Fermi Award Ceremony June 21, 2006 Arthur H. Rosenfeld, Commissioner California Energy Commission...
28
Fermi Award Ceremony June 21, 2006 Arthur H. Rosenfeld, Commissioner California Energy Commission (916) 654-4930 [email protected] http://www.energy.ca.gov/commission/commissioners/ rosenfeld.html
-
Upload
shavonne-washington -
Category
Documents
-
view
217 -
download
2
Transcript of Fermi Award Ceremony June 21, 2006 Arthur H. Rosenfeld, Commissioner California Energy Commission...

Fermi Award Ceremony June 21, 2006
Arthur H. Rosenfeld, Commissioner
California Energy Commission
(916) 654-4930
http://www.energy.ca.gov/commission/commissioners/rosenfeld.html
2
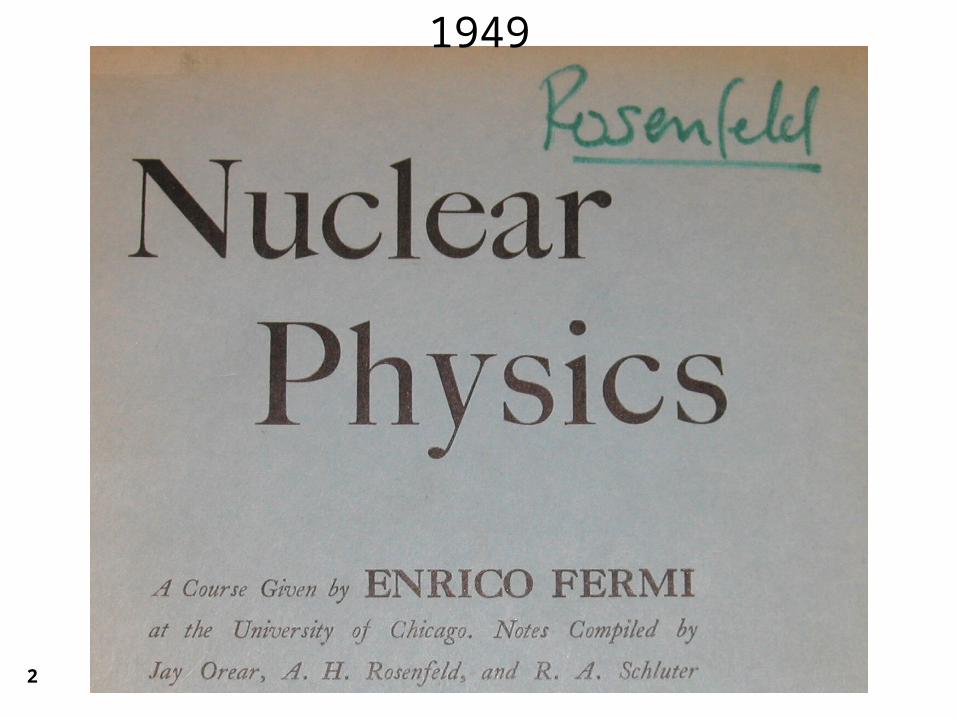
1949

3
Energy Intensity in the United States 1949 - 2005
0.0
5.0
10.0
15.0
20.0
25.0
19491951195319551957195919611963196519671969197119731975197719791981198319851987198919911993199519971999200120032005
thousand Btu/$ (in $2000)
If intensity dropped at pre-1973 rate of 0.4%/year
Actual (E/GDP drops 2.1%/year)

4
Energy Consumption in the United States 1949 - 2005
0
25
50
75
100
125
150
175
200
19491951195319551957195919611963196519671969197119731975197719791981198319851987198919911993199519971999200120032005
Quads
$ 1.7 Trillion
$ 1.0 Trillion
New Physical Supply = 25 Q
Avoided Supply = 70 Quads in 2005
If E/GDP had dropped 0.4% per year
Actual (E/GDP drops 2.1% per year)

5
How Much of The Savings Come from Efficiency?
Easiest to tease out is cars
– In the early 1970s, only 14 miles per gallons
– Now about 21 miles per gallon
– If still at 14 mpg, we’d consume 75 billion gallons more and pay $225 Billion more at 2006 prices
– But we still pay $450 Billion per year
– If California wins the “Schwarzenegger-Pavley” suit, and it is implemented nationwide, we’ll save another $150 Billion per year
Commercial Aviation improvements save another $50 Billion per year Appliances and Buildings are more complex
– We must sort out true efficiency gains vs. structural changes (from smokestack to service economy).

6
How Much of The Savings Come from Efficiency (cont’d)?
Some examples of estimated savings in 2006 based on 1974 efficiencies minus 2006 efficiencies
Beginning in 2007 in California, reduction of “vampire” or stand-by losses
– This will save $10 Billion when finally implemented, nation-wide
Out of a total $700 Billion, a crude summary is that 1/3 is structural, 1/3 is transportation, and 1/3 is buildings and industry.
Billion $
Space Heating 40Air Conditioning 30Refrigerators 15Fluorescent Tube Lamps 5Compact Floursecent Lamps 5Total 95

7
A supporting analysis on Structure vs. Efficiencyfrom Vice-President Dick Cheney
“Had energy use kept pace with economic growth, the nation would have consumed 171 quadrillion British thermal units (Btus) last year instead of 99 quadrillion Btus”
“About a third to a half of these savings resulted from shifts in the economy. The other half to two-thirds resulted from greater energy efficiency”
Source: National Energy Policy: Report of the National Energy Policy Development Group, Dick Cheney, et. al., page 1-4, May 2001

8
Energy Intensity -- California and the United States
0
2
4
6
8
10
12
14
16
18
20
1963 1965 1967 1969 1971 1973 1975 1977 1979 1981 1983 1985 1987 1989 1991 1993 1995 1997 1999 2001 2003year
Intensity (thousand Btus per $ measured in year 2000 $)
US down to 54% of 1973 intensity
California down to 46% of 1973 intensity
54%
46%
9
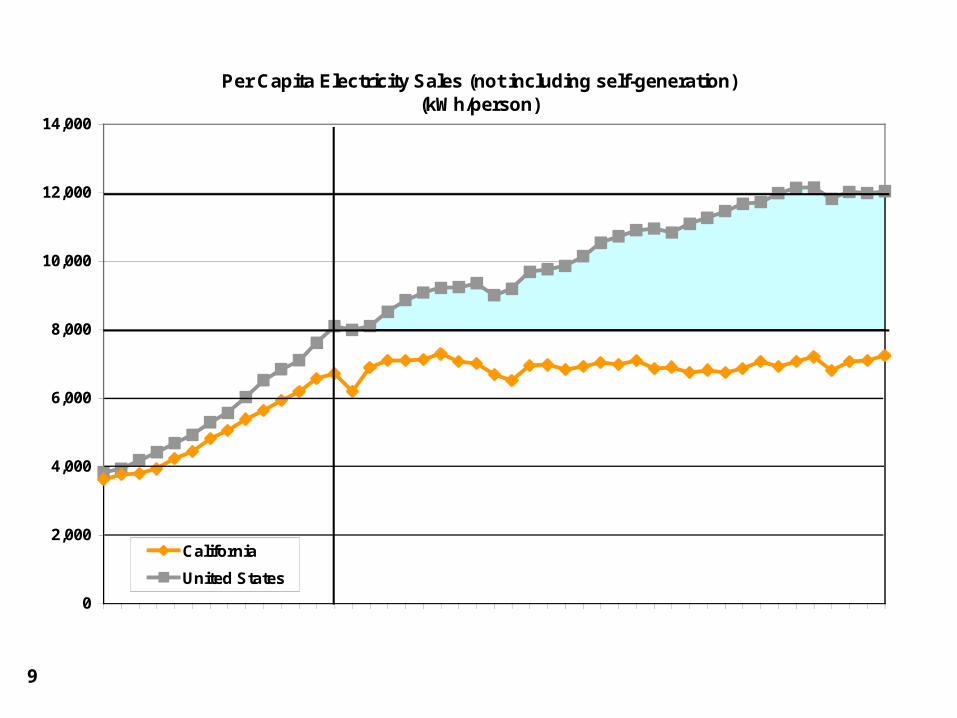
Per Capita Electricity Sales (not including self-generation)(kWh/person)
0
2,000
4,000
6,000
8,000
10,000
12,000
14,000
19601962196419661968197019721974197619781980198219841986198819901992199419961998200020022004
California
United States

10
Carbon Dioxide Intensity and Per Capita CO2 Emissions -- 2001 (Fossil Fuel Combustion Only)
0.00
5.00
10.00
15.00
20.00
25.00
0.00 0.10 0.20 0.30 0.40 0.50 0.60 0.70 0.80 0.90 1.00
intensity (tons of CO2 per 2000 US Dollar)
To
ns
of
CO
2 p
er p
erso
n
Canada Australia
S. Korea
California
Mexico
United States
Austria
Belgium
Denmark
France
Germany
Italy
Netherlands
New Zealand
Switzerland
Japan
11
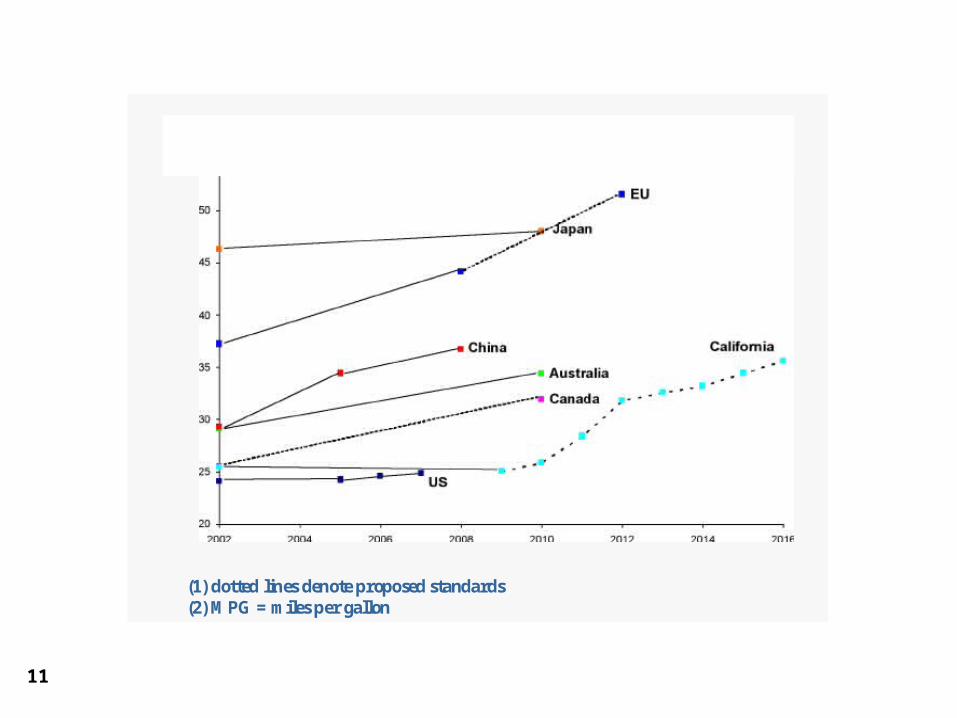
(1) dotted lines denote proposed standards(2) MPG = miles per gallon
MPG
-Converted to CAFE Test Cycle

12
Per Capita Electricity Consumption
0
2,000
4,000
6,000
8,000
10,000
12,000
14,000
1960 1965 1970 1975 1980 1985 1990 1995 2000
year
kWh/person
United StatesCaliforniaNew York
Source: http://www.eia.doe.gov/emeu/states/sep_use/total/csv/use_csv
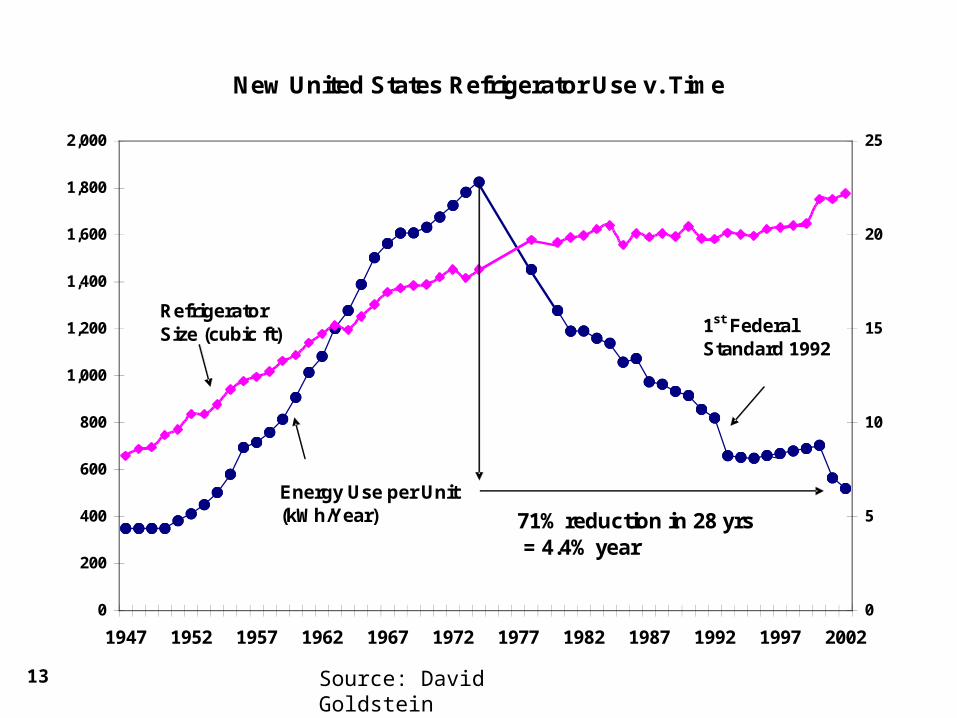
13 Source: David Goldstein
New United States Refrigerator Use v. Time
0
200
400
600
800
1,000
1,200
1,400
1,600
1,800
2,000
1947 1952 1957 1962 1967 1972 1977 1982 1987 1992 1997 2002
Average Energy Use per Unit Sold (kWh/yr)
0
5
10
15
20
25
Refrigerator volume (cubic feet)
Refrigerator Size (cubic ft)
Energy Use per Unit(kWh/Year) 71% reduction in 28 yrs
= 4.4% year
1st Federal Standard 1992

14 Source: David Goldstein
New United States Refrigerator Use v. Time and Retail Prices
0
200
400
600
800
1,000
1,200
1,400
1,600
1,800
2,000
1947 1952 1957 1962 1967 1972 1977 1982 1987 1992 1997 2002
Average Energy Use or Price
0
5
10
15
20
25
Refrigerator volume (cubic feet)
Energy Use per Unit(kWh/Year)
Refrigerator Size (cubic ft)
Refrigerator Price in 1983 $
$ 1,270
$ 462

15
New Refrigerator Energy Use: 71% will be saved when stock completely turns over to 2001 Standards
0
50
100
150
200
250
300
At 1974 Efficiency At 2002 Efficiency
Billion kWh per Year
Energy Needed
Energy Needed
Energy Saved

16
Annual Energy Saved vs. Several Sources of Supply
Energy Saved Refrigerator Stds
renewables
100 Million 1 KW PV systems
conventional hydro
nuclear energy
0
100
200
300
400
500
600
700
800
Billion kWh/year

17
Value of Energy to be Saved (at 8.5 cents/kWh, retail price) vs. Several Sources of Supply in 2005 (at 3 cents/kWh, wholesale price)
Energy Saved Refrigerator Stds
renewables
100 Million 1 KW PV systems
conventional hydro
nuclear energy
0
5
10
15
20
25
Billion $ (US)/year in 2005

18
United States Refrigerator Use, repeated, to compare with
Estimated Household Standby Use v. Time
0
200
400
600
800
1000
1200
1400
1600
1800
2000
1947
1949
1951
1953
1955
1957
1959
1961
1963
1965
1967
1969
1971
1973
1975
1977
1979
1981
1983
1985
1987
1989
1991
1993
1995
1997
1999
2001
2003
2005
2007
2009
Ave
rage
En
ergy
Use
per
Un
it S
old
(k
Wh
per
yea
r)
Refrigerator Use per Unit
1978 Cal Standard
1990 Federal Standard
1987 Cal Standard
1980 Cal Standard
1993 Federal Standard 2001 Federal
Standard
Estimated Standby Power (per house)

19
0
20
40
60
80
100
120
3 Gorges三峡
Refrigerators冰箱
Air Conditioners 空调
TWh
2000 Stds
2000 Stds
2005 Stds
2005 Stds
If Energy Star
If Energy Star
TW
H/Y
ear
1.5
4.5
6.0
3.0
7.5
Val
ue
(bil
lio
n $
/yea
r)
Comparison of 3 Gorges to Refrigerator and AC Efficiency Improvements
Savings calculated 10 years after standard takes effect. Calculations provided by David Fridley, LBNL
Value of TWh
3 Gorges三峡
Refrigerators 冰箱
Air Conditioners
空调
Wholesale (3 Gorges) at 3.6 c/kWh
Retail (AC + Ref) at 7.2 c/kWh
三峡电量与电冰箱、空调能效对比
标准生效后, 10年节约电量
20
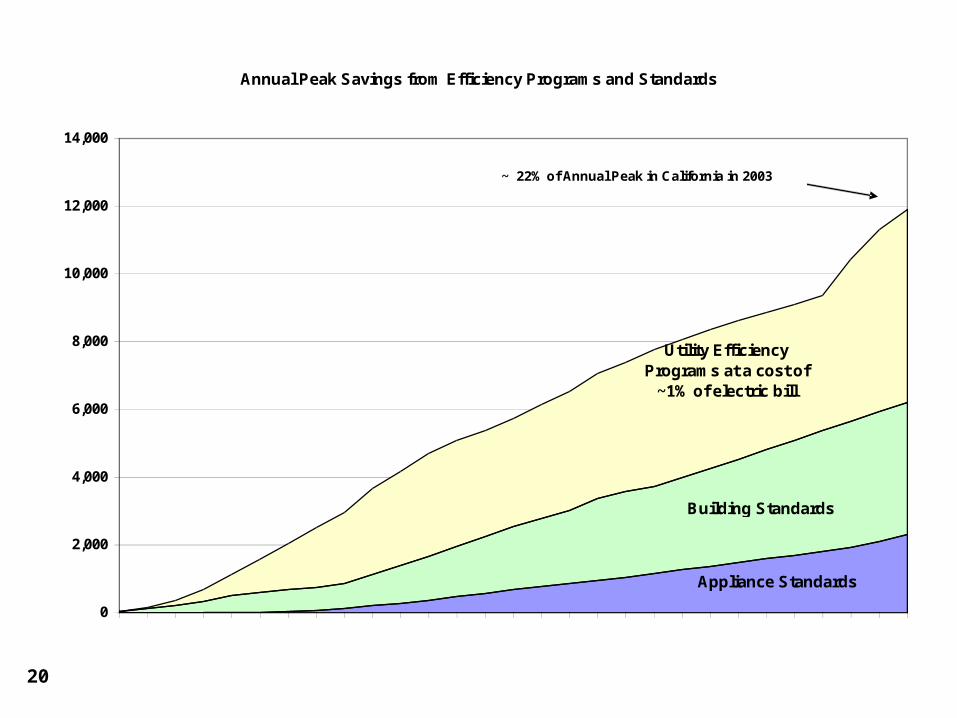
Annual Peak Savings from Efficiency Programs and Standards
0
2,000
4,000
6,000
8,000
10,000
12,000
14,000
19751976197719781979198019811982198319841985198619871988198919901991199219931994199519961997199819992000200120022003
MW/year
Appliance Standards
Building Standards
Utility Efficiency Programs at a cost of
~1% of electric bill
~ 22% of Annual Peak in California in 2003
21
The Rosenfeld Fund at the Energy Foundation
Interests that I’d like to pursue with the Fermi Prize $375,0001. In the Developing World: appropriate technology which also reduces
carbon emissions Replacing Kerosene Lamps with LEDs and PV arrays Ultra violet water purification systems Efficient cook stoves for the Darfur refugee camps
2. Worldwide: Robust Building Technology Seismic resistant insulated panel construction White and cool-colored roofs Cool Communities
3. Support for Graduate Students in fields related to Energy Efficiency
www.EF.org

22
LEDs Powered with Photovoltaics
Evan Mills at LBNL points out the following: If 1 billion people could replace kerosene lamps with LEDs, emissions would drop by the equivalent of 1 million barrels of petroleum per day
http://eetd.lbl.gov/emills/PUBS/Fuel_Based_Lighting.html

23
UV Water Purification

24
Ashok Gadgil at LBNL points out if UV treatment replaces boiling 10 tons of water per day, each system avoids 4 tons of CO2 per day
Meet / exceed WHO and US EPA criteria Energy efficient: 60 watts disinfects 1 ton / hour Low cost: 4 cents disinfects a ton of water Reliable, Mature components Can treat un-pressurized water Rapid throughput: 12 seconds Low maintenance: once every three months http://www.waterhealth.com/
Ultra Violet Water Purification for Villages in Developing World

25
In Nov.-Dec. 2005, he visited Darfur camps, and showed that with a $10 metal stove, and training to use it, only half the fuelwood is needed.
The stove saves fuelwood worth $160 annually for a refugee family
Since that time, Ashok Gadgil has improved stove efficiency by another factor of two
http://www.osti.gov/bridge/servlets/purl/878538-hMpqN3/878538.PDF
Dr. Ashok Gadgil’s Darfur Cookstove Project

26
Residence after 1999 earthquake near Istanbul

27
Adhesive
Cement (Hardie Board)
EPS (‘Styrofoam’)
Fiber
Cement Board in 3 thicknesses 7/16” to 3/4”
Used for roofing, flooring, interior and exterior walls
EPS cores from 3.5” to 11.25”
http://www.fas.org/main/home.jsp

Truck Supported by Panels(6” expanded polystyrene clad with plywood. Pickup supported by 2 panels each 4’ x 24’)