fermentative biohydrogen production by Clostridium butyricum et al 2013... · 2 fermentative...
31
Improving effect of metal and oxide nanoparticles encapsulated in porous silica on 1 fermentative biohydrogen production by Clostridium butyricum 2 Laurent Beckers * , a , Serge Hiligsmann a , Stéphanie D. Lambert b , Benoît Heinrichs b , 3 Philippe Thonart a 4 * Corresponding author: 5 Email address: [email protected] 6 Tel.: +32 (0) 4 366 28 61 7 Fax: +32 (0) 4 366 28 62 8 a Centre Wallon de Biologie Industrielle (CWBI), Département des Sciences de la Vie, B40, 9 Université de Liège, B-4000 Liège, Belgium. 10 b Laboratoire de Génie Chimique, B6a, Université de Liège, B-4000 Liège, Belgium. 11 Abstract 12 This paper investigated the enhancement effect of nanometre-sized metallic (Pd, Ag and Cu) 13 or metallic oxide (Fe x O y ) nanoparticles on fermentative hydrogen production from glucose by 14 a Clostridium butyricum strain. These nanoparticles (NP) of about 2-3 nm were encapsulated 15 in porous silica (SiO 2 ) and were added at very low concentration (10 -6 mol·L -1 ) in batch 16 hydrogen production test. The cultures containing iron oxide NP produced 38% more 17 hydrogen with a higher maximum H 2 production rate (HPR) of 58% than those without NP or 18 with silica particles only. The iron oxide NP were used in a 2.5 L sequencing-batch reactor 19 and showed no significant effect on the yields (established at 2.2 mol hydrogen ·mol glucose -1 ) but an 20 improvement of the HPR (+ 113%, reaching a maximum HPR of 86 mL hydrogen ·L -1 ·h -1 ). These 21 results suggest an improvement of the electron transfers trough some combinations between 22 enzymatic activity and inorganic materials. 23
Transcript of fermentative biohydrogen production by Clostridium butyricum et al 2013... · 2 fermentative...

Improving effect of metal and oxide nanoparticles encapsulated in porous silica on 1
fermentative biohydrogen production by Clostridium butyricum 2
Laurent Beckers *, a
, Serge Hiligsmann a, Stéphanie D. Lambert
b, Benoît Heinrichs
b, 3
Philippe Thonart a
4
* Corresponding author: 5
Email address: [email protected] 6
Tel.: +32 (0) 4 366 28 61 7
Fax: +32 (0) 4 366 28 62 8
a Centre Wallon de Biologie Industrielle (CWBI), Département des Sciences de la Vie, B40, 9
Université de Liège, B-4000 Liège, Belgium. 10
b Laboratoire de Génie Chimique, B6a, Université de Liège, B-4000 Liège, Belgium. 11
Abstract 12
This paper investigated the enhancement effect of nanometre-sized metallic (Pd, Ag and Cu) 13
or metallic oxide (FexOy) nanoparticles on fermentative hydrogen production from glucose by 14
a Clostridium butyricum strain. These nanoparticles (NP) of about 2-3 nm were encapsulated 15
in porous silica (SiO2) and were added at very low concentration (10-6
mol·L-1
) in batch 16
hydrogen production test. The cultures containing iron oxide NP produced 38% more 17
hydrogen with a higher maximum H2 production rate (HPR) of 58% than those without NP or 18
with silica particles only. The iron oxide NP were used in a 2.5 L sequencing-batch reactor 19
and showed no significant effect on the yields (established at 2.2 molhydrogen·molglucose-1
) but an 20
improvement of the HPR (+ 113%, reaching a maximum HPR of 86 mLhydrogen·L-1
·h-1
). These 21
results suggest an improvement of the electron transfers trough some combinations between 22
enzymatic activity and inorganic materials. 23

Keywords: biohydrogen; dark fermentation; Clostridium butyricum; encapsulated 24
nanoparticles; sol-gel process. 25
1. Introduction 26
In the upcoming years, the population living on our planet will increase and they will have to 27
be provided with enough energy, materials and food. Currently, our society is based on the 28
utilization of fossil fuels as a primary energetic source leading the world to environmental, 29
human health and macro-economic issues (Zidansek et al., 2009). The development of 30
alternative and green energy sources is therefore regarded as a major answer aiming to lower 31
the impact of the human industrial activity on the earth. In this context, it is believed that 32
hydrogen will be used extensively in the future as an energetic vector to achieve a less 33
polluting and economically more advantageous society than the current fossil fuel-based 34
economy (Marban & Vales-Solis, 2007). Indeed, its reaction with oxygen, which produces 35
energy and only water as a side-product, can be performed in electrochemical or combustion 36
processes without any generation of greenhouse gases. However, currently, hydrogen is 37
almost exclusively produced from traditional non-renewable fossil fuels in intensive chemical 38
processes, running at elevated pressures and temperatures and releasing CO2 in the 39
atmosphere (Holladay et al., 2009). 40
The green hydrogen produced by microorganisms provides alternative routes for renewable 41
energy production (Kothari et al., 2012). Among the several microorganisms that can convert 42
various carbohydrate sources in hydrogen and metabolites in solution, the anaerobic 43
fermentative bacteria have been studied during the past few years (Davila-Vazquez et al., 44
2008; Hallenbeck, 2009). In these microorganisms, the electrons resulting from the oxidation 45
of the substrate are transferred to protons in order to form molecular hydrogen through the 46
action of enzymes called hydrogenases. Among the anaerobic bacteria producing hydrogen, 47

Clostridium strains are frequently characterised in highly efficient sludge for hydrogen 48
production in mesophilic range of temperatures (Sagnak et al., 2010; Wang & Wan, 2009a). 49
To date, the anaerobic biohydrogen process is still experimented at laboratory or small pilot 50
scale only (Das, 2009). To make the process viable, improvements of the bioactivity of 51
hydrogen-producing microorganisms as well as high substrate conversion yields are needed to 52
meet economic requirements. Key factors for optimal hydrogen production such as pH, 53
temperature, strain selection, microorganisms cell density, concentration of substrate and 54
metabolites have been well studied to improve the kinetics and the yields (Davila-Vazquez et 55
al., 2008; Wang & Wan, 2009a). However, further efforts and new routes have to be found to 56
use these microorganisms more efficiently in a stable process. 57
Recently, the nanoscience has been involved in number of usual products and processes since 58
the nanomaterials bring new chemical and physical properties. Indeed, due to their size 59
between 1 and 100 nm, the nanomaterials exhibit a very large specific surface area and 60
quantum effects start to predominate (Dinesh et al., 2012). The interest in the biological field 61
is still increasing with practical application in many different domains since nanoparticles 62
(NP) have recently showed interactions with microorganisms even at very low concentration. 63
On the one hand, some NP exhibit antimicrobial activity by close contact with the 64
microorganisms leading to membrane disruption, also raising environmental concerns about 65
their dissemination in the nature (Neal, 2008). On the other hand, some microorganisms may 66
take advantages of NP especially in anaerobic environment, by transferring more efficiently 67
electrons to acceptors. Intra- or extra-cellular NP may be produced by the reduction of metal 68
ions for the biosynthesis of nanomaterials with different chemical composition or 69
morphologies (Korbekandi et al., 2009). Electron transfer can also occur through membrane 70
c-type cytochromes or nanowires to electron acceptors such as polluting chemical compounds 71
(for soil remediation applications (Jagadevan et al., 2012)), electrodes (for current generation 72

in microbial fuel cells (Lovley, 2008)) or through interspecies electron transfer (Kato et al., 73
2012). In all these application fields, the NP have recently shown some advantages through 74
their capacity to react rapidly with the electron donors leading therefore to kinetic 75
improvement and, through their action as biocatalysts, to the enhancements of the 76
microorganisms activity (Xu et al., 2012). 77
In a previous work, only gold NP at very low concentration (10-8
mol·L-1
) were tested to 78
observe effects on the biohydrogen production. An enhancement of the performances of about 79
56% was achieved (Zhang & Shen, 2007). The authors concluded that gold NP would operate 80
as “electron sinks” due to their affinity for electrons, which allows to further reduce protons to 81
hydrogen. They acted in parallel on hydrogenases that naturally achieve this reaction in the 82
metabolism of the cell. Other metal are known to interact with microorganisms in 83
environmental conditions. Ag and Cu are often cited as metal having interaction with the 84
bacteria for their antimicrobial activity (Bagchi et al., 2012; Sotiriou & Pratsinis, 2010). Pd is 85
a metal involved usually for its strong interactions with molecular hydrogen in chemical 86
processes (Klavsyuk et al., 2011). Finally, iron is known to be an important element as a 87
cofactor for hydrogenases or for its role in environmental processes (Grieger et al., 2010; Lee 88
et al., 2001; Xu et al., 2012). 89
In this work, the effect of nanoparticles (NP) of about 2-3 nm of three metals (Pd, Ag, Cu) 90
and one iron (Fe) oxide was investigated with pure Clostridium butyricum cultures. These NP 91
were encapsulated in a porous silica (SiO2) matrix. The SiO2 matrix without NP was also 92
tested in the same conditions. To synthesize the catalyst (NP + SiO2 = catalyst), a one-step 93
sol-gel process was applied to obtain NP finely dispersed in the porosity of a silica matrix 94
(Heinrichs et al., 2008; Lambert et al., 2004). In such catalysts, in order to reach active sites, 95
reactants must first diffuse through large pores located between aggregates of SiO2 particles 96
and then through smaller pores between those elementary particles inside the aggregates. 97

Finally, they diffuse through micropores inside the silica particles. It was shown that there are 98
no limitations of mass transfer at each of the three levels (Heinrichs et al., 2001). 99
These NP were experimented in Biochemical Hydrogen Potential (BHP) tests. The most 100
efficient conditions were further investigated in a stirred 2.3 L Anaerobic Sequenced-Batch 101
Reactor (AnSBR). The production of hydrogen and metabolites was monitored in the cultures 102
and the Gompertz model was applied on the volumetric production curves. 103
2. Material and methods 104
2.1. Microorganism and culture medium 105
The strain used as hydrogen-producing microorganism was Clostridium butyricum 106
CWBI1009 (denoted C. butyricum) and was previously isolated and identified by the authors 107
(Masset et al., 2010). It was conserved by sterile monthly transfer of 1 mL from previous pure 108
culture in a hermetically sealed 25 mL tubes containing “MDT” medium and incubated at 109
30°C. The MDT culture medium contained, per litre of deionized water: glucose monohydrate 110
(5 g), casein peptone (5 g), yeast extract (0.5 g), Na2HPO4 (5.1 g), KH2PO4 (1.2 g), 111
MgSO4.7H2O (0.5 g) and L-cysteine hydrochloride (0.5 g). The MDT culture medium was 112
used in biochemical hydrogen potential (BHP) batch serum bottles test and in 2.5L stirred 113
tank reactor driven in anaerobic sequenced-batch mode (AnSBR). 114
For the preparation of fresh inoculum, the transfer in new MDT tubes was repeated twice a 115
week before being used in the culture vessel. Purity tests were performed by spreading 100 116
µL of culture on sterile PCA (Plate Count Agar) Petri dishes before incubation at 30°C for 24 117
to 48 hours. The PCA medium contained glucose monohydrate (1 g), casein peptone (5 g), 118
yeast extract (2.5 g) and agar (15 g) per litre of deionized water. The absence of bacterial 119
growth after incubation for 48 h incubation confirmed the absence of any facultative 120
anaerobic contaminants. 121
2.2. Preparation and characterization of encapsulated nanoparticles 122
Four metallic salts (Pd, Ag, Cu and Fe) have been used for preparing the nanoparticles (NP). 123
To encapsulate these NP inside a porous silica matrix, the cogelation method was used as 124
described by Lambert et al. (Lambert et al., 2004) and by Heinrichs et al. (Heinrichs, 2008). 125
The samples are denoted Pd/SiO2, Ag/SiO2, Cu/SiO2 and Fe/SiO2 cogel (Table 1). The 126
cogelation method allows doping an inorganic matrix with cations, in one step at the 127
molecular scale. The process is based on the simultaneous hydrolysis and condensation of two 128
alkoxysilanes: an SiO2 network-forming reagent such as tetraethoxysilane (TEOS, 129
Si(OC2H5)4) and an alkoxysilane-functionalized ligand of the type (RO)3Si-X-L, in which the 130
ligand L, able to form a complex -LnM with a cation of a metal M (M = Pd, Ag, Cu, Fe etc.), 131
is connected to the hydrolysable alkoxide group (RO)3Si- via an inert and hydrolytically 132
stable spacer X. The concomitant hydrolysis and condensation of such molecules, i.e. their 133
cogelation, results in materials in which the catalytic metal cation is anchored to the silica 134
matrix. 135
In Table 1, a second Fe/SiO2 sample, called Fe/SiO2 dissol, is presented. This sample was 136
prepared by the dissolution method (Heinrichs, 2008), which consists of dissolving the iron 137
salt in the initial homogenous solution of silica gel precursor. Moreover, the porous silica 138
matrix without NP, denoted SiO2 , was also synthesized by the sol-gel process (Lambert, 139
2004) to check if SiO2 plays a significant rule for the biohydrogen production. 140
All these samples were calcined under air (550°C for Fe/SiO2 dissol and Fe/SiO2 cogel, 141
400°C for the other samples) to remove organic moieties. After the calcination step, Pd/SiO2, 142
Ag/SiO2 and Cu/SiO2 were reduced under H2 to obtain metallic NP (Lambert, 2004). 143
The samples were characterized (textural analysis, electron microscopy, X-ray diffraction) by 144
using the methods described by (Lambert et al., 2004) and (Heinrichs et al., 2008). For the 145
clarity of this work, NP is defined as metallic or metallic oxide nanoparticules highly 146
dispersed inside the silica matrix, whereas catalyst is used to define the combination between 147
NP and silica. 148
Concentrated suspensions in water of these samples were prepared in 50 mL bottles by finely 149
pounding (at micrometre-size) and weighting some catalysts. Based on the mass suspended in 150
the bottles, the metallic mass loading in the catalyst and the metal atomic weight (Table 1), a 151
defined volume of homogenized suspension was transferred in the culture medium prior to 152
sterilization in order to reach a final concentration of 10-6
molmetal·L-1
. Therefore, all the tests 153
had the same NP concentration, but the total mass of catalyst (i.e. NP + SiO2) differed from 154
one test to the others, because the metallic mass loading differs between the investigated 155
catalysts. An equivalent mass of SiO2 was added in the corresponding test without NP. 156
2.3. Fermentation set-up 157
The BHP tests were carried out in 270 mL bottles with 200 mL of MDT medium adjusted at 158
pH 7.6 with NaOH 5N as formerly described by (Hamilton et al., 2010). Suspended catalysts 159
were added in the bottles to reach the wished metallic concentration prior to sterilization. The 160
bottles were inoculated with 3 mL of inoculum before being capped tightly with a sterile 161
rubber septum, flushed with sterile nitrogen and incubated at a temperature of 30 °C. The data 162
for the BHP test are representative results of independent experiments run in triplicates. 163
The experiments in AnSBR were done in a 2.5 L laboratory-scale tank bioreactor (Biolafite 164
manufacture) composed of a double envelope and of a stainless steel lid equipped with a butyl 165
septum, a pH probe (Mettler Toledo), shaft with blades, 0.20 µm gas filters (Midisart, 166
Sartorius) and different tubes for gas inlet, gas outlet, medium removal or addition. The 167
reactor contained 2.5 L of MDT medium, except L-cysteine and glucose in order to prevent 168
Maillard reactions, before being sterilized. After cooling down, 1 L of media was removed 169
and the L-cysteine and the glucose, sterilized separately in solution of respectively 25 and 500 170
mL, were added sterilely in the reactor under nitrogen gas to reach MDT concentration. 171
Inoculum (500 mL) cultured in 1 L bottle was then added in the bioreactor. Automatic 172
addition of sterile KOH 3 N was used to control the pH, the temperature maintained at 30°C 173
and the bioreactor was stirred at 100 rpm. Sequenced-batch operations were carried out by 174
removing 40% (1 L) of the wasted liquid media under nitrogen overpressure. The reactor was 175
refilled up to 2.5 L with sterile MDT medium containing 12.5 g of glucose (i.e. in order to 176
obtain a concentration of 5 g·L-1
in the bioreactor). 177
2.4. Monitoring and analytical methods 178
The biogas produced in the BHP tests was collected daily during 96 hours by sterile syringe 179
and needle pierced trough the butyl septum. Injections of the collected biogas in a 9N KOH 180
measurement system for CO2 sequestration allowed the determination of hydrogen content 181
and volumetric hydrogen production by gas balance as already described by the authors 182
(Hiligsmann et al., 2011). 183
The 2.5L AnSBR was connected to a flow meter (TG05/5, Ritter) for continuous 184
measurement of the biogas produced. The composition of the biogas was measured (or 185
confirmed for the BHP tests) by a gas chromatography system (HP 8950 SeriesII) equipped 186
with TCD detector, using nitrogen or helium as carrier gas (respectively for hydrogen and for 187
nitrogen/methane/carbon dioxide detection) as fully described elsewhere (Hamilton et al., 188
2010). Furthermore, the Gompertz model with the adjustment of three parameters (lag phase 189
duration, maximum hydrogen production rate and maximum total hydrogen produced) was 190
applied to the volumetric hydrogen production data following the method described by (Wang 191
& Wan, 2009b). 192
The liquid culture samples were centrifuged at 13000 rpm for 3 min and the supernatants were 193
filtered through a 0.2 µm cellulose acetate filter (Sartorius Minisart). The glucose, lactate, 194
formate, acetate, propionate, ethanol and butyrate were analyzed using a HPLC (Agilent 195
1100) equipped with a differential refraction index detector as described formerly by (Masset 196
et al., 2010). The concentrations measured in the culture medium were used to evaluate the 197
carbon mass balance (MB) of glucose conversion in the soluble metabolites using the method 198
of calculation reported by the authors (Hiligsmann et al., 2011). 199
3. Results and discussion 200
3.1. Effect of encapsulated nanoparticles in BHP tests 201
3.1.1. Biological Hydrogen Potential 202
The production of hydrogen in Clostridium butyricum cultures supplemented with various 203
encapsulated NP was investigated in BHP test (batch serum bottles of 200mL of liquid 204
volume) (Hiligsmann et al., 2011; Lin et al., 2007). Four different elements were tested in 205
triplicates series of bottles. The NP of 2-3 nm of diameter were encapsulated in a porous silica 206
structure (Heinrichs et al., 2008; Lambert et al., 2004). The encapsulation of the NP in the 207
silica matrix limits the risk of agglomeration of the active site. The NP concentration was 208
adjusted at 10-6
mol·L-1
in the culture medium (Table 1). As a reference for the BHP test, a 209
series was done without any catalyst supplementation (MDT medium only). Moreover, a 210
negative control with porous SiO2 particles without NP was carried out in order to assess the 211
effect of the metallic (Pd, Ag or Cu) or metallic oxide (FexOy) active site on the production of 212
hydrogen. 213
The volume of biogas was measured every 24 hours during four days after the inoculation. 214
The daily volumetric hydrogen production, determined according to the description of the 215
BHP tests in the section 2.3, was reported on the Figure 1. The hydrogen production profiles 216
and total production were in line with previous BHP test with the C. butyricum strain 217
(Hiligsmann et al., 2011). A sigmoid profile was observed, indicating a lag phase followed by 218

exponential growth and simultaneous production of hydrogen. Indeed, when growing, the 219
release of soluble metabolites in the medium decreased the pH down to inhibiting level. It 220
resulted in lower hydrogen production after three days, near the end of the culture. 221
None of the NP tested showed an inhibiting effect since the production of hydrogen was 222
similar or higher than in the reference BHP test (without NP and/or without SiO2). Indeed, it 223
is known that silver and copper behave as antimicrobial elements since they destruct the 224
membrane cells by close contact between the microorganism and the NP (Bagchi et al., 2012; 225
Sotiriou & Pratsinis, 2010). However, antimicrobial activity would not be effective in our 226
experimentations because NP are encapsulated inside the porous silica matrix (Neal, 2008). 227
By contrast, the addition of iron and copper induced a significant increase of the total 228
hydrogen produced and different profiles of the cumulative curves in comparison with the 229
reference BHP test (Table 2 and Figure 1). Both series with Fe/SiO2 (synthesised by 230
dissolution or cogelation method) and Cu/SiO2 catalysts reached respectively 120 ± 5 and 104 231
± 8 mLH2, whereas the reference culture without catalyst produced 87 ± 7mLH2. The highest 232
performances for H2 production were recorded with iron oxide NP suggesting the existence of 233
interactions between NP and the bacteria and resulting in a faster hydrogen production. 234
Furthermore, since the sole SiO2 material (without NP) did not show any significant effect, it 235
can be concluded that only the central active site (i.e. the metal or metal oxide NP) would play 236
a role in the improvement of the hydrogen production. 237
3.1.2. Hydrogen production rates and yields 238
The Gompertz model was applied to the cumulative H2 production curves. The resulting 239
coefficients are reported in the Table 2. It confirms that the maximum cumulative H2 240
productions were achieved for the iron oxide NP, i.e. 34% higher than in the reference BHP 241
test. Moreover, the maximum hydrogen production rates (HPR) were 58 % higher with the 242

Fe/SiO2 catalysts than the 1.97 ± 0.2 mL·h-1
recorded without catalyst addition. These results 243
suggest that the NP have a higher influence on the kinetic of H2 production than on the total 244
volumetric production from glucose. By contrast, no significant influence was observed for 245
the lag phase that varies between 7 and 14 hours for all the tests. 246
In addition, no significant difference was evidenced for the hydrogen production yields, based 247
on the total hydrogen production and the substrate consumption (Table 2), i.e. respectively 248
1.08 ± 0.06, 0.96 ± 0.02 and 0.92 ± 0.04 molhydrogen/molglucose for the cultures with Fe/SiO2 249
catalyst, with the sole SiO2 and without both of them.These yields are relatively low 250
comparing to the literature (Lin et al., 2007; Wang & Wan, 2009a) since the pH was not 251
controlled (decreasing from the initial pH set at 7.6 down to 4.7 ± 0.1 at the end of the 252
experiments). Therefore, these experimentation conditions lead to large fluctuations in the 253
metabolic activity and to a short time of culture at optimal pH for H2 production (Hiligsmann 254
et al., 2011; Khanal et al., 2004). It should be mentioned that, in anaerobic sequenced-batch 255
reactors (AnSBR) with the pH set at optimal value of 5.2, the same strain of C. butyricum 256
may produce hydrogen more efficiently reaching maximum yields of 2.3 molhydrogen/molglucose 257
(Masset et al., 2010). 258
In our BHP tests, the gain of hydrogen production recorded with some catalysts was partially 259
due to higher glucose consumption in these conditions than in the reference test. For instance 260
with iron oxide NP, the yields were slightly increased by 12%, that is half of the increase in 261
volumetric H2 production. This is probably due to a different evolution of pH in these cultures 262
since the production of hydrogen is a way for the bacteria to limit the pH decrease by the 263
reduction of acidic proton into molecular hydrogen (Das, 2009). Therefore, the more the 264
bacteria are producing hydrogen to limit the drop of pH, the more they can consume glucose 265
for growth. The results about HPLC analysis of liquid samples (Figure 2) confirm that more 266
glucose was consumed for the production of hydrogen with Fe/SiO2 catalysts. Therefore, the 267

gain of hydrogen production was at least partially due to the increase of glucose consumption. 268
Meanwhile, the yields were slightly increased of 12%, half of the increase performed for the 269
volume of H2. 270
3.1.3. Soluble metabolites distribution 271
Metabolites analysis (Figure 2) can be related to the low yields generally achieved in our BHP 272
experiments since formate, lactate and ethanol were found in solution and are not related to 273
metabolic pathways linked with the production of hydrogen. However, butyrate and acetate 274
were respectively the second and the third major metabolites produced. According to 275
literature, they are related with stoichiometric hydrogen yields of respectively 2 and 4 276
molhydrogen/molglucose. The metabolites profiles are in accordance with previous studies of C. 277
butyricum cultured in batch experiment without pH control (Hiligsmann et al., 2011; Lin et 278
al., 2007). The carbon mass balance (Figure 2) showed that the glucose was mostly converted 279
in butyrate (around 40%), then in formate and lactate (respectively around 15 and 13.5%). In 280
order to improve the production of hydrogen and direct the metabolism of the microorganisms 281
toward the butyrate and acetate production, the pH should be controlled in continuous or 282
semi-continuous fermentation. 283
The introduction of the NP in the media did not modify the metabolites profile. More glucose 284
was consumed with Fe/SiO2, Cu/SiO2 and SiO2 samples and less lactate was produced than in 285
the reference triplicate. The same observation can be made for the carbon mass balance 286
(Figure 2B), with a lower conversion of glucose in formate and lactate i.e. respectively 14 and 287
10% with Fe/SiO2 catalysts. The changes in the metabolites profiles and carbon mass balance 288
are of the same order than for the yields i.e. between 10 and 15%. These changes, taking into 289
account the standard deviations obtained with the triplicates, should not be considered as 290

significant. Therefore, it can’t be concluded that the NP lead to changes in the metabolic 291
pathways followed by the bacteria but rather on the production rate of hydrogen. 292
All the results recorded for the BHP tests underline that interactions may exist between the 293
bacteria and the iron oxide NP and may have an effect on the production of biohydrogen. 294
However, in these experiments, since the pH evolved along the culture, it is hard to establish 295
if the NP influenced the fermentation pathway (H2 yields and metabolites) or only the kinetic 296
for hydrogen production. Therefore, Fe/SiO2 catalysts were used in an AnSBR in order to 297
observe their effect on H2 production in pH-controlled conditions. 298
3.2. Effect of iron oxide nanoparticles in AnSBR 299
3.2.1. Hydrogen production in the sequences without NP 300
An AnSBR was run over 14 sequences during 38 days in a 2.5 L tank reactor at a controlled 301
pH of 5.2 ± 0.1 (i.e. the optimal pH for hydrogen production from glucose by C. butyricum 302
(Masset et al., 2010)). The sequenced-batch operations were carried out by sterile removal of 303
the used medium (40% of working volume i.e. 1 L) and sterile addition of fresh media to 304
reach 5g·L-1
of glucose. The first batch culture (F0) was followed by 6 sequences operated in 305
classical conditions i.e. without NP (from F1 to F6). It allowed the establishment of stationary 306
conditions for both H2 production and soluble metabolites concentration. The effect of 307
Fe/SiO2 (dissol and cogel) catalyst was investigated in the further sequences with addition of 308
iron NP at a concentration equal to 10-6
molFe·L-1
at the beginning of the sequence F7 and F9. 309
The cumulated 15 sequences produced a total of 47.85 L of hydrogen in 39 days and between 310
3 and 3.3 L for each sequence. The hydrogen concentration in the biogas was measured at 311
54.8 ± 2.8 %. Since the first batch sequence (F0) was started without pH control (pH 312
decreasing from 7.6 to 5.2 and then regulated), it produced only 1.7 L of hydrogen. This 313
illustrates the importance of the pH regulation and the fundamental difference in experimental 314

conditions between the BHP tests and the sequences in AnSBR with pH control. By 315
controlling the pH, the hydrogen production yields were improved from 1.2 to 2.2 ± 0.1 316
molhydrogen/molglucose respectively for F0 and the following sequences (Figure 3). These 317
performances are consistent with the results reported in similar conditions by (Masset et al., 318
2010) However, the F0 sequence was important to promote bacteria growth (at a higher pH 319
than 5.2) from only 0.5 L of inoculum added whereas the next sequences began with 1.5L of 320
rich biomass culture medium (60% of the bioreactor medium from the former sequences). 321
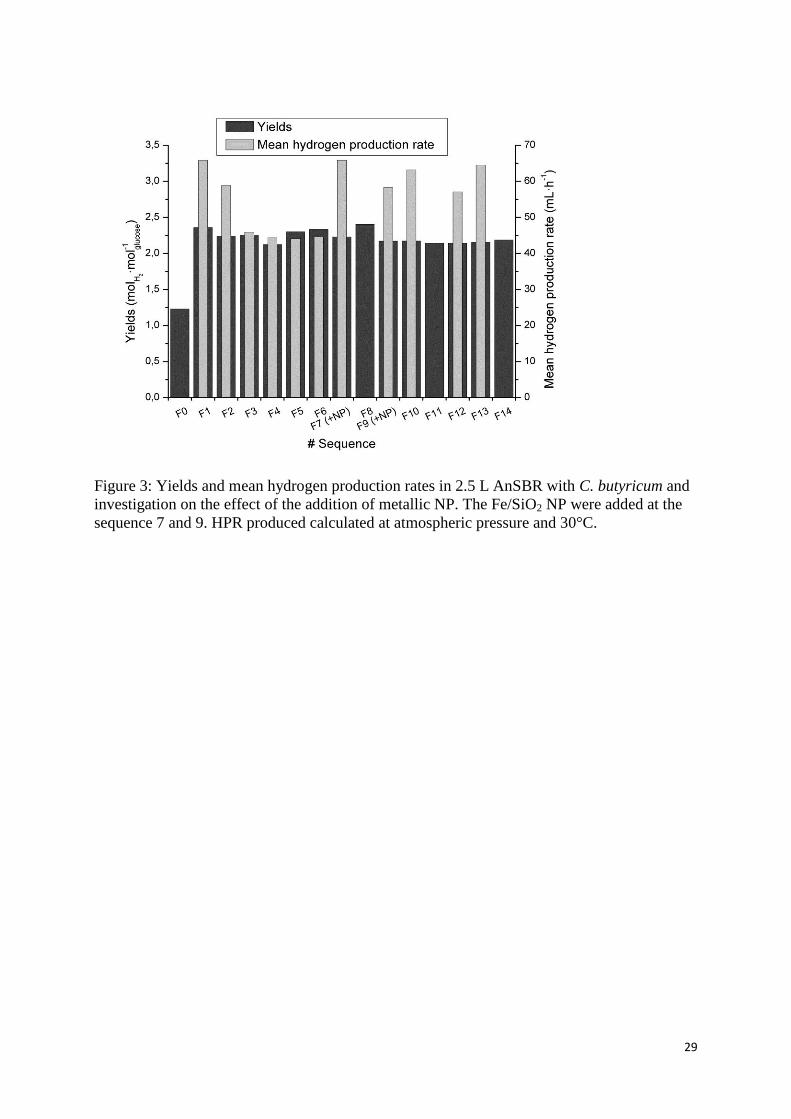
In the successive sequences without NP, the yields did not show any significant variation. By 322
contrast, the mean HPR showed an evolution. The mean HPR is estimated as the ratio 323
between the volume of hydrogen produced and the total time of hydrogen production during 324
the sequence. It should be noted that they were not calculated for F8, F11 and F14 since the 325
elapsed production time for these sequences was overestimated. Figure 3 shows that it 326
reached 65.8 mLH2·h-1
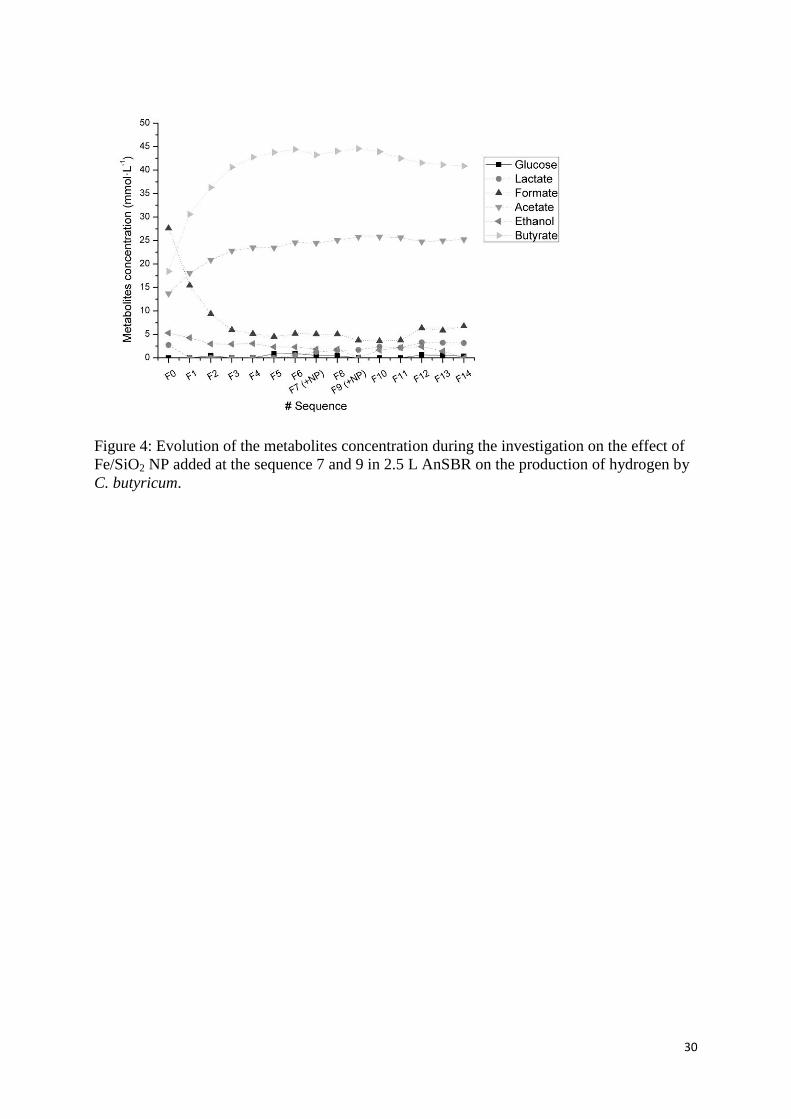
for F1 and then decreased until F3. Indeed, considering the metabolites 327
profiles on Figure 4, the stationary conditions were reached at F3 after an increase of butyrate 328
and acetate concentrations, whereas unfavourable metabolites as formate, lactate and, in a 329
lower extent, ethanol decreased below 7 mmol·L-1
. A similar evolution of the metabolites 330
profiles has already been discussed elsewhere and showed comparable metabolites 331
distribution and concentrations (Masset et al., 2010). Moreover, from F0 to F2, the total 332
concentration of the metabolites in the culture medium was still at a low level that allowed the 333
hydrogen production to occur rapidly without apparent inhibition. On the contrary, in 334
stationary conditions without NP (from F3 to F7), the high concentration of butyrate and 335
acetate seems to influence the hydrogen production that stabilized at a mean HPR of 44.7 ± 336
0.8 mLH2·h-1
(Khanal et al., 2004; Wang & Wan, 2009a). 337
The carbon mass balance confirms that during sequences from F1 to F6 no significant 338
changes occurred in the metabolic pathways in the sequenced-batch mode (Table 3). The 339

variations of metabolites concentration are then rather a consequence of the removal/addition 340
operation than a change in the metabolic activity of the strain. Therefore, the batch sequence 341
F0 and the two following sequences at controlled pH (F1 and F2) have to be considered as 342
transition sequences. In the sequences F3 to F6, a stable production of hydrogen was observed 343
without NP. These steady conditions enabled to test the effect of NP. 344
3.2.2. Hydrogen production in the sequences with NP addition 345
At the beginning of sequence F7 and F9, Fe/SiO2 catalyst was added, each time at a final NP 346
concentration of 10-6
mol·L-1
. The results show that the addition of iron oxide NP improved 347
the mean HPR, from 44.7 ± 0.8 to 61.8 ± 3.9 mLH2·h-1
, whereas the yields remained at 2.2 ± 348
0.1 molhydrogen/molglucose. (Figure 3). Therefore, the addition of NP would have a kinetic effect 349
rather than a metabolic effect on the production of hydrogen. It played a role on the rate of 350
hydrogen formation rather than on the metabolites pathways followed by the bacteria, as 351
already underlined in the BHP tests. These higher HPR were similar in the sequences from the 352
sequences F7 and F9 to F14 though the NP concentration decreased progressively due to 353
addition/removal of culture medium at the beginning of each sequences without NP addition. 354
Indeed it is considered that with the successive dilutions of the medium the concentration of 355
NP was ten times lower in F14 than in F9. 356
A Gompertz modelling on the production of hydrogen was performed for each sequence with 357
at least three volumetric data points (Figure 6). It confirmed the former observation about the 358
mean HPR and that the effect of NP on the HPR did not decreased with the successive 359
dilutions after F9.The maximum HPR reached a stable value after F3 in relation with the 360
stabilization of the AnSBR. The mean values without NP from F3 to F6 reached a maximum 361
HPR of 98.9 ± 9.6 mLH2·h-1
. The increase of the rate brought by the addition of NP is 362
confirmed with a maximum HPR from F7 to F14 of 214.5 ± 33.9 mLH2·h-1
. By contrast, the 363

maximum volume of hydrogen estimated by the Gompertz model slightly decreased from 364
3.35 ± 0.11 to 3.15 ± 0.22 LH2 per sequence. 365
The metabolic profiles and carbon mass balance did not show any significant differences 366
between the sequences without and with NP (Table 3). In both case, butyrate and acetate were 367
the major metabolites, respectively at mean values of 10.2 and 18.3 mmol·L-1
produced 368
during each sequence. The other metabolites found at lower concentration were lactate, 369
formate and ethanol, at respectively 0.5, 1.8 and 0.4 mmol·L-1
. These values are in accordance 370
with previous studies in similar conditions (Masset et al., 2010). At optimal pH conditions, 371
the metabolic pathway was clearly oriented toward the production of hydrogen allowing 372
higher yields. This is shown with more than 42% of the carbon consumed converted in 373
butyrate and 13% in acetate. 374
Regarding the mechanisms promoted by the NP, it can be suggested that they were not 375
metabolised by the bacteria but played a role of active catalytic site involved in the production 376
of hydrogen. It is known that the hydrogen-producing bacteria need iron as a cofactor for 377
hydrogenases synthesis (Chong et al., 2009; Karadag & Puhakka, 2010; Lee et al., 2001). 378
These authors evaluated the minimal iron requirement for the bacterial growth at 10-5
mol·L-1
, 379
but showed that the production of hydrogen could be enhanced by 5 to 10 times by increasing 380
the concentration by a hundred to a thousand time. In comparison, the amount of iron added 381
in our experimentations in the NP form is about 10-fold lower and decreases after successive 382
sequences. On the one hand, a very low amount of iron was added with the NP and diluted 383
with successive sequences. On the other hand, external iron ions were also contained as trace 384
elements in the compounds contained in the culture medium. The iron concentration is 385
estimated at 2·10-5
mol·L-1
(Abelovska et al., 2007). Therefore the total amount of iron oxide 386
NP added at F9 represent only 7% of the iron source available in the nutrients. Furthermore, it 387
is more likely that the bacteria would consume the free ions from the medium before trying to 388

use the stable iron oxide NP encapsulated inside the porous silica matrix. Moreover, it has 389
been shown that free iron supplemented in the media had a clear effect on the rates rather than 390
on the yields as it was observed in this study (Hamilton et al., 2010). 391
3.3. General discussion 392
The effects of zero-valent gold NP were demonstrated on fermentative bioH2 production by 393
(Zhang & Shen, 2007). They showed that the H2 production increases with the decrease of NP 394
size. The concentration of gold NP used by these authors (10
-8 mol·L
-1) was a hundred fold 395
lower than the concentration used in this work. In comparison with this work, 9 sequenced-396
batch operations after F9 should be achieved to reach the same concentration. Furthermore, 397
the nature of NP in the Fe/SiO2 catalysts used in our study has been determined as mainly 398
non-reduced iron oxide Fe2O3 (Heinrichs et al., 2008). Therefore, considering the low 399
concentration of NP and their ferric oxide state, it is suggested that the enhancement of the 400
production of hydrogen with Fe/SiO2 catalysts is related to a catalytic activity working in 401
parallel with the enzymes involved in electron transfer as the hydrogenases, c-cytochromes 402
or/and with extracellular electron mediators. Indeed, the immobilized iron oxide active sites 403
could be used by the bacteria for oxidation/reduction chemical reaction (considering the redox 404
couple Fe2+
/Fe3+
) to help the bacteria transferring faster its electrons without consuming or 405
metabolising the iron as when it is added to the medium in a dissolved form. However, 406
considering the small size of the iron oxide NP (around 3 nm), the surface effect is greatly 407
enhanced and may improve the ability of the NP to react with the electrons transported by 408
mediators and to transfer them efficiently to electron acceptors or eventually protons. 409
C. butyricum is able transfer electrons out of the cell. Indeed, it is known to have c-type 410
cytochromes on the outer cell surface (Park et al., 2001). In addition, interactions and electron 411
transfers between Clostridium bacteria strains and metallic elements have already been 412

supposed in microbial fuel cells (MFC) where clostridia strains have often been isolated and 413
identified (Lovley, 2008; Park et al., 2001). Therefore the NP would act as a chemical catalyst 414
and may add efficiency in the biochemical hydrogen production process usually mediated by 415
the sole enzymes in the cells for the production of hydrogen through the reduction of protons. 416
Furthermore, the hypothesised mechanism also suggests an efficient diffusion of mediating-417
molecules in the porous structure of the encapsulating-silica. A similar diffusion process was 418
demonstrated in the catalyst characterization by the authors (Heinrichs et al., 2008; Lambert 419
et al., 2004). Indeed, the pore size ranges from two to several hundred nanometres. Therefore 420
the pores would connect the outer medium of the silica matrix to the central iron oxide active 421
site. It reinforces the assumption of mediated processes since the bacteria should not come 422
directly in contact with the iron NP. Therefore it should use a redox intermediate to transport 423
the electron from the cell surface to the active metallic oxide surface. 424
The precise role of iron oxide NP, their mechanism of action and their potential influence on 425
the enzymatic activity will have to be investigated and confirmed in further work and will 426
focus on links with hydrogenases activity and electron transfer mechanisms. The hypothesis 427
of partial NP dissolution in the liquid medium has not been ruled out and attention should be 428
brought to this subject in future studies. Indeed, if partial dissolution would occur, its 429
proportion should be measured. However, in the experiments carried out here no lowering 430
effect was observed with successive sequences in the AnSBR . This work also opens the way 431
to researches about combined catalytic and biological treatment for the bioremediation of soil 432
pollution with substances such as aromatic or chlorinated compounds, since mechanism of 433
electron transfer are highly important in such processes. 434
4. Conclusions 435

This study leads to a successful improvement of the biohydrogen production process by C. 436
butyricum combined with encapsulated iron oxide NP added at very low amount (10-6
mol·L-437
1). Interactions with NP have been assumed since an enhancement of the HPR has been 438
achieved. The production rates were improved by 38 and 113% in the batch or AnSBR mode 439
respectively. By contrast, no significant change in the metabolic pathways was observed, 440
regarding the H2 yields and soluble metabolites distribution. The addition of the NP would 441
improve the hydrogen production made by the bacteria trough catalytic mechanism involving 442
extra-cellular mediated-molecules. 443
5. Acknowledgements 444
L. Beckers and S. D. Lambert are grateful to the F.R.S.-FNRS (Fond National pour la 445
Recherche Scientifique) of Belgium for supporting their work and researches as respectively 446
Research fellow and Research associate. This work was also funded through an ARC grant 447
provided by the French Community of Belgium (ARC-07/12-04). 448
6. References 449
Abelovska, L., Bujdos, M., Kubova, J., Petrezselyova, S., Nosek, J., Tomaska, L. 2007. 450
Comparison of element levels in minimal and complex yeast media. Canadian Journal 451 of Microbiology, 53(4), 533-535. 452
Bagchi, B., Dey, S., Bhandary, S., Das, S., Bhattacharya, A., Basu, R., Nandy, P. 2012. 453
Antimicrobial efficacy and biocompatibility study of copper nanoparticle adsorbed 454
mullite aggregates. Materials Science and Engineering C, 32(7), 1897-1905. 455
Chong, M.L., Rahman, N.A., Yee, P.L., Aziz, S.A., Rahim, R.A., Shirai, Y., Hassan, M.A. 456 2009. Effects of pH, glucose and iron sulfate concentration on the yield of 457 biohydrogen by Clostridium butyricum EB6. International Journal of Hydrogen 458
Energy, 34(21), 8859-8865. 459
Das, D. 2009. Advances in biohydrogen production processes: An approach towards 460
commercialization. International Journal of Hydrogen Energy, 34(17), 7349-7357. 461
Davila-Vazquez, G., Arriaga, S., Alatriste-Mondragon, F., de Leon-Rodriguez, A., Razo-462 Flores, E. 2008. Fermentative biohydrogen production: trends and perspectives. 463
Reviews in Environmental Science and Bio/Technology, 7(1), 27-45. 464

Dinesh, R., Anandaraj, M., Srinivasan, V., Hamza, S. 2012. Engineered nanoparticles in the 465 soil and their potential implications to microbial activity. Geoderma, 173–174(0), 19-466 27. 467
Grieger, K.D., Fjordbøge, A., Hartmann, N.B., Eriksson, E., Bjerg, P.L., Baun, A. 2010. 468
Environmental benefits and risks of zero-valent iron nanoparticles (nZVI) for in situ 469 remediation: Risk mitigation or trade-off? Journal of Contaminant Hydrology, 118(3-470 4), 165-183. 471
Hallenbeck, P.C. 2009. Fermentative hydrogen production: Principles, progress, and 472 prognosis. International Journal of Hydrogen Energy, 34(17), 7379-7389. 473
Hamilton, C., Hiligsmann, S., Beckers, L., Masset, J., Wilmotte, A., Thonart, P. 2010. 474 Optimization of culture conditions for biological hydrogen production by Citrobacter 475
freundii CWBI952 in batch, sequenced-batch and semicontinuous operating mode. 476 International Journal of Hydrogen Energy, 35(3), 1089-1098. 477
Heinrichs, B., Pirard, J.-P., Schoebrechts, J.-P. 2001. Mass transfer in low-density xerogel 478 catalysts. AIChE Journal, 47(8), 1866-1873. 479
Heinrichs, B., Rebbouh, L., Geus, J.W., Lambert, S., Abbenhuis, H.C.L., Grandjean, F., Long, 480 G.J., Pirard, J.-P., van Santen, R.A. 2008. Iron(III) species dispersed in porous silica 481 through sol–gel chemistry. Journal of Non-Crystalline Solids, 354(2–9), 665-672. 482
Hiligsmann, S., Masset, J., Hamilton, C., Beckers, L., Thonart, P. 2011. Comparative study of 483
biological hydrogen production by pure strains and consortia of facultative and strict 484 anaerobic bacteria. Bioresource Technology, 102(4), 3810-3818. 485
Holladay, J.D., Hu, J., King, D.L., Wang, Y. 2009. An overview of hydrogen production 486
technologies. Catalysis Today, 139(4), 244-260. 487
Jagadevan, S., Jayamurthy, M., Dobson, P., Thompson, I.P. 2012. A novel hybrid nano 488
zerovalent iron initiated oxidation – Biological degradation approach for remediation 489 of recalcitrant waste metalworking fluids. Water Research, 46(7), 2395-2404. 490
Karadag, D., Puhakka, J.A. 2010. Enhancement of anaerobic hydrogen production by iron and 491
nickel. International Journal of Hydrogen Energy, 35(16), 8554-8560. 492
Kato, S., Hashimoto, K., Watanabe, K. 2012. Microbial interspecies electron transfer via 493 electric currents through conductive minerals. Proceedings of the National Academy of 494 Sciences, 109(25), 10042-10046. 495
Khanal, S.K., Chen, W.H., Li, L., Sung, S.W. 2004. Biological hydrogen production: effects 496 of pH and intermediate products. International Journal of Hydrogen Energy, 29(11), 497 1123-1131. 498
Klavsyuk, A.L., Kolesnikov, S.V., Gainullin, I.K., Saletsky, A.M. 2011. Study of the 499 interaction of a palladium nanocontact with a hydrogen molecule. JETP Letters, 93(9), 500
530-533. 501
Korbekandi, H., Iravani, S., Abbasi, S. 2009. Production of nanoparticles using organisms. 502 Critical Reviews in Biotechnology, 29(4), 279-306. 503

Kothari, R., Singh, D.P., Tyagi, V.V., Tyagi, S.K. 2012. Fermentative hydrogen production – 504 An alternative clean energy source. Renewable and Sustainable Energy Reviews, 505 16(4), 2337-2346. 506
Lambert, S., Alié, C., Pirard, J.-P., Heinrichs, B. 2004. Study of textural properties and 507
nucleation phenomenon in Pd/SiO2, Ag/SiO2 and Cu/SiO2 cogelled xerogel catalysts. 508 Journal of Non-Crystalline Solids, 342(1–3), 70-81. 509
Lee, Y.J., Miyahara, T., Noike, T. 2001. Effect of iron concentration on hydrogen 510 fermentation. Bioresource Technology, 80(3), 227-231. 511
Lin, P.Y., Whang, L.M., Wu, Y.R., Ren, W.J., Hsiao, C.J., Li, S.L., Chang, J.S. 2007. 512
Biological hydrogen production of the genus Clostridium: Metabolic study and 513 mathematical model simulation. International Journal of Hydrogen Energy, 32, 1728-514
1735. 515
Lovley, D.R. 2008. The microbe electric: conversion of organic matter to electricity. Current 516 Opinion in Biotechnology, 19(6), 564-571. 517
Marban, G., Vales-Solis, T. 2007. Towards the hydrogen economy? International Journal of 518
Hydrogen Energy, 32(12), 1625-1637. 519
Masset, J., Hiligsmann, S., Hamilton, C., Beckers, L., Franck, F., Thonart, P. 2010. Effect of 520 pH on glucose and starch fermentation in batch and sequenced-batch mode with a 521
recently isolated strain of hydrogen-producing Clostridium butyricum CWBI1009. 522
International Journal of Hydrogen Energy, 35(8), 3371-3378. 523
Neal, A. 2008. What can be inferred from bacterium–nanoparticle interactions about the 524 potential consequences of environmental exposure to nanoparticles? Ecotoxicology, 525
17(5), 362-371. 526
Park, H.S., Kim, B.H., Kim, H.S., Kim, H.J., Kim, G.T., Kim, M., Chang, I.S., Park, Y.K., 527
Chang, H.I. 2001. A Novel Electrochemically Active and Fe(III)-reducing Bacterium 528 Phylogenetically Related to Clostridium butyricum Isolated from a Microbial Fuel 529 Cell. Anaerobe, 7(6), 297-306. 530
Sagnak, R., Kapdan, I.K., Kargi, F. 2010. Dark fermentation of acid hydrolyzed ground wheat 531 starch for bio-hydrogen production by periodic feeding and effluent removal. 532 International Journal of Hydrogen Energy, 35(18), 9630-9636. 533
Sotiriou, G.A., Pratsinis, S.E. 2010. Antibacterial Activity of Nanosilver Ions and Particles. 534
Environmental Science & Technology, 44(14), 5649-5654. 535
Wang, J.L., Wan, W. 2009a. Factors influencing fermentative hydrogen production: A review. 536 International Journal of Hydrogen Energy, 34(2), 799-811. 537
Wang, J.L., Wan, W. 2009b. Kinetic models for fermentative hydrogen production: A review. 538 International Journal of Hydrogen Energy, 34(8), 3313-3323. 539
Xu, S., Liu, H., Fan, Y., Schaller, R., Jiao, J., Chaplen, F. 2012. Enhanced performance and 540
mechanism study of microbial electrolysis cells using Fe nanoparticle-decorated 541 anodes. Applied Microbiology and Biotechnology, 93(2), 871-880. 542

Zhang, Y.F., Shen, J.Q. 2007. Enhancement effect of gold nanoparticles on biohydrogen 543 production from artificial wastewater. International Journal of Hydrogen Energy, 544 32(1), 17-23. 545
Zidansek, A., Blinc, R., Jeglic, A., Kabashi, S., Bekteshi, S., Slaus, I. 2009. Climate changes, 546
biofuels and the sustainable future. International Journal of Hydrogen Energy, 34(16), 547
6980-6995. 548
549
550

Figure captions 551
Figure 1: Cumulative volume of hydrogen production by the pure C. butyricum in BHP tests 552 with 10
-6 mol·L
-1 of encapsulated metallic NP. The volumes of hydrogen are calculated at 553
atmospheric pressure and 30°C. The standard deviation bars are calculated on the triplicate 554
experiments made for each condition. 555
Figure 2: Investigation of hydrogen production by the pure C. butyricum in BHP tests with 556 metallic NP. (A) Metabolites analysis (mmol·L
-1) at the end of the fermentation (96h). (B) 557
Carbon mass balance (%).The standard deviation bars are calculated on the triplicate 558
experiments made for each condition. 559
Figure 3: Yields and mean hydrogen production rates in 2.5 L AnSBR with C. butyricum and 560
investigation on the effect of the addition of metallic NP. The Fe/SiO2 NP were added at the 561
sequence 7 and 9. HPR produced calculated at atmospheric pressure and 30°C. 562
Figure 4: Evolution of the metabolites concentration during the investigation on the effect of 563
Fe/SiO2 NP added at the sequence 7 and 9 in the 2.5 L AnSBR on the production of hydrogen 564
by C. butyricum. 565
Figure 5: Application of the Gompertz model on the hydrogen production in the 2.5 L AnSBR 566
with Fe/SiO2 NP. (A) Gompertz coefficients adjusted for each sequence with at least three 567 values measured and (B) mean Gompertz coefficients for the sequences without NP (F3 to 568
F6) and with NP (F7 to F14). 569
570
Table 1: Characteristics of the catalyst samples: preparation method, metal loading in catalyst; 571
catalyst mass and volume of suspension used in the MDT medium to reach the final metallic 572
concentration of 10-6 molmetal·L-1
573
Table 2: Hydrogen yields and Gompertz coefficient adjusted on the profiles of volumetric 574 hydrogen production curves for the BHP tests with NP. Standard deviations are calculated on 575
the triplicates experiments made for each condition. All the R² for the Gompertz model were 576
higher than 0.999. 577
Table 3: Comparison of the metabolites and CO2 mass balance of the successive sequences 578 without and with Fe/SiO2 NP in the 2.5 L AnSBR. The NP were added at the sequences F7 579
and F9. Negative values correspond to a consumption of the metabolite. 580

Table 1: Metal loading in catalyst; catalyst mass and volume of suspension used in the MDT medium to reach the final metallic concentration of 581
10-6
molmetal·L-1
582
NP denotation Reference sample Reduction of
the sample
Metallic
mass
content
Mass of catalyst added in 50mL
of water for concentrated
suspension preparation (g)
Volume of concentrated NP
suspension added in 1 L of MDT
medium (mL)
SiO2 X3 (Lambert et al., 2004) No - 0.2034 1.25
Pd/SiO2 Pd3.1 (Lambert et al., 2004) Yes 3.12% 0.0645 2.5
Ag/SiO2 Ag1.5 (Lambert et al., 2004) Yes 1.54% 0.0506 6.25
Fe/SiO2 dissol Fe/SiO2-D (Heinrichs et al., 2008) No 1.65% 0.1354 1.25
Fe/SiO2 cogel Fe/SiO2-C(E) (Heinrichs et al., 2008) No 1.65% 0.1354 1.25
Cu/SiO2 Cu0.1 (Lambert et al., 2004) Yes 0.12% 0.2059 12.5
583

Table 2: Hydrogen yields and Gompertz coefficient adjusted on the profiles of volumetric hydrogen production curves for the BHP tests with NP. 584
Standard deviations are calculated on the triplicates experiments made for each condition. All the R² for the Gompertz model were higher than 585 0.999. 586
Yields
(molH2·molglucose-1
)
Gompertz model
Lag phase duration
(h)
Maximum H2 production rate
(mLH2·h-1
)
Total hydrogen
production (mLH2)
Reference 0.92 ± 0.08 11.2 ± 1.6 1.97 ± 0.24 86.7 ± 7
Pd/SiO2 0.97 ± 0.09 11.5 ± 0.8 2.33 ± 0.22 95.8 ± 8.5
Ag/SiO2 0.97 ± 0.02 11.8 ± 1.8 2.21 ± 0.17 93.8 ± 2.8
Fe/SiO2
dissol 1.08 ± 0.06 11.6 ± 4.2 3.49 ± 0.31 119.4 ± 5.8
Fe/SiO2
cogel 1.05 ± 0.01 9.1 ± 1.9 2.85 ± 0.15 113.3 ± 1.3
Cu/SiO2 1.01 ± 0.08 8.3 ± 2.1 2.4 ± 0.6 103.9 ± 7.9
SiO2 0.96 ± 0.02 12.8 ± 3.1 2.13 ± 0.7 97.3 ± 2.7
587
588

Table 3: Comparison of the metabolites and CO2 mass balance of the successive sequences without and with Fe/SiO2 NP in the 2.5 L AnSBR. 589
The NP were added at the sequences F7 and F9. Negative values correspond to a consumption of the metabolite. 590
Carbon converted from glucose (%)
Lactate Formate Acetate Ethanol Butyrate CO2
F1 -3.9 -0.8 13.4 1.1 55.7 26.2
F2 0 0.2 14 0.5 49.2 24.9
F3 0 0.2 14.3 0.5 51.2 25
F4 0 1.1 13.1 0.5 48.8 23.6
F5 0 0.6 13 0.42 47.7 25.6
F6 1.2 1.5 14.7 1.4 48.6 25.9
F7 2.1 1.4 14.2 1 43.9 24.7
F8 1.9 1.5 14 1.5 46.5 26.7
F9 1 0.5 14.4 2.2 44.8 24.1
F10 2.4 0.9 13.8 1.6 42.7 24.1
F11 1.5 2.4 14.1 1.5 42.9 23.8
F12 4 1.5 13.6 0.1 42.5 23.8
F13 2.8 4.0 14.5 1.1 45.7 23.9
F14 2.6 2.8 14.6 2.6 42.8 24.3
Mean value without
NP (F3 – F6) 0.3 ± 0.6 0.8± 0.6 13.8 ± 0.8 0.5 ± 0.1 49.1 ± 1.5 25 ± 1
Mean value with NP
(F7 – F14) 2.7 ± 1 2.7 ± 1 14.2 ± 0.5 1.3 ± 1 43.5 ± 1.5 23.9 ± 0.2

27
Figure 1: Investigation of hydrogen production by the pure C. butyricum in BHP tests with 10
-
6 mol·L
-1 of encapsulated metallic NP. The volumes of hydrogen are calculated at atmospheric
pressure and 30°C. The standard deviation bars are calculated on the triplicate experiments
made for each condition.

28
Figure 2: Investigation of hydrogen production by the pure C. butyricum in BHP tests with
metallic NP. (A) Metabolites analysis (mmol·L-1
) at the end of the fermentation (96h). (B)
Carbon mass balance (%).The standard deviation bars are calculated on the triplicate
experiments made for each condition.
29
Figure 3: Yields and mean hydrogen production rates in 2.5 L AnSBR with C. butyricum and
investigation on the effect of the addition of metallic NP. The Fe/SiO2 NP were added at the
sequence 7 and 9. HPR produced calculated at atmospheric pressure and 30°C.
30
Figure 4: Evolution of the metabolites concentration during the investigation on the effect of
Fe/SiO2 NP added at the sequence 7 and 9 in 2.5 L AnSBR on the production of hydrogen by
C. butyricum.

31
Figure 5: Application of the Gompertz model on the hydrogen production in the 2.5 L AnSBR
with Fe/SiO2 NP. (A) Gompertz coefficients adjusted for each sequence with at least three
values measured and (B) mean Gompertz coefficients for the sequences without NP (F3 to
F6) and with NP (F7 to F14).