Fenner - Credit Suisse
21
DISCLOSURE APPENDIX CONTAINS ANALYST CERTIFICATIONS AND THE STATUS OF NON US ANALYSTS. FOR OTHER IMPORTANT DISCLOSURES, visit https://rave.credit-suisse.com/disclosures or call +1 (877) 291-2683 US Disclosure: Credit Suisse does and seeks to do business with companies covered in its research reports. As a result, investors should be aware that the Firm may have a conflict of interest that could affect the objectivity of this report. Investors should consider this report as only a single factor in making their investment decision. CREDIT SUISSE SECURITIES RESEARCH & ANALYTICS BEYOND INFORMATION ® Client-Driven Solutions, Insights, and Access 19 September 2013 Europe/United Kingdom Equity Research Engineering & Construction (Capital Goods (Europe)) Fenner (FENR.L) SMALL & MID CAP RESEARCH Time to get involved - Upgrade to Outperform ■ Action: We upgrade Fenner to Outperform, TP to 490p. ■ Investment Case: Five reasons underpin our upgrade: (i). While we fully acknowledge that pressures in the mining cycle are not over our ECS profit bridge analysis underpins 11% Group EPS CAGR 2013- 15E. CS 2014 EPS forecasts are now 3% ahead of consensus (Figure 4). (ii). With N.America recovering the headwind to Fenner’s mining exposure remains Australia. However, a recent CS trip to the Pilbara showed that commodity volumes (key driver of conveyor belt demand) from important Fenner customers remain robust. Furthermore, while Australian pricing pressures persist management are of the view that it has not degraded further and that the opex spending cycle will rebound in FY2014. (iii). Despite recent share price performance (+8% sector rel. over 1 month) Fenner's valuation remains attractive vs. both mining peers / UK Cap Goods sector – a 19% & 28% discount respectively on 2014E EV/EBITA (Figure 12). (iv). Based on performance vs. OE, mining service/consumables should remain in favour. We see potential for consolidation in the space with Fenner as an attractive M&A candidate. Midpoint of our M&A SOTP is 585p (Figure 15). (v). Finally, Fenner screens favourably on CS HOLT® with the share price discounting a contraction in Group 2015 EBITDA margin below our forecast. ■ Catalysts: FY 2013 Results – 13 th November. Fenner is a manufacturer and distributor of conveyor belting and reinforced precision polymer products. It operates in two segments: conveyor belting and advanced engineered products. The conveyor belting segment is engaged in the manufacture of rubber, polyvinyl chloride and steel cord conveyor belts. The advanced engineered products segment is engaged in the manufacture of precision polymer products, including precision drives for computer peripherals and copiers; power transmission and motion transfer components; silicone and hoses for heavy duty trucks and buses; seals and sealing solutions; technical textiles for industrial applications; rollers for digital image processing and medical diagnostics, and fluropolymer components for fluid and gas handling. Rating (from Neutral) OUTPERFORM* Price (18 Sep 13, p) 399.90 Target price (p) (from 390.00) 490.00¹ Market cap. (£ m) 775.18 Enterprise value (£ m) 900.8 *Stock ratings are relative to the coverage universe in each analyst's or each team's respective sector. ¹Target price is for 12 months. Financial and valuation metrics Year 08/12A 08/13E 08/14E 08/15E Revenue (£ m) 830.6 832.0 858.0 880.0 EBITDA (£ m) 139.00 123.00 133.00 140.00 Pre-tax Profit Adjusted (£ m) 103.9 84.7 96.0 103.0 CS adj. EPS (p) 35.87 28.69 32.82 35.38 Prev. EPS (p) — — 30.62 31.54 ROIC (%) 17.84 14.47 15.91 16.93 P/E (adj., x) 11.15 13.94 12.19 11.30 P/E rel. (%) 86.9 108.4 104.2 105.2 EV/EBITDA 6.3 7.3 6.6 6.1 Dividend (08/13E, p) 11.34 IC (08/13E, £ m) 416.09 Dividend yield (%) 2.8 EV/IC 2.2 Net debt/equity (08/13E, %) 43.3 Net debt (08/13E, £ m) 125.6 Number of shares (m) 193.84 Free float (%) 100.0 BV/share (08/13E, £) 1.4 Source: Company data, Credit Suisse estimates Research Analysts Jonathan Hurn, CFA 44 20 7883 4532 [email protected] Andre Kukhnin, CFA 44 20 7888 0350 [email protected] Max Yates 44 20 7883 8501 [email protected] Simon Toennessen 44 20 7883 6893 [email protected]
Transcript of Fenner - Credit Suisse

DISCLOSURE APPENDIX CONTAINS ANALYST CERTIFICATIONS AND THE STATUS OF NON US ANALYSTS. FOR OTHER IMPORTANT DISCLOSURES, visit https://rave.credit-suisse.com/disclosures or call +1 (877) 291-2683 US Disclosure: Credit Suisse does and seeks to do business with companies covered in its research reports. As a result, investors should be aware that the Firm may have a conflict of interest that could affect the objectivity of this report. Investors should consider this report as only a single factor in making their investment decision.
CREDIT SUISSE SECURITIES RESEARCH & ANALYTICS BEYOND INFORMATION®
Client-Driven Solutions, Insights, and Access
19 September 2013
Europe/United Kingdom
Equity Research
Engineering & Construction (Capital Goods (Europe))
Fenner (FENR.L) SMALL & MID CAP RESEARCH
Time to get involved - Upgrade to Outperform
■ Action: We upgrade Fenner to Outperform, TP to 490p.
■ Investment Case: Five reasons underpin our upgrade: (i). While we fully acknowledge that pressures in the mining cycle are not over our ECS profit bridge analysis underpins 11% Group EPS CAGR 2013-15E. CS 2014 EPS forecasts are now 3% ahead of consensus (Figure 4). (ii). With N.America recovering the headwind to Fenner’s mining exposure remains Australia. However, a recent CS trip to the Pilbara showed that commodity volumes (key driver of conveyor belt demand) from important Fenner customers remain robust. Furthermore, while Australian pricing pressures persist management are of the view that it has not degraded further and that the opex spending cycle will rebound in FY2014. (iii). Despite recent share price performance (+8% sector rel. over 1 month) Fenner's valuation remains attractive vs. both mining peers / UK Cap Goods sector – a 19% & 28% discount respectively on 2014E EV/EBITA (Figure 12). (iv). Based on performance vs. OE, mining service/consumables should remain in favour. We see potential for consolidation in the space with Fenner as an attractive M&A candidate. Midpoint of our M&A SOTP is 585p (Figure 15). (v). Finally, Fenner screens favourably on CS HOLT® with the share price discounting a contraction in Group 2015 EBITDA margin below our forecast.
■ Catalysts: FY 2013 Results – 13th November.
Fenner is a manufacturer and distributor of
conveyor belting and reinforced precision
polymer products. It operates in two
segments: conveyor belting and advanced
engineered products. The conveyor belting
segment is engaged in the manufacture of
rubber, polyvinyl chloride and steel cord
conveyor belts. The advanced engineered
products segment is engaged in the
manufacture of precision polymer products,
including precision drives for computer
peripherals and copiers; power transmission
and motion transfer components; silicone
and hoses for heavy duty trucks and buses;
seals and sealing solutions; technical textiles
for industrial applications; rollers for digital
image processing and medical diagnostics,
and fluropolymer components for fluid and
gas handling.
Rating (from Neutral) OUTPERFORM* Price (18 Sep 13, p) 399.90 Target price (p) (from 390.00) 490.00¹ Market cap. (£ m) 775.18 Enterprise value (£ m) 900.8
*Stock ratings are relative to the coverage universe in each analyst's or each team's respective sector.
¹Target price is for 12 months.
Financial and valuation metrics
Year 08/12A 08/13E 08/14E 08/15E Revenue (£ m) 830.6 832.0 858.0 880.0 EBITDA (£ m) 139.00 123.00 133.00 140.00 Pre-tax Profit Adjusted (£ m) 103.9 84.7 96.0 103.0 CS adj. EPS (p) 35.87 28.69 32.82 35.38 Prev. EPS (p) — — 30.62 31.54 ROIC (%) 17.84 14.47 15.91 16.93 P/E (adj., x) 11.15 13.94 12.19 11.30 P/E rel. (%) 86.9 108.4 104.2 105.2 EV/EBITDA 6.3 7.3 6.6 6.1
Dividend (08/13E, p) 11.34 IC (08/13E, £ m) 416.09 Dividend yield (%) 2.8 EV/IC 2.2 Net debt/equity (08/13E, %) 43.3 Net debt (08/13E, £ m) 125.6 Number of shares (m) 193.84 Free float (%) 100.0 BV/share (08/13E, £) 1.4
Source: Company data, Credit Suisse estimates
Research Analysts
Jonathan Hurn, CFA
44 20 7883 4532
Andre Kukhnin, CFA
44 20 7888 0350
Max Yates
44 20 7883 8501
Simon Toennessen
44 20 7883 6893

19 September 2013
Fenner (FENR.L) 2
Fenner FENR.L Price (18 Sep 13): 399.90p, Rating: NEUTRAL, Target Price: (from 390.00) 490.00p
Income statement (£ m) 08/12A 08/13E 08/14E 08/15E
Revenue (£ m) 831 832 858 880 EBITDA 139 123 133 140 Depr. & amort. (20) (23) (24) (25) EBIT (£) 108 84 92 97 Net interest exp. (15) (15) (13) (12) Associates — — — — Other adj, 11 16 17 18 PBT (£) 104 85 96 103 Income taxes (26) (21) (24) (26) Profit after tax 78 64 72 77 Minorities (4) (5) (5) (5) Preferred dividends — — — — Associates & other (4) (3) (3) (3) Net profit (£) 70 56 64 69 Other NPAT adjustments (11) (15) (16) (17) Reported net income 59 41 48 52
Cash flow (£) 08/12A 08/13E 08/14E 08/15E
EBIT 108 84 92 97 Net interest (12) (18) (16) (15) Cash taxes paid (24) (21) (24) (26) Change in working capital (8) 0 (9) (9) Other cash & non-cash items 28 39 41 43 Cash flow from operations 91 84 83 90 CAPEX (26) (20) (30) (30) Free cash flow to the firm 65 64 53 60 Acquisitions (37) (70) (8) (8) Divestments — — — — Other investment/(outflows) — — — — Cash flow from investments (63) (90) (38) (38) Net share issue/(repurchase) — — — — Dividends paid (18) (24) (26) (20) Issuance (retirement) of debt — (5) — — Other (2) — — — Cash flow from financing activities
(20) (29) (26) (20) Effect of exchange rates (5) 7 — — Changes in Net Cash/Debt 4 (28) 19 32 . Net debt at start 102 98 126 107 Change in net debt (4) 28 (19) (32) Net debt at end 98 126 107 75
Balance sheet (£ m) 08/12A 08/13E 08/14E 08/15E
Assets Cash and cash equivalents 109 109 109 109 Accounts receivable 109 109 118 122 Inventory 106 106 109 114 Other current assets 13 13 13 13 Total current assets 336 336 348 359 Total fixed assets 215 212 218 223 Intangible assets and goodwill 221 207 192 176 Investment securities — — — — Other assets 25 18 18 18 Total assets 798 774 777 777 Liabilities Accounts payable 81 81 83 84 Short-term debt 11 — — — Other short term liabilities 90 90 93 95 Total current liabilities 181 171 176 180 Long-term debt 195 234 215 184 Other liabilities 92 79 79 79 Total liabilities 469 484 470 442 Shareholders' equity 313 274 291 319 Minority interest 16 16 16 16 Total equity & liabilities 798 774 777 777 Net debt (£ m) 98 126 107 75
Per share data 08/12A 08/13E 08/14E 08/15E
No. of shares (wtd avg) 194 194 194 194 CS adj. EPS (p) 35.87 28.69 32.82 35.38 Prev. EPS (p) — — 30.62 31.54 Dividend (p) 10.50 11.34 12.47 13.72 Div yield 2.63 2.84 3.12 3.43 Dividend payout ratio 29.27 39.53 38.01 38.79 Free cash flow per share (p)
33.61 32.90 27.50 30.70
Key ratios and valuation
08/12A 08/13E 08/14E 08/15E
Growth(%) Sales 15.6 0.2 3.1 2.6 EBIT 30.4 (21.9) 9.5 5.4 Net profit 28.8 (20.1) 14.4 7.8 EPS 28.5 (20.0) 14.4 7.8 Margins (%)
EBITDA margin 16.7 14.8 15.5 15.9 EBIT margin 13.0 10.1 10.7 11.0 Pretax margin 12.5 10.2 11.2 11.7 Net margin 8.4 6.7 7.4 7.8 Valuation metrics (x) EV/sales 1.1 1.1 1.0 1.0 EV/EBITDA 6.3 7.3 6.6 6.1 EV/EBIT 8.1 10.7 9.6 8.8 P/E 11.1 13.9 12.2 11.3 P/B 2.5 2.8 2.7 2.4 Asset turnover 1.0 1.1 1.1 1.1 ROE analysis (%) ROE stated-return on equity
19.7 13.8 16.9 16.9 ROIC 17.8 14.5 15.9 16.9 Interest burden 1.0 1.0 1.0 1.1 Tax rate 29.6 31.6 31.6 31.8 Financial leverage 0.66 0.86 0.74 0.58 Credit ratios (%) Net debt/equity 29.7 43.3 34.7 22.4 Net debt/EBITDA 0.7 1.0 0.8 0.5 Interest coverage ratio 7.2 5.5 7.1 8.1
Source: FTI, Company data, Thomson Reuters, Credit Suisse Securities
(EUROPE) LTD. Estimates.
237
337
437
Sep-11 Jan-12 May-12 Sep-12 Jan-13 May-13
Price Price relative
The price relative chart measures performance against the FTSE ALL SHARE
INDEX which closed at 3493.47 on 18/09/13
On 18/09/13 the spot exchange rate was £.84/Eu 1. - Eu .75/US$1

19 September 2013
Fenner (FENR.L) 3
1. Potential for consensus upgrades Based on our bottom up mining capex / opex model and analysis of the Fenner profit
bridge we see 3%+ upside to 2014 consensus EPS forecast while 2015 estimates look
well underpinned on conservative rates of YoY profit growth.
Focus on Engineered Conveyor Solutions…
Figure 1 shows our forecast for Fenner ECS divisional revenue growth in 2014 (+3% YoY)
and 2015 (+2% YoY). Capex forecasts (which are attributable to c12% of ECS sales in
2013 on our estimates) come from our bottom up mining capex model based on our
Mining teams estimates for 90 miners globally while our Opex forecasts (relate to
remaining c88% of ECS sales) use CS commodity supply forecasts as a base and are
overlaid with pricing, de-stocking/restocking effects, productivity and ore grade
deterioration considerations.
Figure 1: ECS Revenue Forecasts in millions, unless otherwise stated
Calendarised (%) Fenner (%)
% exposure 2012 2013E 2014E 2015E 2013E 2014E 2015E 2013E 2014E 2015E
Iron Ore 23% 62% 7% -18% -34% 25% -10% -29% - -2.2% -6.6%
Coal 51% 14% -11% -12% -22% -3% -12% -19% - -6.0% -9.5%
Other 26% 67% -10% -10% 5% 16% -10% 0% - -2.6% 0.0%
Total -11.9% -16.8%
Weighted Growth Rate -1.5% -2.2%
Calendarised (%) Fenner (%)
% exposure 2012 2013E 2014E 2015E 2013E 2014E 2015E 2013E 2014E 2015E
Iron Ore 23% 2% 5% 14% 9% 4% 11% 10% - 2.6% 2.4%
Met Coal 10% 6% 6% 8% 4% 6% 7% 6% - 0.7% 0.6%
Thermal Coal 41% 10% 4% 4% 3% 6% 4% 3% - 1.6% 1.2%
Other 26% 2% 2% 2% 0.6% 0.6%
Total 5.5% 4.8%
Weighted Growth Rate 4.8% 4.2%
Fenner ECS Division Total 2013E 2014E 2015E
OE (£,m) 68 60 50
Aftermarket (£,m) 497 521 543
Total 565 581 592
YoY growth % 3% 2%
OE % 12% 10% 8%
After Market % 88% 90% 92%
CS Capex forecasts (%)
CS Opex forecasts (%)
Source: Company data, Credit Suisse estimates
Figure 2 is the CS breakdown of the ECS profit bridge by geography. In our view, the key
takeaways are:
■ While only 16% of divisional sales Europe generates an 18% operating profit margin
positioning Fenner well for a recovery in Europe. It is also the highest margin
geography having overtaken Asia Pacific.
■ With destocking over in North America, opex spend resumed and monthly book to bill
increasing sequentially, 2013 profit has increased 50% in H2 vs. H1. Recent
management comments at the CS Cap Goods conference were that this improving
trend is expected to continue into 2014, the restock by customers is still to come and
this market has seen no pricing pressure (aided by its fragmented structure).
■ On the flipside despite H2 seasonally being a stronger period for Fenner ECS, Asia
Pacific profitability has fallen 20% sequentially vs. H1. Underpinning this are lower
activity levels in Australia but also pricing pressure from a reasonably concentrated
customer base. However, on the latter management also stated at our Cap Goods

19 September 2013
Fenner (FENR.L) 4
conference that the vast majority of major Australian supply contracts have now been
renegotiated with price downs averaging low single digits (aided by offering a lower
grade of belt / bundling of products) and that they now believe that the worst of the
Australian price down environment has passed with no significant further deterioration
expected.
■ On the back of the H2 2013 contraction in Australia management reduced the
workforce predominantly within the OE exposed operations (50% of Australian
revenue is generated from service). We believe the cost of this equates to at least
£1m with it taken above the line. This cost will not be repeated in 2014.
Based on our profit bridge analysis which includes Fenner's characteristic H2 weighting
we believe the Americas (underpinned by a return to normal trading patterns), Europe and
Africa will see YoY profit growth in 2014 while Asia Pacific will see profitability down YoY
as the reduced profit level of H2 2013 continues into FY14.
For 2015 we see the YoY profit growth continuing in the Americas, Europe and Africa
aided by factors including increasing service levels and the structural move to increased
automation of mining assets (and use of conveyor belts). We also believe Asia Pacific can
return to YoY growth with management stating at our conference that based on their
experience in North America reduced spend on opex can last for up to c9 months before
problems materially impact operational output. On this basis opex spend will have to return
in Asia Pacific within the next 6 months.
Figure 2: ECS Profit Bridge in millions, unless otherwise stated
Americas Asia Pacific Europe Africa SubTotal Above the line
prior year
costs not
repeated
Divisional
EBITA
Sales 42% 38% 16% 4%
Profit 36% 40% 21% 3%
Assummed Margin 10% 12% 18% 10%
H1 2013 (£,m) 9 14 5 1 29
H2 2013 (£,m) 14 12 9 1 36
FY 2013 (£,m) 23 26 14 2 65
FY 2014 (£,m) 27 23 17 3 70 1 71
FY 2015 (£,m) 29 24 18 3 75 75 Source: Company data, Credit Suisse estimates
… But don’t forget AEP
While attention is predominantly focused on the performance of ECS it is important to
remember the AEP division remains the more profitable and contributes c30% of group
revenue. At this juncture our revenue forecasts for AEP show no material change with
destocking having now runs its course and YoY growth continuing to be driven by both
Medical and Seals sold into Oil & Gas (particularly upstream unconventional). The only
area of change is our outlook for the divisional margin which we now expect to be broadly
unchanged 2014-2015E with the operational gearing impact of increasing volume being
offset by an increased spend on R&D (particularly in oil & gas with the cost taken above
the line).

19 September 2013
Fenner (FENR.L) 5
Figure 3: AEP revenue and EBITA forecasts in millions, unless otherwise stated
FY 2011 FY 2012 H1 2013 H2 2013E FY 2013E FY 2014E FY 2015E
Revenue 207.6 237.2 125.6 135.2 267 277 288
EBITA 38.2 43.6 19.1 24.9 44 47 49
EBITA Margin 18.4% 18.4% 15.2% 18.4% 16.5% 17.0% 17.0%
Source: Company data, Credit Suisse estimates
CS estimates vs. Consensus
Figure 4 shows CS forecasts vs. consensus estimates. Focusing on EPS CS estimates
are 3% ahead for 2014 and 1% for 2015. However, we note that upside potential exists for
2015 as our Asia Pacific estimates discount profitability still 7% below the 2013 level.
Figure 4: Fenner: CS estimates vs. Consensus in millions, unless otherwise stated
CS estimates Consensus CS vs C'sus CS estimates Consensus CS vs C'sus
Sales (£,m) 858 860 0% 880 897 -2%
EBITA (£,m) 109 107 2% 115 114 1%
EPS (p) 32.8 32.0 3% 35.4 35.1 1%
2014E 2015E
Source: Bloomberg, Credit Suisse estimates

19 September 2013
Fenner (FENR.L) 6
2. Australian mining trends not all negative As highlighted Asia Pacific and Australia in particular has been a headwind to group
performance and contributing to the last profit downgrade (24/04/13). However, on a
recent trip to Australia by the CS mining team not all trends within the country are negative
with the outlook for iron ore volume out of the Pilbara region of Western Australia from key
Fenner customers particularly supportive. This is in addition to management comments
(above) that they do not expect a further step down in pricing pressure on their Australian
contracts.
Iron Ore volumes - ahead of forecast at Rio
Capex accounts for a small proportion of ECS revenue with the vast majority consumables
/ service (Figure 8) whose key driver remains volume. While the recent visit of the CS
mining team to the Pilbara reinforced recent cuts to capex forecasts at Rio and on-going
cultural changes at the miners (Rio managers' KPI targets linked to operational
performance) it also highlighted that volumes for important Fenner commodities such as
iron ore are ramping up quicker than previously thought. On the back of the trip CS
estimates for Rio increased 5-6% for 2014-15 (11th Sept, Rio Tinto – Ramping up earnings
/ Pilbara Primer) based on the early delivery of iron ore growth tonnes. With Fenner belts
traditionally sold on number of tonnes shipped rather than price / set operational life this
trend is supportive for future Conveyor Belt demand and associated levels of service.
Figure 5: Rio Tinto - Revised Pilbara iron ore production
forecasts (half-year annualised, Mtpa)
Figure 6: Rio’s Pilbara development options shows
material increase in mine capacity through 2018
150
200
250
300
350
1H10
2H10
1H11
2H11
1H12
2H12
1H13
2H13F
1H14F
2H14F
1H15F
2H15F
1H16F
2H16F
1H17F
2H17F
1H18F
2H18F
1H19F
2H19F
1H20F
2H20F
New Old
Source: Company data, Credit Suisse estimates from 2H 2013 Source: Company presentation
Figure 7: Rio Tinto – Pilbara iron ore production forecasts (Mt)
2013 2014 2015 2016 2017 2018 2019 2020
New 250,828 282,500 302,500 325,000 345,000 360,000 360,000 360,000
Old 248,828 275,000 295,000 315,000 335,000 355,000 360,000 360,000
Source: Credit Suisse estimates
Figure 8: Fenner: Exposure by category and commodity in millions, unless otherwise stated
2012 2012
OEM 14% Bulk Materials 26%
Service 22% Coal Mining & Handling 51%
Replacement (3-5yr belt life) 64% Other (mostly Iron Ore) 23%
Source: Company data, Credit Suisse estimates

19 September 2013
Fenner (FENR.L) 7
3. Attractive valuation vs. peers Despite outperforming the UK Capital Goods sector by 8% over the last month, Figure 9
shows that Fenner's performance has still lagged that of its mining peers YTD. Concerns
have focused on N.American coal followed by Australian pricing issues which together
have contributed to a series of earnings downgrades.
However, conclusions from our analysis in Figure 2 support management’s comments that
‘the Group continues to anticipate a return to growth in its 2013/4 financial year’ and that
the EPS downgrade cycle is over.
Figure 9: Withstanding the recent rally in the Fenner share price, performance stills lags
its mining peer group
0.70
0.80
0.90
1.00
1.10
1.20
Jan-13 Feb-13 Mar-13 Apr-13 May-13 Jun-13 Jul-13 Aug-13 Sep-13
Fenner Fenner Mining Peers
Source: Thomson Reuters. Fenner ~Mining peers used are Caterpillar Atlas Copco, Sandvik, Komatsu,
Metso, Terex, Weir
Figure 10 and Figure 11 illustrates that Fenner is currently trading towards the bottom of
its historic range on EV/EBITA and towards the mid-point on PE. This compares to a UK
Capital Goods sector where the same multiples for a number of companies are towards or
at the top of their historical 7 year range. Furthermore the Fenner 2014E EV/Sales multiple
of 1.08x compares favourably vs. a 2014 forecast Group EBITA margin of 12.7%.
Figure 10: Fenner currently trades at the midpoint of its
historical trading range on EV/EBITA and CS Underlying
PE
Figure 11: Current multiple vs. 7 year high and 7 year low
0.0
2.0
4.0
6.0
8.0
10.0
12.0
14.0
16.0
18.0
EV/Sales EV/EBITA CS Underlying PE
7-year low 7-year high Current
EV/Sales EV/EBITA CS Underlying PE
7-year low 0.78x 7.1x 8.7x
7-year high 1.15x 10.7x 15.3x
Current 1.08x 8.5x 12.1x
Source: Thomson Reuters, Credit Suisse estimates Source: Credit Suisse estimates

19 September 2013
Fenner (FENR.L) 8
Fenner is currently trading at a 23% discount to the sector on 2014E earnings (Figure 12).
Historically the discount for Fenner has averaged 10%. We see potential for this to close.
Our new target price of 490p equates to a Fenner 2014E PE of 14.9x representing a 6%
discount to the UK Capital Goods sector.
Figure 12: Fenner's continues to trade at a discount to both Mining and UK Capital Goods peers. The PE discount vs.
the UK has averaged 10% through cycle vs. the current 23%.
Company
EV/Sales EV/EBITA PE EV/Sales EV/EBITA PE
Caterpillar 1.57x 13.7x 11.0x 1.41x 11.8x 9.4x
Atlas Copco 2.61x 12.3x 16.7x 2.53x 11.8x 15.6x
Sandvik 1.53x 10.9x 15.0x 1.51x 10.3x 14.0x
Komatsu 1.45x 9.1x 11.7x 1.35x 7.8x 10.0x
Metso 0.74x 8.9x 13.1x 0.74x 8.2x 12.0x
Terex 0.55x 6.7x 10.9x 0.55x 5.6x 8.7x
Weir 2.18x 11.6x 14.7x 2.11x 11.2x 14.2x
Mining peers 1.52x 10.5x 13.3x 1.46x 9.5x 12.0x
Fenner vs Mining peers -29% -19% -9% -30% -19% -7%
UK Cap Goods 2.03x 11.8x 15.7x 1.96x 11.3x 14.9x
Fenner vs UK Cap Goods peers -47% -28% -23% -48% -31% -25%
Fenner 1.08x 8.5x 12.1x 1.01x 7.8x 11.2x
2015E2014E
Source: Thomson Reuters, Credit Suisse estimates *Priced as of intraday price of 396p 18/09/13
Figure 13 is one of our favoured methods of analysing relative valuation within the sector.
It compares 2014 EV/EBITA vs. the CS calculation of Cash adjusted return (see our note
Searching for Through-Cycle Value Creation - 11/09/13). As can be seen relative to our
Pan European Capital Goods sector the current Fenner share price is not fully discounting
the level of ROIC generated (which on our forecast should improve further through 2015E).
Modelling a scenario where Fenner’s share price fully discounts the level of cash adjusted
ROIC generated (move up to the black line) then there is potential for 1.5x points to be
added to the company’s EV/EBITA multiple (+c20%).
Figure 13: Relative to our Pan European Capital Goods universe Fenner's valuation does not fully reflects the level of
CS Adjusted ROIC it generates. Looking ahead we expect Fenner's ROIC profile to improve through 2015E.
Alfa Laval
Assa Abloy
Atlas Copco
Electrolux
Metso
Sandvik
Schindler
SKF
ABB
Alstom
Legrand
Nexans
PhilipsPrysmian
Schneider
Siemens
Bodycote
Fenner
GKN
Halma
IMI
Laird
Melrose
Morgan Adv. Mats
Senior Smiths Group
Spectris
Spirax
VesuviusWeir
Sector average
7
8
9
10
11
12
13
14
15
2% 4% 6% 8% 10% 12% 14% 16% 18% 20% 22% 24% 26%
2014E
EV
/EB
IT
Cash Adjusted 2013-2014E ROIC
Geberit(ROIC 31.6%, EV/EBIT 14.2)
Kone (ROIC 27.4%, EV/EBIT 12.9)
Rotork(ROIC 30.4%, EV/EBIT 14.1)
Source: Company data, Credit Suisse estimates

19 September 2013
Fenner (FENR.L) 9
4. Fenner M&A analysis Within the current mining cycle, it is clear from results / commentary from companies
including Weir and Atlas Copco that the aftermarket / consumables side of their business
continues to outperform relative to OE. We believe that for FY2013E OE within Fenner’s
ECS division will have fallen to c12% meaning that service and replacement account for
the remainder. We are of the view that this product mix would be attractive to larger
mining peers such as CAT whose recent focus has been on increasing its service /
aftermarket component within its revenue mix and being a ‘one –stop’ shop for its
customers (CAT has a limited heavy duty conveyor belt offering vs. global No.1 Fenner).
Figure 14 highlights recent M&A multiples paid within the mining sector.
Figure 14: Recent multiples paid for Mining M&A assets
EV/Sales EV/EBIT
Australian Conveyor Solution 0.6 6.0
Allison Custom Fabrication 2.3 7.5
Statewide 2.7 8.0
Conveyor Serv ices Corp 1.5 8.2
King Energy Serv ices 0.9 4.4
Northern Belting 1.2 7.7
Spiceline 0.8 4.2
R.Wales 1.8 10.1
Linatex 2.0 12.9
CH Warman 2.9 13.0
Sandvik Seco Tools 1.0 6.2
CAT Bucyrus 2.3 15.7
Aaalborg Portland 0.6 7.9
Laperriere 1.1 15.8
Ludowici 1.9 20.1
Average multiples paid 1.6 9.8
Fenner
Weir
FL Smidth
Acquirer TargetMultiple paid
Source: Company data, Credit Suisse estimates, Thomson Reuters
Applying these multiples to Fenner 2014E forecasts results in an M&A SOTP range of
514p-658p. At the midpoint, this would represent c45%+ to current levels.
Figure 15: Fenner: M&A SOTP in millions, unless otherwise stated
Engineered Conveyor Solutions (£,m) 581 71
Appropriate Mining multiple 1.6x 9.8x
ECS - Enterprise Value (£,m) 930 696
Advanced Engineered Products (£,m) 277 47
Appropriate Industrials multiple 1.8x 9.4x
AEP - Enterprise Value (£,m) 485 440
Fenner Enterprise Value (£,m) 1,414 1,136
Net cash / (debt) £,m -107 -107
Pension deficit (£,m) -35 -35
Market Cap (£,m) 1,273 994
Number of shares (m) 194 194
Estimated Share price (£) 6.58 5.14
2014E 2014EYear
Source: Credit Suisse estimates

19 S
ep
tem
ber 2
01
3
Fe
nn
er (F
EN
R.L
) 1
0
5. HOLT® - price discounting material margin / low growth Figure 16: Market implied HOLT® CFROI®
1
FENNER: Priced for low growth and fading CFROI levels
Historical Operations. Fenner's CFROI
reached a new peak in 2012 driven higher by (i)
improvements in both margins (operating profit in
the Conveyor Solutions division representing
71% of sales grew twice as fast as revenues)
and (ii) asset turns (benefited from the 5th year of
double digit sales growth)
Market Expectations. Using IBES consensus
estimates for sales growth and EBITDA margins
out to 2015, Fenner is priced for CFROI levels to
fade by 230bps over the next 5 years (with sales
growth of 4.2% p.a. post 2014e and margins
dropping to 14.0% by 2017, flat thereafter).
Assuming instead that margins remain flat at 15%
beyond 2015e (with sales growth of 4.2% p.a.)
the warranted price would be £4.10.
Modeling EBITDA margins remaining at 16%
post 2015 and inline with our conservative
forecasts then the warranted price moves up to
£4.50. A key driver to move the HOLT valuation
higher is organic growth with Fenner needing to
generate >4%. Within a more normalised trading
backdrop we believe this is achievable.
Risks To Consider. Fenner has a high score onHOLT’s Accounting Quality and has a lowprobability of default (2%). Price momentum and3 month CFROI revisions are positive relative topeers.
Source: Credit Suisse HOLT, Credit Suisse estimates
19 September 2013
Fenner (FENR.L) 11
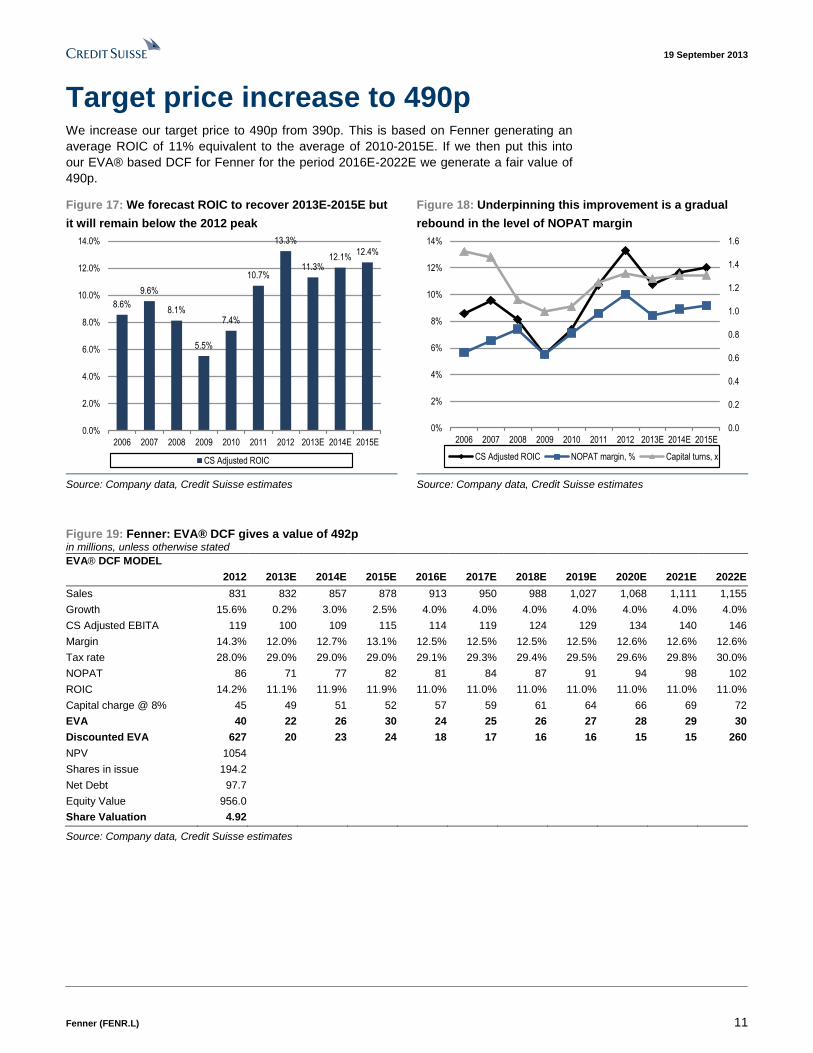
Target price increase to 490p We increase our target price to 490p from 390p. This is based on Fenner generating an
average ROIC of 11% equivalent to the average of 2010-2015E. If we then put this into
our EVA® based DCF for Fenner for the period 2016E-2022E we generate a fair value of
490p.
Figure 17: We forecast ROIC to recover 2013E-2015E but
it will remain below the 2012 peak
Figure 18: Underpinning this improvement is a gradual
rebound in the level of NOPAT margin
8.6%
9.6%
8.1%
5.5%
7.4%
10.7%
13.3%
11.3%12.1%
12.4%
0.0%
2.0%
4.0%
6.0%
8.0%
10.0%
12.0%
14.0%
2006 2007 2008 2009 2010 2011 2012 2013E 2014E 2015E
CS Adjusted ROIC
0.0
0.2
0.4
0.6
0.8
1.0
1.2
1.4
1.6
0%
2%
4%
6%
8%
10%
12%
14%
2006 2007 2008 2009 2010 2011 2012 2013E 2014E 2015E
CS Adjusted ROIC NOPAT margin, % Capital turns, x
Source: Company data, Credit Suisse estimates Source: Company data, Credit Suisse estimates
Figure 19: Fenner: EVA® DCF gives a value of 492p in millions, unless otherwise stated
EVA® DCF MODEL
2012 2013E 2014E 2015E 2016E 2017E 2018E 2019E 2020E 2021E 2022E
Sales 831 832 857 878 913 950 988 1,027 1,068 1,111 1,155
Growth 15.6% 0.2% 3.0% 2.5% 4.0% 4.0% 4.0% 4.0% 4.0% 4.0% 4.0%
CS Adjusted EBITA 119 100 109 115 114 119 124 129 134 140 146
Margin 14.3% 12.0% 12.7% 13.1% 12.5% 12.5% 12.5% 12.5% 12.6% 12.6% 12.6%
Tax rate 28.0% 29.0% 29.0% 29.0% 29.1% 29.3% 29.4% 29.5% 29.6% 29.8% 30.0%
NOPAT 86 71 77 82 81 84 87 91 94 98 102
ROIC 14.2% 11.1% 11.9% 11.9% 11.0% 11.0% 11.0% 11.0% 11.0% 11.0% 11.0%
Capital charge @ 8% 45 49 51 52 57 59 61 64 66 69 72
EVA 40 22 26 30 24 25 26 27 28 29 30
Discounted EVA 627 20 23 24 18 17 16 16 15 15 260
NPV 1054
Shares in issue 194.2
Net Debt 97.7
Equity Value 956.0
Share Valuation 4.92
Source: Company data, Credit Suisse estimates

19 S
ep
tem
ber 2
01
3
Fe
nn
er (F
EN
R.L
) 1
2
Figure 20: Fenner: Company Background
Geographic Split Operating Profit Mix Sales Mix End Market Split
Division Products End Markets / Channels Main Competitors / Positioning Revenue Split by Geo Key Drivers / Themes
Engineered Conveyor Solutions
FY2012 Sales - £593m,
10.3% org. growth
FY2012 EBITA - £84m,
14.2% margin
The suite of products and services which
serve the conveying needs of mining, power
generation and bulk handling markets. The
suite of products and services includes
heavyweight ply, solid woven and steel cord
conveyor belting and the design, installation,
monitoring and maintenance of conveyor
systems and components. Commercial
arrangements vary from a purely
transactional relationship to a full strategic
partnership to reduce both conveyor
downtime and total cost of ownership.
Coal mining & handling, Bulk materials,
Other mining
Continental (17%), Veyance (formerly
Goodyear, Private Equity owned (16%),
Semperit (6%), Bridgestone (5%), Svedala
(4%), Bando (4%)
Europe - £96m (16%)
Americas - £250m (42%)
Asia Pacific - £224m (38%)
Africa - £24mn (4%)
Volume of coal, iron ore,
copper and aggregate
mined. Increasing
outsourcing by majors of
mining service needs
Advanced Engineered Products
FY2012 Sales - £237m,
8.6% org. growth
FY2012 EBITA - £44m,
18.4% margin
Performance critical hydraulic seals for the
global fluid power industry, bespoke sealing,
products for process applications including
oil and gas, electronics, pumps, valves,
compressors and aerospace applications,
custom-engineered biomedcal textile
structures for implantable medical devices,
single use disposable devices (usually
silicone based), a wide range of
sophisticated industrial fabrics, critical
polymer components to the office
automation industry; extensive range of
bespoke solutions for mechanical power
transmission and motion transfer
applications, silicone and EPDM speciality
hoses for the diesel engine, truck, bus and
off-road equipment OEM market.
General Industrial, Oil&Gas, Construction,
Medical, Automation, Transportation, Fluid
power, Mining, Agriculture
Varies according to product but includes
Parker Hannifin, John Crane and Trelleborg
(seals), Continental (hose). Medical remains
very specialised
Europe - £56m (23.6%)
Americas - £161m (67.8%)
Asia Pacific - £20m (8.6%)
Levels of global IP remains a
key driver for this division as
well as specific end markets
including truck and off road
vehicles.
FENNER (FENR.L / FENR LN) - JONATHAN HURN, CFA +44 20 7883 4532 / [email protected]
ECS
68%
AEP
32%
ECS
60%
AEP
40%
Europe, 18%
Americas, 50%
Asia Pacific, 29%
Africa, 3%Coal mining &
handling36%
Bulk Materials
19%
Other Mining
16%
General Industrial
7%
Oil&Gas
6%
Construction
4%
Medical
4%
Others
8%
Shareholding structure
Free float: 95%
Top 5 shareholders: Standard Life
Investments - 11%, Scottish Widows -
8%, Lloyds Banking Group Plc - 5%,
Legal & General - 5%, BNP Paribas - 5%
Ownership by Country: UK - 71%,
USA - 12%, Norway - 3%, France - 3%,
Luxembourg - 3%
Management
Chairman -Mark Abrahams
CEO - Nicholas Hobson
CFO - Richard Perry
CS - Debra Bradbury
Source: Company data, Credit Suisse estimates

19 September 2013
Fenner (FENR.L) 13
Financial Statements
Figure 21: Fenner: Divisional Breakdown In millions, unless otherwise stated
REVENUE 2006 2007 2008 2009 2010 2011 2012 2013e 2014e 2015e
FY FY FY FY FY FY FY FY FY FY
Engineered Conveyor Solutions 269.5 255.8 292.2 361.8 389.5 510.7 593.4 565.0 581.0 592.0
Change yoy, % 17% -5% 14% 24% 8% 31% 16% -5% 3% 2%
CS constant currency organic growth yoy, % 16% 1% 9% -3% 1% 21% 10% -8% 6% 2%
Advanced Engineering Products 109.5 125.0 145.6 137.6 163.0 207.6 237.2 267.0 277.0 288.0
Change yoy, % 50% 14% 16% -5% 18% 27% 14% 13% 4% 4%
CS constant currency organic growth yoy, % 49% 1% 0% -25% 18% 23% 9% -1% 4% 4%
Group revenue 379.0 380.8 437.8 499.4 552.5 718.3 830.6 832.0 858.0 880.0
Change yoy, % 25% 0% 15% 14% 11% 30% 16% 0% 3% 3%
CS constant currency organic growth yoy, % 25% 1% 6% -9% 6% 22% 10% -6% 5% 3%
EBITA
Engineered Conveyor Solutions 23.8 24.2 29.1 30.8 40.5 61.1 84.4 65.0 71.0 75.0
Margin, % 8.8% 9.5% 10.0% 8.5% 10.4% 12.0% 14.2% 11.5% 12.2% 12.7%
CS constant currency organic growth yoy, % 159% 8% 13% -24% 23% 35% 25% -25% 13% 6%
Advanced Engineering Products 15.2 20.0 26.1 15.8 22.6 38.2 43.6 44.0 47.0 49.0
Margin, % 13.9% 16.0% 17.9% 11.5% 13.9% 18.4% 18.4% 16.5% 17.0% 17.0%
CS constant currency organic growth yoy, % 83% 29% 9% -53% 42% 64% 8% -8% 7% 4%
Group EBITA pre central costs 39.0 44.2 55.2 46.6 63.1 99.3 128.0 109.0 118.0 124.0
Margin, % 10.3% 11.6% 12.6% 9.3% 11.4% 13.8% 15.4% 13.1% 13.8% 14.1%
CS constant currency organic growth yoy, % 130% 18% 11% -34% 30% 46% 19% -18% 11% 5%
Central Costs (4.9) (5.2) (5.9) (5.3) (6.1) (7.9) (9.2) (9.0) (9.0) (9.0)
Group EBITA 34.1 39.0 49.3 41.3 57.0 91.4 118.8 100.0 109.0 115.0
Margin, % 9.0% 10.2% 11.3% 8.3% 10.3% 12.7% 14.3% 12.0% 12.7% 13.1%
Source: Company data, Credit Suisse estimates

19 September 2013
Fenner (FENR.L) 14
Figure 22: Fenner: Group Income Statement in millions, unless otherwise stated
2006 2007 2008 2009 2010 2011 2012 2013e 2014e 2015e
FY FY FY FY FY FY FY FY FY FY
Revenue 379.0 380.8 437.8 499.4 552.5 718.3 830.6 832.0 858.0 880.0
Change yoy, % 24.8% 0.5% 15.0% 14.1% 10.6% 30.0% 15.6% 0.2% 3.1% 2.6%
EBITDA 42.1 47.6 59.0 55.9 74.7 109.8 139.0 123.0 133.0 140.0
Margin, % 11.1% 12.5% 13.5% 11.2% 13.5% 15.3% 16.7% 14.8% 15.5% 15.9%
EBITA 34.1 39.0 49.3 41.3 57.0 91.4 118.8 100.0 109.0 115.0
Margin, % 9.0% 10.2% 11.3% 8.3% 10.3% 12.7% 14.3% 12.0% 12.7% 13.1%
Income Associates -0.1 0.0 0.0 0.0 0.0 0.0 0.0 0.0 0.0 0.0
Net interest Income / (Expense) (4.3) (4.6) (7.5) (10.2) (10.7) (11.2) (14.9) (15.3) (13.0) (12.0)
CS PBT 29.7 34.4 41.8 31.1 46.3 80.2 103.9 84.7 96.0 103.0
Amortisation of Acquired Intangibles (0.4) (0.6) (2.1) (6.8) (7.7) (8.9) (11.2) (16.0) (17.0) (18.0)
Restructuring Costs (non-recurring) 0.0 0.0 0.0 (17.4) 0.0 0.0 0.0 0.0 0.0 0.0
Exceptional - Financial 0.0 (0.2) (3.4) (1.3) (1.4) (1.7) (4.1) (2.0) (2.0) (2.0)
Exceptional - Profit / (Loss) on Disposal 0.0 0.0 0.0 0.0 0.0 0.0 0.0 0.0 0.0 0.0
Reported PBT 29.3 33.6 36.3 5.6 37.2 69.6 88.6 66.7 77.0 83.0
Income Tax (8.9) (10.3) (12.5) (8.7) (13.8) (23.9) (30.4) (24.0) (27.3) (29.3)
Exceptional - Tax 0.2 0.6 2.1 7.7 3.1 3.7 4.2 2.9 2.9 2.9
Underlying rate, % 30% 30% 30% 28% 30% 30% 29% 28% 28% 28%
Reported Profit After Tax 20.6 23.9 25.9 4.6 26.5 49.4 62.4 45.6 52.6 56.6
Profit / (Loss) Discontinued Operations 0.0 0.0 0.0 0.0 0.0 0.0 0.0 0.0 0.0 0.0
Minority Interest (0.2) (0.2) (0.2) (0.1) (0.2) (2.2) (3.8) (5.0) (5.0) (5.0)
Reported Net Income 20.4 23.7 25.7 4.5 26.3 47.2 58.6 40.6 47.6 51.6
Net income margin, % 5.4% 6.2% 5.9% 0.9% 4.8% 6.6% 7.1% 4.9% 5.6% 5.9%
CS EPS 13.4 15.9 17.5 12.8 17.9 28.1 36.1 28.8 32.9 35.5
CS EPS (Diluted) 13.2 15.8 17.4 12.8 17.8 27.9 35.9 28.7 32.8 35.4
Reported EPS (Diluted) 12.8 14.9 15.4 2.6 14.5 24.3 30.2 20.9 24.5 26.6
DPS, p 6.0 6.2 6.6 6.6 7.2 8.0 10.5 11.3 12.5 13.7
DPS growth yoy, % 3% 6% 0% 9% 11% 31% 8% 10% 10%
Dividend cover (X) 2.2 2.6 2.7 1.9 2.5 3.5 3.4 2.5 2.6 2.6
Diluted ordinary shares in issue (m) 159 159 167 175 181 194 194 194 194 194
Source: Company data, Credit Suisse estimates

19 September 2013
Fenner (FENR.L) 15
Figure 23: Fenner: Group Cashflow Statement in millions, unless otherwise stated
2006 2007 2008 2009 2010 2011 2012 2013e 2014e 2015e
FY FY FY FY FY FY FY FY FY FY
EBITDA 42.1 47.6 59 55.9 74.7 109.8 139 123 133 140
Working Capital Change (2.4) 10.8 (8.2) 16.5 12.6 (11.2) (8.3) 0.2 (9.3) (9.1)
Additional Pension Contribution 0.0 0.0 0.0 0.0 0.0 0.0 0.0 0.0 0.0 0.0
Other (1.5) (5.1) (5.1) (18.9) (4.8) (4.0) (3.6) 0.0 0.0 0.0
Operating Cash Flow 38.2 53.3 45.7 53.5 82.5 94.6 127.1 123.2 123.7 130.9
Net Financing Cost (4.4) (4.3) (6.3) (10.7) (10.7) (11.2) (12.3) (18.3) (16.0) (15.0)
Tax Paid (7.5) (10.2) (6.3) (6.4) (5.0) (14.8) (23.5) (21.1) (24.4) (26.4)
Net Operating Cash Flow 26.3 38.8 33.1 36.4 66.8 68.6 91.3 83.8 83.3 89.5
Net Operating Cash / Operating Profit 78% 101% 70% 106% 135% 83% 85% 100% 91% 92%
Net Capex (18.5) (31.3) (62.9) (32.9) (10.0) (14.0) (26.0) (19.9) (29.9) (29.9)
Free Cash Flow 7.8 7.5 (29.8) 3.5 56.8 54.6 65.3 63.9 53.4 59.6
FCF / Net Income 38% 32% -116% 78% 216% 116% 111% 157% 112% 116%
Acquisitions (0.5) (8.8) (45.9) (37.6) (16.9) (29.9) (34.3) (70.0) (8.2) (8.2)
Disposals 0.0 5.2 4.8 0.1 0.1 0.1 0.0 0.0 0.0 0.0
Dividend Received 0.0 0.0 0.0 0.0 0.0 0.0 0.0 0.0 0.0 0.0
Other (0.5) (0.5) (0.2) (1.0) (0.2) (0.8) (2.3) 0.0 0.0 0.0
Pre Financing Cash Flow 6.8 3.4 (71.1) (35.0) 39.8 24.0 28.7 (6.1) 45.3 51.5
Dividend Paid (8.2) (9.5) (9.9) (11.5) (11.5) (13.8) (15.4) (20.8) (22.6) (16.2)
Equity Financing 0.3 0.7 35.6 0.0 35.2 0.0 0.0 0.0 0.0 0.0
Borrowings Raised / (Repaid) (8.3) 31.9 0.0 0.0 0.0 0.0 0.0 (4.5) 0.0 0.0
Minority Dividend (0.1) (0.1) (0.1) (0.1) (0.1) (0.8) (2.6) (3.6) (3.7) (3.7)
FX Impact 0.0 0.0 (10.9) (21.2) (8.4) (0.3) (4.7) 7.0 0.0 0.0
Other 10.9 (29.6) (4.9) 0.0 0.0 (0.5) (1.9) 0.0 0.0 0.0
Net Cash / (Debt) Year Start (34.5) (33.1) (36.3) (97.6) (165.4) (110.4) (101.8) (97.7) (125.6) (106.7)
Movement Net Cash / (Debt) 1.4 (3.2) (61.3) (67.8) 55.0 8.6 4.1 (27.9) 18.9 31.6
Net Cash / (Debt) Year End (33.1) (36.3) (97.6) (165.4) (110.4) (101.8) (97.7) (125.6) (106.7) (75.1)
Source: Company data, Credit Suisse estimates

19 September 2013
Fenner (FENR.L) 16
Figure 24: Fenner: Group Balance Sheet in millions, unless otherwise stated
2006 2007 2008 2009 2010 2011 2012 2013e 2014e 2015e
FY FY FY FY FY FY FY FY FY FY
PPE 69 90 159 198 203 208 215 212 218 223
Goodwill 57 56 75 90 95 115 115 115 115 115
Intangible Assets 9 10 42 74 75 87 106 92 77 61
Financial assets / investments 16 13 18 27 32 31 25 18 18 18
Inventories 54 55 75 63 76 103 106 106 109 114
Receivables 59 57 79 73 84 110 109 109 118 122
Payables (41) (45) (61) (44) (63) (91) (81) (81) (83) (84)
Working capital 72 66 92 92 97 122 134 134 143 152
Current Assets 6 5 7 10 10 9 13 13 13 13
Current Liabilities (33) (36) (52) (62) (65) (86) (90) (90) (93) (95)
Non-Current Assets 0 0 0 0 0 0 0 0 0 0
Non-Current Liabilities (12) (12) (19) (25) (33) (50) (44) (44) (44) (44)
Total assets 184 193 323 403 413 435 475 451 449 445
Shareholders' funds 121 142 205 194 255 284 313 274 291 319
Minorities 1 1 1 1 2 18 16 16 16 16
Total Borrowings 75 102 141 200 155 206 206 234 215 184
Cash and equivalents (41) (66) (44) (35) (45) (104) (109) (109) (109) (109)
Net Debt / (Cash) 33 36 98 165 110 102 98 126 107 75
Pension Deficit 29 14 19 42 46 32 48 35 35 35
Total liabilities 184 193 323 403 413 435 475 451 449 445
Source: Company data, Credit Suisse estimates
The author of this report wishes to acknowledge the contribution made by Chandramouli
Muthiah, an employee of CRISIL Global Research and Analytics, a business division of
CRISIL Limited, a third-party provider of research services to Credit Suisse.

19 September 2013
Fenner (FENR.L) 17
Companies Mentioned (Price as of 18-Sep-2013)
ABB (ABBN.VX, SFr21.68) Alfa Laval (ALFA.ST, Skr150.8) Alstom (ALSO.PA, €27.04) Assa Abloy (ASSAb.ST, Skr304.6) Atlas Copco (ATCOa.ST, Skr188.6) Bodycote Plc (BOY.L, 667.5p) Caterpillar Inc. (CAT.N, $87.07) Electrolux (ELUXb.ST, Skr177.5) Fenner (FENR.L, 399.9p, OUTPERFORM, TP 490.0p) GKN (GKN.L, 348.9p) Geberit (GEBN.VX, SFr242.5) Halma (HLMA.L, 566.0p) IMI Plc (IMI.L, 1451.0p) Komatsu (6301.T, ¥2,553) Kone Corporation (KNEBV.HE, €66.15) Laird (LRD.L, 233.6p) Legrand SA (LEGD.PA, €42.15) Melrose (MRON.L, 302.8p) Metso (MEO1V.HE, €30.98) Morgan Advanced Materials (MGAMM.L, 307.9p) Nexans (NEXS.PA, €46.7) Philips (PHG.AS, €24.11) Prysmian (PRY.MI, €17.86) Renishaw (RSW.L, 1880.0p) Rio Tinto (RIO.AX, A$61.7) Rotork plc (ROR.L, 2793.0p) SKF (SKFb.ST, Skr180.8) Sandvik (SAND.ST, Skr93.35) Schindler-Holding AG (SCHP.VX, SFr137.4) Schneider (SCHN.PA, €65.99) Senior (SNR.L, 273.3p) Siemens (SIEGn.DE, €89.7) Smiths Group (SMIN.L, 1412.0p) Spectris (SXS.L, 2234.0p) Spirax Sarco (SPX.L, 3000.0p) Terex Corporation (TEX.N, $32.94) Vesuvius (VSVS.L, 457.1p) Weir Group (WEIR.L, 2361.0p)
Disclosure Appendix
Important Global Disclosures
Jonathan Hurn, CFA, Max Yates, Andre Kukhnin CFA and Simon Toennessen each certify, with respect to the companies or securities that the individual analyzes, that (1) the views expressed in this report accurately reflect his or her personal views about all of the subject companies and securities and (2) no part of his or her compensation was, is or will be directly or indirectly related to the specific recommendations or views expressed in this report.

19 September 2013
Fenner (FENR.L) 18
3-Year Price and Rating History for Fenner (FENR.L)
FENR.L Closing Price Target Price
Date (p) (p) Rating
11-Nov-10 281.30 320.00 O
13-Dec-10 337.60 420.00
19-Jul-11 409.00 500.00
11-Aug-11 330.00 395.00
11-Nov-11 367.90 415.00
08-Dec-11 382.90 470.00
12-Jan-12 446.30 500.00
16-Mar-12 473.80 540.00
03-May-12 434.20 480.00 N
13-Jul-12 340.00 370.00
07-Nov-12 359.50 345.00
17-Jan-13 394.70 400.00
15-Mar-13 420.20 415.00
24-Apr-13 379.00 390.00
03-Jul-13 306.20 340.00
11-Sep-13 390.10 390.00
* Asterisk signifies initiation or assumption of coverage.
O U T PERFO RM
N EU T RA L
The analyst(s) responsible for preparing this research report received Compensation that is based upon various factors including Credit Suisse's total revenues, a portion of which are generated by Credit Suisse's investment banking activities
As of December 10, 2012 Analysts’ stock rating are defined as follows:
Outperform (O) : The stock’s total return is expected to outperform the relevant benchmark*over the next 12 months.
Neutral (N) : The stock’s total return is expected to be in line with the relevant benchmark* over the next 12 months.
Underperform (U) : The stock’s total return is expected to underperform the relevant benchmark* over the next 12 months.
*Relevant benchmark by region: As of 10th December 2012, Japanese ratings are based on a stock’s total return relative to the analyst's coverage universe which consists of all companies covered by the analyst within the relevant sector, with Outperforms representing the most attractive, Neutrals the less attractive, and Underperforms the least attractive investment opportunities. As of 2nd October 2012, U.S. and Canadian as well as European ra tings are based on a stock’s total return relative to the analyst's coverage universe which consists of all companies covered by the analyst within the relevant sector, with Outperforms representing the most attractive, Neutrals the less attractive, and Underperforms the least attractive investment opportunities. For Latin American and non-Japan Asia stocks, ratings are based on a stock’s total return relative to the average total return of the relevant country or regional benchmark; Australia, New Zealand are, and prior to 2nd October 2012 U.S. and Canadian ratings were based on (1) a stock’s absolute total return potential to its current share price and (2) the relative attractiveness of a stock’s total return potential within an analyst’s coverage universe. For Australian and New Zealand stocks, 12-month rolling yield is incorporated in the absolute total return calculation and a 15% and a 7.5% threshold replace the 10-15% level in the Outperform and Underperform stock rating definitions, respectively. The 15% and 7.5% thresholds replace the +10-15% and -10-15% levels in the Neutral stock rating definition, respectively. Prior to 10th December 2012, Japanese ratings were based on a stock’s total return relative to the average total return of the relevant country or regional benchmark.
Restricted (R) : In certain circumstances, Credit Suisse policy and/or applicable law and regulations preclude certain types of communications, including an investment recommendation, during the course of Credit Suisse's engagement in an investment banking transaction and in certain other circumstances.
Volatility Indicator [V] : A stock is defined as volatile if the stock price has moved up or down by 20% or more in a month in at least 8 of the past 24 months or the analyst expects significant volatility going forward.
Analysts’ sector weightings are distinct from analysts’ stock ratings and are based on the analyst’s expectations for the fundamentals and/or valuation of the sector* relative to the group’s historic fundamentals and/or valuation:
Overweight : The analyst’s expectation for the sector’s fundamentals and/or valuation is favorable over the next 12 months.
Market Weight : The analyst’s expectation for the sector’s fundamentals and/or valuation is neutral over the next 12 months.
Underweight : The analyst’s expectation for the sector’s fundamentals and/or valuation is cautious over the next 12 months.
*An analyst’s coverage sector consists of all companies covered by the analyst within the relevant sector. An analyst may cover multiple sectors.

19 September 2013
Fenner (FENR.L) 19
Credit Suisse's distribution of stock ratings (and banking clients) is:
Global Ratings Distribution
Rating Versus universe (%) Of which banking clients (%)
Outperform/Buy* 42% (55% banking clients)
Neutral/Hold* 40% (48% banking clients)
Underperform/Sell* 15% (40% banking clients)
Restricted 3%
*For purposes of the NYSE and NASD ratings distribution disclosure requirements, our stock ratings of Outperform, Neutral, an d Underperform most closely correspond to Buy, Hold, and Sell, respectively; however, the meanings are not the same, as our stock ratings are determined on a relative basis. (Please refer to definitions above.) An investor's decision to buy or sell a security should be based on investment objectives, current holdin gs, and other individual factors.
Credit Suisse’s policy is to update research reports as it deems appropriate, based on developments with the subject company, the sector or the market that may have a material impact on the research views or opinions stated herein.
Credit Suisse's policy is only to publish investment research that is impartial, independent, clear, fair and not misleading. For more detail please refer to Credit Suisse's Policies for Managing Conflicts of Interest in connection with Investment Research: http://www.csfb.com/research and analytics/disclaimer/managing_conflicts_disclaimer.html
Credit Suisse does not provide any tax advice. Any statement herein regarding any US federal tax is not intended or written to be used, and cannot be used, by any taxpayer for the purposes of avoiding any penalties.
Price Target: (12 months) for Fenner (FENR.L)
Method: Our target price for Fenner is 490p. This is based on our updated forecasts and an EVA-DCF valuation which assumes a ROIC for Fenner of 11% and inline with the average of our forecast period 2010A-2015E.
Risk: These include macro risks that will result in our assumed level of organic revenue growth not being achieved - examples include reduced global mining original equipment demand and reduced oil and gas activity impacting Fenners Seals business . This will have a knock on effect on the level of operational gearing and on EBITDA margin performance.
Please refer to the firm's disclosure website at https://rave.credit-suisse.com/disclosures for the definitions of abbreviations typically used in the target price method and risk sections.
See the Companies Mentioned section for full company names
The subject company (ABBN.VX, ALFA.ST, ASSAb.ST, CAT.N, HLMA.L, IMI.L, MEO1V.HE, MRON.L, NEXS.PA, PHG.AS, PRY.MI, SAND.ST, SCHN.PA, SIEGn.DE, WEIR.L, RIO.AX, TEX.N) currently is, or was during the 12-month period preceding the date of distribution of this report, a client of Credit Suisse.
Credit Suisse provided investment banking services to the subject company (ABBN.VX, ASSAb.ST, PHG.AS, SAND.ST, SIEGn.DE, RIO.AX, TEX.N) within the past 12 months.
Credit Suisse provided non-investment banking services to the subject company (ABBN.VX) within the past 12 months
Credit Suisse has managed or co-managed a public offering of securities for the subject company (SIEGn.DE, RIO.AX, TEX.N) within the past 12 months.
Credit Suisse has received investment banking related compensation from the subject company (ABBN.VX, ASSAb.ST, PHG.AS, SAND.ST, SIEGn.DE, RIO.AX, TEX.N) within the past 12 months
Credit Suisse expects to receive or intends to seek investment banking related compensation from the subject company (ABBN.VX, ALFA.ST, ASSAb.ST, CAT.N, GKN.L, HLMA.L, IMI.L, MEO1V.HE, MRON.L, NEXS.PA, PHG.AS, PRY.MI, SAND.ST, SCHN.PA, SIEGn.DE, WEIR.L, RIO.AX, 6301.T, TEX.N) within the next 3 months.
Credit Suisse has received compensation for products and services other than investment banking services from the subject company (ABBN.VX) within the past 12 months
As of the date of this report, Credit Suisse makes a market in the following subject companies (CAT.N, TEX.N).
As of the end of the preceding month, Credit Suisse beneficially own 1% or more of a class of common equity securities of (ABBN.VX, GKN.L, PHG.AS, ROR.L, SIEGn.DE, WEIR.L, RIO.AX).
Credit Suisse has a material conflict of interest with the subject company (RIO.AX) . Credit Suisse is acting as advisor to Imerys on the proposed acquisition of the Luzenac Talc Group from Rio Tinto.
Important Regional Disclosures
Singapore recipients should contact Credit Suisse AG, Singapore Branch for any matters arising from this research report.

19 September 2013
Fenner (FENR.L) 20
The analyst(s) involved in the preparation of this report have not visited the material operations of the subject company (FENR.L, ABBN.VX, ALFA.ST, ALSO.PA, ASSAb.ST, ATCOa.ST, BOY.L, CAT.N, ELUXb.ST, GEBN.VX, GKN.L, HLMA.L, IMI.L, KNEBV.HE, LEGD.PA, LRD.L, MEO1V.HE, MGAMM.L, MRON.L, NEXS.PA, PHG.AS, PRY.MI, ROR.L, RSW.L, SAND.ST, SCHN.PA, SCHP.VX, SIEGn.DE, SKFb.ST, SMIN.L, SNR.L, SPX.L, SXS.L, VSVS.L, WEIR.L, RIO.AX, 6301.T, TEX.N) within the past 12 months
Restrictions on certain Canadian securities are indicated by the following abbreviations: NVS--Non-Voting shares; RVS--Restricted Voting Shares; SVS--Subordinate Voting Shares.
Individuals receiving this report from a Canadian investment dealer that is not affiliated with Credit Suisse should be advised that this report may not contain regulatory disclosures the non-affiliated Canadian investment dealer would be required to make if this were its own report.
For Credit Suisse Securities (Canada), Inc.'s policies and procedures regarding the dissemination of equity research, please visit http://www.csfb.com/legal_terms/canada_research_policy.shtml.
Credit Suisse Securities (Europe) Limited (Credit Suisse) acts as broker to (FENR.L, BOY.L, HLMA.L, SMIN.L).
The following disclosed European company/ies have estimates that comply with IFRS: (ABBN.VX, ALFA.ST, ALSO.PA, ASSAb.ST, ATCOa.ST, BOY.L, ELUXb.ST, GKN.L, HLMA.L, IMI.L, LEGD.PA, MEO1V.HE, MGAMM.L, PHG.AS, SAND.ST, SCHN.PA, SIEGn.DE, SKFb.ST, SMIN.L, SPX.L, WEIR.L, RIO.AX).
As of the date of this report, Credit Suisse acts as a market maker or liquidity provider in the equities securities that are the subject of this report.
Principal is not guaranteed in the case of equities because equity prices are variable.
Commission is the commission rate or the amount agreed with a customer when setting up an account or at any time after that.
To the extent this is a report authored in whole or in part by a non-U.S. analyst and is made available in the U.S., the following are important disclosures regarding any non-U.S. analyst contributors: The non-U.S. research analysts listed below (if any) are not registered/qualified as research analysts with FINRA. The non-U.S. research analysts listed below may not be associated persons of CSSU and therefore may not be subject to the NASD Rule 2711 and NYSE Rule 472 restrictions on communications with a subject company, public appearances and trading securities held by a research analyst account.
Credit Suisse Securities (Europe) Limited...................................... Jonathan Hurn, CFA ; Max Yates ; Andre Kukhnin CFA ; Simon Toennessen
Important Credit Suisse HOLT Disclosures
With respect to the analysis in this report based on the Credit Suisse HOLT methodology, Credit Suisse certifies that (1) the views expressed in this report accurately reflect the Credit Suisse HOLT methodology and (2) no part of the Firm’s compensation was, is, or will be directly related to the specific views disclosed in this report.
The Credit Suisse HOLT methodology does not assign ratings to a security. It is an analytical tool that involves use of a set of proprietary quantitative algorithms and warranted value calculations, collectively called the Credit Suisse HOLT valuation model, that are consistently applied to all the companies included in its database. Third-party data (including consensus earnings estimates) are systematically translated into a number of default algorithms available in the Credit Suisse HOLT valuation model. The source financial statement, pricing, and earnings data provided by outside data vendors are subject to quality control and may also be adjusted to more closely measure the underlying economics of firm performance. The adjustments provide consistency when analyzing a single company across time, or analyzing multiple companies across industries or national borders. The default scenario that is produced by the Credit Suisse HOLT valuation model establishes the baseline valuation for a security, and a user then may adjust the default variables to produce alternative scenarios, any of which could occur.
Additional information about the Credit Suisse HOLT methodology is available on request.
The Credit Suisse HOLT methodology does not assign a price target to a security. The default scenario that is produced by the Credit Suisse HOLT valuation model establishes a warranted price for a security, and as the third-party data are updated, the warranted price may also change. The default variable may also be adjusted to produce alternative warranted prices, any of which could occur.
CFROI®, HOLT, HOLTfolio, ValueSearch, AggreGator, Signal Flag and “Powered by HOLT” are trademarks or service marks or registered trademarks or registered service marks of Credit Suisse or its affiliates in the United States and other countries. HOLT is a corporate performance and valuation advisory service of Credit Suisse.
For Credit Suisse disclosure information on other companies mentioned in this report, please visit the website at https://rave.credit-suisse.com/disclosures or call +1 (877) 291-2683.

19 September 2013
Fenner (FENR.L) 21
References in this report to Credit Suisse include all of the subsidiaries and affiliates of Credit Suisse operating under its investment banking division. For more information on our structure, please use the following link: https://www.credit-suisse.com/who_we_are/en/This report may contain material that is not directed to, or intended for distribution to or use by, any person or entity who is a citizen or resident of or located in any locality, state, country or other jurisdiction where such distribution, publication, availability or use would be contrary to law or regulation or which would subject Credit Suisse AG or its affiliates ("CS") to any registration or licensing requirement within such jurisdiction. All material presented in this report, unless specifically indicated otherwise, is under copyright to CS. None of the material, nor its content, nor any copy of it, may be altered in any way, transmitted to, copied or distributed to any other party, without the prior express written permission of CS. All trademarks, service marks and logos used in this report are trademarks or service marks or registered trademarks or service marks of CS or its affiliates. The information, tools and material presented in this report are provided to you for information purposes only and are not to be used or considered as an offer or the solicitation of an offer to sell or to buy or subscribe for securities or other financial instruments. CS may not have taken any steps to ensure that the securities referred to in this report are suitable for any particular investor. CS will not treat recipients of this report as its customers by virtue of their receiving this report. The investments and services contained or referred to in this report may not be suitable for you and it is recommended that you consult an independent investment advisor if you are in doubt about such investments or investment services. Nothing in this report constitutes investment, legal, accounting or tax advice, or a representation that any investment or strategy is suitable or appropriate to your individual circumstances, or otherwise constitutes a personal recommendation to you. CS does not advise on the tax consequences of investments and you are advised to contact an independent tax adviser. Please note in particular that the bases and levels of taxation may change. Information and opinions presented in this report have been obtained or derived from sources believed by CS to be reliable, but CS makes no representation as to their accuracy or completeness. CS accepts no liability for loss arising from the use of the material presented in this report, except that this exclusion of liability does not apply to the extent that such liability arises under specific statutes or regulations applicable to CS. This report is not to be relied upon in substitution for the exercise of independent judgment. CS may have issued, and may in the future issue, other communications that are inconsistent with, and reach different conclusions from, the information presented in this report. Those communications reflect the different assumptions, views and analytical methods of the analysts who prepared them and CS is under no obligation to ensure that such other communications are brought to the attention of any recipient of this report. CS may, to the extent permitted by law, participate or invest in financing transactions with the issuer(s) of the securities referred to in this report, perform services for or solicit business from such issuers, and/or have a position or holding, or other material interest, or effect transactions, in such securities or options thereon, or other investments related thereto. In addition, it may make markets in the securities mentioned in the material presented in this report. CS may have, within the last three years, served as manager or co-manager of a public offering of securities for, or currently may make a primary market in issues of, any or all of the entities mentioned in this report or may be providing, or have provided within the previous 12 months, significant advice or investment services in relation to the investment concerned or a related investment. Additional information is, subject to duties of confidentiality, available on request. Some investments referred to in this report will be offered solely by a single entity and in the case of some investments solely by CS, or an associate of CS or CS may be the only market maker in such investments. Past performance should not be taken as an indication or guarantee of future performance, and no representation or warranty, express or implied, is made regarding future performance. Information, opinions and estimates contained in this report reflect a judgment at its original date of publication by CS and are subject to change without notice. The price, value of and income from any of the securities or financial instruments mentioned in this report can fall as well as rise. The value of securities and financial instruments is subject to exchange rate fluctuation that may have a positive or adverse effect on the price or income of such securities or financial instruments. Investors in securities such as ADR's, the values of which are influenced by currency volatility, effectively assume this risk. Structured securities are complex instruments, typically involve a high degree of risk and are intended for sale only to sophisticated investors who are capable of understanding and assuming the risks involved. The market value of any structured security may be affected by changes in economic, financial and political factors (including, but not limited to, spot and forward interest and exchange rates), time to maturity, market conditions and volatility, and the credit quality of any issuer or reference issuer. Any investor interested in purchasing a structured product should conduct their own investigation and analysis of the product and consult with their own professional advisers as to the risks involved in making such a purchase. Some investments discussed in this report may have a high level of volatility. High volatility investments may experience sudden and large falls in their value causing losses when that investment is realised. Those losses may equal your original investment. Indeed, in the case of some investments the potential losses may exceed the amount of initial investment and, in such circumstances, you may be required to pay more money to support those losses. Income yields from investments may fluctuate and, in consequence, initial capital paid to make the investment may be used as part of that income yield. Some investments may not be readily realisable and it may be difficult to sell or realise those investments, similarly it may prove difficult for you to obtain reliable information about the value, or risks, to which such an investment is exposed. This report may provide the addresses of, or contain hyperlinks to, websites. Except to the extent to which the report refers to website material of CS, CS has not reviewed any such site and takes no responsibility for the content contained therein. Such address or hyperlink (including addresses or hyperlinks to CS's own website material) is provided solely for your convenience and information and the content of any such website does not in any way form part of this document. Accessing such website or following such link through this report or CS's website shall be at your own risk. This report is issued and distributed in Europe (except Switzerland) by Credit Suisse Securities (Europe) Limited, One Cabot Square, London E14 4QJ, England, which is authorised by the Prudential Regulation Authority ("PRA") and regulated by the Financial Conduct Authority ("FCA") and the PRA. This report is being distributed in Germany by Credit Suisse Securities (Europe) Limited Niederlassung Frankfurt am Main regulated by the Bundesanstalt fuer Finanzdienstleistungsaufsicht ("BaFin"). This report is being distributed in the United States and Canada by Credit Suisse Securities (USA) LLC; in Switzerland by Credit Suisse AG; in Brazil by Banco de Investimentos Credit Suisse (Brasil) S.A or its affiliates; in Mexico by Banco Credit Suisse (México), S.A. (transactions related to the securities mentioned in this report will only be effected in compliance with applicable regulation); in Japan by Credit Suisse Securities (Japan) Limited, Financial Instruments Firm, Director-General of Kanto Local Finance Bureau (Kinsho) No. 66, a member of Japan Securities Dealers Association, The Financial Futures Association of Japan, Japan Investment Advisers Association, Type II Financial Instruments Firms Association; elsewhere in Asia/ Pacific by whichever of the following is the appropriately authorised entity in the relevant jurisdiction: Credit Suisse (Hong Kong) Limited, Credit Suisse Equities (Australia) Limited, Credit Suisse Securities (Thailand) Limited, having registered address at 990 Abdulrahim Place, 27 Floor, Unit 2701, Rama IV Road, Silom, Bangrak, Bangkok 10500, Thailand, Tel. +66 2614 6000, Credit Suisse Securities (Malaysia) Sdn Bhd, Credit Suisse AG, Singapore Branch, Credit Suisse Securities (India) Private Limited regulated by the Securities and Exchange Board of India (registration Nos. INB230970637; INF230970637; INB010970631; INF010970631), having registered address at 9th Floor, Ceejay House, Dr.A.B. Road, Worli, Mumbai - 18, India, T- +91-22 6777 3777, Credit Suisse Securities (Europe) Limited, Seoul Branch, Credit Suisse AG, Taipei Securities Branch, PT Credit Suisse Securities Indonesia, Credit Suisse Securities (Philippines ) Inc., and elsewhere in the world by the relevant authorised affiliate of the above. Research on Taiwanese securities produced by Credit Suisse AG, Taipei Securities Branch has been prepared by a registered Senior Business Person. Research provided to residents of Malaysia is authorised by the Head of Research for Credit Suisse Securities (Malaysia) Sdn Bhd, to whom they should direct any queries on +603 2723 2020. This report has been prepared and issued for distribution in Singapore to institutional investors, accredited investors and expert investors (each as defined under the Financial Advisers Regulations) only, and is also distributed by Credit Suisse AG, Singapore branch to overseas investors (as defined under the Financial Advisers Regulations). By virtue of your status as an institutional investor, accredited investor, expert investor or overseas investor, Credit Suisse AG, Singapore branch is exempted from complying with certain compliance requirements under the Financial Advisers Act, Chapter 110 of Singapore (the "FAA"), the Financial Advisers Regulations and the relevant Notices and Guidelines issued thereunder, in respect of any financial advisory service which Credit Suisse AG, Singapore branch may provide to you. This research may not conform to Canadian disclosure requirements. In jurisdictions where CS is not already registered or licensed to trade in securities, transactions will only be effected in accordance with applicable securities legislation, which will vary from jurisdiction to jurisdiction and may require that the trade be made in accordance with applicable exemptions from registration or licensing requirements. Non-U.S. customers wishing to effect a transaction should contact a CS entity in their local jurisdiction unless governing law permits otherwise. U.S. customers wishing to effect a transaction should do so only by contacting a representative at Credit Suisse Securities (USA) LLC in the U.S. Please note that this research was originally prepared and issued by CS for distribution to their market professional and institutional investor customers. Recipients who are not market professional or institutional investor customers of CS should seek the advice of their independent financial advisor prior to taking any investment decision based on this report or for any necessary explanation of its contents. This research may relate to investments or services of a person outside of the UK or to other matters which are not authorised by the PRA and regulated by the FCA and the PRA or in respect of which the protections of the PRA and FCA for private customers and/or the UK compensation scheme may not be available, and further details as to where this may be the case are available upon request in respect of this report. CS may provide various services to US municipal entities or obligated persons ("municipalities"), including suggesting individual transactions or trades and entering into such transactions. Any services CS provides to municipalities are not viewed as "advice" within the meaning of Section 975 of the Dodd-Frank Wall Street Reform and Consumer Protection Act. CS is providing any such services and related information solely on an arm's length basis and not as an advisor or fiduciary to the municipality. In connection with the provision of the any such services, there is no agreement, direct or indirect, between any municipality (including the officials, management, employees or agents thereof) and CS for CS to provide advice to the municipality. Municipalities should consult with their financial, accounting and legal advisors regarding any such services provided by CS. In addition, CS is not acting for direct or indirect compensation to solicit the municipality on behalf of an unaffiliated broker, dealer, municipal securities dealer, municipal advisor, or investment adviser for the purpose of obtaining or retaining an engagement by the municipality for or in connection with Municipal Financial Products, the issuance of municipal securities, or of an investment adviser to provide investment advisory services to or on behalf of the municipality. If this report is being distributed by a financial institution other than Credit Suisse AG, or its affiliates, that financial institution is solely responsible for distribution. Clients of that institution should contact that institution to effect a transaction in the securities mentioned in this report or require further information. This report does not constitute investment advice by Credit Suisse to the clients of the distributing financial institution, and neither Credit Suisse AG, its affiliates, and their respective officers, directors and employees accept any liability whatsoever for any direct or consequential loss arising from their use of this report or its content. Principal is not guaranteed. Commission is the commission rate or the amount agreed with a customer when setting up an account or at any time after that.
Copyright © 2013 CREDIT SUISSE AG and/or its affiliates. All rights reserved.
Investment principal on bonds can be eroded depending on sale price or market price. In addition, there are bonds on which investment principal can be eroded due to changes in redemption amounts. Care is required when investing in such instruments.
When you purchase non-listed Japanese fixed income securities (Japanese government bonds, Japanese municipal bonds, Japanese government guaranteed bonds, Japanese corporate bonds) from CS as a seller, you will be requested to pay the purchase price only.
FennerFinal200913.doc