Femtosecond wave packet and chemical reaction dynamics … Scherer... · Femtosecond wave packet...
17
Femtosecond wave packet and chemical reaction dynamics of iodine in solution: Tunable probe study of motion along the reaction coordinate Norbert F. Scherer, David M. Jonas, and Graham R. Fleming Citation: The Journal of Chemical Physics 99, 153 (1993); doi: 10.1063/1.465795 View online: http://dx.doi.org/10.1063/1.465795 View Table of Contents: http://scitation.aip.org/content/aip/journal/jcp/99/1?ver=pdfcov Published by the AIP Publishing This article is copyrighted as indicated in the abstract. Reuse of AIP content is subject to the terms at: http://scitation.aip.org/termsconditions. Downloaded to IP: 128.32.208.2 On: Wed, 13 Nov 2013 23:40:11
Transcript of Femtosecond wave packet and chemical reaction dynamics … Scherer... · Femtosecond wave packet...

Femtosecond wave packet and chemical reaction dynamics of iodine in solution:Tunable probe study of motion along the reaction coordinateNorbert F. Scherer, David M. Jonas, and Graham R. Fleming Citation: The Journal of Chemical Physics 99, 153 (1993); doi: 10.1063/1.465795 View online: http://dx.doi.org/10.1063/1.465795 View Table of Contents: http://scitation.aip.org/content/aip/journal/jcp/99/1?ver=pdfcov Published by the AIP Publishing
This article is copyrighted as indicated in the abstract. Reuse of AIP content is subject to the terms at: http://scitation.aip.org/termsconditions. Downloaded to IP:
128.32.208.2 On: Wed, 13 Nov 2013 23:40:11
Femtosecond wave packet and chemical reaction dynamics of iodine in solution: Tunable probe study of motion along the reaction coordinate
Norbert F. Scherer,a) David M. Jonas, and Graham R. Fleming Department of Chemistry and the James Franck Institute, The University of Chicago, Chicago, Illinois 60637
(Received 18 January 1993; accepted 15 March 1993)
One- and two-color time-domain probing of the resonant dichroic response of iodine in n-hexane following femtosecond B-X excitation at 580 nm is described. The detected signals contain both ground and excited state vibrational coherence contributions to the third-order polarization. The dichroic response can be separated into positive and negative amplitude contributions: B-X absorption and stimulated emission are positive but absorption from the B-state can yield either positive or negative signals depending on the direction of the transition moment. Wave packet motion on both the ground and excited states of iodine is studied with a frequency tunable femtosecond probe. It is shown that the positive signals can be interpreted as B-X dichroic response using the classical Franck principle. The classical Franck principle also provides information about the potential probed in absorption from the B state. From the probe wavelength dependent delay in the signal appearance, it is concluded that the absorptive signal for blue probe wavelengths arises from a repulsive state reached by solvent-induced predissociation of the B state. Dephasing of B state vibrational coherence results from this solvent-induced predissociation of iodine. We discuss the evolving reaction in terms of possible dissociative potential energy curves al geIl) and a'O; (3~-). The time evolution of the bluest probe dichroism signals is representative of continuing atom separation; the experiments have not yet probed large enough internuclear separations to evidence a buildup of dissociated product or momentum reversal, i.e., caging.
I. INTRODUCTION
Understanding how a reaction proceeds from reactants to products is a central problem in chemical dynamics. In the isolated gas-phase environment this understanding may be largely obtained through measurements performed on the asymptotic reactants and products. In condensed media the ubiquitous presence and influence of the host or bath often limits the information obtained from asymptotic measurements to product yield and reaction energetics; details of the vibronic dynamics in the vicinity of the transition state are obscured. It is therefore desirable to directly probe the chemical process during the course of reaction in condensed phases.
The utility of direct rate measurements in the time domain has long been appreciated. 1 Femtosecond measurements have also provided spectroscopic information about vibrational motion in condensed matter.2-4 Femtosecond nonlinear measurements may be Fourier transformed to uncover "sub-linewidth" vibrational dynamics of molecules in solution provided that vibrational coherence persists and that the linewidths are inhomogeneously broadened.3•
5 Vibrational dynamics in solution-phase chemical reactions are expected to be similarly accessible to femtosecond nonlinear spectroscopy.6.7
The last few years have witnessed femtosecond time scale studies of chemical reactions. Zewail and co-workers have investigated the temporal evolution of directly disso-
')Present address: Department of Chemistry. University of Pennsylvania, Philadelphia, Pennsylvania 19104.
ciative, curve crossing, and bimolecular gas phase reactions,8 as well as the B-state iodine predissociation in dense Argon gas.9 In solution, optical-pump/ir-probe techniques have been developed by Hochstrasser and co-workers 10 and applied to the study of CO dissociation and rebinding in heme proteins. Shank and Mathies and co-workers!! have investigated the initial isomerization step in rhodopsins. Ruhman and co-workers!2 have shown clear evidence for persistence of vibrational coherence in the Ii reaction product of 13 photodissociation. Coupling of the iodate anion to the initial (t=0) polar solvent structure may have a significant influence on the 13 dissociation, even dictating which bond will be broken. Lineberger and co-workers have recently reported coherent Ii vibrational motion above the dissociation limit in Ii (C02) n clusters. 13 In contrast to the aforementioned studies which examine exclusively solute dynamics, relaxation of the solute-solvent system free energy can be probed through time-dependent Stokes shift of dipolar solute emission on the time scale of solvent reorientation!4.!5 and libration. 16
Despite these and other experimental efforts, our understanding of liquid-phase photoinduced reactions at times intermediate between reactants and products is still limited. For example, the proper statistical description of solvent fluctuation coupling to the optical transition dipole operator is an issue of current controversy.17-21 Furthermore, reaction dynamics in solution occur in accordance with the potential of mean force;22.23 gas-phase potentials are inadequate for describing solvent mediated nonadiabatic processes or rapid dissipation of chromophore kinetic energy into the solvent. It is therefore desirable to examine
J. Chern. Phys. 99 (1). 1 July 1993 0021-9606/93/99(1 )/153/ 16/$6.00 © 1993 American Institute of Physics 153 This article is copyrighted as indicated in the abstract. Reuse of AIP content is subject to the terms at: http://scitation.aip.org/termsconditions. Downloaded to IP:
128.32.208.2 On: Wed, 13 Nov 2013 23:40:11

154 Scherer, Jonas, and Fleming: Solvent induced predissociation of iodine
a simple photochemical reaction with a small number of chromophore degrees of freedom. In an effort to probe the actual process of solution-phase curve crossing and the evolving reaction, we have chosen to study molecular iodine dissolved in n hexane.24
The photoinitiation of iodine dissociation and recombination in solution has been considered a prototype for the solvent "cage effect" since the work of Rabinovitch and Franck.25 Systematic studies of geminate recombination were begun by Noyes26 and first extended to picosecond time resolution by Eisenthal and co-workers.27 Subsequent picosecond studies have focused on the time scale for geminate recombination and X state vibrational relaxation.28-31 The excellent review by Harris et af. summarizes the relevant time scales and relaxation dynamics.32 Incompletely resolved issues in the photoinitiated dynamics of iodine in gas phase,33 solution,34 and solid35 environments are the origin of the coupling between electronic states and the shape of potential energy surfaces involved in mediuminduced predissociation. These curve-crossing and dissociation steps must occur prior to geminate recombination and the appearance of molecular iodine in the bound levels of the lower energy A' and X states. From the similar ultraviolet transient absorption behavior following B-state and above-dissociation A-state excitation, Smith and Harris36 concluded that highly vibrationally excited X or A" state products form in 2 ps or less. This sets an upper limit for the dissociation and geminate recombination dynamics. From their inability to detect B-state vibrational bands by transient hole burning, Berg and co-workers37 estimated that the excited state relaxation must occur in less than 1 ps for 12 in hexane.
We have shown6,7 that separate measurements of the
real and imaginary time dependent response functions5 facilitate the study of weakly absorbing solutes at low concentration (e.g., 5 mM 12 in hexane, €:::;200 t7mol cm).38 In iodine, the electronic state origin of the vibrational quantum beats observed in the third-order polarization response is readily apparent, in contrast to the beats observed for large molecules in solution, which are not readily identified.2,3 The one-color transient dichroism of iodine in hexane solution exhibits pronounced consinusoidal oscillations reflecting ground state (211 cm -I) and excited state (110 cm -I) vibrational coherence. The 211 cm - 1 ground state frequency component observed in these pump-probe studies agrees with cw resonance Raman studies.39 From a third-order polarization treatment of a two-electronic-state four-level system, these oscillations are superposed on an exponential decay due to popUlation relaxation. The excited state coherence and population contributions to the dichroism were found to relax with approximately equal, 200 fs, time constants. 6 The solution-phase B-state wave packet frequency is similar to that observed in the gas phase, but the long persistence of vibrational coherence reported by Zewail and co-workers for gas-phase iodine40 is not obtained in solution.6,7,24
In this paper we present two-color pump-probe transient dichroism measurements of the dynamics of iodine in hexane solution.41 In these experiments, the 30 fs duration
25000
20000 B (excited state)
.... I
~ 15000 a (dissociative state)
~ 10000 L QJ C QJ 5000
X (ground state)
0 2 3 4
(a) R (Angstroms)
25000
~ 20000 B (excited state)
.... I
~ 15000 a (dissociative state)
~ 10000 L QJ C QJ 5000
X (ground state)
0 2 3 4
(b) R (Angstroms)
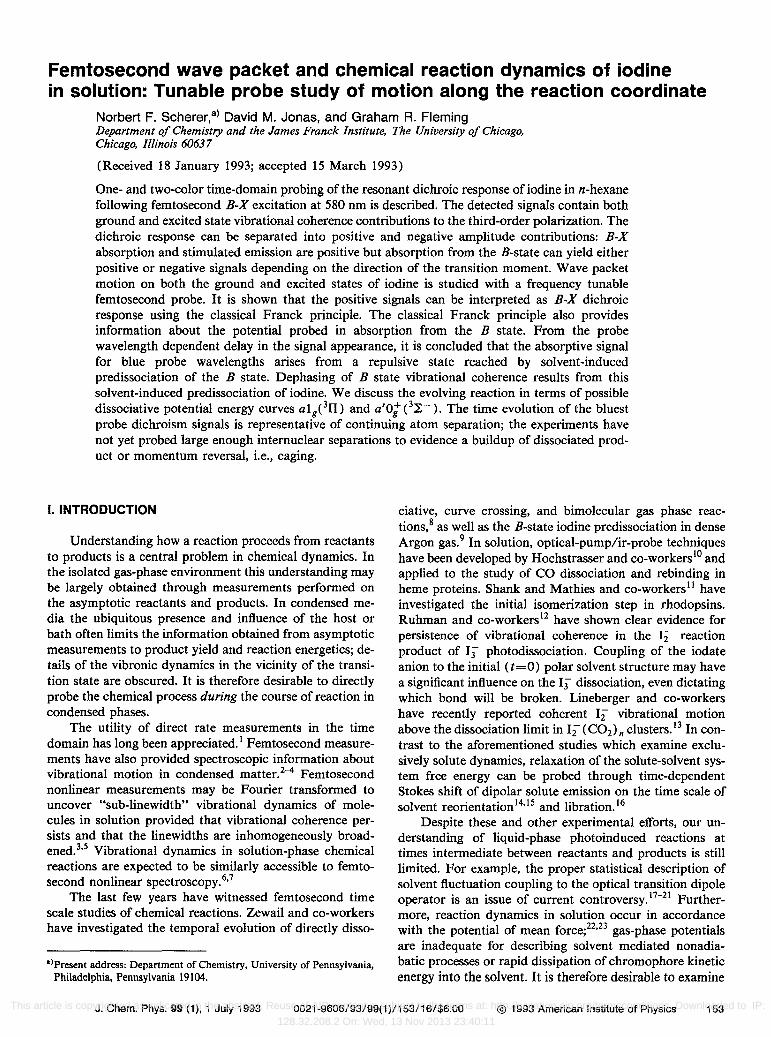
FIG. 1. Illustration of coherent wave packet preparation on the ground (X) and excited (B) states of iodine by the pump pulse. The initial superposition is located near the outer classical turning point of the X state for these levels [Fig. I(a)]. The excited state wave packet is initially located near the inner classical turning point of the B state and is composed of, roughly v'=lS-19, as diagrammed in Fig. l(b). The dissociative (a) state is also shown. (Level spacings have been exaggerated for clarity.)
pump pulse is maintained at 580 nm center wavelength for seven probe pulse center wavelengths ranging from 636 to 460 nm. The multiplicity of potential energy curves with the correct electronic symmetry for optical absorption from the B-state facilitate probing the wave packet flux along the reaction coordinate. In general, two-color pumpprobe measurements allow probing molecular dynamics outside the Franck-Condon (Fe) region pertinent to pump pulse preparation of the initial wave packet.42,43 The one-color and two-color pump-probe studies sample wave packet motion at different iodine bond lengths. The delay for the appearance of and significantly greater magnitude of the blue probe signals in the two-color experiments indicates they sample iodine molecules which have crossed from the bound B state onto dissociative potential curves,44-48 most probably algC3I1) (Refs. 33 and 48) or a'Oi el:-) (Refs. 47 and 48). A brief account of this work has been reported elsewhere.24
II. THEORETICAL BACKGROUND
Several authors have described pump-probe spectroscopy via a density matrix treatment of the third-order polarization.3,5,37,43 The potential curves and optical pump
J. Chem. Phys., Vol. 99, No.1, 1 July 1993 This article is copyrighted as indicated in the abstract. Reuse of AIP content is subject to the terms at: http://scitation.aip.org/termsconditions. Downloaded to IP:
128.32.208.2 On: Wed, 13 Nov 2013 23:40:11
Scherer, Jonas, and Fleming: Solvent induced predissociation of iodine 155
interactions shown in Figs. 1(a) and 1 (b) illustrate how dichroism (or pump-probe spectroscopy) exhibits sensitivity to both ground and excited state wave packet dynamics. The short optical pump pulse prepares vibrational coherences on both the ground and excited electronic states. Heller and co-workers have emphasized the conceptual and computational advantages of classical mechanics for understanding short time quantum dynamics (e.g., wave packet motion,49 low resolution spectra50). We have found that the classical mechanics of a thermal ensemble of iodine molecules provides considerable insight into the signals observed in our experiments. Accordingly, a classical treatment is presented first and the quantum mechanics is discussed afterward.
A. Heterodyne detection and dichroism
Optically induced anisotropies in the absorption coefficient (dichroism) and refractive index (birefringence) of a medium are produced by an intense polarized pump pulse and are measured in time-domain polarization spectroscopySI and the optical Kerr effect,52 respectively. These perturbations of the solution can change the polarization state of the probe beam and cause partial transmission through a polarization analyzer (e.g., calcite polarizer) which would block the probe beam in the absence of the pump. If the probe pulse interferes with a reference optical field (local oscillator) which has the same frequency spectrum and a constant phase shift with respect to the probe pulse, then the electric field amplitUde of the material response may be detected. This approach, which produces a signal which is linear, rather than quadratic, in the field transmitted through the analyzer, is known as optical heterodyne detection. 53 The total detected intensity is given by
1tot=ho+1s+ (nc/81Tp)(~ELO+~oEs), (1)
where ho= (ncI81Tp)EtoELO is the local oscillator intensity, Is= (nc/81Tp)~Es is the homodyne signal which would be detected in the absence of the local oscillator, and the final term is the heterodyne signal. Following a linearly polarized pump pulse, a probe pulse with polarization at 45° to that of the pump will have its plane of polarization rotated by anisotropic absorption or stimulated emission coefficients (dichroism) and acquire some ellipticity from anisotropic refractive indices (birefringence).53 A slightly uncrossed analyzer after the sample permits detection of the heterodyne dichroic response. Provided that ELO>Es , the heterodyne term in Eq. (1) dominates. Heterodyne detection can recover the sign of both dichroic and birefringent responses: The sign of the dichroic response is extremely important for both data analysis and interpretation.
B. The classical Franck prinCiple
The B and X state potentials are known from highresolution gas-phase spectroscopy, so it is possible to qualitatively predict the observed frequencies and phases for the observed B-X dichroic response as a function of wavelength. The short vibrational dephasing time allows us to interpret wavepacket absorption and emission classically
25000
~ 20000 ..... I
G 15000
i;; 10000 L ID C ID 5000
o
(a)
25000
~ 20000 ...... I
~ 15000
i;; 10000 L ID C ID 5000
o
(b)
2.5 3 3.5 R (Angstroms)
2.5 3 3.5 R (Angstroms)
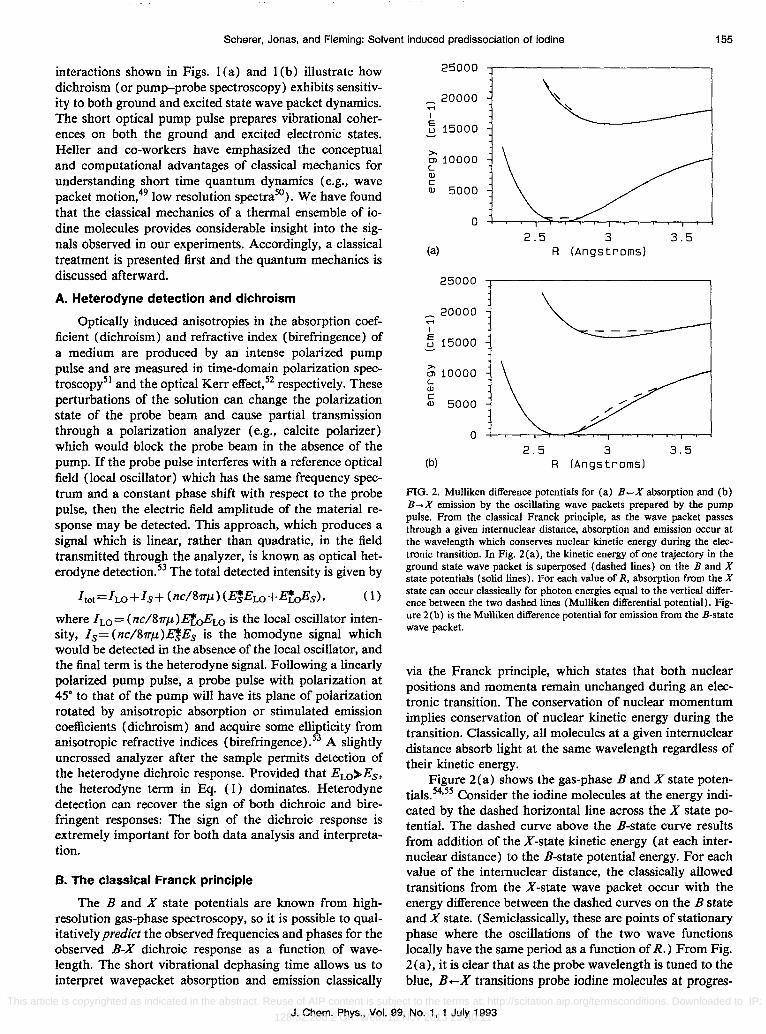
FIG. 2. Mulliken difference potentials for (a) B-X absorption and (b) B .... X emission by the oscillating wave packets prepared by the pump pulse. From the classical Franck principle, as the wave packet passes through a given internuclear distance, absorption and emission occur at the wavelength which conserves nuclear kinetic energy during the electronic transition. In Fig. 2(a), the kinetic energy of one trajectory in the ground state wave packet is superposed (dashed lines) on the B and X state potentials (solid lines). For each value of R, absorption from the X state can occur classically for photon energies equal to the vertical difference between the two dashed lines (Mulliken differential potential). Figure 2(b) is the Mulliken difference potential for emission from the B-state wave packet.
via the Franck principle, which states that both nuclear positions and momenta remain unchanged during an electronic transition. The conservation of nuclear momentum implies conservation of nuclear kinetic energy during the transition. Classically, all molecules at a given internuclear distance absorb light at the same wavelength regardless of their kinetic energy.
Figure 2(a) shows the gas-phase B and X state potentials. 54,55 Consider the iodine molecules at the energy indicated by the dashed horizontal line across the X state potential. The dashed curve above the B-state curve results from addition of the X-state kinetic energy (at each internuclear distance) to the B-state potential energy. For each value of the internuclear distance, the classically allowed transitions from the X-state wave packet occur with the energy difference between the dashed curves on the B state and X state. (Semiclassically, these are points of stationary phase where the oscillations of the two wave functions locally have the same period as a function of R.) From Fig. 2(a), it is clear that as the probe wavelength is tuned to the blue, B +-X transitions probe iodine molecules at progres-
J. Chern. Phys., Vol. 99, No.1, 1 July 1993 This article is copyrighted as indicated in the abstract. Reuse of AIP content is subject to the terms at: http://scitation.aip.org/termsconditions. Downloaded to IP:
128.32.208.2 On: Wed, 13 Nov 2013 23:40:11

156 Scherer, Jonas, and Fleming: Solvent induced predissociation of iodine
sively smaller instantaneous internuclear distances. Similarly, Fig. 2(b) shows Mulliken's difference potential for emission from the B state, assuming 580 nm excitation. The classical Franck principle shows that B-X emission is almost entirely to the red of 580 nm and probes bond lengths greater than 2.7 A.
The classical Franck principle was originally stated56
in a form particularly suited to determine excited state potentials from femtosecond wave packet studies: "We may assume that when light is absorbed the nuclei can only alter their potential energy, as the raising of an electron to another quantum state alters the strength of the chemical binding of the molecule." For a given internuclear distance, the absorbed (or emitted) photon energy supplies (removes) the potential energy difference between electronic states. Absorption from the B state can be distinguished from B +-X absorption by the sign change and vibrational dephasing time. Since the gas-phase B and X state potentials are known, the internuclear distance at which a transition takes place can be approximately determined from the phase shift and frequency of the wave packet absorption. This allows us to crudely map out the excited electronic surfaces reached by absorption from the B state.
The Franck-Condon principle has sometimes been incorrectly interpreted as implying absorption and emission only from the vicinity of the classical turning points. In a cw experiment, time averaging usually does bias the signal towards the classical turning points, however, transitions from the middle of the well can and do occur,57 sometimes with high intensity. 58 If the pump and probe pulses are significantly shorter than a vibrational period, time averaging becomes irrelevant. In femtosecond experiments, one is quite likely to probe the wave packet when it has high momentum as it crosses the middle of the well.
C. Classical wave packet dynamics
The optical pump pulse is temporally short compared to the iodine ground state vibrational period yet spectrally narrow relative to the range of classically allowed B-X transition energies. Only molecules passing through a small range of internuclear distances during the pump pulse can be electronically excited. After the pump pulse, we have electronically excited molecules only in a small range of internuclear distance (this range is larger for greater kinetic energy). Similarly, only ground state molecules in a small range of internuclear distances have been depleted. For each kinetic energy, the excited (depleted) molecules oscillate together in the excited (ground) state potential. For harmonic potentials, molecules with different kinetic energy drift slightly out of step for a quarter period and then come back into step every half period. Anharmonicity causes molecules with different kinetic energy to slowly drift out of step even at the half periods. For iodine, this drift is small on the timescales studied here and will be ignored.
Raman processes in which molecules are transferred to the B state, move on the B-state potential, and then transferred back to the ground state also occur. If the temper-
ature is low and these processes are sufficiently rapid, they can create excess population at some internuclear distances even though there is a net depletion of the ground state. Their importance depends on the kinetic energy acquired in the excited state (determined by the excited state potential) before the molecule moves outside the range of internuclear distances sampled by the pump spectrum (determined by the difference between the ground and excited state potentials). These processes are therefore less important for a pump FC region near the ground state classical turning point (as for the experiment here) than a pump FC region near the ground state equilibrium geometry (e.g., Ref. 43) and will be ignored in further discussions.
By probing with suitable pulses at different wavelengths,59 we can follow the ground state "bleach" or the excited state molecules as they oscillate back and forth. For B ....... X absorption, a short probe pulse will be less strongly absorbed each time the ground state bleach passes through the range of internuclear distances within the probe spectral bandwidth; i.e., we have a vibrational quantum beat. If each probe wavelength samples only one value of the internuclear distance, vibrational modulation of the absorption spectrum may occur up to 4 times per vibrational period. (If the pump pulse excites molecules with nonzero kinetic energy, both molecules with positive momenta and those with negative momenta are sampled as they each pass through the probed region up to twice per vibrational period.) For a given pump pulse, the modulation depth and pattern are determined by the spectral and temporal profile of the probe pulse and the temperature. For instance, if one probes only the higher kinetic energy components of the bleach (e.g., by probing at an energetically inaccessible internuclear distance for the low energy portions), the modulation depth is decreased. Similarly, if the probe pulse is spectrally broad (sampling a large range of internuclear distances) or too long (sampling molecules passing through the probe window at a variety of times), the modulation depth will be decreased. Elastic collisions with the solvent decrease the modulation depth with time ( Tf). Transient absorption of the probe (or stimulated emission) has the general form of a quantum beat.
D. Alignment and anisotropy
The electric dipole transition moment of the B-X transition lies along the iodine bond. Therefore, a linearly polarized pump pulse preferentially excites iodine molecules aligned parallel to the optical electric field. Rotational reorientation is approximately independent of vibrational motion, so that the observed anisotropy is roughly a product:
(2)
where R(td) describes the overall rotational relaxation of the anisotropy induced by the first pulse and each Wj(td) term is the vibronic response for a single electronic transition (absorption and emission count separately). In the limit of small probe rotations, each Wj(td) is proportional to a time dependent vibronic transition probability. For
J. Chern. Phys., Vol. 99, No.1, 1 July 1993 This article is copyrighted as indicated in the abstract. Reuse of AIP content is subject to the terms at: http://scitation.aip.org/termsconditions. Downloaded to IP:
128.32.208.2 On: Wed, 13 Nov 2013 23:40:11

Scherer, Jonas, and Fleming: Solvent induced predissociation of iodine 157
simplicity, we assume rotational reorientation will be reflected as an exponentially decaying multiplicative term [R(td)] with a time constant given by the rotational correlation time of iodine [complications due to the change in 12 bondlength are neglected in Eq. (2)]. The Wi(td) terms contain information about the wave packet dynamics and are of primary interest here.
E. Sign of the dichroic response
For dichroism, the effect of absorption and emission anisotropies can be analyzed by decomposing the linearly polarized probe beam into beams parallel and perpendicular to the pump beam. In X-state absorption, the perpendicular component, is preferentially absorbed because of the ground state bleach. For B-state emission, the parallel component is preferentially emitted. Thus, B-X transitions always rotate the plane of polarization of the probe beam toward that of the pump (we experimentally define this as a positive signal). In contrast, transient absorption from the B state can rotate the probe polarization either towards or away from the pump. If the absorptive transition moment is along the iodine bond, as for the B-X transition, the parallel component will be preferentially absorbed by the B-state molecules, rotating the probe away from the pump (negative signal).60 It is clear that while vibrational motion modulates the magnitude of the dichroic response for a particular optical transition, the sign of that dichroic response does not change; i.e., the dichroic response for a particular optical transition never passes through zero. The dichroic response for each electronic transition has a definite sign.61
F. Quantum correspondence
It is helpful to view the modulations of S(td) as periodic absorption and/or emission by oscillating wave packets on the ground and excited states. Since the wave packets in our experiment are launched from the classical turning points, they may pass through a given probed region only twice per vibrational period. If we assume that the resonant pump pulse yields a net bleach for all X-state vibrational levels, then the ground state wave packet is a
"h I ,,62 Th . ted k . I pure 0 e. e exci state wave pac et IS a ways a pure "particle." The modulations of the signal are then the sum of several signed quantum beats WiCtd), one for each electronic transition. This is depicted schematically in Fig. 3. Assuming that all vibrational levels in a given electronic state have identical popUlation and coherence decay rates, each quantum beat is a signal of the form
Wield) a:A exp( -ld/Tl)
+.IB,cos(Acutfd+cp)exp( -td/T2)' (3)
The ACUi are vibrational energy differences. The constants A, B; are positive and obey certain inequalities which formally result from the density matrix inequality .I (Pij561) >0 for an arbitrary vector 5.63 If there is only one cosine term, this inequality implies A>B. Inequalities for the population and coherence decay time constants T I
2
~
co C 0 01 .r< r.fl
-1
-2 \! 0 2 3
time
FIG. 3. Summation of two signed oscillatory signals (dotted lines) to yield a signal oscillating through zero (solid line). Each signal is the sum of exponentially damped cosines and a more slowly decaying pure exponential, with the amplitude of the pure exponential such that the signal never passes through zero. All of these exponential and damped cosine terms are recovered separately by the LP-SVD analysis, which must be interpreted in accord with the physical constraints on the amplitUde and time constant for the cosine terms relative to the pure exponential.
and T 2 can be formally derived from the density matrix inequality PiiP jj> I Pij 12. For vibrational levels of electronically excited states with zero thermal population, T 1 > T 2'
As discussed in Sec. II E, the overall sign of each WiCtd) term depends on the electronic state from which it originates and the direction of the transition moment. Most of the signals we observe are simply the sum of a positive quantum beat from B-X absorption and a negative quantum beat for absorption (with transition moment along the iodine bond) by electronically excited molecules. This allows the observed signal to pass through zero, as depicted in Fig. 3.
The ground state W(td) term in Eq. (2) is positive and modulated at the ground state vibrational energy differences by coherences from Raman processes. From the classical theory, these Raman-induced ground state vibrational coherences may be thought of as a wave packet "hole." Perhaps not altogether obvious, this makes sense because no change in the distribution of internuclear distances is expected during vibrationally impulsive excitation.43 The ground state signal is a sum of oscillating coherence decays and a decay of the vibrational depopulation induced by the pump pUlse.64 The repopulation of the depleted ground state vibrational levels is caused mainly by vibrational energy transfer. The ground state vibrational depopulation decay is therefore expected to be much slower than rotational reorientation and effectively decay at the rotational .. 32 I h . reonentatlOn rate. n t e one-color expenments, the de-
lay and phase for ground state signals are zero, but both phase and delay can vary with probe wavelength in the two-color experiments.
Excited state Wi(td) terms are modulated at the excited state vibrational energy differences. Generally, there is a positive stimulated emission term along with both positive and negative absorptive terms. The stimulated emission contribution to the excited state signal, which is necessarily positive, has zero phase and zero delay in one-color
J. Chern. Phys., Vol. 99, No.1, 1 July 1993 This article is copyrighted as indicated in the abstract. Reuse of AIP content is subject to the terms at: http://scitation.aip.org/termsconditions. Downloaded to IP:
128.32.208.2 On: Wed, 13 Nov 2013 23:40:11
158 Scherer, Jonas, and Fleming: Solvent induced predissociation of iodine
experiments, but again both phase and delay can vary in two-color experiments: of course, there is no stimulated emission when the probe photon energy exceeds the internal energy of the iodine molecules prepared by the pump. Both the phase and delay of the negative (absorptive) part of the excited state response can vary, even in one-color experiments. In contrast to the ground state, a fairly rapid electronic population decay is expected for the excited state signal. 36
In a perturbative density matrix description of the third-order polarization for a two electronic state system, the ground and excited state vibrational coherence contributions to resonant pump-probe studies occur with the same sign. In our previous report, the excited state dynamics disagreed with the predictions of the two electronic state model by a sign change (a sign change can be distinguished from a 1T phase shift by the sign of the excited state exponential term). This sign change implies absorptive probing from the B-state wave packet to a higher lying electronic state.
III. EXPERIMENTAL
A. Laser system and pulse generation
The laser system employed here and the experimental approach of polarization spectroscopy are well suited to examine the short time dynamics of iodine in solution. The laser system produces tunable 30 fs full width at half maximum (FWHM) Gaussian pulses at 100 kHz repetition rates. The tunability facilitates resonant pumping of the B +-X optical transition and allows us to probe the subsequent dynamics as a function of wavelength. The high repetition rate enables phase-sensitive (lock-in) detection. The zero-background nature of the crossed polarizer arrangement allows separate measurement of absorptive (dichroic) and dispersive (birefringent) signals, thereby facilitating the detection of small absorptions.
The laser system consists of a cavity dumped antiresonant ring dye laser6s that produces 3 nJ 60 fs duration pulses at 610 nm. The near transform limited pulses are amplified to 150-200 nJ energies at a repetition rate of 100 kHz in a two-stage dye amplifier. The second harmonic output (3.5 f-LJ at 532 nm) of an all acoustic-optic Nd:Y AG regenerative amplifier66 serves as the source of 100 kHz repetition rate pump pulses for the dye amplifier. The amplified pulses maintain their 60 fs width and TEMoo mode profile and, following prism compensation, are used to generate a white light continuum in H 20.67 The peak power density in the water cell is maintained at only twice threshold for the process.
The spatially and spectrally selected portion of the optical continuum is amplified in a 250 f-Lm thick jet of 4 mM R6G in ethylene glycol. Spherical mirrors focus the selected portion of continuum into the gain jet and recollimate the amplified beam. Gain is provided by a 300 nJ / pulse 532 nm beam from the regenerative amplifier, yielding 5-10 nJ pulse energies for the amplified continuum, sufficient for the pump pulse in our experiments. Selection of a sufficiently large spectral bandpass and prism
compression produce a pulse of 25-30 fs duration; this is shorter than the incident amplified pulse used to generate the optical continuum.
B. Experimental arrangement
The spectrally selected and reamplified pulses were double passed through a prism pair arrangement to precompensate for the temporal dispersion that arises from the self phase modulation in continuum generation and the wavelength dependent index of refraction of the polarizer, waveplate and lens materials in the polarization arrangement. For the one-color experiment, interferometric autocorrelations were used to minimize self phase modulation and the beam was split 95%:5% into two optical paths for the pump and probe beams, respectively.
The two-color measurements used the amplified portion of the continuum for the pump (3-5 nJ at 580 nm) and the unamplified continuum for the probe (50-200 pJ). The pump and probe beams each double passed through separate F2 prism pairs for chirp compensation. Autocorrelations were used to optimize the pump prism separation for minimal pulse duration at the point of the experiment. The probe beam was spectrally apertured between passes through its prism pair. At each spectral bandpass, the probe prism pair separation was adjusted for minimal pump-probe cross-correlation width at the experiment.
A stepper motor actuated translation stage varied the probe pulse temporal delay with 100 nm (::::;0.3 fs) precision. The pump and probe beams passed through polarizers set at 45° with respect to each other. The probe also passed through a quarter wave plate oriented to compensate for residual birefringence in the optics. The pump was reflected to travel parallel to the probe and both beams were focused by a single f = 10 cm lens into the 1 mm flowing sample cell. The probe beam was recollimated before it encountered the polarization analyzer. Optics along the probe path were selected for small static birefringence so that the extinction ratio of the polarization arrangement is about 106. The transmitted probe beam was imaged onto a high gain photomultiplier tube (Amperex red-enhanced XP2020). In both the one-color and the two-color experiments, the pump beam was chopped and modulated probe transmission through the analyzer was processed by a lock-in amplifier (SRS 530) referenced to the chopper frequency. Since the local oscillator background in Eq. (1) is not modulated by chopping the pump beam, it is effectively removed by lock-in detection.
10 mM 12 (Aldrich) in n-hexane (Baker spectrophotometric grade) was flowed to avoid thermal heating and lensing effects. The optical density is 0.5 at 580 nm. All measurements are performed at room temperature. The signal was recorded for each step of the optical delay line (1 s accumulation) and approximately 4 scans of the delay line were averaged together.
c. Heterodyne detection and data analysis
The detection of the real and imaginary components of the signal electric field, Es , may be achieved by setting the
J. Chern. Phys., Vol. 99, No.1, 1 July 1993 This article is copyrighted as indicated in the abstract. Reuse of AIP content is subject to the terms at: http://scitation.aip.org/termsconditions. Downloaded to IP:
128.32.208.2 On: Wed, 13 Nov 2013 23:40:11

Scherer, Jonas, and Fleming: Solvent induced predissociation of iodine 159
1,6
1,4
1,2
:> 1.0
.§. 0,8 iii c: 0.6 0>
00 0.4
0.2
0.0
Transient Dichroism of Iodine in n-Hexane
580/580 Pump Probe
-0.0 0.4 0.8 1.2 1.6
Delay Time (ps)
Dichroism Autocorrelation
2.0 2.4
FIG. 4. Transient dichroism signal for 580/580 pump-probe wavelengths. The signal is the sum of a positive transient dichroic response from B-X absorption (420 and 211 em-I damped cosines, 1500 fs exponential decay) and a negative response from absorption by the B-state wave packet (112 em-I damped cosine and 150 fs exponential decay).
local oscillator to be in-phase or in-quadrature, respectively, facilitating the measurement of the imaginary (dichroic) or real (birefringent) components of the molecular response function, p( 3) (t). In practice, the dichroism was obtained by taking the difference of two scans, each with the same magnitude local oscillator, but of opposite sign.68
This 'IT-phase shift of the local oscillator was obtained by rotating the analyzer equal amounts in opposite directions. The differencing approach has the advantage of removing the homodyne and any small residual birefringence signal from the dichroism measurement.
The data analysis was performed by using linear prediction singular value decomposition (LP-SVD) to determine the number of terms and parameters for the exponentially damped cosinusoidal terms that describe the data set.69 The form of the assumed signal is
(4)
Although Eq. (4) is mathematically equivalent to Eq. (2) when R(td) is an exponential decay and the Wi(td) are given by Eq. (3), Eq. (4) eliminates multiple terms with the same time dependence. The LP-SVD method of analysis has been used previously to determine the frequency, phase and time constant of vibrational wave packet motion for dye molecules in solution.7o The main disadvantage of the LP-SVD method is that one cannot easily build physical constraints, such as the density matrix inequalities for the coefficients and time constants appearing in Eq. (3), into the fitting procedure. In interpreting the results of LP-SVD analysis, care is required to ensure that the interpretation satisfies these physical constraints.
IV. RESULTS
Figure 4 shows the optically induced dichroism of iodine in n-hexane for 580 nm pump and probe (denoted as 580/580). The oscillatory nuclear contribution to the sig-
TABLE I. LP-SVD fitting parameters for two-color pump-probe dichroism data.
Pump-probe ill (em-I) '" (deg) r (ps) A
580/636 215 -91 0.28 0.041 0 -180 0.46 0.028
580/580 211 -2 0.95 0.071 420 -3 0.95 0.020 0 0 1.43 0.091
112 -190 0.22 0.045 0 -180 0.15 0.050
580/526 193 -100 0.24 0.034 423 -120 0.58 0.011 0 0 2.4 0.051
103 -75 0.22 0.040 0 -180 0.27 0.Q28
580/510 215 -190 0.59 0.057 0 0 2.5 0.067 99 -19 0.29 0.099 0 -180 0.24 0.030
580/490 216 -205 0.60 0.017 0 0 3.6 0.024
103 -50 0.34 0.038 0 -180 0.23 0.11
580/475 200 -125 0.23 0.050 0 0 2.6 0.063
102 -60 0.27 0.12 0 -180 0.32 0.55
580/460 180 -126 0.15 0.13 0 0 0.85 0.64
IJ6 -110 0.21 0.21 0 180 0.50 1.35
nal is evident from 40 fs delay. As in our earlier reports6,24
the nuclear dynamics of iodine yield an oscillatory response that does not decay in a monotonic fashion (i.e., the third positive recurrence is larger in magnitude than the second). This indicates the presence of at least two oscillatory components at small time delays ( < 600 fs).
The curves shown in Fig. 1 (b) of Ref. 6 are from LP-SVD analysis of the 580/580 data set; analysis starting from 50 fs delay yields 112 and 211 cm -I cosine components with 220 and 950 fs exponential damping times, and -190° and _2° phases, respectively. Simple exponential decay components are also present and correspond to excited state population relaxation and 12 rotational reorientation. The slow exponential decay (1'= 1.43 ps) reflects mainly the molecular diffusive rotational reorientation of the ground state since repopulation of the ground state is expected to be slow.32 The rotational orientation decay is multiplicative to all the signals as discussed earlier.6
,7 The fitting parameters are summarized in Table I. The 211 cm -1 oscillatory component corresponds to the ground state vibrational coherence.6,39 The 112 cm- I component was assigned by the close similarity to the period of the B-state gas-phase wave packet,4O and vibrational level spacing.38
The complex response observed in Fig. 4 around (=0 results, in part, from other combinations of pump and
J. Chem. Phys., Vol. 99, No.1, 1 July 1993 This article is copyrighted as indicated in the abstract. Reuse of AIP content is subject to the terms at: http://scitation.aip.org/termsconditions. Downloaded to IP:
128.32.208.2 On: Wed, 13 Nov 2013 23:40:11
160 Scherer, Jonas, and Fleming: Solvent induced predissociation of iodine
4.5
4.0
3.5
3.0
2.5
(ij 2.0 c:
1.5 Cl CiS
1.0
0.5
0.0
-0.5
-1.0
-1.5 -0.5
Transient Dichroism of Iodine in Hexane Probe Tuning Dependence
580 nm probe
~ 526
510
490
~5 : 460
0.0 0.5 1.0 1.5 2.0
Delay Time (ps) 2.5
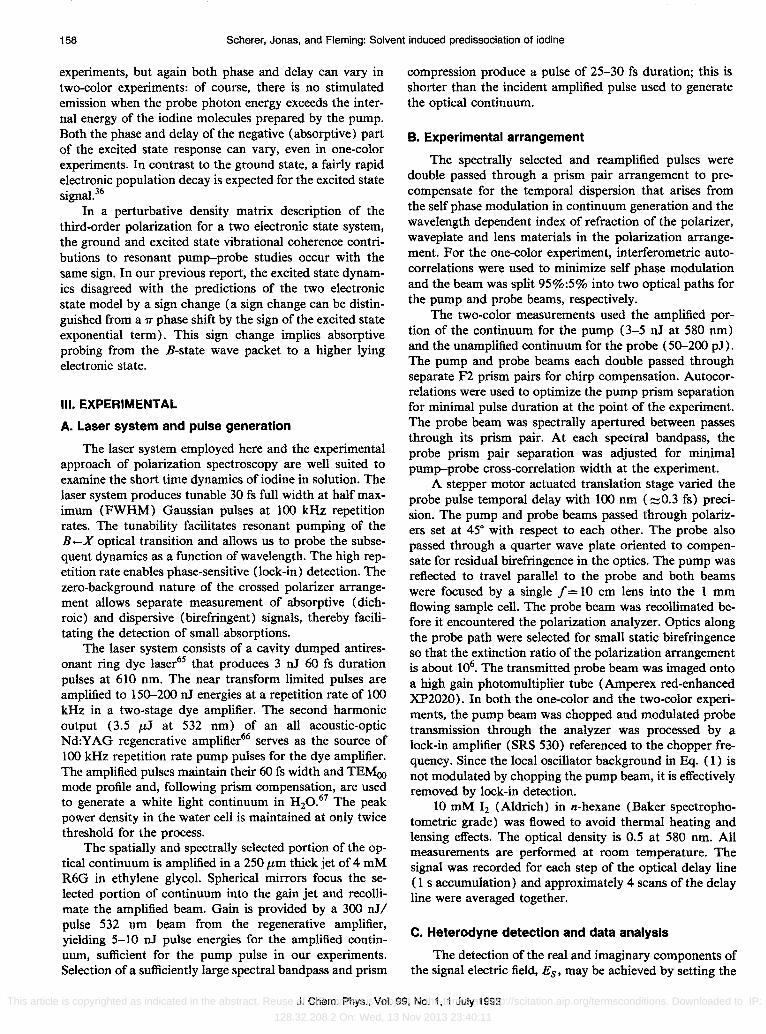
FIG. 5. Tunable probe transient dichroism signals, approximately intensity normalized (see text). Note the evolution of the signals with decreasing wavelength: the signal becomes almost entirely negative, the nuclear response is increasingly delayed, and the delayed nuclear response becomes stronger than the 1=0 electronic response with overlapping pump and probe lasers_
probe field time-ordered interactions.71,72 The formation of
phase gratings in the sample flow71 can cause a small birefringent contamination that interferes with the dichroism signal at t=O. As shown in Ref. 7, the optically induced birefringence of n-hexane is more than an order of magnitude larger than the iodine dichroism signal near t=O. For this reason the LP-SVD analysis is begun at time delays in excess of the pulse autocorrelation width. The 580/580 data have been obtained with pulse widths ranging from 60 to 25 fs and only a small phase variation of about 20· is observed. This 20· variation seems a reasonable guess for the phase angle error bar in our measurements. (The anticipated greater error in the phase angles for higher frequency components seems to be approximately canceled by their greater amplitude.) The small birefringence contamination does not have any effect on the phase and frequency of the oscillatory contributions to the signal, but it can affect the excited state population exponential relaxation so as to apparently shorten the exponential time constant.
Figure 5 shows a plot of the 580 nm pump/tunableprobe dichroism data sets. The amplitude of each data set has been roughly normalized by scaling to the pump-probe intensity autocorrelation used to establish the laser system temporal response and determine the t=O pump-probe delay time. The absorbance of the 12 sample, at the beam crossing point of 0.25 mm depth, has also been taken into account in the normalization. The pump intensity and experimental configuration were the same for each measurement. Two points should be noted about this figure: (1) the prominent 580/580 ground-state vibrational coherence contribution is replaced by a longer period (7::::;300 fs) rapidly damped oscillation that becomes progressively more prominent with shorter wavelength probing and (2) the time of appearance of this same low frequency feature increases with shorter wavelength probing. The amplitude of the delayed nuclear contribution to the signal actually
1.8
1.5
1.2
0.9
s- 0.6
.E- 0.3
(ij 0.0 c Cl -0.3
CiS -0.6
-0.9
-1.2
-1.5
-1.8 -0.4
Transient Dichroism of Iodine in Hexane
{\ 580 nm pump, 640 nm probe
!i : :
J \ W'>-<:1-....,..........------
-0.0 0.4 0.8 1.2 1.6
Delay Time (ps)
Dichroism
Cross-correlation
2.0 2.4
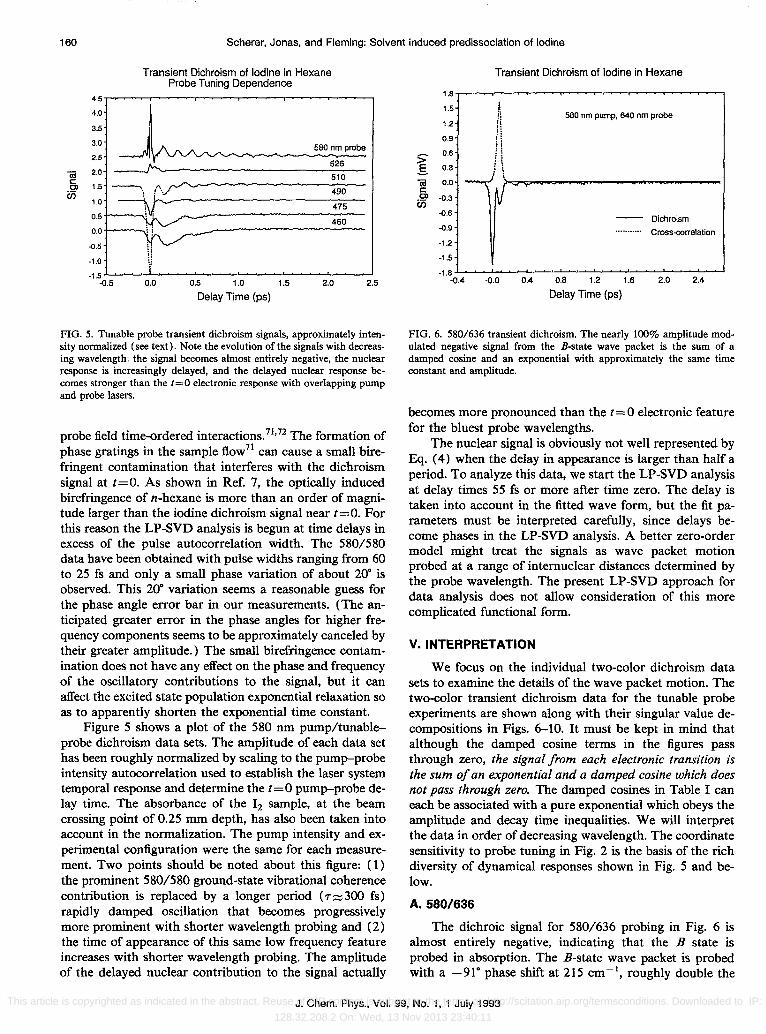
FIG. 6. 580/636 transient dichroism. The nearly 100% amplitUde modulated negative signal from the B-state wave packet is the sum of a damped cosine and an exponential with approximately the same time constant and amplitude.
becomes more pronounced than the t=O electronic feature for the bluest probe wavelengths.
The nuclear signal is obviously not well represented by Eq. (4) when the delay in appearance is larger than half a period. To analyze this data, we start the LP-SVD analysis at delay times 55 fs or more after time zero. The delay is taken into account in the fitted wave form, but the fit parameters must be interpreted carefully, since delays become phases in the LP-SVD analysis. A better zero-order model might treat the signals as wave packet motion probed at a range of internuclear distances determined by the probe wavelength. The present LP-SVD approach for data analysis does not allow consideration of this more complicated functional form.
V.INTERPRETATION
We focus on the individual two-color dichroism data sets to examine the details of the wave packet motion. The two-color transient dichroism data for the tunable probe experiments are shown along with their singular value decompositions in Figs. 6-10. It must be kept in mind that although the damped cosine terms in the figures pass through zero, the signal from each electronic transition is the sum of an exponential and a damped cosine which does not pass through zero. The damped cosines in Table 1 can each be associated with a pure exponential which obeys the amplitude and decay time inequalities. We will interpret the data in order of decreasing wavelength. The coordinate sensitivity to probe tuning in Fig. 2 is the basis of the rich diversity of dynamical responses shown in Fig. 5 and below.
A.580/636
The dichroic signal for 580/636 probing in Fig. 6 is almost entirely negative, indicating that the B state is probed in absorption. The B-state wave packet is probed with a _910 phase shift at 215 cm- I
, roughly double the
J. Chem. Phys., Vol. 99, No.1, 1 July 1993 This article is copyrighted as indicated in the abstract. Reuse of AIP content is subject to the terms at: http://scitation.aip.org/termsconditions. Downloaded to IP:
128.32.208.2 On: Wed, 13 Nov 2013 23:40:11

Scherer, Jonas, and Fleming: Solvent induced predissociation of iodine 161
> §. Iii c: 0> en
(a)
0.35
0.30
0.25
0.20
0.15
0.10
0.05
0.00
.(l.os
.(l.10 -0.5
..... tU C OJ ·rl UJ
(b)
0.1
o
-0.1
-0.2
Transient Dichroism of Iodine in Hexane
580 nm Dumo. 526 nm probe
0.0 0.5 1.0 1.5 2.0 2.5
Delay TIme (ps)
o 0.5 1 1. 5 2 2.5 3 time (ps)
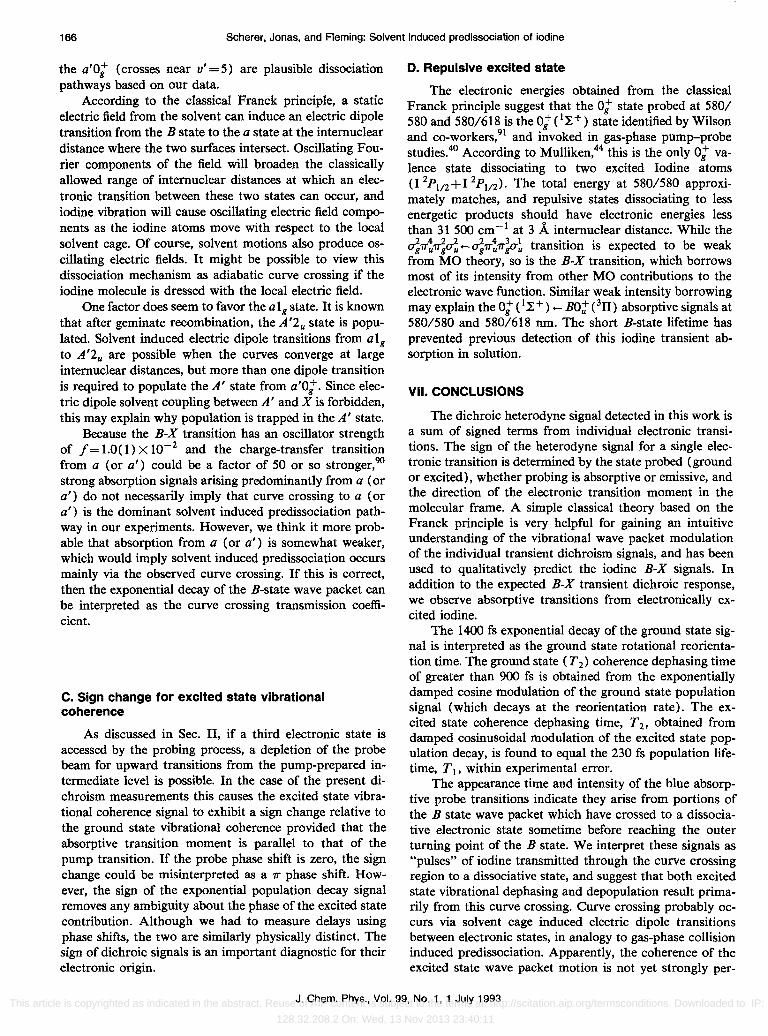
FIG. 7. (a) 580/526 transient dichroic response and (b) singular value decomposition. Oscillations through zero imply both positive and negative signals contribute to the total signal. The 423 cm -I damped cosine and 2400 fs pure exponential are interpreted as the expected positive ground state signal (see text and Fig. 2).
B-state vibrational frequency, both of which imply the wave packet is probed as it passes somewhere near the middle of the B-state well twice each vibrational period. The delay time for signal appearance is t= -CP/{J)i' so that probing exactly at the middle of the well with (J)i=2{J)vib and delay time t= TViJ/4 would imply a phase shift CPi= -180'. The delay time suggests probing somewhere between the inner turning point and the middle of the wellY The 0.3 ps coherence decay time for this oscillation agrees reasonably well with the 0.22 ps excited state coherence decay time from the 580/580 data. Although signals from B-.X stimulated emission might also be expected at this wavelength, they could not be detected. From Fig. 2(a), no absorptive signals from the X-state wave packet are expected.
Since this absorptive signal is negative, it shows that the absorptive transition moment is parallel to the 12 bond, as for B-X excitation. This implies74 the absorptive transition probed obeys a ~O = 0 selection rule from the BO;;state; i.e., the final state has symmetry ot It is known 75
(a)
(b)
2
Transient Dichroism of Iodine in Hexane
, f~ n f \
580 nm pump, 510 nm probe
o ~ \.") .r7"IV "A..-------..----1
-2 Dichroism Cross-correlation
-3~--~~--~~~~~~~~~~~~--~
-0.5 0.0 0.5 1.0 1.5 2.0 2.5
Delay TIme (ps)
LP-SVD of Iodine Dichroism. 580 nm Pump. 510 nm Probe
.0.80~-~O:':.5'---~----:I"::.5---:----2.'":"5--......J
Time (ps)
FIG. 8. 580/510 transient with singular value decomposition. The total signal oscillating through zero is the sum of a positive B-X absorption signal (215 cm- I damped cosine plus 2500 fs exponential) and a negative excited state signal (99 cm- I damped cosine plus 240 fs exponential).
that there are no bound electronic states of iodine at the final energy reached by the probe, so this 0: state must be repulsive. From the Franck principle we can calculate that this state has about 31 500 cm - 1 electronic potential energy at R = 3 A. For the time being, we label this state 0: ( 'l: + ); this label will be justified in the discussion.
B.580/580
For the 580/580 data in Fig. 4, according to Fig. 2, we expect B-X absorption with zero phase shift at the X state vibrational frequency from the outer turning point of the X state and B-X emission with zero phase shift at the B-state frequency from the inner turning point of the B state. From the singular value decomposition, there is a 112 cm -1 oscillatory component at nearly the gas-phase B-state frequency, but the phase for this component is -190·. According to Sec. II E, this can only be interpreted as a negative amplitude absorptive B-state oscillation with a - 10· phase shift. Support for this interpretation comes from the negative amplitUde for the B-state popUlation decay, which has a similar decay constant. Since the neg-
J. Chern. Phys., Vol. 99, No.1, 1 July 1993 This article is copyrighted as indicated in the abstract. Reuse of AIP content is subject to the terms at: http://scitation.aip.org/termsconditions. Downloaded to IP:
128.32.208.2 On: Wed, 13 Nov 2013 23:40:11
162 Scherer, Jonas, and Fleming: Solvent induced predissociation of iodine
-0.2
-0.3
-0.4
-0.5
-0.6 -0.4
(a)
Transient Dichroism of Iodine in Hexane
-0.0 0.4 0.8 1.2 1.6
Delay Time (ps)
Dichroism Cross-correlation
2.0 2.4
LP-SVD of Iodine Dichroism. 580 om Pump. 490 om Probe O.05c--------------'---------,
.(l.05
t -0.1 ;;;
(b)
0.5
:",. " ...
1.5 2.5
Tune (ps)
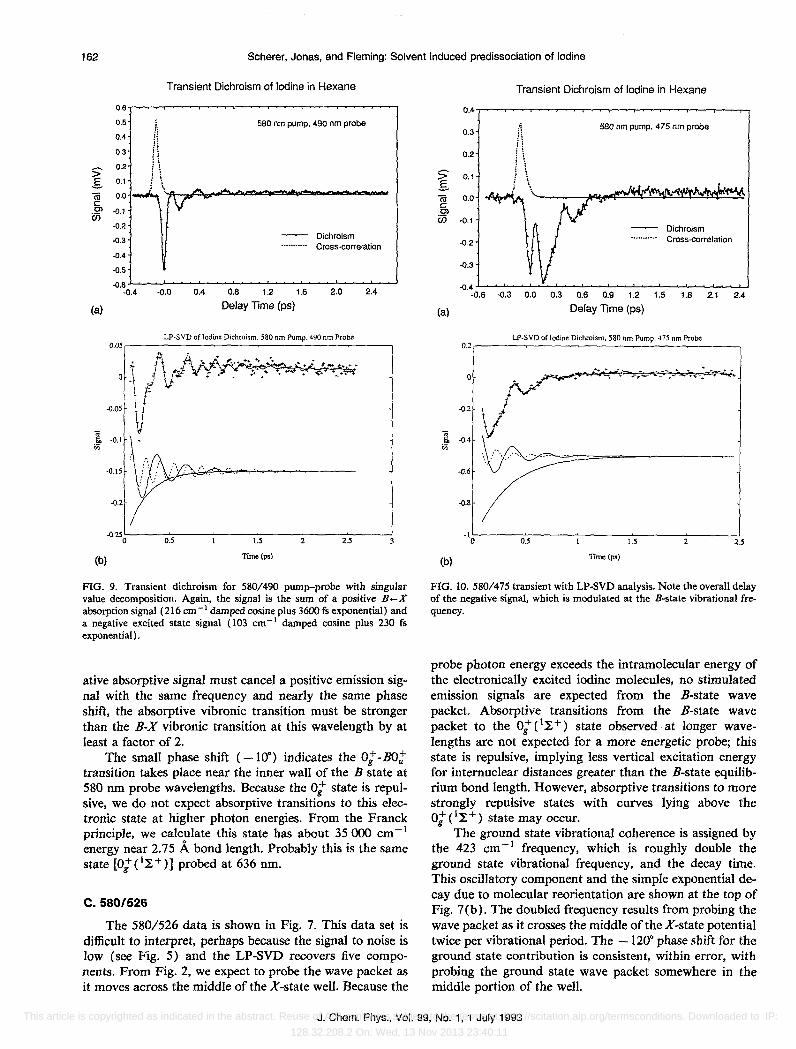
FIG. 9. Transient dichroism for 580/490 pump-probe with singular value decomposition. Again, the signal is the sum of a positive B-X absorption signal (216 em -I damped cosine plus 3600 fs exponential) and a negative excited state signal (103 em-I damped cosine plus 230 fs exponential) .
ative absorptive signal must cancel a positive emission signal with the same frequency and nearly the same phase shift, the absorptive vibronic transition must be stronger than the B-X vibronic transition at this wavelength by at least a factor of 2.
The small phase shift (-10°) indicates the 0: -BO;; transition takes place near the inner wall of the B state at 580 nm probe wavelengths. Because the 0: state is repulsive, we do not expect absorptive transitions to this electronic state at higher photon energies. From the Franck principle, we calculate this state has about 35 ()(X) cm- 1
energy near 2.75 A bond length. Probably this is the same state [0: ( 1 ~ + ) J probed at 636 nm.
C.580/526
The 580/526 data is shown in Fig. 7. This data set is difficult to interpret, perhaps because the signal to noise is low (see Fig. 5) and the LP-SVD recovers five components. From Fig. 2, we expect to probe the wave packet as it moves across the middle of the X-state well. Because the
0.4
0.3
0.2
~ 0.1
(ij 0.0 c 0)
CiS -0.1
-0.2
-0.3
-0.4 -0.6 -0.3
(al
0.2
-0.2
], -0.4 ;;;
-0.6
-0.8
-I 0
(b)
Transient Dichroism of Iodine in Hexane
0.0 0.3
580 nm pump. 475 nm probe
0.6 0.9 1.2
Delay Time (ps) 1.5
Dichroism Cross-correlation
1.8 2.1
LP-SYD of Iodine Dichroism. 580 om Pump. 475 om Probe
' .. ~ . . ~. . ... ..,.4'- .... - . ..", ......
0.5 1.5
Time (ps)
2.4
2 . .5
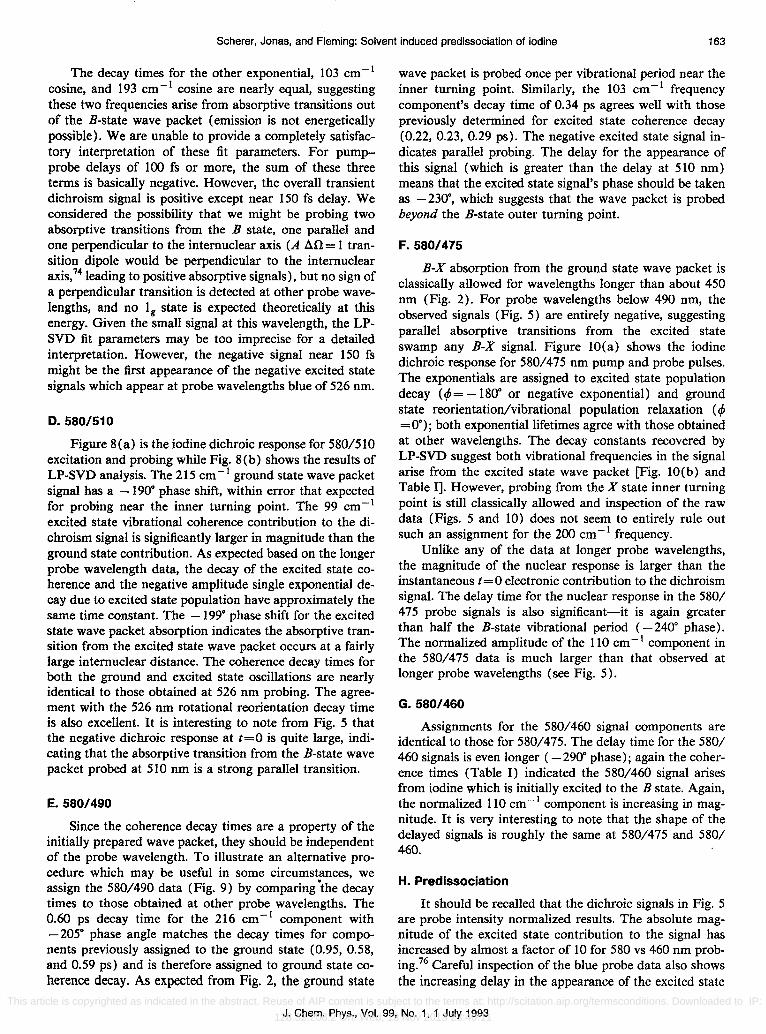
FIG. 10. 580/475 transient with LP-SVD analysis. Note the overall delay of the negative signal, which is modulated at the B-state vibrational frequency.
probe photon energy exceeds the intramolecular energy of the electronically excited iodine molecules, no stimulated emission signals are expected from the B-state wave packet. Absorptive transitions from the B-state wave packet to the O:e~+) state observed at longer wavelengths are not expected for a more energetic probe; this state is repulsive, implying less vertical excitation energy for internuclear distances greater than the B-state equilibrium bond length. However, absorptive transitions to more strongly repulsive states with curves lying above the 0; (I}; +) state may occur.
The ground state vibrational coherence is assigned by the 423 cm- 1 frequency, which is roughly double the ground state vibrational frequency, and the decay time. This oscillatory component and the simple exponential decay due to molecular reorientation are shown at the top of Fig. 7(b). The doubled frequency results from probing the wave packet as it crosses the middle of the X-state potential twice per vibrational period. The -120· phase shift for the ground state contribution is consistent, within error, with probing the ground state wave packet somewhere in the middle portion of the well.
J. Chem. Phys., Vol. 99, No.1, 1 July 1993 This article is copyrighted as indicated in the abstract. Reuse of AIP content is subject to the terms at: http://scitation.aip.org/termsconditions. Downloaded to IP:
128.32.208.2 On: Wed, 13 Nov 2013 23:40:11
Scherer, Jonas, and Fleming: Solvent induced predissociation of iodine 163
The decay times for the other exponential, 103 cm- I
cosine, and 193 cm -1 cosine are nearly equal, suggesting these two frequencies arise from absorptive transitions out of the B-state wave packet (emission is not energetically possible). We are unable to provide a completely satisfactory interpretation of these fit parameters. For pumpprobe delays of 100 fs or more, the sum of these three terms is basically negative. However, the overall transient dichroism signal is positive except near 150 fs delay. We considered the possibility that we might be probing two absorptive transitions from the B state, one parallel and one perpendicular to the internuclear axis (A An = 1 transition dipole would be perpendicular to the internuclear axis, 74 leading to positive absorptive signals), but no sign of a perpendicular transition is detected at other probe wavelengths, and no 19 state is expected theoretically at this energy. Given the small signal at this wavelength, the LPSVD fit parameters may be too imprecise for a detailed interpretation. However, the negative signal near 150 fs might be the first appearance of the negative excited state signals which appear at probe wavelengths blue of 526 nm.
D.580/510
Figure 8(a) is the iodine dichroic response for 580/510 excitation and probing while Fig. 8(b) shows the results of LP-SVD analysis. The 215 cm- I ground state wave packet signal has a - 190· phase shift, within error that expected for probing near the inner turning point. The 99 em-I excited state vibrational coherence contribution to the dichroism signal is significantly larger in magnitude than the ground state contribution. As expected based on the longer probe wavelength data, the decay of the excited state coherence and the negative amplitude single exponential decay due to excited state population have approximately the same time constant. The - 199· phase shift for the excited state wave packet absorption indicates the absorptive transition from the excited state wave packet occurs at a fairly large internuclear distance. The coherence decay times for both the ground and excited state oscillations are nearly identical to those obtained at 526 nm probing. The agreement with the 526 nm rotational reorientation decay time is also excellent. It is interesting to note from Fig. 5 that the negative dichroic response at 1=0 is quite large, indicating that the absorptive transition from the B-state wave packet probed at 510 nm is a strong parallel transition.
E.580/490
Since the coherence decay times are a property of the initially prepared wave packet, they should be independent of the probe wavelength. To illustrate an alternative procedure which may be useful in some circumstances, we assign the 580/490 data (Fig. 9) by comparing "the decay times to those obtained at other probe wavelengths. The 0.60 ps decay time for the 216 cm - 1 component with - 205· phase angle matches the decay times for components previously assigned to the ground state (0.95, 0.58, and 0.59 ps) and is therefore assigned to ground state coherence decay. As expected from Fig. 2, the ground state
wave packet is probed once per vibrational period near the inner turning point. Similarly, the 103 cm -I frequency component's decay time of 0.34 ps agrees well with those previously determined for excited state coherence decay (0.22, 0.23, 0.29 ps). The negative excited state signal indicates parallel probing. The delay for the appearance of this signal (which is greater than the delay at 510 nm) means that the excited state signal's phase should be taken as -230·, which suggests that the wave packet is probed beyond the B-state outer turning point.
F. 580/475
B-X absorption from the ground state wave packet is classically allowed for wavelengths longer than about 450 nm (Fig. 2). For probe wavelengths below 490 nm, the observed signals (Fig. 5) are entirely negative, suggesting parallel absorptive transitions from the excited state swamp any B-X signal. Figure lO(a) shows the iodine dichroic response for 580/475 nm pump and probe pulses. The exponentials are assigned to excited state population decay (ifJ= -180· or negative exponential) and ground state reorientation/vibrational population relaxation (ifJ =0·); both exponential lifetimes agree with those obtained at other wavelengths. The decay constants recovered by LP-SVD suggest both vibrational frequencies in the signal arise from the excited state wave packet [Fig. lO(b) and Table I]. However, probing from the X state inner turning point is still classically allowed and inspection of the raw data (Figs. 5 and 10) does not seem to entirely rule out such an assignment for the 200 cm- I frequency.
Unlike any of the data at longer probe wavelengths, the magnitude of the nuclear response is larger than the instantaneous 1=0 electronic contribution to the dichroism signal. The delay time for the nuclear response in the 580/ 475 probe signals is also significant-it is again greater than half the B-state vibrational period (-240· phase). The normalized amplitUde of the 110 cm - 1 component in the 580/475 data is much larger than that observed at longer probe wavelengths (see Fig. 5).
G.580/460
Assignments for the 580/460 signal components are identical to those for 580/475. The delay time for the 580/ 460 signals is even longer (-290· phase); again the coherence times (Table I) indicated the 580/460 signal arises from iodine which is initially excited to the B state. Again, the normalized 110 cm - 1 component is increasing in magnitude. It is very interesting to note that the shape of the delayed signals is roughly the same at 580/475 and 580/ 460.
H. Predlssociation
It should be recalled that the dichroic signals in Fig. 5 are probe intensity normalized results. The absolute magnitude of the excited state contribution to the signal has increased by almost a factor of 10 for 580 vs 460 nm probing.76 Careful inspection of the blue probe data also shows the increasing delay in the appearance of the excited state
J. Chern. Phys., Vol. 99, No.1, 1 July 1993 This article is copyrighted as indicated in the abstract. Reuse of AIP content is subject to the terms at: http://scitation.aip.org/termsconditions. Downloaded to IP:
128.32.208.2 On: Wed, 13 Nov 2013 23:40:11

164 Scherer, Jonas, and Fleming: Solvent induced predissociation of iodine
300
Ii) 240 .... I
I I III 180 E
.I"'i
4J 120 -
I >-m I""i III 'C
60
0 450 475 500 525
probe wavelength (nm)
FIG. 11. Appearance delay (calculated from the phase angle) for the excited state signal at the B-state vibrational frequency plotted against probe photon energy for the blue probe transients. Note that the delay increases steadily to values significantly greater than half the 320 fs B-state vibrational period.
nuclear contribution to the signal as the probe wavelength decreases from 510 to 460 nm. The enhanced magnitude of the excited state coherence contribution to the dichroic signal indicates two things: (i) blue probing from the excited state is more efficient than B-X probing, and (ii) the delayed nuclear dynamics are probed more efficiently, perhaps by way of an optical transition with a stronger transition moment than the t=O "electronic" response.
Figure 11 shows the time delay for the appearance of the excited state vibrational coherence contribution to the dichroism signal for the blue probe wavelengths. This information is obtained from the phase angle of the excited state vibrational coherence contribution to the dichroic response. The delay increases with shorter wavelength probing. The delay times increase to 250 fs for 580/460, significantly larger than half the B-state vibrational period of 160 fs determined from the 580/580 data. Delays greater than half the B-state vibrational period are incompatible with bound B-state wave packet motion. This large delay and the increase in the absolute magnitude of the excited state signal (Fig. 5) argue that the 580/475 and 580/460 data no longer probe B-state wave packet motion. It seems likely that the negative signals at the 110 cm - 1 B-state vibrational frequency in the 580/526, 580/510, 580/490, 580/475, and 580/460 data all arise from the same electronic transition after predissociation of the B state.
VI. DISCUSSION
Iodine dissociation and geminate recombination in a variety of solvents have been estimated to occur in less than 1 or 2 ps.32,36 The solution dynamics reported here and in Ref. 6 are clearly distinguished from isolated molecule gas phase dynamics40 by the rapid decay of the excited state coherence and the prominence of the ground state coherence contributions to the signal. The resonance Raman studies of Sension and Strauss39 have established
that the inverse optical dephasing rate (i.e., T 2 ) of iodine in simple noninteracting liquids41 is about 300 fs. The time scale for optical dephasing and excited state vibrational dephasing are the same within experimental uncertainties . We previously concluded that the optical and B-state vibrational dephasing arise from the same process: B-state depopulation by predissociation.6 The two-color experiments reported here substantially support these prior observations and conclusions.
The two-color measurements reveal delays that correspond to absorptive probing in the outer turning point region of the B state and beyond. From the relative strength of the t=O electronic response and the delayed wave packet signals, it is clear that the delayed wave packet motion on the excited state(s) does not contribute to the t=O signal in the case of 490, 475, and 460 nm probing. The implication is that the B-state wave packet has crossed to a second electronic surface which has a strong optical transition to a high lying electronic state.
The surprising strength of the absorptive transient dichroism after B state excitation relative to the B-X dichroism places an important constraint on the states involved; vibronic transitions between them must be stronger than B-X. In addition to the selection rules, qualitative molecular orbital considerations are useful in estimating intensities. The energetically accessible electronic states of iodine can be characterized by the population of the four highest valence molecular orbitals, 5pag, 5p11'u' 5p11'g, and 5pau' The electronic ground state (X) molecular orbital config-
• . _2 4 4 0 uratlon IS ag11'u11'ifI'u'
In the MO approximation, electronic transitions transfer one electron per photon. Transitions between valence states dissociating to neutral atoms (combinations of I 2pl/2 and I 2P3/2) are expected to be weak because electric dipole transitions are forbidden in the separated atom limit. Among transitions to the ion-pair states, which diabatically dissociate to 1+ and 1-, Mulliken44 has emphasized that transitions which transfer an electron from a bonding MO to the corresponding antibonding MO (i.e., au+-ag and 11'g+-11'u) should be extremely intense. The oscillating transition dipole moment of the superposition state, which is that of an electron charge transfer between atoms in both the AO and MO approximations in this case, is obviously large.
A. Delay of wave packet appearance
The combination of the large delay time, greater than half the B-state period, and the prominence of the delayed nuclear dichroic response at 580/475 and 580/460 suggests the delayed transitions probe molecules which have crossed from the B state to another electronic surface (predissociated). If molecules are launched onto the probed region of "the outer surface once per B-state vibrational period, the dichroic response arising from amplitUde on this second surface will be modulated at the B-state frequency and decay with the same time constants. In effect, the frequency tunable probe selects a window along the reaction coordinate and detects any wave packet flux when it passes through.
J. Chern. Phys., Vol. 99, No.1, 1 July 1993 This article is copyrighted as indicated in the abstract. Reuse of AIP content is subject to the terms at: http://scitation.aip.org/termsconditions. Downloaded to IP:
128.32.208.2 On: Wed, 13 Nov 2013 23:40:11

Scherer, Jonas, and Fleming: Solvent induced predissociation of iodine 165
Once the wave packet has crossed onto the dissociative surface, the expected form of the signals is less obvious. The form of the signal will depend strongly on Mulliken's difference potential between the dissociative state and the upper state observed in absorptive probing. If the difference potential is nearly flat, the W;(td) term will increase in a series of steps, as observed for the sodium D line following photodissociation of Nal.77 If the difference potential varies strongly with internuclear distance, each probe wavelength will sample a small range of internuclear distance. In this case, the dissociating molecule will be observed as a series of pulses passing through the probed region with the amplitude of each successive pulse reflecting the transmission coefficient for curve crossing. The observed width of these "pulses" depends on the local slope of the difference potential, since smaller slopes mean that a larger range of internuclear distance is probed.
The increasingly delayed signals at 580/526, 580/510, 580/490, 580/475, and 580/460 are then explained as probing of the electronic state reached after curve crossing at successively larger intermolecular distances. All electronic states crossing the B state are dissociative or have only shallow van der Waals minima. From the classical Franck principle, the progressive blue shift suggests a transition to a bound upper state; since there are no bound valence states at this energy, the upper state is probably an ion-pair state which has been shifted down in energy by a contact charge transfer interaction with the solvent. The intensity increase with delay is in qualitative agreement with intense (possible charge transfer) probe transitions from a dissociative state to one of the ion-pair states.
From the first appearance of the delayed signals (151 fs at 580/510), the curve crossing apparently occurs before the wave packet reaches about 3.5 A on the B-state well.78 If the inner walls of the two crossing potentials are similar and the dissociative state is probed at internuclear distances beyond the curve crossing, then dissociating molecules from both the forward and reverse curve crossings will reach the probed internuclear distance at about the same time. The case of pre dissociation onto the a1g curve32
is indicated in Fig. 1. Figure 12 illustrates a progressively stronger, blue shifted probe absorption from the dissociation wave packet to a solvated ion-pair state. In this case a transition from the repulsive curve to an ion-pair state may result in as much as a tenfold increase in oscillator strength vs transitions from the B-state.
B. Solvent-Induced predissoclatlon
We thus consider probe transitions from dissociative states reached via curve crossing. The a'O: e~ -) state has MO configuration a;1T~7?~ [or possibly a;1T~1T;a~en)] (Ref. 79) and should have an extremely strong chargetransfer transition to the low energy 0'; e~- )a;1T~~~ ion-pair state. The alg state has MO configuration ~~1T;a~ en) so that charge transfer transitions terminate on the higher energy a!1T~~~ MO configuration, requiring a larger solvent shift for the ion-pair state. Such stabilization is not unreasonable; the D ion-pair state does undergo a "contact charge-transfer" interaction, which
50000
40000 ..--. I
~ 30000
6; 20000 L Q)
C Q) 10000
o
-~~!s~~-~\----E _ 1-+1+
1
i
solution ....- -
" ---~- --- I
B
526nm probe
3
460nm probe
4 R (Angstroms)
I 1 + ,. I
i
1 + 1
5
FIG. 12. Schematic illustrating probe transition from iodine on a dissociative electronic state to an ion-pair state. The potential curves of the lowest ion pair states in solution (dashed curve) have been crudely illustrated by subtracting 7000 cm- i from the gas phase E state potential. With blue probing, the dichroic signal for transitions from the dissociative a state to the ion-pair state is increasingly delayed because the wave packet is probed at larger R.
lowers the red edge of the D-X absorption spectrum roughly 10000 cm- I in alkane solvents.8o Tellinghuisen, Heaven, and co-workers have found a 4000 cm -I red shift for ion pair emission in 12Arn clusters.8l The ion-pair states are both theoretically expected and experimentally observed to be quite similar to each other. 82,83
A collision between iodine and the solvent bath or a binary collision in the gas phase can induce a transition from the B state to one of the nearby repulsive states. Tellinghuisen33 has shown that the observed vibrational dependence of the electric field induced predissociation84 of 12 (B) is consistent with predissociation via the a I g state characterized by Churassy et al. 48 Steinfeld47 suggested that the a'O: state dominates fluorescence quenching, but it seems possible that alg is responsible for the gas-phase collision-induced predissociation.85
Emission from the B, A, and A' states is observed after B-state excitation of iodine in rare gas matrices. Although the pathway which populates the A, and A' states is not known, circumstantial evidence86 tends to rule out B-state predissociation via B" I u (l n). A recent study suggests that the "one-atom cage effect,,,87 which had been attributed to nonadiabatic coupling between Band B" in the 12Ar van der Waals complex,88 is purely kinematic: electronic coupling to B"lu en) is not involved.89 Heaven and co-workers86 have suggested that the iodine predissociation mechanism is the same in gases, rare gas matrices, and liquids.
The basic idea of the gas-phase models is that during a collision, the electric fields responsible for van der Waals interaction induce an electric dipole transition from the B state to a dissociative electronic state or states. The linear trend of B state vibrational dephasing time (which we interpret as a predissociation rate) vs solvent polarizability observed in Ref. 7 suggests a similar van der Waals electric dipole predissociation mechanism in solution. Both the a I g
curve (crossing near the outer turning point of v' = 1) and
J. Chern. Phys., Vol. 99, No.1, 1 July 1993 This article is copyrighted as indicated in the abstract. Reuse of AIP content is subject to the terms at: http://scitation.aip.org/termsconditions. Downloaded to IP:
128.32.208.2 On: Wed, 13 Nov 2013 23:40:11
166 Scherer, Jonas, and Fleming: Solvent induced predissociation of iodine
the a'a: (crosses near v' = 5) are plausible dissociation pathways based on our data.
According to the classical Franck principle, a static electric field from the solvent can induce an electric dipole transition from the B state to the a state at the internuclear distance where the two surfaces intersect. Oscillating Fourier components of the field will broaden the classically allowed range of internuclear distances at which an electronic transition between these two states can occur, and iodine vibration will cause oscillating electric field components as the iodine atoms move with respect to the local solvent cage. Of course, solvent motions also produce oscillating electric fields. It might be possible to view this dissociation mechanism as adiabatic curve crossing if the iodine molecule is dressed with the local electric field.
One factor does seem to favor the alg state. It is known that after geminate recombination, the A '2U state is populated. Solvent induced electric dipole transitions from alg to A '2U are possible when the curves converge at large internuclear distances, but more than one dipole transition is required to populate the A' state from a'Ot Since electric dipole solvent coupling between A I and X is forbidden, this may explain why population is trapped in the A I state.
Because the B-X transition has an oscillator strength of f = l.0( 1) X 10-2 and the charge-transfer transition from a (or a/ ) could be a factor of 50 or so stronger,90 strong absorption signals arising predominantly from a (or a / ) do not necessarily imply that curve crossing to a (or a/ ) is the dominant solvent induced predissociation pathway in our experiments. However, we think it more probable that absorption from a (or a') is somewhat weaker, which would imply solvent induced predissociation occurs mainly via the observed curve crossing. If this is correct, then the exponential decay of the B-state wave packet can be interpreted as the curve crossing transmission coefficient.
C. Sign change for excited state vibrational coherence
As discussed in Sec. II, if a third electronic state is accessed by the probing process, a depletion of the probe beam for upward transitions from the pump-prepared intermediate level is possible. In the case of the present dichroism measurements this causes the excited state vibrational coherence signal to exhibit a sign change relative to the ground state vibrational coherence provided that the absorptive transition moment is parallel to that of the pump transition. If the probe phase shift is zero, the sign change could be misinterpreted as a 1/' phase shift. However, the sign of the exponential population decay signal removes any ambiguity about the phase of the excited state contribution. Although we had to measure delays using phase shifts, the two are similarly physically distinct. The sign of dichroic signals is an important diagnostic for their electronic origin.
D. Repulsive excited state
The electronic energies obtained from the classical Franck principle suggest that the 0: state probed at 580/ 580 and 580/618 is the 0: (Il:+) state identified by Wilson and co-workers,91 and invoked in gas-phase pump-probe studies.40 According to Mulliken,44 this is the only 0: valence state dissociating to two excited Iodine atoms (I 2PI/2+I 2P1/2)' The total energy at 580/580 approximately matches, and repulsive states dissociating to less energetic products should have electronic energies less than 31 500 cm -I at 3 A internuclear distance. While the ~1/'!~c1u+-~1/'!~g<7~ transition is expected to be weak from MO theory, so is the B-X transition, which borrows most of its intensity from other MO contributions to the electronic wave function. Similar weak intensity borrowing may explain the 0: ( Il: + ) +- BO;; (3n) absorptive signals at 580/580 and 580/618 nm. The short B-state lifetime has prevented previous detection of this iodine transient absorption in solution.
VII. CONCLUSIONS
The dichroic heterodyne signal detected in this work is a sum of signed terms from individual electronic transitions. The sign of the heterodyne signal for a single electronic transition is determined by the state probed (ground or excited), whether probing is absorptive or emissive, and the direction of the electronic transition moment in the molecular frame. A simple classical theory based on the Franck principle is very helpful for gaining an intuitive understanding of the vibrational wave packet modulation of the individual transient dichroism signals, and has been used to qualitatively predict the iodine B-X signals. In addition to the expected B-X transient dichroic response, we observe absorptive transitions from electronically excited iodine.
The 1400 fs exponential decay of the ground state signal is interpreted as the ground state rotational reorientation time. The ground state (T 2) coherence dephasing time of greater than 900 fs is obtained from the exponentially damped cosine modulation of the ground state population signal (which decays at the reorientation rate). The excited state coherence dephasing time, T 2, obtained from damped cosinusoidal modulation of the excited state population decay, is found to equal the 230 fs population lifetime, T 1, within experimental error.
The appearance time and intensity of the blue absorptive probe transitions indicate they arise from portions of the B state wave packet which have crossed to a dissociative electronic state sometime before reaching the outer turning point of the B state. We interpret these signals as "pulses" of iodine transmitted through the curve crossing region to a dissociative state, and suggest that both excited state vibrational dephasing and depopulation result primarily from this curve crossing. Curve crossing probably occurs via solvent cage induced electric dipole transitions between electronic states, in analogy to gas-phase collision induced predissociation. Apparently, the coherence of the excited state wave packet motion is not yet strongly per-
J. Chern. Phys., Vol. 99, No.1, 1 July 1993 This article is copyrighted as indicated in the abstract. Reuse of AIP content is subject to the terms at: http://scitation.aip.org/termsconditions. Downloaded to IP:
128.32.208.2 On: Wed, 13 Nov 2013 23:40:11

Scherer, Jonas, and Fleming: Solvent induced predissociation of iodine 167
turbed or destroyed by interaction with the solvent, even after curve crossing. The direct observation of caging effects thus appears to be a real possibility with shorter wavelength probing.
ACKNOWLEDGMENTS
This work was supported in part by the National Science Foundation. Acknowledgment is made to the donors of The Petroleum Research Fund, administered by the ACS, for partial support of this research. One of us (N.F.S.) thanks Professor Robin Hochstrasser for enlightening conversations. We thank Professor W. Klemperer for providing a preprint of Ref. 89. D.M.J. thanks the National Science Foundation for a postdoctoral fellowship.
I G. R. Fleming, Chemical Applications of Ultrafast Spectroscopy (Oxford University, New York, 1986).
2M. J. Rosker, F. W. Wise, and C. L. Tang, Phys. Rev. Lett. 57, 321 (1986).
3J. Chesnoy and A. Mokhtari, Phys. Rev. A 38,3566 (1988). 4K. A. Nelson and L. R. Williams, Phys. Rev. Lett. 58, 745 (1987). 5S. Mukamei, Ann. Rev. Phys. Chern. 41, 647 (1990). 6N. F. Scherer, L. D. Ziegler, and G. R. Fleming, J. Chern. Phys. 96, 5544 (1992).
'N. F. Scherer, L. D. Ziegler, D. M. Jonas, and G. R. Fleming (unpubIished). This paper presents the solvent dependence of the B-state vibrational dephasing rate. The dephasing rate is found to correlate with static and dynamic solvent properties.
8L. R. Khundkar and A. H. Zewail, Ann. Rev. Phys. Chern. 41, 15 (1990).
9 A. H. Zewail, M. Dantus, R. M. Bowman, and A. Mokhtari, J. Photochem. Photobiol. A: Chern. 62, 301 (1992); Y. Yan, R. M. Whitnell, K. R. Wilson, and A. H. Zewail, Chern. Phys. Lett. 193,402 (1992).
lOp. A. Anfinrud, C. Han, T. Lian, and R. M. Hochstrasser, J. Phys. Chern. 94, 1180 (1990).
II R. A. Mathies, C. H. Brito Cruz, W. T. Pollard, and C. V. Shank, Science 240, 777 (1988); R. W. Schoenlein, L. A. Peteanu, R. A. Mathies, and C. V. Shank, in Ultrafast Phenomena VIII, edited by J. L. Martin, A. Migus, G. A. Mourou, and A. Zewail (Springer-Verlag, New York, 1992).
12U. Banin, A. Waldman, and S. Ruhman, J. Chern. Phys. 96, 2416 (1992); U. Banin, A. Waldman, and S. Ruhrnan, in UltraFast Phenomena VIII, edited by J. L. Martin, A. Migus, G. A. Mourou, and A. Zewail (Springer-Verlag, New York, 1992).
13 J. M. Papanikolas et al., J. Chern. Phys. 97, 7002 (1992). 14M. Maroncelli, J. MacInnis, and G. R. Fleming, Science 243, 1674
( 1989). up. F. Barbara and W. Jarzeba, Adv. Photochem. 15, 1 (1990). 16S. J. Rosenthal. X. Xie. M. Du. and G. R. Fleming, J. Chern. Phys. 95,
4715 (1991). l7y. J. Yan and S. Mukamel, J. Chern. Phys. 94. 179 (1991). 18E. J. Nibbering, D. A. Wiersma, and K. Duppen, Phys. Rev. Lett. 66,
2464 (1991). 191._Y. Bigot. M. T. PortelJa, R. W. Schoenlein. C.l. Bardeen. A. Migus,
and C. V. Shank, Phys. Rev. Lett. 66, 1138 (1991). 20M. Cho. S. J. Rosenthal. N. F. Scherer, L. D. Ziegler. and G. R.
Fleming, 1. Chern. Phys. 96, 5033 (1992). 21 A. M. Walsh and R. F. Loring. Chern. Phys. Lett. 186, 77 (1991). 22D. A. McQuarrie. Statistical Mechanics (Harper and Row. New York.
1976). p. 266. 23J. T. Hynes. R. Kapral. and G. M. Torrie, J. Chern. Phys. 72, 177
(1980). 24N. F. Scherer, L. D. Ziegler, D. Jonas, and G. R. Fleming. in Ultrafast
Phenomena VIII, edited by J. L. Martin, A. Migus. G. A. Mourou, and A. H. Zewail (Springer-Verlag. New York, 1992).
2SJ. Franck and E. Rabinowitsch, Trans. Faraday Soc. 30, 120 (1934). 26See L. F. Meadows and R. M. Noyes, J. Am. Chern. Soc. 82, 1872
( 1960). and references therein.
27T. J. Chuang, G. W. Hoffman. and K. B. Eisenthal, Chern. Phys. Lett. 25.201 (1974).
28p. Bado, C. Dupuy, D. Magde, K. R. Wilson, and M. M. Malley, 1. Chern. Phys. 80, 5531 (1984); P. Bado and K. R. Wilson, J. Phys. Chern. 88, 655 (1984).
29D. F. Kelly, N. A. Abul-Haj, and D. J. Jang, J. Chern. Phys. 80, 4\05 (1984).
30 A. L. Harris, M. Berg, and C. B. Harris, J. Chern. Phys. 84, 788 (1986). 31 X. Xu, S. Yu, R. Lingle, H. Zhu, and J. B. Hopkins, J. Chern. Phys. 95,
2445 (1991), and references therein. 32 A. L. Harris, J. K. Brown, and C. B. Harris, Ann. Rev. Phys. Chern. 39,
341 (1988). 33 J. Tellinghuisen, J. Chern. Phys. 82, 4012 (1985). 34B. Otto, J. Schroeder, and J. Troe, J. Chern. Phys. 81, 202 (1984), and
references therein. 3Sp. B. Beeken, E. A. Hansen, and G. W. Flynn, J. Chern. Phys. 78, 5892
(1983); M. Macler, 1. P. Nicolai, and M. C. Heaven, ibid. 91, 674 ( 1989).
36D. E. Smith and C. B. Harris, J. Chern. Phys. 87, 2709 (1987). 37T. J. Kang, J. Yu, and M. Berg, J. Chern. Phys. 94, 2413 (1991). 38 J. Tellinghuisen, J. Quant. Spectr. Radiat. Trans. 19, 149 (1978); R. F.
Barrow and K. K. Yee. J. Chern. Soc. Faraday Trans. II 69, 684 (1973).
39R. 1. Sension and H. L. Strauss, 1. Chern. Phys. 85, 3791 (1986). 4OR. M. Bowman, M. Dantus, and A. H. Zewail, Chern. Phys. Lett. 161,
297 (1989). 41 Iodine does not form molecular complexes in hexane. See R. S. Mul
liken, J. Am. Chern. Soc. 72, 600 (1950). 42R. M. Bowman, M. Dantus, and A. H. Zewail, Chern. Phys. Lett. 174,
546 (1990). 43W. T. Pollard, S.-Y. Lee, and R. A. Mathies, J. Chern. Phys. 92, 4012
(1990). 44R. S. Mulliken, J. Chern. Phys. 55, 288 (1970). This paper is quanti
tatively out of date for the ion-pair states, but contains an extremely valuable qualitative discussion.
45 For a comprehensive bibliography of molecular iodine spectroscopy up to 1977, see K. P. Huber and G. Herzberg, Molecular Spectra and Molecular Structure, Vol. IV, Constants of Diatomic Molecules (Van Nostrand-Reinhold. New York, 1979), pp. 33Q-.337.
46Electronic states are designated by an italic letter (possibly with primes) followed by a symmetry label appropriate for Hund's case (c): The quantum number .0. (absolute value of the projection of the total electronic angular momentum on the internuclear axis) with subscript "g" or "u" denoting the symmetry of the electronic state under molecule-fixed inversion. States with .0.=0 have an additional superscript" +" or .. -" for the sign acquired by the electronic wave function under reflection in a plane containing the two nuclei. (This superscript for the electronic states should not be confused with the ± parity labels used for rovibronic states.) The electric dipole selection rules for electronic transitions are A.o. = 0, ± I and g ...... u, with the additional selection rule that 0+......0- transitions are forbidden. [G. Herzberg, Molecular Spectra and Molecular Structure, VoL I Spectra of Diatomic Molecules (Krieger, Malabar, FL 1989), Eq. (VA7)]. For example, electric dipole transitions to 0: (e.g., X) and I g states are electronically allowed from the BO: state. Since Hund's case (a) labels (superscript 2S + I preceding k, n, or A for projection of the electronic angular momentum A=O, I, or 2) are relevant for discussion of intensities, they follow the case (c) labels in parentheses. The additional case (a) selection rules are AA=O, ± 1 and AS=O.
4' J. E. Selwyn and J. I. Steinfeld, Chern. Phys. Lett. 4, 217 (1969); J. 1. Steinfeld, Acc. Chern. Res. 3, 313 (1970); J. I. Steinfeld, J. Phys. Chern. Ref. Data 13, 445 (1984).
48S. Churassy, F. Martin, R. Bacis, J. Verges, and R. W. Field, J. Chern. Phys. 75, 4863 (1981).
49E. J. Heller, 1. Chern. Phys. 62, 1544 (1975); E. J. Heller, Ace. Chern. Res. 14, 368 (1981).
sOJ. R. Reimers, K. R. Wilson, and E.l. Heller, J. Chern. Phys. 79, 4749 ( 1983); J. P. Bergsma, P. H. Berens. K. R. Wilson, D. R. Fredkin, and E. J. Heller, J. Phys. Chern. 88, 612 (1984).
51 D. S. Alavi, R. S. Hartman, and D. H. Waldeck, J. Chern. Phys. 94, 4509 (1991).
52D. McMorrow, W. T. Lotshaw, and G. A. Kenny-Wallace, IEEE J. Quant. Elect. 24, 443 (1988).
53G. L. Eesley, M. D. Levenson, and W. M. Tolles, IEEEJ. Quant. EJect.
J. Chern. Phys., Vol. 99, No.1, 1 July 1993
This article is copyrighted as indicated in the abstract. Reuse of AIP content is subject to the terms at: http://scitation.aip.org/termsconditions. Downloaded to IP:
128.32.208.2 On: Wed, 13 Nov 2013 23:40:11
168 Scherer, Jonas, and Fleming: Solvent induced predissociation of iodine
14, 45 (1978); M. D. Levenson and G. L. Besley, Appl. Phys. 19, I ( 1979).
54The X-state potential is from R. J. LeRoy, J. Chern. Phys. 52, 2683 (1970).
55The B-state potential is from Table VIn of Barrow and Yee [Ref. 38; note the typographical error for G(v=46) which should read G(v) =3892.86 cm- I ] and J. Tellinghuisen, J. Chern. Phys. 58, 2821 (1973).
56J. Franck, Trans. Faraday Soc. 21, 536 (1925). 57J. Tellinghuisen, J. Mol. Spectrosc. 103,455 (1984). 58 A. Dalgarno, G. Herzberg, and T. L. Stephens, Astrophys. J. 162, L49
(1970); R. S. Mulliken, J. Chern. Phys. 55, 309 (1971). 59R. B. Bernstein and A. H. Zewail, J. Chern. Phys. 90,829 (1989). 60 Absorption from the B state can produce a positive signal if the absorp
tive transition moment is perpendicular to the internuclear axis. 61 In molecules of low symmetry, it is possible to imagine "pathological"
exceptions to this rule if the direction of the electronic transition moment varies appropriately with vibrational coordinate. Moreover, free rotational motion can cause alignment perpendicular to the initial pump polarization at certain times which are longer than our experimental timescale [see P. M. Felker, J. S. Baskin, and A. H. Zewail, J. Phys. Chern. 90, 724 (1986), Fig. 2].
62Note that for nonresonant pump pulses, Raman processes produce mixed ground state wave packets consisting of both a "particle" and a "hole" by redistributing the ground state population. For mixed wave packets, the dichroic signal does not have a definite sign.
63L. D. Landau and E. M. Lifschitz, Quantum Mechanics, 3rd ed. (Pergamon, New York, 1977), Sec. 14.
64This ground state vibrational popUlation contribution to the dichroic signal was erroneously omitted in the theoretical treatment of a two electronic state, four level system referred to in Ref. 6, but is required by the density matrix inequality I.(pijs61»O.
65N. F. Scherer, A. J. Ruggiero, H. Guttman, M. Du, and G. R. Fleming (unpublished) .
66 A. J. Ruggiero, N. F. Scherer, G. M. Mitchell, G. R. Fleming, and J. N. Hogan, J. Opt. Soc. Am. B 8, 2061 (1991).
67 A. J. Ruggiero, N. F. Scherer, and G. R. Fleming (unpublished). 68D. S. Alavi, R. S. Hartman, and D. H. Waldeck, J. Chern. Phys. 94,
4509 (1991). 69F. W. Wise, M. J. Rosker, G. L. Milhauser, and C. L. Tang, IEEE J.
Quant. Elec. QE23, 1116 (1987); W. Barkhuijsen, R. DeBeer, W. M. M. J. Bovee, and D. van Ormondt, J. Mag. Reson. 61, 465 (1985).
701. A. Walmsley, M. Mitsunaga, and C. L. Tang, Phys. Rev. A 38, 4681 (1988).
71T. F. Heinz, S. L. Palfrey, and K. B. Eisenthal, Opt. Lett. 9, 359 (1984); J. L. Oudar, IEEE J. Quant. Elec. 19,713 (1983).
72C. C. Hayden and R. Trebino, Appl. Phys. B 51, 350 (1990). 73 Since the phase shift indicates the ground state well is being probed off
to one side, the LP-SVD analysis is inadequate: actually there should be two equal amplitude damped cosinusoidal oscillations at the groundstate vibration frequency, with phases 4> and (211'-4». The modest signal-to-noise ratio of this data may account for this missing component and the fit to double the excited state frequency.
74L. E. Brus, J. Mol. Spectrosc. 64, 376 (1977).
75 There can be no bound valence states of iodine above the dissociation limit corresponding to two I 2pl/2 atoms.
76 This bears a superficial resemblance to previously unexplained transient grating results [T. S. Rose, W. L. Wilson, G. Wackerlee, and M. D. Fayer, J. Chern. Phys. 86, 5370 (1987)]. X state vibrational relaxation may be a plausible explanation for these transient grating results. The 560 nm and longer wavelength pump transitions are dominated by absorption from vibrationally excited X-state iodine (mainly v" = 1 and v"=2), while absorption from the iodine zero-point level is strongest near the 532 nm probe. Thus, single collision vibrational energy transfer within the X state might cause the delayed appearance of a grating at 532 nm after excitation at 560 nm and longer wavelengths.
77T. S. Rose, M. J. Rosker, and A. H. Zewail, J. Chern. Phys. 91, 7415 (1989).
78This estimate of the internuclear distance was obtained by numerical integration of the classical equations of motion on the B-state potential.
79Mulliken (Ref. 44) suggested both MO configurations, and Tellinghuisen (Ref. 33) has pointed out some indirect evidence for the former. If the latter possibility is correct, then the strong charge transfer transition from a' will be analogous to and roughly isoenergetic with that from a.
8oD. F. Evans, J. Chern. Phys. 23, 1424 (1955); L. E. Orgel and R. S. Mulliken, J. Am. Chern. Soc. 79, 4839 (1957); L. M. Julien and W. B. Person, J. Phys. Chern. 72, 3059 (1968).
81 S. Fei et al., J. Chern. Phys. 97, 6057 (1992). 82K. S. Viswanathan and J. Tellinghuisen, J. Mol. Spectrosc. 101, 285
(1983). 83 J. C. D. Brand, A. R. Hoy, A. K. Kalkar, and A. B. Yamashita, J. Mol.
Spectrosc. 95, 350 (1982). 84F. W. Dalby, C. D. P. Levy, and J. VanderLinde, Chern. Phys. 85, 23
(1984). 85Nakagawa et aL [Chern. Phys. 106, 259 (1986)] have attributed the
collision induced predissociation of the iodine B state to the 0; en) state, but this conclusion is based on an incorrect theory [C. A. Thayer and J. T. Yardley, J. Chern. Phys. 57, 3992 (1972)] which neglected the intermolecular wave function of the collision partners. [For a correct treatment of the intermolecular wave function symmetry, see T. Oka, Adv. Atomic Mol. Phys. 9, 127 (1973).] The O;em state has been observed (Ref. 82) and is nowhere near the location derived by Nakagawa et al. Recognizing that vibrational energy transfer during collisions will wash out the vibrational dependence of the collision induced predissociation somewhat, it seems probable from Fig. 3 of the paper by Nakagawa et al. that collisional predissociation via the alg state is consistent with the observed vibrational dependence of the Iluorescence quenching cross sections.
86M. Macler, J.-P. Nicolai, and M. C. Heaven, J. Chern. Phys. 91, 674 (1989); M. Macler and M. C. Heaven, Chern. Phys. 151,219 (1991).
87J. J. Valentini and J. B. Cross, J. Chern. Phys. 77, 572 (1982). 88J. A. Beswick, R. Monot, J.-M. Philippoz, and H. van den Bergh, J.
Chern. Phys. 86, 3965 (1987). 89M. L. Burke and W. Klemperer, J. Chern. Phys. 98, 1797 (1993). 90 According to Ref. 45, the D-X charge transfer transition has an oscil
lator strength, /;:;;0.5 (summed over all vibrational bands). 91R. K. Sander and K. R. Wilson, J. Chern. Phys. 63,4242 (1975).
J. Chern. Phys., Vol. 99, No.1, 1 July 1993 This article is copyrighted as indicated in the abstract. Reuse of AIP content is subject to the terms at: http://scitation.aip.org/termsconditions. Downloaded to IP:
128.32.208.2 On: Wed, 13 Nov 2013 23:40:11