FEMININE STEM ROLE MODELS: ATTEMPTS TO IMPROVE …
157
FEMININE STEM ROLE MODELS: ATTEMPTS TO IMPROVE WOMEN’S MOTIVATION IN SCIENCE, TECHNOLOGY, ENGINEERING, AND MATHEMATICS FIELDS BY COUNTERING THE UNFEMININE-STEM STEREOTYPE by Diana E. Betz A dissertation submitted in partial fulfillment of the requirements for the degree of Doctor of Philosophy (Psychology) in the University of Michigan 2013 Doctoral Committee: Professor Denise J. Sekaquaptewa, Chair Professor Elizabeth Ruth Cole Professor Ramaswami Mahalingam Professor Abigail J. Stewart
Transcript of FEMININE STEM ROLE MODELS: ATTEMPTS TO IMPROVE …
FEMININE STEM ROLE MODELS: ATTEMPTS TO IMPROVE WOMEN’S MOTIVATION IN SCIENCE, TECHNOLOGY, ENGINEERING, AND MATHEMATICS FIELDS BY
COUNTERING THE UNFEMININE-STEM STEREOTYPE
by
Diana E. Betz
A dissertation submitted in partial fulfillment
of the requirements for the degree of Doctor of Philosophy
(Psychology) in the University of Michigan
2013 Doctoral Committee: Professor Denise J. Sekaquaptewa, Chair Professor Elizabeth Ruth Cole Professor Ramaswami Mahalingam Professor Abigail J. Stewart

© Diana E. Betz 2013

ii
ACKNOWLEDGEMENTS
I am very grateful to my advisor, Denise Sekaquaptewa, for her guidance over the past
six years. I feel lucky to have learned so much from her, not just as a researcher but also as a
teacher and a mentor. Her example has helped me in my work with my own research assistants,
without whom this research would have been impossible. I am particularly grateful to Melissa
Manley and Sara Johnson for their assistance creating materials and for aiding in middle school
data collection, and to Kelsey Martin for her collaboration on Study 3. I am thankful to Liz Cole,
Ram Mahalingam, and Abby Stewart for serving on my committee. Their diverse viewpoints
have strengthened this work and deepened my thinking about the ideas it contains. I am grateful
to my once lab- and office-mate, Laura Ramsey, for her guidance not just on this project but
throughout graduate school. I am grateful to Bert Lue for his patience and insight, to my family
for their constant support, and to my friends for sharing this experience with me.
iii
TABLE OF CONTENTS
Acknowledgements ............................................................................................................. ii List of Tables ..................................................................................................................... iv List of Figures ......................................................................................................................v List of Appendices ............................................................................................................. vi Abstract ............................................................................................................................. vii Chapter 1. Introduction ........................................................................................................1 Chapter 2. Study 1a: Feminine STEM Role Models and Middle School Girls .................12
Method ...................................................................................................................14 Results ....................................................................................................................18 Discussion ..............................................................................................................21
Chapter 3. Study 1b: Attainability of Feminine STEM Role Models ................................23
Method ...................................................................................................................23 Results ....................................................................................................................24 Discussion ..............................................................................................................25
Chapter 4. Study 2: Feminine STEM Role Models and College Women .........................27
Method ...................................................................................................................29 Results ....................................................................................................................33 Discussion ..............................................................................................................40
Chapter 5. Study 3: Individual Differences and Reactions to Role Models ......................43
Method ...................................................................................................................47 Results ....................................................................................................................52 Discussion ..............................................................................................................66
Chapter 6. General Discussion ...........................................................................................70 Tables .................................................................................................................................78 Figures................................................................................................................................98 Appendices .......................................................................................................................116 References ........................................................................................................................134

iv
LIST OF TABLES
Table 1: Role Model Ratings, Study 1a .............................................................................78 Table 2: Correlations Among Role Model Ratings and Outcomes, Study 1a ...................79 Table 3: Role Model Ratings, Study 2 ...............................................................................80 Table 4: Correlations Among Role Model Ratings ...........................................................81 Table 5: Math Self-Ratings, Study 2 ..................................................................................82 Table 6: Science Self-Ratings, Study 2 ..............................................................................83 Table 7: English Self-Ratings, Study 2 ..............................................................................84 Table 8: Math Plans, Study 2 .............................................................................................85 Table 9: Science Plans, Study 2 .........................................................................................86 Table 10: English Plans, Study 2 .......................................................................................87 Table 11: Math Persistence, Study 2 ..................................................................................88 Table 12: Role Model Ratings, Study 3 .............................................................................89 Table 13: Correlations Among Role Model Ratings, Study 3 ...........................................91 Table 14: Math Self-Ratings, Study 3 ................................................................................92 Table 15: Science Self-Ratings, Study 3 ............................................................................93 Table 16: English Self-Ratings, Study 3 ............................................................................94 Table 17: English Plans, Study 3 .......................................................................................95 Table 18: Math Persistence, Study 3 ..................................................................................96 Table 19: Correlations Among Individual Differences, Study 3 .......................................97

v
LIST OF FIGURES
Figure 1: Math Self-Ratings, Study 1a ..............................................................................98 Figure 2: Math Plans, Study 1a ..........................................................................................99 Figure 3: Attainability Ratings, Study 1b ........................................................................100 Figure 4: English Self-Ratings, Study 2 ..........................................................................101 Figure 5: Math Attempts, Study 2....................................................................................102 Figure 6: Math Self-Concept, Study 2 .............................................................................103 Figure 7: Mediation Model via Attainability, Study 2 .....................................................104 Figure 8: Math Plans, Study 3 .........................................................................................105 Figure 9: Science Plans, Study 3 ......................................................................................106 Figure 10: Science Self-Ratings by Domain, Implicit Stereotypes, Study 3 ...................107 Figure 11: Math Plans by Role Model Type, Implicit Stereotypes, Study 3 ...................108 Figure 12: Science Plans by Role Model Femininity, Implicit Stereotypes, Study 3 ......109 Figure 13: Math Attempts by Role Model Type, Implicit Stereotypes, Study 3 .............110 Figure 14: English Self-Ratings by Role Model Femininity, Imp. Stereotypes, S3 ........111 Figure 15: Science Plans by Role Model Type, Explicit Stereotypes, Study 3 ...............112 Figure 16a: English Plans by Role Model Femininity, Explicit Stereotypes, Study 3 ....113 Figure 16b: English Plans by Role Model Domain, Explicit Stereotypes, Study 3 .........114 Figure 17: Math Plans by Role Model Domain, Feminine App. End., Study 3 ..............115
vi
LIST OF APPENDICES
Appendix A: Role Model Stimuli, Studies 1a, 1b ...........................................................117 Feminine STEM Role Models .............................................................................117 Gender-Neutral School Role Models ...................................................................120
Appendix B: Outcome Measures, Studies 1a, 2, 3 ..........................................................123 Appendix C: Role Model Stimuli, Study 2 ......................................................................125
Feminine STEM Role Model ...............................................................................125 Gender-Neutral Humanities Role Model .............................................................126
Appendix D: Single-Category Implicit Association Test Stimuli, Study 3 .....................127 Feminine Photographs .........................................................................................127 Unfeminine Photographs .....................................................................................128
Appendix E: Illustration of Single-Category Implicit Association Test, Study 3 ...........129 Appendix F: Role Model Stimuli, Study 3 ......................................................................130
Feminine STEM Role Models .............................................................................130 Gender-Neutral Humanities Role Models ...........................................................132
vii
ABSTRACT
Women remain underrepresented in science, technology, engineering, and mathematics (STEM)
fields, perhaps in part because STEM is seen as incompatible with femininity. Interventions that
change perceptions of academic fields (e.g., counterstereotypic role models) can boost
motivation, but feminine STEM role models remain untested. It may seem daunting to combine
the incompatible qualities of femininity and success in “unfeminine” fields, making feminine
STEM role models less effective motivators than more everyday, gender-neutral women in
STEM. Studies 1a and 1b test this possibility by asking middle school girls to read interviews
with college women who were feminine or gender-neutral in terms of appearance and hobbies,
and who were succeeding in STEM fields or in school generally. Study 1a suggests that feminine
STEM role models dampen girls’ self-rated ability and future plans in math. Study 1b
corroborates past evidence that role models are more threatening than inspiring when their
success feels unattainable: girls disinterested in STEM (who were most harmed by reading about
feminine STEM role models in Study 1a) saw feminine STEM success as least attainable. Study
2 aimed to replicate these effects with a female college sample, with “humanities” replacing
“school” as the comparison role model condition. STEM role models generally improved
English self-ratings and harmed math self-ratings. Perceiving STEM role models as less
attainable than humanities role models mediated their negative effect on math self-concept.
Study 3 used improved stimuli and found that gender-neutral female STEM role models were
more motivating than feminine STEM role models. Study 3 also assessed three individual
differences. A Single-Category Implicit Association Test (SC-IAT) was developed to measure
viii
implicit associations between STEM-related words and photos representing unfeminine
appearance, as opposed to photos representing feminine appearance. Explicit unfeminine-STEM
stereotypes and participants’ endorsement of feminine appearance were also assessed. Feminine
STEM role models were least motivating for participants with strong implicit or explicit
stereotypes, yet feminine appearance endorsement did not moderate feminine STEM role model
effects. Overall, gender-neutral STEM role models were found to be more effective motivators
than feminine STEM role models. Implications for interventions aimed girls and women in
STEM are discussed.
Key Words: gender, femininity, stereotype, role models, science, math, academics,
cognitive associations, motivation

1
CHAPTER I
Introduction
The gender gap in STEM—or science, technology, engineering, and math—is a highly
visible problem. In the United States, nearly twice as many men as women intend to major in
STEM1 fields, especially engineering, computer science, and the physical sciences (American
Association of University Women [AAUW], 2010). They earn 38.4% of bachelor’s degrees
awarded in STEM fields (driven by relatively greater participation in biological and life sciences
as well as mathematics; National Science Foundation [NSF], 2007), but with workforce attrition,
women hold just 24% of STEM jobs (United States Department of Commerce, 2011; Hewlett et
al., 2008). These numbers have been crunched by thousands of articles in psychology alone, as
researchers from diverse sciences attempt to understand why this gap exists.
One of the most prominent explanations points to a sense of incompatibility, poor fit, or
mismatch between being female and succeeding in STEM. In general, people’s career choices
are shaped by perceived fit. According to Gottfredson’s (1981) influential circumscription and
compromise theory, students gradually narrow down potential careers by cutting out jobs whose
typical representatives do not share their own interests and abilities. For instance, middle school
students show the most interest in fields where they feel they resemble the “typical student”
(Hannover & Kessels, 2004). Similarly, Eccles’ (Parsons [Eccles], Adler, & Meece, 1984)
1 This term excludes the health and medical sciences, fields that are federally funded by a separate agency (the National Institutes of Health rather than the National Science Foundation) and in which women are more equally represented.
2
expectancy-value model argues that students are drawn to fields that seem to fit both their
abilities and their values, or what they think is important in life.
These broad ideas have specific implications for women’s perceived fit in STEM.
Gottfredson (1981) argued that as early as kindergarten, students become less likely to consider
jobs typically associated with the other gender. Indeed, adolescent girls report feeling less similar
to typical science students than young boys do, and this self-science discrepancy partially
explains girls’ weaker interest in those careers (Lee, 1998; see also Cheryan & Plaut, 2010).
Recent work also suggests that women’s interest in STEM is eroded by a perceived mismatch
between STEM careers and communal values (Diekman, Brown, Johnston, & Clark, 2010;
Diekman, Clark, Johnston, Brown, & Steinberg, 2011). Girls may also show less interest in math
than boys because they feel less talented at it (Eccles, 1994; Davis-Kean, & Eccles, 2006;
Wigfield, Eccles, Mac Iver, Reuman, & Midgley, 1991).
That girls feel less talented than boys in math is unsurprising given the prevalent
stereotype asserting that very idea (e.g., Nosek et al., 2009). Research on stereotype threat shows
that reminders of this ability stereotype can harm women’s performance in math (e.g., Spencer,
Steele, & Quinn, 1999), engineering (Logel et al., 2009), and science (Miyake et al., 2010). This
occurs whether the reminders are blatant (e.g., being told that men tend to perform better than
women in math [Spencer et al., 1999] or interacting with a sexist man [Logel et al., 2009]) or
more subtle (being the only woman in a group of men [Sekaquaptewa & Thompson, 2003] or
simply reporting one’s gender before a calculus test [Danaher & Crandall, 2008]). Even though
threat can affect women who do not actually endorse this belief (e.g., Huguet & Régner, 2009;
Kiefer & Sekaquaptewa, 2007b), the stereotype is reflected in men’s and women’s assessments
of their own abilities. Boys report feeling more competent than girls do in math (Else-Quest,
3
Hyde, & Linn, 2010) and science (DeWitt et al., 2011). Further, women tend to underestimate
and men to overestimate their math ability (Correll, 2001), which has direct implications for the
likelihood of selecting quantitative high school classes (Simpkins et al., 2006) and college
majors (Correll, 2001).
However, girls and women’s lower participation in STEM fields is not fully explained by
beliefs about ability. This is especially apparent in light of their rapid advances in math and
science achievement: the most recent meta-analyses find essentially no gender difference in U.S.
students’ standardized test scores (Hyde, Lindberg, Linn, Ellis, & Williams, 2008; Lindberg,
Hyde, Petersen, & Linn, 2010). Beyond stereotypes about ability, girls must also contend with a
larger “double bind” that pits academic or professional success against traditional femininity.
Essentially, women who portray masculine qualities—including those deemed necessary for
success in traditionally masculine spaces— are expected to compensate for their transgression by
also displaying feminine features, even though those features may be regarded as incompatible
with masculine success. Matina Horner (1969; 1989) asserted that “a bright woman is caught in a
double bind,” meaning a woman viewed as intelligent or accomplished risked being viewed as
insufficiently feminine. In research from the 1990s, young girls echoed this sentiment, speaking
of the trade-off between being smart and social, and between being high-achieving and nice
(Bell, 1996; Roberts & Petersen, 1992). Agentic female leaders’ competence is met with
punishment for an assumed lack of warmth (Eagly, 2007; Heilman & Okimoto, 2007; Heilman,
Wallen, Fuchs, & Tamkins, 2004; Phelan & Rudman, 2010; Rudman & Glick, 2001). A double
bind is essentially a “no-win situation” (Bateson, Jackson, Haley, & Weakland, 1963).
Women in male-dominated STEM fields face a similar double bind, as success in STEM
is perceived as incompatible with femininity. What exactly does it mean, however, to have one’s
4
femininity questioned? Femininity can be thought of as a set of personality traits, gender roles,
and appearance standards that solidify one’s identity as a woman—in part by distinguishing
women from men (Cole & Zucker, 2007; Mahalik et al., 2005; Twenge, 1999). Research
identifies points of incompatibility between STEM success and each of these three facets.
Several of the classic double binds shared earlier implicate feminine traits: a successful
woman runs the risk of seeming insufficiently social, nice, and warm. These are examples of
expressive or communal traits (Bem, 1974), which characterize the ideal female personality:
sensitive, nurturing, and kind (Rudman & Glick, 2001). Women who succeed in STEM are
assumed to be lower in these traits than women who succeed in more traditional domains. For
instance, college students rate female engineers as having fewer expressive/feminine traits
(including kindness, gentleness, nurturance, warmth, and intentions to marry or have children)
than female nurses (Yoder & Schleicher, 1996). Middle schoolers describe the “typical” physics
student (whether described as male or female) as having fewer feminine traits than the “typical”
music student (Kessels, 2005). Computer scientists are stereotyped as lacking the feminine trait
of sociability (Cheryan, Siy, Vichayapai, Drury & Kim, 2011; Faulkner, 2009). After reading
real mission statements for engineering schools and liberal arts colleges, university participants
imagined engineering students to be less feminine (e.g., soft spoken, eager to soothe feelings)
and more masculine (e.g., dominant, forceful) than liberal arts students (de Pillis & de Pillis,
2008). These person perceptions extend to perceptions of entire fields. Compared to female
stereotypic careers (including nurses, social workers, and teachers), careers in STEM (engineers,
computer scientists, and environmental scientists) are rated less likely to satisfy the communal
goals of intimacy, affiliation, and altruism (Diekman et al., 2010).

5
In addition to traits, femininity is characterized by adherence to traditional gender roles.
One such role calls for investment in heterosexual romantic relationships (Mahalik et al., 2005).
However, research suggests that college women view math-related goals as impediments to
romance-related goals (Park, Young, Troisi, & Pinkus, 2011), suggesting a point of conflict
between this role and STEM success. Another feminine role involves dedication to children and
home over paid work (Mahalik et al., 2005). Indeed, women consistently spend more time on
household duties than men, regardless of their relative income or work hours (Bittman, England,
Sayer, Folbre, & Matheson, 2003; Maume, 2006), and women working in science, engineering,
and technology corporations report that these duties conflict with long hours in the lab (Frome,
Alfeld, Eccles, & Barber, 2006; Hewlett et al., 2008). Ceci, Williams, and Barnett (2009) review
survey research that echoes this reported conflict from women in the field. Of note, economist
Jennifer Hunt (2010) finds that inadequate pay and promotion opportunities offer a much more
robust explanation for why more women than men leave engineering careers, as well as non-
STEM male-dominated vocations. Nevertheless, there is evidence that STEM careers are thought
to make romance or childrearing difficult.
Finally, femininity is defined by appearance, including clothing (such as dresses, skirts,
soft lines, and pale colors), styled hair, and makeup that prioritize frippery and fashion over
function and that show effortful dedication to marking oneself as female (Forsythe, Drake, &
Cox, 1985; Mahalik et al., 2006; Moore, 2006). Women’s success in STEM is also presumed to
carry a cost in feminine appearance. In my own work, female college students described women
who are good at math with more unfeminine physical features (e.g., unkempt hair, unstylish
clothing) and fewer feminine physical features (e.g., styled hair, make-up) than women who are
bad at math (Betz & Sekaquaptewa, 2011). Wearing make-up has been rated incompatible with

6
math success (although fashion consciousness was not; Pronin, Steele, & Ross, 2004). Some
women in science, technology, and engineering professions report eschewing makeup and
feminine clothing in order to be taken seriously and to avoid harassment in the workplace
(Hewlett et al., 2008; Faulkner, 2009). Jorgenson (2002) and Faulkner (2009) both observed that
by drawing attention to their gender, women would undermine their status as engineers.
Popular Images of Women in STEM: The Unfeminine and the Defiantly Feminine
Whether assessing traits, roles, or appearance, evidence abounds that women in STEM
are stereotyped as unfeminine. Where do these images come from? The sheer lack of women in
STEM fields may reinforce their male stereotypicality, heightening the perception that women
who do succeed in them must be lacking in femininity (e.g., Heilman & Okimoto, 2007). The
male-STEM association emerges frequently in real life situations, including advertisements
marketing science kits to boys rather than girls (Halim & Ruble, 2010), pictures of men
populating college science department websites (Cundiff, Matsick, & Vescio, 2011), and high-
level math classes disproportionately populated by men (AAUW, 2010). The media features
female scientists less frequently than male scientists. In the 1990s, more male than female
scientists were featured in The New York Times’ Science section, and two thirds of scientist
protagonists in popular films were male (reviewed in Steinke, 2012). In an analysis of twelve
popular television shows watched by adolescents, just 30% of scientist characters were female
(the proportion jumped to 42% when 2 NSF-funded shows were included; Long et al., 2010). It
is no wonder that in a national survey run by L’Oreal’s “For Women in Science” campaign, 65%
of adult respondents could not name a single female scientist (PR Newswire, 2009).
Over time, popular film may have reinforced the stereotype women in science are
unfeminine. Eva Flicker (2003; 2007) argues that between 1929 and 2004, female scientists in

7
film fell into seven archetypal categories, several of which portrayed an incompatibility between
femininity and scientific competence. For instance, the “old maid” and the “male woman/gruff
women’s libber” archetypes are scientifically competent but unemotional, uninterested in
romance, and explicitly unattractive (albeit by Hollywood standards, which may just mean
glasses and shapeless clothing). The “naïve expert” and “daughter/assistant” are sweet and
attractive, yet gullible and emotional, and thus incompetent. They are also subordinate to men,
whether in their jobs on screen or in their role in the film narrative. The “lonely heroine,”
characteristic of films in the 90s, sacrifices meaningful relationships for her scientific success.
However, recent images of female scientists are more feminine than those of the past
(Steinke, 2012). Flicker (2003) argues that the “lonely heroine” of 90s cinema is more
conventionally attractive than the “old maid” of the 50s or the “gruff women’s libber” of the 70s.
Yet, she is also more competent than the “naïve expert” or the “daughter/assistant.” Steinke
(2012) notes female scientists in films from the 1990s onward are younger, cooler, and more
romantically involved than those in older films, and that male and female scientist characters are
shown as generally equal in competence and status. This move towards an image of women in
science that is no longer incompatible with femininity can also be seen off screen in Faulkner’s
(2009) interviews with female engineers. Faulkner asserted that in comparison to other women
interviewed a decade earlier, her subjects actually disagreed that success had to come at the
expense of their femininity.
Implications of Feminine Women in Science
Do these trends reflect a resolution to the double bind, a sense that women can indeed be
successful in masculine fields without having their femininity challenged? Or do they reflect yet
more prescriptive stereotyping, still greater demands on the way women should be? Steinke

8
(2005) has also noted a rise in overt objectification of female scientist characters on film and
“makeovers” that transformed the scientists from nerds into sexy women. The “lonely heroine”
has been replaced by the “clever, digital beauty” of the early 2000s (the primary example being
technologically-skilled archaeologist Lara Croft of the Tomb Raider franchise; Flicker, 2007).
This is an archetype that is not just attractive but hyper-sexualized and objectified. The female
forensic scientists on popular crime series CSI are also frequently objectified (Kleminski, 2006).
Off camera, Faulkner (2009) describes a “delicate juggling act” in her subjects’
negotiation of professional and feminine identity, an effort to approach feminine “girls with
nails” without being deemed “too girly’” (p. 181). She observes “a tension between two gender
messages: one which says, ‘To be a woman engineer is to be somewhat less conventionally
feminine, or more masculine, than most women’; the other which says, ‘To be a ‘‘real
woman’’…one must conform to stereotypical understandings of femininity.’” (Faulkner, 2009, p.
181). The apparent need to assert that women in STEM are indeed “real women” is evident in
newspapers and magazines’ coverage of female scientists, emphasizing how they play a
supporting role to men; their happiness in domesticity, marriage and motherhood; and their
bodies, hair, clothing, and age (reviewed in Steinke, 2012). It seems that this feminine image is
presented not as an additional option for women in STEM, but actually the prescribed and
preferred option.
Some real women in math and science have even used these overtly feminine images as a
potential recruitment strategy for young girls. 2010 saw the release of pink-laptop-toting
Computer Engineer Barbie, co-designed by the Society of Women Engineers with the goal of
helping girls see computer science as cool (Mattel.com, n.d.). “Dr. Erika” is a former Miss
Massachusetts pageant winner and an MIT-trained biochemist who does science experiments
9
while wearing her tiara on her own cable access show. Mathematician and actress Danica
McKellar (e.g., 2007) has written four popular press books telling girls why math is cool in
pointedly girly ways: algebra is helpful for baking, and figuring out sales while shopping, for
instance. Most recently came “Science: It’s a Girl Thing,” a campaign aimed at teenage girls
launched by the European Union’s Commission for Research and Innovation (Revkin, 2012).
The campaign made headlines when it released a video featuring three young women in skirts
and high heels, dancing and giggling as images of test tubes and petri dishes were intercut with
lipstick and makeup compacts.
Changing the Face of a Field
So what is the impact of a sexy scientist, a feminine mathematician, or an engineer with
painted nails? On the one hand, they may change people’s prototypic visions of what women in
STEM can be like, or look like. Counterstereotypic figures in general can have wonderful effects
by changing people’s notions about who will succeed in a given field, thus giving students a
wider array of options that they could potentially see themselves in. Powerful female faculty can
shatter college women’s stereotypes about men making better leaders (Dasgupta & Asgari,
2004). Successful women in math (Marx & Roman, 2002) and engineering (Stout, Dasgupta,
Hunsinger, & McManus, 2012) counter stereotypes about ability, thus encouraging attempts to
emulate those women: female students report greater motivation and even perform better in the
fields where the role models succeed.
Although past research has not explicitly attempted to “make STEM feminine,” it has
catalogued what happens when STEM is made to seem compatible with feminine traits, gender
roles, and even appearance. Reading about a scientist behaving communally in the course of her
day increased women’s interest in science careers (Diekman et al., 2011). Women in STEM
10
corporations report wanting a mentor who balances career and family, thus fulfilling the family-
centered feminine gender role (Hewlett et al., 2008). Computerized role models who were
dressed in a “cool” way (thus perhaps countering appearance stereotypes) and who emphasized
socially helpful aspects of engineering (thus emphasizing the communal nature of science, and
perhaps even engineers’ social skill) increased high school girls’ interest in engineering careers
(Plant, Baylor, Doerr, & Rosenberg-Kima, 2009). Even those sexy CSI scientists can expand
students’ prototypic scientist image (Jones & Bangert, 2006).
It seems that a counterstereotypically feminine woman in STEM could have encouraging
impacts on female students’ own aspirations. Some, like the Society of Women Engineers or
Danica McKellar, may hope so. However, the literature on role models should also make us wary
of this strategy. Role models are defined by their ability to inspire, to serve as figures that others
look to in the hope of achieving similar success. To be inspiring, however, the role model’s
success must seem plausible and attainable (Lockwood & Kunda, 1997). Role models that
display success that feels impossible for others to achieve are actually threatening rather than
motivational (Hoyt, 2012). Women who excel in a counterstereotypic field while still meeting a
stereotypic feminine ideal—simultaneously fulfilling contradictory roles—may not seem
attainable. Thus, rather than inspiring assimilation to her scientific prowess, she may inspire
contrast in the form of weakened self-concepts and future goals in STEM.
The move towards highlighting feminine women in STEM may be intended to show girls
an alternative to the predominant unfeminine image. However, given the prescriptive nature of
female stereotypes, feminine STEM role models may instead signal that girls should be both
feminine and talented in male-stereotyped fields. The command to combine two seemingly
incompatible things, to defeat the double bind, might seem unattainable, making contrast effects

11
more likely. Thus, adding a stereotypically feminine sheen to a female STEM role model could
undercut her motivating power, or even cause it to backfire.
Present Aim
The aim of this dissertation is to understand the effects of feminine STEM role models. It
attempts this by using a variety of role model manipulations aimed at two developmentally
different populations. Although evidence suggests benefits of counterstereotypic role models,
and even benefits from highlighting the femininity of STEM, it is possible that the pairing of
overt femininity and STEM success may not effectively motivate female students. Studies 1a and
1b look at role model effects for middle school girls, comparing the effectiveness of feminine as
compared to gender-neutral role models succeeding in either STEM or in school more generally.
Study 2 extends the paradigm to college women, a population that may view femininity, STEM
success, or their combination somewhat differently. Study 3 improves on Study 2’s stimuli and
assesses how individual differences in feminine appearance endorsement, explicit unfeminine-
STEM stereotypes, and implicit unfeminine-STEM associations may moderate the impact of role
models.
12
CHAPTER II
Study 1a: Feminine STEM Role Models and Middle School Girls
Studies 1a and 1b address middle school girls’ response to different kinds of academic
role models, varying in femininity as well as domain of success. This sample was selected
because they are at a unique stage of development in their academic identities as well as their
gender identities. At this time, girls really begin to question their math abilities relative to boys’
(Pajares, 2005; Wigfield et al., 1991), perhaps because the middle school climate encourages
social comparison (Good & Aronson, 2008; Tracey, 2001). At around age of twelve, students are
sensitive to comparison and aware that others may to view them through a stereotyped lens
(Good & Aronson, 2008). Some suggest that this is the age when students first become
susceptible to stereotype threat (Good & Aronson, 2008; Huguet & Régner, 2007; Muzzatti &
Agnoli, 2007), although some evidence points to threat effects emerging as early as kindergarten
(Ambady, Shih, Kim, & Pittinsky, 2001). Others’ stereotypes affect students’ own expectations
and goals for future academic success (Oyserman & Fryberg, 2006). Indeed, by the 8th grade,
girls’ weaker math self-confidence predicts worse grades (Correll, 2001) and less math and
science participation down the road (Simpkins et al., 2006). No wonder this young population is
so often targeted for STEM intervention and recruitment, both by social scientists and
practitioners in the field.
Of relevance to the particular impact of an “unfeminine” stereotype, middle school also
brings heightened pressure to conform to gender norms. “Gender intensification” at this age
makes acting appropriately for one’s gender feel even more important (Hill & Lynch, 1983;
13
Wigfield et al., 2001). This means not just liking things that girls are supposed to like, including
certain school subjects (Frome & Eccles, 1998), but also being nice, social, modest, and
attractive (Bell, 2009; Tolman, Impett, Tracy, & Michael, 2006; Sengupta, 2006). The stereotype
that people in math and science lack feminine traits like sociality or that women in science look
unfeminine may make these paths seem particularly off-putting.
Given the potential drawbacks of STEM’s unfeminine image, the impulse to counter it
with feminine STEM role models seems to make sense. And yet, other research suggests that this
strategy may backfire. As discussed, role models who display unattainable success should make
people feel less motivated (Lockwood & Kunda, 1997). Middle school girls have already
reported feeling that scientists wouldn’t make good role models because they are “too good” and
“too smart” (Buck, Plano Clark, Leslie-Pelecky, Lu, & Cerda-Lizarraga, 2007). Adding
femininity to the equation may be even more daunting, particularly for young girls. Their
stereotypes about gender are rigid (Halim & Ruble, 2010) and gender conformity is paramount
(Hill & Lynch, 1983), so a woman succeeding in a masculine field while remaining feminine
may seem quite unlikely. It is possible that young girls may see a feminine STEM role model as
“too good” to be motivating. As a result, they may feel that their own abilities in a similar
domain pale in comparison (Lockwood & Kunda, 1997).
However, feminine STEM role models may have different effects on different kinds of
girls. Whereas all girls may feel a bit worse about themselves in comparison to a superstar,
expectations for the future may fare differently. Girls who like STEM may feel more capable
than STEM-disinterested girls of one day attaining the STEM success of even very feminine
scientists, given their better grades (Simpkins et al., 2006) and higher expectations for
themselves in these fields (Oyserman & Fryberg, 2006). Upward social comparisons can be more

14
damaging to current self-views than expected future success (Kemmelmeier & Oyserman, 2001).
Thus, for these girls, current self-evaluations may suffer, but future plans in math may be
protected. In contrast, students who already dislike STEM may react the worst to feminine
STEM role models. These students may already have a hard time imagining themselves
succeeding in STEM in the future, as students who perform poorly in school find it more
difficult than those performing well to imagine getting good grades in the future (Oyserman &
Fryberg, 2006). Exposure to a role model who combines this feat with idealized femininity may
further depress expectations of attaining similar success in the future.
Study 1a tested two predictions. First, current self-ratings of math interest, ability and
short-term success expectancies (Simpkins et al., 2006) were expected to decrease for all girls
who viewed feminine STEM role models. Second, girls who disliked STEM at the outset were
expected to report weaker future plans to study math following exposure to feminine STEM role
models. In contrast, role models were not expected to affect math plans among girls who already
liked STEM (whose math plans may have been stronger to begin with). To test these predictions,
middle school girls viewed feminine STEM role models, STEM role models who were more
gender-neutral, and feminine and gender-neutral role models succeeding in general academics
but not STEM in particular. Because overall school success is not as likely to be branded
“unfeminine,” these general school role models should not harm math outcomes even if they are
feminine. The inclusion of this comparison group was designed to counter the possibility that
negative outcomes of feminine STEM role models were driven solely by feminine cues (Steele &
Ambady, 2006). Instead, such outcomes would speak to the unique implications of combining
feminine characteristics with success in an unfeminine field.
Method
15
Participants. One hundred ninety three girls in the sixth (n = 92) and seventh grade (n =
52) participated in exchange for a science magazine and an entry in a $100 raffle. Fourteen
participants quit the study before completing the first attitude scale, 33 participants failed to
answer the manipulation check properly, and two participants scored three standard deviations
below the mean on the first attitude scale, leaving 144 participants in the final analysis (75 White
or Middle Eastern, 19 Black, 15 Asian, 5 Hispanic, 15 other (e.g., “American”) or multiracial, 15
chose not to report; Mage = 11.56, SD = .67). Chi-square analyses revealed that dropped
participants were not proportionately different in their liking for STEM (!2(1, N = 193) = 0.15, p
= .70) or their assigned condition (!2(3, N = 193) = 1.81, p = .61). In exchange for participation,
students received a youth magazine and an entry into a $100 lottery.
Materials.
STEM Liking. Participants read a list of school subjects (English, Foreign Language,
Math, Music, Physical Education, Science, Social Studies, “other”) and were asked to indicate up
to three of their favorites. Seventy-eight participants (54.5%) selected math, science, and/or a
STEM-related “other” class (e.g., “technology”). These students were coded as liking STEM.
Those that did not select any math, science, or technology classes were coded as disliking
STEM.
Role Models. Participants read one of four magazine-type interviews. Each magazine
contained three pages, with each page containing one interview and an accompanying
photograph of the interview subject. The women in the photographs were the same across
conditions, but their appearance and the content of the interview was systematically varied to

16
manipulate role model femininity and domain of success.2 Role model femininity was
manipulated by what the women were wearing, the cues in the background of their photographs,
and some information about their preferred leisure activities. Feminine role models wore pink or
pastel-colored clothing and make-up, and were pictured with cues like a pink photo album and a
dorm-style bed covered in decorative pillows (in keeping with a traditional feminine emphasis on
one’s personal appearance and the appearance of one’s home; Cole & Zucker, 2007). They were
also described as having hobbies like dance and yoga, reading fashion magazines and romance
novels, and watching the television shows Gossip Girl and Grey’s Anatomy with friends.
Gender-neutral role models wore clothing that was darker colored and less fashionable, less or
no make-up, and glasses; they were pictured with neutral cues like an office calendar and a
dorm-style bed with regular twin pillows; and they were given hobbies like working out, reading,
and watching her favorite TV shows every week (hobbies seen as gender-neutral; Athenstaedt,
Mikula, & Bredt, 2009).
STEM role models were described as succeeding in chemistry, math, and engineering
(e.g., introduced as an “engineering star,” received praise from a chemistry professor, discussed
having attained a summer research position in math). General school role models had almost
identical descriptions, but references to those three fields were removed (e.g., introduced as a
“freshman star,” received praise from a professor, discussed having attained a summer research
position). Following role model literature, role models were designed to appear similar to
2 Feminine and gender-neutral photos were pretested by 29 college participants. Each participant viewed eight photographs (role model 1 in three different poses, role model 2 in three different poses, and role model 3 in two different poses), in which the role models were dressed in a gender-neutral way, a feminine way, or a feminine way with glasses. The photographs were always paired with the appropriate feminine or gender-neutral STEM interview. From this pretest, one photo of each role model in feminine dress and one photo of each role model in gender-neutral dress was chosen. The photos selected were rated as equally competent in math across condition (p = .41), but more feminine in the feminine condition (p < .001).
17
participants (i.e., they were all the same gender as the participants; they represented three
different races [White, Black, and South Asian] so that different girls could potentially find a
race or ethnicity connection; they attended the local university) and to portray attainable success
(i.e., they were college-aged so that younger girls could perceive sufficient time to achieve
similar success; they emphasized hard work rather than inborn skill in discussing their road to
success; Lockwood & Kunda, 1997). See Appendix A for feminine STEM and gender-neutral
school role model stimuli.
Manipulation check. Participants answered open-ended memory questions about the role
models’ names, majors, and hobbies in order to check for attention to the femininity and domain
manipulations.
Role model ratings. Participants used 7-point scales (1 = not at all, 7 = very much so) to
evaluate the role model on four positive attributes (smart, hardworking, likable, friendly), which
were averaged into a measure of positivity (! = .87). They also rated how similar the role model
seemed to themselves.
Current self-ratings. Participants used seven-point scales to answer twelve items about
their current math self-concept (e.g., “How good at math are you?”), interest (e.g., “Compared to
most of your other activities, how much do you like math”), and the importance of math (e.g.,
“In general, how useful is what you learn in math?”; Simpkins et al., 2006).3 Scale anchors
varied by item, but higher values always indicated higher ratings of self-concept, interest, and
3 Three additional items measured perceived difficulty of math (e.g., “In general, how hard is math for you?”; Frome & Eccles, 1998). High internal reliability is maintained when these items are reverse scored and averaged with the other math self-ratings (! = .88), and the 2x2x2 ANOVA yields identical pattern of main effects and interactions. However, Study 1 results are presented with only the twelve-item composite because the difficulty items were omitted form Studies 2 and 3. This allows easier comparisons of findings across studies.
18
importance. The twelve items were internally reliable (! = .89) and thus averaged into a single
measure of current math self-ratings.
Future plans. Girls then answered two items by using a seven-point scale to rate their
likelihood of taking math in high school and math in college, from 1 (not at all) to 7 (very much
so). These items were correlated (r = .56, p < .001) and combined into a single “future math
plans” measure.
Participants used the same scale to rate their likelihood of taking high school science
classes, taking high school English classes, and attending college. See Appendix B for all self-
rating and future plan outcome measures.
Procedure.
Students whose parents had previously consented to their participation took part in the
study on classroom laptops during their regular math class. Participants first reported STEM
liking, then read one of four possible role model interviews. This yielded a 2 (STEM vs. general
school) x 2 (feminine vs. gender neutral) x 2 (participant STEM-liking vs. disliking) design.
Participants then completed the manipulation check and rated the role models reported their
current self-evaluations and future plans, and were debriefed and compensated.
Results
Manipulation check. Open-ended responses were coded to determine whether
participants could correctly identify at least the major and hobby (as these were how domain and
femininity were manipulated) of at least two of the three role models (to ensure that they had
paid attention for more than one role model). Thirty-three participants failed this manipulation
check and were removed from analysis.
Role model ratings.

19
Positivity. A 2x2x2 factorial ANOVA revealed no differences on overall positivity
ratings of the role models based on role model femininity, role model domain, or STEM liking
(all Fs < 1, all ps > .40). See Table 1 for all means and standard deviations.
Similarity. The same analysis revealed no significant differences on perceived similarity,
with the effect closest to marginal significance being higher perceived similarity among girls
who liked STEM (M = 4.86, SD = 1.56) compared to girls who disliked STEM (M = 4.4, SD =
1.6, F(1,134) = 2.70, p = .103, d = .28). All other Fs were less than 1.9, and all ps were greater
than .17. See Table 1 for all means and standard deviations.
Current self-ratings. A 2x2x2 factorial ANOVA revealed an effect of role model
femininity (F(1,136) = 11.64, p = .001), which was qualified by the predicted two-way
interaction with role model domain (F(1,136) = 7.81, p < .01, d = .48). Simple effect analyses
revealed that the effect of femininity was significant only in the STEM role model condition
(F(1,141) = 17.05, p < .001, d = .70), such that feminine STEM role models yielded lower
current math self-ratings (M = 4.65, SD = 1.01) than gender-neutral STEM role models (M =
5.40, SD = .66). Current self-ratings did not differ between feminine (M = 5.08, SD = .89) and
gender-neutral school role model conditions (M = 5.20, SD = .69, F < .01, p = .97, d = .02). In
addition, within the feminine condition, STEM role models yielded lower math self-concept
ratings than school role models (F(1,141) = 7.19, p < .01, d = .45). STEM role models did not
differ from school role models in the gender-neutral condition (F(1,141) = 2.52, p = .12, d = .27).
See Figure 1. A significant effect of STEM-liking also emerged (F(1, 136) = 16.15, p < .001, d =
.70), such that girls who liked STEM reported higher math self-ratings (M = 5.49, SD = .92) than
girls who disliked STEM (M = 4.96, SD = .91). No other main effects or interactions emerged on
math self-ratings (all Fs < .72, all ps > .40).
20
Future plans.
Math plans. A factorial ANCOVA, including likelihood of attending college as a
significant covariate (F(1,128) = 4.21, p = .04, d = .36), revealed a significant effect of
femininity (F(1,128) = 5.90, p < .02, d = .43), a marginal effect of domain, (F(1,128) = 3.29, p =
.07, d = .32), a significant 2-way interaction between role model femininity and domain
(F(1,128) = 3.96, p = .05, d = .35), and a significant effect of STEM liking (F(1,128) = 25.70, p
< .001, d = .90). These were all qualified by the expected three-way interaction (F(1,128) = 9.21,
p < .01, d = .54).
A simple interaction analyses revealed that the role model domain by femininity
interaction was significant among girls who did not report liking STEM (F(1,133) = 10.23, p <
.01, d = .55), but not among girls who liked STEM (F = .19, p = .66, d = .08). Simple effects
analyses revealed that among girls who disliked STEM, feminine STEM role models (M = 3.94,
SD = 1.22) yielded weaker self-reported likelihood of taking math in high school and college
relative to gender-neutral STEM role models (M = 5.61, SD = 1.04, F(1,131) = 11.14, p = .001, d
= .58). For girls who liked STEM, this simple effect was not significant (F = .05, p = .83).
Future plans did not differ between feminine and gender-neutral school role models for either
type of participant (Fdislike = 1.15, p = .29, d = .19; Flike =.77, p = .38, d = .15). See Figure 2.
Future math plans and current self-ratings correlated at r = .53 (p < .001). See Table 2 for
all bivariate correlations among role model ratings and outcome variables.
Science plans. A 2x2x2 ANOVA revealed that plans to take high school science classes
were unaffected by role model type, although girls who reported liking STEM reported
marginally stronger plans (M = 5.78, SD = 1.54) than girls who did not report liking STEM (M =
5.30, SD = 1.52, F(1,127) = 2.77, p < .10, d = .30; all other Fs < 1.17, ps > .28). The fact that
21
different outcomes emerged for math plans compared to science plans fits with past work on
STEM-related interests at this age (Simpkins et al., 2006), perhaps because of girls’ greater
interest in life compared to physical sciences.
English plans. A 2x2x2 ANOVA revealed that plans to take high school English classes
(a field lacking negative female stereotypes) showed no effect of role model or STEM liking (all
Fs < 1.18, all ps > .28).
Discussion
In keeping with predictions, feminine STEM role models decreased middle school girls’
current self-ratings in math relative to gender-neutral STEM role models. Feminine STEM role
models also weakened future plans to study math only among girls who disliked STEM.
Femininity did not moderate the impact of general school role models on math self-ratings or
future plans, suggesting that mere feminine cues were not wholly responsible for the observed
decrease (Steele & Ambady, 2006). Rather, the unique combination of femininity and STEM
success was most likely to yield a pattern of contrast away from the role models’ domain of
success, in the form of reduced math self-ratings and aspirations.
Although role models may be demotivating if people do not feel sufficiently similar to
them (Cheryan et al., 2011), girls did not feel less similar to the feminine STEM role models,
which yielded the most negative effects. In fact, despite what may be predicted by theories of
gender intensification, girls felt equally similar to all role models. This argues against the lay
notion that girls will connect better with “feminine” women.
The negative effects in this study were argued to be related to the relative incompatibility
of STEM and femininity making such role models seem less attainable, rather than less similar to
girls. Further, the prediction that girls who disliked STEM would feel least motivated by

22
feminine STEM role models reflects the assumption that the combination of these seemingly
incompatible features would seem most daunting to students who may already feel unlikely to
attain STEM success. However, Study 1a did not directly assess how attainable students felt each
kind of role model’s success actually was. Therefore, Study 1b tests the assertion that
participants’ STEM-liking would determine whether succeeding in STEM while meeting a
feminine ideal seemed achievable.
23
CHAPTER III
Study 1b: Attainability of Feminine STEM Role Models
Girls who dislike STEM may view feminine STEM role models as particularly
unattainable for a number of reasons. Students’ “future selves” are strongly related to their
present self-conceptions (Oyserman & Fryberg, 2006). Girls who currently dislike STEM may
not picture themselves pursuing STEM in the future, making STEM role models’ academic
success feel less personally attainable than it might for girls who currently like STEM. In
addition, people figure out how likely a given event is by comparing it to their pre-existing
mental representations. This judgmental bias, known as the representativeness heuristic
(Kahneman & Tversky, 1973), makes unfamiliar or unimagined outcomes feel less likely than
those that we already hold in our minds. Due to the relative incompatibility of femininity and
STEM success, the image of a feminine woman in STEM may be relatively unlikely to exist in
students’ minds, and so may feel unlikely to occur. It might feel even less likely for girls who
dislike STEM, who may already not expect success in these fields. Study 1b directly assesses
how students with different levels of STEM interest assess how likely it is that they could
combine academic STEM success with femininity. Specifically, girls who liked and disliked
STEM rated how attainable this combination of features seemed in feminine compared to
gender-neutral STEM role models.
Method
Participants. Forty-five girls participated in the summer before they entered the sixth (n
= 25), seventh (n = 9), eighth (n = 2) or ninth (n = 1) grade. The same manipulation check used
24
in Study 1a was used in Study 1b. The same girls who failed the manipulation check also failed
to fill out the dependent variable, leaving a final sample of forty-two girls (21 White or Middle
Eastern, four Asian, three Black, eight other or multiracial, and six chose not to report; Mage =
11.38, SD = .83). They participated in exchange for a youth magazine or a package of “Silly
Bandz,” a children’s bracelet that was popular at the time of data collection.
Materials.
STEM liking. As in Study 1a, participants reported their three favorite school subjects,
and 19 participants (45.2%) were coded as liking STEM.
Role models. The feminine and gender-neutral STEM role model stimuli from Study 1a
were reused in Study 1b. This yielded a 2 (STEM-liking) x 2 (STEM role model femininity)
design.
Attainability rating. Participants used a seven-point scale (1 = not at all likely, 7 = very
likely) to rate their likelihood of one day emulating their assigned role models’ success (i.e.,
“How likely do you think it is that you could be both as successful in math/science AND as
feminine or girly as these students by the end of high school?”).
Procedure. The children participated on paper surveys either in their math classrooms or
in a public park during an outdoor art festival. They reported STEM liking, then read one of two
role model interviews, then rated the role model’s attainability and provided demographic
information.
Results
A 2x2 ANOVA on attainability ratings revealed a significant interaction between STEM-
liking and role model femininity (F(1,38) = 5.31, p = .03, d = .75). A simple effect analysis
found that girls who disliked STEM felt significantly less likely to achieve the feminine role

25
models’ combination of femininity and STEM success by the end of high school (M = 4.08, SD =
1.73) compared to gender-neutral role models (M = 5.45, SD = 1.64; F(1,39) = 4.15, p = .05, d =
.65). Likelihood ratings among girls who liked STEM did not differ by role model femininity
(Mgender-neutral = 4.37, SD = 1.69; Mfeminine = 5.36, SD = 1.5, F(1,39) = 1.81, p = .19, d = .43).
Additionally, girls who disliked STEM felt marginally less likely to emulate feminine role
models compared to girls who liked STEM (F(1,39) = 3.63, p = .06, d = .61). STEM-liking
yielded nonsignificant effects in the gender-neutral condition (F(1,39) = 2.21, p = .15, d = .48).
See Figure 3.
Discussion
For girls who disliked STEM, the success of a feminine STEM superstar felt less
attainable than that of a gender-neutral STEM superstar. This outcome fits with work on the
representativeness heuristic as well as future selves research. When girls who disliked STEM,
and likely held weaker math-related future selves, compared themselves to an uncommonly
feminine woman in STEM, they discounted their own likelihood of achieving comparable
success in these two domains.
Studies 1a and 1b offer initial evidence that feminine STEM role models may demotivate
rather than inspire young girls, encouraging contrast away from the role model’s field of success
rather than assimilation towards it (Hoyt, 2012). Study 1a showed that girls who disliked
STEM—and might benefit most from piqued interest in these fields—responded most
negatively. Study 1b suggested that their response was related to the perceived unlikelihood of
combining femininity and STEM success. Research on future selves (as well as STEM-liking
effects seen in Study 1a) already implies that girls who dislike math and science may not picture
26
themselves in these fields; the current findings suggest that adding femininity to the equation
may further impede the formation of such future selves.
Despite these contributions, some important limitations remain. First, role model effects
and attainability ratings were not collected in the same study, making it impossible to directly
test how they impacted one another. Second, the possibility has been raised that girls reported
weaker math self-ratings and fewer math plans because the role model encouraged contrast
effects. However, participants in Study 1 did not have the opportunity to boost themselves in
another domain where the successful role model may have seemed less threatening – for
instance, by assessing their skills in humanities classes. Finally, the findings of Studies 1a and 1b
are limited to a middle school population. Study 2 addresses all of these limitations by asking
college participants to read about feminine or gender-neutral role models in STEM or
humanities, to rate the perceived attainability of these role models’ success, and then to report
academic self-ratings and future plans in both STEM and humanities fields.
27
CHAPTER IV
Study 2: Feminine STEM Role Models and College Women
Study 2 focuses on a college rather than a middle school sample. STEM’s unfeminine
reputation may matter for adult women’s entry into and persistence in STEM fields. For instance,
following a reminder of computer science’s “geeky” image, women but not men expected less
belonging in the major and showed less interest in it (Cheryan, Plaut, Davies, & Steele, 2009).
College women perceive math pursuits as an impediment to romance (Park et al., 2011). In one
survey of college engineering students, 80% of female respondents agreed that being seen as
unfeminine by others was a problem they faced (Hartman & Hartman, 2008). This was just one
of several perceived challenges (including feeling torn between family and career, having
insufficient role models, experiencing discrimination from teachers, and facing stereotypes about
women’s aptitude or drive), but it was the only problem that significantly predicted less
satisfaction with their major (r = -.27, p < .05; Hartman & Hartman, 2008).
Thus, as with middle school girls, there is an intuitive appeal to the idea that college
women would benefit from seeing a woman in STEM counterstereotypically maintaining her
femininity. Women succeeding in counterstereotypic ways, whether encountered in the
classroom or displayed on a computer screen (e.g., Dasgupta & Asgari, 2004; Stout et al., 2011),
can weaken stereotypes about those fields or encourage identification with them. However, the
role models’ success must still feel feasible, and just like young girls, college women may see a
feminine woman succeeding in an unfeminine field as too lofty to be inspiring. The hypotheses
tested in Study 1a could thus apply to Study 2: feminine STEM role models may demotivate
28
college students relative to gender-neutral STEM role models. This could affect current self-
ratings among all students, regardless of STEM liking. It may only harm future STEM plans
among students who dislike math and science at the outset.
However, those hypotheses required updating to better reflect Study 2’s older sample.
Adults’ stereotypes are more flexible than those held by children (Halim & Ruble, 2010). This
makes sense: compared to children, adults should have had more time to encounter the actual
diversity of women in male-dominated fields. As Faulkner (2009) noted, “actual people and
practices tend to be diverse, while people’s accounts of them are often gender dualised” (p. 184).
To an adult population, a feminine woman in STEM may not seem so unlikely and thus more
feasibly attainable. Nevertheless, a feminine STEM role model should still yield less motivation
than a gender-neutral STEM role model, as she still represents an additional achievement that
students may feel pressured to meet. However, rather than demotivating college women,
feminine STEM role models may simply fail to motivate as effectively as gender-neutral STEM
role models. In order to test whether feminine STEM role models yield demotivation or
depressed motivation, Study 2 adds a “no role model” control condition. It was expected that
gender-neutral STEM role models would increase STEM self-ratings relative to control, whereas
feminine STEM role models would not differ from control.
Because Study 2 expected positive effects from gender-neutral STEM role models
moreso than negative effects of feminine STEM role models, expectations regarding the role of
students’ STEM liking also needed to be updated. Specifically, it was possible that students who
liked STEM would show greater boosts in self-concept as well as future plans from gender-
neutral STEM role models. They might be more likely to identify with a STEM role model and
thus reap more benefits (Lockwood & Kunda, 1997; Lockwood, 2006). Study 2’s focus on
29
motivating rather than demotivating effects also highlighted the possibility that role models
would equally boost current self-ratings as well as aspirations (Hoyt & Simon, 2011). This is in
contrast to Study 1a, in which unattainable social comparisons were expected to be more widely
harmful to present self-views than to future plans (Kemmelmeier & Oyserman, 2001). Thus, it
was possible that gender-neutral STEM role models would especially benefit students who liked
STEM.
To better isolate the impact of feminine STEM role models, additional updates were
made to Study 2’s design and measurements. First, the comparison group of school role models
from Study 1a was replaced with humanities role models. Self-ratings and future plans in
humanities were also assessed. Like general school, humanities fields are not stereotyped as
unfeminine. Thus, a woman succeeding in a field like English, as opposed to a masculine STEM
field, should not be presumed to be unfeminine, even in the absence of “pink” cues (Heilman &
Okimoto, 2007). A humanities role model could boost self-ratings or future plans in humanities,
but femininity was not expected to moderate these effects. Self-ratings and future plans in
science were also assessed, and a test of math persistence was added. Gender-neutral STEM role
models were expected to yield stronger self-ratings and future plans in both math and science,
and more math persistence, relative to feminine STEM role models and relative to baseline.
Finally, to better understand how feminine STEM role models exert their effects, Study 2
asked participants to rate how attainable the role models’ success was. This allowed for a direct
test of the relationship between a role model’s perceived attainability and her impact on
academic self-ratings, a relationship only hinted at in Studies 1a and 1b. It was expected that
gender-neutral STEM role models would yield more positive math and science outcomes to the
extent that they were perceived as more attainably successful than feminine STEM role models.
30
Method
Participants. Two hundred forty-two college women (168 White, 38 Asian, 14 Black, 5
Hispanic, 15 other or multiracial, 2 did not report) participated in exchange for a half hour credit
towards their introductory psychology research requirement (n = 229) or for seven dollars (n =
13).
Materials.
STEM liking. STEM liking was assessed with four items, allowing a more nuanced
measure than was used in Studies 1a and 1b. Study 2 participants reported their college major
(28.9% reported a STEM major), and the category of major they were most likely to consider if
they were undecided. Participants then selected their three favorite high school subjects (31%
chose zero math or science subjects, 45% chose one, 23% chose two, and two participants chose
three math or science subjects). Finally, students reported any STEM-relevant academic
experiences they had taken part in at the University, including undergraduate research, living-
learning communities, and special seminars (19% reported a STEM-relevant activity). Answers
to all four questions were used to create a dichotomous “STEM liking” variable. Students were
coded as liking STEM (n = 117) if they reported a STEM major, listed 2 or more STEM classes
as their high school favorites, had participated in a STEM activity, or were undecided and
considering a STEM major.
Role models. Participants then read an article presented as an interview with a “star” UM
alumna called Jennifer. The photograph of the White interview subject from Studies 1a and 1b
was reused here, such that Jennifer either had a feminine appearance (wearing a pink shirt and
jewelry, photographed with a pink photo album in the background) or a more gender-neutral
appearance (e.g., wearing a black shirt and no jewelry, photographed with a white office calendar

31
in the background). The article accompanying Jennifer’s photograph described her as pursuing
graduate studies in either chemistry (for the STEM condition) or English (for the humanities
condition). The content of her interview was updated from Studies 1a and 1b to Study 2 to reflect
post-collegiate accomplishments so that the college participants could perceive sufficient time to
achieve similar success. The content marking her identity as feminine (enjoying dance and yoga,
reading about fashion and romance) or gender-neutral (enjoying working out and reading) was
reused from the previous studies. Because much of their content had been used in Study 1, these
new materials were not pretested. See Appendix C for feminine STEM and gender-neutral
humanities role model stimuli.
Role model ratings. After reading about the role model, participants used 7-point scales
to evaluate the role model on a series of positive attributes (smart, hardworking, organized,
likable, friendly, outgoing, ! = .82), and also how similar to themselves the role model seemed.
In an update to Study 1a, participants used the same 7-point scales to rate how successful and
feminine the role models seemed. Finally, participants rated their own likelihood of being as
successful as the role model one year after graduation and how similar they would like to be to
her at that time.
Current self-ratings. Participants answered the same twelve questions used in Study 1a
to assess self-ratings, adapted for math (! = .95), science (! = .95), and English (! = .93). These
items were appropriate for an undergraduate sample because they have been used with
participants as advanced as high school seniors (Simpkins et al., 2006).
Future plans. Participants answered two items to report their likelihood of taking future
classes in math, natural science (hereafter referred to as “science”), and humanities (hereafter
referred to as “English,” to avoid confusion with references to the humanities role model). They

32
also reported future plans for Social Science and Creative Expression (which includes writing,
art, and music classes), because together, these comprise the five course categories offered by the
University of Michigan’s College of Literature, Arts, and Sciences.4 Using a 7-point scale
ranging from 1 (disagree strongly) to 7 (agree strongly), participants first rated whether they
would consider taking classes in each category in order to fulfill graduation credits. Next they
rated whether they were looking forward to classes in required categories (i.e., science, English)
or if they would choose to take classes in the optional categories (i.e., math; rs " .62, ps # .001).
See Appendix B for all self-rating and future plan outcome measures.
Math persistence task. Participants completed the “36 game,” which tested math
persistence by asking participants to combine the digits 2, 3, and 7 in as many ways as possible
to yield a sum, product, difference, or dividend of 36 (Oyserman, Gant & Ager, 1995). Answers
were coded to yield two scores: total number of attempts, and percentage of those attempts that
were correct and original. See Appendix B for math persistence measure.
Believability. To be sure that participants did not find certain role models more plausible
than others, participants rated the believability of the role model by answering “How realistic or
believable was the woman you read about in the magazine?” on a 1 (not at all) to 7 (very much)
scale.
Procedure. Participants first answered the STEM Liking questions. The order of the next
two tasks was counterbalanced: four fifths of the participants read the role model interview and
rated the role model, then completed the outcome measures of self-ratings, future plans, and
4 Participants first wrote down the specific class they had in mind when considering each category. This was intended to assess if students thinking of male dominated science classes (e.g., physics) had different outcomes than students thinking of gender equal or female dominated science classes (e.g., biology). Analyses suggested that these students did not differ on any major outcome. This item is not further discussed.

33
math persistence. The remaining one fifth of participants acted as the control condition by
completing outcome measures, then reading the role model interview, and then rating the role
model. For all conditions, the role model interviews were then collected, and all participants
ended by rating the role model’s believability. This item came last because the role models were
always described as real students, and asking believability in the beginning may have aroused
suspicion. This yielded a 2 (STEM vs. English) x 2 (feminine vs. gender-neutral) x 2 (participant
STEM-liking vs. disliking) design, with an additional hanging control condition.
Results
Role model ratings. Analyses of role model ratings exclude participants in the control
condition because (a) completing self-evaluations first may have colored impressions of the role
models and (b) ratings chiefly matter for participants who could have been affected by the role
models. Thus, 195 participants were included in a series of 2 (role model domain) x 2 (role
model femininity) x 2 (STEM-liking) factorial ANOVAs on role model ratings. See Table 3 for
means and standard deviations for all role model ratings. See Table 4 for correlations among role
model ratings.
Feminine. As anticipated, feminine role models (M = 5.75, SD = .90) were rated more
feminine than gender-neutral (M = 4.98, SD = 1.11, F(1,187) = 30.14, p < .001, d = .80).
Unexpectedly, albeit in keeping with the stereotypes associated with each field, humanities role
models were rated more feminine (M = 5.55, SD = 1.03) than STEM role models (M = 5.30, SD
= 1.09, F(1,187) = 4.03, p = .05, d = .29). No other main effects or interactions emerged (all Fs <
.45, all ps > .50).
Positivity. Unexpectedly, feminine role models were rated marginally more positively (M
= 5.76, SD = .72) than gender-neutral role models (M = 5.60, SD = .67, F(1,187) = 3.15, p = .08,
34
d = .26). A domain by STEM-liking interaction also emerged (F(1,187) = 6.57, p = .01, d = .37).
A simple effect analysis revealed that the STEM role model (M = 5.87, SD = .59) was rated more
positively than the humanities role model (M = 5.5, SD = .74, F(1,194) = 6.43, p = .01, d = .36)
by students who liked STEM, but not by students who disliked STEM (p = .41).
Successful. Unexpectedly, STEM role models were rated more successful (M = 6.45, SD
= .71) than English (M = 6.13, SD = .93, F(1,187) = 6.8, p = .01, d = .38) role models. No other
main effects or interactions emerged (all Fs < 2.02, all ps > .15).
Attainability of success. STEM role models were rated less attainably successful (M =
5.23, SD = 1.31) than English role models (M = 5.64, SD = 1.07, F(1,187) = 7.36, p < .01, d =
.40). However, contrary to prediction, role model domain did not interact with role model
femininity (p = .35). No other main effects or interactions emerged (all Fs < 1.36, all ps > .24).
Similar. Unexpectedly, feminine role models were rated more similar to participants (M
= 4.02, SD = 1.53) than gender-neutral role models (M = 3.71, SD = 1.55, F(1,187) = 4.38, p =
.04, d = .31). A main effect of domain (F(1,187) = 6.28, p = .01, d = .37) and a nearly marginal
main effect of STEM liking (F(1,187) = 2.70, p = .10, d = .24) were qualified by a significant
interaction between domain and STEM-liking (F(1,187) = 10.87, p = .001, d = .48). A simple
effect analysis revealed that the STEM role model (M = 4.37, SD = 1.40) was rated more similar
to oneself than the English role model (M = 3.06, SD = 1.42, F(1,192) = 18.15, p < .001, d = .61)
by students who liked STEM, but not by students who did not like STEM (p = .68). No other
main effects or interactions emerged (all Fs < 1.43, all ps > .23).
Desired similarity. No effect of role model or STEM liking emerged on how similar
participants would like to be to the role models in the future (all Fs < 1.87, all ps > .17).
35
Believable. No effect of role model or STEM liking emerged on how believable
participants found the role models (all Fs < 2.11, all ps > .14). Ratings for each type of role
model ranged from 5.29 (SD = 1.19) to 6.0 (SD = 1.33) for participants who did not like STEM,
and from 5.34 (SD = 1.82) to 5.83 (SD = 1.10) for participants who liked STEM. One-sample t-
tests revealed that means in all of these conditions were significantly above the midpoint of four
(all ts > 3.90, all ps < .001), indicating that the role models seemed generally believable.
Role model effects on current self-ratings. Role model effects were assessed with a 2
(role model domain) x 2 (role model femininity) x 2 (STEM-liking) factorial ANOVA, excluding
control participants. Whenever a significant role model effect emerged, comparisons to the
control group were assessed with post-hoc contrasts.
Math self-ratings. A 2 (role model domain) x 2 (role model femininity) x 2 (STEM
liking) factorial ANOVA did not reveal the expected two-way interaction between role model
domain and role model femininity (F(1,187) = .98, p = .32, d = .14). The three-way interaction
was also nonsignificant (F(1,187) = .21, p = .65, d = .07). Participants who liked STEM reported
higher math self-ratings (M = 4.68, SD = 1.25) than participants who did not like STEM (M =
3.53, SD = 1.32, F(1,187) = 36.47, p < .001, d = .88). No other significant main or interactive
role model effects emerged (all Fs < 1.29, all ps > .25). See Table 5 for all means and standard
deviations.
Science self-ratings. A 2x2x2 ANOVA did not reveal the expected two-way interaction
between role model domain and role model femininity (F(1,187) = .41, p = .52, d = .09). The
three-way interaction was also nonsignificant (F(1,187) = .01, p = .94, d = .01). Participants who
liked STEM reported higher science self-ratings (M = 5.13, SD = 1.18) than participants who did
not like STEM (M = 4.19, SD = 1.22, F(1,187) = 28.05, p < .001, d = .77). No other significant
36
main or interactive role model effects emerged (all Fs < 2.34, all ps > .12). See Table 6 for all
means and standard deviations.
English self-ratings. Unexpectedly (because role model femininity was not expected to
moderate English effects), a marginal effect of role model femininity (F(1,187) = 3.10, p = .08, d
= .26) was qualified by a significant two-way interaction with role model domain (F(1,187) =
4.28, p = .04, d = .30). A simple effect analysis revealed that gender-neutral STEM role models
yielded marginally stronger English self-ratings (M = 5.40, SD = .89) than gender-neutral
humanities role models (M = 4.94, SD = 1.21, F(1,192) = 3.25, p = .07, d = .26). Post-hoc
contrasts revealed that the gender-neutral STEM role model condition also yielded significantly
stronger English self-ratings than control (M = 4.66, SD = 1.20, F(1,237) = 8.81, p < .01, d =
.39). The feminine STEM role model (M = 5.03, SD = 1.05) yielded marginally stronger English
self-ratings than control (F(1,237) = 2.86, p = .09, d = .22). See Figure 4. In addition,
participants who liked STEM reported lower English self-ratings (M = 4.65, SD = 1.13) than
participants who did not like STEM (M = 5.45, SD = .93, F(1,187) = 29.74, p < .001, d = .80).
The three-way interaction was nonsignificant (F(1,187) = .81, p = .34, d = .13). See Table 7 for
all means and standard deviations.
Role model effects on future plans.
Math plans. A 2x2x2 ANOVA did not reveal the expected two-way interaction between
role model domain and role model femininity (F(1,187) = 2.26, p = .14, d = .22), nor the
hypothesized three-way interaction (F(1,187) = 2.34, p = .13, d = .22). STEM fans (or students
who liked STEM) reported greater likelihood to take math classes (M = 4.0, SD = 1.88) than
non-STEM fans (or students who did not like STEM; M = 2.69, SD = 1.72, F(1,187) = 23.70, p <
37
.001, d = .71). No other significant main or interactive effects emerged (all Fs < 2.34, all ps >
.12). See Table 8 for all means and standard deviations.
Science plans. A 2x2x2 ANOVA did not reveal the expected two-way interaction
between role model domain and role model femininity (F(1,187) = .20, p = .65, d = .07). The
three-way interaction was also nonsignificant (F(1,187) = .66, p = .42, d = .12). STEM fans
reported greater likelihood to take science classes (M = 5.15, SD = 1.85) than non-STEM fans (M
= 3.65, SD = 2.01, F(1,187) = 24.90, p < .001, d = .73). No other significant main or interactive
effects emerged (all Fs < 2.14, all ps > .14). See Table 9 for all means and standard deviations.
English plans. A 2x2x2 ANOVA did not reveal a main effect of role model domain
(F(1,186) = .001, p = .98, d < .01), a two-way interaction between femininity and domain
(F(1,186) = .11, p = .74, d = .05), nor the three-way interaction (F(1,186) = 1.55, p = .22, d =
.18). STEM fans reported less likelihood to take English classes (M = 4.82, SD = 1.69) than non-
STEM fans (M = 5.69, SD = 1.24, F(1,187) = 19.0, p < .001, d = .64). No other significant main
or interactive effects emerged (all Fs < 2.53, all ps > .11). See Table 10 for all means and
standard deviations.
Role model effects on math persistence.
Math attempts. A 2x2x2 factorial ANOVA did not reveal the expected two-way
interaction between role model domain and role model femininity (F(1,187) = 2.16, p = .14, d =
.21). However, the three-way interaction was significant (F(1,187) = 4.78, p = .03, d = .32). A
simple interaction analysis revealed that role model domain and femininity interacted
significantly among STEM fans (F(1,192) = 7.13, p < .01, d = .39), but the simple interaction
was not significant among participants who did not like STEM (p = .79). A simple effect
analysis on STEM fans’ scores found that feminine STEM role models yielded fewer math

38
attempts (M = 5.0, SD = 2.71) than the feminine humanities condition (M = 7.93, SD = 5.69,
F(1,190) = 8.5, p < .01, d = .42), but not significantly fewer than the gender-neutral STEM
condition (M = 6.94, SD = 3.33, F(1,190) = 1.87, p = .17, d = .20). Feminine humanities role
models yielded more math attempts than the gender-neutral humanities condition (M = 6.12, SD
= 3.41, F(1,190) = 5.41, p = .02, d = .34). Post-hoc contrasts revealed that no condition differed
from STEM-liking participants in the control condition (M = 6.54, SD = 4.49, ps > .13). See
Figure 5.
Percent correct. Neither the expected 2-way interaction between role model femininity
and role model domain (F(1,184) = .001, p = .98, d < .01) nor the 3-way interaction (F(1,184) =
2.09, p = .15, d = .21) was significant on percent of math solutions deemed correct and original.
All other Fs were less than 1.55 and all ps were greater than .21. See Table 11 for all means and
standard deviations for math attempts and percent correct.
Exploratory analysis of self-rating subscales. The positive impact of STEM role
models on English self-ratings was unexpected. In the face of a STEM role model that had been
rated more successful and less attainably successful than the humanities role model, participants
may have highlighted their aptitude in English, a field where the STEM role model might have
been assumed to be less talented. If this was the case, some sort of deflation in the role model’s
field of success (math or science) should also have emerged, i.e., in the math and science self-
ratings. Thus, exploratory analyses of the self-rating subscales (self-concept, interest, and
importance) in math and science were undertaken.
Math self-concept. A 2x2x2 factorial ANOVA revealed a significant effect of domain
(F(1,187) = 3.88, p = .05, d =.29) such that STEM role models yielded weaker math self-concept
(M = 4.16, SD = 1.47) than humanities role models (M = 4.51, SD = 1.42). A post-hoc contrast

39
revealed that the STEM role models marginally weakened math self-concept relative to control
(M = 4.40, SD = 1.41; F(1,237) = 3.71, p = .055, d = .25). Participants who liked STEM also
reported higher math self-concept (M = 4.82, SD = 1.27) than participants who disliked STEM
(M = 3.89, SD = 1.47, F(1,187) = 21.75, p < .001, d = .68). See Figure 6.
Other subscales. Analyses of math interest, math importance, science self-concept,
science interest, and science importance yielded no statistically significant role model effects,
although students who liked STEM scored significantly higher on all five subscales compared to
students who disliked STEM.
Mediation of math self-concept effect via attainability. Because the STEM and
humanities role models unexpectedly differed in perceived attainability of success, a mediation
analysis tested whether that condition differences could account for the observed effect on math
self-concept.
Following Baron and Kenny (1986), three hierarchical linear regression models were
estimated, excluding control participants. For the first estimation, math self-concept was
regressed on role model domain (as well as the standardized control variables of STEM liking,
ratings of role model similarity and success, role model femininity, and the interaction of domain
and femininity). The model was significant (F(5,189) = 5.33, p < .001, R2 = .12). Domain was
marginally significant (" = .13, p < .08) such that STEM role models (coded as 0) predicted
worse math self-concept than humanities role models (coded as 1).
In the second estimation, the same variables were used to predict the proposed mediator
of attainability. The model was significant (F(5,189) = 3.21, p < .01, R2 = .08). Domain was

40
significant (" = .21, p < .01) such that STEM role models were rated less attainable than
English.5
In the third estimation, all variables including attainability were used to predict math self-
concept. The model was significant (F(6,188) = 8.07, p < .001, R2 = .21). Domain was
nonsignificant (" = .06, p = .37) whereas attainability was significant (" = .30, p < .001) such that
greater perceived attainability of one’s assigned role model predicted greater math self-concept.
This suggests that STEM role models’ lower attainability ratings mediated their negative impact
on math self-concept.6 See Figure 7.
Hayes and Preacher’s MEDIATE macro (2013) was also used to generate bootstrapped
confidence intervals based on samples of 10,000 cases, in order to provide a direct significance
test of the mediation model. The 95% confidence intervals revealed an indirect effect that was
significantly different from zero (Mediated Effect = .07, SE = .04, 95% CI = 0.009 to .153).
STEM role models indirectly reduced math self-concept by portraying success that seemed
relatively unattainable.
Discussion
Study 2 found a pattern of effects somewhat different than that uncovered in Study 1a,
and somewhat counter to its hypotheses. STEM role models were rated as particularly successful
and more unattainably so than humanities role models. They were also motivating on English
self-ratings rather than math or science self-ratings. In addition, although overall math self-
5 In the first estimation, liking STEM (coded as 0) also significantly positively predicted math self-concept (" = .33, p < .001). In the second estimation, role model similarity ratings were also significantly positively related to attainability (" = .20, p < .01). 6 Attainability did not mediate role models’ effects on English self-ratings or math attempts. Similar analyses yielded no evidence that similarity, positivity, or success ratings mediated the role models’ effects on any outcome (self-ratings, future plans, math persistence).

41
ratings were unaffected, exploratory analyses found that STEM role models reduced math self-
concept relative to humanities role models and relative to the no role model control condition.
These effects may reflect participants contrasting away from their assigned role models,
rather than assimilating towards them. This may be tied to the particular role model
manipulations used in Study 2. First, participants saw only one role model instead of three. As a
result, the role model may have served as a singular exemplar, which can encourage contrast
rather than assimilation (Mussweiler, Rüter, & Epstude, 2004). In addition, STEM role models
(but not feminine STEM role models in particular) seemed more successful and less attainably
successful than humanities role models. Mediation analysis suggested that STEM role models
deflated participants’ self-ratings in math, a field relevant to the role model’s domain of success,
because they were rated less attainably successful.
Contrast effects may also explain why STEM role models improved English self-ratings,
even though role models were not expected to affect outcomes in domains outside of their own.
In the face of a more successful other, participants may have attempted to boost their self-esteem
by highlighting their abilities in English, a field the STEM role model may have been assumed to
be less talented in. This contrast emerged most clearly following exposure to the gender-neutral
STEM role model, perhaps because she (as a less feminine woman) was especially likely to be
seen as less talented in English (a stereotypically feminine field).
It was possible that students who liked STEM would benefit most from gender-neutral
STEM role models. Although this did not occur due to the overall lack of positive role model
effects in Study 2, STEM fans alone did work harder at the math test after viewing feminine
humanities role models. This may have occurred because these STEM-identified students had the
most to gain by contrasting themselves away from a woman in a more stereotypically expected

42
field. Alternatively, this may have occurred because people tend to contrast away from outgroup
members (Brewer & Weber, 1994), and students who liked STEM felt dissimilar from English
role models. Either way, their increased math persistence may have been their way of contrasting
themselves away from the presumed skills of a woman who fit the stereotypic image of a woman
succeeding in a field so different from their own.
In short, Study 2 failed to find the expected difference between feminine and gender-
neutral STEM role models on math and science outcomes. It is possible that this occurred
because the STEM role models seemed too successful to yield inspiration or too singular to
encourage assimilation. Study 3 thus developed new stimuli that were better matched on
attainability, and increased the number of role models each participant saw. This was intended to
allow a cleaner assessment of college women’s reactions to feminine STEM role models.

43
CHAPTER V
Study 3: Individual Differences and Reactions to Role Models
Study 3 aimed to further clarify how STEM outcomes were affected by feminine STEM
role models by updating its operationalization of femininity. Studies 1a, 1b, and 2 manipulated
the femininity of the role models’ personal appearance, home appearance, and leisure activities.
This distinguished the studies from other work that had highlighted femininity in STEM via
communal traits or values (e.g., Diekman et al., 2011). However, the present work had not yet
determined if feminine appearance alone was enough to influence the effectiveness of STEM
role models.
Appearance is central to cultural stereotypes about women. Toddlers quickly learn to
describe girls in terms of appearance or clothing, and boys in terms of traits or actions (Halim &
Ruble, 2010). Theoretical definitions of femininity include clothing, hairstyles, make-up, and
grooming practices (Moore, 2006). The Conformity to Feminine Norms Inventory (used in this
study) includes a subscale asking solely about women’s make-up and hairstyling habits (Mahalik
et al., 2005). Fittingly, women are judged for the femininity of their appearance across diverse
(and irrelevant) domains. For instance, women judged as too feminine (e.g., wearing too much
make-up) are seen as less competent and deemed worthy of lower starting salaries (Forsythe et
al., 1985; Kyle & Mahler, 1996). Yet, women judged as not feminine enough (i.e., not wearing
enough make-up) are seen as less confident, less healthy, and as having a lower earning potential
(Nash, Fieldman, Hussey, Leveque, & Pineau, 2006). Study 3 narrowed its focus to this aspect of
femininity by manipulating only the interview subjects’ appearance.
44
Participants also viewed two role models each rather than one in order to discourage
contrast effects that may arise from comparisons to singular exemplars. Although it would have
been ideal to present participants with three role models, as was done in Studies 1a and 1b, only
two volunteers (one Black and one White) were available to pose for role model photographs.
Thus, a South Asian role model was not presented. These materials, varying in femininity as well
as domain, were subjected to pre-tests with a college sample. Feminine role models were
intended to appear more feminine than yet equally intelligent as gender-neutral role models, and
STEM role models were designed to appear equally successful and equally attainably successful
as humanities role models.
Study 3 tests the same hypotheses tested (but not supported) by Study 2. Gender-neutral
STEM role models were expected to yield stronger self-ratings and future plans in both math and
science, and more math persistence, relative to the feminine STEM role model condition and to a
no role model control condition. It was possible that humanities role models would boost self-
ratings and future plans in humanities, but femininity was not expected to moderate these effects.
Further, it was possible that gender-neutral STEM role models would especially benefit students
who liked STEM (as these students might best identify with a STEM role model; Lockwood &
Kunda, 1997).
In addition, Study 3 assessed how these predicted effects might be moderated by
previously unexplored individual differences. Studies 1a, 1b, and 2 highlighted the importance of
STEM liking as an individual difference: middle school girls who disliked STEM were most
deflated by feminine STEM role models, and college women who liked STEM were most likely
to contrast away from feminine humanities role models. Study 3 shifted its focus from a STEM-
relevant individual difference to three femininity-relevant variables. Specifically, it assessed
45
implicit and explicit stereotypes about femininity and STEM, as well as participants’ own
endorsement of feminine appearance norms.
The extent to which women endorse stereotypes about gender and STEM is related to
academic outcomes, including vulnerability to stereotype threat (Schmader, Johns, & Barquissau,
2004). Importantly, stereotypes can exist at either the implicit or the explicit level. Implicit
stereotypes are nonconscious associations between two concepts, and they typically reflect
whatever is frequently paired in one’s environment (Rudman, 2004). For instance, men are more
visible in STEM fields than women, and so implicit male-math and male-science associations are
more prevalent than female-math or female-science associations (e.g., Nosek et al., 2009). In
contrast, explicit stereotypes are consciously held beliefs about the characteristics of a given
social group (Rudman, 2004). Whereas explicit stereotypes are under some conscious control,
implicit stereotypes cannot be purposefully endorsed or rejected. As a result, one can explicitly
reject female stereotypes (or even be a female math major; Nosek, Banaji, & Greenwald, 2002)
yet still absorb an implicit male-math association from the surrounding culture.
Although research has found explicit endorsement of the unfeminine-STEM stereotype, it
remained unclear whether this link also existed at an implicit level. Given the rise of the “sexy
scientist” in the media, it was unclear how prevalent this implicit link might be in a female
college-aged sample. It was important to assess both kinds of stereotypes because explicit
stereotypes have been found to be less predictive of academic outcomes than implicit stereotypes
(Kiefer & Sekaquaptewa, 2007b; Ramsey & Sekaquaptewa, 2010). For instance, the weaker
women’s implicit male-math stereotype, the better they performed on a stereotype-threat-free
math test (Kiefer & Sekaquaptewa, 2007b), and the worse they performed in real college math
courses (Kiefer & Sekaquaptewa, 2007a; Ramsey & Sekaquaptewa, 2010).

46
Study 3 assessed implicit associations between unfeminine appearance and STEM with a
timed computer task. Participants paired words related to STEM with images related to feminine
appearance and with images related to unfeminine appearance. If the unfeminine-STEM pairings
were completed more quickly than the feminine-STEM pairings, this indicated a stronger
unfeminine-STEM stereotype. It was predicted that participants who strongly held the implicit
stereotype would be least motivated by feminine STEM role models, as such a combination
might feel least likely and thus least motivating to participants who most strongly link STEM
and unfeminine appearance. In contrast, participants who lacked the implicit stereotype might
respond equivalently to feminine and gender-neutral STEM role models, as they might not view
the feminine-STEM combination as unlikely or difficult.
Study 3 also assessed participants’ level of explicit stereotyping. Participants were asked
to report how strongly they agreed with the notion that women in STEM fields look unfeminine.
Given explicit stereotypes’ poorer predictive validity, explicit stereotypes were not expected to
moderate reactions to feminine STEM role models. At the very least, explicit stereotypes were
expected to moderate outcomes less consistently compared to implicit stereotypes.
The final individual difference variable measured was participants’ own endorsement of
feminine appearance norms. Effective role models are those that seem similar to their audience
on some important dimension. For instance, aspiring teachers were more inspired by successful
teachers than successful accountants, and vice versa (Lockwood & Kunda, 1997), and women
may derive unique benefits from same-gender role models (Lockwood, 2006). Women who
personally endorse a feminine appearance might thus feel just as motivated by feminine STEM
role models as gender-neutral STEM role models, if not more so. That is, participants who
valued or adhered more to feminine appearance might have been expected to assimilate to the

47
academic outcomes portrayed by feminine role models, even in a field considered to be
“unfeminine.”
The changes made to Study 3’s manipulations and the addition of these three individual
differences allowed for a fuller assessment of the role of femininity in STEM role models. First,
the femininity of role models was manipulated solely in terms of feminine appearance. Second,
participants’ own feminine appearance endorsement was assessed, with the expectation that
feminine STEM role models would be less ineffective to participants high in this trait. Third,
participants’ associations between STEM and unfemininity were assessed, with the expectation
that implicit stereotypes would more consistently moderate the impact of feminine STEM role
models compared to explicit stereotypes.
Method
Participants. One hundred-sixty-one undergraduate women (100 White, 40 Asian, 9
Black, 7 Hispanic, 5 multiracial; Mage = 19.48, SD = 2.14) participated in exchange for either one
hour of credit for their introductory psychology class (n = 90) or twelve dollars (n = 71). The
majority of students were in their first (n = 60) year, followed by second (n = 43), third (n = 33),
fourth (n = 20), and fifth or beyond (n = 3). One hundred seven students were majoring in a non-
STEM field (including business, nursing, sociology, and general psychology), and 54 in STEM
(including biology, chemistry, engineering, and neuroscience). Four participants failed to
complete the implicit stereotype test due to computer error, yielding a sample size of 157 for all
analyses assessing implicit stereotypes.
Materials
Individual differences prescreen. Before coming to the lab, participants had the option of
completing a computerized pretest questionnaire that contained the measures of feminine
48
appearance endorsement and explicit stereotyping. Thirty-seven participants opted not to
complete the prescreen, yielding a sample size of 124 for all analyses assessing these two
variables.
Feminine appearance endorsement. Participants used 7-point scales (1 = strongly
disagree, 7 = strongly agree) to answer two items taken from the Conformity to Feminine Norms
Inventory (“I regularly wear makeup” and “I get ready in the morning without looking in the
mirror very much” [reverse coded], Mahalik et al., 2005), and three original items (“It is
important to me that I look feminine,” “Women should pay attention to their appearance,” and
“Women should look feminine.”) The items displayed sufficient internal reliability (! = .69) and
were averaged into a single measure of feminine appearance endorsement.
Explicit stereotype endorsement. Participants used a 7-point Likert scale to report their
agreement (1 = strongly disagree, 7 = strongly agree) with one statement assessing explicit
endorsement of the unfeminine-STEM stereotype: “I think that women in STEM really do look
less feminine than women in more traditional fields.”
Single-Category Implicit Association Test. Participants’ automatic associations between
STEM and unfeminine appearance were assessed with a modified Single-Category Implicit
Association Test (Karpinski & Steinman, 2006). This test is adapted from the original Implicit
Association Test (Greenwald, McGhee, & Schwartz, 1998). The SC-IAT allows for a
comparison of the strength of two associations with a single construct (here, STEM’s association
with unfemininity compared to femininity), whereas the classic design would also require a
comparison of those associations with STEM and an “opposite” construct, typically humanities.
Participants were seated at a computer screen, where they read that their task was to
categorize photographs and words according to labels appearing on either the left or right side of

49
their screen. The stimuli participants sorted were six STEM-related words (engineering, physics,
biology, technology, mathematics, and chemistry) and twelve photographs of clothing or
accessories. These photographs portrayed either an unfeminine version or a feminine version of
each of six items (sweater, coat, shoe, watch, necklace/lanyard, and bag).7 See Appendix D for
all SC-IAT feminine and unfeminine photographs.
Over four rounds (including two practice rounds featuring 24 sorting tasks and two critical
rounds featuring 72 sorting tasks), participants sorted these stimuli into three categories of
interest: “Math/Science”, “Unfeminine”, and “Feminine.” In each round, the “feminine” category
label appeared on one side of the screen and the “unfeminine” category label appeared on the
other. For half of the rounds, the STEM label was paired with the unfeminine label, and for the
other half, it was paired with the feminine label. To avoid bias related to handedness, half of the
participants first completed rounds with unfeminine on the right side and the other half first
completed rounds with unfeminine on the left side. To avoid bias related to which pairing came
first, half of the participants saw STEM paired with unfeminine first and the other half saw it
paired with feminine first.
As each word and photograph appeared one by one in the center of the screen, participants
were asked to press the “Z” key on their keyboard to assign it to the category or categories on the
left side of the screen and to press the “M” key to assign it to any of the categories on the right
side of the screen. The faster that participants were able to assign unfeminine pictures and STEM
words when those categories shared a response side, relative to the speed with which they paired
7 In pilot testing, 32 participants rated each photograph on a scale from 1 (extremely unfeminine) to 7 (extremely feminine), with 4 being labeled “neither feminine nor unfeminine.” The final six “feminine appearance” items were deemed significantly more feminine than neutral (e.g., a pink cardigan sweater with a bow; t(31) = 50.66, p < .001, M = 6.78, SD = 0.3) and the six “unfeminine appearance” items were rated significantly more unfeminine than neutral (e.g., a shapeless brown turtleneck; t(31) = -9.59, p < .001, M = 2.82, SD = 0.69).

50
feminine pictures and STEM words, the stronger that participant’s implicit unfeminine-STEM
stereotype was determined to be. See Appendix E for an illustration of the SC-IAT.
In keeping with author recommendations (Karpinski & Steinman, 2006), participants
received positive feedback (a green circle) for each correct categorization and negative feedback
(a red x) for each incorrect one. They were also given a maximum response time window of
1600 ms. If they had not categorized a stimulus word or picture within 1.6 seconds, they received
an error message reading “Please respond more quickly,” and that trial was not included in final
response time calculations.
Role model stimuli. Participants read a pair of interviews ostensibly conducted with
recent University of Michigan graduates. The interviews and photographs differed along two key
dimensions: femininity of appearance and domain of success.
The feminine role models (one White woman and one Black woman) wore make-up, long
hair, pink or pastel-colored clothing, and jewelry. The gender-neutral photographs featured the
same women wearing no make-up, dark-colored clothing, a ponytail, and no jewelry. The
photographs were pretested and found to be significantly more feminine-looking in the feminine
appearance condition (ps < .001), yet equivalently intelligent (ps > .74) regardless of
appearance.8
The role models’ domain of success was manipulated via the content of the interview and
one element of one of the role model’s photographs. The role models were described as
successful either in STEM fields or in the humanities. The STEM versions featured a
8 Seventy-three pilot participants rated the femininity and intelligence of the role models on seven-point scales. They viewed four photographs (two different photos of each of the two volunteers) dressed in a gender-neutral way, feminine way, or feminine way with glasses. The final photographs feature feminine women in glasses in order to ensure that the feminine and gender-neutral role model photographs were as similar as possible in all respects save for outfit.

51
biochemistry graduate now pursuing a PhD in Chemistry and Biomedical Engineering at the
University of California at Berkeley and an engineering graduate working at an engineering
design firm in New York City. The humanities versions featured an English graduate now
pursuing a PhD in English Language and Literature at UC Berkeley and an art history graduate
now working at the Metropolitan Museum of Art in New York City. These interviews were
pretested to ensure that both versions conveyed equally impressive yet feasible success.9 In
addition, one role model was pictured in front of a blackboard with math equations in the STEM
condition, but in front of a blackboard with the equations digitally erased in the humanities
condition. The other role model was photographed in a library, a setting that could seem STEM-
or humanities-related, depending on the accompanying interview. See Appendix F for feminine
STEM and gender-neutral humanities role model materials.
The study thus utilized a 2 (domain) x 2 (femininity) design, as well as a hanging control
condition, as in Study 2. To approximate STEM-liking, which was measured in the prior three
studies, major (STEM vs. non-STEM) was included as an additional factor, yielding a 2x2x2
design.
Role model ratings. After reading their role model interview, participants used a 7-point
Likert scale ranging from 1 (not at all) to 7 (very much so) to rate the role models the 6-item
positivity measure used in Study 2 (! = .86), on perceived similarity to themselves (as in Study
2, no particular domain of similarity was specified), and on perceived success. They also rated
the role models on the item “feminine-looking” (as opposed to merely “feminine," as was asked
in Study 2). Participants were then asked three questions about how likely it was that they could
9 Forty-two pilot participants read both interviews in either the STEM or humanities condition and used seven-point scales to rate how successful the women seemed and the extent to which it was possible to achieve similar success. There was no significant difference on ratings of success (F(1,40) = .62, p = .44, d = .25) or attainability (F(1,40) = .20, p = .66, d = .14).

52
be similar to the role models one year after their own graduation in three different domains: as
academically successful, as feminine, and both as academically successful and as feminine.
Finally, they reported how similar they would one day like to be to the role models in terms of
academics, femininity, and both academics and femininity.
Current self-ratings. Participants completed self-rating scales for mathematics (! = .95),
science (! = .93), and English (! = .93; Simpkins et al., 2006). The items were identical to those
used in Study 2, save for the omission of one item related to self-concept. This item asked how
well students expected to do in a current or upcoming class in that field, and was dropped
because some students may not have been planning to take classes in certain fields.
Future plans. Participants responded to the same future plans measure that was used in
Study 2. The items correlated positively for mathematics (r = .78, p < .001), science (r = .82, p <
.001), and English (r = .76, p < .001).
Math persistence. Participants completed the 36 game, and their responses were again
coded for number of attempts and percent correct.
Procedure. Participants first had the option of completing a computerized pretest
questionnaire at home. Once in the psychology lab, all participants first completed the implicit
stereotyping measure, the SC-IAT. As in Study 2, they were then randomly assigned into one of
five role model conditions (including a control condition) and completed outcome measures.
They ended by rating the role model’s believability and reporting demographics. Finally, they
were debriefed and dismissed.
Results
Role model ratings. As in Study 2, analyses of role model ratings excluded participants
in the control condition. Thus, 129 participants were included in a series of 2 (role model

53
domain) x 2 (role model femininity) x 2 (STEM major) factorial ANOVAs on role model ratings.
Although multi-faceted STEM liking was not assessed, STEM major (as a reflection of STEM
liking) was included as a factor for the sake of symmetry between studies. See Table 12 for
means and standard deviations for all role model ratings. See Table 13 for correlations among
role model ratings.
Feminine-looking. As predicted, feminine role models were rated more feminine-looking
(M = 6.07, SD = .99) than gender-neutral role models (M = 4.86, SD = 1.43, F(1,121) = 27.34, p
< .001, d = .95) regardless of whether they were in the STEM or humanities domain (all
remaining Fs < 1.34, all ps > .25).
Positivity. Diverging from Study 2, a 2x2x2 ANOVA on positivity revealed a marginal
effect of role model femininity (F(1,121) = 3.18, p = .08, d = .32) and a significant effect of
domain (F(1,121) = 12.85, p < .001, d = .65), both of which were qualified by a significant 2-
way role model domain by femininity interaction (F(1,121) = 4.49, p = .04, d = .39). A simple
effect analysis revealed that feminine STEM role models were rated more positively (M = 6.58,
SD = .44) than feminine humanities role models (M = 5.78, SD = .88, F(1,126) = 17.88, p < .001,
d = .75) or than gender-neutral STEM role models (M = 6.0, SD = .71, F(1,126) = 8.71, p < .01,
d = .53). No other main effects or interactions emerged (all Fs < 1.92, all ps > .16).
Successful. Despite pretesting, STEM role models (M = 6.7, SD = .53) were again rated
more successful than humanities (M = 6.13, SD = 1.08, F(1,121) = 14.11, p < .001, d = .68).
Also, non-STEM majors gave marginally higher success ratings (M = 6.51, SD = .83) than
STEM majors (M = 6.18, SD = 1.04, F(1,121) = 3.41, p = .07, d = .34). No other main effects or
interactions emerged (all Fs < 1.45, all ps > .23).
54
Attainability. As desired, and unlike in Study 2, STEM and humanities role models
seemed equally attainable in terms of academics (all Fs < 1, all ps > .32). They also seemed
equally attainable in terms of combined academics and femininity (all Fs < 1.77, all ps > .18).
However, feminine role models seemed more attainable (M = 6.38, SD = 1.05) than gender-
neutral (M = 5.67, SD = 1.38, F(1,121) = 7.20, p < .01, d = .49) in terms of femininity. All other
Fs were lower than 2.33, and all ps greater than .13.
Similar. Similar to Study 2, a significant effect of domain (F(1,121) = 10.41, p < .01, d =
.59) was qualified by a significant interaction with major (F(1,121) = 5.95, p < .02, d = .44).
STEM majors rated STEM role models more similar to themselves (M = 5.39, SD = .98) than
humanities role models (M = 3.59, SD = 1.68, F(1,126) = 10.78, p = .001, d = .58). No other
main effects or interactions emerged (all Fs < 2.49, all ps > .11).
Desired similarity. Similar to Study 2, the role models did not differ on desired academic
similarity (all Fs < 1.34, all ps > .24). Participants reported wanting to be more similar in terms
of femininity to the feminine role models (M = 5.39, SD = 1.80) than the neutral role models (M
= 4.46, SD = 2.02, F(1,120) = 5.66, p < .02; all other Fs < 1.21, all ps > .27), and marginally
more similar to the feminine role models than the gender-neutral role models in terms of
combined academic and feminine similarity (F(1,120) = 3.02, p < .09, d = .32), perhaps in part
because this question directly followed the feminine similarity question. All other Fs were lower
than 1.24, and all ps greater than .26.
Believable. Unexpectedly, a 2x2x2 ANOVA revealed a significant effect of domain on
believability ratings (F(1,120) = 16.8, p < .001, d = .75), qualified by a significant interaction
with major (F(1,120) = 6.6, p = .01, d = .47) such that only STEM majors felt that the STEM
role models (M = 6.28, SD = .90) were more believable than the humanities role models (M =
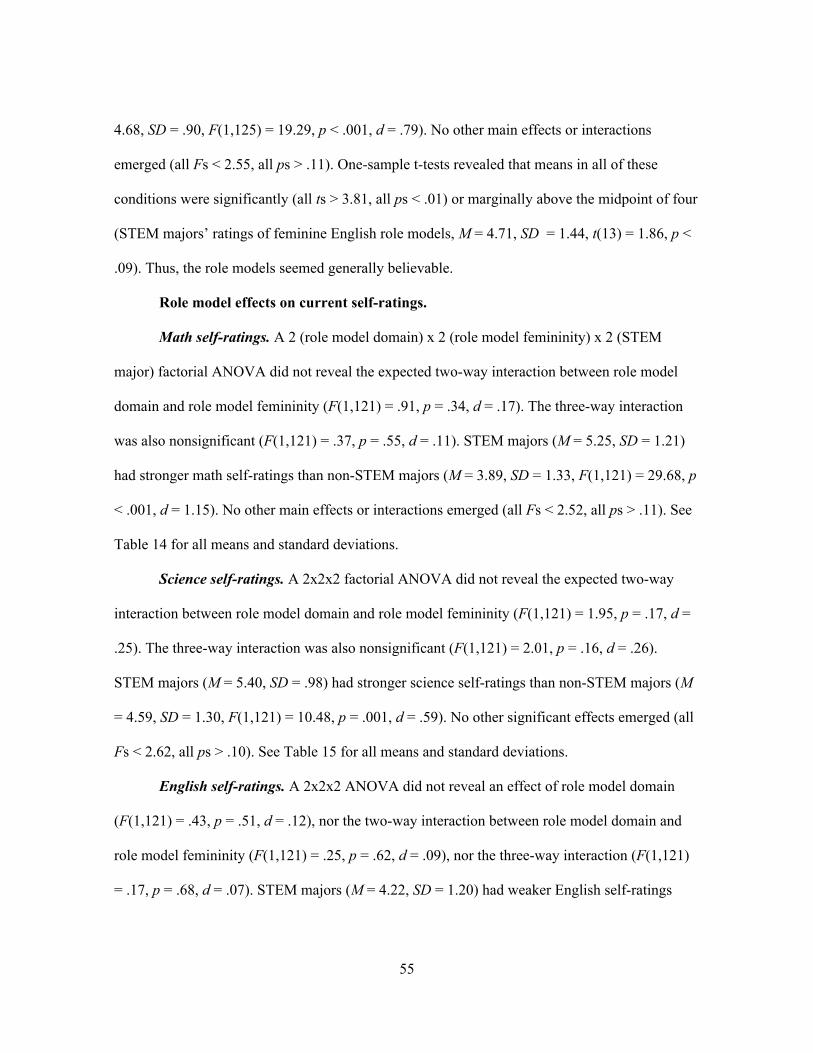
55
4.68, SD = .90, F(1,125) = 19.29, p < .001, d = .79). No other main effects or interactions
emerged (all Fs < 2.55, all ps > .11). One-sample t-tests revealed that means in all of these
conditions were significantly (all ts > 3.81, all ps < .01) or marginally above the midpoint of four
(STEM majors’ ratings of feminine English role models, M = 4.71, SD = 1.44, t(13) = 1.86, p <
.09). Thus, the role models seemed generally believable.
Role model effects on current self-ratings.
Math self-ratings. A 2 (role model domain) x 2 (role model femininity) x 2 (STEM
major) factorial ANOVA did not reveal the expected two-way interaction between role model
domain and role model femininity (F(1,121) = .91, p = .34, d = .17). The three-way interaction
was also nonsignificant (F(1,121) = .37, p = .55, d = .11). STEM majors (M = 5.25, SD = 1.21)
had stronger math self-ratings than non-STEM majors (M = 3.89, SD = 1.33, F(1,121) = 29.68, p
< .001, d = 1.15). No other main effects or interactions emerged (all Fs < 2.52, all ps > .11). See
Table 14 for all means and standard deviations.
Science self-ratings. A 2x2x2 factorial ANOVA did not reveal the expected two-way
interaction between role model domain and role model femininity (F(1,121) = 1.95, p = .17, d =
.25). The three-way interaction was also nonsignificant (F(1,121) = 2.01, p = .16, d = .26).
STEM majors (M = 5.40, SD = .98) had stronger science self-ratings than non-STEM majors (M
= 4.59, SD = 1.30, F(1,121) = 10.48, p = .001, d = .59). No other significant effects emerged (all
Fs < 2.62, all ps > .10). See Table 15 for all means and standard deviations.
English self-ratings. A 2x2x2 ANOVA did not reveal an effect of role model domain
(F(1,121) = .43, p = .51, d = .12), nor the two-way interaction between role model domain and
role model femininity (F(1,121) = .25, p = .62, d = .09), nor the three-way interaction (F(1,121)
= .17, p = .68, d = .07). STEM majors (M = 4.22, SD = 1.20) had weaker English self-ratings
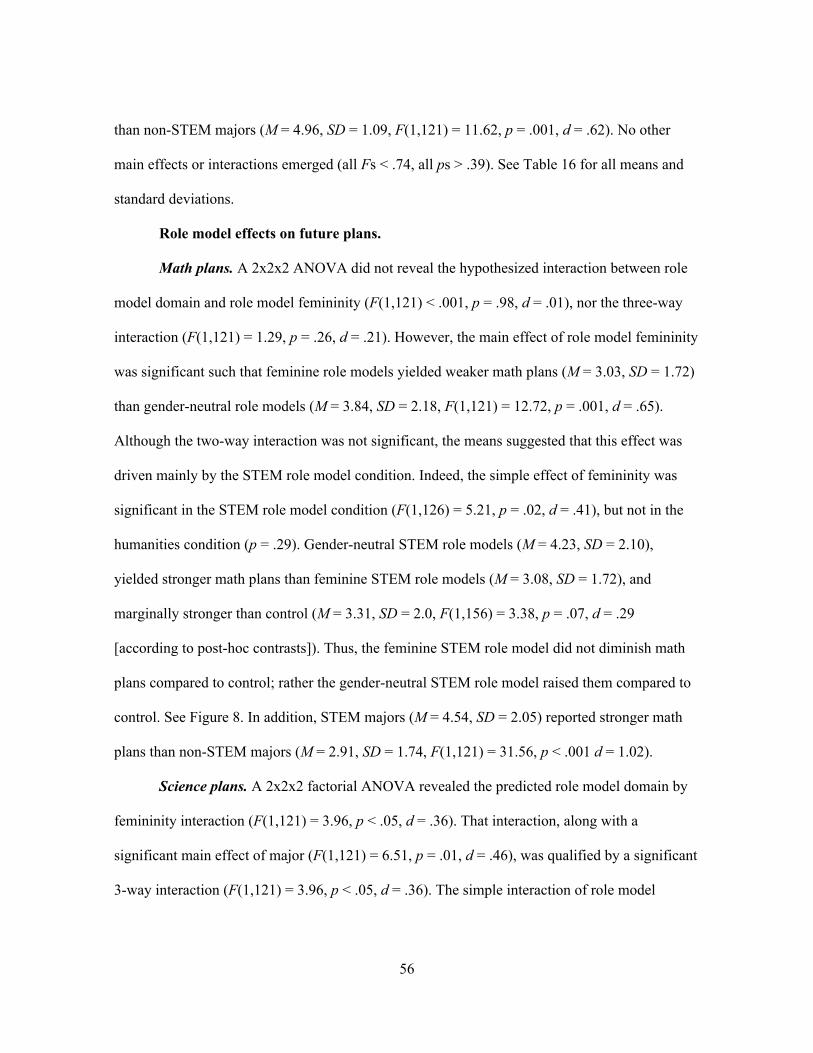
56
than non-STEM majors (M = 4.96, SD = 1.09, F(1,121) = 11.62, p = .001, d = .62). No other
main effects or interactions emerged (all Fs < .74, all ps > .39). See Table 16 for all means and
standard deviations.
Role model effects on future plans.
Math plans. A 2x2x2 ANOVA did not reveal the hypothesized interaction between role
model domain and role model femininity (F(1,121) < .001, p = .98, d = .01), nor the three-way
interaction (F(1,121) = 1.29, p = .26, d = .21). However, the main effect of role model femininity
was significant such that feminine role models yielded weaker math plans (M = 3.03, SD = 1.72)
than gender-neutral role models (M = 3.84, SD = 2.18, F(1,121) = 12.72, p = .001, d = .65).
Although the two-way interaction was not significant, the means suggested that this effect was
driven mainly by the STEM role model condition. Indeed, the simple effect of femininity was
significant in the STEM role model condition (F(1,126) = 5.21, p = .02, d = .41), but not in the
humanities condition (p = .29). Gender-neutral STEM role models (M = 4.23, SD = 2.10),
yielded stronger math plans than feminine STEM role models (M = 3.08, SD = 1.72), and
marginally stronger than control (M = 3.31, SD = 2.0, F(1,156) = 3.38, p = .07, d = .29
[according to post-hoc contrasts]). Thus, the feminine STEM role model did not diminish math
plans compared to control; rather the gender-neutral STEM role model raised them compared to
control. See Figure 8. In addition, STEM majors (M = 4.54, SD = 2.05) reported stronger math
plans than non-STEM majors (M = 2.91, SD = 1.74, F(1,121) = 31.56, p < .001 d = 1.02).
Science plans. A 2x2x2 factorial ANOVA revealed the predicted role model domain by
femininity interaction (F(1,121) = 3.96, p < .05, d = .36). That interaction, along with a
significant main effect of major (F(1,121) = 6.51, p = .01, d = .46), was qualified by a significant
3-way interaction (F(1,121) = 3.96, p < .05, d = .36). The simple interaction of role model

57
domain and femininity was significant for STEM majors (F(1,126) = 7.61, p < .01, d = .49) but
not non-STEM majors (p = .93). For STEM majors, feminine STEM role models (M = 4.28, SD
= 2.06) yielded marginally weaker science plans than gender-neutral STEM role models (M =
5.78, SD = 1.15, F(1,124) = 3.0, p < .09, d = .31). In contrast, feminine humanities role models
yielded stronger science plans than feminine STEM role models (M = 5.86, SD = 1.25, F(1,124)
= 5.62, p < .02, d = .43) or the gender-neutral humanities role models (M = 4.56, SD = 1.70,
F(1,124) = 4.55, p < .04, d = .38). However, no role model condition differed from STEM
majors in the control condition (M = 5.38, SD = 1.63, all ps > .17). See Figure 9.
English plans. A 2x2x2 ANOVA did not reveal an effect of role model domain (F(1,121)
= .06, p = .80, d = .04), nor the two-way interaction between role model domain and role model
femininity (F(1,121) = 2.06, p = .15, d = .26), nor the three-way interaction (F(1,121) = .22, p =
.64, d = .09). STEM majors (M = 4.14, SD = 1.77) had weaker English plans than non-STEM
majors (M = 5.20, SD = 1.56, F(1,121) = 10.07, p = .002, d = .58). No other significant effects
emerged (all Fs < 1.2, all ps > .27). See Table 17 for all means and standard deviations.
Role model effects on math persistence.
Math attempts. A 2x2x2 ANOVA did not reveal the hypothesized interaction between
role model domain and role model femininity (F(1,121) = .88, p = .35, d = .17). The three-way
interaction was also nonsignificant (F(1,121) = .01, p = .95, d = .02). Unexpectedly, however,
role model femininity was significant such that feminine role models yielded more math attempts
(M = 7.37, SD = 6.50) than gender-neutral role models (M = 5.35, SD = 3.59, F(1,121) = 4.97, p
< .03, d = .41). STEM majors (M = 8.25, SD = 7.62) made more math attempts than non-STEM
majors (M = 5.47, SD = 3.56, F(1,121) = 7.24, p < .01, d = .49). No other main effects or

58
interactions emerged (all Fs < .88, all ps > .35). See Table 18 for all means and standard
deviations.
Percent correct. As in Study 2, the hypothesized interaction between role model domain
and role model femininity did not emerge (F(1,121) = 1.16, p = .28, d = .20), nor did the three-
way interaction (F(1,121) = .21, p = .65, d = .08). No other effects emerged (all Fs < 2.60, all ps
> .11). See Table 18 for all means and standard deviations.
Mediation of role model effects via attainability. Neither Baron and Kenny’s (1986)
mediation method nor Hayes and Preacher’s MEDIATE macro (2013) revealed evidence for
mediation of any of the above effects via academic attainability, feminine attainability, or
combined femininity/academic attainability. As in Study 2, mediation analyses also found no
mediation of role models’ effects via perceived positivity, similarity, or success.
Individual difference descriptives. See Table 19 for correlations among the three
individual difference variables.
Implicit unfeminine-STEM stereotype. Reaction times for each of the two critical 72-
trial blocks were used to calculate unfeminine-STEM implicit stereotype scores, following the
scoring procedures described by Karpinski & Steinman (2006). Calculations excluded responses
faster than 350ms and slower than 1400ms. Incorrect responses had a 400ms penalty added. Each
of the blocks’ average reaction time was then calculated with these trials. The average reaction
time for the block featuring stereotypic categorizations (i.e., pairing STEM words with
unfeminine photographs) was subtracted from the reaction time for the block featuring
counterstereotypic categorizations (i.e., pairing STEM words with feminine photographs).
Finally, this difference score was divided by the standard deviation of all correct response times
(Karpinski & Steinman, 2006).

59
The average score on the unfeminine-STEM implicit IAT was .29 (SD = .33), with a
range of -.92 to 1.06. The positive mean score indicates that counterstereotypic (feminine-
STEM) pairings took longer on average to complete than stereotypic (unfeminine-STEM)
pairings. A two-tailed one-sample t-test found that this mean score was significantly different
than zero (t(156) = 11.16, p < .001, d = 1.79). Thus, participants displayed an implicit association
between STEM and unfemininity. An independent-samples t-test revealed that IAT scores did
not differ by major (Mnon-STEM, = .30, SD = .33, MSTEM = .29, SD = .32, t(155) = -.18, p = .86, d =
-.03).
Explicit stereotype endorsement. The average score on the seven-point explicit
stereotype endorsement item was 2.56 (SD = 1.53). Scores ranged from 1 to 6. A two-tailed one-
sample t-test found that this mean score was significantly lower than the scale midpoint of four
(t(123) = -10.44, p < .001, d = -1.88). Thus, participants tended to disagree with the explicit
unfeminine-STEM stereotype. An independent-samples t-test revealed that non-STEM majors
(M = 2.32, SD = 1.41) tended to disagree with this statement more strongly than STEM majors
(M = 3.0, SD = 1.65; t(122) = 2.44, p = .02, d = .44).
Feminine appearance endorsement. The average score on the seven-point feminine
appearance endorsement composite was 4.59 (SD = 1.10). Scores ranged from 1.2 to 7. A two-
tailed one-sample t-test found that this mean score was significantly higher than the scale
midpoint of four (t(123) = 5.98, p < .001, d = 1.08). Thus participants tended to moderately
endorse feminine appearance. An independent-samples t-test revealed that feminine appearance
scores did not differ by major (Mnon-STEM = 4.67, SD = 1.11, MSTEM = 4.45, SD = 1.07, t(122) = -
1.05, p = .30, d = .19).
Moderation of role model effects by individual differences.
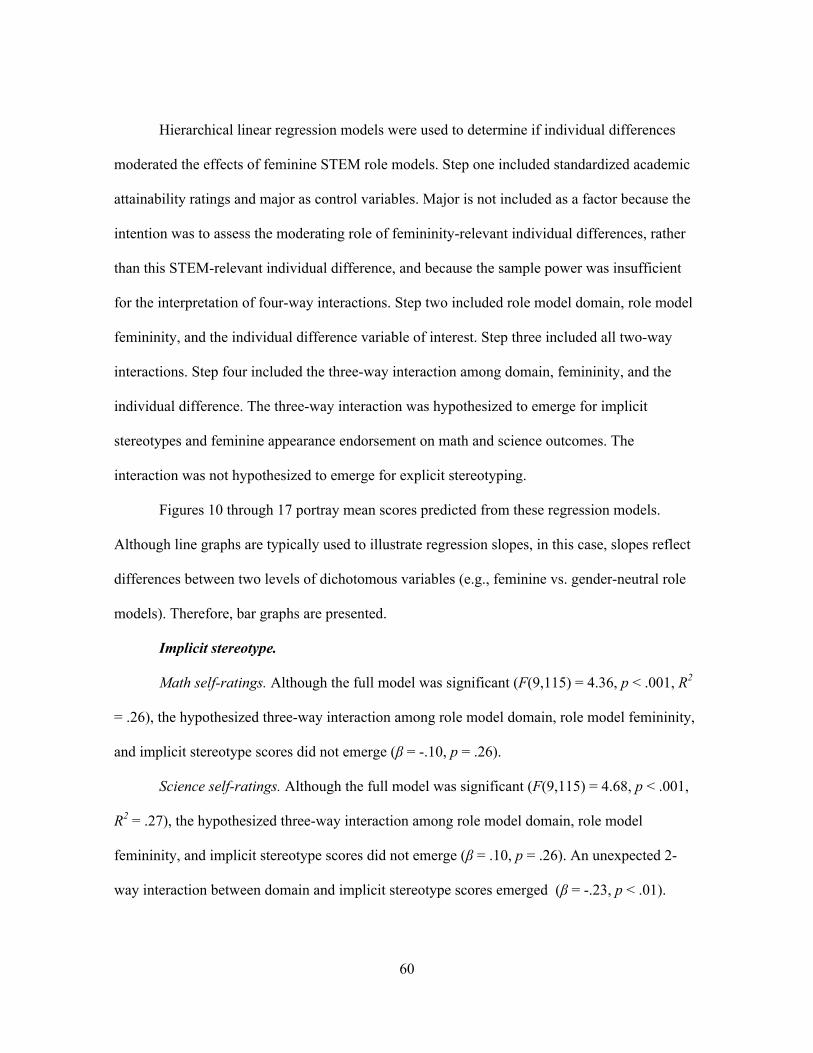
60
Hierarchical linear regression models were used to determine if individual differences
moderated the effects of feminine STEM role models. Step one included standardized academic
attainability ratings and major as control variables. Major is not included as a factor because the
intention was to assess the moderating role of femininity-relevant individual differences, rather
than this STEM-relevant individual difference, and because the sample power was insufficient
for the interpretation of four-way interactions. Step two included role model domain, role model
femininity, and the individual difference variable of interest. Step three included all two-way
interactions. Step four included the three-way interaction among domain, femininity, and the
individual difference. The three-way interaction was hypothesized to emerge for implicit
stereotypes and feminine appearance endorsement on math and science outcomes. The
interaction was not hypothesized to emerge for explicit stereotyping.
Figures 10 through 17 portray mean scores predicted from these regression models.
Although line graphs are typically used to illustrate regression slopes, in this case, slopes reflect
differences between two levels of dichotomous variables (e.g., feminine vs. gender-neutral role
models). Therefore, bar graphs are presented.
Implicit stereotype.
Math self-ratings. Although the full model was significant (F(9,115) = 4.36, p < .001, R2
= .26), the hypothesized three-way interaction among role model domain, role model femininity,
and implicit stereotype scores did not emerge (" = -.10, p = .26).
Science self-ratings. Although the full model was significant (F(9,115) = 4.68, p < .001,
R2 = .27), the hypothesized three-way interaction among role model domain, role model
femininity, and implicit stereotype scores did not emerge (" = .10, p = .26). An unexpected 2-
way interaction between domain and implicit stereotype scores emerged (" = -.23, p < .01).

61
Analyses of simple slopes revealed that participants with weak implicit stereotypes showed
higher science self-ratings in the humanities role model condition than in the STEM role model
condition (" = .27, p = .02), and higher self-ratings than people with strong implicit stereotypes
in the humanities role model conditions (" = -.36, p < .01). See Figure 10.
English self-ratings. The full model was significant (F(9,115) = 2.38, p = .02, R2 = .16).
Implicit stereotype scores did not interact with role model domain or femininity (all ps > .20).
This was expected, as beliefs about the femininity of math and science were expected to
moderate only reactions to STEM role models, which were not predicted to affect English
outcomes.
Math plans. The full model was significant (F(9,115) = 4.34, p < .001, R2 = .25), and the
hypothesized three-way interaction among role model domain, role model femininity, and
implicit stereotype scores was marginally significant (" = -.16, p < .07). Simple slope analyses
revealed that the overall effect of femininity was significant for participants with strong implicit
stereotypes (" = .21, p = .04), such that gender-neutral role models (coded as 1) improved math
plans relative to feminine role models (coded as 0). However, this was driven by the STEM role
model condition. Participants with strong implicit stereotypes reported greater math plans after
viewing a gender-neutral STEM role model compared to a feminine STEM role model (" = .85,
p < .01), and greater math plans compared to the gender-neutral humanities condition (" = -.74, p
= .04). This positive effect of gender-neutral STEM role models fits the hypothesized pattern.
The overall effect of femininity (" = .27, p = .03) was also significant for participants
with weak implicit stereotypes (those who did not associate STEM with either femininity or
unfemininity). In this case, the effect was driven by the humanities role model condition. These
participants reported greater math plans after viewing a gender-neutral humanities role model

62
compared to a feminine humanities role model (" = .80, p = .02). However, the gender-neutral
humanities role model did not improve math plans relative to a gender-neutral STEM role model
(p = .64). See Figure 11.
Science plans. The full model was significant (F(9,115) = 3.18, p < .01, R2 = .20), but the
hypothesized three-way interaction among role model domain, role model femininity, and
implicit stereotype scores was not significant (" = .12, p = .19). As had emerged for science self-
ratings, the two-way interaction between domain and implicit stereotype scores was
unexpectedly significant (" = -.18, p = .04). Analyses of simple slopes revealed a pattern
identical to that found on science self-ratings. Participants with weak implicit stereotypes
showed greater science plans in the humanities role model condition than in the STEM role
model condition (" = .25, p < .05), and greater plans than people with strong implicit stereotypes
in the humanities role model conditions (" = -.40, p < .01). See Figure 12.
English plans. The full model was significant (F(9,115) = 2.37, p = .02, R2 = .16). As
predicted, implicit stereotype scores did not interact with role model domain or femininity (all ps
> .34).
Math attempts. The full model was significant (F(9,115) = 2.40, p = .02, R2 = .16), and
the hypothesized three-way interaction among role model domain, role model femininity, and
implicit stereotype scores was significant (" = -.19, p < .05). Simple slopes analyses revealed that
the overall effect of role model femininity was marginally significant in the STEM role model
condition (" = -.21, p = .09), but in an unexpected direction. Gender-neutral STEM role models
reduced math attempts relative to feminine STEM role models. However, this was driven by
participants with weak implicit stereotypes, who tried harder on the math task in the feminine
STEM condition than the gender-neutral STEM condition (" = -1.97, p = .04).

63
Although the overall effect of role model femininity was not significant in the humanities
role model condition (" = -.13, p = .30), participants with strong implicit stereotypes made
marginally fewer math attempts in the gender-neutral humanities condition compared to the
feminine humanities condition (" = -1.75, p = .07), and marginally fewer than participants with
weak implicit stereotypes in the gender-neutral humanities condition (" = -1.77, p = .08). See
Figure 13.
Percent correct. The full model was not significant (F(9,114) = 1.57, p = .13, R2 = .11).
Explicit stereotype endorsement.
Math self-ratings. As predicted, although the full model was significant (F(9,90) = 4.69,
p < .001, R2 = .32), explicit stereotype scores did not interact with role model domain or
femininity (all ps > .26).
Science self-ratings. As predicted, although the full model was significant (F(9,90) =
3.29, p < .01, R2 = .25), explicit stereotype scores did not interact with role model domain or
femininity (all ps > .33).
English self-ratings. The full model was significant (F(9,90) = 2.57, p = .01, R2 = .21),
the three-way interaction among role model domain, role model femininity, and explicit
stereotyping was nonsignificant (" = -.09, p = .35). However, role model femininity
unexpectedly interacted with explicit stereotype scores (" = -.22, p = .03). Simple slopes
analyses revealed that participants with stronger explicit stereotypes reported higher English self-
ratings in the feminine role model condition than in the gender-neutral role model condition (" =
-.33, p = .02), and higher self-ratings than people with weak explicit stereotypes in the feminine
condition (" = .29, p = .04). See Figure 14.

64
Math plans. As predicted, although the full model was significant (F(9,90) = 3.64, p =
.001, R2 = .27), explicit stereotype scores did not interact with role model domain or femininity
(all ps > .29).
Science plans. The full model was significant (F(9,90) = 2.35, p = .02, R2 = .19), and the
three-way interaction among role model femininity, domain, and explicit stereotype endorsement
was unexpectedly a marginally significant predictor (" = -.16, p < .10). Simple slopes analyses
revealed that the overall effect of role model femininity was marginally significant within the
STEM role model condition (" = .26, p = .054), such that gender-neutral STEM role models
marginally improved science plans relative to feminine STEM role models. However, this was
driven by participants high in explicit stereotyping. Participants with strong explicit stereotypes
reported marginally greater science plans after viewing a gender-neutral STEM role model
compared to a feminine STEM role model (" = .69, p = .06) or a gender-neutral humanities role
model (" = -.73, p = .06). These effects were nonsignificant for participants with weak explicit
stereotypes (ps > .37). The positive effect of gender-neutral STEM role models fits the
hypothesized pattern, which also emerged significantly for STEM majors in a 2x2x2 ANOVA
that did not account for explicit stereotyping. See Figure 15.
English plans. The full model was significant (F(9,90) = 2.67, p < .01, R2 = .21), and the
three-way interaction was nonsignificant (" = -.07, p = .45). Unexpectedly, two two-way
interactions emerged: explicit stereotyping interacted significantly with role model femininity ("
= -.20, p = .04) and also with role model domain (" = .20, p < .05). Participants with strong
explicit stereotypes reported fewer English plans in the gender-neutral role model condition than
the feminine condition (" = -.29, p = .03), and than participants with weak stereotypes in the

65
gender-neutral condition ("= -.28, p < .05). As with English self-concept, participants with
strong explicit stereotypes scored highest in the feminine role model condition. See Figure 16a.
Participants with weak stereotypes reported marginally more English plans in the STEM
role model condition than the humanities role model condition (" = -.24, p = .08), and marginally
more than participants with strong explicit stereotypes in the STEM condition (" = -.26, p = .07).
See Figure 16b.
Math attempts. As predicted, although the full model was significant (F(9,90) = 1.99, p <
.05, R2 = .17), explicit stereotype scores did not interact with role model domain or femininity
(all ps > .36).
Percent correct. The full model was not significant (F(9,88) = .36, p = .95, R2 = .04).
Feminine appearance endorsement.
Math self-ratings. Although the full model was significant (F(9,90) = 4.63, p < .001, R2 =
.32), the hypothesized three-way interaction among role model domain, role model femininity,
and feminine appearance endorsement did not emerge (" = -.13, p = .15).
Science self-ratings. Although the full model was significant (F(9,90) = 3.16, p = .002, R2
= .24), the hypothesized three-way interaction among role model domain, role model femininity,
and feminine appearance endorsement did not emerge (" = .02, p = .86).
English self-ratings. The full model was only marginally significant (F(9,90) = 1.87, p =
.07, R2 = .16). As predicted, feminine appearance endorsement did not interact with role model
domain or femininity (all ps > .55).
Math plans. Although the full model was significant (F(9,90) = 4.04, p < .001, R2 = .29),
the hypothesized three-way interaction among role model domain, role model femininity, and
feminine appearance endorsement did not emerge (" = -.07, p = .49). An unexpected 2-way

66
interaction between domain and feminine appearance endorsement emerged (" = -.19, p < .05).
Participants who strongly endorsed feminine appearance reported stronger math plans in the
STEM role model condition than the humanities role model condition ("= -.31, p = .02), but not
more than participants who weakly endorsed feminine appearance in the STEM role model
condition (p = .23). See Figure 17.
Science plans. Although the full model was significant (F(9,90) = 2.20, p = .03, R2 = .18),
the hypothesized three-way interaction among role model domain, role model femininity, and
feminine appearance endorsement did not emerge (" = -.02, p = .87).
English plans. Although the full model was significant (F(9,90) = 2.26, p = .03, R2 = .18).
As predicted, feminine appearance endorsement did not interact with role model domain or
femininity (all ps > .77).
Math attempts. The full model was not significant (F(9,90) = 1.67, p = .11, R2 = .14).
Percent correct. The full model was not significant (F(9,88) = .84, p = .59, R2 = .08).
Discussion
Study 3 found some support for the notion that gender-neutral STEM role models are
more motivating than feminine STEM role models. Adding femininity to the role model’s
appearance seemed to wipe out benefits that might otherwise emerge from a STEM role model.
More specifically, positive effects of gender-neutral STEM role models were most likely for
STEM-identified participants (STEM majors) or for participants with strong implicit unfeminine-
STEM stereotypes. Gender-neutral STEM role models yielded stronger science plans than
feminine STEM role models only among STEM majors, and stronger math plans only among
people with strong implicit unfeminine-STEM stereotypes. Although explicit stereotypes were
less predictive overall, gender-neutral STEM role models were also most motivating in terms of
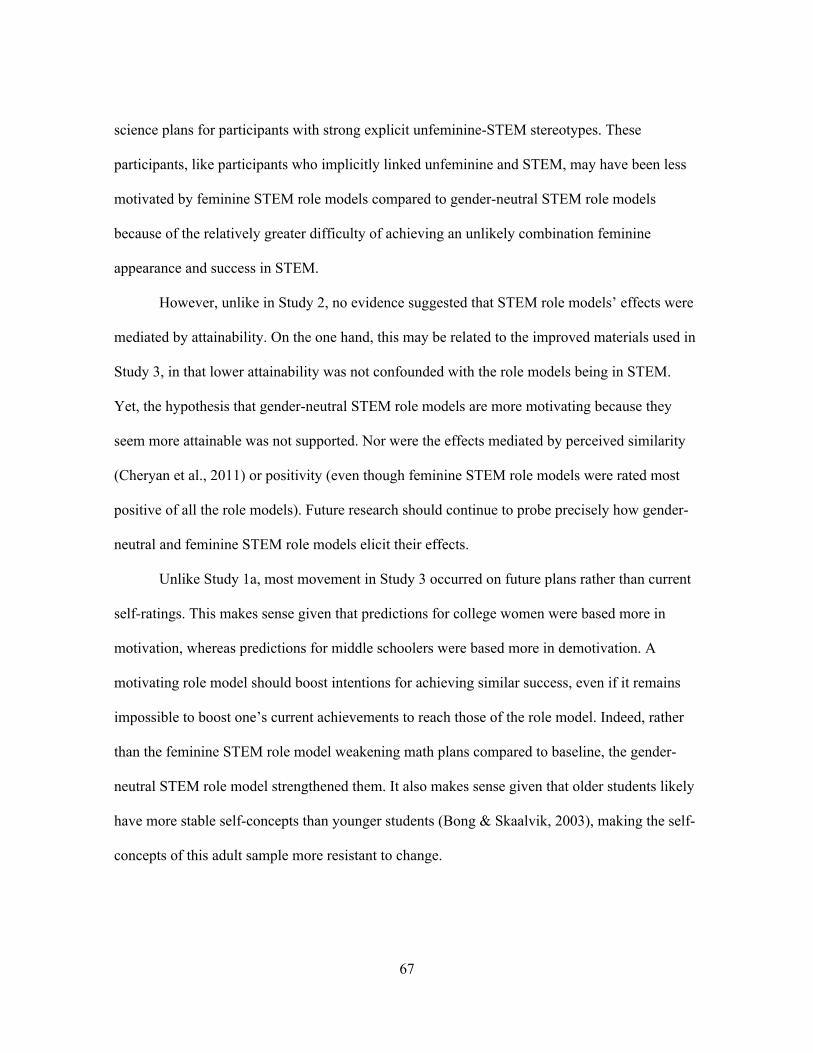
67
science plans for participants with strong explicit unfeminine-STEM stereotypes. These
participants, like participants who implicitly linked unfeminine and STEM, may have been less
motivated by feminine STEM role models compared to gender-neutral STEM role models
because of the relatively greater difficulty of achieving an unlikely combination feminine
appearance and success in STEM.
However, unlike in Study 2, no evidence suggested that STEM role models’ effects were
mediated by attainability. On the one hand, this may be related to the improved materials used in
Study 3, in that lower attainability was not confounded with the role models being in STEM.
Yet, the hypothesis that gender-neutral STEM role models are more motivating because they
seem more attainable was not supported. Nor were the effects mediated by perceived similarity
(Cheryan et al., 2011) or positivity (even though feminine STEM role models were rated most
positive of all the role models). Future research should continue to probe precisely how gender-
neutral and feminine STEM role models elicit their effects.
Unlike Study 1a, most movement in Study 3 occurred on future plans rather than current
self-ratings. This makes sense given that predictions for college women were based more in
motivation, whereas predictions for middle schoolers were based more in demotivation. A
motivating role model should boost intentions for achieving similar success, even if it remains
impossible to boost one’s current achievements to reach those of the role model. Indeed, rather
than the feminine STEM role model weakening math plans compared to baseline, the gender-
neutral STEM role model strengthened them. It also makes sense given that older students likely
have more stable self-concepts than younger students (Bong & Skaalvik, 2003), making the self-
concepts of this adult sample more resistant to change.
68
There was one case where feminine STEM role models seemed more motivating than
gender-neutral role models, but only when qualified by an individual difference. People with a
weak (or nonexistent) implicit stereotype made more attempts on a math task after seeing a
feminine STEM role model than a gender-neutral STEM role model. Perhaps, as predicted, such
a role model might not seem so unlikely to people who do not link STEM and unfemininity.
Thus, that role model had the potential to be equally as motivating as the gender-neutral STEM
role model, or even (as it turned out) more motivating. Nevertheless, the feminine STEM role
model never improved intentions for pursuing math or science, which may be more meaningful
indicators of STEM motivation (Simpkins et al., 2006).
Whereas explicit stereotype endorsement was rather low, the Single-Category Implicit
Association Test did reveal that women on average nonconsciously associated STEM with
unfemininity over femininity. This disconnect has precedent in previous comparisons of explicit
and implicit stereotypes (Nosek et al., 2002). Also as predicted, implicit stereotypes were the
most meaningful individual difference in terms of moderating feminine STEM role model
effects. Strong implicit stereotypes predicted greater math plans following exposure to gender-
neutral STEM role models, whereas weak implicit stereotypes predicted more math attempts
following exposure to feminine STEM role models. In contrast, explicit stereotypes moderated
fewer specific effects of exposure to feminine or gender-neutral STEM role models.
Although humanities role models were not expected to influence math or science
outcomes, some two-way interactions suggested a pattern of contrast versus assimilation effects
moderated by individual differences. In general, weak stereotypes promoted contrast away from
humanities role models. People with weak explicit stereotypes reported stronger science plans
following exposure to humanities role models. People with weak implicit stereotypes reported

69
higher science self-ratings following exposure to humanities role models, and greater math plans
following exposure to the gender-neutral humanities role model. Women succeeding in
stereotypically feminine fields, regardless of appearance, might most motivate contrast in the
form of heightened STEM motivation among people who do not see STEM as incompatible with
femininity.
In contrast, strong feminine appearance endorsement encouraged assimilation to
humanities role models in the form of weakened math plans. Participants who value feminine
appearance might take another woman’s stereotypically feminine success (in terms of domain, if
not necessarily appearance) as an encouragement to eschew math. Somewhat surprisingly,
feminine appearance endorsement did not moderate reactions to feminine as compared to gender-
neutral role models. Perhaps the femininity of one’s field of success provides a stronger cue than
appearance in terms of meeting feminine norms. This latter point is speculative, however, given
that participants’ views about the femininity of humanities fields were not assessed.
It is interesting to note that feminine STEM role models were rated most positively
overall, even though they were less effective motivators than gender-neutral STEM role models.
The fact that feminine role models were rated most positively overall in Study 2, and feminine
STEM role models most positively in Study 3 speaks to the cultural value that is still placed on
feminine women. Yet, adding that positively valued femininity to a successful woman in STEM
did not improve her ability to motivate women in her field of success.

70
CHAPTER VI
General Discussion
Echoing real world efforts to highlight STEM’s compatibility with femininity, these four
studies tested whether feminine STEM role models could improve girls’ and women’s math and
science motivation. Results suggest that such role models—women in STEM who hold feminine
interests or even just look overtly feminine—are less motivating than more “everyday” female
STEM role models. Study 1a found that among younger girls, feminine STEM role models
reduced math self-ratings compared to either gender-neutral STEM role models or to feminine
role models outside of STEM. Study 3 found that among college women, gender-neutral STEM
role models yielded stronger math plans compared to a no role model control condition, whereas
feminine STEM role models failed to boost math or science outcomes above baseline.
These effects, however, depended to some extent on individual differences. For one,
college women and middle school girls responded differently to feminine STEM role models.
Young girls reported more negative effects on current self-concepts, whereas college women’s
future plans were more widely affected. This may be because academic self-concepts become
more stable over time, and thus perhaps less moveable by short-term interventions (Bong &
Skaalvik, 2003). Relatedly, adults’ less rigid stereotypes may make feminine STEM role models
seem less daunting than they do to younger girls (albeit still more lofty than gender-neutral
STEM role models). This would make positive effects of gender-neutral STEM role models
more likely than overly negative effects of feminine STEM role models, and such motivating
effects may be more likely to emerge on future plans than on current self-concepts. Young girls

71
and adult women are both targeted by messages prescribing feminine norms and attempting to
counter STEM’s supposed compatibility with those norms. Future research should continue to
assess how such messages differently affect students at various developmental stages, as well as
the mechanisms underlying those effects. It is particularly important to identify which effects
(from Study 1a’s demotivating feminine STEM role models, to Study 2’s contrast-inducing
STEM role models, to Study 3’s motivating gender-neutral STEM role models) are due to
aspects of the role model manipulation, and which are due to developmental differences between
young girls and adult women.
STEM interests also seemed to intensify the negative or positive effects of STEM role
models. A demotivating role model was most harmful to students who had already begun to
disidentify with the model’s field of success. That is, in Study 1a, girls who did not express
interest in math or science at the outset of the study reported decreased math self-ratings as well
as lower likelihood of taking future math classes after viewing feminine STEM role models. A
motivating role model, on the other hand, most benefitted students already identified with her
domain. In Study 3, only STEM majors reported stronger intentions to take science classes after
viewing gender-neutral STEM role models compared to feminine STEM role models. To reach
gender parity in STEM, interventions must encourage female students’ entry into STEM fields,
and prevent attrition from women already in the field (AAUW, 2010; Frome et al., 2006). It is
therefore essential to calibrate role models and other interventions to reach students with varying
levels of interest in STEM.
Beliefs about femininity were another individual difference that predicted the impact of
feminine-STEM role models. For instance, gender-neutral STEM role models were more
effective than feminine STEM role models particularly among participants with strong
72
unfeminine-STEM stereotypes, at either the implicit or explicit level. These two stereotypes
looked quite different in Study 3’s sample, as implicit and explicit cognitions often do (e.g.,
Nosek et al., 2002). Participants explicitly rejected the idea that women in STEM look
unfeminine, yet nonconsciously associated STEM more strongly with unfeminine appearance
than feminine appearance. Women’s explicit rejection of the stereotype is encouraging, to the
extent that STEM’s unfeminine reputation is discouraging to women. Yet, implicit stereotypes
tend to be better predictors of academic outcomes, and implicit unfeminine-STEM stereotypes
moderated more outcomes than explicit stereotypes did. In spite of modern examples of feminine
scientists, the prevailing image that women are absorbing from the culture, and that may impact
their academic plans, still appears to be one of an unfeminine STEM woman.
One underlying notion that may explain why individual differences in STEM interest and
unfeminine stereotypes is the idea of attainability. The role model literature already shows that
role models who seem too difficult to match can deflate rather than inspire (Hoyt, 2012;
Lockwood & Kunda, 1997). Hints of this emerged in the present studies. In Study 1b, the kinds
of girls who were most demotivated by feminine STEM role models in Study 1a (i.e., girls who
disliked STEM) also saw the combination of overt femininity and STEM success as least
attainable. Study 2 found that STEM role models reduced math self-concept because they
seemed less attainably successful than humanities role models. This effect, however, was not
limited to feminine STEM role models, and instead may have been related to flaws in the
number of role models presented or in a failure to match the role model’s success across domain.
Although Study 3 did not find evidence of mediating factors, the fact that participants who saw
STEM as unfeminine were least motivated by feminine STEM role models suggests that seeing
73
STEM as incompatible with femininity is related to feeling unmotivated by feminine women in
STEM.
Although failure to connect STEM with femininity (that is, holding the stereotype that
STEM women are not feminine) exacerbated the effects of feminine STEM role models, the
importance participants placed on their own feminine appearance did not seem to matter.
Nevertheless, future research should continue to explore how feminine identity affects STEM-
related choices, not just in women but also in young girls. Although a bit dated, past research
found that eleven-year-old girls describing themselves as feminine were more likely to view
science fields as masculine and thus unappealing (Kelly & Smail, 1986). The perception that
women in STEM are unfeminine—not just in terms of communal values or personality traits, but
even in appearance—may still be a barrier for people who value feminine appearance. Feminine
STEM role models may simply not be the best way to remove that barrier.
Additional studies will shed more light on how the unfeminine-STEM stereotype affects
academic choices, what kinds of role models or other interventions might alter that relationship,
and for whom these effects might emerge. In other words, next steps should address the
measures, manipulations, and samples used in these four studies. For instance, the SC-IAT
photographs meant to represent “unfeminine” appearance could easily be perceived as
“masculine” instead. This overlap is somewhat understandable, given that male and female are
commonly regarded as “opposites.” Yet, this means that participants’ SC-IAT scores may reflect
“male-STEM” associations rather than “unfeminine-STEM.” Developing a more precise
assessment of the implicit unfeminine-STEM stereotype would further the goals of this research.
The role model manipulations’ focus on feminine appearance also merits examination.
Additional studies might ask exactly why the mere appearance of a woman in STEM might

74
affect students’ math and science motivation. Appearance may act as a signal for underlying
communal traits, or may signal interest in romance or romantic desirability. More detailed
measures of role models’ perceived traits and abilities might help answer this question. Another
area of improvement lies in the design of the humanities role models. Humanities as a field of
study may seem more diffuse than STEM, in that an English major might seem to have less in
common with an art history major, compared to an engineering and a biochemistry major. More
carefully crafted comparison role models would help isolate the unique effects of feminine
STEM role models on STEM motivation.
Finally, the outcomes of all of these lines of inquiry likely depend on the sample.
Viewing STEM as unfeminine may mean something different to young girls than to college
women. Perhaps appearance in and of itself is more important to younger girls, serving as a
clear-cut indicator of prized gender conformity, whereas college women might value feminine
appearance to the extent that it serves romantic goals. The kinds of academic choices and the
reasons behind them should also differ for each of these groups. Taking a high school math class
might seem like more of a “given” than selecting an engineering major, and may speak less to a
student’s career goals. Toward this end, future studies should also examine high school students’
stereotypes and reactions to role models. Their academic choices may feed more directly into
occupational choices than those of middle schoolers, and successful interventions could
encourage exploration of different careers before a major is chosen. In addition, future research
should consider samples of different racial, ethnic, and cultural backgrounds, as notions of
feminine incompatibility or the attractiveness of different careers may change in different
contexts (e.g., South Asia as compared to the United States).

75
Feminine STEM role models should be regarded cautiously, and not just because of their
failure to motivate across these studies. Swami and colleagues (2010) argue that endorsement of
the feminine appearance ideal is problematic: it emphasizes that women should look good (i.e.,
feminine) in order to please and attract men. Feminine role models’ emphasis on appearance
could activate romantic concerns, which would likely conflict with goals in math or other
“unfeminine” pursuits (Park et al., 2011). Swami and colleagues (2010) also report that
endorsement of appearance norms is associated with objectification, or regarding women’s
bodies (including one’s own) as objects for others’ pleasure (Fredrickson & Roberts, 1997).
Objectification cues, or reminders of how others view one’s body, impair women’s cognition,
wasting energy otherwise needed for intellectual tasks and yielding worse performance on
stereotype-relevant tasks such as math tests (Fredrickson, Roberts, Noll, Quinn, & Twenge,
1998; Gervais, Vescio, & Allen, 2011; Kiefer, Sekaquaptewa, & Barczyk, 2006). Such outcomes
are quite the opposite of what a STEM role model is meant to do, and highlight why extra
caution is called for when considering what kinds of figures are held up for girls and women to
aspire to.
Feminine STEM role models may not be as effective as some may hope, but the
underrepresentation they are designed to address remains a pressing issue. So what kinds of
figures do make good role models? It was argued that reading about singular examples in Study
2 encouraged contrast rather than motivation. Some work has found that women benefit from
reading about multiple role models, whether in STEM (e.g., five famous female engineers; Stout
et al., 2011) or other male-stereotyped domains such as leadership (Dasgupta & Asgari, 2004).
However, other studies suggest that women’s math identification and performance can be
improved by exposure to just one role model (e.g., a mathematically-talented female peer [Marx
76
& Roman, 2002] or a female calculus professor [Stout et al., 2011]). Future research should
assess whether students are best motivated by multiple counterstereotypic examples, or under
which conditions a single role model may be effective. Given the paucity of women in high-
ranking STEM positions (AAUW, 2010), understanding how to harness the power of even a
single counterstereotypically successful woman could have a real impact.
Of note, the current studies only tested the effects of reading about role models, whereas
the individual role models discussed above were real people that the participants actually met.
Some evidence suggests that actual interactions with scientists may be particularly effective at
increasing young girls’ interest in science (Buck et al., 2008). Meeting real people in the field
can change girls’ images of scientists as cartoonishly stereotypic (Bardeen, 2000) or unattainably
successful (Buck et al., 2008) into something more relatable, and thus more inspiring. Good,
Aronson, and Inzlicht’s (2003) successful stereotype threat intervention similarly relied on real
interactions, and found that regular meetings with a single college mentor improved female and
ethnic minority students’ standardized test scores. When students have the opportunity to
actually connect with a role model, one may be sufficient. Perhaps even feminine role models
could be effective in this context, which would allow for conversations about the many kinds of
people in math and science, rather than a simplistic endorsement of feminine appearance.
The intention behind a feminine STEM role model is good, and her appeal may be
intuitive. Efforts to counter stereotypes, whether about academic fields or the people in them, can
undoubtedly help to close educational gaps. Yet, as these four studies show, those efforts must be
carefully calibrated to avoid backfiring. Across these studies, feminine STEM role models either
hurt or failed to help, especially if feminine STEM success seemed unattainable or unlikely, and
regardless of whether the women reading about the role models valued feminine appearance.

77
Attempting to simultaneously counter the stereotype that women are not good at math and
science (by showing successful women in STEM) and the stereotype that women in those fields
are unfeminine (by making those women appear feminine) may be a less effective strategy than
simply showing a diversity of women succeeding in unexpected fields.
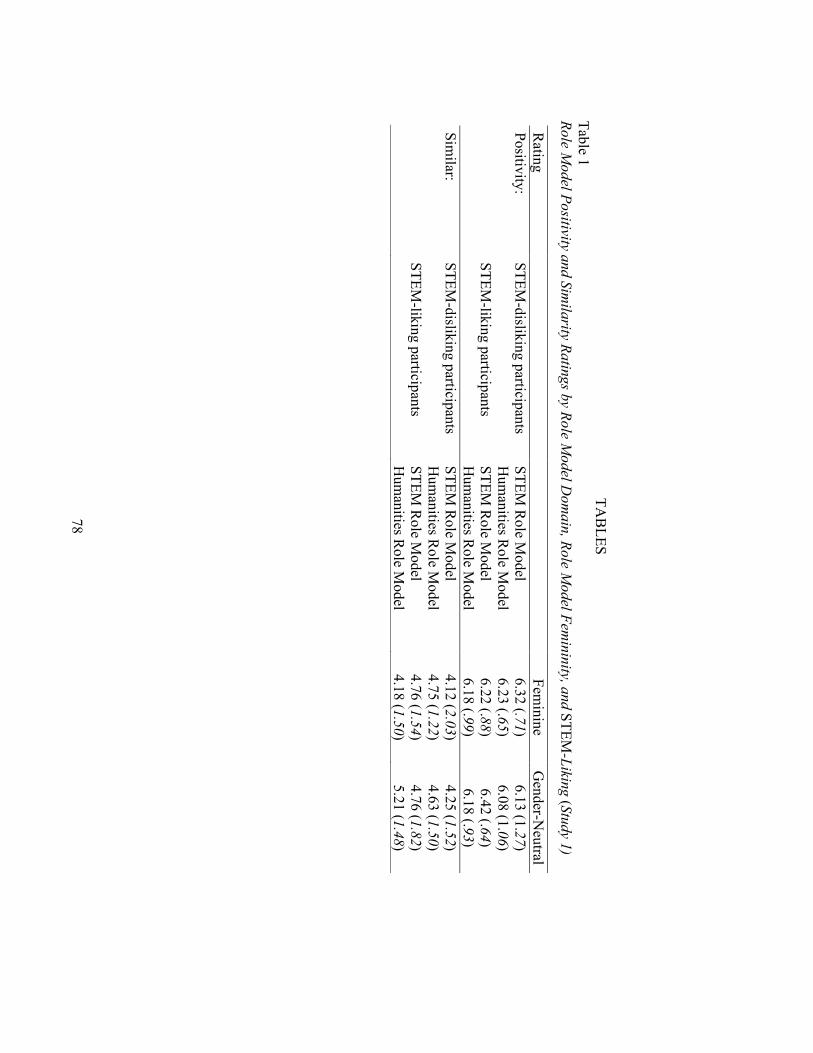
78
TAB
LES Table 1 Role M
odel Positivity and Similarity Ratings by Role M
odel Dom
ain, Role Model Fem
ininity, and STEM-Liking (Study 1)
Rating
Feminine
Gender-N
eutral Positivity:
STEM-disliking participants
STEM R
ole Model
6.32 (.71) 6.13 (1.27)
Hum
anities Role M
odel 6.23 (.65)
6.08 (1.06)
STEM-liking participants
STEM R
ole Model
6.22 (.88) 6.42 (.64)
Hum
anities Role M
odel 6.18 (.99)
6.18 (.93) Sim
ilar: STEM
-disliking participants STEM
Role M
odel 4.12 (2.03)
4.25 (1.52)
H
umanities R
ole Model
4.75 (1.22) 4.63 (1.50)
STEM
-liking participants STEM
Role M
odel 4.76 (1.54)
4.76 (1.82)
H
umanities R
ole Model
4.18 (1.50) 5.21 (1.48)

79
Table 2 Bivariate correlations am
ong role model ratings and outcom
e variables (Study 1)
†p ! .10; *p ! .05; ** p ! .01; *** p ! .001
1
2 3
4 5
6 1. R
ole Model Positivity R
ating --
2. R
ole Model Sim
ilarity Rating
.32*** --
3. Math Self-R
atings .09
.31*** --
4. Future M
ath Plans .03
.22** .53***
--
5. Future English Plans
.15†
.09 .10
.26** --
6. Future Science Plans
.08 .23**
.08 .46***
.23** --
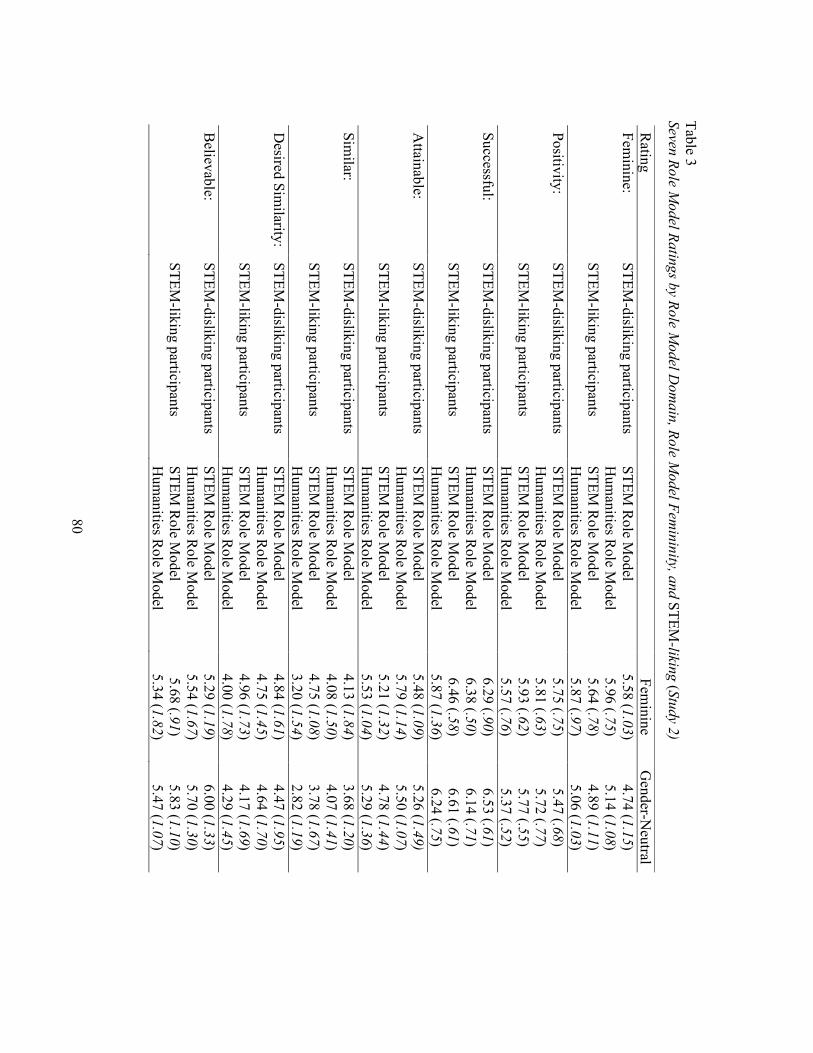
80
Table 3 Seven Role M
odel Ratings by Role Model D
omain, Role M
odel Femininity, and STEM
-liking (Study 2)
Rating
Feminine
Gender-N
eutral Fem
inine: STEM
-disliking participants STEM
Role M
odel 5.58 (1.03)
4.74 (1.15)
H
umanities R
ole Model
5.96 (.75) 5.14 (1.08)
STEM
-liking participants STEM
Role M
odel 5.64 (.78)
4.89 (1.11)
H
umanities R
ole Model
5.87 (.97) 5.06 (1.03)
Positivity: STEM
-disliking participants STEM
Role M
odel 5.75 (.75)
5.47 (.68)
H
umanities R
ole Model
5.81 (.63) 5.72 (.77)
STEM
-liking participants STEM
Role M
odel 5.93 (.62)
5.77 (.55)
H
umanities R
ole Model
5.57 (.76) 5.37 (.52)
Successful: STEM
-disliking participants STEM
Role M
odel 6.29 (.90)
6.53 (.61)
H
umanities R
ole Model
6.38 (.50) 6.14 (.71)
STEM
-liking participants STEM
Role M
odel 6.46 (.58)
6.61 (.61)
H
umanities R
ole Model
5.87 (1.36) 6.24 (.75)
Attainable:
STEM-disliking participants
STEM R
ole Model
5.48 (1.09) 5.26 (1.49)
Hum
anities Role M
odel 5.79 (1.14)
5.50 (1.07)
STEM-liking participants
STEM R
ole Model
5.21 (1.32) 4.78 (1.44)
Hum
anities Role M
odel 5.53 (1.04)
5.29 (1.36) Sim
ilar: STEM
-disliking participants STEM
Role M
odel 4.13 (1.84)
3.68 (1.20)
H
umanities R
ole Model
4.08 (1.50) 4.07 (1.41)
STEM
-liking participants STEM
Role M
odel 4.75 (1.08)
3.78 (1.67)
H
umanities R
ole Model
3.20 (1.54) 2.82 (1.19)
Desired Sim
ilarity: STEM
-disliking participants STEM
Role M
odel 4.84 (1.61)
4.47 (1.95)
H
umanities R
ole Model
4.75 (1.45) 4.64 (1.70)
STEM
-liking participants STEM
Role M
odel 4.96 (1.73)
4.17 (1.69)
H
umanities R
ole Model
4.00 (1.78) 4.29 (1.45)
Believable:
STEM-disliking participants
STEM R
ole Model
5.29 (1.19) 6.00 (1.33)
Hum
anities Role M
odel 5.54 (1.67)
5.70 (1.30)
STEM-liking participants
STEM R
ole Model
5.68 (.91) 5.83 (1.10)
Hum
anities Role M
odel 5.34 (1.82)
5.47 (1.07)
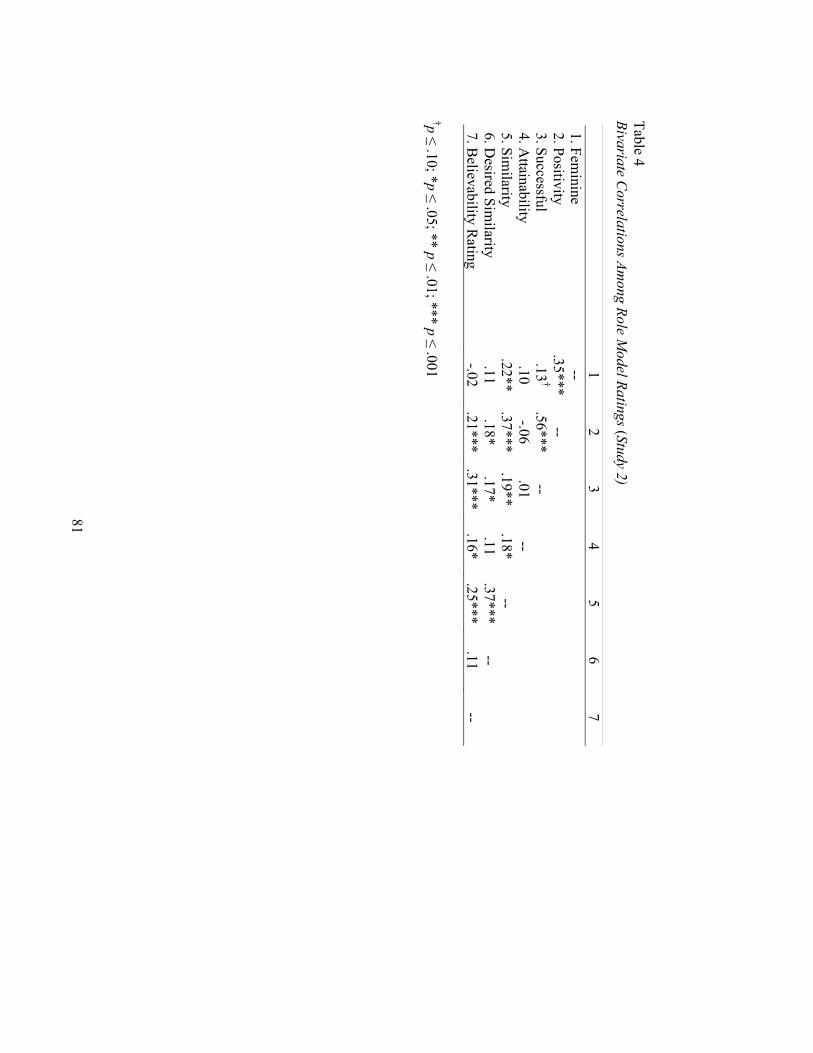
81
Table 4 Bivariate C
orrelations Among Role M
odel Ratings (Study 2)
†p ! .10; *p ! .05; ** p ! .01; *** p ! .001
1
2 3
4 5
6 7
1. Feminine
--
2. Positivity
.35*** --
3. Successful
.13†
.56*** --
4. Attainability
.10 -.06
.01 --
5. Sim
ilarity .22**
.37*** .19**
.18* --
6. Desired Sim
ilarity .11
.18* .17*
.11 .37***
--
7. Believability R
ating -.02
.21*** .31***
.16* .25***
.11 --

82
Table 5 M
ath Self-Ratings by Role Model D
omain, Role M
odel Femininity, and STEM
-Liking (Study 2)
Feminine
Gender-N
eutral STEM
-disliking participants STEM
Role M
odel 3.46 (1.37)
3.53 (1.15)
Hum
anities Role M
odel 3.43 (1.22)
3.70 (1.50)
Control
4.13 (.94) STEM
-liking participants STEM
Role M
odel 4.63 (1.25)
4.37 (1.51)
Hum
anities Role M
odel 4.72 (1.25)
5.01 (.93)
Control
4.75 (1.32)

83
Table 6 Science Self-Ratings by Role M
odel Dom
ain, Role Model Fem
ininity, and STEM-Liking (Study 2)
Feminine
Gender-N
eutral STEM
-disliking participants STEM
Role M
odel 4.32 (1.25)
4.20 (1.01)
Hum
anities Role M
odel 4.06 (1.36)
4.14 (1.25)
Control
4.51 (1.14) STEM
-liking participants STEM
Role M
odel 5.04 (1.10)
4.82 (1.60)
Hum
anities Role M
odel 5.29 (1.12)
5.33 (.86)
Control
5.29 (1.13)

84
Table 7 English Self-Ratings by Role M
odel Dom
ain, Role Model Fem
ininity, and STEM-Liking (Study 2)
Feminine
Gender-N
eutral STEM
-disliking participants STEM
Role M
odel 5.43 (1.00)
5.56 (.69)
Hum
anities Role M
odel 5.55 (.85)
5.33 (1.09)
Control
4.85 (1.30) STEM
-liking participants STEM
Role M
odel 4.59 (.94)
4.23 (1.05)
Hum
anities Role M
odel 4.56 (1.27)
4.30 (1.14)
Control
4.49 (1.10)

85
Table 8 M
ath Plans by Role Model D
omain, Role M
odel Femininity, and STEM
-Liking (Study 2)
Feminine
Gender-N
eutral STEM
-disliking participants STEM
Role M
odel 2.69 (1.73)
2.84 (1.75)
Hum
anities Role M
odel 2.56 (1.87)
2.70 (1.66)
Control
3.43 (1.69) STEM
-liking participants STEM
Role M
odel 4.45 (1.76)
3.44 (1.89)
Hum
anities Role M
odel 3.73 (2.10)
4.32 (1.54)
Control
3.89 (2.17)

86
Table 9 Science Plans by Role M
odel Dom
ain, Role Model Fem
ininity, and STEM-Liking (Study 2)
Feminine
Gender-N
eutral STEM
-disliking participants STEM
Role M
odel 3.55 (1.98)
4.13 (1.91)
Hum
anities Role M
odel 3.63 (2.18)
3.48 (2.02)
Control
3.86 (2.01) STEM
-liking participants STEM
Role M
odel 4.98 (2.02)
4.72 (2.38)
Hum
anities Role M
odel 5.43 (1.64)
5.38 (1.27)
Control
5.25 (1.94)

87
Table 10 English Plans by Role M
odel Dom
ain, Role Model Fem
ininity, and STEM-Liking (Study 2)
Feminine
Gender-N
eutral STEM
-disliking participants STEM
Role M
odel 5.23 (1.48)
5.89 (.81)
Hum
anities Role M
odel 5.90 (1.41)
5.88 (1.21)
Control
5.23 (1.92) STEM
-liking participants STEM
Role M
odel 5.23 (1.57)
4.57 (1.71)
Hum
anities Role M
odel 4.70 (1.78)
4.53 (1.74)
Control
5.13 (1.43)

88
Table 11 M
ath Attempts and Percent of M
ath Attempts that w
ere Correct by Role M
odel Dom
ain, Role Model Fem
ininity, and STEM-Liking
(Study 2)
Outcom
e
Fem
inine G
ender-Neutral
Math A
ttempts:
STEM-disliking participants
STEM R
ole Model
5.23 (2.86) 4.89 (2.92)
Hum
anities Role M
odel 4.92 (2.60)
5.32 (2.87)
C
ontrol 5.45 (4.04)
STEM
-liking participants STEM
Role M
odel 5.00 (2.71)
6.94 (3.33)
H
umanities R
ole Model
7.93 (5.69) 6.12 (3.41)
Control
6.54 (4.49) Percent C
orrect: STEM
-disliking participants STEM
Role M
odel .84 (.23)
.76 (.30)
H
umanities R
ole Model
.85 (.20) .87 (.23)
Control
.85 (.26)
STEM-liking participants
STEM R
ole Model
.86 (.25) .86 (.25)
Hum
anities Role M
odel .93 (.14)
.83 (.19)
C
ontrol .85 (.20)

89
Table 12 Eleven Role M
odel Ratings by Role Model D
omain, Role M
odel Femininity, and STEM
Major (Study 3)
Rating
Feminine
Gender-N
eutral Fem
inine-looking: N
on-STEM M
ajors STEM
Role M
odel 6.14 (1.15)
4.73 (1.32)
H
umanities R
ole Model
5.95 (1.22) 4.96 (1.32)
STEM
majors
STEM R
ole Model
6.22 (.83) 5.22 (1.09)
Hum
anities Role M
odel 6.00 (.78)
4.38 (1.51) Positivity:
Non-STEM
Majors
STEM R
ole Model
6.56 (.44) 5.95 (.72)
Hum
anities Role M
odel 5.81 (.80)
6.07 (.77)
STEM m
ajors STEM
Role M
odel 6.63 (.45)
6.13 (.72)
H
umanities R
ole Model
5.75 (1.02) 5.58 (.86)
Successful: N
on-STEM M
ajors STEM
Role M
odel 6.90 (.30)
6.64 (.66)
H
umanities R
ole Model
6.11 (.94) 6.37 (1.01)
STEM
majors
STEM R
ole Model
6.78 (.44) 6.33 (.50)
Hum
anities Role M
odel 5.93 (1.44)
5.75 (.89) A
cademic:
Non-STEM
Majors
STEM R
ole Model
5.95 (1.20) 5.59 (1.10)
Attainable
H
umanities R
ole Model
5.68 (1.16) 5.85 (1.26)
STEM
majors
STEM R
ole Model
5.89 (1.36) 6.00 (1.00)
Hum
anities Role M
odel 5.71 (1.73)
6.25 (.86) A
ttainable: N
on-STEM M
ajors STEM
Role M
odel 6.29 (1.27)
5.68 (1.64) Fem
inine
Hum
anities Role M
odel 6.63 (.68)
5.67 (1.47)
STEM m
ajors STEM
Role M
odel 6.11 (1.17)
6.11 (.93)
H
umanities R
ole Model
6.36 (1.08) 5.13 (2.17)
Attainable: B
oth N
on-STEM M
ajors STEM
Role M
odel 5.68 (1.62)
5.64 (1.53)
H
umanities R
ole Model
6.16 (.83) 5.67 (1.24)
STEM
majors
STEM R
ole Model
5.78 (1.56) 6.11 (.78)
Hum
anities Role M
odel 5.57 (1.22)
5.88 (1.13) Sim
ilar: N
on-STEM M
ajors STEM
Role M
odel 4.57 (1.50)
3.86 (1.81)
H
umanities R
ole Model
3.74 (2.05) 4.19 (1.73)
STEM
majors
STEM R
ole Model
5.11 (1.05) 5.67 (.87)
Hum
anities Role M
odel 3.71 (1.82)
3.38 (1.51)

90
D
esired Similarity:
Non-STEM
Majors
STEM R
ole Model
6.71 (.72) 6.68 (.57)
Academ
ic
Hum
anities Role M
odel 6.74 (.56)
6.67 (.88)
STEM m
ajors STEM
Role M
odel 6.78 (.44)
6.44 (.73)
H
umanities R
ole Model
6.43 (1.28) 6.75 (.46)
Desired Sim
ilarity: N
on-STEM M
ajors STEM
Role M
odel 5.52 (1.60)
4.27 (2.05) Fem
inine
Hum
anities Role M
odel 5.58 (1.68)
4.31 (2.04)
STEM m
ajors STEM
Role M
odel 5.33 (1.50)
5.33 (1.12)
H
umanities R
ole Model
5.43 (2.03) 4.50 (2.51)
Desired Sim
ilarity: N
on-STEM M
ajors STEM
Role M
odel 6.00 (1.48)
5.19 (1.12) B
oth
Hum
anities Role M
odel 6.05 (.97)
5.30 (1.71)
STEM m
ajors STEM
Role M
odel 6.00 (1.12)
5.89 (.78)
H
umanities R
ole Model
5.86 (1.92) 5.63 (1.51)
Believable
Non-STEM
Majors
STEM R
ole Model
6.25 (.91) 5.91 (.97)
Hum
anities Role M
odel 5.68 (1.25)
5.85 (.95)
STEM m
ajors STEM
Role M
odel 6.11 (.78)
6.44 (1.01)
H
umanities R
ole Model
4.71 (1.44) 5.13 (.84)
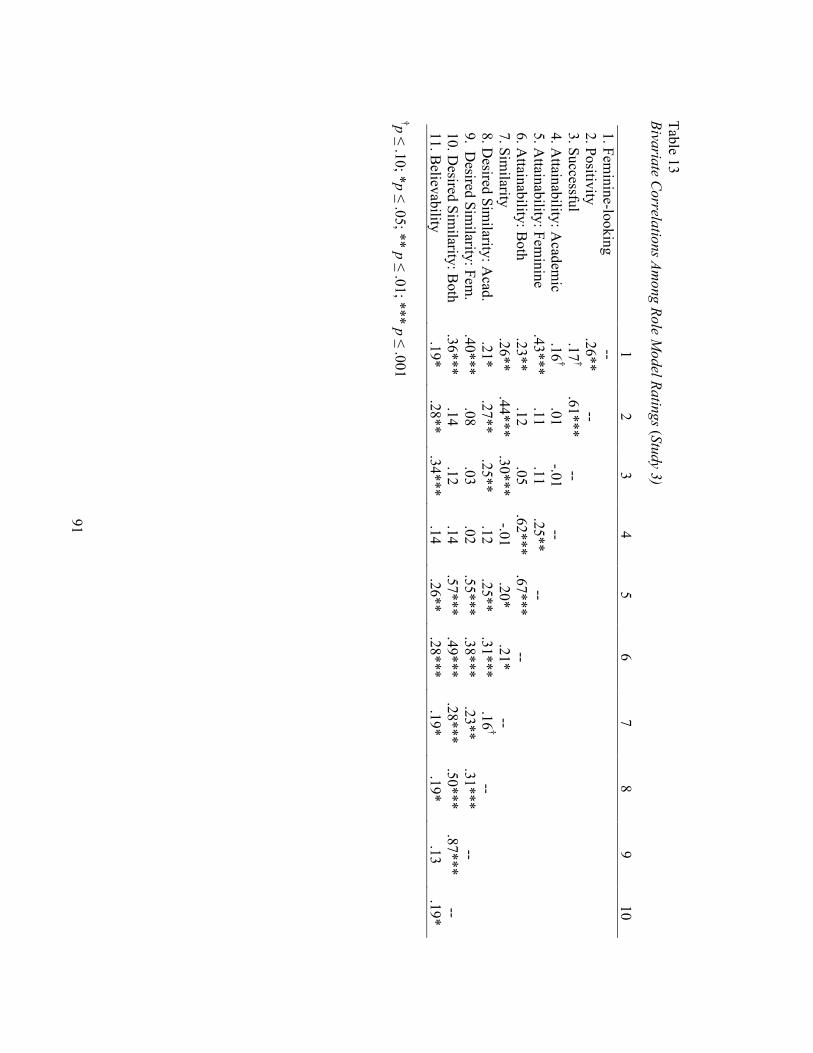
91
Table 13 Bivariate C
orrelations Among Role M
odel Ratings (Study 3)
†p ! .10; *p ! .05; ** p ! .01; *** p ! .001
1
2 3
4 5
6 7
8 9
10 1. Fem
inine-looking --
2. Positivity
.26** --
3. Successful .17
† .61***
--
4. Attainability: A
cademic
.16†
.01 -.01
--
5. A
ttainability: Feminine
.43*** .11
.11 .25**
--
6. Attainability: B
oth .23**
.12 .05
.62*** .67***
--
7. Sim
ilarity .26**
.44*** .30***
-.01 .20*
.21* --
8. D
esired Similarity: A
cad. .21*
.27** .25**
.12 .25**
.31*** .16
† --
9. Desired Sim
ilarity: Fem.
.40*** .08
.03 .02
.55*** .38***
.23** .31***
--
10. Desired Sim
ilarity: Both
.36*** .14
.12 .14
.57*** .49***
.28*** .50***
.87*** --
11. Believability
.19* .28**
.34*** .14
.26** .28***
.19* .19*
.13 .19*

92
Table 14 M
ath Self-Ratings by Role Model D
omain, Role M
odel Femininity, and STEM
Major (Study 3)
Feminine
Gender-N
eutral N
on-STEM M
ajors STEM
Role M
odel 3.99 (1.26)
4.50 (.94)
Hum
anities Role M
odel 3.71 (1.26)
3.45 (1.57)
Control
4.01 (1.37) STEM
Majors
STEM R
ole Model
5.15 (1.50) 5.51 (1.37)
H
umanities R
ole Model
5.11 (.95) 5.30 (1.29)
C
ontrol 4.89 (1.37)

93
Table 15 Science Self-Ratings by Role M
odel Dom
ain, Role Model Fem
ininity, and STEM M
ajor (Study 3)
Feminine
Gender-N
eutral N
on-STEM M
ajors STEM
Role M
odel 4.37 (1.35)
4.74 (1.14)
Hum
anities Role M
odel 4.39 (1.54)
4.77 (1.23)
Control
4.50 (1.32) STEM
Majors
STEM R
ole Model
5.28 (1.15) 5.56 (.69)
H
umanities R
ole Model
5.76 (.78) 4.72 (1.13)
C
ontrol 4.92 (1.00)

94
Table 16 English Self-Ratings by Role M
odel Dom
ain, Role Model Fem
ininity, and STEM M
ajor (Study 3)
Feminine
Gender-N
eutral N
on-STEM M
ajors STEM
Role M
odel 4.68 (1.13)
4.90 (.99)
Hum
anities Role M
odel 5.22 (.96)
5.03 (1.23)
Control
5.07 (1.07) STEM
Majors
STEM R
ole Model
4.34 (1.17) 4.11 (1.09)
H
umanities R
ole Model
4.32 (1.45) 4.05 (1.05)
C
ontrol 4.86 (1.10)

95
Table 17 English Plans by Role M
odel Dom
ain, Role Model Fem
ininity, and STEM M
ajor (Study 3)
Feminine
Gender-N
eutral N
on-STEM M
ajors STEM
Role M
odel 5.64 (1.24)
4.91 (1.53)
Hum
anities Role M
odel 5.21 (1.61)
5.09 (1.77)
Control
5.38 (1.32) STEM
Majors
STEM R
ole Model
4.39 (1.76) 4.06 (1.86)
H
umanities R
ole Model
3.75 (1.92) 4.63 (1.55)
C
ontrol 5.00 (1.78)
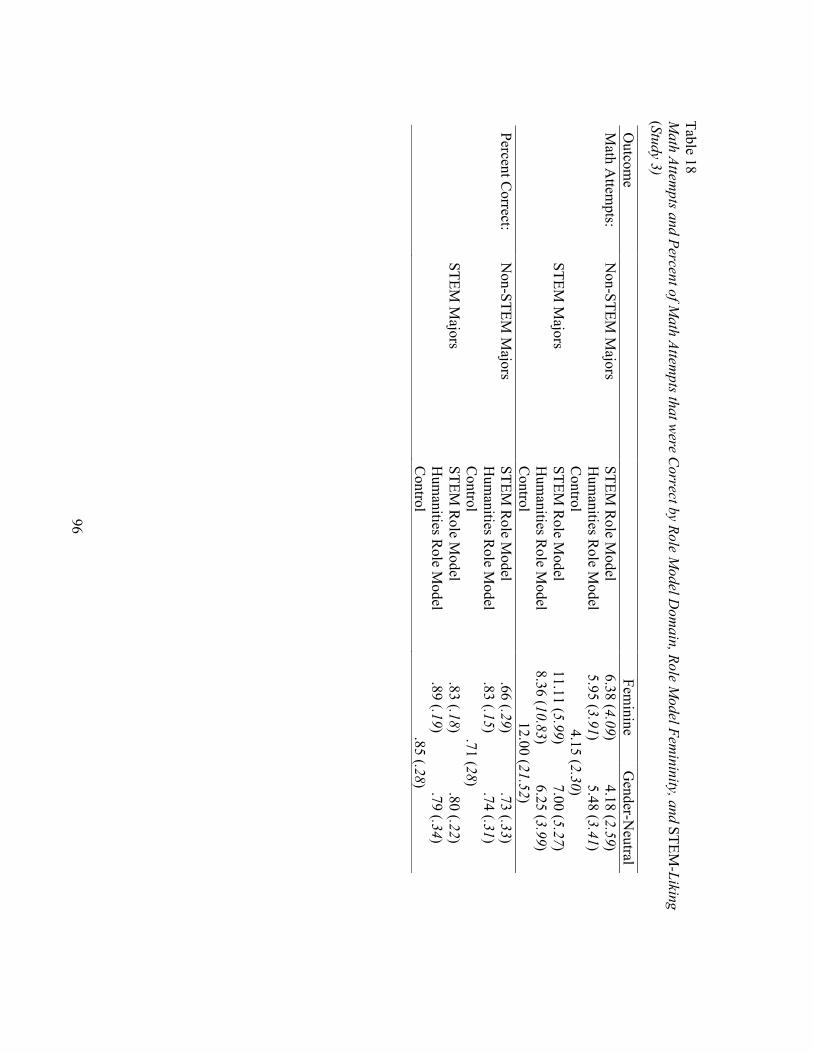
96
Table 18 M
ath Attempts and Percent of M
ath Attempts that w
ere Correct by Role M
odel Dom
ain, Role Model Fem
ininity, and STEM-Liking
(Study 3)
Outcom
e
Fem
inine G
ender-Neutral
Math A
ttempts:
Non-STEM
Majors
STEM R
ole Model
6.38 (4.09) 4.18 (2.59)
Hum
anities Role M
odel 5.95 (3.91)
5.48 (3.41)
C
ontrol 4.15 (2.30)
STEM
Majors
STEM R
ole Model
11.11 (5.99) 7.00 (5.27)
Hum
anities Role M
odel 8.36 (10.83)
6.25 (3.99)
C
ontrol 12.00 (21.52)
Percent Correct:
Non-STEM
Majors
STEM R
ole Model
.66 (.29) .73 (.33)
Hum
anities Role M
odel .83 (.15)
.74 (.31)
C
ontrol .71 (28)
STEM
Majors
STEM R
ole Model
.83 (.18) .80 (.22)
Hum
anities Role M
odel .89 (.19)
.79 (.34)
C
ontrol .85 (.28)
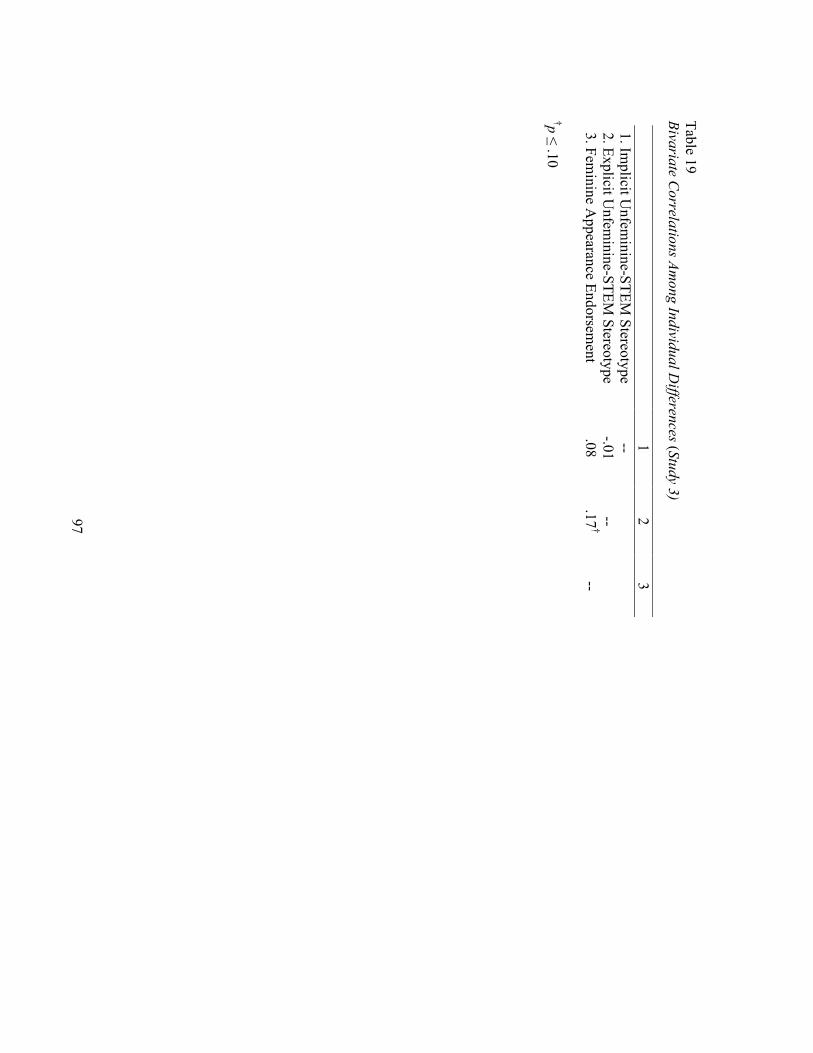
97
Table 19 Bivariate C
orrelations Among Individual D
ifferences (Study 3)
†p ! .10
1
2 3
1. Implicit U
nfeminine-STEM
Stereotype --
2. Explicit Unfem
inine-STEM Stereotype
-.01 --
3. Fem
inine Appearance Endorsem
ent .08
.17†
--
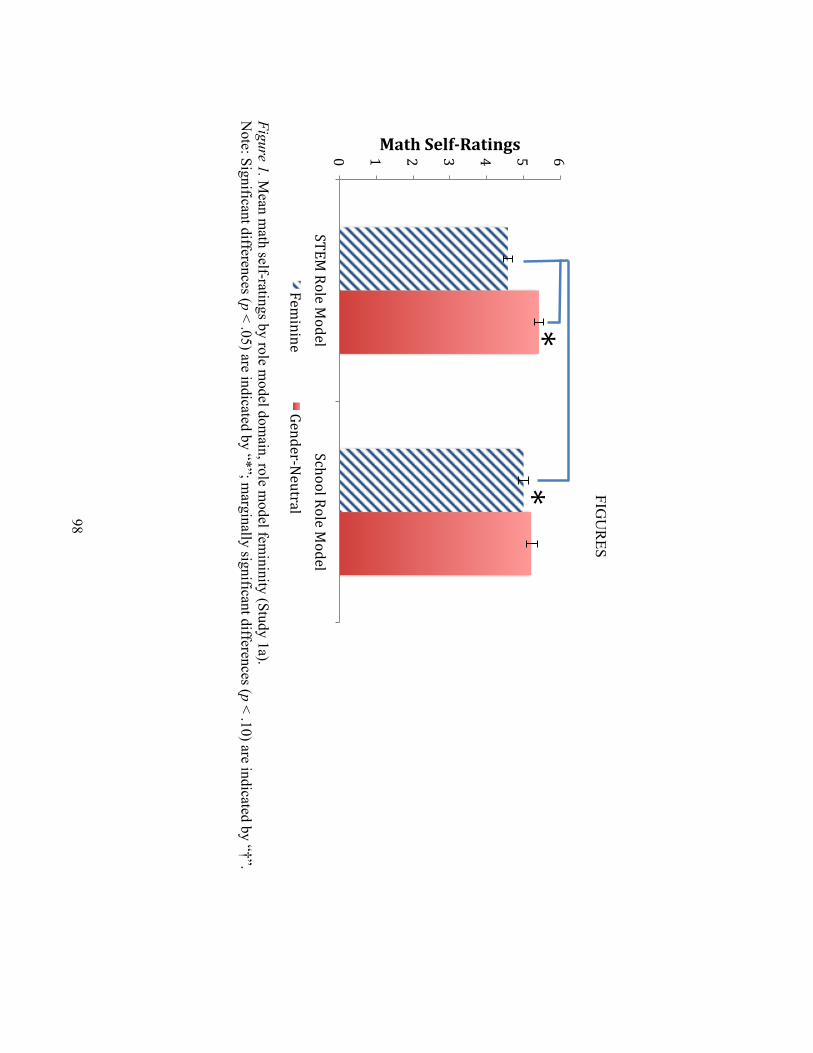
98
FIGU
RES
Figure 1. M
ean math self-ratings by role m
odel domain, role m
odel femininity (Study 1a).
Note: Significant differences (p < .05) are indicated by “*”; m
arginally significant differences (p < .10) are indicated by “†”.
!" #" $" %" &" '" ("
)*+,"-./0",
.10/")23../"-./0",
.10/"
!"#$%&'()*+"#,-./%
40567670"
807109:;0<=9>/"
?"?"

99
Figure 2. M
ean future math plans by role m
odel domain, role m
odel femininity, and participant STEM
-liking (Study 1a). N
ote: Means and standard errors for Future Plans predicted from
AN
CO
VA
with covariate “likelihood of attending college.”
Significant differences (p < .05) are indicated by “*”.
!" #" $" %" &" '" (" @" A"
)*+,"-./0",
.10/")23../"-./0",.10/"
)*+,"-./0",
.10/")23../"-./0",.10/"
)*+,:B6C/6D67E"
)*+,:F6D67E"
!"#$%0("-/%
40567670"
807109:;0<=9>/"
?"?"

100
Figure 3. M
ean rated attainability of combined fem
ininity and STEM success of assigned role m
odel, displayed by STEM liking and
role model fem
ininity (Study 1b). N
ote: Significant differences (p < .05) are indicated by “*”; marginally significant differences (p < .10) are indicated by “†”.
!" #" $" %" &" '" (" @"
)*+,:B6C/6D67E"
)*+,:F6D67E"
1##",-"2,(,#3%+"#,-.%
40567670"-./0",
.10/"807109:;
0<=9>/"-./0",.10/"
G"?"
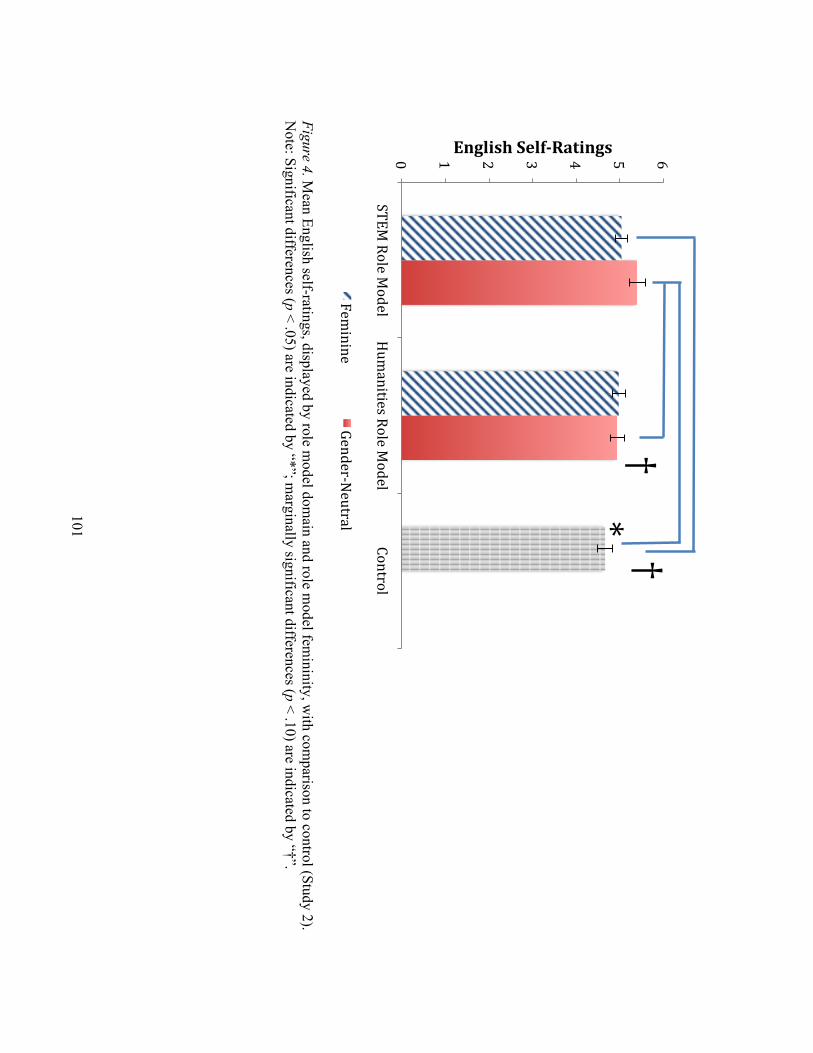
101
Figure 4. M
ean English self-ratings, displayed by role model dom
ain and role model fem
ininity, with com
parison to control (Study 2). N
ote: Significant differences (p < .05) are indicated by “*”; marginally significant differences (p < .10) are indicated by “†”.
!" #" $" %" &" '" ("
)*+,"-./0",
.10/"H<5
>76=60C"-./0",.10/"
I.7=9./"
4-.(,/$%&'()*+"#,-./%
40567670"
807109:;0<=9>/"
G?G

102
Figure 5. M
ean math attem
pts, displayed by role model dom
ain, role model fem
ininity, and STEM-liking, w
ith comparison to control
groups (Study 2). N
ote: Significant differences (p < .05) are indicated by “*”.
!" #" $" %" &" '" (" @" A" J"
#!"
)*+,"-./0"
,.10/"
H<5
>76=60C"-./0",
.10/"I.7=9./"
)*+,"-./0"
,.10/"
H<5
>76=60C"-./0",
.10/"I.7=9./"
)*+,:B6C/6D67E"
)*+,:F6D67E"
!"#$%1##'56#/%
40567670"
807109:;0<=9>/"
?"?"

103
Figure 6. M
ean math self-concept (subscale of m
ath self-ratings), displayed by role model dom
ain and role model fem
ininity, with
comparison to control (Study 2).
Note: Significant differences (p < .05) are indicated by “*”; m
arginally significant differences (p < .10) are indicated by “†”.
!" #" $" %" &" '" ("
)*+,"-./0",
.10/"H<5
>76=60C"-./0",.10/"
I.7=9./"
!"#$%&'()*78-9'6#%
40567670"
807109:;0<=9>/"
G?"
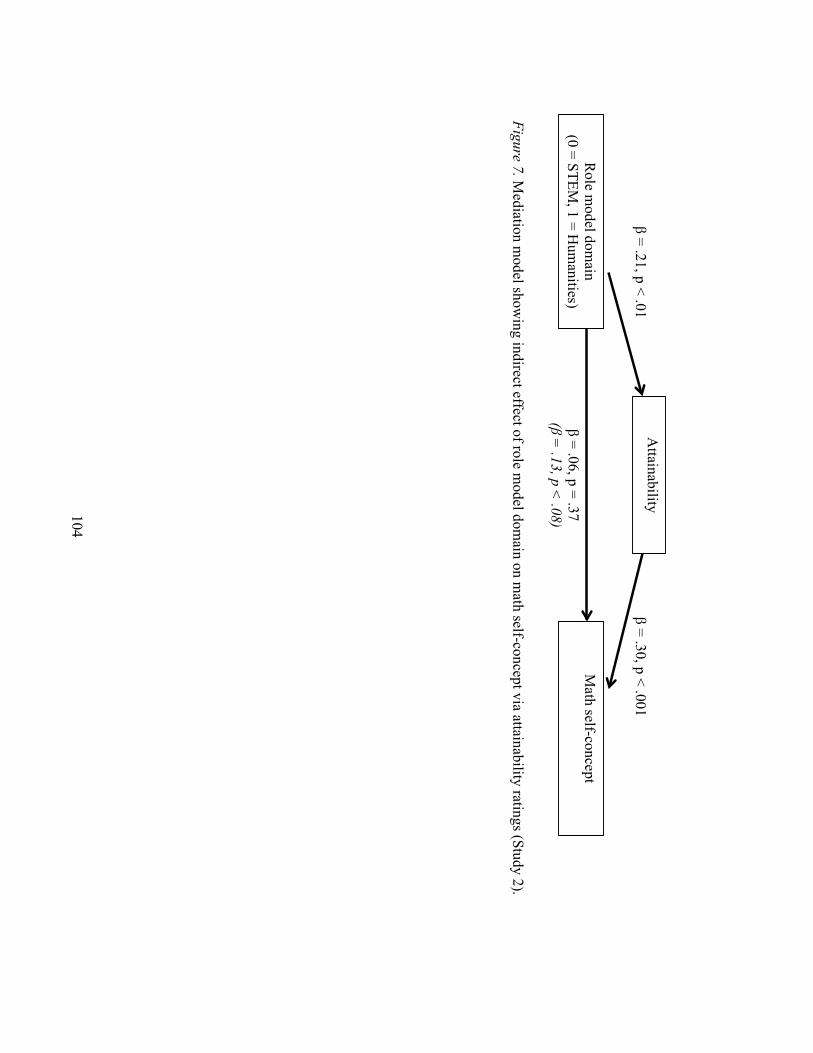
104
Figure 7. Mediation m
odel showing indirect effect of role m
odel domain on m
ath self-concept via attainability ratings (Study 2).
Role m
odel domain
(0 = STEM, 1 = H
umanities)
Math self-concept
Attainability
" = .21, p < .01 " = .30, p < .001
" = .06, p = .37 (! =
.13, p < .08)

105
Figure 8. M
ean math plans displayed by role m
odel domain and role m
odel femininity, w
ith comparison to control (Study 3).
Note: Solid red colum
ns differ from blue striped colum
ns (representing a significant effect of role model fem
ininity), and simple
effects and post-hoc contrasts are denoted with “*” (p < .05) or “†” (p < .10).
!"!K'" #"#K'" $"$K'" %"%K'" &"&K'" '"
)*+,"-./0",
.10/"H<5
>76=60C"-./0",.10/"
I.7=9./"
!"#$%0("-/%
40567670"
807109:;0<=9>/"
G?

106
Figure 9. M
ean science plans displayed by role model dom
ain, role model fem
ininity, and STEM m
ajor, with com
parison to control groups (Study 3). N
ote: Significant differences (p < .05) are indicated by “*”; marginally significant differences (p < .10) are indicated by “†”.
!" #" $" %" &" '" (" @"
)*+,"-./0"
,.10/"
H<5
>76=60C"-./0",
.10/"I.7=9./"
)*+,"-./0"
,.10/"
H<5
>76=60C"-./0",
.10/"I.7=9./"
7.7:)*+,"5>L.9"
)*+,"5>L.9"
&9,'-9'%0("-/%
40567670"
807109:;0<=9>/"
?"?"
G

107
Figure 10. Science self-ratings predicted at one standard deviation above and below
mean im
plicit stereotype scores, displayed by role m
odel domain condition (Study 3).
Note: Significant differences (p < .05) are indicated by “*”.
Note: The m
ean reported science self-ratings in the control condition was 4.66 (1.21).
!" #" $" %" &" '" ("
)*+,"-./0",
.10/"H<5
>76=60C"-./0",.10/"
&9,'-9'%&'()*+"#,-./%
F.M"N5
O/626=")=090.=PO0"Q:#")BR"H6E3"N5
O/626=")=090.=PO0"QS#")BR"
?"?"

108
Figure 11. M
ath plans predicted at one standard deviation above and below m
ean implicit stereotype scores, displayed by role m
odel dom
ain and role model fem
ininity condition (Study 3). N
ote: Significant differences (p < .05) are indicated by “*”. N
ote: The mean reported m
ath plans in the control condition was 3.31 (2.01).
!"
!K'" #"
#K'" $"
$K'" %"
%K'" &"
&K'" '"
40567670"
807109:;0<=9>/"
40567670"
807109:;0<=9>/"
)*+,"-./0",
.10/"H<5
>76=60C"-./0",.10/"
!"#$%0("-/%%
F.M"N5
O/626=")=090.=PO0"Q:#")BR"H6E3"N5
O/626=")=090.=PO0"QS#")BR" ?"?"
?"
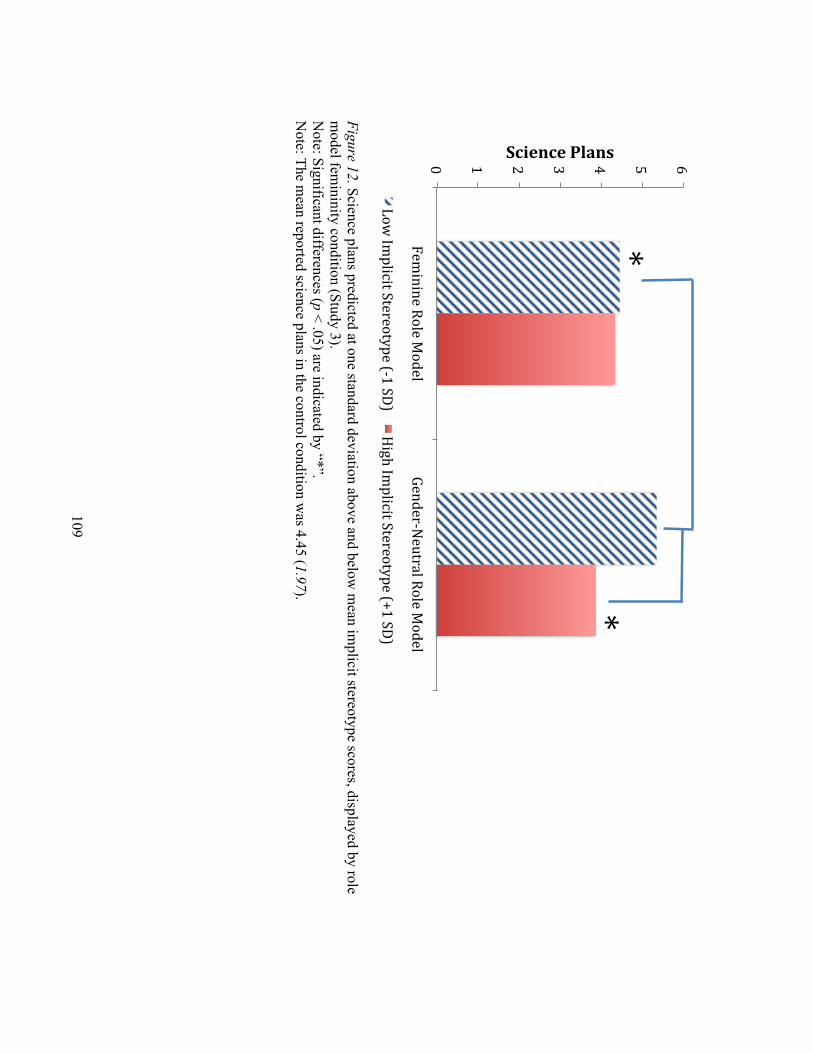
109
Figure 12. Science plans predicted at one standard deviation above and below
mean im
plicit stereotype scores, displayed by role m
odel femininity condition (Study 3).
Note: Significant differences (p < .05) are indicated by “*”.
Note: The m
ean reported science plans in the control condition was 4.45 (1.97).
!" #" $" %" &" '" ("
40567670"-./0",
.10/"807109:;
0<=9>/"-./0",.10/"
&9,'-9'%0("-/%
F.M"N5
O/626=")=090.=PO0"Q:#")BR"H6E3"N5
O/626=")=090.=PO0"QS#")BR"
?"?"

110
Figure 13. M
ath attempts predicted at one standard deviation above and below
mean im
plicit stereotype scores, displayed by role m
odel domain and role m
odel femininity condition (Study 3).
Note: Significant differences (p < .05) are indicated by “*”; m
arginally significant differences (p < .10) are indicated by “†”. N
ote: The mean reported m
ath attempts in the control condition w
as 7.09 (13.51), or 4.74 (2.37) with the rem
oval of one outlier (80 attem
pts).
!" #" $" %" &" '" (" @" A" J"
#!"
40567670"
807109:;0<=9>/"
40567670"
807109:;0<=9>/"
)*+,"-./0",
.10/"H<5
>76=60C"-./0",.10/"
!"#$%1##'56#/%%
F.M"N5
O/626=")=090.=PO0"Q:#")BR"H6E3"N5
O/626=")=090.=PO0"QS#")BR"
G"?"
G"

111
Figure 14. English self-ratings predicted at one standard deviation above and below
mean explicit stereotype scores, displayed by role
model fem
ininity condition (Study 3). N
ote: Significant differences (p < .05) are indicated by “*”. N
ote: The mean reported English self-ratings in the control condition w
as 4.66 (1.21).
!" #" $" %" &" '" ("
40567670"-./0",
.10/"807109:;
0<=9>/"-./0",.10/"
4-.(,/$%&'()*+"#,-./%
F.M"+TO/626=")=090.=PO0"Q:#")BR"
H6E3"+TO/626=")=090.=PO0"QS#")BR"
?"?"
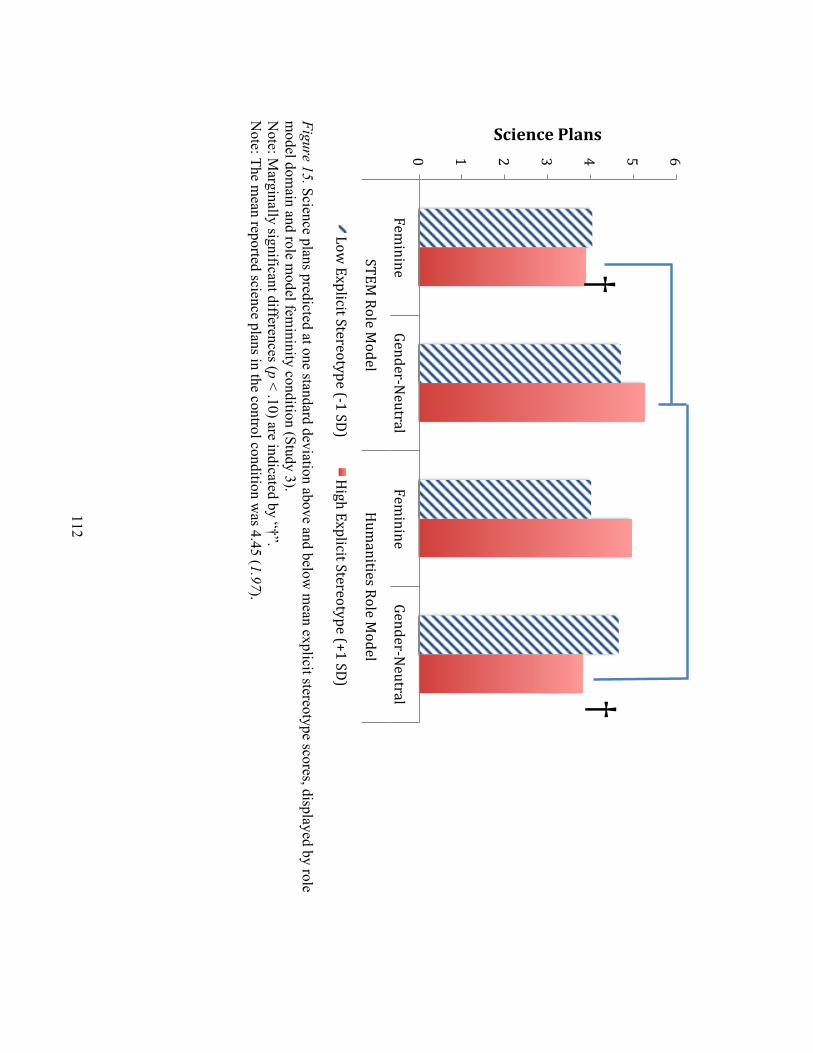
112
Figure 15. Science plans predicted at one standard deviation above and below
mean explicit stereotype scores, displayed by role
model dom
ain and role model fem
ininity condition (Study 3). N
ote: Marginally significant differences (p < .10) are indicated by “†”.
Note: The m
ean reported science plans in the control condition was 4.45 (1.97).
!" #" $" %" &" '" ("
40567670"
807109:;0<=9>/"
40567670"
807109:;0<=9>/"
)*+,"-./0",
.10/"H<5
>76=60C"-./0",.10/"
&9,'-9'%0("-/%%
F.M"+TO/626=")=090.=PO0"Q:#")BR"
H6E3"+TO/626=")=090.=PO0"QS#")BR" G
G

113
Figure 16a. English plans predicted at one standard deviation above and below
mean explicit stereotype scores, displayed by role
model fem
ininity condition (Study 3). N
ote: Significant differences (p < .05) are indicated by “*”. N
ote: The mean reported English plans in the control condition w
as 5.23 (1.49).
!" #" $" %" &" '" ("
40567670"-./0",
.10/"807109:;
0<=9>/"-./0",.10/"
4-.(,/$%0("-/%
F.M"+TO/626=")=090.=PO0"Q:#")BR"
H6E3"+TO/626=")=090.=PO0"QS#")BR"
?"?"

114
Figure 16b. English plans predicted at one standard deviation above and below
mean explicit stereotype scores, displayed by role
model dom
ain condition (Study 3). N
ote: Marginally significant differences (p < .10) are indicated by “†”.
Note: The m
ean reported English plans in the control condition was 5.23 (1.49).
!" #" $" %" &" '" ("
)*+,"-./0",
.10/"H<5
>76=60C"-./0",.10/"
4-.(,/$%0("-/%
F.M"+TO/626=")=090.=PO0"Q:#")BR"
H6E3"+TO/626=")=090.=PO0"QS#")BR"
G"G"
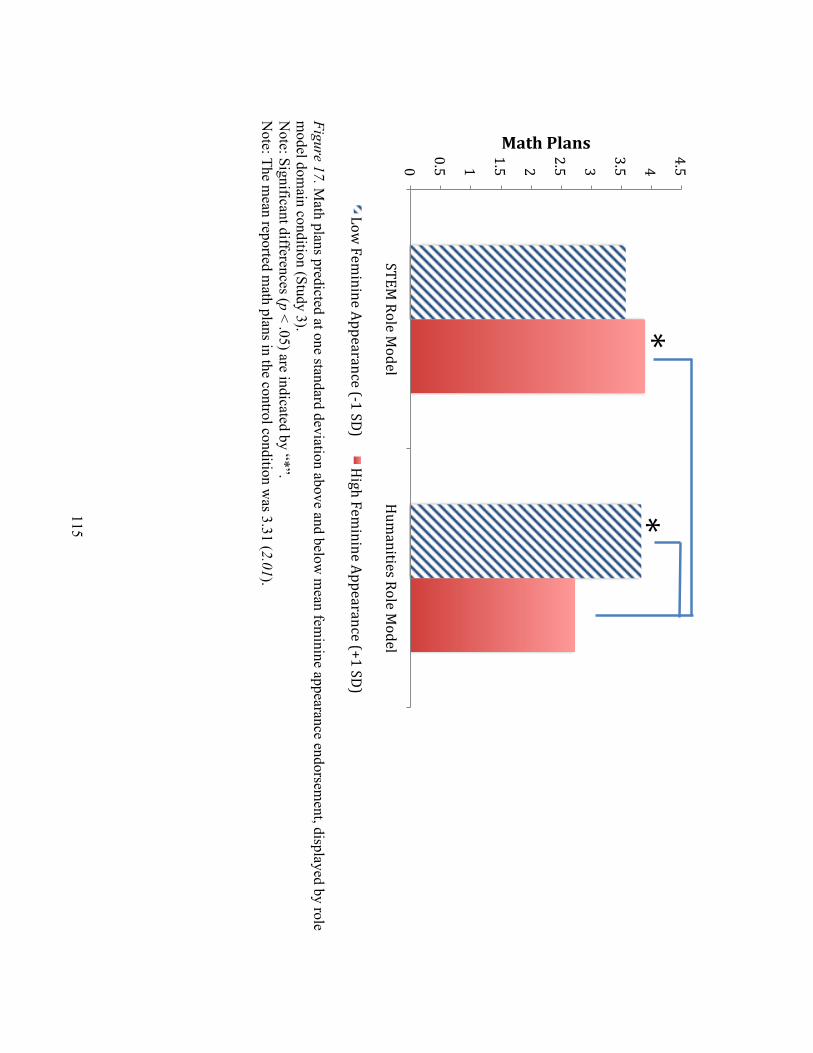
115
Figure 17. M
ath plans predicted at one standard deviation above and below m
ean feminine appearance endorsem
ent, displayed by role m
odel domain condition (Study 3).
Note: Significant differences (p < .05) are indicated by “*”.
Note: The m
ean reported math plans in the control condition w
as 3.31 (2.01).
!"
!K'" #"
#K'" $"
$K'" %"
%K'" &"
&K'"
)*+,"-./0",
.10/"H<5
>76=60C"-./0",.10/"
!"#$%0("-/%
F.M"405
67670"UOO0>9>720"Q:#")BR"H6E3"405
67670"UOO0>9>720"QS#")BR"
?"?"

116
APPENDICES

117
Appendix A
Role Model Stimuli (Study 1a, 1b)
Feminine STEM Role Models

118

119

120
Gender-Neutral School Role Models

121

122

123
Appendix B
Outcome Measures (Studies 1a, 2, and 3)
Self-Rating Items (Studies 1a, 2, and 3)
Note: Participants in Studies 1a, 2 and 3 completed the following items with 7-point scales. The endpoints of each scale are listed at the end of each item. Participants in Study 1a answered the questions as they appear. Participants in Studies 2 and 3 answered the items three times, relating to mathematics, natural science, and humanities (referred to as “math,” “science,” and “English” in this text). The items were averaged into a single self-rating composite for each subject. Participants in Studies 2 and 3 also had small changes made to the wording of the items, indicated by parenthesized additions to items 2, 4, and 9. In Study 3, item 4 was omitted. Self-concept 1. How good at math are you? 1 = not at all good, 7 = very good 2. If you were to rank all the students in your (most recent) math class from the worst to the
best in math, where would you put yourself? 1 = the worst, 7 = the best 3. Compared to most of your other school subjects, how good are you at math? 1 much
worse, 7 = much better 4. How well do you expect to do in math this year (this semester or the next semester that you
take this course)? 1 = not at all well, 7 = very well 5. How good would you be at learning something new in math? 1 = not at all good, 7 =
very good 6. How successful do you think you'd be in a career that required mathematical ability?
1 = not very successful, 7 = very successful Interest 7. Compared to most of your other activities, how much do you like math? 1 = not as
much, 7 = a lot more 8. In general, do you find working on math assignments . . . 1 = very boring, 7 = very
interesting) 9. How much do you like doing (studying) math? 1 = a little, 7 = a lot Importance 10. In general, how useful is what you learn in math? 1 = not at all useful, 7 = very useful 11. For me being good at math is . . . 1 = not at all important, 7 = very important 12. Compared to most of your other activities, how important is it to you to be good at math?
1 = not as important, 7 = a lot more important

124
Future Math Plans Items (Study 1a)
Note: Participants in Study 1a completed the following items with 7-point scales (1 = not at all, 7 = very much so).
1. When you think of yourself in the future, how likely are you to take math classes in high school?
2. When you think of yourself in the future, how likely are you to take science classes in high school?
3. When you think of yourself in the future, how likely are you to take English classes in high school?
4. When you think of yourself in the future, how likely are you to attend college? 5. When you think of yourself in the future, how likely are you to take math classes in
college?
Future Plans Items (Studies 2 and 3)
Note: Participants in Studies 2 and 3 completed the following items with 7-point scales (1 = disagree strongly, 7 = agree strongly).
1. I am looking forward to taking course(s) in this required category: (for natural science, social science, and humanities)
2. I will likely choose to take course(s) from this optional category: (for mathematics, creative expression)
3. If I had to take more classes for graduation, I would consider course(s) in this category: (for all five course categories)
Math Persistence Task (Studies 2 and 3) Note: Participants in Studies 2 and 3 read the instructions below, then had a blank sheet of paper (Study 2) or a text entry box on a computer screen (Study 3) to provide as many solutions as possible. Parentheses contain alterations to the directions seen by Study 3 participants.
For this portion of the study, you will play the 36 game. Use the numbers 2, 3, and 7 to obtain the number 36 in as many ways as you can.
Rules:
• Write (type) your answers in the space below. • You may add, multiply, subtract, and divide. • You may use each number as many times as you like. • You may provide as many solutions as you want. • When you are finished, turn to the next page (click to the next screen).

125
Appendix C
Role Model Stimuli (Study 2)
Feminine STEM Role Model

126
Gender-Neutral Humanities Role Model

127
Appendix D
Single-Category Implicit Association Test Stimuli (Study 3)
Feminine SC-IAT Photographs

128
Unfeminine SC-IAT Photographs

129
Appendix E
Illustration of SC-IAT Task (Study 3)
Appendix D
Role Model Stimuli (Study 3)
Feminine STEM Role Models
Physics
Feminine Math/Science or Unfeminine
X
Feminine Math/Science or Unfeminine
If participant pressed “Z”
O
Feminine Math/Science or Unfeminine
If participant pressed “M”
Feminine Math/Science
or Unfeminine
O
Feminine Math/Science or Unfeminine
If participant pressed “Z”
X
Feminine Math/Science or Unfeminine
If participant pressed “M”

130
Appendix F
Role Model Stimuli (Study 3)
Feminine STEM Role Models

131

132
Gender-Neutral Humanities Role Models

133
134
REFERENCES
American Association of University Women. (2010). Why So Few? Women In Science,
Technology, Engineering, And Mathematics. Washington D. C.: AAUW.
Ambady, N., Shih, M., Kim, A., & Pittinsky, T. L. (2001). Stereotype susceptibility in
children: Effects of identity activation on quantitative performance.
Psychological Science, 12, 385-390.
Athenstaedt, U., Mikula, G., & Bredt, C. (2009). Gender role self-concept and leisure
activities of adolescents. Sex Roles, 60, 399-409.
Bateson, G., Jackson, D. D., Haley, J., & Weakland, J. H. (1963): A note on the double
bind – 1962. Family Process, 2, 154–161.
Bardeen, M. (2000, March 2). Who’s the scientist? Retrieved from
http://ed.fnal.gov/projects/scientists/.
Baron, R. M., & Kenny, D. A. (1986). The moderator–mediator variable distinction in
social psychological research: Conceptual, strategic, and statistical
considerations. Journal of Personality and Social Psychology, 51, 1173–1182.
Bell, L. A. (1996). In danger of winning: Consciousness raising strategies for
empowering girls in the United States. Women’s Studies International Forum, 9,
419-427.
Bem, S. L. (1974). The measurement of psychological androgyny. Journal of Consulting
and Clinical Psychology, 42, 155-162.
135
Betz, D. E. & Sekaquaptewa, D. (2011, July). Challenging gender stereotypes by making math
pink? Surprisingly negative effects of feminine STEM role models. Poster at Challenging
Stereotypes, a Medium-Sized Meeting of the European Association of Social Psychology,
Lisbon, Portugal.
Bittman, M., England, P., Sayer, L., Folbre, N., & Matheson, G. (2003). When does
gender trump money? Bargaining and time in household work. American Journal
of Sociology, 109, 186-214.
Bong, M., & Skaalvik, E. M. (2003). Academic self-concept and self-efficacy: how different are
they really? Educational Psychology Review, 15, 1-40.
Brewer, M. B., & Weber, J. G. (1994). Self-evaluation effects of interpersonal versus intergroup
social comparison. Journal of Personality and Social Psychology, 66, 268-275.
Buck, G. A., Plano Clark, V. L., Leslie-Pelecky, D., Lu, Y., & Cerda-Lizarraga, P. (2008).
Examining the cognitive processes used by adolescent girls and women scientists in
identifying science role models: A feminist approach. Science Education, 92, 688-707.
Ceci, S. J., Williams, W. M., & Barnett, S. M. (2009). Women’s underrepresentation in science:
Sociocultural and biological considerations. Psychological Bulletin, 135, 218-261.
Cheryan, S., & Plaut, V. D. (2010). Explaining underrepresentation: A theory of precluded
interest. Sex Roles, 63,475–488.
Cheryan, S., Plaut, V. C., Davies, P., & Steele, C. M. (2009). Ambient belonging: How
stereotypical environments impact gender participation in computer science. Journal of
Personality and Social Psychology, 97, 1045-1060.
136
Cheryan, S., Siy, J. O., Vichayapai, M., Drury, B. J., & Kim, S. (2011). Do female and male role
models who embody STEM stereotypes hinder women's anticipated success in STEM?
Social Psychological and Personality Science, 2, 656-664.
Cole, E. R., & Zucker, A. N. (2007). Black and White women’s perspectives on femininity.
Cultural Diversity and Ethnic Minority Psychology, 13, 1-9.
Correll, S. J. (2001).Gender and the career choice process: The role of biased self-assessments.
American Journal of Sociology, 106, 1691-1730.
Cundiff, J. L., Matsick, J. L., & Vescio, T. (2011). Cues of belongingness on websites of science,
technology, engineering, and math (STEM) departments. Poster presented at Poster
presented at the 12th Annual Meeting of the Society for Personality and Social
Psychology, San Antonio.
Danaher, K., & Crandall, C. S. (2008). Stereotype threat in applied settings re-examined.
Journal of Applied Social Psychology, 38, 1639-1655.
Dasgupta, N., & Asgari, S. (2004). Seeing is believing: Exposure to counterstereotypic
women leaders and its effect on automatic gender stereotyping. Journal of
Experimental Social Psychology, 40, 642-658.
de Pillis, E., & de Pillis, L. (2008). Are engineering schools masculine and authoritarian? The
mission statements say yes. Journal of Diversity in Higher Education, 1, 33–44.
DeWitt, J., Osborne, J., Archer, L., Dillon, J., Willis, B., & Wong, B. (2011). Young children's
aspirations in science: The unequivocal, the uncertain and the unthinkable. International
Journal of Science Education (ahead-of-print), 1-27. doi:
10.1080/09500693.2011.608197
137
Diekman, A. B., Brown, E. R., Johnston, A. M., & Clark, E. K. (2010). Seeking congruity
between roles and goals: A new look at why women opt out of STEM careers.
Psychological Science, 21, 1051-1057. doi: 10.1177/0956797610377342
Diekman, A. B., Clark, E. K., Johnston, A, M., Brown, E. R., & Steinberg, M. (2011).
Malleability in communal goals and beliefs influences attraction to stem careers:
Evidence for a goal congruity perspective. Journal of Personality and Social Psychology,
101, 902-918. doi: 10.1037/a0025199
Eagly, A. H. (2007). Female leadership advantage and disadvantage: Resolving the
contradictions. Psychology of Women Quarterly, 31, 1–12. doi: 0361-6843/07
Eccles, J. S. (1994). Understanding women’s educational and occupational choices: Applying the
Eccles et al. model of achievement-related choices. Psychology of Women Quarterly, 18,
585-609.
Eccles (Parsons), J., Adler, T., & Meece, J. L. (1984). Sex differences in achievement: A
test of alternate theories. Journal of Personality and Social Psychology, 46, 26-
43.
Else-Quest, N. M., Hyde, J. S., & Linn, M. C. (2010). Cross-national patterns of gender
differences in mathematics and gender equity: A meta-analysis. Psychological Bulletin,
136, 103–127. doi:10.1037/a0018053
Faulkner, W. (2009). Doing gender in engineering workplace cultures. II. Gender in/authenticity
and the in/visibility paradox. Engineering Studies, 1, 169–189.
Flicker, E. (2003). Between brains and breasts—Women scientists in fiction film: On the
marginalization and sexualization of scientific competence. Public Understanding
of Science, 12, 307-318.
138
Flicker, E. (2007). Women scientists in mainstream film: Social role models—a
contribution to the public understanding of science from the perspective of film
sociology. In B. Huppauf & P. Weingart (Eds.), Science images and popular
images of the sciences (pp. 241-256). New York, NY: Routledge.
Forsythe, S., Drake, M. F., & Cox, C. E. (1985). Influence of applicant's dress on interviewer's
selection decisions. Journal of Applied Psychology, 70, 374-378.
Fredrickson, B. L., & Roberts, T. A. (1997). Objectification theory: Toward
understanding women’s lived experiences and mental health risks. Psychology of
Women Quarterly, 21, 173–206.
Fredrickson, B., Roberts, T., Noll, S., Quinn, D., & Twenge, J. (1998). That swimsuit
becomes you: Sex differences in self-objectification, restrained eating, and math
performance. Journal of Personality and Social Psychology, 75, 269–284.
Frome, P. M., Alfeld, C. J., Eccles, J. S., & Barber, B. L. (2006). Why don’t they want a
male-dominated job? An investigation of young women who changed their
occupational aspirations. Educational Research and Evaluation, 12, 359-372.
Frome, P. M., & Eccles, J. S. (1998). Parents' influence on children's achievement-related
perceptions. Journal of Personality and Social Psychology, 84, 435-452.
Gervais, S. J. Vescio, T. K., & Allen, J. (2011). When what you see is what you get: The
consequences of the objectifying gaze for men and women. Psychology of
Women Quarterly, 35, 5-17.
Good, C., & Aronson, J. (2008). The development of stereotype threat: Consequences for
social and educational equality. In E. Turiel, C. Wainryb, and J. Smetana (Eds.),

139
Social Development, Social Inequalities, and Social Justice, (pp 155-183). New
York, NY: Lawrence Erlbaum Associates.
Good, C., Aronson, J., & Inzlicht, M. (2003). Improving adolescents' standardized test
performance: An intervention to reduce the effects of stereotype threat. Journal
of Applied Developmental Psychology, 24, 645-662.
Gottfredson, L. S. (1981). Circumscription and compromise: A developmental theory of
occupational aspirations. Journal of Counseling Psychology Monograph, 28, 545-579.
Greenwald, A. G., McGhee, D. E., & Schwartz, J. L. K. (1998). Measuring individual
differences in implicit cognition: The Implicit Association Test. Journal of Personality
and Social Psychology, 79, 1022-1038.
Halim, M. L., & Ruble, D. (2010). Gender identity and stereotyping in early and middle
childhood. In J. C. & D. R. McCreary (Eds.), Handbook of Gender Research in
Psychology. (1st ed., pp. 495-525). New York: Springer.
Hannover, B., & Kessels, U. (2004). Self-to-prototype matching as a strategy for making
academic choices. Why German high school students do not like math and science.
Learning and Education, 14, 51-67.
Hartman, H., & Hartman, M. (2008). How undergraduate engineering students perceive
women’s (and men’s) problems in science, math, and engineering. Sex Roles, 58, 251-
265.
Hayes, A. F., & Preacher, K. J. (2013). Statistical mediation analysis with a multicategorical
independent variable. Unpublished manuscript. Retrieved from
http://www.afhayes.com/public/hpcatx.pdf

140
Heilman, M. E., & Okimoto, T. G. (2007). Why are women penalized for success at male tasks?:
The implied communality deficit. Journal of Applied Psychology, 92, 81-92.
Heilman, M. E., Wallen, A. S., Fuchs, D., & Tamkins, M. M. (2004). Penalties for success:
Reactions to women who succeed at male gender-typed tasks. Journal of Applied
Psychology, 89, 416–427 doi: 10.1037/0021-9010.89.3.416
Hewlett, S. A., Buck Luce, C., Servon, L. J., Sherbin, L., Shiller, P., Sosnovich, E., & Sumberg,
K. (2008). The Athena Factor: Reversing the brain drain in science, engineering and
technology (Harvard Business Review Research Report). Boston: Harvard Business
Publishing.
Hill, J. P., & Lynch, M. E. (1983). The intensification of gender-related role expectations during
early adolescence. In J. Brooks-Gunn & A. C. Petersen (Eds.), Girls at puberty (pp. 201-
228). New York: Plenum Press.
Horner, M. (1969). A bright woman is caught in a double bind. Reprinted in Richard Steiger &
Roy A. Helton, Jr. Going to the Source. Belmont, CA: Wadsworth, 1989.
Hoyt, C. L. (2012). Inspirational or self-deflating: The role of self-efficacy in elite role model
effectiveness. Social Psychological and Personality Science 4, 290-298 .
Hoyt, C. L., & Simon, S. L. (2011). Female leader role models: Injurious or inspiring?
Psychology of Women Quarterly, 35, 143–157.
Huguet, P., & Régner, I. (2007). Stereotype threat among schoolgirls in quasi-ordinary classroom
circumstances. Journal of Educational Psychology, 99, 545-560.
Huguet, P., & Régner, I. (2009). Counter-stereotypic beliefs in math do not protect school girls
from stereotype threat. Journal of Experimental Social Psychology, 45, 1024-1027.

141
Hunt, J. (2010). Why do women leave science and engineering? National Bureau of Economic
Research Working Paper 15853. Retrieved from http://www.nber.org/papers/w15853
Hyde, J. S., Lindberg, S. M., Linn, M. C., Ellis, A., & Williams, C. (2008, July 25). Gender
similarities characterize math performance. Science, 321, 494–495.
doi:10.1126/science.1160364
Jones, R., & Bangert, A. (2006). The “CSI” effect: changing the face of science. Science Scope,
30, 38-42. Retrieved from
http://www3.nsta.org/main/news/stories/science_scope.php?news_story_ID=528
Jorgenson, J. (2002). Engineering selves: Negotiating gender and identity in technical work.
Management Communications Quarterly, 15, 350-380.
Kahneman, D., & Tversky, A. Subjective probability: A judgment of representativeness.
Cognitive Psychology, 1972, 430-454.
Karpinski, A., & Steinman, R. (2006). The Single Category Implicit Association Test as a
measure of implicit social cognition. Journal of Personality and Social Psychology, 91,
16-32.
Kelly, A., & Smail, B. (1986). Sex stereotypes and attitudes to science among eleven-year-old
children. British Journal of Educational Psychology, 56, 158-68.
Kemmelmeier, M., & Oyserman, D. (2001). The ups and downs of thinking about a successful
other: Self-construals and consequences of upward social comparison. European Journal
of Social Psychology, 31, 311-320.
Kessels, U. (2005). Fitting into the stereotype: How gender-stereotyped perceptions of prototypic
peers relate to liking for school subjects. European journal of psychology of education,
20, 309-323.
142
Kiefer, A.K. & Sekaquaptewa, D. (2007). Implicit stereotypes, gender identification, and math-
related outcomes: A prospective study of female college students. Psychological Science,
18, 13-18.
Kiefer, A. K., & Sekaquaptewa, D. (2007). Implicit stereotypes and women’s math performance:
How implicit gender-math stereotypes influence women’s susceptibility to stereotype
threat. Journal of Experimental Social Psychology, 43, 825–832.
Kiefer, A., Sekaquaptewa, D., & Barczyk, A. (2006).When appearance concerns make women
look bad: Solo status and body image concerns diminish women’s academic
performance. Journal of Experimental Social Psychology 42, 78–86.
Kleminski, A. (2006). CSI: The new face of the male gaze. Global Media Journal, 14. Retrieved
from
http://lass.calumet.purdue.edu/cca/gmj/fa06/graduatefa06/gmj_grad_fa06_kleminski.htm
Kyle, D. J., & Mahler, H. I. M. (1996). The effects of hair color and cosmetic use on perceptions
of a female’s ability. Psychology of Women Quarterly, 20, 447-455.
Lee, J. D. (1998). Which kids can “become” scientists? Effects of gender, self-concepts, and
perceptions of scientists. Social Psychology Quarterly, 61, 199-219.
Lindberg, S. M., Hyde, J. S., Petersen, J. L., & Linn, M. C. (2010). New trends in gender and
mathematics performance: A meta-analysis. Psychological Bulletin, 6, 1123-1135. doi:
10.1037/a0021276
Lockwood, P. (2006). “Someone like me can be successful”: Do college students need same-
gender role models? Psychology of Women Quarterly, 30, 36-46.
Lockwood, P., & Kunda, Z. (1997). Superstars and me: Predicting the impact of role models on
the self. Journal of Personality and Social Psychology, 73, 91-103.
143
Logel, C., Walton, G., Spencer, S. J., Iserman, E. C., von Hippel, W., & Bell, A. E. (2009).
Interacting with sexist men triggers social identity threat among female engineers.
Journal of Personality and Social Psychology, 96, 1089–1103.
Long, M., Steinke, J., Applegate, B., Knight Lapinski, M., Johnson, M. J., & Ghosh, S.
(2010). Portrayals of male and female scientists in television programs popular
among middle school-age children. Science Communication, 32, 356-382.
Mahalik, J. R., Morray, E. B., Coonerty-Femiano, A., Ludlow, L. H., Slattery, S. M., & Smiler,
A. (2005). Development of the Conformity to Feminine Norms Inventory. Sex Roles, 52,
417-435.
Marx, D. M., & Roman, J. S. (2002) Female role models: Protecting women’s math test
performance. Personality and Social Psychology Bulletin, 28, 1183-1193.
Mattel.com (n.d.) The vote is in: Barbie® unveils her 125th and 126th careers. Retrieved
November 3, 2011 from: http://www.barbiemedia.com/?page=21&story=48
Maume, D. J. (2006). Gender differences in restricting work efforts because of family
responsibilities. Journal of Marriage and Family, 68(4), 859-869.
McKellar, D. (2007). Math Doesn’t Suck: How To Survive Middle School Math Without Losing
Your Mind Or Breaking A Nail. New York: Penguin.
Miyake, A., Kost-Smith, L. E., Finkelstein, N. D., Pollock, S. J., Cohen, G. L., & Ito, T. A.
(2010, November 26). Reducing the gender achievement gap in college science: A
classroom study of values affirmation. Science, 330, 1234-1237.
Moore, M. R. (2006). Lipstick or Timberlands? Meanings of gender presentation in black lesbian
communities. Signs: Journal of Women in Culture and Society, 32, 113-139.
Mussweiler, T., Rüter, K., & Epstude, K. (2004). The ups and downs of social comparison:
144
Mechanisms of assimilation and contrast. Journal of Personality and Social Psychology,
87, 832–844.
Muzzatti, B., & Agnoli, F. (2007). Gender and mathematics: Attitudes and stereotype threat
susceptibility in Italian children. Developmental Psychology, 43, 747-759.
Nash, R., Fieldman, G., Hussey, T., Leveque, J. L., Pineau, P. (2006). Cosmetics: They influence
more than Caucasian female facial attractiveness. Journal of Applied Social Psychology,
36, 493-504.
National Science Foundation (2007). Women, Minorities, and Persons with Disabilities in
Science and Engineering. Arlington, VA.
Nosek, B. A., Banaji, M. R., & Greenwald, A. G. (2002). Math = me, me = female, therefore
math ! me. Journal of Personality and Social Psychology, 83, 44-59.
Nosek, B. A., Smyth, F. L., Sriram, N., Lindner, N. M., Devos, T., Ayala, A., Bar-Anan, Y.,
Bergh, R., Cai, H., Gonsalkorale, K., Kesebir, S., Maliszewski, N., Neto, F., Olli, E.,
Park, J., Schnabel, K., Shiomura, K., Tulbure, B., Wiers, R. W., Somogyi, M., Akrami,
N., Ekehammar, B., Vianello, M., Banaji, M. R., & Greenwald, A. G. (2009). National
differences in gender-science stereotypes predict national sex differences in science and
math achievement. Proceedings of the National Academy of Sciences, 106, 10593-10597.
Oyserman, D., & Fryberg, S. A. (2006). The possible selves of diverse adolescents: Content
and function across gender, race and national origin. In C. Dunkel & J. Kerpelman
(Eds.), Possible Selves: Theory, Research, and Applications (pp. 17-39). Huntington,
NY: Nova.

145
Oyserman, D., Gant, L., & Ager, J. (1995). A socially contextualized model of African
American identity: Possible selves and school persistence. Journal of Personality
and Social Psychology, 69, 1216-1232.
Pajares, F. (2005). Gender differences in mathematics self-efficacy beliefs. In A. M. Gallagher &
J. C. Kaufman (Eds.), Gender differences in mathematics: An integrative psychological
approach (pp. 294–315). New York: Cambridge University Press.
Park, L. E., Young, A. F., Troisi, J. D., & Pinkus, R. T. (2011). Effects of everyday
romantic goal pursuit on women’s attitudes toward math and science.
Personality and Social Psychology Bulletin, 37, 1259-1273.
Phelan, J. E., & Rudman, L. A. (2010). Prejudice toward female leaders: backlash effects
and women’s impression management dilemma. Social and Personality
Psychology Compass 4, 807–820.
Plant, E. A., Baylor, A. L., Doerr, C. E., & Rosenberg-Kima, R. B. (2009). Changing
middle- school students’ attitudes and performance regarding engineering with
computer- based social models. Computers and Education, 53, 209–15.
PR Newswire. (2009, May 7). Nearly two-thirds of Americans can't name a famous
female scientist according to national survey by L'Oreal USA. Retrieved from
http://ca.sys-con.com/node/953308
Pronin, E., Steele, C. M., & Ross, L. (2004). Identity bifurcation in response to stereotype
threat: Women and mathematics. Journal of Experimental Social Psychology, 40,
152-168.

146
Ramsey, L. R., & Sekaquaptewa, D. (2010). Changing stereotypes, changing grades: A
longitudinal study of stereotyping during a college math course. Social Psychology of
Education, 1-11.
Revkin, A. C. (2012, December 18). Two video views of science as a ‘girl thing’. The
New York Times. Retrieved from
http://dotearth.blogs.nytimes.com/2012/12/18/two-video-views-of-science-as-a-
girl-thing/
Roberts, L. R., & Petersen, A. C. (1992). The relationship between academic achievement and
social self-image during early adolescence. Journal of Early Adolescence, 12, 197-219.
Rudman, L. A. (2004). Sources of implicit attitudes. Current Directions in Psychological
Science, 13, 79-82.
Rudman, L. A., & Glick, P. (2001). Prescriptive gender stereotypes and backlash towards agentic
women. Journal of Social Issues, 57, 743-762.
Schmader, T., Johns, M., & Barquissau, M. (2004). The costs of accepting gender differences:
The role of stereotype endorsement in women’s experience in the math domain. Sex
Roles, 50, 835-850.
Sekaquaptewa, D., & Thompson, M. (2003). Solo status, stereotype threat, and performance
expectancies: Their effects on women’s performance. Journal of Experimental Social
Psychology, 39, 68–74.
Sengupta, R. (2006). Reading representations of Black, East Asian, and White women in
magazines for adolescent girls. Sex Roles, 54, 799–808.

147
Simpkins, S. D., Davis-Kean, P. E., & Eccles, J. S. (2006). Math and science motivation: A
longitudinal examination of the links between choices and beliefs. Developmental
Psychology, 42, 70-83.
Spencer, S. J., Steele, C. M., & Quinn, D. M. (1999). Stereotype threat and women’s math
performance. Journal of Experimental Social Psychology, 35, 4-28.
Steele, J. R., & Ambady, N. (2006). “Math is hard!” The effect of gender priming on women's
attitudes. Journal of Experimental Social Psychology, 42, 428–436.
Steinke, J. (2005). Cultural representations of gender and science: Portrayals of female scientists
and engineers in popular films. Science Communication, 27, 27-63.
Steinke, J. (2012). Portrayals of female scientists in the mass media. The International
Encyclopedia of Media Studies. doi: 10.1002/9781444361506.wbiems070
Stout, J. G., Dasgupta, N., Hunsinger, M., & McManus, M. (2011). STEMing the tide:
Using ingroup experts to inoculate women’s self-concept and professional goals
in science, technology, engineering, and mathematics (STEM). Journal of
Personality and Social Psychology, 100, 255–270.
Swami, V., Coles, R., Wyrozumska, K., Wilson, E., Salem, N., & Furnham, A. (2010).
Oppressive beliefs at play: Associations among beauty ideals and practices and
individual differences in sexism, objectification of others, and media exposure.
Psychology of Women Quarterly, 34, 365-379.
Tolman, D. L., Impett, E. A., Tracy, A.. J., & Michael, A. (2006). Looking good, sounding good:
Femininity ideology and adolescent girls’ mental health. Psychology of Women
Quarterly, 30, 85-95.
148
Tracey, T. J. G. (2001). The development of structure of interests in children: Setting the stage.
Journal of Vocational Behavior 59, 89–104.
Twenge, J. M. (1999). Mapping gender: The multifactoral approach and the organization of
gender-related attributes. Psychology of Women Quarterly, 23, 485–502.
United States Department of Commerce. (2011). Women in STEM: A gender gap to innovation.
Retrieved from: http://www.esa.doc.gov/sites/default/files/reports/documents/
womeninstemagaptoinnovation8311.pdf
Wigfield, A., Eccles, J. S., Mac Iver, D., Reuman, D. A., & Midgley, C. (1991). Transitions
during early adolescence: Changes in children's domain-specific self-perceptions and
general self-esteem across the transition to junior high school. Developmental
Psychology, 27, 552-565.
Yoder, J. D., & Schleicher, T. L. (1996). Undergraduates regard deviation from occupational
gender stereotypes as costly for women. Sex Roles, 34, 171-188.