FEM simulation of a crack propagation in a round bar under...
11
FEM simulation of a crack propagation in a round bar under combined tension and torsion fatigue loading Item type Article Authors Citarella, Roberto; Maligno, Angelo; Shlyannikov, Valery Citation Citarella, R. et al (2015) 'FEM simulation of a crack propagation in a round bar under combined tension and torsion fatigue loading ', Fracture and Structural Integrity, No. 31. pp. 138-147. DOI: 10.3221/IGF-ESIS.31.11 DOI 10.3221/IGF-ESIS.31.11 Publisher Italian Group of Fracture Journal Fracture and Structural Integrity Downloaded 13-Jun-2018 23:33:20 Link to item http://hdl.handle.net/10545/621556
Transcript of FEM simulation of a crack propagation in a round bar under...

FEM simulation of a crack propagation in a round bar undercombined tension and torsion fatigue loading
Item type Article
Authors Citarella, Roberto; Maligno, Angelo; Shlyannikov, Valery
Citation Citarella, R. et al (2015) 'FEM simulation of a crackpropagation in a round bar under combined tension andtorsion fatigue loading ', Fracture and Structural Integrity,No. 31. pp. 138-147. DOI: 10.3221/IGF-ESIS.31.11
DOI 10.3221/IGF-ESIS.31.11
Publisher Italian Group of Fracture
Journal Fracture and Structural Integrity
Downloaded 13-Jun-2018 23:33:20
Link to item http://hdl.handle.net/10545/621556
R. Citarella et alii, Frattura ed Integrità Strutturale, 31 (2015) 138-147; DOI: 10.3221/IGF-ESIS.31.11
138
FEM simulation of a crack propagation in a round bar under combined tension and torsion fatigue loading R.Citarella, M.Lepore Dept. of Industrial Engineering – University of Salerno - Fisciano (SA), Italy. [email protected] A. Maligno Institute for Innovation in Sustainable Engineering, University of Derby, Quaker Way, DE1 3HD Derby (UK). [email protected] V. Shlyannikov Researches Center for Power Engineering Problems of Russian Academy of Sciences, Lobachevsky Street, 2/31, 420111, Kazan, Russia. [email protected]
ABSTRACT. An edge crack propagation in a steel bar of circular cross-section undergoing multiaxial fatigue loads is simulated by Finite Element Method (FEM). The variation of crack growth behaviour is studied under axial and combined in phase axial+torsional fatigue loading. Results show that the cyclic Mode III loading superimposed on the cyclic Mode I leads to a fatigue life reduction. Numerical calculations are performed using the FEM software ZENCRACK to determine the crack path and fatigue life. The FEM numerical predictions have been compared against corresponding experimental and numerical data, available from literature, getting satisfactory consistency. KEYWORDS. Surface flaw; Tension and torsion; Crack growth prediction; FEM; G-criterion. INTRODUCTION
umerical modelling of three-dimensional (3D) fatigue crack growth under mixed mode conditions represents a crucial factor in fracture mechanics in order to assess the residual life of components. The fatigue growth analysis of surface cracks is one of the most important elements for structural integrity prediction of the circular
cylindrical metallic components (bars, wires, bolts, shafts, etc.), in the presence of initial and accumulated in service damages. In most cases, part-through flaws appear on the free surface of the cylinder and defects are approximately considered as semi-elliptical cracks. Multi-axial loading conditions including tension/compression, bending and torsion are typical for the circular cylindrical metallic components of engineering structures. The problem of residual fatigue life prediction of such type of structural elements is complex and the closed solution is often not available because surface flaws are three-dimensional in nature.
N

R. Citarella et alii, Frattura ed Integrità Strutturale, 31 (2015) 138-147; DOI: 10.3221/IGF-ESIS.31.11
139
In [1], experimental and numerical results of fatigue crack growth for a crack starting from a straight-fronted edge notch in an elastic bar under axial loading with or without superimposed cyclic torsion are given and the influence of different loading conditions on fatigue life of cylindrical specimens is discussed. The relations between crack opening displacement and the crack length measured on the free specimen surface are obtained, and it is shown that the growth of the crack fronts is dependent on the initial notch depth. Using the aforementioned relations, the crack front shape and crack growth rate in the depth direction can be predicted. The numerical simulations in [4] are based on the Dual Boundary Element Method [2-3] whereas, in this paper, the same calculations are performed based on the Finite Element Method (FEM). In the past a comparison between FEM and DBEM results on this kind of problems was already attempted but considering separately the two loading conditions [4-5]; now the comparison is extended in case of simultaneous application of the torsion and traction fatigue loads. The computational 3D fracture analyses deliver variable mixed mode conditions along the crack front. FRACTURE MECHANICS SIMULATIONS BY ZENCRACK Introduction
he numerical studies are based on finite element (FE) analyses using the adaptive remeshing approach. This study employs ZENCRACK [6-8] for automated 3D remeshing and crack propagation calculations along with ABAQUS [9] as the finite element solver.
ZENCRACK is a 3D crack analysis tool able to read in an uncracked finite element model and to produce a cracked finite element model. Stress intensity factors are calculated automatically from the results of the cracked finite element analysis. Furthermore, crack growth can be undertaken by extending the crack position. An updated finite element model is then created and run to simulate crack growth (Fig. 1).
USER INPUT(FE mesh of
uncracked comp.)
USER INPUT(crack location, size)
ZENCRACK(Creates mesh of
crack comp.)
FE CODE (Analysis)
ZENCRACK (Evaluation of crack growth
and update FE mesh)
ZENCRACK (Next FE analyses)STOP
No Yes
USER INPUT(FE mesh of
uncracked comp.)
USER INPUT(crack location, size)
ZENCRACK(Creates mesh of
crack comp.)
FE CODE (Analysis)
ZENCRACK (Evaluation of crack growth
and update FE mesh)
ZENCRACK (Next FE analyses)STOP
No Yes
Figure 1: Flow chart for crack growth prediction analysis. Crack growth criteria In order to predict linear elastic fracture mechanics (LEFM) crack growth using FE method, three basic parameters are required: stress intensity factors (SIF), crack propagation direction (CPD) and crack growth material models. There are several approaches to calculating Stress Intensity Factors (SIF’s) such as: the crack tip opening displacement (CTOD) approach [5], the crack tip stress field approach [10] and the SIF extraction method from J-integral [5]. Using the crack opening displacement approach the SIF values can be obtained as follows:
2 24 1
p pI b b
EK u u
r
(1a)
2 24 1
p pII n n
EK u u
r
(1b)
2 24 1
p pIII n n
EK u u
r
(1c)
T

R. Citarella et alii, Frattura ed Integrità Strutturale, 31 (2015) 138-147; DOI: 10.3221/IGF-ESIS.31.11
140
where and E are Poisson’s ratio and Young’s modulus respectively. The displacement up is evaluated at a point P on the crack front sufficiently close to the crack tip. The displacements p
bu , pnu , and p
tu are projections of up on the coordinate
directions of the local crack front coordinate system and = π and = -π denote upper and lower crack surfaces respectively. KI, KII and KIII are the Mode I, II and III SIF’s. In the present work the SIF’s are extracted from the J-integral using the method illustrated in [11], based on the following equation:
2 2 21 1
2I II IIIJ K K KE G
(2)
where 2/ (1 )E E for plain strain conditions. The quarter-point node technique is used to model the crack-tip singularity. Under mixed mode conditions it is necessary to introduce an equivalent stress intensity factor, Keq, considering Mode I, II and III simultaneously. Several formulae have been proposed for Keq and the most commonly used expression is [12, 13]:
2 2 21eq I II IIIK K K K (3)
In order to determine new crack front positions, the CPD must be computed. Although expressions exist to calculate the crack growth angle based upon the stress intensity factors, an alternative method is adopted here based on the maximum energy release rate at a crack front point. The G-criterion states that a crack will grow in the direction of maximum energy release rate. The CPD, = o, is then determined by:
0o
dG
d
; 2
0o
dG
d
The application of a series of virtual crack extensions (Fig. 2) ultimately generates a growth angle at the crack front node that, in the general case, may be out-of-plane.
(a) (b)
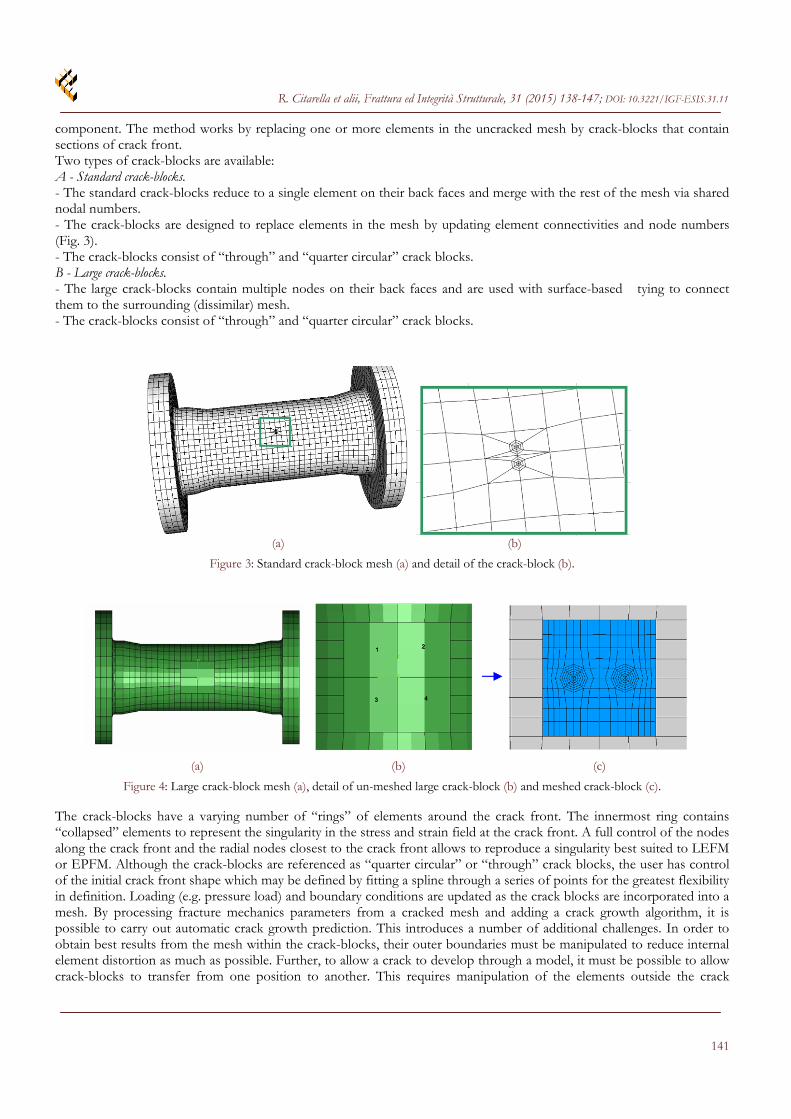
Figure 2: Energy based calculation of Gmax (a) and crack grow direction (b). Remeshing technique A critical issue that must be addressed in 3D FE fracture mechanics analysis is that of mesh generation. In the simplest of geometric cases where symmetry can be used, it may be possible to utilise standard mesh generation tools to produce a crack of the required size. In the general case, however, the use of standard tools leads to several time consuming problems including: • Component geometries are often complex and time consuming to model in their uncracked forms. • Defects often occur at geometrically difficult locations e.g. corners, welds, chamfers. • Initial cracks of the correct size and shape must be inserted into the component at the correct location. • Cracks may develop in a non-planar fashion depending upon the loading. The approach that has been successfully adopted here is the use of ‘crack blocks’ which model the details of the cracked region. Crack-blocks are groups of elements arranged in such a way that they contain a section of crack front. Fig. 3-4 demonstrate the use of the crack-block methodology in generating a cracked mesh from a user-supplied intact
R. Citarella et alii, Frattura ed Integrità Strutturale, 31 (2015) 138-147; DOI: 10.3221/IGF-ESIS.31.11
141
component. The method works by replacing one or more elements in the uncracked mesh by crack-blocks that contain sections of crack front. Two types of crack-blocks are available: A - Standard crack-blocks. - The standard crack-blocks reduce to a single element on their back faces and merge with the rest of the mesh via shared nodal numbers. - The crack-blocks are designed to replace elements in the mesh by updating element connectivities and node numbers (Fig. 3). - The crack-blocks consist of “through” and “quarter circular” crack blocks. B - Large crack-blocks. - The large crack-blocks contain multiple nodes on their back faces and are used with surface-based tying to connect them to the surrounding (dissimilar) mesh. - The crack-blocks consist of “through” and “quarter circular” crack blocks.
(a) (b)
Figure 3: Standard crack-block mesh (a) and detail of the crack-block (b).
(a) (b) (c)
Figure 4: Large crack-block mesh (a), detail of un-meshed large crack-block (b) and meshed crack-block (c). The crack-blocks have a varying number of “rings” of elements around the crack front. The innermost ring contains “collapsed” elements to represent the singularity in the stress and strain field at the crack front. A full control of the nodes along the crack front and the radial nodes closest to the crack front allows to reproduce a singularity best suited to LEFM or EPFM. Although the crack-blocks are referenced as “quarter circular” or “through” crack blocks, the user has control of the initial crack front shape which may be defined by fitting a spline through a series of points for the greatest flexibility in definition. Loading (e.g. pressure load) and boundary conditions are updated as the crack blocks are incorporated into a mesh. By processing fracture mechanics parameters from a cracked mesh and adding a crack growth algorithm, it is possible to carry out automatic crack growth prediction. This introduces a number of additional challenges. In order to obtain best results from the mesh within the crack-blocks, their outer boundaries must be manipulated to reduce internal element distortion as much as possible. Further, to allow a crack to develop through a model, it must be possible to allow crack-blocks to transfer from one position to another. This requires manipulation of the elements outside the crack

R. Citarella et alii, Frattura ed Integrità Strutturale, 31 (2015) 138-147; DOI: 10.3221/IGF-ESIS.31.11
142
blocks, again to reduce distortion in the mesh. Of course there is no single method of crack modelling and remeshing that can be used for all crack geometries. However, the combination of standard and large crack-blocks in conjunction with mesh manipulation algorithms, allows many difficult problems to be handled. TEST MATERIAL AND SPECIMENS
he test material is carbon steel R2M. Its main mechanical properties including constants of the Paris equation (Eq. 4) are listed in Tab. 1 where E is the Young’s modulus, b is the nominal ultimate tensile strength, 0 is the monotonic tensile yield strength, u is the true ultimate tensile strength, n is the strain hardening exponent, C (the
numerical value is consistent with a Young modulus and remote applied stress expressed in MPa and distances expressed in mm) and m are the Paris constants.
mdaC K
dN (4)
E [MPa] b [MPa] 0 [MPa] u [MPa] n C m
209000 810.3 540.8 890 6.134 4.1 10-13 2.818
Table 1: Mechanical properties of steel R2M.
The specimen geometry configuration is shown in Fig. 5: the nominal diameter is equal to 10 mm in the test section and the length, including the clamped part, is equal to 100 mm. Using linear cutting machine, surface edge cracks were cut with initial flaw depths b0=1.0 mm.
Figure 5: Details of the specimen geometry.
The geometric parameters of specimen test section and of growing crack are shown in Fig. 6a-b: b is the current crack depth, with the crack front approximated by an elliptical curve with major axis 2c and minor axis 2b. The crack length a is obtained by measuring the distance between the advancing crack break through point and the notch break through point, as shown in Fig. 6a. The depth of the initial straight edge notch is denoted by h and the initial notch length by L. The crack opening displacement is measured on the free specimen cylindrical surface, in the central plane of symmetry as shown in Fig. 6b. For the simple cyclic axial fatigue tests, the specimens are tested with an applied maximum remote stress equal to 250 MPa and with a stress ratio R=0.1. The combined tension/torsion tests are performed with the same stress ratio, applying synchronous and in-phase tensile and shear stresses whose maximum values are respectively equal to 250 and 100 MPa. Two different frequency values (10 and 7 Hz) were applied to the specimens in order to highlight the crack front geometry during propagation: during each test, beach marks were produced on each specimen by reducing the applied frequency from 10 to 7 Hz, when the surface crack length was approximately equal to a 1mm. The typical beach marks on the post mortem cross section of different specimens are shown in Fig. 7a-b.
T

R. Citarella et alii, Frattura ed Integrità Strutturale, 31 (2015) 138-147; DOI: 10.3221/IGF-ESIS.31.11
143
a) b)
Figure 6: Edge crack geometric parameters: section view (a) and lateral view (b).
a) b)
Figure 7: Photograph of the cross section of specimens (a-pure tension, b-tension+torsion).
EXPERIMENTAL RESULTS
he evolution of the crack growth rate of the elliptical-fronted edge cracks during the tests is determined using COD measurement and information from the microscope. In order to study the crack growth in shafts under fatigue tension loading with superimposed cyclic torsion, several specimens are tested with an initial notch depth
equal to 1 mm. Fig. 8a-b show plots of the break through point advances a and of COD against the number of cycles N under pure tension and combined tension+torsion, respectively: in-phase cyclic torsion loading superimposed on cyclic tension leads to a fatigue life decreasing.
a) b)
Figure 8: Fatigue crack growth (a) and COD curves on free surface of specimens (b).
T

R. Citarella et alii, Frattura ed Integrità Strutturale, 31 (2015) 138-147; DOI: 10.3221/IGF-ESIS.31.11
144
Fig. 9a-b represent the superficial crack growth rate da/dN versus crack length a and versus COD, under pure cyclic tension and combined tension+torsion. It can be seen that there is not a significant reduction of the crack growth rates along the external surface direction when the cyclic Mode III loading is superimposed on the cyclic tension. However, looking at Fig. 7b and considering changes in the general durability of the specimens in pure tension and combined loading (Fig. 8a-b), significant differences in the crack growth rate in the depth direction b under the above types of loading conditions are expected.
a) b)
Figure 9: Crack growth rate as a function of superficial crack length (a) and COD (b). FEM MODEL
he crack propagation in the cylindrical specimens N.1 and 2 (Fig. 10a-b), undergoing combined traction-torsion fatigue loads, is simulated by the FEM model shown in Fig. 11. Such model has a length equal to 60 mm, with one end clamped and the other end constrained along the in plane radial directions and loaded along the axial and
tangential directions. The mesh is made with 18960 quadratic elements (brick with 20 nodes “C3D20”): such number of elements is nearly constant during the propagation. The whole propagations take nearly one hour calculus on a powerful PC. The initial crack, as indicated by experimental measurements (beach mark technique) has the following sizes: a=0.855 mm, b=0.852 mm, c=3.705 mm. During the propagation, the average crack advance at each step is equal to 0.2 mm. As previously said, the SIF’s along the crack front are calculated by the J-Integral approach. The crack growth rate is calculated by the Paris formula (Eq. 4), whose calibration parameters are shown in Tab. 1. The crack path is calculated using the G-criterion.
a) b)
Figure 10: Geometry of specimens N. 1 (a) and N. 2 (b).
T

R. Citarella et alii, Frattura ed Integrità Strutturale, 31 (2015) 138-147; DOI: 10.3221/IGF-ESIS.31.11
145
Figure 11: FEM model with highlight of mesh, remote appled tractions and torque.
NUMERICAL RESULTS AND DISCUSSION
n Fig. 12 it is possible to see the crack propagation, starting from the initial configuration (step 0) and proceeding through the step 11 up to the final step 21: the crack kinking coming from the superimposed torsion is evident. A qualitative comparison between the numerical and experimental (Fig. 7b) crack shape is possible.
STEP 0
STEP 11
STEP 21
Figure 12: Contour plot of Von Mises stresses (MPa) at different stages of crack propagation, with external and internal views of the growing crack. In Fig. 13 it is possible to appreciate the good level of correlation between experimental and numerical (FEM and DBEM [1]) crack growth rates for both the analyzed specimens. The numerical simulation starts from the first traced crack front, so that there is no comparison available in the initial stage of experimental monitored crack growth.
I

R. Citarella et alii, Frattura ed Integrità Strutturale, 31 (2015) 138-147; DOI: 10.3221/IGF-ESIS.31.11
146
In Fig. 14 the growth angle from the initial cracked configuration is shown with its variation along the crack front and against the analyzed crack growth criteria: it is possible to see that the all criteria provide similar predictions. At the beginning of crack growth, the growth rate of the crack front midpoint is faster than that at the intersection with the surface (break through points): the reason is that the maximum stress-intensity factor (Fig. 15) is attained at the deepest point of the initial crack front. Consequently, a straight-fronted notch evolves towards a curved front and the flaw aspect ratio b/c increases. In Fig. 16 the crack depth as calculated by DBEM [1] and by FEM (ZENCRACK) is shown along the crack propagation, proving a satisfactory level of consistency between the aforementioned computational approaches.
Figure 13: Superficial crack length (mm) vs. cycles for the analyzed specimens (considering the outcomes of the DBEM code Beasy and of the FEM code ZENCRACK).
Figure 14: Growth angle, from the four different criteria, as varying along the initial crack front (considering the outcomes of the DBEM code Beasy and of the FEM code ZENCRACK).
Figure 15: SIF’s (MPamm) along the crack front related to the first step (considering the outcomes of the DBEM code Beasy and of the FEM code ZENCRACK).
Figure 16: Crack advance (mm) of crack front center point point vs. number of cycles.
CONCLUSIONS
he computed FEM crack propagation results are found to be in good qualitative (the crack path) and quantitative (the crack growth rates) agreement with experimental findings and numerical outcomes available from literature. A rather complex 3D crack growth behavior is present in case of superimposed tension and in phase torsion and
the fatigue life is decreased if compared to a pure tension fatigue load. This is related to the increase of the mode mixity effect. Moreover, it can be emphasized the reduced calculation times of the FEM approach, in comparison with the DBEM approach shown in [1], the latter providing some advantages in the preprocessing phase (e.g. remeshing during crack propagation). The crack insertion and the whole crack propagation is fully automatic, with repeated remeshing realized at
T

R. Citarella et alii, Frattura ed Integrità Strutturale, 31 (2015) 138-147; DOI: 10.3221/IGF-ESIS.31.11
147
each crack step nearly without user intervention. Consequently, for the cases analyzed, the functionality of the proposed procedure can be stated. REFERENCES
[1] Citarella, R., Lepore, M., Shlyannikov, V., Yarullin, R., Fatigue surface crack growth in cylindrical specimen under
combined loading, Engineering Fracture Mechanics, 131 (2014) 439-453. [2] Calì, C., Citarella, R., Perrella, M., Three-dimensional crack growth: numerical evaluations and experimental tests,
European Structural Integrity Society, In: Biaxial/Multiaxial Fatigue and Fracture, Edited by Andrea Carpinteri, Manuel de Freitas and Andrea Spagnoli, 31 (2003) 3-504.
[3] Citarella R., Perrella M., Multiple surface crack propagation: numerical simulations and experimental tests, Fatigue and Fracture of Engineering Material and Structures, 28 (2005) 135-148.
[4] Citarella, R., Buchholz, F.-G., Comparison of crack growth simulation by DBEM and FEM for SEN-specimens undergoing torsion or bending loading, Engineering Fracture Mechanics, 75 (2008) 489–509.
[5] Citarella, R., Cricrì, G., Comparison of DBEM and FEM Crack Path Predictions in a notched Shaft under Torsion, Engineering Fracture Mechanics, 77 (2010) 1730-1749.
[6] ZENCRACK manual, Version 7.9. [7] Maligno, A.R., Rajaratnam, S., Leen, S.B., Williams, E.J., A three-dimensional (3D) numerical study of fatigue crack
growth using remeshing techniques, Engineering Fracture Mechanics, 77 (2010) 94–111. [8] Maligno, A.R., Citarella, R., Silberschmidt, V.V., Soutis, C., Assessment of Structural Integrity of Subsea Wellhead
System: Analytical and Numerical Study, Fracture and Structural Integrity (Frattura ed Integrità Strutturale), 31(2015) 97-119. DOI: 10.3221/IGF-ESIS.31.08.
[9] ABAQUS User’s and Theory Manuals, Version 6.5, HKS Inc. (2005). [10] Dhondt, G., Application of the Finite Element Method to mixed-mode cyclic crack propagation calculations in
specimens, International Journal of Fatigue, 58 (2014) 2–11. [11] Shih, C. F., Asaro, R. J., Elastic-plastic and asymptotic fields of interface cracks, International Journal of Fracture,
42(2) (1990) 101-116. [12] Adrian, PC., Aliabadi MH., Dual boundary element assessment of three-dimensional fatigue crack growth, Engng
Anal Boundary Elements, 28 (2004) 1157–73. [13] Guagliano, M., Vergani, L., A simplified approach to crack growth prediction in a crank shaft, Fatigue Fract Engng
Mater Struct, 17(5) (1994) 1295–306.