Felicity Shanahan & Michael Redington. Recipients of FTA Funding (Grantees) All Subrecipients and...
33
MIS REPORTING FOR FTA Felicity Shanahan & Michael Redington
-
Upload
tatiana-kemble -
Category
Documents
-
view
221 -
download
3
Transcript of Felicity Shanahan & Michael Redington. Recipients of FTA Funding (Grantees) All Subrecipients and...
MIS REPORTING FOR FTA
Felicity Shanahan&Michael Redington

WHO?
Recipients of FTA Funding (Grantees) All Subrecipients and Covered Contractors
Any employer that is required to have a FTA Drug & Alcohol Testing Program

WHY?
655.72 – Reporting of Results Prepare Annual Summary of Drug &
Alcohol Testing Results Submit to FTA, when requested Responsible for Accuracy & Timeliness
Grantee responsible for Subrecipients & Covered Contractors

HOW DO I KNOW TO SUBMIT?
Grantees Receive Notification Letter – (Dec/Jan)
Username & Password – Access to DAMIS https://DAMIS.DOT.GOV
Due Date = March 15th
Instructions for Revising Subrecipient/Contractor List

USING DAMISHTTPS://DAMIS.DOT.GOV
Allows Grantees to Enter Testing Results Provides Subrecipients/Contractors
Username & Passwords Status .PDF of MIS Submission
DAMIS = Drug and Alcohol Management Information System

UPDATE SUBS & CONTRACTORS
If List is Not Current and Accurate Need to Update Contact:
FTA Hotline – (617) 494-6336 FTA DAMIS Email: [email protected]
Grantee is responsible for subrecipients & contractors
Grantee distributes usernames and & passwords for subrecipients & contractors

YOU SHOULD KNOW Usernames & Passwords – Change every
calendar year You can Revise your MIS Report – Up
until database is closed (Sept/Oct) Must ‘Sign & Submit’ Again Grantee Must ‘Accept’ We do record date of original submission
You cannot access/print previous years MIS reports
Required to retain MIS - 5 Years
COMMON QUESTIONS
Q: Who can be the ‘Certifying Official’A: Any company official – whoever can
certify data as complete & accurate
Q: How do I determine “Number of Safety-Sensitive Employees”(next slide)

COMPUTE NUMBER OF SAFETY-SENSITIVE EMPLOYEES
Example: (FTA random pool size at time of random selection):
(800/4) = 200 is the “Number of Safety-Sensitive Employees”
200
Selection Period
# - FTA in Random Pool
1st QTR 1752nd QTR 2253rd QTR 2504th QTR 150
TOTAL 800

COMMON QUESTIONS
Q: What if an employee works multiple safety-sensitive jobs (i.e. operator & dispatcher)
A: Include in employee category in which they worked the most (Section II (B) & (C))
Does not mean all test results will be in that employee category.

Q: WHAT DOES IT MEAN – “EMPLOYER BASED”?
A: Each individual submission is for the ‘Employer’ listed, only. (Employer Name)
A2: You do not submit combined testing results for
-the consortium-the random pool (includes FMCSA)- other employers
(contractor/subrecipient/grantee)
GOLDEN RULE: DO NOT DOUBLE-REPORT TESTING RESULTS TO DOT

COMMON QUESTIONSQ: What if I have no safety-sensitive employees?
Grantee or SubrecipientA:If you pass-through FTA funds – submit a “zeroed-out” report.
Make sure your contractor/subrecipient does submit results.
Q: What if we switched contractors mid-year?A: Submit an MIS for each contractor
Report ‘calendar year’ results (all results)Request another account (for new contractor) if necessary

WHAT IF WE MADE ERRORS
Upon review – we find we made mistakes during the calendar year. Report test results as they stand.
EXAMPLES: Return-to-Duty instead of Pre-Employment Non-DOT Alcohol pre-employment DOT Alcohol – not in policy DOT/FTA Post-Accident – not meet thresholds
There is no place to provide a ‘Comment’ or indicate ‘time period’

COMMON ERRORS
Don’t Provide C/TPA information. Don’t submit all employers – especially
contractors Combine multiple employer data on a
single report Include Contractors in Grantee report

NATIONAL CONTRACTORS?
(Veolia, First Transit, MV, Cummins, W.W. Williams, GoodYear….and more) National Contractors must NOT send in a
‘Company-Wide’ report Testing Results (MIS Report) - each FTA-
Covered Employer (Contract)

CONTRACTORS
Has multiple contracts Each contract uses different employees
(contracts completely separate – no crossover)
Must submit two separate MIS reports One for each contractor
NO DOUBLE-COUNTING

CONTRACTORS
If a contractor use the same safety-sensitive employees on contracts with multiple FTA-Grantees: Can designate one contract as primary and
one as secondary and just submit one MIS. Contact FTA D&A Hotline

CONTRACTED EMPLOYEES
What if our contracted employer/employees service more than one FTA Grantee? Both Grantees ensure contractor submits
MIS. Q: Who reports the results? A: Random results to the employer for
whom the employee performs the greater % of service.
Other results (PA, R-T-D, FU & RS) dependent on for who service was being performed at the time of the event.

MORE THAN 1 SPECIMEN IS SENT TO LAB
Examples: Negative dilute – policy to retest Positive – request split specimen MRO Cancels (Invalid) – requires retest R-T-D – not done as observed – employee
returned Insufficient Specimen Temperature out-of-range
Result requiring most stringent consequence is the test of record 1 Positive or Negative or Refusal or Cancelled for each testing event Only report “Result”

WHAT IF I HAVE A FERRYBOAT?
FTA funded vessels (Ferryboats) Subject to FTA Random Alcohol Test
requirements Must Submit MIS to FTA
Only Random Alcohol Test Results Employee Category = Ferryboat
Must Inform FTA of Ferryboat Service Contact FTA D&A Project Office
Provide Capability to Enter Ferryboat alcohol test results

HOW DO I PUT TOGETHER THE REPORT? Semi-Annual Lab Report?? – Not Usually!
Does not include ‘MRO verified’ results May include cancellations that don’t get
reported on MIS May include results of all employer DOT tests Employer may use multiple Labs See previous slide – these results may be
included
Lab Report – Appendix B (next slide)

Appendix B to Part 40 - DOT Drug Testing Semi-Annual Laboratory Report to EmployersThe following items are required on each laboratory report: Reporting Period: (inclusive dates)Laboratory Identification: (name and address)Employer Identification: (name; may include Billing Code or ID code) C/TPA Identification: (where applicable; name and address)1. Specimen Results Reported (total number) By Test Reason (a) Pre-employment (number) (b) Post-Accident (number) (c) Random (number) (d) Reasonable Suspicion/Cause (number) (e) Return-to-Duty (number) (f) Follow-up (number) (g) Type of Test Not Noted on CCF (number)2. Specimens Reported (a) Negative (number) (b) Negative and Dilute (number)3. Specimens Reported as Rejected for Testing (total number) By Reason (a) Fatal flaw (number) (b) Uncorrected Flaw (number) 4. Specimens Reported as Positive (total number) By Drug (a) Marijuana Metabolite (number) (b) Cocaine Metabolite(number) (c) Opiates (number) (1) Codeine (number) (2) Morphine (number) (3) 6–AM (number) (d) Phencyclidine (number) (e) Amphetamines (number) (1) Amphetamine (number) (2) Methamphetamine (number) (3) MDMA (number) (4) MDA (number) (5) MDEA (number)5. Adulterated (number) 6. Substituted (number)7. Invalid Result (number)

HOW DO I PUT TOGETHER THE REPORT? Consortium Report, TPA Report, CCFs
Review to make sure they are only your results – single employer (you), FTA tests results

AVERAGE TIME TO COMPLETE (HTTPS://DAMIS.DOT.GOV)
FAA 17.0 minutes FMCSA 19.6 minutes FTA 19.6 minutes FRA 40.9 minutes PHMSA 2.7 minutes USCG 19.3 minutes
WHAT DO YOU DO WITH DATA
Trend Analysis – FTA & DOT DAMIS = All DOT Modes (FTA, FRA, FAA, FMCSA, PHMSA
& USCG) Required Minimum Random Testing Rates
FTA Random Drug Rate Lowered 50% 25% (2007)
Analysis of Federal, State Regulatory Revisions Audit Scheduling Ensure Program Compliance
* Do Employers meet minimum random testing requirements – not the primary use

GENERATE REPORTS - EXAMPLEDRUGS - FAA - 2012
Refusals
STATE Positives THC Cocaine PCP Opiates Amphet Adulterated Substituted Shy Bladder Other
AK 3 2 1 0 0 0 0 0 0 0
AL 15 12 4 0 0 0 0 0 0 1
AR 12 7 3 0 0 2 0 0 0 2
AZ 50 33 6 0 3 10 0 0 0 1
CA 91 59 13 0 2 19 1 1 1 11
CO 45 31 9 0 1 4 0 2 0 5
CT 29 20 10 0 1 1 0 0 0 1
DE 1 0 1 0 0 0 0 0 0 0
FL 92 53 38 0 4 4 0 0 1 2
GA 63 38 15 0 6 6 0 0 0 3
GU 0 0 0 0 0 0 0 0 0 0
HI 3 1 1 0 0 1 0 0 0 0
IA 2 2 0 0 0 0 0 0 0 0
ID 3 2 0 0 0 1 0 0 0 2
IL 48 40 5 0 0 3 0 1 1 3
IN 18 12 4 0 1 1 0 0 0 1

% OF ALL DRUG TESTS, POSITIVE FOR THC
2009 2010 2011 2012 20130.600%
0.700%
0.800%
0.900%
1.000%
1.100%
1.200%
0.834%0.856%
0.864%
0.834%
0.970%

1995 1996 1997 1998 1999 2001 2002 2003 2004 2005 2006 2007 2008 2009 2010 2011 2012 20130.00%
0.20%
0.40%
0.60%
0.80%
1.00%
1.20%
1.40%
1.60%
1.80%
2.00%
1.76%
1.60%
1.27%1.20%
1.14%
1.05%
0.89%
1.03%0.96%
0.89%
0.79%0.79%0.81%0.82%0.81%0.82%
0.74%
0.86%
FTA Drug Positive Rate (Random Testing)

1996 1997 1998 1999 2001 2002 2003 2004 2005 2006 2007 2008 2009 2010 2011 2012 20130.00%
0.05%
0.10%
0.15%
0.20%
0.25%
0.21%
0.19%
0.22%
0.18%
0.15%
0.19%
0.17%
0.11%0.11%
0.12%0.13%
0.15%
0.11%
0.13%0.12%
0.11%
0.13%
FTA Alcohol Violation Rate (Random Testing)
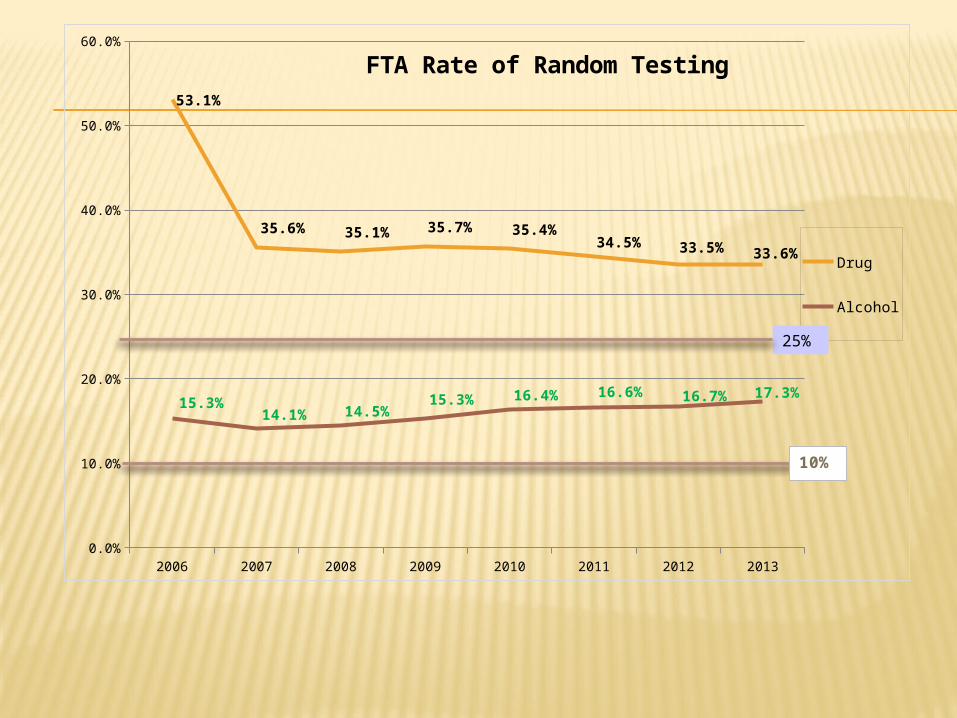
2006 2007 2008 2009 2010 2011 2012 20130.0%
10.0%
20.0%
30.0%
40.0%
50.0%
60.0%
53.1%
35.6% 35.1% 35.7% 35.4%34.5% 33.5% 33.6%
15.3%14.1% 14.5%
15.3% 16.4% 16.6% 16.7% 17.3%
FTA Rate of Random Testing
Drug
Alcohol
10%
25%
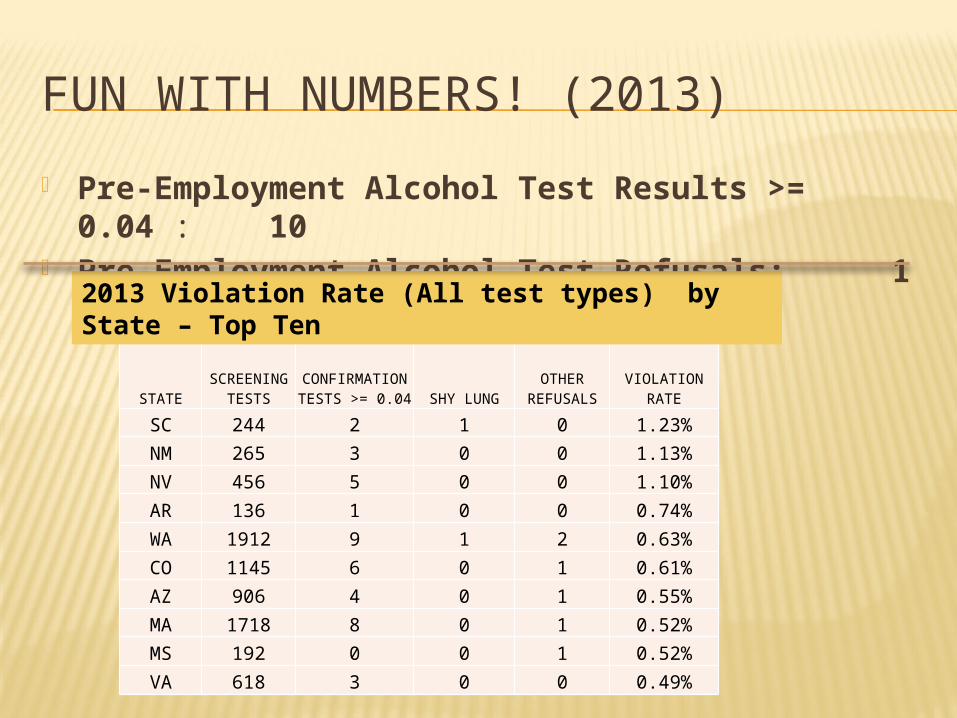
FUN WITH NUMBERS! (2013)
Pre-Employment Alcohol Test Results >= 0.04 :10
Pre-Employment Alcohol Test Refusals:1
REFUSALS
STATESCREENING
TESTSCONFIRMATION TESTS >= 0.04 SHY LUNG
OTHER REFUSALS
VIOLATION RATE
SC 244 2 1 0 1.23%
NM 265 3 0 0 1.13%
NV 456 5 0 0 1.10%
AR 136 1 0 0 0.74%
WA 1912 9 1 2 0.63%
CO 1145 6 0 1 0.61%
AZ 906 4 0 1 0.55%
MA 1718 8 0 1 0.52%
MS 192 0 0 1 0.52%
VA 618 3 0 0 0.49%
2013 Violation Rate (All test types) by State – Top Ten

REFUSALS
STATE TEST RESULTS POSITIVES ADULTERATED SUBSTITUTED SHY BLADDEROTHER
REFUSALPOSITIVE
RATE
AZ 5888 135 0 0 1 102 4.04%
MD 9650 266 3 0 4 16 2.99%
VI 44 1 0 0 0 0 2.27%
KY 2560 43 0 0 0 15 2.27%
CO 4610 86 0 0 0 15 2.19%
TX 11725 197 1 3 3 39 2.07%
IL 11791 219 7 4 0 7 2.01%
OK 1398 25 0 0 0 1 1.86%
IN 2076 31 0 1 1 5 1.83%
MS 385 4 0 0 0 3 1.82%
2013 Positive Rate (All test types) by State – Top Ten