Feeding and Nutrition of Infants and Young Children - the Dr. Rath
171
Transcript of Feeding and Nutrition of Infants and Young Children - the Dr. Rath


introduction
��������
A child’s first 2 or 3 years of life are the most crucial for normal physical andmental development. Nevertheless, current feeding practices in some countriesmay be doing more harm than good to the development of young children.Children under 3 years of age are vulnerable to poor nutrition; the growth rateduring this period is greater than at any other time, and there thus exists anincreased risk of growth retardation. Also, the immunological system is notfully mature at this age, resulting in a risk of frequent and severe infections.Both cognitive and emotional potentials start to develop early, and so thefoundations of intellectual, social and emotional competencies are also estab-lished during this period. In summary, poor nutrition during the early yearsleads to profound defects including delayed motor and cognitive development,behavioural problems, deficient social skills, a reduced attention span, learningdeficiencies and lower educational achievement.
Infants, especially those who have a low birth weight or are otherwise vulner-able, are at high risk of morbidity and mortality during the first 2 years of life,especially after 6 months of age. In the period after birth most infants, even themost vulnerable, grow and develop normally if they are exclusively breastfed.If foods or drinks are introduced too early or are not given safely in the correctquantity at the optimum time, growth rates falter dramatically and can leadto growth retardation. By the time these children are 2 years old, many will bestunted. This is irreversible, and as adults they will remain small and be likelyto have reduced mental and physical capacities. To reduce the high prevalenceof stunting – common among vulnerable groups in the European Region –national feeding guidelines based on those given in this book should be imple-mented by health ministries. This will promote normal growth and develop-ment in the first 3 years of life, especially for the most vulnerable.
Nutrition-related health problems during the first 3 years of life lead to short-and long-term consequences, such as cardiovascular disease, that limit humanpotential within society. Improving infant and young child nutrition shouldthus be a priority, and be seen as an integral part of social and economicdevelopment. During times of economic crisis countries face difficult choices, soit is imperative to advocate social sector investments, notably nutrition policiesfor young children. Failing to ensure that young children receive optimumnutrition is counterproductive. Faced with limited resources, countries maydecide to reduce general expenditure by limiting resources devoted to the

x
development of young children. In the long run, however, failing to invest inthe young will be more costly to the state and to society. Future mental andphysical capacity will be compromised and, in addition, treating the resultingpreventable diseases will be extremely costly. By placing emphasis on the firstthree years of life and developing comprehensive nutrition policies, countriescan avert many preventable deaths, avoid irreversible mental damage, andpreserve a child’s priceless endowment of emotional, intellectual and moralqualities.
The 1997 edition of UNICEF’s State of the world’s children states: “Approxi-mately half the economic growth achieved by the United Kingdom and anumber of Western Countries between 1790 and 1980 … has been attributedto better nutrition and improved health and sanitation conditions, socialinvestments made as much as a century earlier”. The social and economic costsof poor nutrition are huge. For this reason, international investment banksagree that investing in nutrition makes sense: it reduces health care costs andthe burden of chronic preventable diseases in adulthood, it improves social andeconomic development and it promotes learning and intellectual capacity. Noeconomic analysis, however, can fully do justice to all the benefits of sustainedmental, emotional and physical development in childhood.
In general, the central role that nutrition and feeding practices play withregard to the health and development of young children is not sufficiently wellunderstood by enough health professionals. Health professionals should be asource of correct and consistent information on nutrition. These guidelines havebeen produced to facilitate this and strengthen the role of the health sector. Alarge proportion of the health service budget is used to treat preventable nutri-tion-related disorders, costs that could be substantially reduced if these disor-ders were prevented. Implementing these guidelines will enable countries todevelop their own national nutrition policies for infants and young children. Indoing this, the health sector can carry out its role effectively within this cruciallyimportant area of public health. Children represent the future of a nation, andthese guidelines have been produced with the intention that young children,especially the disadvantaged, will have a better future.
Marc Danzon John DonohueRegional Director Regional DirectorWHO Regional Office CEE/CIS and the Baltics
for Europe UNICEF Office for EuropeCopenhagen, Denmark Geneva, Switzerland

introduction
Acknowledgements
This publication was prepared by WHO’s Nutrition Policy, Infant Feedingand Food Security programme at the Regional Office in collaboration withthe United Nations Children’s Fund (UNICEF). The authors would likeespecially to thank Rachel Elsom and Ellenor Mittendorfer, who carriedout most of the background research and helped draft the manuscript.
The financial support provided by the Governments of the Netherlands andthe United Kingdom is gratefully acknowledged. In this context we wouldespecially like to thank Elly Leemhuis-de Regt and Jacob Waslander of theNetherlands for their interest and support. Many individuals contributed tothis book, and in particular Dr Bruno de Benois (WHO), Professor FrançoisDelange (Belgium), Professor Patrice L. Engle (United States), Dr Marco Jermini(WHO), Dr Lida Lhotska (UNICEF), Dr Yasmine Motarjemi (WHO),Dr Elizabeth M. Poskitt (United Kingdom), Professor Andrew Rugg-Gunn(United Kingdom) and Dr Jovile Vingraité (Lithuania).
Special thanks are also due to the participants attending the UNICEF/WHO Regional Consultation on Prevention and Control of Iron Defi-ciency Anaemia in Women and Children, held in Geneva in February 1999,and to the following who contributed to individual sections or reviewedthe draft text: Dr Carlo Agostoni (Italy), Ms Helen Armstrong (UnitedStates), Professor Zulfiqar Bhutta (Pakistan), Professor Ken Brown (UnitedStates), Dr Nancy Butte (United States), Dr Michel Chauliac (France),Professor Forrester Cockburn (United Kingdom), Professor Kathryn Dewey(United States), Dr Conor Doherty (United Kingdom), Dr Henrik Friis(Denmark), Dr Serge Hercberg (France), Professor Olle Hernell (Sweden),Professor Peter Howie (United Kingdom), Ms Sandra Huffman (UnitedStates), Ms Hind Khatib (UNICEF, Geneva), Dr Felicity Savage King(WHO headquarters, Geneva), Professor Berthold Koletzko (Germany),Ms Sandra Lang (United Kingdom), Dr Christian Mølgaard (Denmark),Dr Olga Netrebenko (Russian Federation), Ms Nancy Jo Peck (Switzer-land), Dr John Reilly (United Kingdom), Ms Patti Rundall (United King-dom), Dr Werner Schultink (UNICEF, New York), Dr Roger Shrimpton(UNICEF, New York), Dr Inga Thorsdóttir (Iceland), Dr AbdelmajidTibouti (UNICEF, Geneva), Professor Brian Wharton (United Kingdom),Professor Susan Reynolds Whyte (Denmark), Dr Anthony Williams(United Kingdom) and Dr Charlotte Wright (United Kingdom).

introduction
Recommendations
INTRODUCTION
It is recommended that each country review, update, develop and imple-ment national nutrition and feeding guidelines for infants and young chil-dren, based on the recommendations in this publication.
HEALTH AND NUTRITIONAL STATUS AND FEEDINGPRACTICES
It is recommended that each country establish nutrition surveillance ofinfants and young children as an integral part of its health informationsystem.
Breastfeeding practices, feeding patterns and the nutritional status of in-fants and young children should be monitored regularly to enable problemsto be identified and strategies developed to prevent ill health and poor growth.
RECOMMENDED NUTRIENT INTAKES
Each country should use recommended nutrient intakes for infants andyoung children, based on international scientific evidence, as the founda-tion of its nutrition and feeding guidelines.
ENERGY AND MACRONUTRIENTS
Provision of adequate dietary energy is vital during the period of rapidgrowth in infancy and early childhood. Attention must be paid to feedingpractices that maximize the intake of energy-dense foods without compro-mising micronutrient density.
An adequate protein intake with a balanced amino acid pattern is importantfor the growth and development of the infant and young child. If the childreceives a varied diet, however, protein quantity and quality are seldom aproblem. It is prudent to avoid a high-protein diet because this can haveadverse effects.
During complementary feeding and at least until 2 years of age, a child’s dietshould not be too low (because this may diminish energy intake) or too
high in fat (because this may reduce micronutrient density). A fat intakeproviding around 30–40% of total energy is thought to be prudent.
Consumption of added sugars should be limited to about 10% of totalenergy, because a high intake may compromise micronutrient status.
VITAMINS
In countries where there is a high prevalence of childhood infectious disease,it is important to determine whether vitamin A deficiency is a public healthproblem.
In countries where rickets is a public health problem, all infants shouldreceive a vitamin D supplement as well as adequate exposure to sunlight.
MINERALS OTHER THAN IRON
In countries where iodine deficiency is a public health problem, legislationon universal salt iodization should be adopted and enforced.
CONTROL OF IRON DEFICIENCY
Iron deficiency in infants and young children is widespread and has seriousconsequences for child health. Prevention of iron deficiency should there-fore be given high priority.
When complementary foods are introduced at about 6 months of age, it isimportant that iron-rich foods such as liver, meat, fish and pulses or iron-fortified complementary foods are included.
The too-early introduction of unmodified cow’s milk and milk products isan important nutritional risk factor for the development of iron deficiencyanaemia. Unmodified cow’s milk should not therefore be introduced as adrink until the age of 9 months and thereafter can be increased gradually.
Because of their inhibitory effect on iron absorption, all types of tea (black,green and herbal) and coffee should be avoided until 24 months of age.After this age, tea should be avoided at mealtimes.
Optimal iron stores at birth are important for the prevention of irondeficiency in the infant and young child. To help ensure good infantiron stores, the mother should eat an iron-rich diet during pregnancy.
xiii

xiv
At birth the umbilical cord should not be clamped and ligated until it stopspulsating.
BREASTFEEDING AND ALTERNATIVES
All infants should be exclusively breastfed from birth to about 6 months ofage, and at least for the first 4 months of life.
Breastfeeding should preferably continue beyond the first year of life, andin populations with high rates of infection continued breastfeeding through-out the second year and longer is likely to benefit the infant.
Each country should support, protect and promote breastfeeding by achiev-ing the four targets outlined in the Innocenti Declaration: appointment ofan appropriate national breastfeeding coordinator; universal practice of theBaby Friendly Hospital Initiative; implementation of the InternationalCode of Marketing of Breast-milk Substitutes and subsequent relevantresolutions of the World Health Assembly; and legislation to protect thebreastfeeding rights of working women.
COMPLEMENTARY FEEDING
Timely introduction of appropriate complementary foods promotes goodhealth, nutritional status and growth of infants and young children duringa period of rapid growth, and should be a high priority for public health.
Throughout the period of complementary feeding, breast-milk shouldcontinue to be the main type of milk consumed by the infant.
Complementary foods should be introduced at about 6 months of age. Someinfants may need complementary foods earlier, but not before 4 months of age.
Unmodified cow’s milk should not be used as a drink before the age of9 months, but can be used in small quantities in the preparation of comple-mentary foods from 6–9 months of age. From 9–12 months, cow’s milkcan be gradually introduced into the infant’s diet as a drink.
Complementary foods with a low energy density can limit energy intake,and the average energy density should not usually be less than 4.2 kJ (1 kcal)/g.This energy density depends on meal frequency and can be lower if mealsare offered often. Low-fat milks should not be given before the age of about2 years.

xv
Complementary feeding should be a process of introducing foods with anincreasing variety of texture, flavour, aroma and appearance, while main-taining breastfeeding.
Highly salted foods should not be given during the complementary feedingperiod, nor should salt be added to food during this period.
CARING PRACTICES
Policy-makers and health professionals should recognize the need to sup-port caregivers, and the fact that caring practices and resources for care arefundamental determinants of good nutrition and feeding and thereby ofchild health and development.
GROWTH ASSESSMENT
Regular growth monitoring is an important tool for assessing the nutri-tional status of infants and young children and should be an integral part ofthe child health care system.
DENTAL HEALTH
It is recommended that the frequent intake of foods high in sugar, sugarydrinks, sweets and refined sugar should be limited to improve dental health.
Teeth should be cleaned gently twice a day as soon as they appear.
An optimal fluoride intake should be secured through water fluoridation,fluoride supplements or the use of fluoride toothpaste.
FOOD SAFETY
Safe food, clean water and good hygiene are essential to prevent diarrhoeaand food- and water-borne diseases, which are a major cause of poor nutri-tion, stunting and recurrent illness.
Breastfeeding should be encouraged even where contamination of breast-milk is a concern, and mothers should be reassured that the risk fromcontamination is very small compared with the overall benefits ofbreastfeeding.

introduction
Introduction
It is recommended that each country review, update, develop and implementnational nutrition and feeding guidelines for infants and young children,based on the recommendations in this publication.
WHY IS THIS PUBLICATION NEEDED AND FOR WHOM IS ITINTENDED?
Optimum nutrition and good feeding of infants and young children areamong the most important determinants of their health, growth anddevelopment. Good feeding practices will prevent malnutrition andearly growth retardation, which is common in some parts of the WHOEuropean Region. Poorly fed children have greater rates and severity ofenteric and other infections, and they are at risk of dying prematurely.There is evidence to suggest that infant nutrition has long-term healthconsequences and plays a role in preventing the development of somechronic noncommunicable diseases in adults. Furthermore, micronu-trient deficiencies, especially of iron and iodine, are associated withdelayed psychomotor development and impaired cognitive function.Thus improvements in nutrition are desirable not only for the physicalhealth and growth of young children but also for reducing the risk ofinfection, maximizing psychomotor development and school perform-ance and, in the long term, improving opportunities for participating insocial development.
The transition from an exclusively milk diet to one in which an increas-ing variety of foods is required to satisfy nutritional needs is a particu-larly vulnerable time. Poor nutrition and less-than-optimum feedingpractices during this critical period may increase the risk of falteringgrowth and nutritional deficiencies. Despite the importance of infantand young child nutrition and feeding practices, limited attention hasbeen paid to the need for guidelines based on scientific evidence. Rec-ommendations on infant nutrition and feeding practices in the easternpart of the European Region are based on former Soviet recommenda-tions, which are outdated and require revision. Moreover, a number oftraditional dietary practices in the Region appear to have adverse effectson nutritional status; this is particularly true in the case of iron.
2
This publication has been produced to address this situation. It con-tains the scientific rationale for the development of national nutritionand feeding recommendations from birth to the age of 3 years, and isdesigned to provide information that will help national experts to developor update their current national feeding recommendations.
This publication builds on WHO/UNICEF recommendations (1) andseveral national publications (2–6). In addition, a review of the literaturehas been carried out to develop appropriate scientifically based recommen-dations for Europe. In some key areas scientific evidence is limited, how-ever, and it has therefore been necessary to base recommendations on prag-matic information, erring on the side of caution. Nevertheless, new data arecontinually becoming available, and it will be important to review theguidelines frequently and regularly.
The guidelines are designed for the WHO European Region, with empha-sis on the countries that resulted from the dissolution of the former SovietUnion. Nutrition and feeding practices vary throughout the Region andthese recommendations should be applied flexibly and be adapted to localand national needs and circumstances. Despite the wide range of socioeco-nomic conditions found between and within the Member States of theRegion, it is believed that many recommendations can be applied univer-sally. They are especially applicable to the most vulnerable groups of infantsand young children living in deprived conditions. These are mainly foundin the eastern part of the Region, but are also common in ethnic minoritiesand children of low-income families in western Europe.
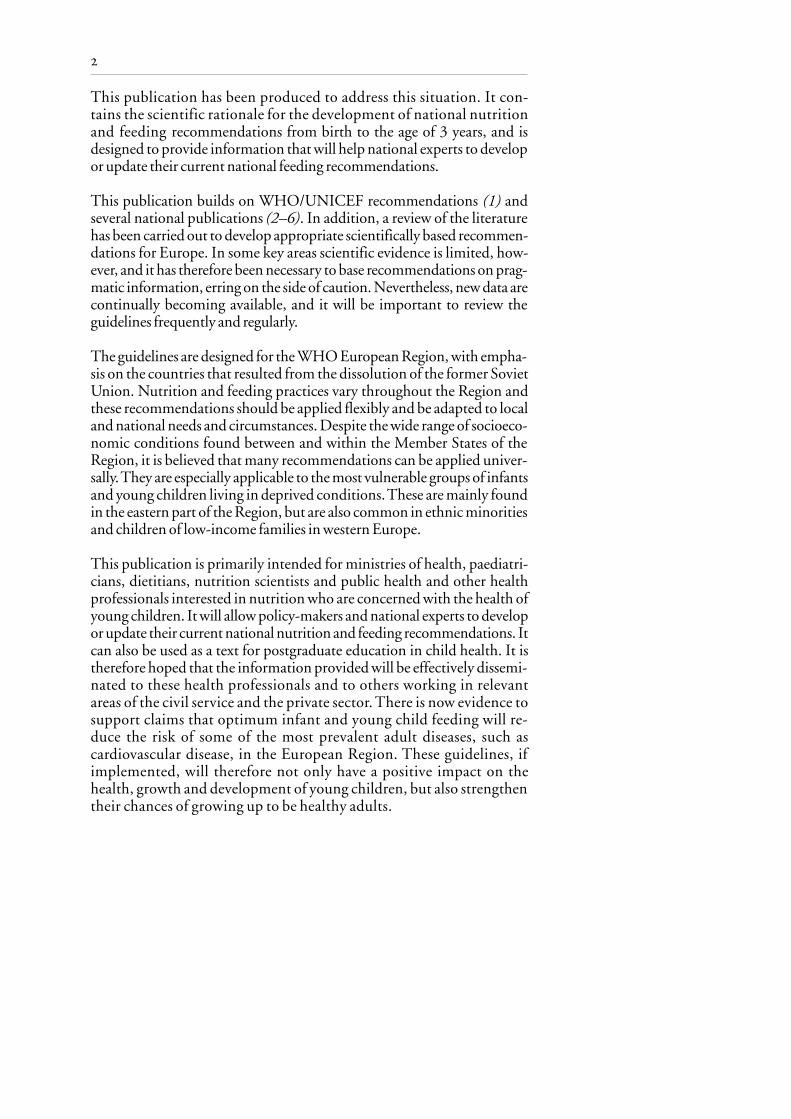
This publication is primarily intended for ministries of health, paediatri-cians, dietitians, nutrition scientists and public health and other healthprofessionals interested in nutrition who are concerned with the health ofyoung children. It will allow policy-makers and national experts to developor update their current national nutrition and feeding recommendations. Itcan also be used as a text for postgraduate education in child health. It istherefore hoped that the information provided will be effectively dissemi-nated to these health professionals and to others working in relevantareas of the civil service and the private sector. There is now evidence tosupport claims that optimum infant and young child feeding will re-duce the risk of some of the most prevalent adult diseases, such ascardiovascular disease, in the European Region. These guidelines, ifimplemented, will therefore not only have a positive impact on thehealth, growth and development of young children, but also strengthentheir chances of growing up to be healthy adults.

3
SOME DETERMINANTS OF HEALTH IN EUROPE
Historically, life expectancy in the European Region has been high and isincreasing. Since the dissolution of the Soviet Union, however, there hasbeen a dramatic decrease in life expectancy at birth in those countries thatwere formerly part of it. Thus, in 1994, the average life expectancy in thesecountries was 66 years, which approaches that of developing countries(62 years). This decline in life expectancy is due in part to a rise in mortalityamong infants and young children.
Reducing premature mortality and so improving life expectancy can beachieved by improving the nutritional status of young children and theirmothers. Although the nutrition of mothers is not dealt with in depth inthis book, it is recognized that an optimum maternal diet will help toensure the birth of healthy infants and improve their life expectancy. Thereis a sizeable body of evidence to suggest that good maternal nutritionsupports optimal fetal development, which has long-term health conse-quences and plays a role in preventing the development of noncommunicablediseases, notably coronary heart disease, hypertension, stroke, chronic bron-chitis, obesity and diabetes (7–9). The mother’s diet immediately prior toconception and during pregnancy influences the growth and developmentof the embryo and fetus. Where poor maternal nutrition is common (oftenlinked to poverty) it is associated with low birth weight (< 2500 g), prema-ture birth and high perinatal mortality, as well as the development ofnoncommunicable diseases in adulthood. The influence of early nutritionon cognitive development and adult health is another area of growinginterest, particularly with respect to pre-term and low-birth-weight infants(10–13). Investment in child nutrition will also contribute to a country’seconomic development (11).
Poor child care is often associated with bad environmental conditions andpoverty. While the impact of poverty is greatest in the eastern part of theRegion, there is evidence of growing inequalities in western Europe (14).The gap between rich and poor is widening in some countries. It is esti-mated that almost one third of children in the United Kingdom are living inpoverty – three times the number in 1979 – and one in five lives in ahousehold where nobody works – twice the rate of 1979 (15). At the 1998World Health Assembly it was pointed out that 32% of the population ofthe WHO European Region is living in poverty (the same percentage asfound in developing countries). These statistics are derived from the globalreports of the United Nations Development Programme (UNDP) (16)and UNICEF (17) and they illustrate the extent to which underlying pov-erty could predispose to malnutrition through a poor-quality diet.

4
Despite the high prevalence of poverty, there is little evidence of widespreadprotein-energy malnutrition (PEM) throughout the Region. Only in someof the central Asian republics are there signs of wasting and PEM.In Tajikistanand Uzbekistan, around 10% of children have been classified as sufferingfrom PEM. However, in all of the central Asian republics and Azerbaijan,levels of growth retardation and stunting are high. In addition, levels ofanaemia are high: 60% and 70% in Kazakhstan and Azerbaijan, respectively(see Chapter 1).
THE CONTENTS OF THIS BOOK
Chapter 1 reviews what is known about the current situation of childnutrition, together with limited information about current infant andyoung child feeding practices from selected countries in the Region.
Chapters 2–6 deal with nutrient recommendations, energy and themacronutrients (protein, fat and carbohydrates) and the most importantvitamins and minerals. International recommendations on nutrient intakecurrently used by the European Union, the United Kingdom, the UnitedStates and WHO are compared. These recommendations provide a stand-ard against which the adequacy of the diet of a population of infants andyoung children can be assessed. The difference between nutrient “require-ments” and “recommendations” is explained, and how the latter concept hasevolved and is designed to cover the wide range of individual variation innutritional needs found within a population. The nutrient recommenda-tions provide guidance on how much of each nutrient is required for theoptimum health of young children, whether prevention of deficiency isenough, and whether overconsumption of a nutrient can be harmful. Otherfactors that affect the definition of nutrient recommendations, such asnutrient bioavailability, are also discussed. Iron deficiency anaemia is one ofthe major health problems throughout the Region and one that this publi-cation aims to prevent, and therefore an entire chapter (Chapter 6) is de-voted to this subject.
In Chapters 7–9, the importance of breastfeeding and the appropriate agefor the introduction of complementary foods and fluids are reviewed.International experts agree that exclusive breastfeeding during early infancyis the most beneficial. The precise age at which appropriate, adapted familyfoods should be introduced will differ from infant to infant. Too early anintroduction of complementary foods and fluids increases the risk of infec-tion and reduces the benefit of exclusive breastfeeding. Too late an intro-duction can result in interruption of growth, undernutrition and an
5
increased risk of illness. Chapter 9 is dedicated to the important role of thecaregiver, and emphasizes that how infants and children are cared for canhave a dramatic impact on their growth and development.
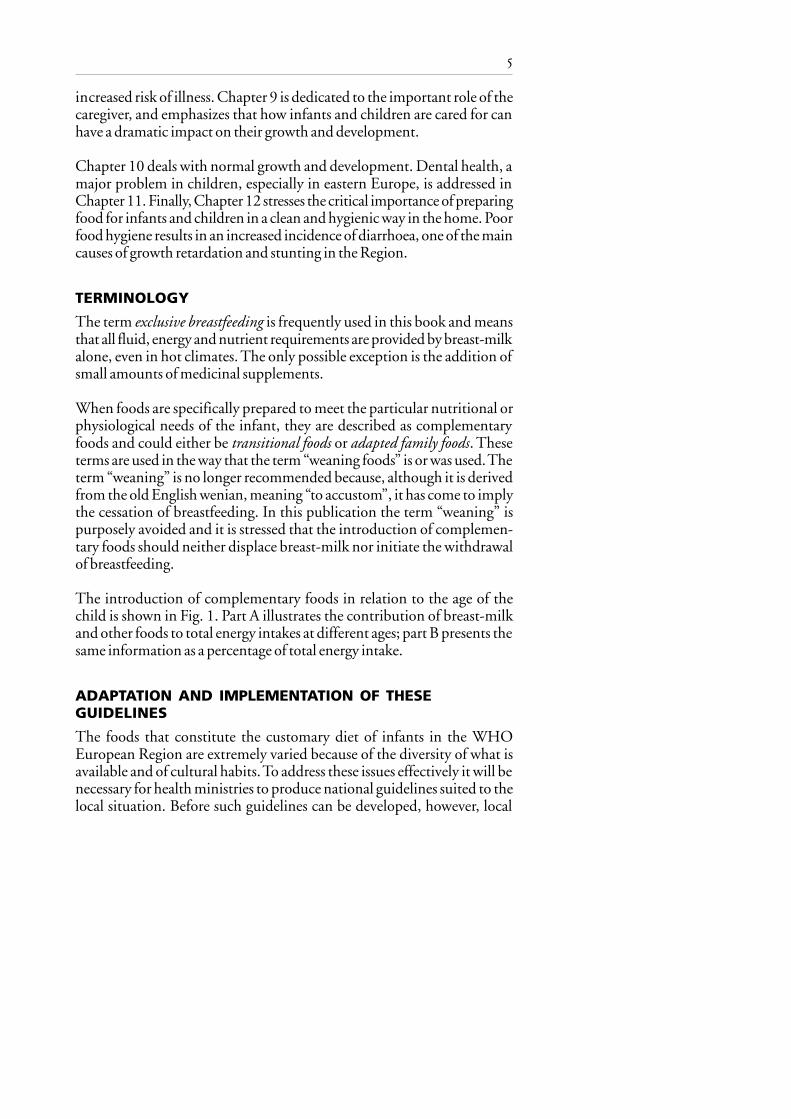
Chapter 10 deals with normal growth and development. Dental health, amajor problem in children, especially in eastern Europe, is addressed inChapter 11. Finally, Chapter 12 stresses the critical importance of preparingfood for infants and children in a clean and hygienic way in the home. Poorfood hygiene results in an increased incidence of diarrhoea, one of the maincauses of growth retardation and stunting in the Region.
TERMINOLOGY
The term exclusive breastfeeding is frequently used in this book and meansthat all fluid, energy and nutrient requirements are provided by breast-milkalone, even in hot climates. The only possible exception is the addition ofsmall amounts of medicinal supplements.
When foods are specifically prepared to meet the particular nutritional orphysiological needs of the infant, they are described as complementaryfoods and could either be transitional foods or adapted family foods. Theseterms are used in the way that the term “weaning foods” is or was used. Theterm “weaning” is no longer recommended because, although it is derivedfrom the old English wenian, meaning “to accustom”, it has come to implythe cessation of breastfeeding. In this publication the term “weaning” ispurposely avoided and it is stressed that the introduction of complemen-tary foods should neither displace breast-milk nor initiate the withdrawalof breastfeeding.
The introduction of complementary foods in relation to the age of thechild is shown in Fig. 1. Part A illustrates the contribution of breast-milkand other foods to total energy intakes at different ages; part B presents thesame information as a percentage of total energy intake.
ADAPTATION AND IMPLEMENTATION OF THESEGUIDELINES
The foods that constitute the customary diet of infants in the WHOEuropean Region are extremely varied because of the diversity of what isavailable and of cultural habits. To address these issues effectively it will benecessary for health ministries to produce national guidelines suited to thelocal situation. Before such guidelines can be developed, however, local

6
conditions should be assessed. Gathering quantitative food intake data onthe customary diet of young children is a challenge, but it is important tocollect such information in addition to anthropometric data on weight andlength. It is strongly recommended that health ministries, ideally jointlywith ministries responsible for food and agriculture, undertake regularmonitoring of the health and growth of infants and young children and that
Fig. 1. Contribution of different food sources to young children’s energy intakein relation to age
Tota
l ene
rgy i
ntak
e (k
cal/d
ay)
Transitional foodsFamily foods
Breast-milk
Complementaryfeeding
Family foodsTransitional foods
Breast-milk
Complementaryfeeding
Perc
enta
ge o
f tot
al e
nerg
y int
ake
Exclusivebreastfeeding
Exclusivebreastfeeding
Source: World Health Organization (1).
Age
Age

7
the process becomes an integral part of the national health and nutritioninformation system.
The recommendations presented in this publication will help health pro-fessionals involved in the care of infants and young children, and will assistpolicy-makers to develop national nutrition and feeding guidelines to pre-vent disease and achieve better health and development of young children.The health benefits are likely to persist into adulthood, and provide thefoundation of a healthy start in life. These guidelines present a scientificconsensus for health promotion and information to develop national rec-ommendations. They provide a clear direction for the sustainable develop-ment of health and socioeconomic policy, and can help policy-makersidentify resources needed to improve the health of young children and thusthat of the population in future generations.
REFERENCES
1. Complementary feeding of young children in developing countries: a re-view of current scientific knowledge. Geneva, World Health Organiza-tion, 1998 (document WHO/NUT/98.1).
2. DEPARTMENT OF HEALTH, UNITED KINGDOM. Weaning and the weaningdiet. Report of the Working Group on the Weaning Diet of the Committeeon Medical Aspects of Food Policy. London, H.M. Stationery Office,1994 (Report on Health and Social Subjects, No. 45).
3. CANADIAN PEDIATRIC SOCIETY, DIETITIANS OF CANADA & HEALTH
CANADA. Nutrition for healthy term infants. Ottawa, Minister of PublicWorks and Government Services, 1998.
4. Recommendations for the nutrition of infants: recommendations for healthpersonnel. Copenhagen, National Board of Health, 1998.
5. FOMON, S.J. Protein. In: Fomon, S.J. Nutrition of normal infants. StLouis, MO, Mosby, 1993, pp. 121–139.
6. GARROW, J.S. ET AL., ED. Human nutrition and dietetics, 10th ed. Lon-don, Churchill Livingstone, 1999.
7. BARKER, D.J.P., ED. Fetal and infant origins of adult disease. London,British Medical Journal, 1992.
8. OZANNE, S.E. & HALES, C.N. The long-term consequences of intra-uterine protein malnutrition for glucose metabolism. Proceedings of theNutrition Society, 58: 615–619 (1999).
9. HERNANDEZ-DIAZ, S. ET AL. Association of maternal short staturewith stunting in Mexican children: common genes vs commonenvironment. European journal of clinical nutrition, 53: 938–945(1999).

8
10.MARTORELL, R. The nature of child malnutrition and its long termimplications. Food and nutrition bulletin, 20: 288–292 (1999).
11.HEAVER, R. & HUNT, J.M. Improving early childhood development –an integrated program for the Philippines. Washington, DC, WorldBank, 1995.
12. GUNNEL, D. ET AL. Separating in utero and postnatal influences on laterdisease. Lancet, 254: 1506–1507 (1999).
13. LUCAS, A. ET AL. Fetal origins of adult disease – the hypothesis revisited.British medical journal, 319: 245–249 (1999).
14. DALY, A. ET AL. Diet and disadvantage: observations on infant feedingfrom an inner city. Journal of human nutrition and dietetics, 11: 381–389 (1998).
15. DEPARTMENT OF SOCIAL SECURITY, UNITED KINGDOM. Opportunity forall: tackling poverty and social exclusion. London, Stationery Office,1999.
16. UNITED NATIONS DEVELOPMENT PROGRAMME. Human development re-port 1997. New York, Oxford University Press, 1997.
17. UNITED NATIONS CHILDREN’S FUND. The state of the world’s children1998. Oxford, Oxford University Press, 1998.

introductionchapter 1
Health and nutritional statusand feeding practices
It is recommended that each country establish nutrition surveillance of infantsand young children as an integral part of its health information system.
Breastfeeding practices, feeding patterns and the nutritional status of infantsand young children should be monitored regularly to enable problems to beidentified and strategies developed to prevent ill health and poor growth.
NUTRITION-RELATED HEALTH PROBLEMS IN YOUNGCHILDREN
In order to develop national feeding guidelines and nutritional recommen-dations, sound data should be available on growth, nutrition-related dis-eases and feeding practices. The greatest concern is child survival, so mortal-ity is one of the most important indicators of child health. The infantmortality rate is calculated as the number of deaths among children under1 year of age divided by the total number of live births occurring in the sameperiod. The under-5 mortality rate is calculated as the number of deathsamong children under 5 years of age divided by the total number of livebirths occurring in the same period. Mortality data are usually reportedroutinely, but they may not be accurate in many countries because of pooror incomplete death certification.
Post-neonatal mortality (deaths among infants aged between 1 month and12 months) is used as an indicator of poor living conditions and therebypoor nutrition, because many deaths during the first month of life arecaused by congenital malformations and neonatal complications unrelatedto nutrition. High mortality rates may not always be related to poor nutri-tion, and it is not always possible to establish a direct causal link betweenmalnutrition and mortality. Nevertheless, a correlation has been demon-strated in several studies, and according to Pelletier (1) the relationship iscontinuous. Thus even mild and moderate malnutrition carries an increasedrisk of mortality.
Indicators of poor nutritional status can provide an early indication that achild is at risk (see Chapter 10). The most widely used are anthropometric.

10 chapter 1
For example, in children below the age of 5 years, measured weight andheight can be compared with the weights and heights of children of thesame age in a healthy reference population. The reference population rec-ommended by WHO is that drawn up by WHO and the Centers forDisease Control and Prevention in Atlanta (CDC) (2). Indices are usuallyexpressed as standard deviations from the mean (Z score), centiles or per-centage of the median.
The weight-for-height index is a measure of fatness or thinness and issensitive to sudden changes in energy balance. A weight-for-height indexmore than two standard deviations below the mean is called “wasting” andindicates severe weight loss, which is often due to acute starvation and/orsevere disease. Provided there is no serious food shortage, the populationprevalence of wasting is usually below 5% even in poor countries. Childrenwith a weight-for-height index more than two standard deviations abovethe mean are defined as overweight or obese.
Height-for-age is an index of the growth and development of the skeleton.A low value may be an expression of long-term exposure to nutritionalinadequacy and indicate chronic malnutrition in children lacking essentialnutrients, but it is also related to poor sanitary conditions, repeated infec-tions, diarrhoea and inadequate care. Stunting is defined as a height-for-ageindex more than two standard deviations below the mean of the WHO/CDC reference population. Stunting, unlike wasting, is relatively commonthroughout the European Region, especially in low-income groups.
The distribution of weights in the reference population used in the formerSoviet Union is shifted to the right compared with that of the WHO/CDCpopulation, so that the 5th centile of the Soviet reference correspondsapproximately to the 10th centile of the WHO/CDC reference. This leadsto a 5% overestimation of the prevalence of malnutrition and a 5% under-estimation of the prevalence of obesity in countries that base their data onthe former Soviet reference population.
Biochemical indicators are sometimes useful for assessing nutritional sta-tus, and some may provide an early indication of a specific nutrient defi-ciency, but because of their cost and invasiveness they cannot be measuredroutinely. Haemoglobin is one exception, because simple and relativelyinexpensive field measurement methods have been developed. However,different haemoblobin cut-off points have been used to define mild and mod-erate anaemia (3), and comparisons between countries are not always possibleunless the same cut-off points have been used or the raw data are available.

11health and nutritional status and feeding practices
It is often not possible to assess nutrient intake because food intake surveysare lacking. Moreover, data on breastfeeding rates from different countriescannot be compared easily because the definitions used are often different.Most surveys do not include data on exclusive breastfeeding. There is a needto stress the importance of exclusive breastfeeding for optimum child health(see Chapter 7) and create awareness of the need to measure its prevalence inevery country. It is recommended that a standardized questionnaire forcollecting data on breastfeeding and infant and young child feedingpractices be developed for the WHO European Region to strengthenthe current surveillance systems, which are not well established in mostcountries.
This chapter provides an overview of the situation in the European Regionusing the limited data available. For the purpose of comparison, the Mem-ber States of the WHO European Region have been divided into eightgeographical regions, as shown in Table 1. Where possible, data from thecentral Asian republics (CAR) and the other members of the Common-wealth of Independent States (CIS) have been compared with those fromwestern or southern Europe or from the Nordic countries. It is hoped thatthis comparison will highlight the disparity in health and nutritional statusacross the Region, and help to identify the nutritional problems of greatestconcern. Based on the limited data available, some of the differences ininfant and young child feeding practices are highlighted.
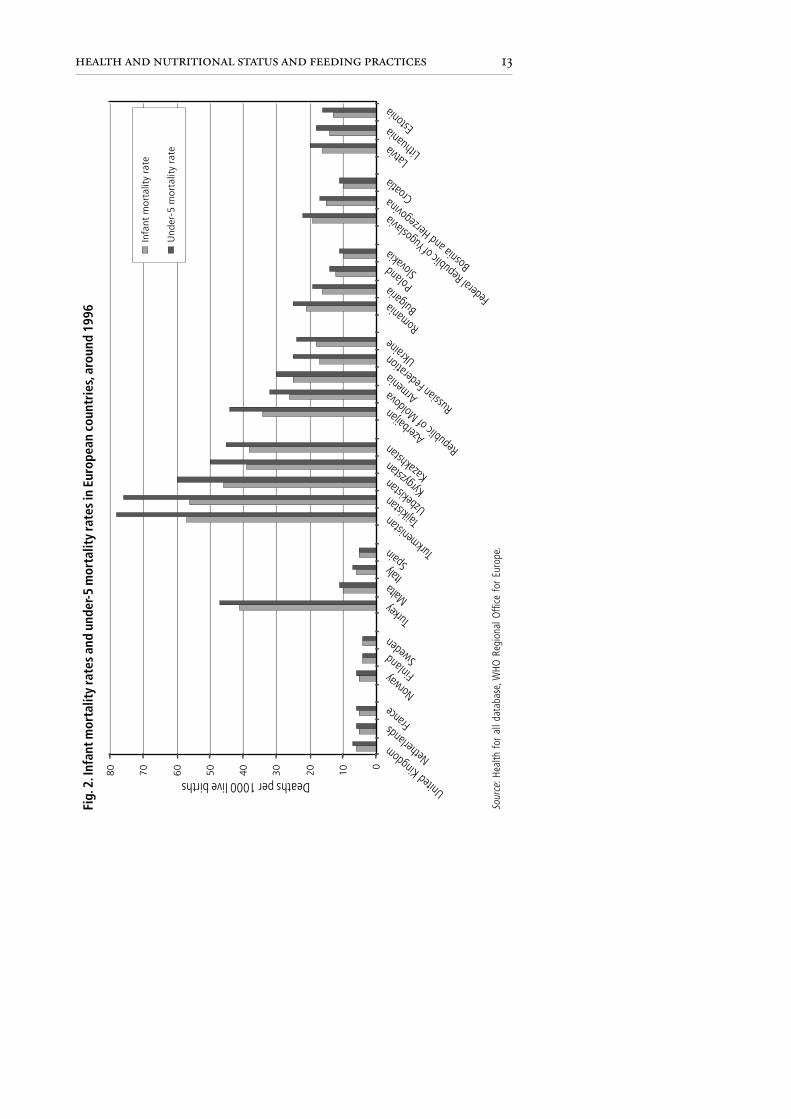
MortalityFig. 2 shows the wide disparity in infant and under-5 mortality rates in theEuropean Region, ranging from the highest in CAR, particularly Tajikistanand Turkmenistan (over 55 and 75 per thousand live births for infant andunder-5 mortality, respectively) to the lowest in the Nordic countries suchas Finland and Sweden (5 per 1000 live births for both). The mortality ratesin central and eastern Europe and in the Balkans fall between these twoextremes at around 10–20 per 1000 live births. The difference betweeninfant and under-5 mortality is relatively large in countries with high mor-tality rates. In contrast it is almost zero in Finland and Sweden, indicatingthat very few deaths occur after the first year.
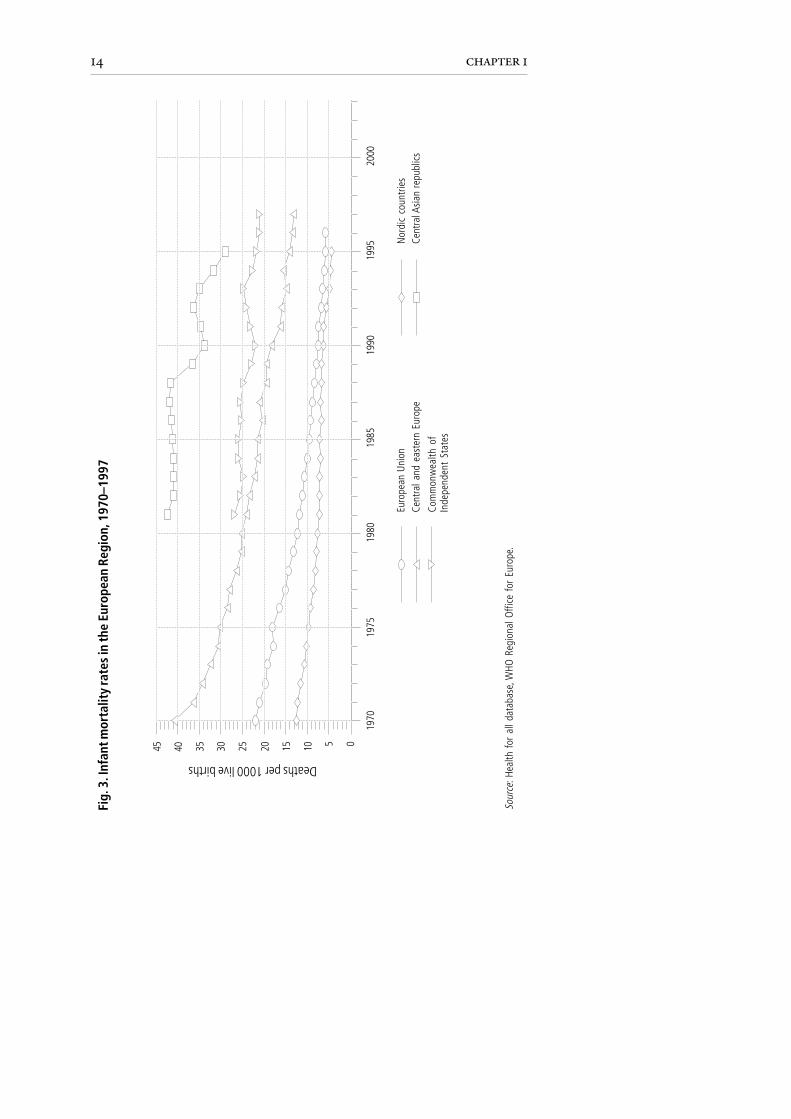
Since the 1970s, infant mortality rates have been steadily decreasing acrossthe Region (Fig. 3). However, while the averages for the European Unionand the Nordic countries have dropped from 22 and 13 deaths per1000 live births, respectively, in 1970 to just 5 in 1995, the figures forCIS and especially CAR remain significantly higher than in the rest ofthe Region.

12 chapter 1
Tabl
e 1.
The
Mem
ber S
tate
s of
the
WH
O E
urop
ean
Regi
on
Balk
anBa
ltic
Cent
ral
Cent
ral
Com
mon
wea
lth
Nor
dic
Sout
hern
Wes
tern
coun
trie
sco
untr
ies
Asi
anan
dof
Inde
pend
ent
coun
trie
sEu
rope
Euro
pere
publ
ics
east
ern
Stat
es(C
AR)
Euro
pe(e
xclu
ding
CAR)
Alba
nia
Esto
nia
Kaza
khst
anBu
lgar
iaAr
men
iaDe
nmar
kAn
dorra
Aust
riaBo
snia
and
Latv
iaKy
rgyz
stan
Czec
h Re
publ
icAz
erba
ijan
Finl
and
Gre
ece
Belg
ium
Herz
egov
ina
Lith
uani
aTa
jikis
tan
Hung
ary
Bela
rus
Icel
and
Isra
elFr
ance
Croa
tiaTu
rkm
enis
tan
Pola
ndG
eorg
iaN
orw
ayIta
lyG
erm
any
Slov
enia
Uzb
ekist
anRo
man
iaRe
publ
ic o
fSw
eden
Mal
taIre
land
The
form
erSl
ovak
iaM
oldo
vaM
onac
oLu
xem
bour
gYu
gosl
avRu
ssia
nPo
rtuga
lN
ethe
rland
sRe
publ
ic o
fFe
dera
tion
San
Mar
ino
Switz
erla
ndM
aced
onia
Ukra
ine
Spai
nUn
ited
Yugo
slavi
aTu
rkey
King
dom
13health and nutritional status and feeding practices
Deaths per 1000 live births
Fig.
2. I
nfan
t mor
talit
y ra
tes
and
unde
r-5 m
orta
lity
rate
s in
Eur
opea
n co
untr
ies,
aro
und
1996
United Kingdom
Netherl
ands
France
Norway Fin
land Sw
eden
Turkey
MaltaItal
y Spain Tur
kmeni
stan Taj
ikistan Uzbe
kistan
Kazakhs
tan
Kyrgyzs
tan
Azerbai
jan
Republic
of Moldova Arm
enia
Russian
Feder
ation Ukraine
Romania Bulg
aria Poland Slo
vakia
Federa
l Republic
of Yu
gosla
via
Sour
ce: H
ealth
for
all
data
base
, WHO
Reg
iona
l Offi
ce f
or E
urop
e.
Bosnia and Herz
egovin
a Croatia
Latvia Lith
uania Est
onia
0
1020304050607080
Infa
nt m
orta
lity
rate
Und
er-5
mor
talit
y ra
te
14 chapter 1
Sour
ce: H
ealth
for
all
data
base
, WHO
Reg
iona
l Offi
ce f
or E
urop
e.
Fig.
3. I
nfan
t mor
talit
y ra
tes
in th
e Eu
rope
an R
egio
n, 1
970–
1997
Deaths per 1000 live births
45 40 35 30 25 20 15 10 5 0
2000
1990
1995
1985
1980
1975
1970
Euro
pean
Uni
onCe
ntra
l and
eas
tern
Eur
ope
Com
mon
wea
lth o
fIn
depe
nden
t St
ates
Nor
dic
coun
tries
Cent
ral A
sian
repu
blic
s
15health and nutritional status and feeding practices
Whereas in western European countries the primary causes of infant mor-tality are congenital malformations, injuries and “cot deaths” (sudden in-fant death syndrome), such deaths in countries with high mortality rates aremainly caused by infectious diseases. Poor nutritional status compromisesthe immune function of young children and makes them more susceptibleto infections, particularly those affecting the respiratory and gastrointestinaltracts. In Azerbaijan, for example, the under-5 mortality rate from respira-tory diseases is 24.5 per 1000 live births, while in Slovakia it is only 1.5 per1000 live births.1 In CAR, infants suffer from acute respiratory infections,diarrhoeal diseases and vaccine-preventable diseases such as tuberculosis;seven out of ten deaths are due to these illnesses, often in combination.Among children under 5, acute respiratory infections (notably pneumonia)are responsible for between 30% and 50% of all infant deaths. In Bulgariaand the Federal Republic of Yugoslavia, respiratory diseases are also themain cause of death in children (4).
Fetal, infant and child growth
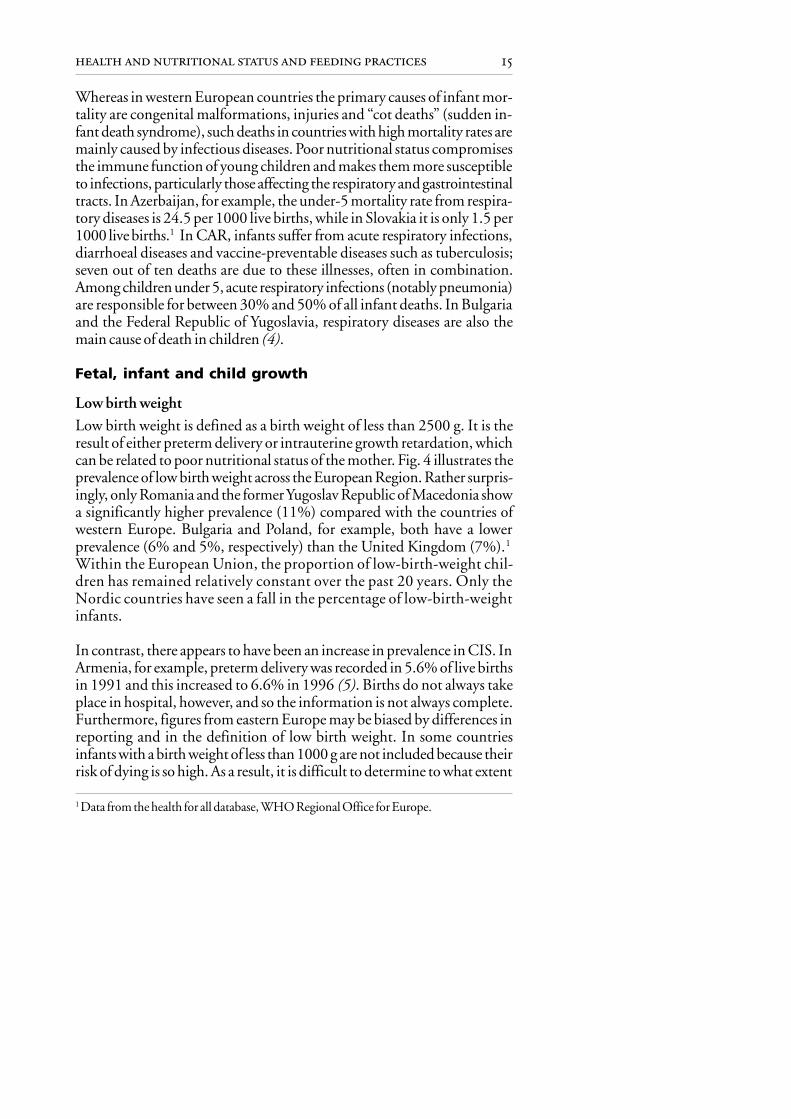
Low birth weightLow birth weight is defined as a birth weight of less than 2500 g. It is theresult of either preterm delivery or intrauterine growth retardation, whichcan be related to poor nutritional status of the mother. Fig. 4 illustrates theprevalence of low birth weight across the European Region. Rather surpris-ingly, only Romania and the former Yugoslav Republic of Macedonia showa significantly higher prevalence (11%) compared with the countries ofwestern Europe. Bulgaria and Poland, for example, both have a lowerprevalence (6% and 5%, respectively) than the United Kingdom (7%).1
Within the European Union, the proportion of low-birth-weight chil-dren has remained relatively constant over the past 20 years. Only theNordic countries have seen a fall in the percentage of low-birth-weightinfants.
In contrast, there appears to have been an increase in prevalence in CIS. InArmenia, for example, preterm delivery was recorded in 5.6% of live birthsin 1991 and this increased to 6.6% in 1996 (5). Births do not always takeplace in hospital, however, and so the information is not always complete.Furthermore, figures from eastern Europe may be biased by differences inreporting and in the definition of low birth weight. In some countriesinfants with a birth weight of less than 1000 g are not included because theirrisk of dying is so high. As a result, it is difficult to determine to what extent
1Data from the health for all database, WHO Regional Office for Europe.
16 chapter 1
Fig.
4. P
reva
lenc
e of
low
bir
th w
eigh
t (<
2500
g) i
n Eu
rope
, 199
0–19
97
The form
er Yugosla
v
Republic of M
acedonia
Croatia
Latvia Lith
uania Est
onia
Sour
ce: H
ealth
for
all
data
base
, WHO
Reg
iona
l Offi
ce f
or E
urop
e.
Percentage
02468
10
12
United Kingdom
France
Norway
Finlan
d
Swed
en
Turkey
Italy Spain
Turkm
enista
n
Tajikis
tan
Uzbekis
tan
Kazakhs
tan
Azerbai
jan
Russian
Feder
ation
Romania
Bulgari
a
Poland
Sloven
ia
Belgium
Greece
Georgia Armeni
a

17health and nutritional status and feeding practices
the present data reflect the real situation. There is clearly a need to standard-ize the definition and collection of data to improve comparisons betweencountries.
Wasting, overweight and stunting
European data from the Global Database on Child Growth and Malnutri-tion and from population surveys are shown in Table 2.
A prevalence of wasting greater than 5% has been documented only inTajikistan and Uzbekistan, where it is 10–12%. Otherwise there is gener-ally a low prevalence of wasting throughout the Region, ranging from zeroand 0.8% in France and Italy in the 1970s to around 2–3% in othercountries in the 1990s. Even in vulnerable groups such as refugees in Arme-nia and Azerbaijan, and populations under siege in Bosnia and Herzegovina(10), the data indicate that protein–energy malnutrition was not a wide-spread public health problem.
Overweight in older children has been observed in several countries of theRegion, particularly in the west. In a recent study of British schoolchildrenaged 7–8 years, for example, the prevalence of overweight and obesitysignificantly exceeded the expected frequency (13). In contrast, only a slightexcess prevalence has been observed in countries in the east of the Region,such as Armenia and the Federal Republic of Yugoslavia. The Russian Fed-eration is the exception, where 20% of young children are overweight – thehighest prevalence in the Region (11). Comparing obesity data for the 0–5-year-old age group is not very useful, however: while a high weight-for-ageindex in infancy may not be a cause for concern, since it is unlikely tocontinue into adulthood, obesity in the 4–5-year-old age group and oldermay well do so (14,15).
The main nutrition-related problem in the Region is growth retardation,indicated by a low height-for-age index. The prevalence of stunting isespecially high in CAR, where it affects between 7% and 43% of childrenunder 5 years of age (Table 2). Stunting is usually most pronounced in ruralareas and this is an indication of its link with environmental conditions.Such high rates of stunting are similar to those observed in African countriesand should be considered a major public health problem. Intermediatevalues of stunting (10–22% of young children) have been observed in otherCIS countries (Table 2). In contrast, the other regions all have low levels orno stunting in young children when compared with the WHO/CDCreference population.

18 chapter 1
Balkan countriesBosnia and
Herzegovina 1993 0–5 1.3 – –Croatia 1995–1996 1–6 0.8 5.9 0.8The former
YugoslavRepublic ofMacedonia 1999 0–5 5.3 5.6 5.2
FederalRepublic of 1996 0–5 (rural) 2.2 4.8 6.8Yugoslavia 0–5 (urban 3.5 8.0 1.7
Central Asian republics (CAR)Kazakhstan 1995 0–3 (rural) 3.0 3.8 21.8
0–3 (urban) 3.7 4.9 7.5Kyrgyzstan 1997 0–3 (rural) 3.2 – 27.7
0–3 (urban) 4.3 – 14.8Tajikistan 1996 0.5–5 10.9 – 42.6Uzbekistan 1996 0–3 (rural) 12.2 – 30.7
0–3 (urban) 10.2 – 32.6
Central and eastern EuropeCzech
Republic 1991 0–5 2.1 4.1 1.9Hungary 1980–1988 0–5 1.6 2.0 2.9Romania 1991 0–5 2.5 2.3 7.8
Commonwealth of Independent States (excluding CAR)Armenia 1998 0–5 3.8 5.8 12.2Azerbaijan 1996 0–5 2.9 3.7 22.2Republic of
Moldova 1996 0–5 3.2 11.7 9.6Russian
Federation 1993 0–5 3.5 20.9 17.0
Southern EuropeItaly 1975–1977 0–6 0.8 4.4 2.7Turkey 1993 0–5 (rural) 3.0 2.7 27.1
0–5 (urban) 2.9 2.9 16.1
Western EuropeFrance 1975 0–3 0.0 3.6 5.8United
Kingdom 1973–1979 0–5 1.0 2.9 2.4
Table 2. Prevalence of wasting, overweight and stunting in childrenaged 0–5 years in selected countries of the WHO European Region
Country Year of Age Wasting Overweight Stuntingsurvey (years) (%) (%) (%)
Sources: Branca et al. (6,7); Macro International (8,9); Robertson et al. (10); World HealthOrganization (11); WHO/UNICEF (12).
19health and nutritional status and feeding practices
Anthropometric data for the 0–3 or 0–5-year-old range should be inter-preted with caution, since they are affected by the distribution of ageswithin the sample. Stunting is rare during infancy and the rates of stuntingare therefore usually higher if a survey includes children aged up to 5 yearsinstead of up to 3 years. Again, there is a need to standardize the method ofdata collection throughout the Region in order to make useful comparisons.
Micronutrient statusThe prevalence of the deficiency of four micronutrients is described here:iodine, iron and vitamins A and D. These are discussed in more detail inChapters 4–6.
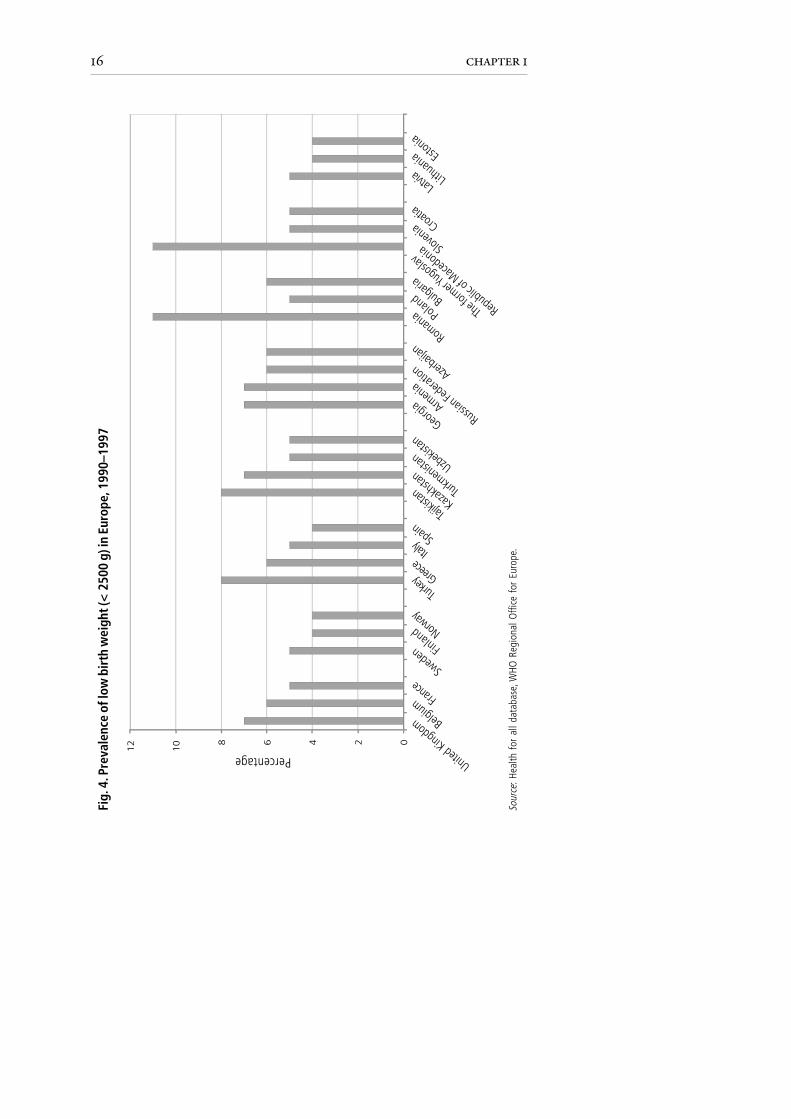
IodineThe definition of mild, moderate and severe iodine deficiency (Table 3) isbased on the combined evaluation of four different indicators: goitre inschool-age children, thyroid volume greater than the 97th centile, medianurinary iodine in school-age children and adults, and the prevalence of levels
Table 3. Indicators of the prevalence of iodine deficiency disorders andcriteria for a significant public health problem
Indicator Normal Mild Moderate Severedeficiency deficiency deficiency
Prevalence of goitre inschool-age children < 5% 5–19.9% 20–29.9% > 30%
Frequency of thyroidvolume in school-agechildren > 97th centileby ultrasound < 5% 5–19.9% 20–29.9% > 30%
Median urinary iodine inschool-age childrenand adults 100–200 µg/l 50–99 µg/l 20–49 µg/l < 20 µg/l
Prevalence of neonatalthyroid stimulatinghormone above5 µU/ml whole blood < 3% 3–19.9% 20–39.9% > 40%
Source: WHO Regional Office for Europe (16).
20 chapter 1
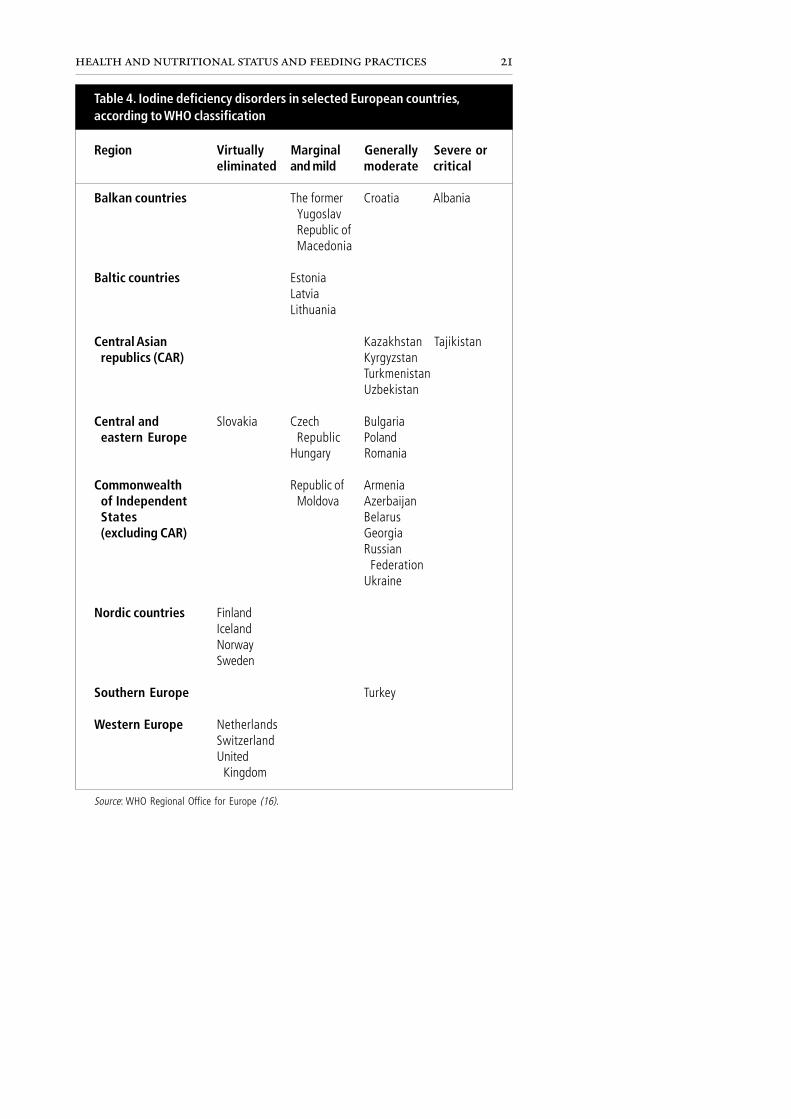
of thyroid stimulating hormone in neonates above 5 µU/ml whole blood(16). Iodine deficiency disorders remain common in the European Region,as shown in Table 4.
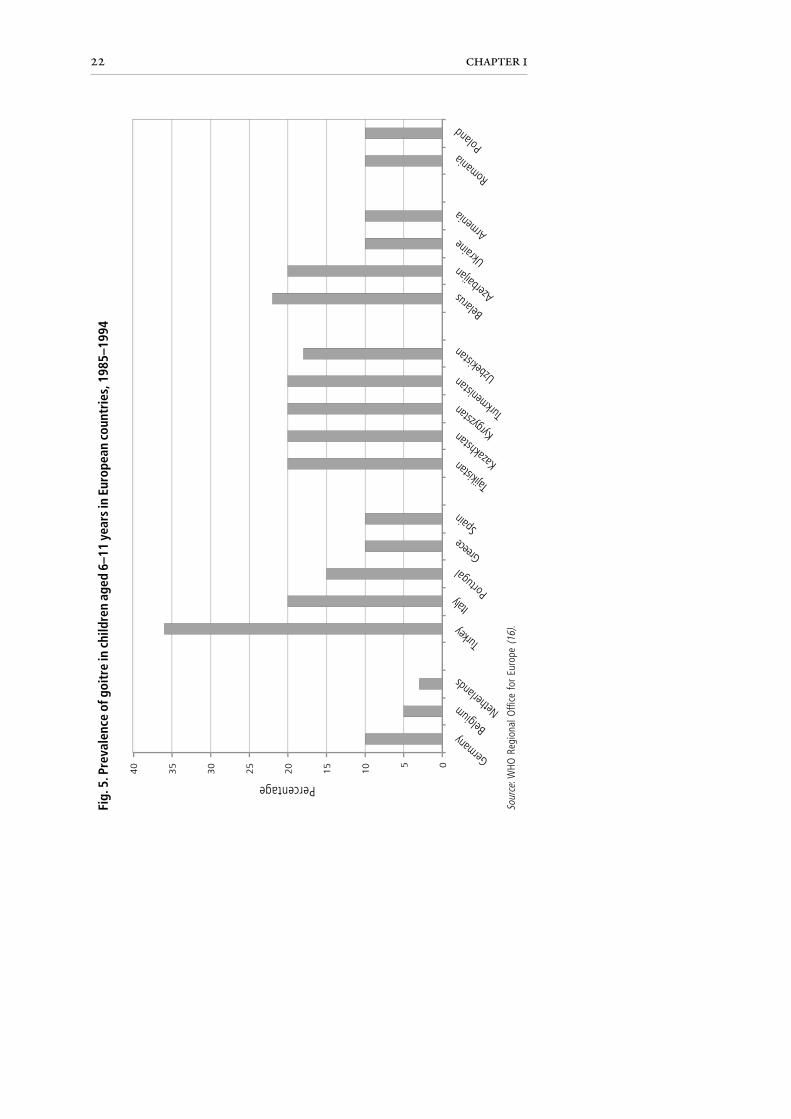
There are clear differences in the success of public health interventions toeliminate the problem. In western European countries, iodine deficiencydisorders have virtually been eliminated through universal salt iodization.In contrast, moderate levels are still found in the central Asian republics,other former Soviet countries, central and eastern Europe and Turkey.Indeed, severe or critical levels are reported in both Albania and Tajikistan.Surveys of the prevalence of goitre in schoolchildren aged 6–11 years,conducted in a range of European countries (Fig. 5), show that the highestgoitre rates occur in Turkey, Belarus, Azerbaijan, the central Asian republicsand even Italy. Such high goitre rates should be considered a public healthpriority and measures should be taken to deal with the problem.
Universal salt iodization (see Chapter 5) used to be practised in the formerSoviet Union. Since the dissolution of that country, however, iodizationplants are no longer in production. Although salt iodization is on the publichealth agenda of most of the former Soviet countries, it is not alwaysimplemented. Urinary excretion of iodine can be used to evaluate the effi-ciency of iodization policies; in the former Yugoslav Republic of Macedo-nia, for example, urinary iodine excretion has increased to normal levels as aresult of salt iodization. An extensive review of the situation was carried outin the WHO European Region in 1998–1999 (17).
Iron
In Europe, information on the prevalence of iron deficiency in children islimited. Most studies have investigated only the prevalence of anaemia,usually by measuring haemoblobin levels, and not its etiology, even thoughiron deficiency is likely to be the most common cause.
Comparison is further hindered by the use of different age groups. Whilesome studies are carried out only in children under 3 years of age (Fig. 6),other studies go up to 5 years of age (Fig. 7). The highest prevalence ofanaemia has been reported from the central Asian republics, where morethan half of the children under 3 years had haemoglobin < 12 g/dl blood(Fig. 6). It should be pointed out, however, that only a small proportion ofcases were of severe anaemia (haemoglobin < 7 g/dl). In western Europeanaemia is less frequent in children of this age; in the United Kingdom, forexample, a 12% prevalence has been observed in children aged 1–2 yearsand a 6% prevalence in children aged 2–4 years. The United Kingdom
21health and nutritional status and feeding practices
Region Virtually Marginal Generally Severe oreliminated and mild moderate critical
Balkan countries The former Croatia AlbaniaYugoslavRepublic ofMacedonia
Baltic countries EstoniaLatviaLithuania
Central Asian Kazakhstan Tajikistanrepublics (CAR) Kyrgyzstan
TurkmenistanUzbekistan
Central and Slovakia Czech Bulgariaeastern Europe Republic Poland
Hungary Romania
Commonwealth Republic of Armeniaof Independent Moldova AzerbaijanStates Belarus(excluding CAR) Georgia
RussianFederation
Ukraine
Nordic countries FinlandIcelandNorwaySweden
Southern Europe Turkey
Western Europe NetherlandsSwitzerlandUnited
Kingdom
Source: WHO Regional Office for Europe (16).
Table 4. Iodine deficiency disorders in selected European countries,according to WHO classification
22 chapter 1
Fig.
5. P
reva
lenc
e of
goi
tre
in c
hild
ren
aged
6–1
1 ye
ars
in E
urop
ean
coun
trie
s, 1
985–
1994
Sour
ce: W
HO R
egio
nal O
ffice
for
Eur
ope
(16)
.
Percentage
05
10
15
20
25
30
35
40
German
y
Netherl
ands
Belgium
Portugal
Turkey
Greece
Italy
Spain
Turkm
enista
n
Tajikis
tan
Uzbekis
tan
Kazakhs
tan Kyrgyzs
tan
Azerbai
jan
Armeni
a
Ukraine
Romania
Belarus
Poland

23health and nutritional status and feeding practices
Fig.
6. P
reva
lenc
e of
ana
emia
a in
child
ren
unde
r 3 y
ears
of a
ge in
five
cou
ntri
es
Sour
ces:
Mac
ro In
tern
atio
nal (
8,9)
; WHO
/UN
ICEF
(12)
; Law
son
et a
l. (1
8); S
harm
anov
(19)
.
a Def
ined
as
<12
g/d
l hae
mog
lobi
n.b C
hild
ren
aged
1–2
yea
rs.
01020304050607080
Seve
reM
oder
ate
Mild
Tota
l
Percentage
Uzb
ekis
tan
Kaza
khst
anKy
rgyz
stan
Azer
baija
nUn
ited
King
dom
b

24 chapter 1
Sour
ces:
Bra
nca
et a
l. (6
,7);
Robe
rtson
et a
l. (1
0); L
awso
n et
al.
(18)
.
Fig.
7. P
reva
lenc
e of
ana
emia
a in
child
ren
unde
r 5 y
ears
of a
ge in
four
cou
ntri
es
a Def
ined
as
<12
g/d
l hae
mog
lobi
n.b C
hild
ren
aged
2–4
yea
rs.
Unite
d Ki
ngdo
mb
Bosn
iaan
dHe
rzeg
ovin
a
The
form
erYu
gosla
vRe
publ
ic o
fM
aced
onia
Arm
enia
Seve
reM
oder
ate
Mild
Tota
l
30 25
Percentage
1520 10 5 0

25health and nutritional status and feeding practices
survey used a cut-off point of 11 g/dl blood; according to this, anaemiaoccurs in 10–30% of pre-school children living in inner cities in the UnitedKingdom (20). Prevalence among a nationally representative sample ofAsian children living in the United Kingdom was significantly higher thanthis (between 20% and 45%) (18).
Factors other than iron deficiency cause anaemia. In Uzbekistan, a study of243 children under 5 years of age showed that 72% were anaemic, but only2% of these seemed to have non-nutritional anaemia (caused by infectionsand chronic diseases). In 40% of cases anaemia was associated with bothlow iron and low vitamin A status; 10% of cases were associated with irondeficiency alone and 20% with vitamin A deficiency alone (21).
Food intake data from the Russian Federation suggest that both womenand children are at high risk of iron deficiency. Grain products rich inphytates are the major food source of iron in the Russian Federation (22).Moreover, the reported high intake of tea and low consumption of vitamin Cfrom vegetables and fruit also compromise the bioavailability of iron presentin the diet. A survey of 4077children under 2 years of age showed a preva-lence of anaemia, assessed by clinical signs, that varied from 2% (Moscowregion) to 16% (Urals region). The prevalence of haemoglobin levels under11 g/dl blood was much higher and varied from 22% (Moscow city) to47% (Urals region). The mean haemoglobin level was significantly higherin young children in cities than in those in small towns and rural regions, at 12.2and 11.6 g/dl, respectively (O. Netrebrenko, personal communication, 1997).
There is a shortage of studies on the cause of the high prevalence of mild tomoderate anaemia in parts of eastern Europe, such as the too-early intro-duction of cow’s milk and milk products and tea. A small study inUzbekistan, which included measurement of ferritin and haemoglobinlevels, suggested that deficiency of both iron and vitamin A was responsible.A survey carried out in Kazakhstan associated anaemia in children withstunting, morbidity and geophagia (the habit of eating soil). Geophagiawas also reported from Uzbekistan (21) and is considered a symptom ofiron deficiency anaemia. Clearly, further studies are needed to investigatethe cause of the high prevalence of anaemia found in some parts of theEuropean Region.
Vitamin A
Serum retinol levels under 0.35 µmol (100 µg) per litre indicate severevitamin A deficiency; levels under 0.70 µmol (200 µg) per litre indicate lowvitamin A status. A 10% prevalence of low serum retinol points to an

26 chapter 1
important public health problem requiring at least public informationstrategies (23).
There is a lack of data describing the vitamin A status of populations in theRegion. Evidence suggests, however, that vitamin A deficiency is likely tobe a problem in the central Asian republics. A study in the Aral Sea area ofUzbekistan showed that 40–60% of children under 5 years of age hadserum retinol levels < 100 µg/l (21). Another study carried out in Armeniaindicated that only 0.8 % of children under 5 years of age had low levels ofretinol (< 200 µg/l) (24). A recent survey in the former Yugoslav Republicof Macedonia, however, showed higher levels of mild deficiency in childrenunder 5 years: 30% had serum retinol values under 200 µg/l, but only 1%had severely low levels (< 100 µg/l) (7). More information is clearly re-quired before any policy recommendations can be made about vitamin Astatus in the Region.
Vitamin D deficiency and rickets
Radiographic identification of rickets has been reported in the Region, butfor most countries only routine clinical data are available. One of the maincauses of rickets is likely to be the traditional practice of swaddling infants,often continued until the age of 2 years, which is common in some parts ofthe Region. Near total covering of the skin limits its exposure to ultravioletlight and is therefore a key factor in the development of rickets. In theformer Yugoslav Republic of Macedonia, 16% of children were reported toshow clinical signs of rickets (7). A study of 1135 Armenian children under5 years of age (6) reported that 7% had an epiphyseal enlargement of thewrist, 2% had craniotabes, 25% had frontal and parietal bossing and 11%had beading of the ribs. When serum alkaline phosphatase (an indicator ofvitamin D deficiency) was measured, however, only 4–6% of the childrenunder 2 years of age had high values, indicating that rickets was no longeractive in the majority. Some young children may be naturally bow-legged,thereby confounding the diagnosis of rickets; it is also unclear to whatdegree lack of exposure to sunlight or dietary vitamin D deficiency areresponsible (see Chapter 4).
FEEDING PRACTICES AND RECOMMENDATIONS
Many countries in the WHO European Region do not have national guide-lines for feeding infants and young children. Nevertheless, they do exist inseveral countries including Denmark, Ireland, the Netherlands, Swedenand the United Kingdom. In the former Soviet Union the need for suchguidelines, which were last updated in 1982 (25), was long recognized. The

27health and nutritional status and feeding practices
scientific basis underpinning optimum infant and young child feeding isstill a relatively new area of research, and advances are occurring all the time.There is thus a need to ensure guidelines keep abreast of the science onwhich they are based.
Infant feeding recommendations appear to vary considerably between west-ern and eastern Europe. In many countries of eastern Europe, feeding guide-lines have been influenced by the recommendations of the former SovietUnion (25). A review identified a number of recommendations from theformer Soviet era that differ from international standards (26). Poor com-plementary feeding practices help to explain the poor iron status and possi-bly the high levels of stunting among infants and young children in theEuropean Region, and particularly in the countries of the former SovietUnion.
In relation to breastfeeding, the former Soviet literature recommended:
• late initiation of breastfeeding (up to 6–12 hours after birth), particu-larly in sick women and including those with anaemia;
• prelacteal feeds of 5% glucose until lactation was established;• exclusive breastfeeding for the first month only (although not widely
practised);• breast-milk as the main feed for the first 4–4½ months;• complete cessation of breastfeeding by 10–11 months of age; and• breastfeeding to follow a strict timetable.
The importance of a night break between feeds was often emphasized.According to the six feeds per day regimen, a 6½-hour break during thenight was advised; this break increased to 8 hours on the five feeds per dayschedule. A review of the Soviet literature (J. Vingraité, personal commu-nication, 1998) revealed that some authorities allowed feeds to deviatefrom this schedule by all of 10–15 minutes.
Non-adapted formulas in the Soviet Union included diluted fresh orfermented cow’s milk with added sugar, vitamins and minerals. Theintroduction of cow’s milk diluted with cereal water was recommendedat 2–3 months (for example, 50 ml pure cow’s milk or kefir, 45 mlcereal water and 5 ml 100% sugar syrup).
Former Soviet recommendations on the introduction of weaning foodsincluded: additional fluids, primarily tea and water with sugar, for breastfedinfants; the introduction of vegetable and “fruit” juices (jam with water) at

28 chapter 1
1 month of age; the introduction of unmodified cow’s milk at 4 monthsand pure kefir at 3 months of age; the introduction of fruit at 2 months,hard boiled egg yolk at 3 months and curd at 4 months of age; the additionof sugar and salt solutions to infant foods; and the introduction of cerealporridges with added sugar, syrup, salt and butter at 4 months of age.
Of particular concern is that in cases of diagnosed anaemia (and rickets),porridge and other solids were recommended to be introduced earlier than4 months of age.
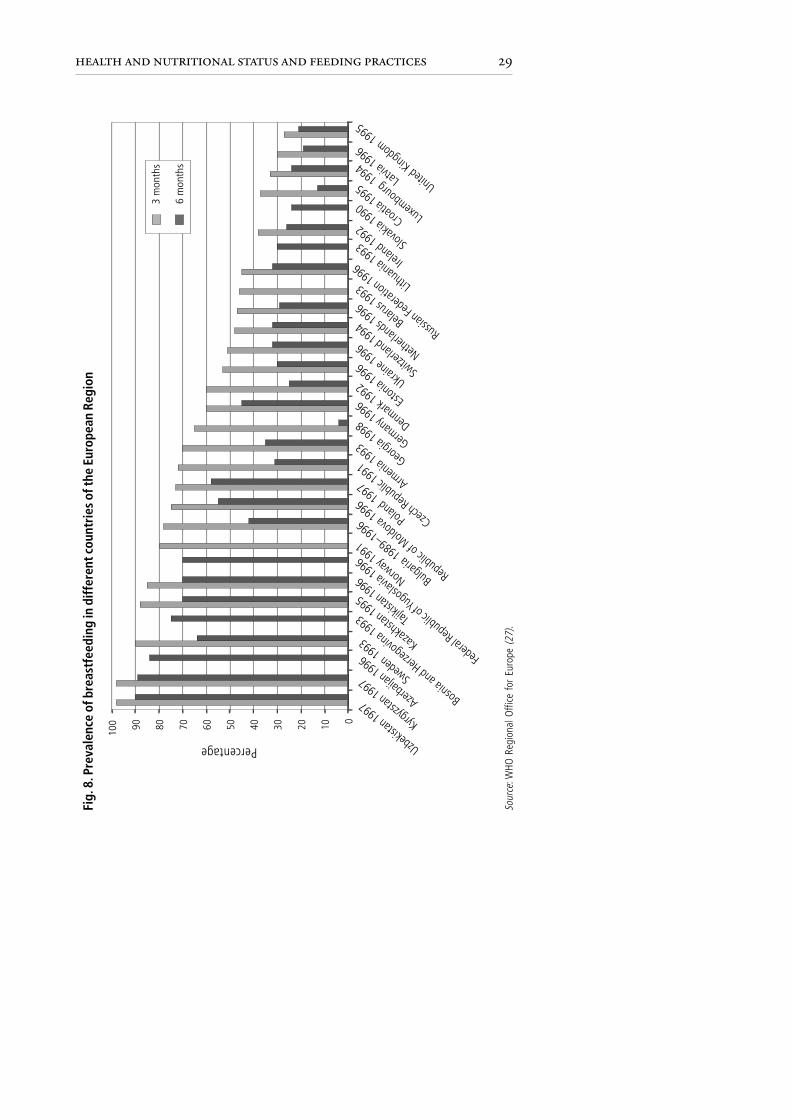
Breastfeeding: initiation, duration and practice ofexclusive breastfeedingOwing to a lack of comprehensive and comparable data and of standardizedinternational definitions, it is difficult to make a general statement aboutthe prevalence of breastfeeding in the WHO European Region. The data onthe percentages of breastfed infants given in Fig. 8 have been taken fromdifferent sources (27). These data should be interpreted with caution: thesurvey methodology varied and in some cases the way in which the surveyswere carried out was not described.
With these caveats, it can be seen that the practice of breastfeeding variesdramatically between European countries. In the United Kingdom, some25% of infants are breastfed at 3 months, compared with over 90% inUzbekistan. Nevertheless, the prevalence of breastfeeding within a countrycan change dramatically over a few years. In Norway, for instance, theprevalence of breastfeeding at 3 months rose from only 25–30% in 1969 toaround 80% in 1985 (28).
Unfortunately the data presented in Fig. 8 do not show the rates of “exclu-sive” breastfeeding. Few studies have provided a definition of “exclusive”breastfeeding, but data from those that have are presented in Fig. 9, whichshows the relatively high rates of exclusive breastfeeding in Sweden both at3 and 6 months. In contrast, the rates of exclusive breastfeeding in thecentral Asian republics are much lower (around 10% or less) at 3 months,except in Georgia and Kyrgyzstan where the levels are around 30%. Polandis making excellent progress: the prevalence of exclusive breastfeeding in-creased dramatically from almost zero in 1988 to some 40% in 1997.
In the Russian Federation in 1996 breastfeeding was initiated in about 95%of babies born in maternity hospitals (O. Netrebrenko, personal commu-nication, 1997). The mean duration ranged from 3 to 4 months dependingon when breastfeeding was initiated and on the mother’s educational level.
29health and nutritional status and feeding practices
Fig.
8. P
reva
lenc
e of
bre
astf
eedi
ng in
diff
eren
t cou
ntri
es o
f the
Eur
opea
n Re
gion
Sour
ce: W
HO R
egio
nal O
ffice
for
Eur
ope
(27)
.
Russian
Federa
tion 1996
Percentage
United Kingdom 1995
Netherl
ands 1
996
Norway
1991
Swede
n 1993
Tajikis
tan 1996
Uzbekis
tan 1997
Kazakhs
tan 1995
Kyrgyzs
tan 1997
Azerba
ijan 1996
Republic
of Moldova
1996
Armenia 1
993
Ukraine 1
996
Bulgaria 1
989–1996 Polan
d 1997
Slovak
ia 1990
Federa
l Republic
of Yugosla
via 1996
Bosnia and Herz
egovin
a 1993
Croatia
1995
Luxembourg 1994
Lithuan
ia 1993
Estonia 1
996
Czech Republic
1991 Georgia 1998
German
y 1996
Denmark
1992Sw
itzerla
nd 1994 Bela
rus 1993
Irelan
d 1992
Latvia
1996
0102030405060708090100
3 m
onth
s
6 m
onth
s

30 chapter 1
0
10
20
30
40
50
60
70
80
3 months
6 months
Fig. 9. Prevalence of exclusive breastfeeding in selected countriesof the European Region, 1989–1998
Perc
enta
geSw
eden
Polan
dKy
rgyzst
anGeo
rgia
Luxe
mbour
gKa
zakh
stan
Uzbek
istan
Fede
ral Re
publi
c of Y
ugos
lavia
Bosn
ia an
d Herz
egov
inaAz
erbaij
an
Source: WHO Regional Office for Europe (27).
The most educated women breastfed their infants significantly longer thanwomen with lower levels of education. The prevalence of partial breastfeedingwas about 50% at 3 months and about 30% at 6 months. The majority ofbreastfed infants also received cow’s milk. The prevalence of exclusivebreastfeeding in infants aged 4 months varied between 22% and 28% inmost regions. In St Petersburg, however, the prevalence of exclusivebreastfeeding was very high (42%), probably as a result of higher educationlevels and of the commitment of the local authorities to implementing theinternational breastfeeding recommendations (see Chapter 7).
Studies in the central Asian republics indicate that, despite the high preva-lence of breastfeeding, a low percentage of infants are exclusively breastfed(Fig. 9); in over 50% breastfeeding has not begun after the first 24 hours.The lack of exclusive breastfeeding, together with deteriorating socio-economic conditions, water contamination and low immunization rates,
31health and nutritional status and feeding practices
pose a threat to infant health. In Kazakhstan, despite a high level of breastfeedingwith a mean duration of around 12 months, the period of exclusive breastfeedingis very short (8). In the former Yugoslav Republic of Macedonia only 8% ofchildren are exclusively breastfed at 4 months of age. Conversely, in the Nordiccountries, where great efforts have been made to increase rates of exclusivebreastfeeding, the percentage is very high (Fig. 8 and 9).
The rates of breastfeeding seem to be increasing throughout the Region, and theNordic countries especially have very high rates compared with 20 years ago.Efforts should be made to maintain these high rates and greater efforts should bemade in all other countries to increase rates of exclusive breastfeeding during thefirst few months of life (see Chapter 7). This is especially important for vulner-able groups such as ethnic minorities and low-income families living in high-risk areas with poor hygiene, sanitation and water supply.
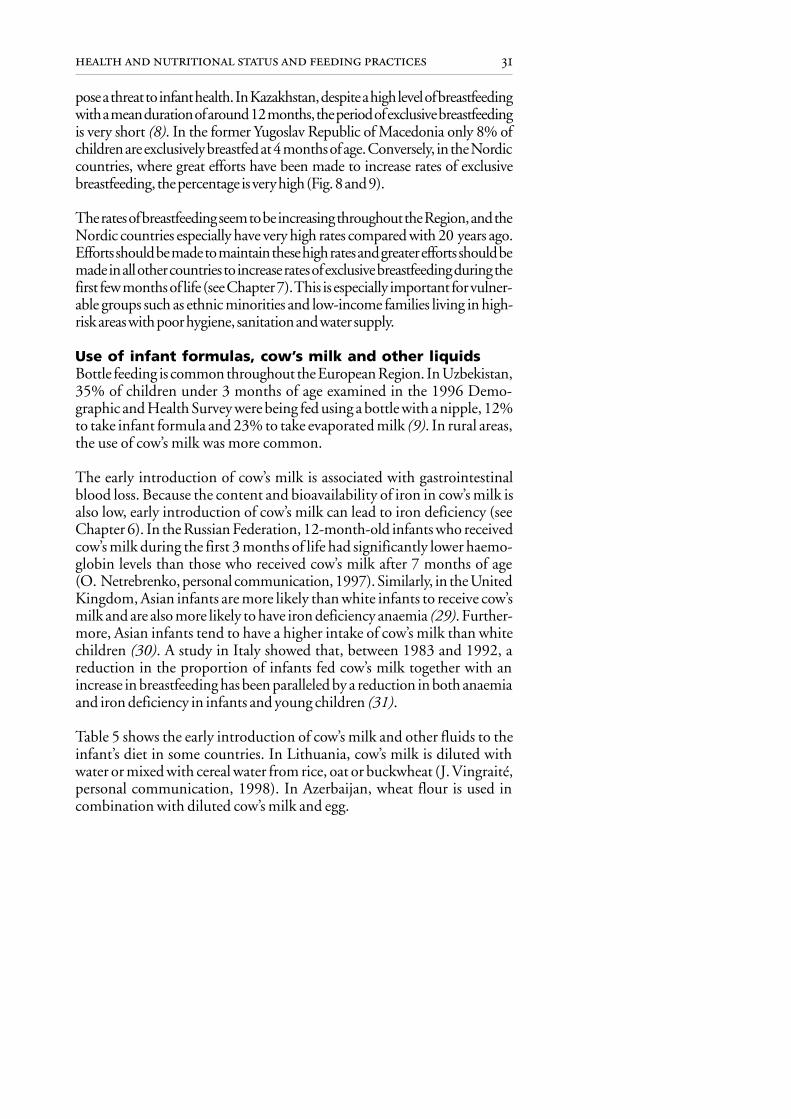
Use of infant formulas, cow’s milk and other liquidsBottle feeding is common throughout the European Region. In Uzbekistan,35% of children under 3 months of age examined in the 1996 Demo-graphic and Health Survey were being fed using a bottle with a nipple, 12%to take infant formula and 23% to take evaporated milk (9). In rural areas,the use of cow’s milk was more common.
The early introduction of cow’s milk is associated with gastrointestinalblood loss. Because the content and bioavailability of iron in cow’s milk isalso low, early introduction of cow’s milk can lead to iron deficiency (seeChapter 6). In the Russian Federation, 12-month-old infants who receivedcow’s milk during the first 3 months of life had significantly lower haemo-globin levels than those who received cow’s milk after 7 months of age(O. Netrebrenko, personal communication, 1997). Similarly, in the UnitedKingdom, Asian infants are more likely than white infants to receive cow’smilk and are also more likely to have iron deficiency anaemia (29). Further-more, Asian infants tend to have a higher intake of cow’s milk than whitechildren (30). A study in Italy showed that, between 1983 and 1992, areduction in the proportion of infants fed cow’s milk together with anincrease in breastfeeding has been paralleled by a reduction in both anaemiaand iron deficiency in infants and young children (31).
Table 5 shows the early introduction of cow’s milk and other fluids to theinfant’s diet in some countries. In Lithuania, cow’s milk is diluted withwater or mixed with cereal water from rice, oat or buckwheat (J. Vingraité,personal communication, 1998). In Azerbaijan, wheat flour is used incombination with diluted cow’s milk and egg.

32 chapter 1
In the Russian Federation, the types of non-breast-milk fluid given toinfants differ between the large cities and the smaller towns or rural areas. InMoscow, some 50% of infants start to receive infant formula at 2 monthsas a supplement to breast-milk. In addition to formulas, about 10% ofinfants in the cities received unadapted milks (cow’s milk, kefir, goat’smilk) as supplements during the first 4 months. Some 22% of infants insmall towns and rural areas received cow’s milk or kefir at least 3 times a dayduring the first 4 months as a breast-milk substitute. The time of introduc-tion of unadapted milks depended on the mother’s education and thefamily income: infants of low-income families receive cow’s milk signifi-cantly earlier than those from wealthier families (O. Netrebrenko, personalcommunication, 1997).
Other fluids commonly given to infants in the first or second month of lifeinclude plain or sweetened water and tea. In Uzbekistan, 40% of childrenreceived tea within the first month after birth and by 3 months of age the
< 4 weeks < 3 months < 5 months
Baltic countriesLithuania Cow’s milk, goat’s
milk, kefir
Central Asian republics (CAR)Kazakhstan Water, tea with sugar Cow’s milk, teaKyrgyzstan Water, tea with sugar Cows milk, teaUzbekistan Water, fruit juice Cow’s milk, tea
Commonwealth of Independent States (excluding CAR)Armenia Water, tea Fruit juice, cow’s
milkAzerbaijan Water, tea Cow’s milkRussian Federation Fruit juice
Western EuropeUnited Kingdom Herbal drink Cow’s milk
Water
Table 5. Age of introduction of non-breast-milk fluids into the infant’s diet
Average age of introduction
Sources: Branca et al. (6); Macro International (8,9); WHO/UNICEF (12); Mills & Tyler (30).
Country

33health and nutritional status and feeding practices
proportion had increased to 72% (21). Other central Asian republics showsimilar patterns. For example, 21%, 34% and 49% of infants in Kazakhstan,Kyrgyzstan and Uzbekistan, respectively, received tea during the first fewmonths of life (19). In Armenia, water and herbal tea are introduced duringthe first 2 months and tea in the third month. In most instances water isboiled and given without the addition of sugar, but sugar is added to herbaltea (67%) and to ordinary tea (95%). The introduction of tea and sugaroccurs even earlier in rural areas (6).
The practice of giving teas (both ordinary and herbal) to infants also appearsto persist in western Europe, especially among ethnic minorities, and incentral Europe. This practice is not recommended, not only because itinterferes with breastfeeding but also because the polyphenols present in teaimpair iron absorption.
Introduction of semi-solid and solid foodsTable 6 shows the time of introduction of complementary foods in somecountries. In the Russian Federation, the proportion of infants receivingfoods before 4 months of age ranges from 17% in St Petersburg to 32% inthe Urals region (O. Netrebrenko, personal communication, 1997). Simi-larly, in Armenia, children are fed semi-solid foods (crushed fruit and veg-etables, porridge and potatoes) and biscuits at 4–5 months, and at 6 monthsthey are given eggs. Bread and pasta, minced meat, fruit and vegetables areintroduced at around 8–9 months of age. Other meat preparations and fishare the last to be introduced, at around 1 year of age. Compared with theRussian Federation, there appear to be fewer differences between urban andrural areas in Armenia or between residents and refugees in the age at whichvarious foods are introduced (6).
In the United Kingdom in 1996, white mothers tended to start giving theirinfants solid food earlier than Asian mothers. At 8 weeks, 2% of Bangla-deshi, 3% of Pakistani and 5% of Indian infants had received some solidfood, compared with 18% of white infants. In all groups the majority ofmothers introduced food between 8 weeks and 3 months. By the age of3 months, between 70% and 73% of Asian mothers and 83% of whitemothers had given their infants some solid food (29).
In the central Asian republics, infants’ diets are often monotonous, mainlyconsisting of a porridge poor in nutrients. The results of the 1996Demographic and Health Survey in Uzbekistan (9) found that 19% of4–7-month-old infants had received meat, poultry, fish or eggs in the24 hours preceding the interview, while 35% had received fruit or vegetables.

34 chapter 1
< 3 months 3–4 months 5–6 months > 6 months
Baltic countriesLithuania Fruit, berries, Curd, egg yolk, Meat, broth
vegetable juice oil, butter,cereals
Central Asian republics (CAR)Uzbekistan Vegetables, Broth Poultry, fish, Family food
fruit eggs, meat,flour,potatoes
Commonwealth of Independent States (excluding CAR)Armenia Fruit, porridge,
vegetables,potatoes,biscuits
Azerbaijan Potatoes,cereals, soup,milk, porridge,biscuits
Russian Federation Fruit Vegetable Meatpurée,cereals
Southern EuropeItaly Rice porridge, Meat, pasta, Eggs, fish, rice,
fruit, parmesan vegetables pulses
Spain Cereals, fruit Bread,vegetables,yoghurt, meat,fish, eggs,pulses
Table 6. Time of introduction of complementary foods into the infant’s diet
Average age of introduction
Sources: Branca et al. (6); Macro International (9); WHO/UNICEF (12); Ferrante et al. (32);Savino et al. (33); Van den Boom et al. (34).
Country

35health and nutritional status and feeding practices
In the Balkan region, Albanian infants receive diets based heavily on cereals(35) and in the former Yugoslav Republic of Macedonia diets include largeamounts of grain, beans and vegetables. The socioeconomic situation af-fects nutritional status by decreasing the ability to buy meat and milkproducts due to their high price (36). Thus the introduction of fruit andvegetables, and of meat and liver may be delayed or reduced by economicand/or seasonal factors. In contrast, meat is introduced at 5–6 months inItaly and after 6 months in Spain.
REFERENCES
1. PELLETIER, D.L. The relationship between child anthropometry andmortality in developing countries: implications for policy, programsand future research. Journal of nutrition, 124: 2047S–2081S (1994).
2. Measuring change in nutritional status. Geneva, World Health Organi-zation, 1983.
3. Prevention and control of iron deficiency anaemia in women andchildren. Report of the UNICEF/WHO Regional Consultation, Ge-neva, 3–5 February 1999. Geneva, United Nations Children’s Fund,1999.
4. Central and eastern Europe in transition: public policy and social condi-tions. Poverty, children and policy: responses for a brighter future. Flor-ence, UNICEF International Child Development Centre, 1995 (Econo-mies in Transition Studies, Regional Monitoring Report, No. 3).
5. Health and health care. Yerevan, Ministry of Health of Armenia, 1997.6. BRANCA, F. ET AL. The health and nutritional status of children and
women in Armenia. Rome, National Institute of Nutrition, 1998.7. BRANCA, F. ET AL. Mulitiple indicator cluster survey in Fyrom with micro-
nutrient component. Rome, National Institute of Nutrition, 1999.8. Kazakstan Demographic and Health Survey, 1995. Calverton, MD,
Macro International Inc., 1996.9. Uzbekistan Demographic and Health Survey, 1996. Calverton, MD,
Macro International Inc., 1997.10. ROBERTSON, A. ET AL. Nutrition and immunisation survey of Bosnian
women and children during 1993. International journal of epidemiol-ogy, 24: 1163–1170 (1993).
11. WHO global database on child growth and malnutrition. Geneva, WorldHealth Organization, 1997 (document WHO/NUT/97.4).
12. Nutrition survey of children under 5 of Azerbaijan. Geneva, World HealthOrganization and United Nations Children’s Fund, 1997.
13. REILLY, J.J. ET AL. Prevalence of overweight and obesity in British chil-dren: a cohort study. British medical journal, 319: 1039 (1999).

36 chapter 1
14. ROLLAND-CACHERA, M.F. ET AL. Increasing prevalence of obesity among18-year-old males in Sweden: evidence for early determinants. Actapaediatrica, 88: 365–367 (1999).
15. ROLLAND-CACHERA, M.F. ET AL. Influence of adiposity development: afollow-up study of nutrition and growth from 10 months to 8 years ofage. International journal of obesity and related metabolic disorders, 19:573–578 (1995).
16. DELANGE, F. ET AL., ED. Elimination of iodine deficiency disorders (IDD)in central and eastern Europe, the Commonwealth of Independent Statesand the Baltic states. Proceedings of a conference held in Munich, Ger-many, 3–6 September 1997. Copenhagen, WHO Regional Office forEurope, 1998 (document WHO/EURO/NUT/98.1).
17. Comparative analysis of progress on the elimination of iodine deficiencydisorders. Copenhagen, WHO Regional Office for Europe, 2000 (docu-ment EUR/ICP/LVNG 01 01 01).
18. LAWSON, M.S. ET AL. Iron status of Asian children aged 2 years living inEngland. Archives of disease in childhood, 78: 420–426 (1998).
19. SHARMANOV, A. Anaemia in central Asia: demographic and health ser-vice experience. Food and nutrition bulletin, 19: 307–317 (1998).
20. GREGORY, J.R. ET AL. National diet and nutrition survey children aged1.5–4.5 years. Vol 1. Report of the diet and nutrition survey. London,H.M. Stationery Office, 1995.
21. MORSE, C. The prevalence and causes of anemia in Muynak District,Karakalpakistan, the Republic of Uzbekistan. Brandon, MS, CrosslinkInternational, 1994.
22. KOHLMEIER, L. Deficient dietary iron intakes among women and chil-dren in Russia: evidence from the Russian Longitudinal MonitoringSurvey. American journal of public health, 88: 576–580 (1998).
23. Indicators for assessing vitamin A deficiency and their application in moni-toring and evaluating intervention programmes. Geneva, World HealthOrganization, 1996 (document WHO/NUT/96.10).
24. UNITED NATIONS CHILDREN’S FUND. Infant feeding in Armenia. Reporton a comparative study and national survey. Yerevan, American Univer-sity of Armenia, 1997.
25. Infant feeding. Methodical recommendations. Moscow, Ministry ofHealth of the USSR, 1982.
26. Complementary feeding and the control of iron deficiency anaemia in theNewly Independent States: presentation by WHO at a WHO/UNICEFconsultation, Geneva, Switzerland, 4 February 1999. Copenhagen, WHORegional Office for Europe, 2000.
27. Comparative analysis of implementation of the Innocenti Declaration in WHOEuropean Member States. Monitoring Innocenti targets on the protection,
37health and nutritional status and feeding practices
promotion and support of breastfeeding. Copenhagen, WHO Regional Of-fice for Europe, 1999 (document EUR/ICP/LVNG 01 01 02).
28. HEIBERG ENDERSEN, E. & HELSING, E. Changes in breastfeeding prac-tices in Norwegian maternity wards: national surveys 1973, 1982 and1991. Acta paediatrica, 84: 719–724 (1995).
29. THOMAS, M. & AVERY, V. Infant feeding in Asian families. London,Stationery Office, 1997.
30. MILLS, A. & TYLER, H. Food and nutrient intakes of British infants aged6–12 months. London, H.M. Stationery Office, 1992.
31. SALVIOLI, G.P. Iron nutrition and iron stores changes in Italian infants inthe last decade. Annali del’Istituto Superiore di Sanità, 31: 445–459(1995).
32. FERRANTE, E. ET AL. Retrospective study on weaning practice in Romeand interland. Results and comment. Minerva pediatrica, 46: 275–283(1994).
33. SAVINO, F. ET AL. Weaning practice in Torinese area: epidemiologicalstudy on practice and age of introduction of complementary food.Minerva pediatrica, 46: 285–293 (1994).
34. VAN DEN BOOM, S.A.M. ET AL. Weaning practices in children up to19 months of age in Madrid. Acta paediatrica, 84: 853–858 (1995).
35. BARDHOSHI, A. ET AL. Country report – Albania. Development of localfood based dietary guidelines and nutrition education. In: Workshop onDevelopment of Local Food Based Guidelines and Nutrition Education,Nitra, Slovakia, 22–25 September 1997. Rome, Food and AgricultureOrganization of the United Nations, 1997.
36. PETRUSEVSKA-TOZI, L. ET AL. Country report – Macedonia. Develop-ment of local food based dietary guidelines and nutrition education. In:Workshop on Development of Local Food Based Guidelines and NutritionEducation, Nitra, Slovakia, 22–25 September 1997. Rome, Food andAgriculture Organization of the United Nations, 1997.

introductionchapter 2
Recommended nutrientintakes
Each country should use recommended nutrient intakes for infants and youngchildren, based on international scientific evidence, as the foundation of itsnutrition and feeding guidelines.
INTRODUCTION
This and the next four chapters include discussion and comparison of therecommended nutrient intakes (RNIs) from the European Union, theUnited Kingdom, the United States and WHO. These values provide astandard against which the adequacy of the diets of young children, asmeasured by food intake surveys, can be assessed (1).
The purpose of RNIs is to provide guidance for policy-makers on howmuch of each nutrient is needed to ensure that a population is healthy(Box 1). The aim is to prevent deficiency (for example, iodine to preventgoitre); to optimize health (for example, recommendations for anti-oxidants in vegetables and fruit); and to provide safe limits above whicha nutrient (for example, excess protein or energy) could be harmful.
1. RNIs provide a benchmark for the development of dietary guidelines and theplanning of public health nutrition strategies.
2. RNIs can be useful for food labelling (for example, a food might be described ascontaining x% of the recommended intake of vitamin C for a given age group).
3. RNIs can be used to assess and interpret dietary surveys and food intakeinformation relating to normal healthy populations.
4. RNIs can be used to assess the adequacy of the dietary intake of vulnerablegroups.
Source: adapted from Weaver (2).
Box 1. Applications and limitations of recommended nutrient intakes

40 chapter 2
Additional factors such as bioavailability (of iron, for example) must betaken into consideration when setting national RNIs.
RECOMMENDATIONS ARE DERIVED FROMREQUIREMENTS
A requirement is defined as the lowest continuing level of intake of anutrient that will maintain a defined level of nutrition in an individual (3).The actual nutrient requirement will vary from individual to individual,whereas a nutrient recommendation must cover the requirements of al-most all those in a given population. RNIs are useful for assessing the diet ofgroups within a population, not of individual children, and recommenda-tions must take account of the large biological variation within a popula-tion. The metabolic needs of healthy individuals, such as the needs forgrowth, are taken into account whereas the increased nutrient demands ofillness are not.
In the United Kingdom, a committee convened by the Department ofHealth (4) decided to use the term “dietary reference values” rather thanRNIs. The committee chose to set, where possible, three values for eachnutrient, reflecting a range of nutrient requirements (low, medium andhigh) (Fig. 10) rather than just one value. These three values, known collec-tively as dietary reference values, include the mean value (the “estimatedaverage requirement”), the mean value plus two standard deviations (the“reference nutrient intake”) and the mean value minus two standarddeviations (the “lower reference nutrient intake”). An example of this ap-proach is shown in Table 7, where the three values are presented for zinc.
Fig. 10. Relationship between various reference valuesfor nutritional requirements
Num
ber o
f peo
ple
Nutrient requirements
Lower referencenutrient intake
Estimated averagerequirement
Reference nutrientintake
(a) (b) (c)

41recommended nutrient intakes
Underlying the concept for defining recommendations is the assumptionthat the requirements of most nutrients are distributed normally in a popu-lation (Fig. 10). The level that is sufficient to meet the requirements ofpractically all the population is set at the upper end of the distribution atapproximately two standard deviations above the mean. This recommen-dation, the reference nutrient intake, should cover the nutrient require-ments of approximately 95% of the population, whereas the mean valuewill meet those of around half the population. Because excess intake ofenergy leads to obesity, the mean value is the recommended value forenergy; the higher value would undoubtedly lead to excess energy intake ina large percentage of the population and increase the risk of obesity-relateddiseases. The value at the lower end of the distribution curve is estimated bycalculating the mean minus two standard deviations. If the habitual meanintake of a population were at the level of the lower reference nutrientintake, more than half the population would be deficient in that particularnutrient and thus their complete nutrient requirements would not be satisfied.
Most estimates are derived from a limited number of balance studies orintake surveys, and care is therefore required in interpreting RNIs. Forexample, RNIs for infants are often based on measures of the breast-milkintake of exclusively breastfed infants. Between the ages of 6 and 12 months,and sometimes up to 24 months, nutrient recommendations are derived byextrapolating from the data for this younger age group, using a formula thatallows for growth and increasing body size. The nutrient recommendationsfor children aged over 24 months are in most cases extrapolated from adultvalues, on the assumption that children have a similar maintenance require-ment for a given nutrient per kilogram of body weight. To most of these
Table 7. Dietary reference values (mg/day) for zinc in the United Kingdom
Age of child Lower reference Estimated Referencenutrient intake average nutrient intake
requirement
0–3 months 2.6 3.3 4.04–6 months 2.6 3.3 4.07–9 months 3.0 3.8 5.010–12 months 3.0 3.8 5.01–3 years 3.0 3.8 5.04–6 years 4.0 5.0 6.6
Source: Department of Health, United Kingdom (4).

42 chapter 2
recommendations is added an additional increment as a safety margin inorder to protect against any risk of deficiency.
NOMENCLATURE OF RECOMMENDED NUTRIENT INTAKES
Several countries have established their own RNI systems, and differentnomenclatures are used (Table 8). The European Union uses populationreference intakes (PRI) and the former Soviet Union used the term “physi-ological norm”. The RNIs used in this publication correspond to the refer-ence nutrient intake shown in Fig. 10. It should be noted that the abbrevia-tion “RNI” used here, unless otherwise stated, refers to recommended andnot reference nutrient intake.
The criteria presented in Box 2 reflect the fact that the RNI is usually setaround the mean value representative of a group, plus two standard devia-tions. However, the trend is to consider the optimal intake of each nutrientas opposed to setting levels designed only to prevent deficiency. This in-cludes considering the problem of excess nutrient intakes, such as of energy,protein, vitamin A, vitamin D and iron, which are potentially harmful ifregularly consumed in excessive amounts.
Table 8. Definitions of nutrient recommendations
Source: Weaver (2).
Source Name Definition
European Union Population reference intake The intake that will meet the(PRI) needs of nearly all healthy
people in a group (5).
United Kingdom Reference nutrient intake An amount of the nutrient that(RNI) is enough, or more than
enough, for about 97% ofpeople in a group (2).
United States Recommended dietary The levels of intake of essentialallowances (RDA) nutrients that, on the basis of
scientific knowledge, areAdequate intake (AI) judged ... to be adequate to
meet the known nutrientneeds of practically all healthypersons (6).
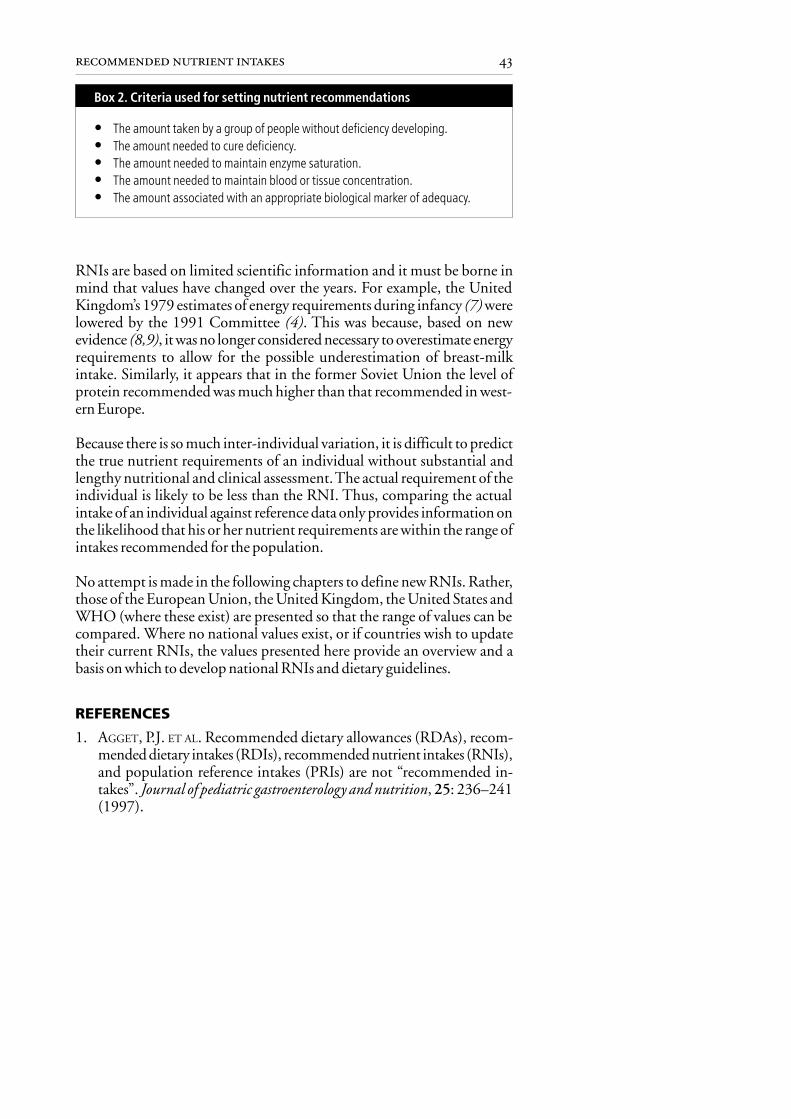
43recommended nutrient intakes
• The amount taken by a group of people without deficiency developing.• The amount needed to cure deficiency.• The amount needed to maintain enzyme saturation.• The amount needed to maintain blood or tissue concentration.• The amount associated with an appropriate biological marker of adequacy.
Box 2. Criteria used for setting nutrient recommendations
RNIs are based on limited scientific information and it must be borne inmind that values have changed over the years. For example, the UnitedKingdom’s 1979 estimates of energy requirements during infancy (7) werelowered by the 1991 Committee (4). This was because, based on newevidence (8,9), it was no longer considered necessary to overestimate energyrequirements to allow for the possible underestimation of breast-milkintake. Similarly, it appears that in the former Soviet Union the level ofprotein recommended was much higher than that recommended in west-ern Europe.
Because there is so much inter-individual variation, it is difficult to predictthe true nutrient requirements of an individual without substantial andlengthy nutritional and clinical assessment. The actual requirement of theindividual is likely to be less than the RNI. Thus, comparing the actualintake of an individual against reference data only provides information onthe likelihood that his or her nutrient requirements are within the range ofintakes recommended for the population.
No attempt is made in the following chapters to define new RNIs. Rather,those of the European Union, the United Kingdom, the United States andWHO (where these exist) are presented so that the range of values can becompared. Where no national values exist, or if countries wish to updatetheir current RNIs, the values presented here provide an overview and abasis on which to develop national RNIs and dietary guidelines.
REFERENCES
1. AGGET, P.J. ET AL. Recommended dietary allowances (RDAs), recom-mended dietary intakes (RDIs), recommended nutrient intakes (RNIs),and population reference intakes (PRIs) are not “recommended in-takes”. Journal of pediatric gastroenterology and nutrition, 25: 236–241(1997).

44 chapter 2
2. WEAVER, L.T. Nutrition. In: Campbell, A.G.M. et al., ed. Forfar &Arneil’s textbook of paediatrics, 5th ed. Edinburgh, Churchill Livingstone,1992, pp. 1179–1180.
3. US INSTITUTE OF MEDICINE. Dietary reference intakes for thiamin, ri-boflavin, niacin, vitamin B
6, folate, vitamin B
12, pantothenic acid,
biotin, and choline. Washington, DC, National Academy Press, 1998.4. DEPARTMENT OF HEALTH, UNITED KINGDOM. Dietary reference values
for food energy and nutrients for the United Kingdom. Report of the Panelon Dietary Reference Values of the Committee on Medical Aspects of FoodPolicy. London, H.M. Stationery Office, 1991 (Report on Health andSocial Subjects, No. 41).
5. EUROPEAN COMMISSION. Report of the Scientific Committee on Food(thirty-first series). Nutrient and energy intakes for the European Com-munity. Luxembourg, Office for Official Publications of the EuropeanCommunities, 1993.
6. US NATIONAL RESEARCH COUNCIL. Recommended dietary allowances,10th ed. Washington, DC, National Academy Press, 1989.
7. DEPARTMENT OF HEALTH, UNITED KINGDOM. Recommended dailyamounts of food energy and nutrients for groups of people in the UnitedKingdom. London, H.M. Stationery Office, 1979 (Report on Healthand Social Subjects, No. 15).
8. PRENTICE, A.M. ET AL. Are current guidelines for young children aprescription for overfeeding? Lancet, 2: 1066–1069 (1988).
9. LUCAS, A. ET AL. How much energy does a breast-fed infant consumeand expend? British medical journal, 295: 75–77 (1987).

introductionchapter 3
Energy and macronutrients
Provision of adequate dietary energy is vital during the period of rapid growthin infancy and early childhood. Attention must be paid to feeding practicesthat maximize the intake of energy-dense foods without compromising micro-nutrient density.
An adequate protein intake with a balanced amino acid pattern is importantfor the growth and development of the infant and young child. If the childreceives a varied diet, however, protein quantity and quality are seldom aproblem. It is prudent to avoid a high-protein diet because this can haveadverse effects.
During complementary feeding and at least until 2 years of age, a child’s dietshould not be too low (because this may diminish energy intake) or too high infat (because this may reduce micronutrient density). A fat intake providingaround 30–40% of total energy is thought to be prudent.
Consumption of added sugars should be limited to about 10% of total energy,because a high intake may compromise micronutrient status.
ENERGY
FunctionEnergy is required for tissue maintenance and growth, to generate heat(thermogenesis) and for physical activity. Weight gain is a sensitive indica-tor of the adequacy of energy intake in young children. The energy require-ment is the amount of dietary energy needed to balance the energy ex-pended and that deposited in new tissue (growth). Energy expenditure canbe subdivided into basal metabolism, which represents 50–60% of totalenergy expenditure (TEE) in most healthy children, energy expended onphysical activity (30–40% of TEE in most healthy children) and thermo-genesis (approximately 5–8% of TEE). The energy required for growthdeclines rapidly from around 35% of TEE at birth to 5% at 1 year (Fig. 11).Basal metabolic rate can be considered to represent a “maintenance” require-ment, since it is the energy cost of biosynthesis, metabolism and the physi-cal work of respiratory and cardiac function. The energy expended onphysical activity varies widely, while that expended on thermogenesis isprimarily the cost of digesting, absorbing and resynthesizing nutrients.

46 chapter 3
Growth demands some energy expended on biosynthesis, in addition tothe energy content of newly synthesized tissue.
SourcesDietary energy is consumed in the form of fat, carbohydrate and protein.Fat accounts for approximately 50% of the energy in breast-milk and is themain source of energy for infants less than 6 months old. With the intro-duction of complementary food, fat is gradually overtaken by carbohydrateas the chief energy source, and together they meet the energy needs of thegrowing child. Dietary protein can also be oxidized to provide energy, butits primary role is in the growth and maintenance of new tissues. Per unit ofbody weight, the intakes of energy, fat and carbohydrates of the normalinfant during the early months of life are far greater than the correspondingintakes of normal adults (Fig. 12). This is because the maximum rate ofgrowth occurs in infancy, when the baby doubles its body weight in the first6 months and triples it by 1 year.
Per unit body weight, the intake of energy by an exclusively breastfed infantis 2.3 times that of an adult. Compared with an adult, and calculated pergram of macronutrient, an infant’s intake of protein is almost the same, theintake of fat almost four times and the intake of carbohydrate almost double.
RequirementsCurrent WHO recommendations for energy intake for the first 12 monthsof life (1) were based on the observed average energy intakes of healthychildren in affluent countries, plus a 5% increment for an assumed under-estimation of breast-milk intake.
Fig. 11. Comparison of energy requirements during infancy and adulthood
0
20
40
60
80
100
120
ActivityGrowthThermogenesisBasal metabolic rate
Age (months)
Adult9631
Ener
gy re
quire
men
ts(k
cal/k
g/da
y)
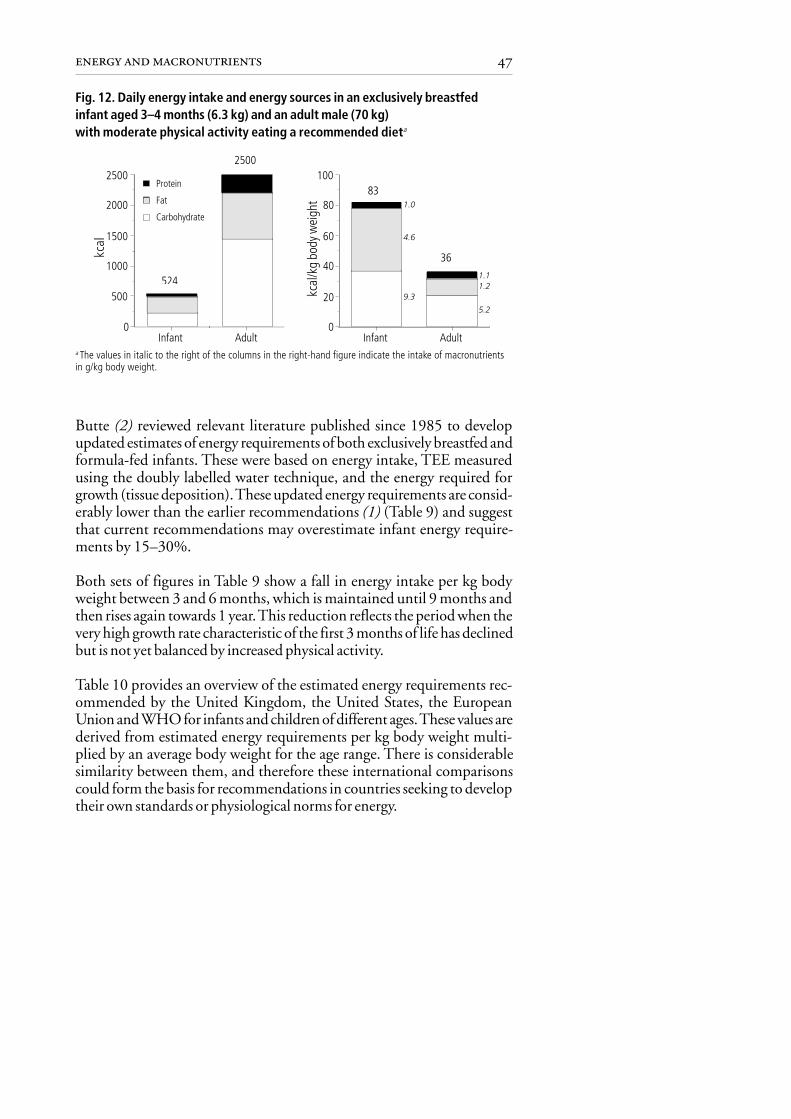
47energy and macronutrients
Fig. 12. Daily energy intake and energy sources in an exclusively breastfedinfant aged 3–4 months (6.3 kg) and an adult male (70 kg)with moderate physical activity eating a recommended dieta
a The values in italic to the right of the columns in the right-hand figure indicate the intake of macronutrientsin g/kg body weight.
0
20
40
60
80
100
Infant Adult
Protein
Fat
Carbohydrate
0
500
1000
1500
2000
2500
Infant Adult
524
2500
83
36
1.0
4.6
9.3
1.11.2
5.2
kcal
Butte (2) reviewed relevant literature published since 1985 to developupdated estimates of energy requirements of both exclusively breastfed andformula-fed infants. These were based on energy intake, TEE measuredusing the doubly labelled water technique, and the energy required forgrowth (tissue deposition). These updated energy requirements are consid-erably lower than the earlier recommendations (1) (Table 9) and suggestthat current recommendations may overestimate infant energy require-ments by 15–30%.
Both sets of figures in Table 9 show a fall in energy intake per kg bodyweight between 3 and 6 months, which is maintained until 9 months andthen rises again towards 1 year. This reduction reflects the period when thevery high growth rate characteristic of the first 3 months of life has declinedbut is not yet balanced by increased physical activity.
Table 10 provides an overview of the estimated energy requirements rec-ommended by the United Kingdom, the United States, the EuropeanUnion and WHO for infants and children of different ages. These values arederived from estimated energy requirements per kg body weight multi-plied by an average body weight for the age range. There is considerablesimilarity between them, and therefore these international comparisonscould form the basis for recommendations in countries seeking to developtheir own standards or physiological norms for energy.
kcal
/kg
body
wei
ght
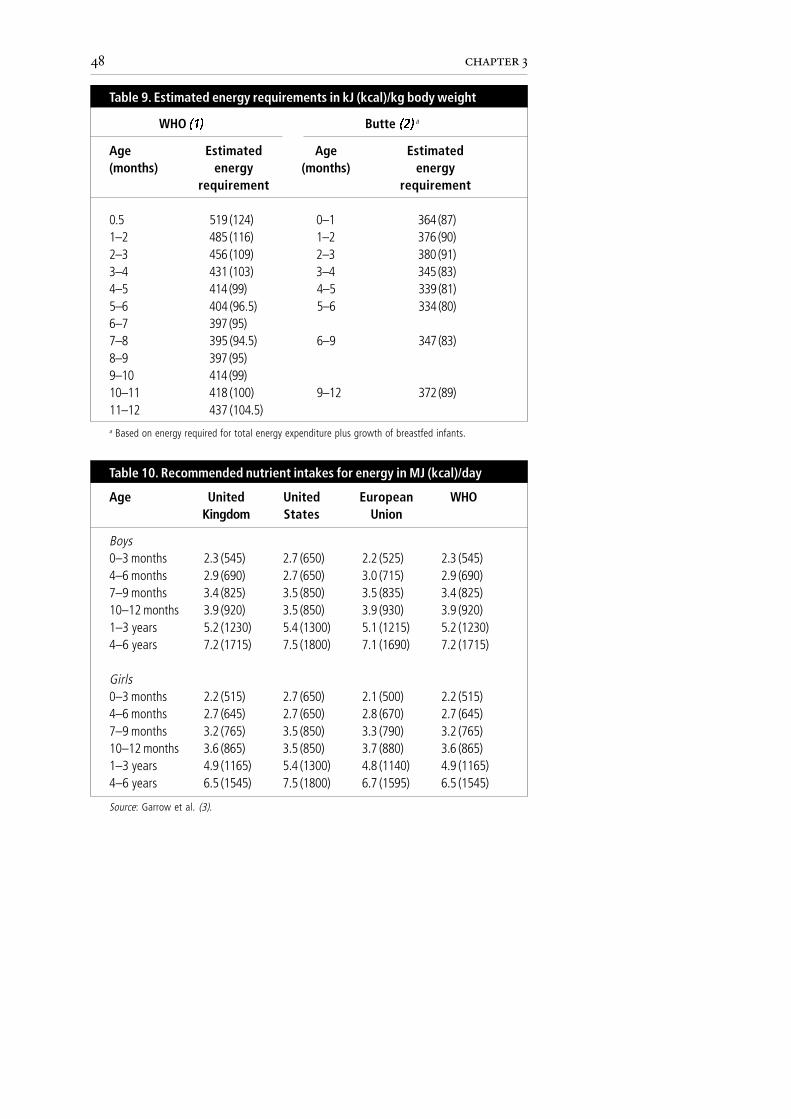
48 chapter 3
Age Estimated Age Estimated(months) energy (months) energy
requirement requirement
0.5 519 (124) 0–1 364 (87)1–2 485 (116) 1–2 376 (90)2–3 456 (109) 2–3 380 (91)3–4 431 (103) 3–4 345 (83)4–5 414 (99) 4–5 339 (81)5–6 404 (96.5) 5–6 334 (80)6–7 397 (95)7–8 395 (94.5) 6–9 347 (83)8–9 397 (95)9–10 414 (99)10–11 418 (100) 9–12 372 (89)11–12 437 (104.5)
Table 9. Estimated energy requirements in kJ (kcal)/kg body weight
WHO ��� Butte ��� a
a Based on energy required for total energy expenditure plus growth of breastfed infants.
Age United United European WHOKingdom States Union
Boys0–3 months 2.3 (545) 2.7 (650) 2.2 (525) 2.3 (545)4–6 months 2.9 (690) 2.7 (650) 3.0 (715) 2.9 (690)7–9 months 3.4 (825) 3.5 (850) 3.5 (835) 3.4 (825)10–12 months 3.9 (920) 3.5 (850) 3.9 (930) 3.9 (920)1–3 years 5.2 (1230) 5.4 (1300) 5.1 (1215) 5.2 (1230)4–6 years 7.2 (1715) 7.5 (1800) 7.1 (1690) 7.2 (1715)
Girls0–3 months 2.2 (515) 2.7 (650) 2.1 (500) 2.2 (515)4–6 months 2.7 (645) 2.7 (650) 2.8 (670) 2.7 (645)7–9 months 3.2 (765) 3.5 (850) 3.3 (790) 3.2 (765)10–12 months 3.6 (865) 3.5 (850) 3.7 (880) 3.6 (865)1–3 years 4.9 (1165) 5.4 (1300) 4.8 (1140) 4.9 (1165)4–6 years 6.5 (1545) 7.5 (1800) 6.7 (1595) 6.5 (1545)
Table 10. Recommended nutrient intakes for energy in MJ (kcal)/day
Source: Garrow et al. (3).
49energy and macronutrients
For girls and boys aged less than 2 years, reference nutrient intakes areassumed to be identical when expressed per unit body weight. Owing totheir greater average weight, therefore, boys have higher estimated averagerequirements for energy.
Physical activityEnergy requirements change with physical activity and under stressful envi-ronmental conditions, such as extremes of temperature and during illness,but precise estimates of the range of these variations are not available forinfants and young children. Physical activity plays a key role in the psycho-logical and social development of young children and it is therefore essentialthat children receive adequate energy to support optimal physical activity.There is some evidence that when energy intake is insufficient, activity maybe reduced to maintain growth (4).
Energy required from complementary foodsThe energy needed from complementary foods depends on the energy ob-tained from breast-milk and the energy requirements of the individual infant. Itis therefore difficult to estimate the average energy required from complemen-tary foods alone. In the WHO/UNICEF report on complementary feeding indeveloping countries (5), however, an attempt was made to estimate this.
The energy needed from complementary foods can be calculated by sub-tracting the energy consumed as breast-milk from the recommended en-ergy intake. Values used for the recommended energy intake are thoseproposed by Butte (2) (Table 9) for infants aged up to 12 months, and byTorun et al. (6) for young children aged 12 months and over. Estimates ofmean breast-milk intake were derived from a comprehensive review of thepublished literature from both developing and industrialized countries,and from both exclusively and partially breastfed infants. Energy require-ments were assumed to be the same for all these groups of infants.
Because the mean intake of breast-milk was slightly lower in developingthan in industrialized countries, the energy needed from complementaryfoods in the 3–8-month age group in developing countries is slightly higher(Table 11). The original theoretical analyses (5) include a range of high tolow intakes of breast-milk (mean + 2 standard deviations). The range iswide and, for example in industrialized countries, values range from zero to1.7 MJ/day (408 kcal/day) in the 6–8-month age group.
The data given in Table 11 suggest that infants from industrialized coun-tries, with an average breast-milk intake, do not require any complementary

50 chapter 3
food to meet their energy requirements until the age of 6–8 months, whenthey need 0.8 MJ (196 kcal)/day from complementary food. As men-tioned, however, the range of needs is wide and it is vital to interpret theseestimates cautiously. The actual energy requirements of each infant willdepend on his or her body weight and other factors, including rate ofgrowth.
In contrast, it appears that a 3–5-month-old infant from a developingcountry does need a small amount of energy from complementary food(0.3 MJ (76 kcal)/day). This figure is the difference between the energyneeds of an infant with a median body weight according to the WHOreference and energy from a breast-milk intake based on available data fromdeveloping countries, where infants often have a low body weight; thefigure may therefore be inflated. Furthermore, studies suggest that theintroduction of complementary foods before 6 months is likely to displacebreast-milk (7,8) and its early introduction is thus not effective in increas-ing the total energy intake.
Thus, after about 6 months of age, breast-milk alone does not meet a child’senergy needs, and appropriate complementary foods are necessary to supplythe additional energy required. The evidence for when to introduce com-plementary foods is reviewed in more detail in Chapter 8.
Low intakeIf energy intake is less than the energy requirement of the individual, physi-cal activity and/or rate of growth will be reduced. If the deficit continues,
0–2 2.1 (490) 0.0 (0) 1.8 (437) 0.0 (0)3–5 2.3 (548) 0.0 (2) 2.0 (474) 0.3 (76)6–8 2.0 (486) 0.8 (196) 1.7 (413) 1.1 (269)9–11 1.6 (375) 1.9 (455) 1.6 (379) 1.9 (451)12–23 1.3 (313) 3.3 (779) 1.5 (346) 3.1 (746)
Source: World Health Organization (5).
Table 11. Age-specific estimates of energy in MJ (kcal)/day required fromcomplementary foods in industrialized and developing countries,assuming an average breast-milk intake
Breast-milk Complementary Breast-milk Complementaryfoods foods
Industrialized countries Developing countriesAgegroup(months)
51energy and macronutrients
protein–energy malnutrition will develop. Low energy intake may alsoresult in the metabolism of protein for energy and consequently proteindeficiency (see page 54).
High intakeWhen energy intake exceeds requirements, fat deposition and weight gainincrease. However, fat deposition during infancy is part of normal growth.The rate of fat deposition, measured as subcutaneous fat or body fat, is veryfast up to the age of 4 months, and slows thereafter until the age of about6 years. Fat mass as a percentage of body mass increases until about 6 monthsof age and gradually declines thereafter. Total fat, on the other hand, is onaverage higher in a 6-year-old than a 1-year-old, although it will be lowerper unit of body weight.
Studies from the early 1970s suggested that fatness during infancy couldresult in a lifelong risk of obesity. More recent epidemiological studies,however, show no strong correlation between fatness during infancy andobesity in later life (9,10). It is now generally agreed that fatness duringinfancy is not a risk factor for obesity later in life. Nevertheless, the degree towhich fatness during early childhood (second and third years of life) is associ-ated with obesity in later life is not known. Given the escalating prevalenceof obesity in the Region, it is prudent to limit fat and sugar intake andthereby energy intake from the age of 2–3 years. Furthermore, all childrenshould be encouraged to be physically active.
ENERGY DENSITY
Infants and young children have an energy intake per kg body weight some2–3 times that of adults (Fig. 11 and 12). Because they have to ingest largeamounts of energy, a key determinant of energy intake is the energy densityof complementary foods. Too low an energy density may result in an energydeficit and consequently poor growth. The amount of energy an infant caneat is determined by a number of factors (Fig. 13). Energy density is in-creased by raising the content of fat and sugar, while a higher water contentwill decrease energy density. Energy intake is increased through comple-mentary food with a high energy density, more frequent meals and anincreased intake of breast-milk. Conversely, energy intake will be reduced ifcomplementary foods are very viscous, which is typically the result of a highstarch content.
Energy intake is also influenced by functional gastric capacity, which deter-mines the volume of food an infant can ingest during one meal. The

52 chapter 3
functional gastric capacity is determined not only by the volume of thestomach but also by its rate of emptying. If the energy density of a meal islow, the infant will require a large volume of food to satisfy energy require-ments, and this may exceed the infant’s gastric capacity. Functional gastriccapacity has been estimated to be about 30 g/kg body weight (5). This isequal to values of approximately 250, 285 and 345 g/meal for infants ofaverage body weight at 6–8, 9–11 and 12–23 months, respectively. Theseestimates of gastric capacity were used to calculate the minimum energydensity of complementary food (5). Table 12 shows the energy densitiesneeded to satisfy energy requirements assuming an average breast-milkintake (see Table 11) or no breast-milk intake and different meal frequen-cies. These figures depend on a number of assumptions about gastric capac-ity, and the number and composition of meals, and should therefore beregarded as rough estimates.
Based on these data, the WHO/UNICEF report (5) concluded that breastfedinfants older than 8 months should receive at least three meals of comple-mentary foods per day and that, if the energy density of the diet is less than4.2 kJ (1 kcal)/g, more than three meals are needed. Furthermore, thereport recommended that for those infants receiving little or no breast-milk(or suitable alternative formula), at least four meals per day, or very energy-dense food, are required. Studies of the dietary intake of infants and young
Fig. 13. Factors affecting the energy density of complementary foods andenergy intake by the infant and young child.The direction of influence is indicated as positive (+) or negative (–).
Energy density ofcomplementary
foodGrowth
Fat Sugar Breast-milk Meal frequency
Energy intake
(+) (+)
Viscosity of complementary foodWater
(+)
(+)
(–) (–)
(+)
(+)

53energy and macronutrients
2 meals 3 meals 4 meals 2 meals 3 meals 4 meals
6–8 3.8 (0.9) 2.5 (0.6) 1.6 (0.4) 7.1 (1.7) 4.6 (1.1) 3.8 (0.9)9–11 5.0 (1.2) 3.4 (0.8) 2.5 (0.6) 7.5 (1.8) 5.0 (1.2) 3.8 (0.9)12–23 6.3 (1.5) 4.2 (1.0) 2.9 (0.7) 8.4 (2.0) 5.4 (1.3) 4.2 (1.0)
Table 12. Minimum energy density in kJ (kcal)/g of complementary foodsby number of meals per day, breast-milk intake and age group
No breast-milkAverage breast-milkintake
Agerange(months)
Source: World Health Organization (5).
children from industrialized countries show that the energy density of thetotal diet (breast-milk combined with complementary foods) slowly in-creases from that of breast-milk (2.8 kJ (0.67 kcal)/g) (11). The averageenergy density of complementary foods is higher than that of breast-milk;if it falls below that of breast-milk, studies suggest that the total energyintake will be too low. It is therefore prudent to assume that the averageenergy density of complementary foods should be at least 2.8 kJ (0.67 kcal)/gand ideally closer to 4.2 kJ (1 kcal)/g.
Energy density varies considerably among different complementary foods.Foods with a high energy density include meat and fatty fish. Most comple-mentary foods, however, are based on a staple that is high in complexcarbohydrates, and therefore bulky and viscous, often with a low energyand nutrient density. Porridges, for example, typically have a very lowenergy density (< 2.1 kJ (< 0.5 kcal)/g) if they are prepared without milk orfat. To reduce their viscosity and thereby make them easier for infants andyoung children to consume, water is often added to complementary foods,particularly to porridges. This further reduces their energy and nutrientdensity, and is therefore not recommended.
There are several ways in which the energy density of a complementary foodcan be increased. Adding fat or sugar increases the energy density withoutincreasing the viscosity of the food (Fig. 13). Fat is most efficient because itis very energy-dense (38 kJ (9 kcal)/g) while sugar, like other carbohydratesand protein, contains only 17 kJ (4 kcal)/g. Both fat and sugar, however,contain no protein and almost no micronutrients and thus the nutrientdensity of the meal will be reduced. The amount of fat that can be added toa diet without reducing the intake of micronutrients to a level below therecommended intake depends on the total micronutrient content of thediet.

54 chapter 3
National recommendations from industrialized countries advise a di-etary fat content of about 35–45% total energy intake for the age group6–12 months, decreasing to about 30–40% from 12 months to 2–3 yearsof age (12). In contrast, it is recommended (5) that in developing countriesfat intake should be lower, at approximately 30% of total energy intake(25% in the complementary diet). This last recommendation is based on aconcern that if a high quantity of fat is added to a monotonous cereal-baseddiet with a borderline micronutrient content, then this low micronutrientcontent would be further diluted. In the present report, a fat intake provid-ing around 30–40% of total energy is thought to be prudent for the first2 years of life.
PROTEIN
FunctionProteins are the major functional and structural components of all thebody’s cells. They are diverse in structure and function: enzymes, bloodtransport molecules, the intracellular matrix, fingernails and hair are allcomposed of proteins, as are most hormones and components of mem-branes. Amino acids, the building-blocks of proteins, also act as precursorsfor the synthesis of many coenzymes, hormones, nucleic acids and othermolecules essential for life. Thus, to maintain cellular integrity and func-tion and to ensure health and growth, an adequate supply of dietary proteinis vital. Proteins may also be a source of energy during times of energy depriva-tion, although fat and carbohydrate are utilized preferentially by the body.
Protein intake is particularly important in infancy and childhood, whenrapid growth requires amino acids from which to build new tissue (particu-larly the organs and muscle). All amino acids provide nitrogen for synthesisof human proteins, but some essential (indispensable) amino acids cannotbe synthesized by the body and must therefore be supplied in the diet. Ifdeprived of these essential amino acids, the body will catabolize its ownproteins to produce them. Adequate intakes of essential amino acids can beachieved so long as the diet contains a variety of protein sources (see below).In adults, the essential amino acids are isoleucine, leucine, lysine, methio-nine, phenylalanine, threonine, tryptophan, valine and histidine. Arginineis an essential amino acid for children. Cysteine, taurine and tyrosine appearto be essential amino acids for the preterm infant, but evidence is inconclu-sive as to their essentiality for term infants.
The body can synthesize other amino acids from simple precursors, andthese are termed the nonessential amino acids. They are alanine, aspartic

55energy and macronutrients
acid, cysteine, glutamic acid, glycine, proline, serine and tyrosine. There areonly very small reserves of protein in the body (approximately 3% of thetotal body content), and therefore pathological conditions such as starva-tion, injury or infection can cause substantial rates of protein loss from thebody protein mass. Protein is catabolized mainly by the breakdown ofmuscle cells to provide the necessary amino acids, or energy if energy intakeis low, to maintain protein synthesis. Thus if dietary sources of nitrogen arelimited, all amino acids become “essential”. If breast-milk (or other milk)intake is significant, however, the need for essential amino acids fromcomplementary foods is very small, and nitrogen can be provided fromplant proteins as long as there is sufficient energy.
SourcesGood sources of high-quality protein include animal sources, such as liver,meat, fish, cheese, milk and eggs, and some vegetable sources, primarilysoya products, green beans and pulses. Wheat products are also good sourcesof vegetable protein, but most vegetables and fruit contain little protein.
Proteins are classified nutritionally according to the quantity and propor-tion of essential amino acids that they contain. The biological value of aprotein refers to its ability, when it is the sole dietary source of protein, tosupport protein synthesis and therefore body maintenance and growth. Onthis scale, breast-milk proteins and egg have the highest value, 1.0. Allanimal proteins (with the exception of gelatin) are complete, that is theycontain all the essential amino acids and are of high biological value. Mostvegetable proteins, except soya, are incomplete because they offer an unbal-anced assortment of amino acids that cannot alone satisfy the body’s needs.An essential amino acid supplied in less than the amount needed to supportprotein synthesis is known as a limiting amino acid; in cereal diets, forexample, lysine tends to be limiting. This so-called “limiting” can be over-come by mixing different vegetable protein sources together, as explained inChapter 8.
Because proteins are digested to amino acids or small peptides before theyare absorbed, it is the mixture of amino acids derived from the ingestedfoods that is important. Protein complementation is the process by whicha protein of low biological value, lacking amino acid X but containing Y, iseaten with another low-value protein, rich in X but not Y, the two togethergiving a good mix of amino acids equal to a protein of high biological value.Thus, if cereals are consumed with milk proteins, which have a high lysinecontent, there is significant complementation and the limiting factor isovercome.
56 chapter 3
Coeliac diseaseCoeliac disease is the result of a sensitivity in a small number of children todietary gluten, a protein that causes injury to the mucosa of the smallintestine, leading to malabsorption and other clinical problems includingiron deficiency and wasting. Gluten is a mixture of proteins found incereals, and it is the gliadin fraction of gluten that is toxic to the intestinalepithelium, precipitating gluten enteropathy or coeliac disease. The gliadincontent of wheat is considerably higher than that of other cereals. Gliadinitself is a mixture of proteins, and research is under way to identify thedifferent epitopes and mechanisms by which they cause mucosal damage.
Coeliac disease sometimes manifests itself during the complementary feed-ing period, after the infant first encounters foods containing gluten. It maytake some time to develop clinically, and if genetically predisposed indi-viduals are breastfed and are not introduced to gluten-containing foodsuntil after 6 months of age, the onset of the disorder will probably bedelayed or possibly prevented. This delay may be important, because nutri-tion and growth will not be compromised during the particularly vulner-able stage of rapid growth. New data from Sweden suggest that not onlybreastfeeding, but also the age at which gluten is introduced into the dietand the amount of gluten consumed in early life, affect the risk of develop-ing coeliac disease (13). Coeliac disease is treated by lifelong exclusion ofgluten from the diet. Most countries recommend that infants should notreceive gluten-containing foods before 6 months of age. Thus, it seemsprudent to recommend that gluten-containing cereals should not be intro-duced before the age of about 6 months.
RequirementsThe 1985 recommendations on protein requirements for infants less than6 months of age (1) were based on intake data from breastfed infants. It wasconcluded that the protein requirements of infants up to 6 months of agewill be fully satisfied as long as energy needs are met and the food offeredcontains protein in a quantity and quality equivalent to that in human milk.Not all of the protein in human milk is “nutritional”, as some functionalproteins such as secretory IgA can be found in the stools. Nevertheless,although the protein requirement per unit of body weight is greater ininfants than in any other age group, the nitrogen from breast-milk is highlybioavailable and well absorbed and is matched by a high energy intake perunit of body weight. This concept can be illustrated by the energy andprotein requirements of a 3-month-old infant. Breast-milk is perfectlyadapted to infant needs and is relatively low in protein compared with cow’smilk. At 3 months of age, protein intake represents approximately 5–6% of

57energy and macronutrients
total energy intake compared with about 10–15% in adults. With anaverage daily breast-milk intake of around 800 ml, the protein require-ments (estimated at 1.4 g/kg body weight/day) will be satisfied.
Table 13 shows that the protein requirements for infants aged 2–5 months, asestimated in 1985 (1), were 7–19% greater than the intakes of exclusivelybreastfed infants estimated by Dewey et al. (14). The most probable explana-tion for this difference is that protein requirements were overestimated in 1985.
The 1985 estimates of mean protein requirements used a modified facto-rial approach, based on estimates of maintenance nitrogen needs and thosefor growth, which in children under 2 years is a significant percentage. Lackof data and dependence on certain assumptions limit these estimates, andthere is a need for more evidence on which to base reliable recommenda-tions of the safe level of protein intake for children, particularly during thecritical period of rapid growth in the first 12 months. In the absence ofevidence from direct experimentation, protein requirements are based onan estimate of the protein intake that would meet the mean requirement; asafe level is then set at two standard deviations above this in order to meetthe needs of the vast majority of infants. Estimates for safe protein require-ments in infants aged 0–12 months are shown in Table 13. National andinternational recommendations are based on these estimated requirements(Table 14).
The former Soviet “physiological norms” for protein were significantlyhigher (over three times in some cases) than levels recommended by inter-national expert committees. As a result, studies investigating the adequacy
Age (months) FAO/WHO/UNU ��� Dewey et al. ����
0–1 – 2.691–2 2.25 2.042–3 1.82 1.533–4 1.47 1.374–5 1.34 1.255–6 1.30 1.196–9 1.25 1.099–12 1.15 1.02
Table 13. Estimated protein “requirements” in g/kg body weight/day forinfants aged 0–12 months

58 chapter 3
of protein intakes in the former Soviet countries may erroneously claim tofind widespread protein deficiency. Indeed, there is very little evidence tosupport claims that widespread protein deficiency exists in any of the formerSoviet countries, including the central Asian republics.
Low intakeProtein deficiency is almost always accompanied by inadequate energyintake, and the two together give rise to protein–energy malnutrition, oneof the commonest forms of malnutrition worldwide. In children, acuteprotein–energy malnutrition (caused by recent severe food deprivation) ischaracterized by a low weight-for-height index (wasting), while the chroniccondition (caused by long-term food deprivation) is characterized by a lowheight-for-age index (stunting). Severe protein–energy malnutrition re-sults in the clinical syndromes of marasmus, kwashiorkor or marasmickwashiorkor. All three conditions are compounded by a range of nutri-tional disorders, including micronutrient deficiencies (15).
In infants and young children in industrialized countries, severe malnutri-tion is usually secondary to gastrointestinal disorders or chronic systemicdisease such as tuberculosis, cystic fibrosis or cancer. Nevertheless, primarymalnutrition unrelated to illness may be caused by insufficient food avail-ability, lack of care or poverty. Specific causes include: formula feeds that areoverdiluted; home-made formulas of inappropriate composition; prolongedpartial breastfeeding without adequate addition of complementary foods;excessive juice intake; the offering of inadequate food because of perceivedfood “allergens”; and the inappropriate provision of a milk-free diet that islow in protein.
Age United United European WHOKingdom States Union
0–3 months 12.5 13 – 12.54–6 months 12.7 13 14.0 12.77–9 months 13.7 14 14.5 13.710–12 months 14.9 14 14.5 14.91–3 years 14.5 16 14.7 14.54–6 years 19.7 24 19.0 19.7
Table 14. Recommended nutrient intakes for protein in g/day�
� Recommended protein intake per day is calculated by multiplying recommended protein intakesper kg body weight with the mean body weight for infants in each age group.
Source: Garrow et al. (3).
59energy and macronutrients
High intakeFamily foods tend to contain a high proportion of protein (approximately10–15% of total energy intake) and if the diet is low in fat the percentage oftotal energy intake contributed by protein can be between 15% and 20%.Such protein intakes are 3–4 times greater than the protein requirements ofinfants and young children.
Diets high in protein offer no benefits and can theoretically have a numberof adverse effects. High circulating blood levels of amino acids may exceedthe capacity of the hepatic and renal systems to metabolize and excrete theexcess nitrogen. This may lead to acidosis, diarrhoea and elevated levels ofblood ammonia and urea. The high potential renal solute load associatedwith diets rich in protein reduces the margin of safety related to the mainte-nance of water balance. Consequently, during periods of illness with associ-ated dehydration, the reduced capacity to excrete waste products increasesthe risk of hypernatraemia. High prevalence of hypernatraemic dehydra-tion has virtually disappeared in some countries, probably as a result of thehigher rates of breastfeeding and the use of modified cow’s milk formulawith lower protein and salt content (16).
In addition to the risk that high protein intakes can compromise fluidbalance, excess protein intake has also been linked to obesity in later life. Ina longitudinal study of children, for example, those with a high proteinintake at the age of 2 years had a significantly higher risk of being obese at8 years (17). However, this association is not proven to be causal.
FAT
FunctionDietary fats provide the infant and young child with energy, essential fattyacids and the fat-soluble vitamins A, D, E and K. Fats also heighten thepalatability of food, thereby promoting greater energy intake. Further-more, several fatty acids, especially the long-chain polyunsaturated fattyacids, have specific and essential physiological functions.
The different types of fat (structural and storage) in the body have diversefunctions, and the quality as well as the quantity of fat intake is important.The structural fats are mainly constituents of cell membranes and neuraltissue and thereby contribute to the architecture of cells, while the storagefats act as a long-term reserve of metabolic fuel for the body. The largeststore of fatty acids that supply long-term energy needs is adipose tissue,which is principally composed of triglycerides. Similarly breast-milk fat,

60 chapter 3
which is the main energy source for young infants, is 98% triglycerides.Triglycerides are the richest source of energy and have an energy density of38 kJ (9 kcal)/g, which is more than twice that of carbohydrate or protein.
SourcesDietary fat includes all of the lipids found in both plant and animal foods(Table 15). In nutritional terms, fats are often divided into “visible” fats,such as cooking oils, butter and the fat on meats, and “invisible fats”, whichare those incorporated into foods during preparation and cooking (forexample in cakes and biscuits), or present in processed meats and sausagesand emulsions such as mayonnaise. The majority of both visible and invis-ible fats are triglycerides, but fats may also be present in plant membranesand animal tissues, and these are chiefly phospholipids, glycolipids andcholesterol. Fats from animal produce (for example, cow’s milk and meat)tend to contain saturated fatty acids, while those from plants and fish tendto contain monounsaturated or polyunsaturated fatty acids (Table 15). Inadults, saturated fats are associated with an increase in cardiovascular dis-eases, but there are no data to suggest that saturated fat intake during thefirst years of life contributes to this problem. In contrast, unsaturated fatconsumption is associated with a lower prevalence of cardiovascular diseasein adults.
There are two essential fatty acids, linoleic and α-linolenic acids, that thehuman body cannot synthesize. These are precursors of phospholipids,prostaglandins and the long-chain polyunsaturated fatty acids, includingarachadonic and docosahexaenoic acids. Young infants have limited ability
Table15. Dietary fats and their sources
Dietary factor Typical sources
Saturated fatty acids Butter, lard, cow’s milk fat, cheese, meat andsausages
Monounsaturated fatty acids Olive, canola and rapeseed oilsPolyunsaturated fatty acids
Linoleic acid Corn, sunflower, soya and safflower oilsα-linolenic acid Fish oils, soya oil and fats in vegetables and
nutsTrans fatty acids Hydrogenated fat in margarines, biscuits and
cakesDietary cholesterol Eggs, meat, butter and whole milk

61energy and macronutrients
to synthesize arachadonic and docosahexaenoic acids but both are presentin human milk. Most commercial infant formulas do not containdocosahexaenoic acid, and the membrane phospholipids in the brains ofinfants whose intake of this fatty acid is deficient have replaced it with otherfatty acids. Docosahexaenoic acid is a major constituent of the developingbrain, and its replacement with other fatty acids is likely to change thefunctional characteristics of neural cells (18).
RequirementsAbout 50% of the energy available in human milk is derived from fat.Many foods adapted for infants have a substantially lower proportion oftheir energy derived from fat (12), and thus the proportion of total dietaryenergy provided as fat gradually decreases as a wider variety of foods areintroduced. When defining an optimal level of dietary fat during the periodof complementary feeding, it is vital to ensure that there is enough fat tomeet the requirements for essential fatty acids, and that energy density iswithin a desirable range.
It has therefore been recommended (12) that, during the complementaryfeeding period (between about 6 and 24 months), a child’s diet shouldderive 30%–40% of energy from fat. This translates into a total energyintake of approximately 3% from linoleic acid and approximately 0.3%from linolenic acid. However, the optimal intake of long-chain polyun-saturated fatty acids for this age group remains controversial.
Fat can make a considerable contribution to the energy density of the mixeddiet and, because it does not normally increase the viscosity of food, it canbe used to increase energy density without resulting in an overly thickpreparation. However, the fat content should not be so great as to displaceprotein or micronutrients or to induce gastrointestinal intolerance.
Low intakeInfants and young children have particularly high energy requirements fortheir body weight. To safeguard growth during this period, therefore, re-stricted diets and especially low-fat diets (those with a low energy density)should not be recommended for this age group. In support of this, there issome epidemiological evidence to suggest that poor growth during earlylife might increase the risk of cardiovascular disease later in life (19).
High intakeThe main rationale for restricting fat intake during childhood is to preventobesity and cardiovascular disease later in life. Evidence for a beneficial

62 chapter 3
effect of a lower fat intake during infancy and early childhood on latercardiovascular disease is indirect, however, and is based primarily on ex-trapolation from studies of adults and children with hypercholesterolae-mia. The atherosclerotic vascular lesions found before puberty are revers-ible. Although high blood lipid levels during early childhood tend to con-tinue to be relatively high, there is no proof that lowering fat intake duringearly life reduces the risk of developing cardiovascular disease later in life(20). Furthermore, epidemiological studies have shown that infant obesityis a poor predictor of obesity later in childhood and in adulthood (17,21).
CARBOHYDRATES
FunctionCarbohydrates provide a significant proportion of the energy in the humandiet. Ultimately, all carbohydrates in food are converted to and absorbed asmonosaccharides, primarily glucose. Glucose is an essential fuel for all bodytissues and particularly the brain, which is unable to metabolize fat forenergy. Under normal conditions, a rise in blood glucose above a certainlevel leads to its removal from the circulation and storage as glycogen in theliver or muscle, or conversion into and storage as fat.
Glycoproteins are polypeptides containing short chains of carbohydrates,and are present in many tissues. Glycoproteins are involved in a range offunctions, and include the mucins that provide a protective lining forepithelia, particularly that of the gut.
The colon is inhabitated by a large and complex bacterial microflora, whichis capable of fermenting most of the carbohydrate that has not been di-gested and absorbed in the small intestine. This unabsorbed carbohydrate(starches and non-starch polysaccharides) is fermented to lactic acid andshort-chain fatty acids, including acetic, propionic and butyric acids, and togases that include hydrogen, carbon dioxide and methane.
Short-chain fatty acids represent a source of energy for the colonic mucosaand other body tissues, and it is estimated that in adults fermentationgenerates at least 2 kcal per gram of unabsorbed carbohydrate. Further-more, short-chain fatty acids have important health benefits. Butyric acid isthe principal fuel for colonocytes and may help to prevent colonic disease,while propionic and acetic acids may have positive effects on liver metabo-lism and on general energy balance, respectively. Moreover, short-chainfatty acids are rapidly absorbed, promoting water absorption and therebyreducing the risk of osmotic diarrhoea.

63energy and macronutrients
SourcesDietary carbohydrates include sugars (with up to 3 monosaccharide units),oligosaccharides (with up to 10 monosaccharide units) and complex carbo-hydrates (starches and fibres with 10 or more monosaccharide units). Sug-ars are soluble carbohydrates, comprising mainly monosaccharides such asglucose, fructose and galactose and disaccharides such as sucrose, lactose andmaltose. Starches are composed of polysaccharide chains and have physicalstates that are subject to modification by cooking. The polysaccharides(excluding starch) form a complex group of polymers mainly derivedfrom plant cell walls, and are the principal components of “dietaryfibre”.
SugarsSugars can be classified into two groups: those that are naturally integratedinto the cellular structure of food (the most important being whole fruitsand vegetables containing mainly fructose, glucose and sucrose) and thosethat are not located within the cellular structure of the food, and either existfree in food or are added to it. Free or added sugars can be subdivided furtherinto the milk sugars (mainly lactose, representing around 37% of the en-ergy in human milk) that naturally occur in milk and milk products, and allother sugars (added sugars). These include refined sugar (sucrose) fromsugar cane and beet (used in recipes, at the table or in soft drinks) and honey(a mixture of fructose and glucose).
Sugars provide energy but they make no other contribution to nutrientneeds. Infants enjoy the taste of sweet foods, and parents may be tempted touse them as a comfort or reward. It is thus important that the infant dietshould offer a variety of tastes and textures, and that infants should notcome to expect that their food and drink will always be sweet (see Chap-ter 8, pages 180–181). Unsweetened cereals, yoghurts and kefir should bepreferred to those containing a large quantity of sugar. There is no advantagein terms of dental health of replacing sucrose with other sweet foods such ashoney or fructose.
Starch
Complementary feeding should, as a priority, ensure adequate energy. Al-though starch is well tolerated and relatively efficiently digested and ab-sorbed, a starch-rich diet tends to be bulky. Cooked cereal products andvegetables provide suitable sources of starch in the infant’s diet. Rice starchis well digested and absorbed and is particularly suitable during early com-plementary feeding because it is gluten-free. Data on starch intakes byinfants and young children are scarce, but it is generally recommended that

64 chapter 3
an increasing starch intake with age should be encouraged provided that thetotal energy intake remains adequate.
Dietary fibreDietary fibre can be defined as the non-starch polysaccharides (cellulose,hemicellulose A and B, gums, mucilages and pectins) and lignin. A com-mon characteristic of all dietary fibres is that they are not fully digested inthe small intestine and they enter the colon where they are available forfermentation by the colonic microflora.
The principal positive effect of fibre in children is probably that of regulat-ing bowel movement. Some forms of dietary fibre are better than others forincreasing stool weight and frequency, softening faeces, increasing faecalbulk and reducing gastrointestinal transit time. Constipation can beprevented and treated with dietary fibre. The effects appear to varyaccording to the type of fibre consumed: insoluble, coarsely groundfibre has a more marked effect in retaining water, and thereby increasingstool frequency, than finely ground soluble fibre. The products of thebacterial fermentation of dietary fibre may also directly affect bowelhabit.
Fibre may prevent or be used to treat obesity. High-fibre foods have a lowerenergy density, satisfy hunger, “flatten” the post-prandial glycaemic responseand slow the rates of food ingestion, gastric emptying and digestion. How-ever, there are very few useful studies of these effects in children. In olderchildren, no adverse effects have been reported from the consumption offibre-containing foods, and there is no information available from develop-ing countries where higher fibre intakes frequently coexist with low energyintake.
Foods used for complementary feeding should not in general contain asmuch fibre as the adult diet, because fibre can displace the energy-rich foodsthat children under 2 years of age need for growth. Infants and youngchildren who receive diets with inappropriately high amounts of low-energy-density foods may not have an adequate energy intake, which canresult in failure to thrive.
Fruit and vegetables are good for older infants and young children. They arerich in fibre and are also good sources of micronutrients and other beneficialsubstances. Many foods rich in fibre, however, such as whole-grain cerealproducts and legumes, also contain phytates, which impair the absorptionfrom the diet of zinc and iron.

65energy and macronutrients
Research is needed on foods that promote a beneficial colonic flora. Fromthe second year of life, progressive introduction of natural foods in the formof vegetables, (whole) cereals, legumes and fruit will accustom the infant toa balanced and correct dietary habit within a mixed diet. Indeed, theserecommendations would help to control the overconsumption of proteinfound in the 12–24-month period in most countries (21).
RequirementsProvided energy is adequate, starch intake should gradually increase with aconcomitant decrease in fat intake. Added sugars represent “empty calo-ries”, being a source of energy only and not associated with anymicronutrients. Thus, a diet with a high proportion of energy from addedsugars has a reduced capacity to ensure micronutrient needs and may causediarrhoea (this is particularly true of fructose-rich fruit drinks). Severalcountries recommend that the intake of added sugars should not exceed10% of total energy intake, equal to approximately five level teaspoons(25 g) of sugar per day for a 12-month-old infant. This figure is arbitraryand studies do not recommend it specifically. However, given that there areno benefits of a high intake of added sugars, it seems prudent to keep thisfigure as a recommendation. If added sugars are consumed in excess ofabout 30% of total energy intake, undesirable elevations in plasma concen-trations of glucose, insulin and lipids may occur (22). Such intakes shouldbe avoided, and children with intakes of this magnitude should replace theexcess with starch and nutrient-rich foods, especially fruit and vegetables.Reducing added sugar intake should also lower the risk of dental caries inpreschool children.
Low intakeA low energy intake depletes glycogen and adipose stores, and thereafterincreases the risk of hypoglycaemia. Although glucose can be synthesized bythe liver from amino acids and propionic acid, a minimum amount ofdietary carbohydrate is essential to inhibit ketosis (the accumulation ofketoacids formed in the liver from fatty acids) and to allow completeoxidation of fat.
High intakeDiets high in fibre are energy-sparse and bulky, and diets over-rich in fibreare therefore not recommended for infants and young children. Childrenover 2 years of age, for whom an energy-dense diet is of less concern, shouldbe encouraged to eat foods rich in complex carbohydrates, since these play avital role in normal bowel function. There is very little evidence that excesscarbohydrate intake is a cause of obesity in infancy.
66 chapter 3
REFERENCES
1. Energy and protein requirements. Report of a joint FAO/WHO/UNUexpert consultation. Geneva, World Health Organization, 1985 (WHOTechnical Report Series, No. 724).
2. BUTTE, N.F. Energy requirements of infants. European journal of clini-cal nutrition, 50 (Suppl. 1): S24–S36 (1996).
3. GARROW, J.S. ET AL., ED. Human nutrition and dietetics, 10th ed. Lon-don, Churchill Livingstone, 1999.
4. WATERLOW, J.C. Energy-sparing mechanisms. Reductions in body mass,BMR and activity: their relative importance and priority in undernour-ished infants and children. In: Schürch, B. & Scrimshaw, N.S. Activity,energy expenditure and energy requirements of infants and children.Lausanne, International Dietary Energy Consultative Group, 1990.
5. Complementary feeding of young children in developing countries: a re-view of current scientific knowledge. Geneva, World Health Organiza-tion, 1998 (document WHO/NUT/98.1).
6. TORUN, B. ET AL. Energy requirements and dietary energy recommen-dations for children and adolescents 1 to 18 years old. European journalof clinical nutrition, 50 (Suppl. 1): S37–S80 (1996).
7. SIMONDON, K.B. ET AL. Effect of early, short-term supplementation onweight and linear growth of 4–7-month-old infants in developingcountries: a four-country randomized trial. American journal of clinicalnutrition, 64: 537–545 (1996).
8. COHEN, R.J. ET AL. Effects of age of introduction of complementaryfoods on infant breast milk intake, total energy intake, and growth: arandomised intervention study in Honduras. Lancet, 344: 288–293(1994).
9. ROLLAND-CACHERA, M.F. ET AL. Tracking the development of adiposityfrom one month of age to adulthood. Annals of human biology, 14:219–229 (1987).
10. ROBERTS, S.B. Early diet and obesity. In: Heird, W.C., ed. Nutritionalneeds of the six to twelve month old infant. New York, Raven Press, 1991.
11. MICHAELSEN, K.F. & JØRGENSEN, M.H. Dietary fat content and energydensity during infancy and childhood: the effect on energy intake andgrowth. European journal of clinical nutrition, 49: 467–483 (1995).
12. Fats and oils in human nutrition. Report of a joint expert consultation.Rome, Food and Agriculture Organization of the United Nations,1994 (FAO Food and Nutrition Paper, No. 57).
13. IVARSSON, A. ET AL. Epidemic of coeliac disease in Swedish children.Acta paediatrica, 89: 165–171 (2000).
14. DEWEY, K.G. ET AL. Protein requirements of infants and children. Euro-pean journal of clinical nutrition, 50 (Suppl. 1): S119–S150 (1996).
67energy and macronutrients
15. Management of severe malnutrition: a manual for physicians and othersenior health workers. Geneva, World Health Organization, 1999.
16. ARNEIL, G.C. & CHIN, K.C. Lower solute milks and reduction ofhypernatraemia in young Glasgow infants. Lancet, 2: 840 (1979).
17. ROLLAND-CACHERA, M.F. ET AL. Influence of adiposity development: afollow-up study of nutrition and growth from 10 months to 8 years ofage. International journal of obesity and related metabolic disorders, 19:573–578 (1995).
18. COCKBURN, F. Neonatal brain and dietary lipids. Archives of disease inchildhood, fetal and neonatal edition, 70(1): F1–F2 (1994).
19. BARKER, D.J.P., ED. Fetal and infant origins of adult disease. London,British Medical Journal, 1992.
20. ESPGAN COMMITTEE ON NUTRITION. Committee report: commenton childhood diet and prevention of coronary heart disease. Journal ofpediatric gastroenterology and nutrition, 19: 261–269 (1994).
21. ROLLAND-CACHERA, M.F. ET AL. Increasing prevalence of obesity among18-year-old males in Sweden: evidence for early determinants. Actapaediatrica, 88: 365–367 (1999).
22. DEPARTMENT OF HEALTH, UNITED KINGDOM. Dietary sugars and humandisease. London, H.M. Stationery Office, 1989 (Report on Health andSocial Subjects, No.37).

introductionchapter 4
Vitamins
In countries where there is a high prevalence of childhood infectious disease, it isimportant to determine whether vitamin A deficiency is a public health problem.
In countries where rickets is a public health problem, all infants should receive avitamin D supplement as well as adequate exposure to sunlight.
In this chapter, the vitamins that are most relevant to the health of infants andyoung children in the European Region are discussed. The RNIs of thosevitamins that are not discussed here (vitamins E and K, and the B vitaminsthiamin, riboflavin, niacin, vitamin B
6, biotin and pantothenic acid) are given
in the Appendix to this chapter. Table 16 shows the main sources and functionsof vitamins.
VITAMIN A
FunctionVitamin A is required for healthy vision, for the integrity of epithelial surfaces,and for the development and differentiation of tissues. It is also essential forembryonic development and many other physiological processes, includingspermatogenesis, normal immune response, taste, hearing and growth. In addi-tion, several carotenoids including β-carotene, which can be converted intovitamin A, appear to act as important antioxidants in tissues. Together withvitamin C and vitamin E they deactivate or scavenge free radicals (highly reactivemolecules) and activated oxygen, and may therefore protect against cellulardamage. β-carotene is also involved in maintaining an effective immune re-sponse.
SourcesVitamin A is obtained as preformed retinol from animal products or is con-verted from the carotenoids, in particular β-carotene, present in plant food.Levels of preformed vitamin A are highest in liver, dairy products, eggs and fish.Dark green leafy vegetables and yellow vegetables (such as carrots) and fruit arerich sources of carotenoids. The consumption of foods rich in vitamin A shouldbe encouraged once complementary feeding has started.
Requirements and RNIsIn order to express vitamin A requirements in units that allow for thediffering potency of retinol and the carotenoids, the unit “retinol equivalents”

70 chapter 4
Vitamin Important sources Functions
Vitamin A (retinol) Liver, dairy products, fish Eyesightoils, orange and green Healthy skin andvegetables, fortified mucous lining of bodymargarines organs
Vitamin D (cholecalciferol) Fish oils, salmon, herring, Bone formationliver, skin exposure to UVlight
Vitamin E (tocopherol) Vegetable oils, whole Antioxidant properties,grain cereals, nuts, seeds, protecting cells fromgreen leafy vegetables oxidative damage
Vitamin K Colonic bacteria Blood clotting
Vitamin C (ascorbic acid) Citrus fruits, peppers, Formation of supportingtomatoes, cabbage tissues of cells for wound
healingAbsorption of non-haem
iron
Vitamin B1 (thiamin) Whole grain cereals and Carbohydrate utilizationbreads, legumes, nuts,meat
Vitamin B2 (riboflavin) Green leafy vegetables, Nervous system functionmeat, eggs, milk Protein metabolism
Growth
Vitamin B3 (niacin or Whole grain cereals, nuts, Energy metabolismnicotinic acid) legumes, meat, poultry,
fish
Vitamin B12 Meat, eggs, fish, poultry, Red blood cell formation(cyanocobalamin) milk, roots/nodules of Nervous system function
legumes (otherwise notgenerally present inplants)
Table 16. The main sources and functions of vitamins

71vitamins
Vitamin Important sources Functions
Folic acid Yeast, liver, kidneys, To aid maturation of redgreen leafy vegetables, blood cellsorange juice
Vitamin B6 (pyridoxine) Liver, kidneys, meat, Protein metabolismwhole grain cereals, Formation and growth ofegg yolk red blood cells
Biotin Liver, egg yolk, soya flour, Cofactor forcereals, yeast gluconeogenesis and fat
metabolism
Pantothenic acid Animal products, whole Essential for numerousgrains, legumes reactions involved in lipid
and carbohydratemetabolism
Table 16 (contd)
(RE) has replaced International Units (IU). 1 µg retinol is equivalent to 1RE, and it takes 6 µg β-carotene to form 1 RE (1 RE = 3.33 IU vitamin A).
Infants are born with vitamin A stores in the liver and these, together withintakes of vitamin A from breast-milk, will satisfy requirements until about6 months of age. The amount of vitamin A secreted in breast-milk dependson maternal intake and stores. If the vitamin A status of the mother issufficient, breast-milk is also an important source of vitamin A after the ageof 6 months. However, mothers deficient in vitamin A may not provideenough of it in their milk to build up infant liver stores or to protect theinfant from deficiency beyond 6 months of age (1). For children inpopulations with a high prevalence of vitamin A deficiency, complemen-tary foods are an important source of vitamin A after 6 months of age.
International recommendations for vitamin A intake (Table 17) are re-markably consistent, and suggest that intakes of around 350–400 RE perday should meet the needs of all healthy infants and young children.
Low intakeInfants and young children are vulnerable to the adverse effects of bothdeficiency and excess of vitamin A. Xerophthalmia, the result of severe
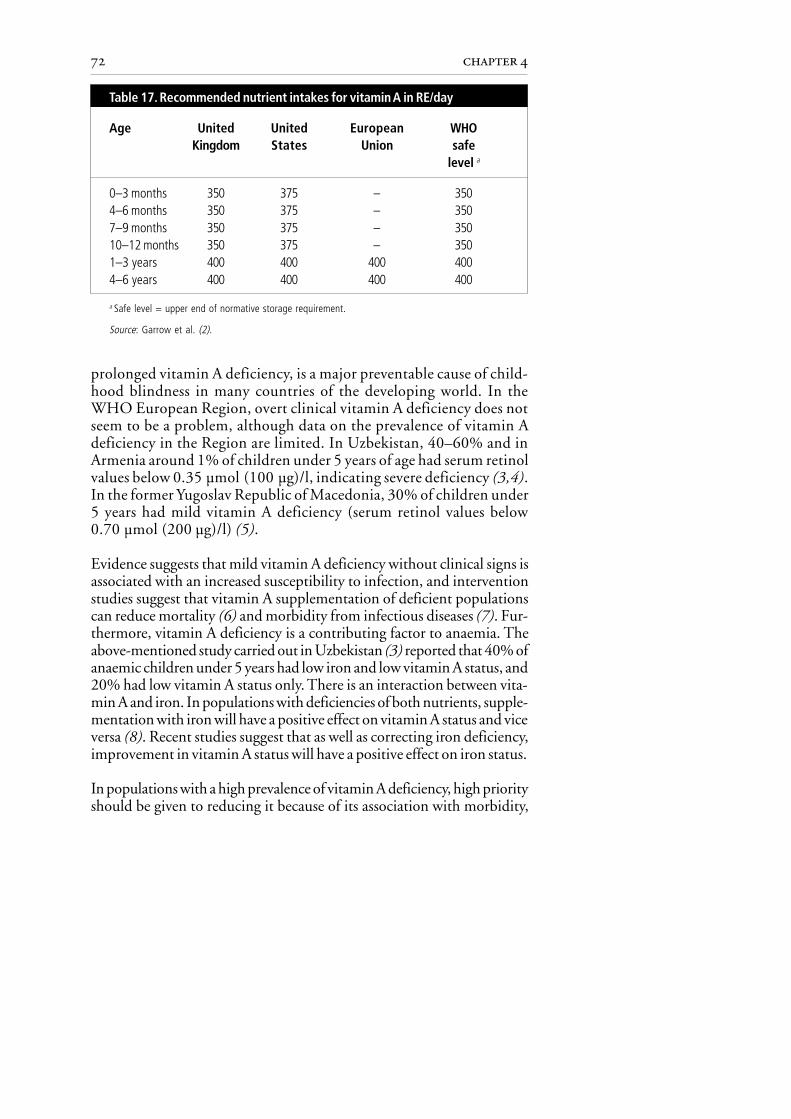
72 chapter 4
prolonged vitamin A deficiency, is a major preventable cause of child-hood blindness in many countries of the developing world. In theWHO European Region, overt clinical vitamin A deficiency does notseem to be a problem, although data on the prevalence of vitamin Adeficiency in the Region are limited. In Uzbekistan, 40–60% and inArmenia around 1% of children under 5 years of age had serum retinolvalues below 0.35 µmol (100 µg)/l, indicating severe deficiency (3,4).In the former Yugoslav Republic of Macedonia, 30% of children under5 years had mild vitamin A deficiency (serum retinol values below0.70 µmol (200 µg)/l) (5).
Evidence suggests that mild vitamin A deficiency without clinical signs isassociated with an increased susceptibility to infection, and interventionstudies suggest that vitamin A supplementation of deficient populationscan reduce mortality (6) and morbidity from infectious diseases (7). Fur-thermore, vitamin A deficiency is a contributing factor to anaemia. Theabove-mentioned study carried out in Uzbekistan (3) reported that 40% ofanaemic children under 5 years had low iron and low vitamin A status, and20% had low vitamin A status only. There is an interaction between vita-min A and iron. In populations with deficiencies of both nutrients, supple-mentation with iron will have a positive effect on vitamin A status and viceversa (8). Recent studies suggest that as well as correcting iron deficiency,improvement in vitamin A status will have a positive effect on iron status.
In populations with a high prevalence of vitamin A deficiency, high priorityshould be given to reducing it because of its association with morbidity,
Table 17. Recommended nutrient intakes for vitamin A in RE/day
Age United United European WHOKingdom States Union safe
level a
0–3 months 350 375 – 3504–6 months 350 375 – 3507–9 months 350 375 – 35010–12 months 350 375 – 3501–3 years 400 400 400 4004–6 years 400 400 400 400
a Safe level = upper end of normative storage requirement.
Source: Garrow et al. (2).

73vitamins
anaemia and mortality. Maternal status should be improved through di-etary intervention or daily supplements. Breastfeeding should be encour-aged because breast-milk is a good source of vitamin A, and foods rich invitamin A should be given during the complementary feeding period.Where it is not feasible to make such interventions within a reasonabletime, supplementation in areas with moderate or severe vitamin A defi-ciency should be considered. A high dose should be given at intervals of3–6 months or, if daily vitamin D supplements are already available, acombined vitamin A and D supplement should be given.
High intakeToxic effects, including bone and liver damage, may arise following a singlevery large dose of retinol or from the ingestion of excessive doses of vitaminA supplements over a long period. Daily intakes of retinol should notexceed 900 RE in infants and 1800 RE in children between 1 and 3 years ofage (9).
B VITAMINS
This section on the B vitamins will focus only on folic acid and vitamin B12
(Tables 18 and 19). Deficiency of both of these vitamins can cause mega-loblastic anaemia. It is not known what proportion of anaemia can beattributed to folic acid and/or vitamin B
12 deficiency in the Region. The
relationship is difficult to elucidate as there are many nutritional and non-nutritional causes of anaemia. Thus, further research and surveys are neededto describe the epidemiology of folic acid and vitamin B
12 deficiency.
Age United United European WHOKingdom States Union safe
levela
0–3 months 50 25 50 164–6 months 50 25 50 247–9 months 50 35 50 3210–12 months 50 35 50 321–3 years 70 50 100 504–6 years 100 75 130 50
a Based on normative storage requirement with 15% coefficient of variation.
Source: Garrow et al. (2).
Table 18. Recommended nutrient intakes for folic acid in µg/day

74 chapter 4
The main symptoms of folic acid deficiency are megaloblastic anaemia,poor appetite, weight loss and failure to thrive. Both human milk and cow’smilk are good sources (40–60 µg/l). Folic acid is heat-labile, however, andmegaloblastic anaemia responsive to folic acid supplementation has beendescribed in infants given heat-treated home-made cow’s milk formula orunfortified commercial infant formula (10).
Children consuming a macrobiotic diet are at risk of vitamin B12
deficiency,and infants breastfed by strict vegan mothers are at risk of impaired neuro-logical development, anaemia and even encephalopathy.
SourcesFolic acid occurs in leafy vegetables and also in liver, beans, beetroot, whole-meal bread, eggs and some fish.
The richest source of vitamin B12
is liver. Other sources include shellfish,fish, meat, eggs, milk, cheeses and yoghurt.
VITAMIN C
FunctionVitamin C is essential for the prevention of scurvy and for the promotion ofwound healing. Furthermore, it is important for the optimal functioningof the immune system and for the synthesis of collagen, and it has antioxi-dant properties. Vitamin C is particularly valuable in assisting the ab-sorption of non-haem iron from vegetables and other non-haem sources
Age United United European WHOKingdom States Union safe
level
0–3 months 0.3 0.3 – 0.14–6 months 0.3 0.3 – 0.17–9 months 0.4 0.5 0.5 0.110–12 months 0.4 0.5 0.5 0.11–3 years 0.5 0.7 0.7 0.54–6 years 0.8 1.0 0.9 0.8
Source: Garrow et al. (2).
Table 19. Recommended nutrient intakes for vitamin B12 in µg/day

75vitamins
(see Chapters 6 and 8). This is probably achieved by chelation with iron toform a soluble compound that readily releases iron to the intestinal mucosa.The enhancing effect of vitamin C on the absorption of iron, and probablyof zinc, from a meal depends on the presence of adequate amounts ofvitamin C. For example, consuming food containing 25 mg ascorbic acidwill approximately double the amount of iron absorbed from cereals (11).To be effective, foods and drinks rich in vitamn C should be consumed atthe same time as foods containing non-haem iron, to allow the necessaryconversion of ferrous iron to ferric iron.
SourcesVegetables and fruit, especially spinach, tomatoes, potatoes, broccoli, ber-ries, oranges and other citrus fruits, are the best sources of vitamin C.Vitamin C is highly labile and is destroyed by several factors including heat,light and oxygen. A diet containing a diversity of plant foods, eaten eitherraw or lightly cooked, is therefore recommended. Foods such as stews,soups, jams and compotes normally undergo prolonged cooking, whichwill significantly reduce and usually destroy all the vitamin C present.
Low intakeThe vitamin C deficiency disease, scurvy, is uncommon in populationsunless there is a prolonged shortage of fruit and vegetables together with anoverall reduction in the food supply. Symptoms of deficiency such asweakness, fatigue, inflamed and bleeding gums, impaired wound healingand bruising have been observed after 3–6 months on a diet lackingvitamin C. The RNIs for preventing vitamin C deficiency are shown inTable 20.
Age United United European WHOKingdom States Union
0–3 months 25 30 – 204–6 months 25 30 – 207–9 months 25 35 20 2010–12 months 25 35 20 201–3 years 30 40 25 204–6 years 30 45 25 20Source: Garrow et al. (2).
Table 20. Recommended nutrient intakes for vitamin C in mg/day
76 chapter 4
High intakeVitamin C is water-soluble and any excess is excreted in the urine. Thetoxicity of vitamin C is low and there is no risk to health of a high intake.
VITAMIN D
FunctionVitamin D has an active role in calcium and bone metabolism, stimulatingthe intestinal absorption of calcium and the release of bound calcium fromthe skeleton. In addition, vitamin D has a role in muscle function, in cellproliferation and maturation, and in the immune system. This may partlyexplain the susceptibility to anaemia and infection of children with rickets(12,13).
SourcesVitamin D is primarily synthesized in the skin by the action of ultraviolet Bradiation from sunlight, after which it is further converted in the liver andkidneys to the active metabolite 1,25-dihydroxyvitamin D
3. Dietary vita-
min D is obtained from fatty fish (sardines, salmon, herring, tuna, etc.),margarines (which in most countries are fortified with vitamin D), somedairy products (including infant formula), eggs, beef and liver. Duringcomplementary feeding, the amount of vitamin D obtained from the dietis generally low and exposure to daylight is thus important for infants andyoung children.
Requirements and RNIsBecause vitamin D is principally derived from the exposure of the skin tosunlight, establishing dietary recommendations (Table 21) is difficult.
The vitamin D status of the newborn is largely determined by the status ofthe mother. If maternal vitamin D status is poor during pregnancy, thenewborn also has low plasma concentrations and low stores of vitamin D.The vitamin D content of breast-milk is also influenced by the vitamin Dstatus of the mother, and because of the strong relationship between mater-nal and infant vitamin D status, in some countries vitamin D supplementsare recommended for pregnant women.
Children under 3 years of age are particularly vulnerable to poor vitamin Dstatus because of the high demands of growth and the rapid rate at whichcalcium is laid down in bone. However, the amount of sunlight exposureneeded to achieve the vitamin D requirements of infants is not large. Expo-sure of the face alone (or of the lower arms or legs) to sunlight for around
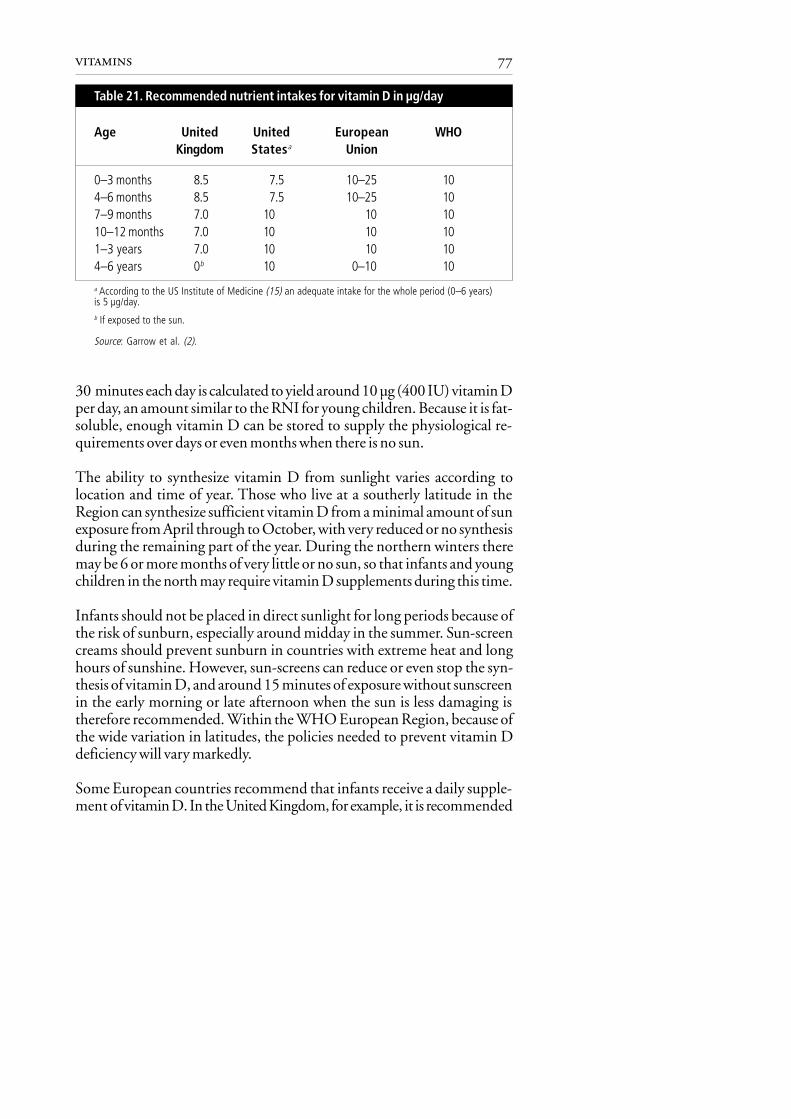
77vitamins
Age United United European WHOKingdom Statesa Union
0–3 months 8.5 7.5 10–25 104–6 months 8.5 7.5 10–25 107–9 months 7.0 10 10 1010–12 months 7.0 10 10 101–3 years 7.0 10 10 104–6 years 0b 10 0–10 10
a According to the US Institute of Medicine (15) an adequate intake for the whole period (0–6 years)is 5 µg/day.b If exposed to the sun.
Source: Garrow et al. (2).
30 minutes each day is calculated to yield around 10 µg (400 IU) vitamin Dper day, an amount similar to the RNI for young children. Because it is fat-soluble, enough vitamin D can be stored to supply the physiological re-quirements over days or even months when there is no sun.
The ability to synthesize vitamin D from sunlight varies according tolocation and time of year. Those who live at a southerly latitude in theRegion can synthesize sufficient vitamin D from a minimal amount of sunexposure from April through to October, with very reduced or no synthesisduring the remaining part of the year. During the northern winters theremay be 6 or more months of very little or no sun, so that infants and youngchildren in the north may require vitamin D supplements during this time.
Infants should not be placed in direct sunlight for long periods because ofthe risk of sunburn, especially around midday in the summer. Sun-screencreams should prevent sunburn in countries with extreme heat and longhours of sunshine. However, sun-screens can reduce or even stop the syn-thesis of vitamin D, and around 15 minutes of exposure without sunscreenin the early morning or late afternoon when the sun is less damaging istherefore recommended. Within the WHO European Region, because ofthe wide variation in latitudes, the policies needed to prevent vitamin Ddeficiency will vary markedly.
Some European countries recommend that infants receive a daily supple-ment of vitamin D. In the United Kingdom, for example, it is recommended
Table 21. Recommended nutrient intakes for vitamin D in µg/day

78 chapter 4
that breastfed infants aged 6 months or more and pregnant and lactatingwomen be given supplements of 7 µg/day. In most countries where thereare recommendations for vitamin D supplementation, doses of 7–10 µg(280–400 IU)/ day are usually recommended. There is still doubt, how-ever, about how much should be given to lactating mothers deficient invitamin D to ensure optimum levels of the vitamin in breast-milk. In apopulation in Finland with scant sunlight in winter, breastfeeding by motherswho received as much as 25 µg (1000 IU)/day was not sufficient to secureadequate vitamin D status in their infants (14).
Low intakeInfants at risk of vitamin D deficiency are those whose skin is completelycovered, who are dark-skinned, who live in northern latitudes or who areweaned on to vegan diets. Growth failure, lethargy and irritability are earlysigns of deficiency. Prolonged vitamin D deficiency in infants and youngchildren results in rickets, which occurs only when bones are still growing.In rickets, there is a reduced calcification of the growing ends (epiphyses) ofthe bones. The clinical manifestations of rickets vary with age and with theduration of vitamin D deficiency. As the disease progresses, the epiphysis ofthe long bones and the ribs tend to be most seriously affected, resulting inflaring of the wrists and ankles, beading of the rib cage and softening of theskull bones (craniotabes). Some information on the prevalence of rickets inthe WHO European Region is given in Chapter 1 (see page 26).
Rickets usually occurs in young children owing to their high rate of growth.The situation is aggravated by factors such as the tradition of swaddling(completely covering infants), keeping infants indoors or keeping themcompletely covered when out of doors. Swaddling, which reduces exposureof the skin to sun, still occurs in many parts of the Region and shouldcertainly be discouraged. Infants should not be completely covered, andchildren should play out of doors as much as possible. Preventive measuresfor pregnant women and children under 5 years, such as dietary educationand behavioural interventions, should be implemented. Where rickets is apublic health problem, all infants should receive a vitamin D supplement inaddition to adequate sunlight.
High intakeHigh intakes of vitamin D can be toxic at all ages and infants are espe-cially vulnerable. Hypercalcaemia (raised plasma concentrations of cal-cium) arising from vitamin D intakes of 50 µg/day or more has beenreported. Hypercalcaemia is associated with thirst, anorexia, failure tothrive, vomiting, depressed IQ, raised plasma levels of vitamin D, and

79vitamins
the risk of calcification of soft tissues and the formation of calcium stonesin the renal tract.
REFERENCES
1. UNDERWOOD, B.A. Maternal vitamin A status and its importance ininfancy and early childhood. American journal of clinical nutrition, 52(Suppl. 2): S175–S225 (1994).
2. GARROW, J.S. ET AL., ED. Human nutrition and dietetics, 10th ed. Lon-don, Churchill Livingstone, 1999.
3. MORSE, C. The prevalence and causes of anemia in Muynak District,Karakalpakistan, the Republic of Uzbekistan. Brandon, MS, CrosslinkInternational, 1994.
4. BRANCA, F. ET AL. The health and nutritional status of children andwomen in Armenia. Rome, National Institute of Nutrition, 1998.
5. BRANCA, F. ET AL. Mulitiple indicator cluster survey in Fyrom with micro-nutrient component. Rome, National Institute of Nutrition, 1999.
6. KEUSCH, G.T. Vitamin A supplements – too good not to be true. NewEngland journal of medicine, 323: 985–987 (1990).
7. FILTEAU, S.M. & TOMKINS, A.M. Vitamin A supplementation in de-veloping countries. Archives of disease in childhood, 72: 106–109(1995) .
8. INTERNATIONAL VITAMIN A CONSULTATIVE GROUP. IVACG statement:vitamin A and iron interactions. Washington, DC, Nutrition Founda-tion, 1996.
9. DEPARTMENT OF HEALTH, UNITED KINGDOM. Dietary reference valuesfor food energy and nutrients for the United Kingdom. Report of the Panelon Dietary Reference Values of the Committee on Medical Aspects of FoodPolicy. London, H.M. Stationery Office, 1991 (Report on Health andSocial Subjects, No. 41).
10. FOMON, S.J. & OLSON, J.A. Vitamin A and the carotenoids. In:Fomon, S.J. Nutrition of normal infants. St Louis, MO, Mosby,1993.
11. ALLEN, L.H. & AHLUWALIA, N. Improving iron status through diet: theapplication of knowledge concerning dietary iron availability in humanpopulations. Washington, DC, US Agency for International Develop-ment, 1997.
12. GRINDULIS, H. ET AL. Combined deficiency of iron and vitamin D inAsian toddlers. Archives of disease in childhood, 61: 843–848 (1986).
13. LAWSON, M. & THOMAS, M. Vitamin D concentration in Asian chil-dren aged 2 years living in England: population survey. British medicaljournal, 318: 28 (1999).

80 chapter 4
14. ALA-HOUHALA, M. 25-Hydroxyvitamin D levels during breastfeedingwith or without maternal or infantile supplementation of vitamin D.Journal of pediatric gastroenterology and nutrition, 4: 220–226 (1985).
15. US INSTITUTE OF MEDICINE. Dietary reference intakes for calcium, phos-phorus, magnesium, vitamin D, and fluoride. Washington, DC, Na-tional Academy Press, 1997.
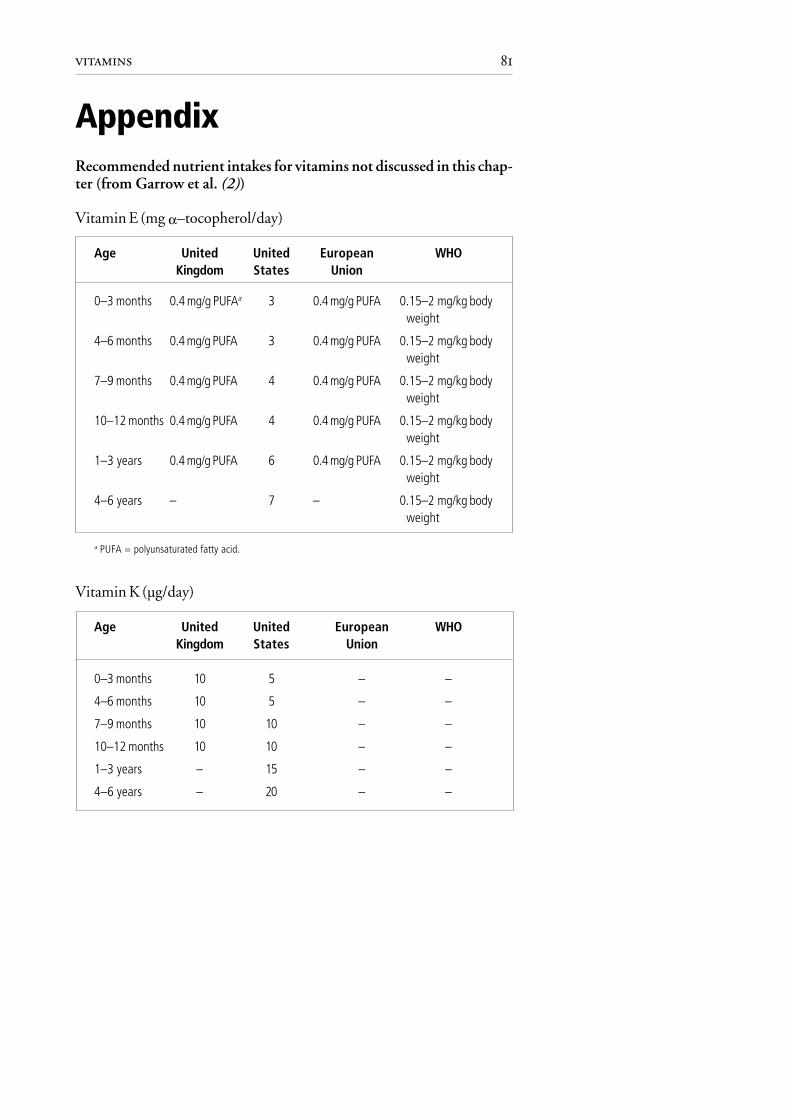
81vitamins
AppendixRecommended nutrient intakes for vitamins not discussed in this chap-ter (from Garrow et al. (2))
Vitamin E (mg α–tocopherol/day)
Age United United European WHOKingdom States Union
0–3 months 0.4 mg/g PUFAa 3 0.4 mg/g PUFA 0.15–2 mg/kg bodyweight
4–6 months 0.4 mg/g PUFA 3 0.4 mg/g PUFA 0.15–2 mg/kg bodyweight
7–9 months 0.4 mg/g PUFA 4 0.4 mg/g PUFA 0.15–2 mg/kg bodyweight
10–12 months 0.4 mg/g PUFA 4 0.4 mg/g PUFA 0.15–2 mg/kg bodyweight
1–3 years 0.4 mg/g PUFA 6 0.4 mg/g PUFA 0.15–2 mg/kg bodyweight
4–6 years – 7 – 0.15–2 mg/kg bodyweight
a PUFA = polyunsaturated fatty acid.
Vitamin K (µg/day)
Age United United European WHOKingdom States Union
0–3 months 10 5 – –
4–6 months 10 5 – –
7–9 months 10 10 – –
10–12 months 10 10 – –
1–3 years – 15 – –
4–6 years – 20 – –

82 chapter 4
Vitamin B1 (thiamin)
Age United United European WHOKingdom States Union
mg/day mg/1000 kcal mg/day mg/day mg/day
0–3 months 0.2 0.3 0.3 – 0.34–6 months 0.2 0.3 0.3 – 0.37–9 months 0.3 0.3 0.4 0.3 0.310–12 months 0.3 0.3 0.4 0.3 0.31–3 years 0.5 0.4 0.7 0.5 0.54–6 years 0.7 0.4 0.9 0.7 0.7
Vitamin B2 (riboflavin) (mg/day)
Age United United European WHOKingdom States Union
0–3 months 0.4 0.4 – 0.54–6 months 0.4 0.4 – 0.57–9 months 0.4 0.5 0.4 0.510–12 months 0.4 0.5 0.4 0.51–3 years 0.6 0.8 0.8 0.84–6 years 0.8 1.1 1.0 1.1
Vitamin B3 (niacin or nicotinic acid)
Age United United European WHOKingdoma States Unionb
mg/day mg/day mg/day mg/day
0–3 months 3 5 – 5.44–6 months 3 5 – 5.47–9 months 5 6 5 5.410–12 months 5 6 5 5.41–3 years 8 9 9 9.04–6 years 11 12 11 12.1
a 6.6 mg/1000 kcal.b 1.6 mg/MJ.

83vitamins
Vitamin B6(pyridoxine)
Age United United European WHOKingdom States Uniona
mg/day µg/g protein mg/day mg/day
0–3 months 0.2 8 0.3 – –4–6 months 0.2 8 0.3 – –7–9 months 0.3 10 0.6 0.4 –10–12 months 0.4 13 0.6 0.4 –1–3 years 0.7 13 1.0 0.7 –4–6 years 0.9 13 1.1 0.9 –
a 15 µg/g protein.
Biotin (µg/day)
Age United United European WHOKingdom States Union
0–3 months – 10 – –4–6 months – 10 – –7–9 months – 15 – –10–12 months – 15 – –1–3 years – 20 – –4–6 years – 25–30 – –
Pantothenic acid (mg/day)
Age United United European WHOKingdom States Union
0–3 months 1.7 2.0 – –4–6 months 1.7 2.0 – –7–9 months 1.7 3.0 – –10–12 months 1.7 3.0 – –1–3 years 1.7 3.0 – –4–6 years 3–7 3–5 – –

introductionchapter 5
Minerals other than iron
In countries where iodine deficiency is a public health problem, legislation onuniversal salt iodization should be adopted and enforced.
Many minerals are essential micronutrients and play a vital role in growth,health and development. Those that are most important in the comple-mentary feeding of infants and young children, namely iodine, zinc, cal-cium and sodium, are discussed here. The RNIs of those minerals that arenot discussed (phosphorus, magnesium, potassium, chloride, copper andselenium) are given in the Appendix to this chapter. Table 22 lists the mainsources and functions of a number of minerals.
IODINE
FunctionIodine is an essential substrate in the synthesis of the thyroid hormones,which are among the key regulators of metabolism (1). The thyroid hor-mones are required for normal growth and development, for oxygen con-sumption in cells, and for the maintenance of metabolic rate (2). Thyroidhormones are also important in mental development and mental retarda-tion, and congenital deafness can be due to hypothyroidism induced byiodine deficiency in utero (3). It is therefore important that both maternalstores and the maternal diet during pregnancy contain adequate quantitiesof iodine.
SourcesThe iodine content of plants and animals is determined by the environmentin which they live and grow. Iodine deficiency is especially prevalent inmountainous regions, but can also occur at sites of prior glaciation and inlow-lying areas subject to flooding. As most soils contain little iodine, mostfoodstuffs are poor sources and food grown in iodine-deficient regionscannot provide enough iodine for the population or livestock livingthere (4).
Fruits, vegetables, cereals, meat and meat products contain between 20 and50 µg iodine/kg under normal circumstances. The only naturally rich sourceof iodine is sea fish (160–1400 µg/kg). Around 200 g of sea fish, eatenweekly, should provide young children with an intake equal to around

86 chapter 5
Mineral Important sources Functions
Iron Liver, meat, poultry, egg yolk, Component of red blood cellsardines, mackerel, whole pigmentgrain cereals and breads, Component of musclelegumes, spinach
Calcium Milk, cheese, shrimps, Growth of bones and teethsalmon, sardines, Contraction of musclesherring, green leafy Nerve transmissionvegetables
Zinc Meat, fish, eggs, cereals, Growthlegumes Reproduction
Wound healing
Iodine Iodized salt, seafood, animal Formation of thyroid hormoneand plant foods grown innon-goitrogenic coastal areas
Fluoride Fluoridated water, tea, Hardening of teeth and bonesseafood, infant foods madewith bone meal
Magnesium Roasted peanuts, dry beans, Nerve and muscle activityraw spinach and other green Important for many enzymevegetables reactions
Sodium Salt, meat, fish, eggs, milk Essential in the control ofextracellular volume and acid-base balance, cellular electricalactivity, nerve conduction andmuscle function
Phosphorus Milk, cheese, shrimps, Bone metabolismsalmon, sardines,herring, green leafyvegetables
Potassium Fruit and vegetables Maintenance of electrolyte balance
Copper Shellfish, legumes, whole Cofactor in metalloenzymesgrain cereals, liver
Selenium Cereal grains, meat, fish Cofactor in antioxidants
Table 22. The main sources and functions of minerals

87minerals other than iron
50 µg iodine per day (5). In the United Kingdom (6) and some Nordiccountries, milk and dairy products are the main source of iodine becausecattle fodder is iodized by law. Seasonal variations are seen, and in Nordiccountries around 45% and 70% of total iodine intake in summer andwinter, respectively, comes from cow’s milk and milk products.
Requirements and RNIsIodine is readily absorbed and excess intake is well controlled by renalexcretion. In the presence of goitrogens (found in cabbage, turnips, swedes,brussels sprouts and broccoli, for example) the utilization of absorbediodine is decreased and therefore iodine intake should be increased. TheRNIs for iodine (Table 23) are based on the requirement for the preventionof goitre (about 1–2 µg/kg body weight) plus a 100% safety margin.
Table 23. Recommended nutrient intakes for iodine in µg/day
Age United United European WHOKingdom States Union
0–3 months 50 40 – 404–6 months 60 40 – 407–9 months 60 50 50 5010–12 months 60 50 50 501–3 years 70 70 70 70–1204–6 years 100 100 90 70–120
Sources: World Health Organization (7); Garrow et al. (8).
In European countries with mild iodine deficiency, the recommendationhas been made to extend the RNI of 90 µg/day down to 0–12 monthsbecause such an intake is required to achieve positive iodine balance in thegrowing infant (9). In populations where there is no evidence of widespreadiodine deficiency disorders, exclusive breastfeeding for the first few monthswill supply infants with the iodine required.
Low intakeIodine deficiency is the world’s greatest single cause of preventable braindamage and mental retardation (3). The term “iodine deficiency disorders”refers to the wide spectrum of effects of iodine deficiency on growth anddevelopment. The deficiency results in a reduced synthesis of thyroid hor-mone. In an attempt to sequester more iodine, the thyroid gland enlarges

88 chapter 5
leading to goitre, which is the most obvious and familiar sign of iodinedeficiency. Other effects are seen at all stages of development, however, andare particularly pertinent during the fetal and neonatal periods (Ta-ble 24).
Stage of development Disorder
Fetus Abortion and stillbirthCongenital abnormalitiesDeafnessIncreased perinatal mortalityIncreased infant mortalityNeurological cretinismMyxoedematous cretinismPsychomotor defects
Neonate Neonatal goitreNeonatal hypothyroidism
Child GoitreJuvenile hypothyroidismImpaired mental functionRetarded physical development
Source: Hetzel (10).
In populations where iodine deficiency disorders are widespread and severeenough to induce hypothyroxinaemia during gestation, the physiologicaltransfer of thyroid hormones from the mother to the fetus is decreased. Theconsequence is irreversible brain damage manifest in the neurological fea-tures of endemic cretinism. Moreover, iodine deficiency occurring duringlate gestation and persisting during lactation leads to a low iodine content ofbreast-milk and possible perinatally acquired hypothyroidism in thebreastfed infant. This explains the hypothyroid component of endemiccretinism (11).
In regions with endemic iodine deficiency disorders, prevention of bothbrain damage and hypothyroidism in the breastfed infant requires iodine
Table 24. Effects of iodine deficiency during early development
89minerals other than iron
supplementation starting early in gestation, or preferably before con-ception, and extending throughout lactation (11). Lower breast-milkiodine concentrations have been reported in endemic iodine-deficientareas (12).
Iodine deficiency increases the sensitivity of children to the carcinogeniceffect of thyroid radiation. The exposure to radioactive fallout aroundChernobyl is thought to have played a major role in the development ofhypothyroidism and thyroid cancer in the exposed population (13).
Correction of iodine deficiency disordersBecause iodine deficiency results mainly from geological rather than socialand economic conditions, it cannot be eliminated by changes in dietaryhabits. The solution to iodine deficiency has focused on two main strate-gies, iodine supplementation and iodine fortification. Universal salt iodiza-tion, calling for household salt and all salt used in agriculture, food process-ing/manufacturing and catering to be iodized, is the agreed preventionstrategy (14).
The choice of this approach has been based on the following facts (15).
• Salt is one of the few commodities that comes closest to being universallyconsumed.
• Salt consumption is almost stable throughout the year in a given region.• Salt production is usually limited to a few centres.• Salt iodization technology is available at reasonable cost (0.4–1.5 US
cents per kilogram and 2–8 US cents per person per year).• The addition of iodine to salt does not affect its colour, taste or odour.• The quality of iodized salt can be monitored at production, retail and
household levels.
Other vehicles for iodine fortification include bread, milk, water and otherfoods. Occasional successes have been reported when using them (6,16).Nevertheless, universal salt iodization remains the strategy of choice. Theintake of other vehicles (except water) is not essential for survival, and theyare frequently not consumed by those most vulnerable such as pregnantwomen, children and poor and isolated populations.
National universal salt iodization programmes should be implementedthrough legislation and should take into account locally produced andimported salt. Care should be taken to ensure that the promotion of iodizedsalt does not result in an increase in salt intake. The necessary monitoring of

90 chapter 5
iodized salt intake is a unique opportunity to evaluate and monitor saltintake and to respect and support the WHO recommendation to maintainsalt intake at healthy levels. In particular, iodized salt is not appropriate forinfants and young children because of their limited ability to excrete so-dium (see Chapter 8 and page 95). Their requirement for iodine will be metif salt is universally iodized, because both breast-milk and formula milk willthen have an adequate content of iodine. Complementary foods of animalorigin, notably fish given at around 6 months of age and cow’s milk andmilk products after 9 months of age, can also provide sufficient iodine.
As an interim measure until an effective universal iodized salt system is fullyoperational, iodine supplementation can be considered in endemic regionsto immediately prevent the adverse effects of iodine deficiency on thecentral nervous system. Such measures should not delay or compromise theimplementation of the agreed strategy of universal salt iodization. Therecommendations for supplementation are as follows.
• Where mild to moderate iodine deficiency disorders exist, pregnant andlactating women should be given iodine supplements until their iodineintake reaches 200–300 µg/day. Infants and children should be given thephysiological dose of 90 µg/day up to the age of 3 years, by which timemost brain development has occurred.
• In conditions of severe iodine deficiency (goitre prevalence > 30% andmedian urinary iodine below 20 µg/l), and especially if neonatal hy-pothyroidism and cretinism continue to occur, the administration ofiodized oil to women of child-bearing age is justified, ideally beforepregnancy. This procedure is efficient and safe (17).
• In all conditions of iodine deficiency, if infant formula is used it shouldcontain 10 µg iodine/dl for full-term infants and 20 µg/dl for preterminfants.
High intakeAny unnecessarily high intake of iodine is excreted in the urine. Neverthe-less, excessive iodine intake at the population level can have adverse effects(18). The most important is the development of hyperthyroidism in adultswith nodular goitre. Other possible complications include iodine-inducedautoimmune thyroid disorders and a change in the predominant type ofthyroid cancer. In infants and children, the main complication of iodineexcess is iodine-induced hypothyroidism (19). Susceptibility to the sideeffects of excess iodine depends on the baseline iodine intake before

91minerals other than iron
exposure to excess (20). In conditions of normal iodine intake, the upperlimit for adults is considered to be 1000 µg/day, and for 0–8-year-oldsprobably 300 µg/day.
ZINC
FunctionBecause zinc is a constituent of many enzymes in the body, it is important ina wide range of metabolic processes including protein and nucleic acidsynthesis. Zinc is mainly absorbed in the duodenum. Its main route ofexcretion is through the gastrointestinal tract and, to a lesser extent, via thekidneys and the skin.
SourcesIn general, zinc from animal products is better absorbed than that fromplant foods. Good sources of zinc include red meat, liver, seafoods, milkand dairy products, pulses, wheat and rice. Unrefined cereal grains andlegumes are rich in phytate, which reduces zinc absorption. In addition, zincabsorption can be limited by the intake of phosphates and calcium, andsupplementation with large doses of non-haem iron can also reduce itsbioavailability. In contrast, haem iron has no effect on zinc bioavailability.Zinc absorption is enhanced by a number of dietary factors includingamino acids (particularly histidine), lactose and a low level of dietaryiron.
Requirements and RNIsRequirements for dietary zinc are determined partly by the physiologicalprocesses governing tissue demands for zinc and its rate of loss from thebody, and partly by the intrinsic characteristics of the diet. Requirements aremarkedly increased during periods of “catch-up growth”, when infants andyoung children are recovering from malnutrition or infection.
Breast-milk is fully adequate to meet the infant’s basal requirements forzinc up to 6 months of age. Infants absorb up to about 80% of the zinc inbreast-milk compared to 30% from cow’s milk formula and about 15%from soya-based formula. Estimates of infant zinc requirements betweenthe ages of 6 and 12 months, however, suggest that the declining dailyoutput of zinc in milk will be insufficient if breast-milk is the sole source. Itis thus particularly desirable to select diets with a high zinc bioavailabilityfor infants after 6 months of age.
The RNIs for zinc are shown in Table 25.

92 chapter 5
Low intakeZinc deficiency is primarily caused by a diet low in animal products andhigh in phytate, or as a result of high zinc losses due to diarrhoea. Theclinical features of zinc deficiency are diverse and nonspecific (growth retar-dation, for example) unless the deficiency is very severe. Acrodermatitisenteropathica is a genetic defect that results in failure of zinc absorption andis thus not a “nutritional” disorder (21). Manifestations of zinc deficiencyare similar, however, and include skin lesions, impaired wound healing,impaired taste, depressed appetite, diarrhoea and defects of the immunesystem, the latter resulting in an increased susceptibility to infections (7).
The effects of marginal or mild zinc deficiency are less obvious and can easily beoverlooked. A slowed growth rate and impaired resistance to infection arefrequently the only manifestations of mild deficiency in humans (7).
Investigations into the impact of zinc supplements on the growth of infantsand young children in developing countries have shown inconsistent re-sults. In situations where physical growth is compromised, however, zincsupplementation appears to have a positive impact on children’s growth(22). Furthermore, it has been suggested that maternal supplementationwith zinc improves certain pregnancy outcomes such as birth weight andhead circumference (23).
High intakeFew instances of acute zinc poisoning have been reported. Its manifesta-tions include nausea, vomiting, diarrhoea, fever and lethargy and have beenobserved after ingestion of 4–8 g of zinc. Long-term exposure to high zinc
Table 25. Recommended nutrient intakes for zinc in mg/day
Age United United European WHOa
Kingdom States Union
0–3 months 4.0 5.0 – 5.34–6 months 4.0 5.0 – 3.17–9 months 5.0 5.0 4.0 5.610–12 months 5.0 5.0 4.0 5.61–3 years 5.0 10.0 4.0 5.54–6 years 6.5 10.0 6.0 6.5
a Normative requirement on diet of moderate zinc availability.
Source: Garrow et al. (8).

93minerals other than iron
intakes substantially in excess of requirements has been shown to interferewith the metabolism of other trace elements, mainly copper (7).
CALCIUM
FunctionCalcium is essential for the structural integrity and mineralization of bonesand teeth and plays an important role in a number of metabolic and regula-tory processes. It is a cofactor of many enzymes necessary for nerve andmuscle function, a component of the blood clotting cascade and a regulatorof many intracellular processes. An adequate supply of calcium is vitalduring skeletal growth to ensure optimum bone mass.
SourcesMilk and milk products provide the richest and most easily absorbed di-etary sources of calcium. Other good sources include nuts and fish. Com-ponents binding calcium, such as phosphorus, phytate and oxalate canreduce its bioavailability.
Requirements and RNIsBreast-milk contains a high level of calcium and is sufficient to meet theinfant’s requirements up to about 6 months. After this, breast-milk shouldcontinue to provide most of the calcium needed by infants and youngchildren. Recommended calcium intakes are shown in Table 26.
Low intakeIsolated calcium deficiency rarely occurs in childhood. In practice, this onlyhappens in young children who receive no milk or dairy products. The distur-bances in calcium metabolism associated with rickets and steatorrhoea are
Table 26. Recommended nutrient intakes for calcium in mg/day
Age United United European WHOKingdom States Union
0–3 months 525 210 – 5004–6 months 525 210 – 5007–9 months 525 270 400 60010–12 months 525 270 400 6001–3 years 350 500 400 4004–6 years 450 800 450 450
Source: Garrow et al. (8).
94 chapter 5
usually related to vitamin D deficiency rather than to calcium, althoughrickets resulting from deficiency in calcium has been described (24). Thecalcium intake of infants fed macrobiotic diets may be less than half that ofinfants fed nonvegetarian or lactovegetarian diets, and high concentrationsof phytates and oxalates may further reduce calcium absorption frommacrobiotic diets. Very low calcium intake in children may result in rickets,growth retardation and biochemical signs of hyperparathyroidism (24).
Calcium absorption may be impaired through binding with long-chainfatty acids present in formula milks and unmodified cow’s milk. Hypocal-caemia may cause seizures and tetany (musculoskeletal spasms and twitch-ing, particularly in the fingers and face) and tingling and numbness. Feedingmodified, low-phosphorus infant formula to non-breastfed infants hasvirtually eliminated the problem.
If infants and young children are fed a diet with no breast-milk, cow’s milkor milk products (after 9 months), it is almost impossible to reach the RNIfor calcium. As a result, it is common to recommend that such infants andchildren receive a daily calcium supplement. However, the long-term conse-quences of a calcium intake below the RNI are not known for this age group.
High intakeThere is little evidence that excessive intake of calcium will result in harmapart from the extreme situation of “milk-alkali” syndrome, which rarelyoccurs in childhood (21). Ingestion of large amounts of alkaline calciumsalts can override the ability of the kidneys to excrete unwanted calcium,causing hypercalcaemia and metastatic calcification of the cornea, kidneysand blood vessels. Hypercalcaemia (high blood calcium) results in thirst,mild mental confusion and irritability, loss of appetite, fatigue and weakness.
SODIUM
FunctionThe majority of sodium is found in extracellular fluids. It is essential in thecontrol of extracellular volume and acid–base balance, cellular electricalactivity, nerve conduction and muscle function.
SourcesThe sodium content of naturally occurring foods is relatively low, withsmall amounts in meat, fish, eggs and milk. Most dietary sodium is pro-vided as salt. Some salt is added in cooking and at the table, but in manycountries of the WHO European Region the largest proportion (around 80%)
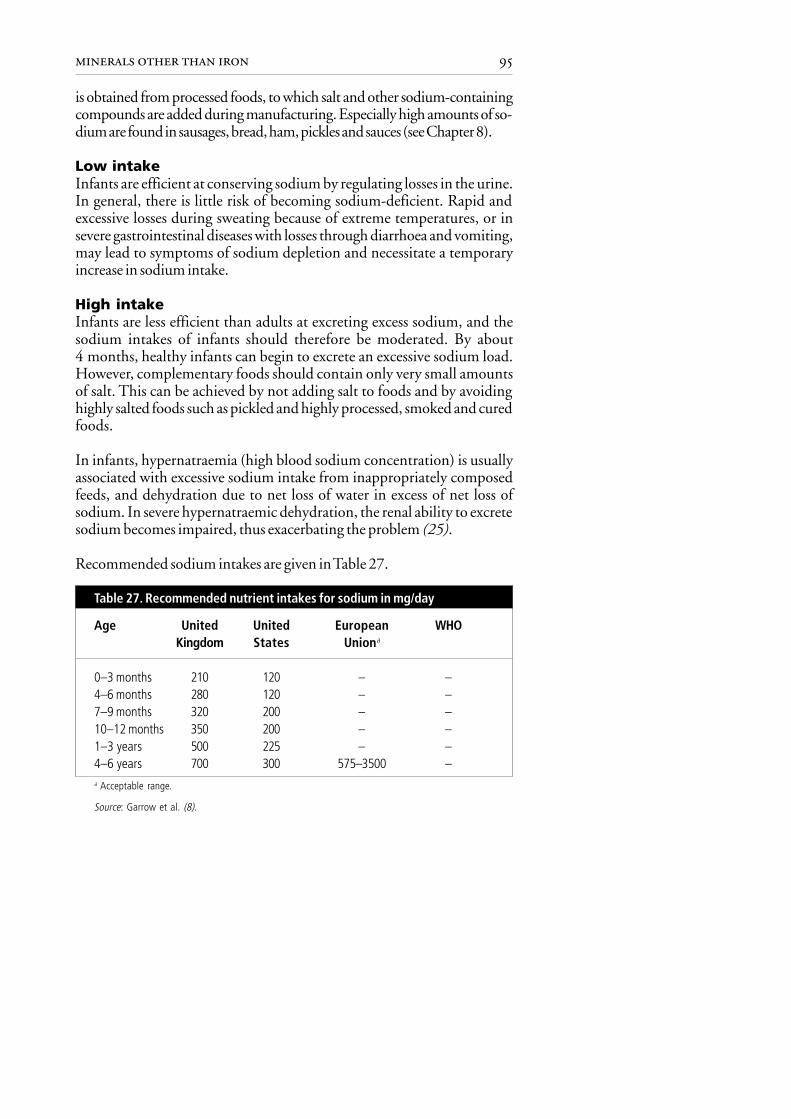
95minerals other than iron
is obtained from processed foods, to which salt and other sodium-containingcompounds are added during manufacturing. Especially high amounts of so-dium are found in sausages, bread, ham, pickles and sauces (see Chapter 8).
Low intakeInfants are efficient at conserving sodium by regulating losses in the urine.In general, there is little risk of becoming sodium-deficient. Rapid andexcessive losses during sweating because of extreme temperatures, or insevere gastrointestinal diseases with losses through diarrhoea and vomiting,may lead to symptoms of sodium depletion and necessitate a temporaryincrease in sodium intake.
High intakeInfants are less efficient than adults at excreting excess sodium, and thesodium intakes of infants should therefore be moderated. By about4 months, healthy infants can begin to excrete an excessive sodium load.However, complementary foods should contain only very small amountsof salt. This can be achieved by not adding salt to foods and by avoidinghighly salted foods such as pickled and highly processed, smoked and curedfoods.
In infants, hypernatraemia (high blood sodium concentration) is usuallyassociated with excessive sodium intake from inappropriately composedfeeds, and dehydration due to net loss of water in excess of net loss ofsodium. In severe hypernatraemic dehydration, the renal ability to excretesodium becomes impaired, thus exacerbating the problem (25).
Recommended sodium intakes are given in Table 27.
0–3 months 210 120 – –4–6 months 280 120 – –7–9 months 320 200 – –10–12 months 350 200 – –1–3 years 500 225 – –4–6 years 700 300 575–3500 –a Acceptable range.
Source: Garrow et al. (8).
Table 27. Recommended nutrient intakes for sodium in mg/day
Age United United European WHOKingdom States Uniona

96 chapter 5
REFERENCES
1. TAUROG, A. Hormone synthesis: thyroid iodine metabolism. In:Braverman, L.E. & Utiger, R.D., ed. Werner & Ingbar’s the thyroid.Hagerstown, MD, Lippincott Williams & Wilkins, 2000, pp. 47–81.
2. BERNAL, J. & NUNEZ, J. Thyroid hormones and brain development.European journal of endocrinology, 133: 390–398 (1995).
3. STANBURY, J.B. The damaged brain of iodine deficiency: cognitive,behavioral, neuromotor, educative aspects. New York, Cognizant Com-munication, 1993.
4. KOUTRAS, D.A. ET AL. The ecology of iodine. In: Stanbury, J.B. &Hetzel, B.S., ed. Endemic goiter and endemic cretinism. New York,John Wiley, 1980, pp. 185–195.
5. WAYNE, E.J. ET AL. Clinical aspects of iodine metabolism. Oxford,Blackwell, 1964.
6. PHILLIPS, D.I.W. Iodine, milk, and the elimination of endemic goitre inBritain: the story of an accidental public health triumph. Journal ofepidemiology and community health, 51: 391–393(1997).
7. Trace elements in human nutrition and health. Geneva, World HealthOrganization, 1996.
8. GARROW, J.S. ET AL., ED. Human nutrition and dietetics, 10th ed. Lon-don, Churchill Livingstone, 1999.
9. DELANGE, F. Requirements of iodine in humans. In: Delange, F. et al.,ed. Iodine deficiency in Europe. A continuing concern. New York, Ple-num Press, 1993, pp. 5–16.
10. HETZEL, B.S. Iodine deficiency disorders (IDD) and their eradication.Lancet, 2: 1126–1129 (1983).
11. DELANGE, F. Endemic cretinism. In: Braverman, L.E. & Utiger, R.D.,ed.Werner & Ingbar’s the thyroid. Hagerstown, MD, Lippincott Williams& Wilkins, 2000, pp. 744–754.
12. DELANGE, F. ET AL. Physiopathology of iodine nutrition during preg-nancy, lactation and early postnatal life. In: Berger, H., ed. Vitamins andminerals in pregnancy and lactation. New York, Raven Press, 1988,pp. 205–213.
13. WILLIAMS, E.D. The role of iodine deficiency in radiation induced thyroidcancer. In: Delange, F. et al., ed. Elimination of iodine deficiency disorders(IDD) in central and eastern Europe, the Commonwealth of IndependentStates and the Baltic states. Proceedings of a conference held in Munich,Germany, 3–6 September 1997. Copenhagen, WHO Regional Office forEurope, 1998 (document WHO/EURO/NUT/98.1), pp. 73–81.
14. Indicators for assessing iodine deficiency disorders and their control throughsalt iodization. Geneva, World Health Organization, 1994 (documentWHO/NUT/94.6).

97minerals other than iron
15. MANNAR, V.M.G. The iodization of salt for the elimination of iodinedeficiency disorders. In: Hetzel, B.S. & Pandav, C.S., ed. S.O.S. for abillion. The conquest of iodine deficiency disorders. New Delhi, OxfordUniversity Press, 1994, pp. 89–107.
16. DUNN, J.T. The use of iodized oil and other alternatives for the elimina-tion of iodine deficiency disorders. In: Hetzel, B.S. & Pandav, C.S., ed.S.O.S. for a billion. The conquest of iodine deficiency disorders. NewDelhi, Oxford University Press, 1994, pp. 119–128.
17. DELANGE, F. Administration of iodized oil during pregnancy: a sum-mary of the published evidence. Bulletin of the World Health Organiza-tion, 74: 101–108 (1996).
18. DELANGE, F. & LECOMTE, P. Iodine supplementation: benefits out-weigh risks. Drug safety, 22: 89–95 (2000).
19. DELANGE, F. ET AL. Topical iodine, breastfeeding and neonatal hypothy-roidism. Archives of disease in childhood, 63: 102–107 (1988).
20. DELANGE, F. ET AL. Risks of iodine-induced hyperthyroidism followingcorrection of iodine deficiency by iodized salt. Thyroid, 9: 545–556(1999).
21. BARLTROP, D. Mineral deficiency. In: Campbell, A.G.M. et al., ed.Forfar & Arneil’s Textbook of Paediatrics, 5th ed. Edinburgh, ChurchillLivingstone, 1992.
22. Complementary feeding of young children in developing countries: a re-view of current scientific knowledge. Geneva, World Health Organiza-tion, 1998 (document WHO/NUT/98.1).
23. SAMMAN, S. Zinc. In: Mann, J. & Truswell, S., ed. Essentials in humannutrition. Oxford, Oxford University Press, 1998, pp. 151–157.
24. THACHER, T.D. ET AL. A comparison of calcium, vitamin D or both, fornutritional rickets in Nigerian children. New England journal of medi-cine, 341: 563–568 (1999).
25. FOMON, S.J. Sodium, chloride, and potassium. In: Fomon, S.J. Nutri-tion of normal infants. St Louis, MO, Mosby, 1993.

98 chapter 5
Appendix
Recommended nutrient intakes for minerals not discussed in this chapter(from Garrow et al. (8))
Phosphorus (mg/day)
Age United United European WHOKingdom States Union
0–3 months 400 – – –4–6 months 400 – – –7–9 months 400 – 300 –10–12 months 400 – 300 –1–3 years 270 460 300 –4–6 years 350 500 350–450 –
Magnesium (mg/day)
Age United United European WHOKingdom States Union
0–3 months 55 40 – –4–6 months 60 40 – –7–9 months 75 60 – –10–12 months 80 60 – –1–3 years 85 80 – –4–6 years 120 120 – –
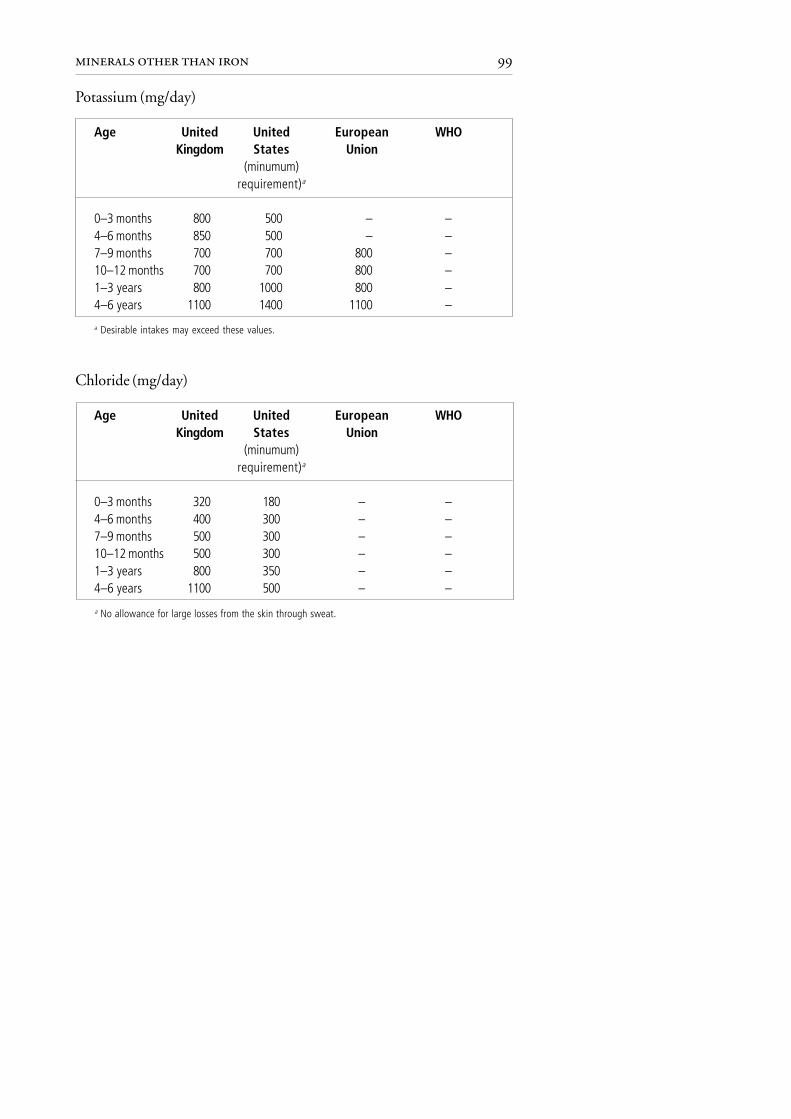
99minerals other than iron
Potassium (mg/day)
Age United United European WHOKingdom States Union
(minumum)requirement)a
0–3 months 800 500 – –4–6 months 850 500 – –7–9 months 700 700 800 –10–12 months 700 700 800 –1–3 years 800 1000 800 –4–6 years 1100 1400 1100 –
Chloride (mg/day)
Age United United European WHOKingdom States Union
(minumum)requirement)a
0–3 months 320 180 – –4–6 months 400 300 – –7–9 months 500 300 – –10–12 months 500 300 – –1–3 years 800 350 – –4–6 years 1100 500 – –
a Desirable intakes may exceed these values.
a No allowance for large losses from the skin through sweat.
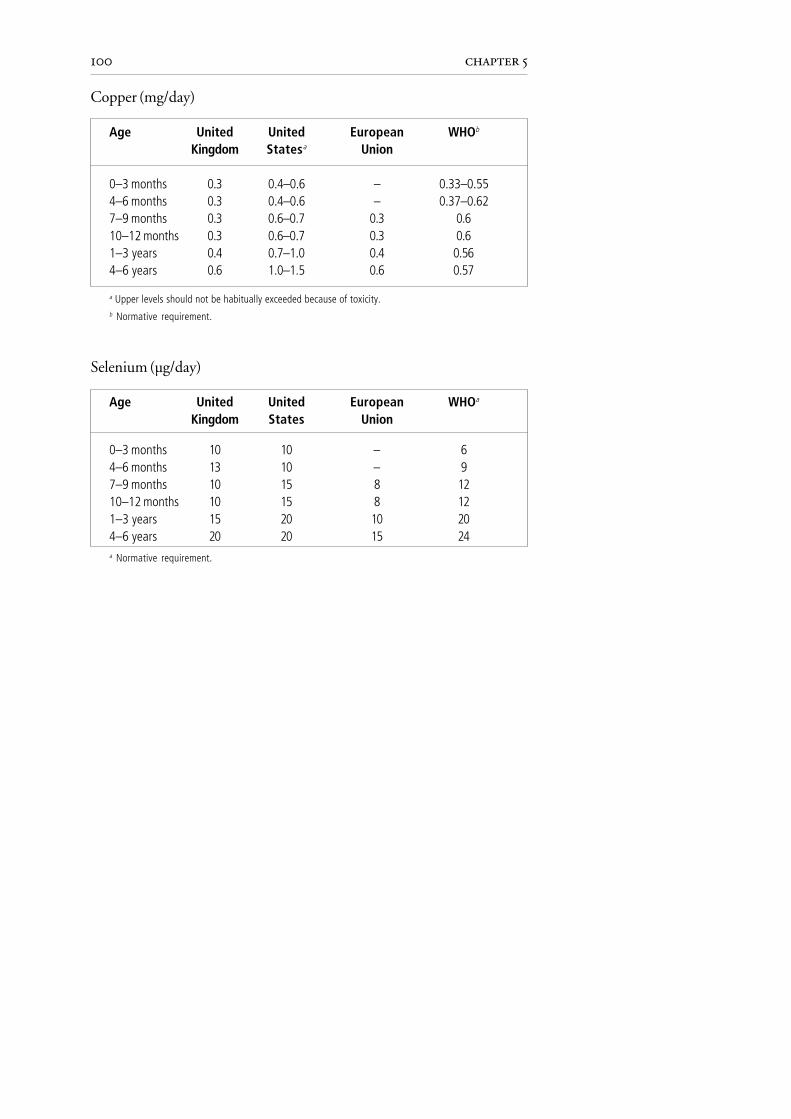
100 chapter 5
Copper (mg/day)
Age United United European WHOb
Kingdom Statesa Union
0–3 months 0.3 0.4–0.6 – 0.33–0.554–6 months 0.3 0.4–0.6 – 0.37–0.627–9 months 0.3 0.6–0.7 0.3 0.610–12 months 0.3 0.6–0.7 0.3 0.61–3 years 0.4 0.7–1.0 0.4 0.564–6 years 0.6 1.0–1.5 0.6 0.57
a Upper levels should not be habitually exceeded because of toxicity.b Normative requirement.
Selenium (µg/day)
Age United United European WHOa
Kingdom States Union
0–3 months 10 10 – 64–6 months 13 10 – 97–9 months 10 15 8 1210–12 months 10 15 8 121–3 years 15 20 10 204–6 years 20 20 15 24a Normative requirement.

101control of iron deficiencyintroductionchapter 6
Control of iron deficiency
Iron deficiency in infants and young children is widespread and has seriousconsequences for child health. Prevention of iron deficiency should therefore begiven high priority.
When complementary foods are introduced at about 6 months of age, it isimportant that iron-rich foods such as liver, meat, fish and pulses or iron-fortified complementary foods are included.
The too-early introduction of unmodified cow’s milk and milk products is animportant nutritional risk factor for the development of iron deficiency anae-mia. Unmodified cow’s milk should not therefore be introduced as a drinkuntil the age of 9 months and thereafter can be increased gradually.
Because of their inhibitory effect on iron absorption, all types of tea (black, greenand herbal) and coffee should be avoided until 24 months of age. After thisage, tea should be avoided at mealtimes.
Optimal iron stores at birth are important for the prevention of iron deficiencyin the infant and young child. To help ensure good infant iron stores, themother should eat an iron-rich diet during pregnancy. At birth the umbilicalcord should not be clamped and ligated until it stops pulsating.
INTRODUCTION
Iron deficiency is one of the commonest nutritional deficiencies world-wide, estimated to affect more than three billion people. It ranges in severityfrom iron depletion, which causes no physiological impairment, to irondeficiency anaemia, and can affect mental and motor development. Chil-dren under the age of 3 years, pregnant women and women of child-bearingage are particularly susceptible to iron deficiency. It is estimated that 43% ofthe world’s infants and children under the age of 4 years suffer from irondeficiency anaemia (1). In some parts of Europe, especially in the centralAsian republics and among Asian children in the United Kingdom, theprevalence of iron deficiency anaemia is high (see Chapter 1). Young chil-dren are especially vulnerable to the development of iron deficiency be-tween the ages of 6 and 24 months. The increased nutritional needs result-ing from rapid growth are combined with a diet that may be low in iron and

102 chapter 6
vitamin C and high in unmodified cow’s milk and other inhibitors of ironabsorption. Dietary recommendations concerning iron are therefore ofspecial importance during the period of complementary feeding. Recom-mendations for complementary feeding should be given high priority byhealth ministries, and should always form an integral part of populationstrategies to control iron deficiency. Prevention of iron deficiency in infantsand young children is possible through the relatively simple dietary strate-gies described below.
Definition of iron deficiencyIron depletion is a decrease in iron stores. There is no evidence of functionalconsequences but iron depletion represents a threshold below which fur-ther decreases result in functional impairment. When iron stores are de-pleted, haemoglobin synthesis is impaired and the haemoglobin level be-gins to fall. As the haemoglobin level of most people is usually within thenormal range, iron depletion usually happens before the haemoglobin levelhas reached the statistically determined cut-off that defines anaemia (2).
Iron deficiency anaemia is defined as iron deficiency resulting in a haemo-globin level that falls below the statistically defined age- and sex-dependentcut-off limit (2). Haemoglobin and haematocrit cut-off points that defineanaemia according to age and sex are shown in Table 28.
In practice, diagnosis is often based on haemoglobin values alone, and theprevalence of anaemia is expressed as the percentage of individuals with ahaemoglobin value below a certain cut-off point. Anaemia can be caused bya number of other factors, including infection; if, however, values forhaematocrit are also low, this strengthens the likelihood that the low
Age or sex Haemoglobin (g/dl) Haematocrit (%)
6 months to 5 years 11.0 335–11 years 11.5 3412–13 years 12.0 36Non-pregnant women 12.0 36Pregnant women 11.0 33Men 13.0 39
Source: World Health Organization (1).
Table 28. Haemoglobin and haematocrit cut-off points used to defineanaemia

103control of iron deficiency
haemoglobin value is the result of iron deficiency. The severity of anae-mia can be classified as mild, moderate or severe, depending on thehaemoglobin value (Table 29).
Classification Haemoglobin level (g/dl)
Severe < 7Moderate < 10 (in children aged between 6 months and 5 years)
< 9 (in infants less than 6 months)Mild 10–11
Source: World Health Organization (1).
Table 29. Classification of anaemia and corresponding haemoglobin levels
In addition to haemoglobin and haematocrit, there are a number of othertests used to assess iron status. The resources available will determine whichtests are used. Of special interest is the measurement of serum ferritin levels,which provides an indication of iron stores in individuals whether or notthey are anaemic. The main disadvantage of this test is that serum ferritinlevels increase during illness, because serum ferritin is an acute-phase reac-tant. Thus, the use of serum ferritin levels can lead to an underestimation ofthe prevalence of iron deficiency in populations where infection is com-mon. A ferritin value below 10 µg/l (3) or 12 µg/l (1) is generally accepted asan indication of iron depletion in children under 5 years.
It is possible to identify iron deficiency as a cause of anaemia by giving aniron supplement for 1–2 months. If the haemoglobin level increases by 1 g/dl or more, iron deficiency is a likely cause of the anaemia. If it does not,however, iron deficiency should not be ruled out because of the possibilityof poor compliance or inconsistent ingestion and absorption of iron.
In infants and young children there are still uncertainties about the appro-priate cut-off values for both haemoglobin and serum ferritin levels. Lowlevels of ferritin do not necessarily imply functional iron deficiency ininfants. The evidence for using 10–12 µg ferritin per litre as a cut-off todefine iron depletion is based on extrapolation from older age groups. Inseveral studies from industrialized countries, including those in healthyinfants receiving iron-fortified foods, a surprisingly high percentage ofinfants (20%–30%) had < 11 g haemoglobin per decilitre, suggestingthat the cut-off value may be too high. These studies have instead

104 chapter 6
recommended the use of values of 10.5 or 10.3 g/dl or lower to defineanaemia in infants (4–6).
Causes of anaemia other than iron deficiencyAnaemia can be caused by factors other than iron deficiency, and these canbe classified as nutritional, environmental, infectious and hereditary fac-tors.
• Nutritional anaemia can be caused by deficiency of other nutrients, suchas vitamin A, folic acid, vitamin B
12, vitamin C, riboflavin and copper.
There is an interaction between iron and vitamin A (7). In several studiesfrom societies where deficiencies of both vitamin A and iron are com-mon, treatment with both micronutrients is more effective in correct-ing anaemia than giving iron alone, most likely because vitamin A defi-ciency impairs mobilization of iron stores.
• Even very small amounts of lead can impair haem synthesis and thuscause anaemia. There is also an interaction between lead intoxication andiron deficiency, because lead and iron share the same absorption path-way. Because iron absorption is enhanced during iron deficiency, there isa tendency for the absorption of lead, if present in the environment, toincrease and thereby aggravate anaemia. Geophagia (the habit of eatingsoil) is associated with iron deficiency anaemia. It is not clear, however, ifgeophagia has a positive effect on iron status due to the iron content ofthe soil, or whether other substances in the soil, such as lead, reduce theabsorption of dietary iron. Aplastic anaemia (reduced platelet and whitecell counts as well as those of red cells) can be associated with excessiveexposure to industrial or agricultural pollutants.
• Systemic infections and chronic inflammation can cause anaemia that isnot related to iron deficiency. However, infectious diseases are typicallymore frequent in areas with a high prevalence of iron deficiency, and theanaemia associated with infections can thus be multifactorial. This isespecially the case in diseases associated with blood loss, such as hook-worm infestation, dysentery and schistosomiasis. There is some evi-dence that hookworm infestation may be a problem in some of thecentral Asian republics. The anaemia often seen in patients with malariais caused by haemolysis and is therefore not necessarily associated withiron deficiency. People with malaria often have iron deficiency for otherreasons, however, and this exacerbates the anaemia caused by haemoly-sis. As a result, malaria sufferers are often treated with iron in addition toantimalarials.
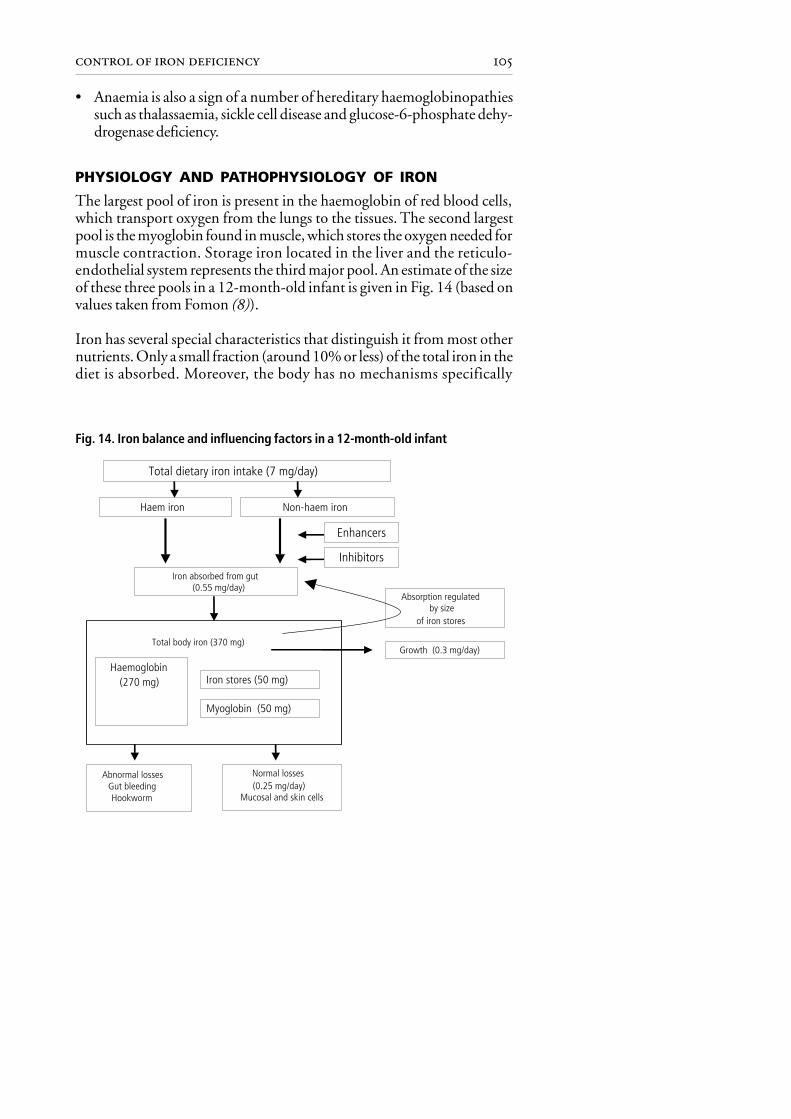
105control of iron deficiency
• Anaemia is also a sign of a number of hereditary haemoglobinopathiessuch as thalassaemia, sickle cell disease and glucose-6-phosphate dehy-drogenase deficiency.
PHYSIOLOGY AND PATHOPHYSIOLOGY OF IRON
The largest pool of iron is present in the haemoglobin of red blood cells,which transport oxygen from the lungs to the tissues. The second largestpool is the myoglobin found in muscle, which stores the oxygen needed formuscle contraction. Storage iron located in the liver and the reticulo-endothelial system represents the third major pool. An estimate of the sizeof these three pools in a 12-month-old infant is given in Fig. 14 (based onvalues taken from Fomon (8)).
Iron has several special characteristics that distinguish it from most othernutrients. Only a small fraction (around 10% or less) of the total iron in thediet is absorbed. Moreover, the body has no mechanisms specifically
Total dietary iron intake (7 mg/day)
Haem iron Non-haem iron
Enhancers
Inhibitors
Iron absorbed from gut (0.55 mg/day)
Absorption regulated by size
of iron stores
Total body iron (370 mg)
Haemoglobin (270 mg) Iron stores (50 mg)
Myoglobin (50 mg)
Abnormal lossesGut bleedingHookworm
Normal losses (0.25 mg/day)
Mucosal and skin cells
Growth (0.3 mg/day)
Fig. 14. Iron balance and influencing factors in a 12-month-old infant
106 chapter 6
designed to excrete iron, and normal losses that occur through the gut orskin are very small. Regulation of total body iron therefore occurs throughregulation of the absorption of iron.
Absorption
Haem and non-haem ironThere are two types of iron in food: haem iron and non-haem iron, and theyare absorbed by different mechanisms. Haem iron is present in haemo-globin and myoglobin in meat (particularly liver) and fish, and is betterabsorbed than non-haem iron. The average absorption of haem iron frommeat is around 25%. In contrast to non-haem iron, the absorption of haemiron is influenced very little by other constituents of the diet and by ironstatus. Nevertheless, most dietary iron is present in the form of non-haemiron. Complementary foods for infants may contain little meat and somost of the dietary iron is in the non-haem form. Absorption of non-haemiron is much lower than that of haem iron and depends on the iron status ofthe individual: more non-haem iron is absorbed by iron-deficient individu-als and less by those who are iron-replete. Moreover, the absorption of non-haem iron depends on its solubility in the intestine, and this is determinedby the composition of foods consumed in a meal. Vitamin C is a reducingagent and a potent promoter of iron absorption, increasing iron solubilitythrough the oxidation of elemental iron from the ferrous (Fe2+) to the ferric(Fe3+) state to form a soluble compound. The promoters and inhibitorspresent in the diet are often stronger determinants of iron status than itsactual iron content.
Promoters and inhibitorsThe quantity of absorbed iron in the diet depends on the balance betweenthe inhibitors and promoters (Table 30). Because the interaction takes placein the gastrointestinal tract, the inhibitory or enhancing effects of foodcomponents on non-haem iron absorption are greatest when these compo-nents are consumed in the same meal.
One of the strongest promoters of iron absorption is vitamin C in freshvegetables and fruits, and there is a clear dose–response relationship be-tween vitamin C intake and iron absorption (10). Fermented products suchas kefir and sauerkraut also enhance non-haem iron absorption. In thepresence of acid, complexes are formed with iron that prevent the forma-tion of the less absorbable iron phytate. In addition, certain forms of mill-ing and thermal processing reduce the phytate content of plant-based sta-ples and thereby help to increase the absorption of non-haem iron. Mild

107control of iron deficiency
Food Degree Active substanceof
effect
InhibitingWhole grain cereals and maize – – – PhytateTea, green leafy vegetables – – – PolyphenolsMilk, cheese – – Calcium plus phosphateSpinach – Polyphenols, oxalic acidEggs – Phosphoprotein, albuminCereals – Fibre
Enhancing Active substanceLiver/meat/fish +++ “Meat factor”Orange, pear, apple +++ Vitamin CPlum, banana ++ Vitamin CCauliflower ++ Vitamin CLettuce, tomato, green pepper,
cucumber + Vitamin CCarrot, potato, beetroot, pumpkin, Citric, malic and tartaric
broccoli, tomato, cabbage ++/+ acidsKefir, sauerkraut ++ Acids
Source: adapted from British Nutrition Foundation (9).
Table 30. Dietary compounds that inhibit (–) and enhance (+) theabsorption of non-haem iron
heat treatment is thought to reduce the phytate content of tubers thoughnot of cereals and legumes. Soaking and germination promote enzymatichydrolysis of phytate in grains and legumes (11).
The strongest inhibitors of iron absorption are phytates and polyphenols.Phytates are storage forms of phosphates and minerals present in cerealgrains, vegetables, seeds and nuts. They strongly inhibit iron absorption in adose-dependent manner, and even small amounts can inhibit the absorp-tion of iron. There are a number of traditional food preparation practicesthat reduce the levels of phytates present in plant foods. These includefermentation, germination, milling, soaking and roasting. Phytates can bealmost completely degraded by fermentation, which thus improves ironabsorption.

108 chapter 6
Phenolic compounds exist in almost all plants as part of their defencesystem against insects and animals. A few phenolic compounds specificallybind iron and therefore inhibit its absorption. These are found in tea, coffeeand cocoa, and also in many vegetables and several herbs and spices. Thepolyphenol tannin, which is found in tea, is responsible for the inhibitoryeffect of tea on iron absorption. Tea has been found to reduce iron absorp-tion from a meal by 62% compared with water (12). Indeed, tea has evenbeen used therapeutically to treat iron overload (13). In many Europeancountries, and especially in the central Asian republics, it is common tointroduce tea very early into the infant’s diet. For example, a survey ofchildren aged 0–3 years in Kazakhstan, Kyrgyzstan and Uzbekistan foundthat 21%, 34% and 49%, respectively, received tea (14). Similar customsare found in central and western Europe (15), especially among ethnicminorities. This practice will contribute to the development of iron defi-ciency.
Other factors
Iron stores are primarily regulated through changes in iron absorption.Injury to the intestinal mucosa due to the too-early introduction of un-modified cow’s milk and dairy products can result in malabsorption, in-cluding decreased absorption of iron (see page 109) (16). This can bepronounced in coeliac disease, which if untreated is often accompanied byiron deficiency anaemia. Chronic diarrhoeal disease is also a common causeof iron deficiency due to malabsorption. During systemic infections there isan acute decrease in iron absorption, paralleling a shift in iron from thecirculation to the liver. This is a natural protective mechanism of the bodyduring periods of infection, aimed at reducing the growth of harmfulbacteria that require iron to proliferate.
Iron storesIron stores have an important buffer function in iron metabolism. At birth,iron stores are large and are gradually depleted over the first 6 months of life,after which maintenance of the infant’s iron stores is dependent on dietaryiron intake. The size of the iron stores can be assessed by measuring serumferritin.
If the mother has severe iron deficiency anaemia, iron stores at birth will besmall (17), while moderate iron deficiency in the mother does not seem toinfluence the iron status of the infant. The size of the iron stores of thenewborn infant are also influenced by the amount of blood transferredfrom the placenta to the infant at delivery, before ligation of the umbilicalcord. Several studies have demonstrated a relationship between maternal
109control of iron deficiency
anaemia and the risk of preterm delivery or low birth weight. Furthermore,preterm or low-birth-weight infants are born with the same ratio of totalbody iron to body weight, but because their body weight is low the amountof stored iron is also low. Moreover, preterm infants have an increased needfor iron because of their need for catch-up growth after delivery. Preterminfants therefore need a good dietary source of iron earlier than term infants.
GrowthIn the infant and young child, most of the absorbed iron is used for expan-sion of the haemoglobin, myoglobin and enzyme pools as the child grows.A 12-month-old infant is estimated to require around 0.3 mg/day of ironfor growth (see Fig. 14). Rapid weight gain is therefore likely to be onepossible cause of iron deficiency, and in some studies of healthy term infantsrapid weight gain has been associated with low serum ferritin levels (5).
Iron lossesThere is a small but continuous loss of iron from the body. This is mainlydue to the turnover and loss of cells from the gastrointestinal mucosa andthe skin (Fig. 14). Bleeding caused by gastrointestinal parasites, infectionsor the intake of unmodified cow’s milk and other milk products before9 months of age results in a loss of iron through the loss of blood. Feedingof unmodified cow’s milk and other milk products during the first 6 monthscan cause bleeding of the gastrointestinal mucosa; furthermore, cow’s milkhas a lower iron content and bioavailability than breast-milk. The earlyintroduction of cow’s milk is thought to be the most important nutritionalrisk factor for low iron stores or iron deficiency in infants. This problem ismost serious during the first months of life.
Hookworm infestation is a common cause of iron deficiency anaemia inmany countries, and can be avoided through preventive measures and treat-ment (see page 121). Other infections causing blood loss are schistosomia-sis of the urinary tract (Schistosoma haematobium) and dysentery. Manyinfections, especially malaria and chronic inflammation syndromes, causeanaemia but blood and thus iron is not lost from the body. Instead, asmentioned above, excess iron circulating in blood is transferred to the liverand stored there until the infection has subsided.
Physiological requirements and RNIAge, gender and physiological status determine iron requirements. Ironrequired before 6 months of age should be provided by the iron stores of theinfant and by breast-milk. After this, iron requirements must be providedby iron present in food. Requirements are especially high in infants from

110 chapter 6
the age of 6 months, in young children, and in pregnant and menstruatingwomen. Blood losses during menstruation largely determine the iron re-quirements of non-pregnant women. The increased iron requirements ofinfants and pregnant women are needed to support growth and new tissueformation. A small amount of dietary iron (approximately 0.2 mg/day in a1-year-old infant) is also needed to replace gastrointestinal and dermallosses (18).
The physiological requirement (Table 31) for absorbed iron by youngchildren is small compared with the amount usually present in the diet orcompared with RNIs (Table 32). This difference is due to the lowbioavailability of iron and the small percentage of iron that is normallyabsorbed: usually only 5%–15% of the iron in the diet. Absorption isinfluenced by the physiological factors described above and by dietary
Table 32. Recommended nutrient intakes for iron in mg/day
Age United United European WHOb
Kingdom States Uniona
0–3 months 1.7 6.0 – –4–6 months 4.3 6.0 – –7–9 months 7.8 10.0 6.0 8.510–12 months 7.8 10.0 6.0 8.51–3 years 6.9 10.0 4.0 5.04–6 years 6.1 10.0 4.0 5.5
a Bioavailability 15%.b Median basal requirement on intermediate bioavailability diet.
Source: Garrow et al. (20).
Age/physiological status µg/kg body weight/day mg/day
4–12 months 120 0.9613–24 months 56 0.612–5 years 44 0.70Pregnant women 24 1.31Menstruating women 43 2.38
Source: Verster (19).
Table 31. Physiological requirements for iron

111control of iron deficiency
factors such as the kind of iron (haem or non-haem) and the presence ofenhancing and inhibitory factors in the diet.
The RNIs for iron given in Table 32 illustrate the large variations (from 6 to10 mg/day at 7–9 months and from 4 to 10 mg/day at 1–3 years of age) thatexist between the recommendations from different countries. These varia-tions can be partly explained by the different eating traditions of differentcultures and thereby differences in the sources of iron and its bioavailability,but they also highlight the scientific uncertainty regarding the optimalintake of iron for infants and young children.
Excess intakeA high iron intake may lead to iron overload, which is associated with anumber of adverse effects. The absorption of non-haem iron is reduced,however, if the iron stores are high, and in most cases this is likely to protectthe individual from iron overload. A normal diet can result in iron overloadif the person suffers from hereditary haemochromatosis, which is character-ized by lifelong excess absorption of iron from the diet. Among people ofEuropean extraction, hereditary haemochromatosis is the most commongenetic disorder of excess iron absorption, with a prevalence of 2–5 per1000 in the Caucasian population. For these people iron can be toxic,leading to tissue and organ damage and ultimately death.
Iron is a pro-oxidant, and increased consumption can potentially induceincreased oxidative stress (21). This may explain why some epidemiologicalstudies of adults have linked high iron stores, measured by high serumferritin values, to an increased risk of cardiovascular disease (22,23), non-insulin-dependent diabetes (24,25) and cancer (26,27). The relevance ofthese findings to infants and young children is not known, and there are nostudies in this age group linking a high iron intake with increased oxidativestress and adverse symptoms.
Several studies have shown an association between iron treatment and anincreased risk of infection. As discussed above, the body withholds ironfrom microorganisms as a defence against infection. During infections,iron is displaced from the vascular bed to the liver and iron absorption isdecreased. Iron administration during infections could thus increase therisk of infection. In most of the studies, however, iron was given parenter-ally, bypassing the regulatory mechanism of absorption. With the excep-tion of malnourished individuals with infections, there is no convincingevidence that the oral administration of iron, either in the form of iron-fortified foods or as medicinal iron supplements, increases the risk or

112 chapter 6
severity of infection (8). In nutritional rehabilitation of severely malnour-ished children it is recommended not to start iron supplementation untilone week after the start of treatment (28).
High intakes of iron may interfere with the absorption of copper and zinc,since the three minerals have the same mechanism for absorption. Copper islikely to be most affected (8).
In conclusion, a high iron intake can theoretically cause adverse effects, butthere is limited evidence in infants and young children that a physiologicalamount of oral iron has adverse effects. In populations with a documentedhigh prevalence of iron deficiency, the possible negative effects of givingexcessive amounts of iron are outweighed by the well documented positiveeffects of preventing the symptoms of iron deficiency. In populations whereiron deficiency is uncommon or where the iron status of the population isunknown, however, it is prudent to avoid too high an iron intake.
SYMPTOMS AND CONSEQUENCES OF IRON DEFICIENCY
Symptoms of anaemia range from nonspecific conditions, such as fatigue,weakness, dizziness and sensitivity to cold, to the clinical manifestations ofchronic anaemia, which include changes to the fingernails, hair or tongue,breathlessness and heart failure.
The major consequences of iron deficiency anaemia include a higher risk ofmaternal mortality, fetal growth retardation, increased prenatal and peri-natal mortality, and lowered physical activity (29). Atrophy of the villi ofthe small intestine, causing malabsorption, has been reported in iron-defi-cient infants. Appetite is reduced, which compounds the problem of im-proving iron status by dietary means, and is often accompanied by falteringgrowth and poor physical development in young children.
Iron deficiency has also been linked with increased susceptibility to infec-tion, although the relationship between the two is complex. There is goodevidence that iron deficiency adversely affects cell-mediated immunity andcauses a decrease in the bactericidal activity of neutrophils, thus loweringresistance and increasing morbidity.
In infants and children under 2 years of age, the consequence of iron defi-ciency of greatest concern is the possible impairment of mental and psycho-motor development. Infants are particularly vulnerable to iron deficiencyduring the period of complementary feeding (between 6 and 24 months of

113control of iron deficiency
age) when the growth rate is high. This period represents the peak preva-lence of iron deficiency in children, and coincides with the latter part of thespurt in brain growth when cognitive and motor development are takingplace.
Evidence from community-based studies has demonstrated a positive asso-ciation between iron deficiency and impaired performance in a range ofmental and physical functions in children of different age groups, particu-larly infants. It has also been suggested that iron deficiency alters the emo-tional state of infants so that they are more withdrawn, cautious and hesi-tant, and as a result may be less able to interact and learn from their environ-ment, thus hindering their intellectual development. In preschool children(36–72 months of age) iron deficiency has been associated with poor learn-ing performance, particularly in tasks that demand close attention anddiscrimination of cues critical to solving visual problems.
The majority of studies of the effects of iron therapy in infants and childrenunder 2 years of age report no improvement in the mental and physicaldevelopment of anaemic infants after either short- or long-term adminis-tration, despite elimination of anaemia. In preschool children, however,iron deficiency has been successfully corrected with iron supplementation,and has resulted in a marked improvement such that the learning problemsassociated with anaemia disappeared. Thus the risk of permanent develop-mental deficits may be related to the child’s age at the time of the deficiencyor to the duration of iron deficiency (30), and the degree of iron deficiencyis also likely to determine whether there is risk of permanent adverse effects.
To summarize, the evidence for a causal association between anaemia ininfancy and poor neurodevelopment is not conclusive. Currently, only twointervention trials have been conducted. One failed to show that anaemicinfants given prophylactic iron supplementation after 6 months had im-proved developmental scores compared with untreated controls (31). Thesecond, carried out in infants who were more socioeconomically disadvanta-ged, did demonstrate such benefits (32). Iron deficiency anaemia is morecommon in conditions of biological (low birth weight, other nutritionaldeficiencies, high infection rates), psychological (lack of stimulation) orsocial (poverty, overcrowding) disadvantage (see Chapter 9). It is possiblethat the adverse effects of iron deficiency on mental development may bemanifest only when infants are already vulnerable to other risk factors, andconsequently the benefits of prevention are more likely to be observed insuch children (2). Given the likelihood of long-lasting effects of iron defi-ciency during infancy, and the possible irreversibility of developmental
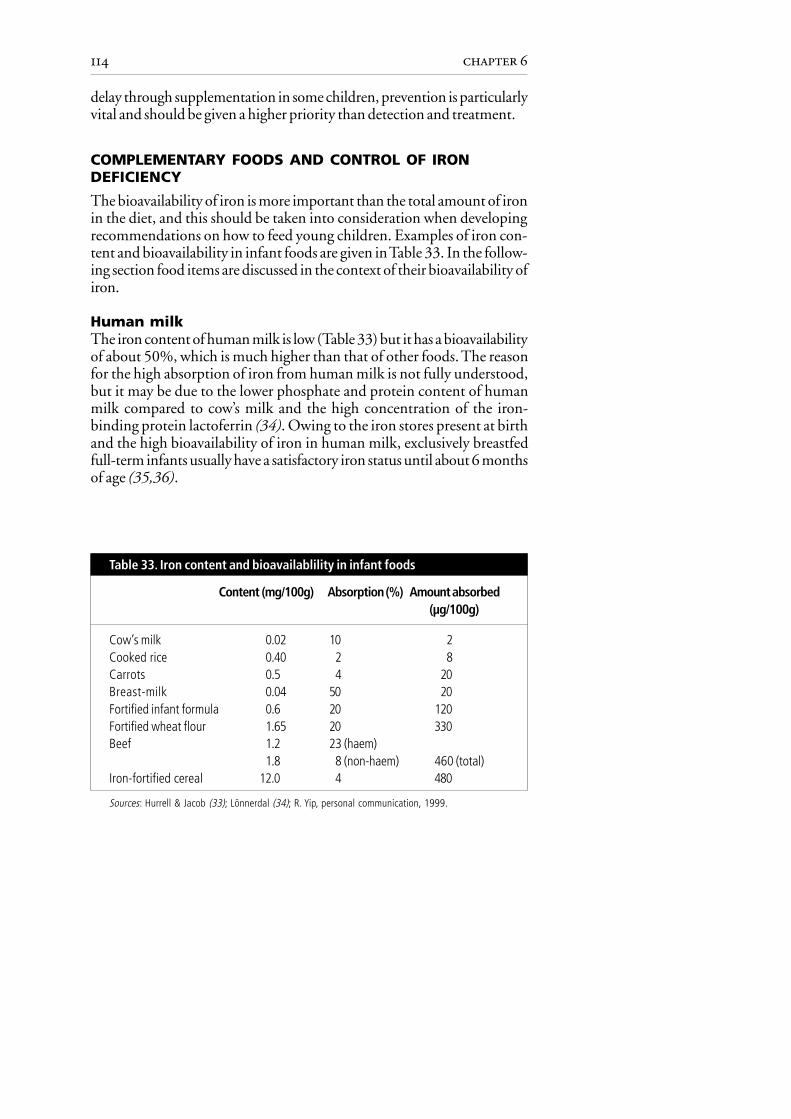
114 chapter 6
delay through supplementation in some children, prevention is particularlyvital and should be given a higher priority than detection and treatment.
COMPLEMENTARY FOODS AND CONTROL OF IRONDEFICIENCY
The bioavailability of iron is more important than the total amount of ironin the diet, and this should be taken into consideration when developingrecommendations on how to feed young children. Examples of iron con-tent and bioavailability in infant foods are given in Table 33. In the follow-ing section food items are discussed in the context of their bioavailability ofiron.
Human milkThe iron content of human milk is low (Table 33) but it has a bioavailabilityof about 50%, which is much higher than that of other foods. The reasonfor the high absorption of iron from human milk is not fully understood,but it may be due to the lower phosphate and protein content of humanmilk compared to cow’s milk and the high concentration of the iron-binding protein lactoferrin (34). Owing to the iron stores present at birthand the high bioavailability of iron in human milk, exclusively breastfedfull-term infants usually have a satisfactory iron status until about 6 monthsof age (35,36).
Content (mg/100g) Absorption (%) Amount absorbed(µg/100g)
Cow’s milk 0.02 10 2Cooked rice 0.40 2 8Carrots 0.5 4 20Breast-milk 0.04 50 20Fortified infant formula 0.6 20 120Fortified wheat flour 1.65 20 330Beef 1.2 23 (haem)
1.8 8 (non-haem) 460 (total)Iron-fortified cereal 12.0 4 480
Sources: Hurrell & Jacob (33); Lönnerdal (34); R. Yip, personal communication, 1999.
Table 33. Iron content and bioavailablility in infant foods

115control of iron deficiency
Infant formulaIf infants are not breastfed they should be fed a commercial iron-forti-fied infant formula. The level of fortification differs; in Europe it istypically 6–7 mg/l while in the United States it is 12 mg/l. More recentstudies suggest that even smaller amounts of iron (2–4 mg/l) can pre-vent the development of iron deficiency in infants under 6 months ofage (37), but thereafter a higher iron content is needed. The iron com-pound in commercial infant formula, ferrous sulfate, is well absorbed(Table 33).
Cow’s milk and other dairy productsIn contrast to breast-milk, iron from unmodified cow’s milk is poorlyabsorbed (Table 33). The poor bioavailability is likely to be due to the highcontent of protein and the low content of vitamin C compared to commer-cial infant formula. Furthermore, the early introduction of unmodifiedcow’s milk and other milk products can cause blood loss from the intestinaltract, and thereby have a negative influence on iron status. Many studieshave confirmed that cow’s milk has a negative effect on iron status, espe-cially during the first 6 months of life (16,38,39) and also during the lasthalf of infancy (5,16,40). A decrease (from 21% to 10%) in the percentageof Italian infants with iron deficiency was observed during a 10-year periodwhen breastfeeding at 5 months increased from 22% to 51% and theconsumption of cow’s milk at 6 months decreased from 73% to 8% (41).Similar observations have been made in the Russian Federation(O. Netrebenko, personal communication, 1997).
In this publication it is recommended that cow’s milk should not be givenas a drink before the age of 9 months. Thereafter, if infants are no longerbreastfed, it can be introduced gradually. Infants who are neither beingbreastfed nor receiving a commercial iron-fortified infant formula shouldreceive home-prepared cow’s milk formula together with an iron supple-ment.
During the fermentation of milk, lactic acid and other organic acids areproduced and these increase the absorption of iron. If fermented milk isconsumed at mealtimes, these acids are likely to have a positive effect on theabsorption of iron from other foods.
Other drinksFruit juices, if made from the flesh of fruit, have a high content of vitamin C,which has a positive effect on iron absorption if consumed with meals.Nevertheless, fruit juice in some countries does not contain vitamin C,

116 chapter 6
especially if made by combining jam or fruit compotes with water. Allthe vitamin C is destroyed during the processing of jam and fruit com-potes.
The consumption of tea, which is very common throughout many parts ofthe Region, has been associated with poor iron status because it has anegative effect on iron absorption.
Meat and fishMeat and fish have a positive effect on iron status because they containhaem iron, which is highly bioavailable, and because they have a positiveeffect on the absorption of non-haem iron present in other foods in thesame meal. Thus the available iron from a meal with vegetables can beimproved considerably if a little meat is added. In one study of 7-month-old infants, the absorption of non-haem iron from vegetables was increasedby 50% when meat was added to the meal (42). Meat is not a majorconstituent of a complementary diet of most societies, and large amountsof meat introduced early will result in a high protein intake, which couldhave adverse effects. Only small amounts of meat are necessary to improveiron status, however, and meat should be introduced gradually into the dietfrom the age of about 6 months (see Chapter 8). In an intervention study of8–10-month-old infants, a group receiving 27 g meat per day had signifi-cantly higher haemoglobin values after 2 months than those receiving only10 g meat per day (43). Meat is expensive, but because only small amountsare needed to improve a complementary diet economic constraints shouldnot be a major limiting factor, especially if less expensive sources (notablyliver) are recommended. If it is not economically possible to give meatdaily, giving it only a few times or even once a week is beneficial. Liver, forexample, is both cheap and high in micronutrients such as zinc and vitaminsA, B and D, as well as iron. If puréed, liver therefore represents a goodcomplementary food after about 6 months of age. Fish contains haemiron and therefore has a positive effect on iron status. Fish is also thoughtto contain a “meat factor” with a positive effect on non-haem ironabsorption.
Cereals, pulses and vegetablesNon-haem iron is the principal form of dietary iron, and is found in foodsof plant origin. The main sources are cereals, pulses, beans, vegetables andfruits. Cereals have a higher content of phytates than pulses and, as a result,pulses represent a better source of bioavailable iron. Iron present in leavenedbread (made with yeast) has a greater bioavailability than that found inunleavened bread.

117control of iron deficiency
Iron-fortified infant foodsIron can be defined as one of the “problem nutrients”, for which there isa large discrepancy between the content in complementary foods andthe amount required by the infant (44). The iron content of comple-mentary foods, derived from family foods, is often low and has a poorbioavailability. Changes to complementary feeding practices, as recom-mended in this chapter and throughout the publication, will enhancethe iron content of the diet and the bioavailability of iron in comple-mentary foods, and thus improve the iron status of infants. Under someconditions, however, where there is evidence that the iron requirementsof infants cannot be met by complementary foods derived from familyfoods, iron fortification of those foods will help combat iron defi-ciency.
Iron fortification of complementary foods for infants and young children isthe most common form of targeted fortification. There is good evidence(45–47) that iron added to infant formulas and commercial baby foods iswell absorbed and that fortified complementary foods can help to reducethe prevalence of iron deficiency in infants over 6 months and in youngchildren (33).
Several different iron salts can be used to fortify foods, but there are differ-ences in their efficacy in providing a source of absorbable iron and in theirstorage life. Although the soluble iron fortificants are readily absorbed, theytend to produce undesirable changes in the texture, flavour and smell offood. Ferrous fumarate and succinate have been recommended as ironfortificants for infant cereals because they are well absorbed and do notusually have these organoleptic effects. Milk-based foods may be fortifiedwith ferrous sulfate. Sodium Fe-EDTA has also proven a safe fortificant foruse in populations with endemic iron deficiency. It is stable, resistant to thecommon inhibitors of non-haem iron absorption and improves the ab-sorption of intrinsic iron as well as zinc, but it is expensive (11). MoreoverFe-EDTA fortification should not be used in areas with a high level of leadcontamination because of the risk of increasing lead absorption. Vitamin Ccan be added to counteract the inhibitory effect of phytate in high-extraction-rate cereal-based foods.
A promising approach is to use a multiple micronutrient formulation,especially when other nutrient deficiencies (such as that of vitamin A) arepresent. As yet, there is no agreement on what the composition of such asupplement should be, although it has been suggested that a powder couldbe added to complementary foods at household level.

118 chapter 6
OTHER INTERVENTIONS TO CONTROL IRON DEFICIENCY
A comprehensive programme to control iron deficiency and anaemia in-cludes an appropriate mix of interventions designed to best address localconditions, which are determined by the available infrastructures and dependon the epidemiology of the iron deficiency anaemia. It is important to prioritizeprogramme efforts so that scarce resources can be used most effectively.
Reproductive and obstetric interventionsThe iron stores of the newborn infant can be optimized by ensuring asatisfactory iron status of the mother during pregnancy. Reducing the totalnumber of pregnancies and increasing the time between them has a positiveimpact on the iron status of the mother. Because the iron cost of lactation isgenerally less than that of regular menstruation, the promotion of exclusivebreastfeeding and thereby lactational amenorrhoea will contribute to thecontrol of iron deficiency anaemia in women of reproductive age (48).
Scientific evidence also supports the view that the presence of maternalanaemia does not prevent women from breastfeeding. Furthermore, lacta-tion helps to reduce the likelihood of anaemia in a number of ways.
• Breastfeeding accelerates the contraction of the uterus to its size beforepregnancy, thus reducing the risk of haemorrhage in the immediatepostpartum period and thereby preserving maternal iron stores.
• The iron cost of lactation is generally less than that of menstruation, as aresult of the lactational amenorrhoea produced by exclusive breastfeeding.
• The absorption of iron from the gastrointestinal tract is enhanced inlactating women.
• Lactation increases the mobilization of body iron stores in women.
If women are anaemic during the first half of pregnancy, the risks of lowbirth weight, preterm delivery and perinatal mortality are increased (18). Inaddition, there is good evidence that severe iron deficiency anaemia duringpregnancy adversely affects the iron endowment of the infant at birth (17).A study from Jordan also found that maternal anaemia during late preg-nancy was associated with a significantly higher incidence of anaemia in theoffspring (49).
The high physiological requirements for iron during pregnancy are some-times difficult to meet through the diet. There is therefore a general

119control of iron deficiency
recommendation that pregnant women should routinely receive iron sup-plements. The recommendations from the International Nutritional Anae-mia Consultative Group (INACG), WHO and UNICEF are given inTable 34.
Prevalence of anaemia Dose Duration
< 40% 60 mg iron and 6 months in pregnancy400 µg folic aciddaily
> 40% 60 mg iron and 6 months in pregnancy and400 µg folic acid continuing to 3 monthsdaily postpartum
Note: If 6 months’ duration cannot be achieved in pregnancy, continue to supplement during thepostpartum period for 6 months or increase the dose to 120 mg iron in pregnancy. Where ironsupplements containing 400 µg folic acid are not available, an iron supplement with less folic acidmay be used. Supplementation with less folic acid should be used only if supplements containing400 µg are not available.
Source: Stoltzfus & Dreyfuss (48).
Table 34. Guidelines for iron supplementation in pregnant women
Another low-cost intervention that can reduce anaemia in infants is thedelayed clamping of the umbilical cord at birth. If the umbilical cord is notclamped and ligated until it stops pulsating (about one minute after deliv-ery), more red blood cells are transferred from the placenta to the newlyborn infant. This process can help to prevent iron deficiency in later infancy,because it increases the body iron stores of the infant. According to a studycarried out in Guatemala, infants with delayed cord clamping had signifi-cantly higher haematocrit values and haemoglobin concentrations at 2months than those with early cord clamping (50). Previous studies ondelayed clamping expressed concerns that if the newborn was placed belowthe level of the placenta, adverse effects such as hyperbilirubinaemia, poly-cythaemia and diminished arousal might occur due to the excess transfer ofblood. The study in Guatemala found no evidence of polycythaemia orother adverse health effects associated with delayed clamping when thenewborn was placed at the same level as the placenta.
General fortificationGeneral food fortification uses the existing food production and distri-bution system and, although this is not very costly, additional nutrition

120 chapter 6
education is required (47). The following foods have been fortified: staplefood (wheat flour), commercial infant formula, condiments such as sugarand salt, and milk and milk products.
The addition of iron to foods does not necessarily mean that it will beabsorbed, or that it will help to prevent iron deficiency. Much iron added tocereal food today, particularly reduced elemental iron, is poorly absorbed.For example, soluble iron fortificants such as ferrous sulfate are absorbed tothe same degree as the intrinsic non-haem iron in the diet. Iron fortificantsare therefore poorly absorbed when added to cereal-based diets. Moreover,it should be remembered that the fortification of basic foods such as wheatflour also provides extra iron for adult men and post-menopausal women,who are often not iron-deficient; this could lead to an increased risk ofatherosclerosis and cancer due to increased oxidative stress from the pro-oxidant properties of iron (33). Furthermore, several studies have shown anassociation between high iron stores and cardiovascular disease and non-insulin-dependent diabetes mellitus.
Before introducing iron fortification programmes, the etiology of the irondeficiency in the target population must be established. Fortification of afoodstuff with iron is appropriate only if iron deficiency is related to lowiron intake, low iron bioavailability or both and not, for example, to thepresence of gut parasites (29). While flour is a suitable vehicle for ironfortification in programmes aimed at older children and adults, infants andyoung children do not consume enough flour to achieve a significant posi-tive effect on their iron status.
SupplementationIn some cases, supplementation with iron tablets or iron drops may beconsidered as one way to prevent iron deficiency anaemia, such as in chil-dren 6–24 months of age (see Table 35) and pregnant women, when givenwith appropriate dietary education programmes. Routine supplementa-tion should be considered for high-risk groups such as preterm infants andinfants receiving unmodified cow’s milk and milk products before the ageof 9 months. Major problems of iron supplementation are the lack ofcompliance in cases of long-term administration and gastrointestinal sideeffects, especially with higher dosages (48).
Recently, several studies have compared the efficacy of weekly versus dailyiron supplementation. Weekly supplementation resulted in limited sideeffects and limited risk of oxidative stress, and therefore represents a poten-tially useful long-term preventive measure as long as compliance is

121control of iron deficiency
Table 35. Guidelines for iron supplementation in children aged 6–24 months
Prevalence Dosage Birth Durationof weightanaemia
< 40% 12.5 mg iron and Normal From 6 to 12 months of age50 µg folic acid daily Low From 2 to 24 months of age
> 40% 12.5 mg iron and Normal From 6 to 24 months of age50 µg folic acid daily Low From 2 to 24 months of age
Note: If the prevalence of anaemia in children aged 6–24 months is not known, it should be assumedto be similar to the prevalence of anaemia in pregnant women in the same population. Iron dosageis based on 2 mg iron/kg body weight/day.
Source: Stoltzfus & Dreyfuss (48).
good (11). While research to evaluate these regimens in different popula-tion groups continues, the current recommendation remains daily supple-mentation for young children and pregnant women (48).
Treatment of hookwormIn areas with endemic hookworm infestation, measures to control theparasite should be an integral part of iron deficiency control programmes.These might include prevention through better sanitation, screening pro-grammes and mass treatment. The prevalence and intensity of hookworminfestation increase with age, so that its effect is greatest on the iron status ofschool-age children, adolescents and adults, including pregnant women (48).
Screening for anaemiaDepending on its epidemiology, universal screening for anaemia is advis-able in low-income areas, while selective screening should be used where theprevalence of iron deficiency anaemia is low. Because the iron stores of afull-term infant of normal or high birth weight can meet the body’s ironrequirement for up to 6 months, anaemia screening is of little value beforethis age. An exception is where unmodified cow’s milk, which may pro-voke gastrointestinal bleeding, is used before the age of 6 months. Inpopulations with a high prevalence of iron deficiency anaemia, however,monitoring and treatment programmes should be established.
The measurement of haemoglobin levels in primary care facilities shouldbe reviewed to ensure that an accurate system with minimal reagent
122 chapter 6
requirements is used. Strict attention must be paid to the use of sterile(preferably disposable) lancets for obtaining blood, owing to the danger ofhepatitis and HIV transmission.
REFERENCES1. DEMAEYER, E.M. ET AL. Preventing and controlling iron deficiency
anaemia through primary health care. A guide for health administratorsand programme managers. Geneva, World Health Organization,1989.
2. GILLESPIE, S. Major issues in the control of iron deficiency. Ottawa,Micronutrient Initiative, 1998.
3. DEPARTMENT OF HEALTH, UNITED KINGDOM. Dietary reference valuesfor food energy and nutrients for the United Kingdom. Report of thePanel on Dietary Reference Values of the Committee on Medical Aspectsof Food Policy. London, H.M. Stationery Office, 1991 (Report onHealth and Social Subjects, No. 41).
4. SIIMES, M. A. ET AL. Exclusive breast-feeding for 9 months: risk ofiron deficiency. Journal of pediatrics, 104: 196–199 (1984).
5. MICHAELSEN, K.F. ET AL. A longitudinal study of iron status in healthyDanish infants: effects of early iron status, growth velocity and dietaryfactors. Acta paediatrica, 84: 1035–1044 (1995).
6. SHERRIFF, A. ET AL. Haemoglobin and ferritin concentrations in childrenaged 12 and 18 months. ALSPAC Children in Focus Study Team.Archives of disease in childhood, 80: 153–157 (1999).
7. INTERNATIONAL VITAMIN A CONSULTATIVE GROUP. IVACG statement:vitamin A and iron interactions. Washington, DC, NutritionFoundation, 1996.
8. FOMON, S.J. Iron. In: Fomon, S.J. Nutrition of normal infants. StLouis, MO, Mosby, 1993.
9. BRITISH NUTRITION FOUNDATION. Iron: nutritional and physiologicalsignificance. Report of the British Nutrition Foundation Task Force.London, Chapman & Hall, 1995.
10.HULTHÉN, L.R. & HALLBERG, H.L. Dietary factors influencing ironabsorption – an overview. In: Hallberg, L. & Asp, N.G., ed.Iron nutrition in health and disease. London, John Libbey & Co.,1996.
11. GIBSON, R.S. Technical approaches to combating iron deficiency.European journal of clinical nutrition, 51: 25–27 (1997).
12. HALLBERG, L. & ROSSANDER, L. Effect of different drinks on theabsorption of non-heme iron from composite meals. Human nutrition:applied nutrition, 36: 116–123 (1982).

123control of iron deficiency
13. KALTWASSER, J.P. ET AL. Clinical trial on the effect of regular tea drinkingon iron accumulation in genetic haemochromatosis. Gut, 43: 699–704 (1998).
14. SHARMANOV, A. Anaemia in central Asia: demographic and healthservice experience. Food and nutrition bulletin, 19: 307–317 (1998).
15. NORTH, K. ET AL. Types of drinks consumed by infants at 4 and8 months of age: sociodemographic variations. Journal of humannutrition and dietetics, 13: 71–82 (2000).
16. SULLIVAN, P.B. Cow’s milk induced intestinal bleeding in infancy.Archives of disease in childhood, 68: 240–245 (1993).
17. SINGLA, P.N. ET AL. Fetal iron status in maternal anaemia. Actapaediatrica, 85: 1327–1330 (1996).
18. DALLMAN, P.R. Review of iron metabolism. In: Filer, L.J., ed. Dietaryiron: birth to two years. New York, Raven Press, 1989, pp. 1–18.
19. VERSTER, A., ED. Guidelines for the control of iron deficiency in countriesof the Eastern Mediterranean, Middle East and North Africa. Alexandria,WHO Regional Office for the Eastern Mediterranean, 1996(document WHO-EM/NUT/177, E/G/11.96/1000).
20. GARROW, J.S. ET AL., ED. Human nutrition and dietetics, 10th ed.London, Churchill Livingstone, 1999.
21. SMITH, M. ET AL. Iron accumulation in Alzeimer Disease is a source ofredox-generated free radicals. Proceedings of the National Academy ofSciences of the United States of America, 94: 9866–9868 (1997).
22. SALONEN, J.T. ET AL. High stored iron levels are associated with excessrisk of myocardial infarction in Western Finnish men. Circulation, 86:803–811 (1992).
23. TUOMAINEN, T.P. ET AL. Association between body iron stores and therisk of acute myocardial infarction in men. Circulation, 97: 1461–1466 (1998).
24. SALONEN, J.T. ET AL. Relation between iron stores and non-insulindependent diabetes in men: case-control study. British medical journal,317: 727–730 (1999).
25. TUOMAINEN, T.P. ET AL. Body iron stores are associated with seruminsulin and blood glucose concentrations: population study in 1013eastern Finnish men. Diabetes care, 20: 426–428 (1997).
26. NELSON, R.L. ET AL. Body iron stores and risk of colonic neoplasia.Journal of the National Cancer Institute, 86: 455–466 (1994).
27. STEVENS, R.G. ET AL. Body iron stores and the risk of cancer. NewEngland journal of medicine, 319: 1047–1052 (1988).
28.Management of severe malnutrition: a manual for physicians andother senior health workers. Geneva, World Health Organization,1999.

124 chapter 6
29. GILLESPIE, S. & JOHNSTON, J.L. Expert Consultation on AnemiaDeterminants and Interventions. Ottawa, Micronutrient Initiative, 1998.
30. PARKS, Y.A. & WHARTON, B.A. Iron deficiency and the brain. Actapaediatrica (Scandinavia supplement), 361: 71–77 (1989).
31. LOZOFF, B. ET AL. Does preventing iron deficiency anemia improvedevelopmental test scores? Ann Arbor, MI, Center for Human Growthand Development, University of Michigan, 1996.
32. MOFFATT, M.E. ET AL. Prevention of iron deficiency and psychomotordecline in high-risk infants through the use of iron-fortified infantformula: a randomized clinical trial. Journal of pediatrics, 125: 527–534 (1994).
33. HURRELL, R.F. & JACOB, S. Role of the food industry in iron nutrition:iron intake from industrial food products. In: Hallberg, L. &Asp, N.G., ed. Iron nutrition in health and disease. London, JohnLibbey & Co., 1996.
34. LÖNNERDAL, B. Breastfeeding and formulas: the role of lactoferrin. In:Hallberg, L. & Asp, N.G., ed. Iron nutrition in health and disease.London, John Libbey & Co., 1996.
35. PISACANE, A. ET AL. Iron status in breast-fed infants. Journal of pediatrics,127: 429–431 (1995).
36. DEWEY, K.G. ET AL. Effects of age of introduction of complementaryfoods on iron status of breast-fed infants in Honduras. American journalof clinical nutrition, 67: 878–884 (1998).
37. HERNELL, O. & LÖNNERDAL, B. Iron requirements and prevalence ofiron deficiency in term infants during the first six months of life. In:Hallberg, L. & Asp, N.G., ed. Iron nutrition in health and disease.London, John Libbey & Co., 1996.
38. ZIEGLER, E.E. ET AL. Cow milk feeding in infancy: further observationson blood loss from the gastrointestinal tract. Journal of pediatrics, 116:11–18 (1990).
39. ROBSON, W.L. ET AL. The use of cow’s milk in infancy. Pediatrics, 91:515–516 (1993).
40. ZLOTKIN, S.H. Another look at cow milk in the second six months oflife. Journal of pediatric gastroenterology and nutrition, 16: 1–3 (1993).
41. SALVIOLI, G.P. ET AL. Iron nutrition and iron stores changes in Italianinfants in the last decade. Annali del’Istituto Superiore di Sanità, 31:445–459 (1995).
42. ENGELMANN, M.D. ET AL. The influence of meat on non-haem ironabsorption in infants. Paediatric research, 43: 768–773 (1998).
43. ENGELMANN, M.D. ET AL. Meat intake and iron status in late infancy:an intervention study. Journal of pediatric gastroenterology and nutrition,26: 26–33 (1998).
125control of iron deficiency
44. Complementary feeding of young children in developing countries: a reviewof current scientific knowledge. Geneva, World Health Organization,1998 (document WHO/NUT/98.1).
45. RUSH, D. ET AL. The national WIC evaluation: evaluation of the specialsupplemental food program for women, infants and children.Background and Introduction. American journal of clinical nutrition,48 (Suppl. 2): 389–393 (1998).
46. WALTER, T. ET AL. Prevention of iron-deficiency anaemia: comparisonof high- and low-iron formulas in term healthy infants after six monthsof life. Journal of pediatrics, 132: 635–640 (1998).
47. YIP, R. The challenge of improving iron nutrition: limitations andpotentials of major intervention approaches. European journal of clinicalnutrition, 51: 16–24(1997).
48. STOLTZFUS, R.J. & DREYFUSS, M.L. Guidelines for the use of ironsupplements to prevent and treat iron deficiency anemia. Washington,DC, International Nutritional Anemia Consultative Group, 1998.
49. KILBRIDE, J. ET AL. Anaemia during pregnancy as a risk factor for iron-deficiency anaemia in infancy: a case-control study in Jordan.International journal of epidemiology, 28: 461–468 (1999).
50.GRAJEDA, R. ET AL. Delayed clamping of the umbilical cord improveshaematological status of Guatemalan infants at 2 months of age.American journal of clinical nutrition, 65: 425–431 (1997).

introductionchapter 7
Breastfeeding andalternatives
All infants should be exclusively breastfed from birth to about 6 months of age,and at least for the first 4 months of life.
Breastfeeding should preferably continue beyond the first year of life, and inpopulations with high rates of infection continued breastfeeding throughoutthe second year and longer is likely to benefit the infant.
Each country should support, protect and promote breastfeeding by achievingthe four targets outlined in the Innocenti Declaration: appointment of anappropriate national breastfeeding coordinator; universal practice of the BabyFriendly Hospital Initiative; implementation of the International Code of Mar-keting of Breast-milk Substitutes and subsequent relevant resolutions of the WorldHealth Assembly; and legislation to protect the breastfeeding rights of workingwomen.
THE IMPORTANCE OF BREASTFEEDING
Human milk is the best food for babies and provides all the nutrientsneeded for about the first 6 months (26 weeks) of life. Moreover, it con-tains nutrients that serve the unique needs of the human infant, such ascertain essential polyunsaturated fatty acids, certain milk proteins, and ironin a readily absorbable form. Human milk also contains immunologicaland bioactive substances, absent from commercial infant formulas, whichconfer protection from bacterial and viral infections and may aid gut adap-tation and development of the newborn.
To clarify, “6 months” means the end of the first 6 months of life, that iswhen the infant is 26 weeks old, as opposed to the start of the sixth monthof life (21–22 weeks of age). Likewise, “4 months” refers to the end and notto the start of the fourth month of life. Breastfeeding refers to breast-milk takendirectly from the breast and should be distinguished from breast-milk feeding.
NUTRITIONAL BENEFITS OF BREASTFEEDING
Human milk is reliably superior to all substitutes, including commercial

128 chapter 7
infant formula. The composition of human milk is not constant but changesduring feeds, according to the time of day, and during the course of lacta-tion. The total volume of maternal milk production and infant milk intakeis highly variable, and although a mean milk intake by infants is oftenquoted as 650–850 ml per day, values may range from very little to morethan 1 litre per day, depending almost entirely on the frequency and effec-tiveness of suckling. Breast-milk intake by the infant increases during theperiod of exclusive breastfeeding, reaching a plateau of about 700–800 mlper day after about 1–2 months, and only increasing slightly thereafter. Thecomposition of human milk compared to that of commercial infant for-mula, cow’s milk and home-prepared formula is shown in Table 36.
Component Mean Infant Cow’s milk Home-values formulaa prepared
for mature formulab
human milk
Energy (kJ) 280 250–315 276 221(kcal) 67 60–75 66 63
Protein (g) 1.3c 1.2–1.95 3.2 2.1Fat (g) 4.2 2.1–4.2 3.9 2.5Carbohydrate (g) 7 4.6–9.1 4.6 8.0Sodium (mg) 15 13–39 55 36Chloride (mg) 43 32.5–81 97 63Calcium (mg) 35 59 120 75Phosphorus (mg) 15 16.3–58.5 92 60Iron (µg) 76d 325–975e 60 39Vitamin A (µg) 60 39–117 35 23Vitamin C (mg) 3.8 5.2 1.8 1.2Vitamin D (µg) 0.01 0.65–1.63 0.08 0.05
Table 36. Composition (per 100 ml) of mature human milk and cow’s milk,and compositional guidelines for infant formula
a Acceptable range (one value only indicates minimum permissible values).b Calculated assuming the recipe for home-prepared formula given on page 158.c True protein = 0.85 g per 100 ml (excluding non-protein nitrogen), although a proportion of thenon-protein nitrogen is used for the maintenance and growth of infants.d Iron in breast-milk is highly bioavailable, with absorption of 50–70%.e Iron in infant formula is poorly bioavailable, with only about 10% absorption.
Source: Department of Health, United Kingdom (1).

129breastfeeding and alternatives
FatBreast-milk has an energy density of approximately 280 kJ (67 kcal)/100 ml.Fat represents around 50% of its total energy content. The foremilk, at thebeginning of each feed, is more watery and higher in lactose and has arelatively low fat concentration, which rises so that the most energy-densemilk is secreted at the end of the feed. This hindmilk therefore makes a vitalcontribution to the infant’s energy intake. The fat-rich milk flows moreslowly but provides important energy and nutrients, so feeds should not beended when the flow of milk slows or the infant’s suckling becomes lessvigorous.
The proportions of fatty acids in cow’s milk and human milk are verydifferent (Table 36). Compared with cow’s milk, human milk has a greaterproportion of unsaturated fatty acids and a higher concentration of essentialfatty acids. Furthermore, the long-chain polyunsaturated fatty acids(LCPUFAs) in breast-milk are better absorbed than those in cow’s milk.Moreover, evidence suggests that LCPUFAs are important for normalneurodevelopment and visual cortical function. Because the newborn’scapacity to convert essential fatty acids to LCPUFAs is limited during thefirst few months of life, infants rely on the efficient transfer of LCPUFAsfrom the mother, prenatally via the placenta and postnatally from breast-milk. Milk fats are also the vehicle for the uptake of the fat-soluble vitaminsA, D, E and K (see below).
CarbohydratesThe main carbohydrate in human milk is lactose, which accounts for about40% of its total energy, and is efficiently (> 90%) digested and absorbed inthe small intestine under the influence of lactase from the epithelium.Unabsorbed lactose passes to the large bowel where it is fermented bycolonic bacteria to short-chain fatty acids and lactate. These are absorbedand make a contribution to energy intake and reduce colonic pH, enhanc-ing the absorption of calcium. In addition, lactose promotes the growth oflactobacilli and may help to develop a favourable colonic flora that protectsagainst gastroenteritis. During acute gastrointestinal infection, formula-fedinfants sometimes become lactose-intolerant due to epithelial damage andloss of lactase activity and may have to change to a lactose-free formula.Breastfed infants, however, remain able to tolerate the high lactose contentof human milk and should continue to be breastfed (2).
Human milk also contains significant concentrations of oligosaccharides.These components amount to around 15 g/l, and it is calculated thatbreastfed babies daily ingest several grams of oligosaccharides. Around 40%
130 chapter 7
are excreted in the faeces, and a small percentage (1–2%) in the urine. Sinceit is hypothesized that the remaining percentage is in part metabolized bythe intestinal flora, there is speculation that these components act as a formof fibre in the diet of breastfed infants. These oligosaccharides may have aprimary function in the defence against viruses and bacteria or their toxinsand in promoting the growth of the colonic flora, including strains withpossible probiotic effects such as the bifidobacteria.
ProteinThe protein content of breast-milk is appropriate for the nutritional needsof infants. It is less than a third that of cow’s milk. Moreover, human milkis whey-predominant, whereas cow’s milk is casein-predominant with only20% whey proteins. Of the human whey proteins, α-lactalbumin andlactoferrin are the most abundant, and represent a complete source ofessential amino acids for the human infant. In contrast, the major wheyprotein found in cow’s milk (and thereby in infant formula), is β-lactoglobulin, which is not present in human milk and can evoke an adverseantigenic reaction when fed to infants. The casein in human milk haschemical properties that make it easier for the human infant to digestthan the casein found in the milk of other mammals. A proportion ofmilk protein, particularly in colostrum, is in the form of theimmunoprotective proteins immunoglobin A, lactoferrin, lysozymeand other macromolecules that play a part in protecting the infant frommicrobiological infections.
Vitamins and mineralsAlthough women of marginal nutritional status can produce milk of ad-equate quantity and quality for normal infant growth, optimal micronutri-ent quality of human milk and therefore optimal micronutrient status ofthe infant depends on the mother having good nutritional status. To predictthe risk of infant or maternal micronutrient deficiencies and the potentialimpact of maternal supplementation on breast-milk composition, and toplan appropriate interventions, it is useful to classify micronutrients inbreast-milk into two groups (Table 37).
The concentration of those nutrients in human milk that are most affectedby the mother’s dietary intake are the water-soluble vitamins and, to a lesserextent, the fat-soluble vitamins. In contrast, with few exceptions, neitherdietary maternal intake nor maternal stores affect the amount of mineralssecreted in breast-milk. Where maternal intake can affect the secretion ofnutrients into milk, there is usually a plateau above which a further increasein intake will have no effect in increasing their concentrations in milk.

131breastfeeding and alternatives
Micronutrients affected by Micronutrients not affected bymaternal status maternal status
Thiamin ZincRiboflavin IronVitamin B6 FolateVitamin B12 CalciumVitamin DVitamin AIodineSelenium
Characteristics Characteristics• Low maternal intake or status • Maternal intake (including
reduces the amount of these supplements) and deficiency havenutrients secreted in milk, and low relatively little effect on theirbreast-milk concentrations can secretion in breast-milk.adversely affect infant development. • Because milk concentrations are not
• Infant stores of most of these reduced when the mother is deficient,nutrients are low and readily she is vulnerable to further depletiondepleted, increasing the infant’s during lactation.dependence on a consistently • Maternal supplementation withadequate supply from breast-milk these nutrients during lactation isand/or complementary foods. more likely to benefit the mother
• The concentration in breast-milk can than her infant.be rapidly restored by increasing • Poor maternal intake or stores ofmaternal intake. these nutrients will have little effect
on the amounts that infants willrequire from complementary foods.
Source: World Health Organization (3).
Table 37. The effect of maternal intake and status on the micronutrientcontent of breast-milk
Micronutrient deficiencies with clinical signs are rare in exclusively breastfedinfants during the first 6 months of life. Provided that the mother’s micro-nutrient status is satisfactory during pregnancy and lactation, exclusivelybreastfed infants under 6 months of age do not require vitamin or mineralsupplementation. Where micronutrient deficiencies exist, however, dietaryimprovement or supplementation of the mother is likely to be effective,and will benefit both mother and infant.
132 chapter 7
Vitamin AVitamin A is vital for growth and for the development and differentiationof tissues, particularly the epithelia of the gastrointestinal and respiratorytracts. Human milk, and particularly colostrum, represents a good sourceof vitamin A. Breastfed infants rarely show signs of deficiency even at lowintakes, but may have subclinical deficiency if maternal vitamin A status ispoor.
Vitamin D
Vitamin D is primarily obtained through photosynthesis in the skin by theaction of ultraviolet radiation. The vitamin D status of the newborn isdependent on the vitamin D status of the mother during both pregnancyand lactation. If it is poor, infant stores will be low and vitamin D levels inthe breast-milk will be inadequate unless the infant receives sufficient expo-sure to ultraviolet light.
Folate
Breast-milk has a high folate concentration, which is maintained at theexpense of maternal stores (4). Breast-milk folate concentrations do not fallunless the mother is severely depleted, and in the parts of Europe wheresupplementation of all pregnant and lactating women is a policy, folatedeficiency is unlikely.
Iron
Despite the relatively low concentration of iron in human milk (which isnevertheless highly bioavailable) there is little risk of iron deficiency anae-mia before 9 months of age in infants of normal birth weight who arebreastfed exclusively for at least 4 months and who continue to be breastfedon demand (3). Iron concentrations in human milk are not correlated withmaternal iron status and are relatively unaffected by the iron content of thematernal diet. Low haemoglobin levels or anaemia in the mother are not acontraindication to breastfeeding. In fact, maternal iron losses throughmilk during breastfeeding are less than those during menstruation. Thus,breastfeeding helps to prevent anaemia and anaemic mothers should berecommended to continue breastfeeding.
ZincLike that of iron, the concentration of zinc in breast-milk is relatively low,but it is highly bioavailable and is much better absorbed than zinc in com-mercial infant formula or cow’s milk. The zinc requirement of formula-fedinfants may thus be about one third greater than that of exclusively breastfedinfants. Zinc deficiency is rare in exclusively breastfed infants before

133breastfeeding and alternatives
6 months of age. During the first 6 months of lactation, the zinc concentra-tion in human milk is unaffected by variations in dietary zinc intake (in-cluding supplements) or maternal zinc status in well nourished women.Consumption of non-breast-milk foods by an infant can significantly re-duce the bioavailability of zinc and iron in breast-milk.
IodineThere is little information on the iodine content of breast-milk in regionswhere dietary intakes of iodine are low. It is possible that in iodine defi-ciency the mammary gland sequesters enough iodine from maternal plasmato prevent breast-milk levels from falling significantly.
NON-NUTRITIONAL BENEFITS OF BREASTFEEDING
In addition to its nutritional benefits, breastfeeding also confers a numberof non-nutritional advantages to young infants (Table 38). These includeprotection against various acute and chronic illnesses, and enhancedphysiological and behavioural development. These effects have beenevaluated in several reviews (5,6,8) and the most important are summa-rized below.
InfectionsBreastfeeding protects infants from infections by two mechanisms. First, itlowers or eliminates exposure to bacterial pathogens transmitted by con-taminated food and fluids. Second, human milk contains antimicrobialfactors and other substances (Table 39) that strengthen the immature im-mune system and protect the digestive system of the newborn infant,thereby conferring protection against infections, particularly those of thegastrointestinal and respiratory tracts. Colostrum (milk produced in thefirst few days after birth) is especially rich in protective proteins, and shouldnot be discarded.
The principal immunoproteins in human milk are secretory immunoglobu-lin A and lactoferrin. The former acts at mucosal surfaces to protect themfrom injury by ingested microbial antigens. The latter is an iron-bindingprotein that competes with bacteria for iron, reducing bacterial viabilityand thereby the risk of enteric infections, particularly those caused byEscherichia coli and Staphylococus spp. These immunological factors are notpresent in commercial infant formula or complementary foods. Formula-fed infants therefore enjoy less protection against infection. Human milkalso contains many other defence and trophic factors that may play a role inthe protection and maturation of the digestive tract.

134 chapter 7
There is abundant evidence that exclusive breastfeeding for around the first6 months reduces both infant morbidity and mortality. These beneficialeffects are more pronounced where infection rates are greatest and hygieneand sanitation are poor (9–12), although benefits have also been foundwith respect to respiratory illness in industrialized countries (13,14). Inaddition, infants tend to continue to accept breast-milk during episodes ofdiarrhoea, whereas consumption of non-breast-milk foods and fluids may
Infant• Reduced incidence and duration of diarrhoeal illnesses.• Protection against respiratory infection.• Reduced occurrence of otitis media and recurrent otitis media.• Possible protection against neonatal necrotizing enterocolitis, bacteraemia,
meningitis, botulism and urinary tract infection.• Possible reduced risk of auto-immune disease, such as diabetes mellitus type I
and inflammatory bowel disease.• Possible reduced risk of sudden infant death syndrome.• Reduced risk of developing cow’s milk allergy.• Possible reduced risk of adiposity later in childhood.• Improved visual acuity and psychomotor development, which may be caused by
polyunsaturated fatty acids in the milk, particularly docosahexaenoic acid.• Higher IQ scores, which may be the result of factors present in milk or to greater
stimulation.• Reduced malocclusion due to better jaw shape and development.
Mother• Early initiation of breastfeeding after birth promotes maternal recovery from
childbirth; accelerates uterine involution and reduces the risk ofhaemorrhaging, thereby reducing maternal mortality; and preserves maternalhaemoglobin stores through reduced blood loss, leading to improved ironstatus.
• Prolonged period of postpartum infertility, leading to increased spacingbetween successive pregnancies if no contraceptives are used.
• Possible accelerated weight loss and return to prepregnancy body weight.• Reduced risk of premenopausal breast cancer.• Possible reduced risk of ovarian cancer.• Possible improved bone mineralization and thereby decreased risk of
postmenopausal hip fracture.
Source: adapted from Heinig & Dewey (6,7).
Table 38. Health advantages of breastfeeding for infants and mothers
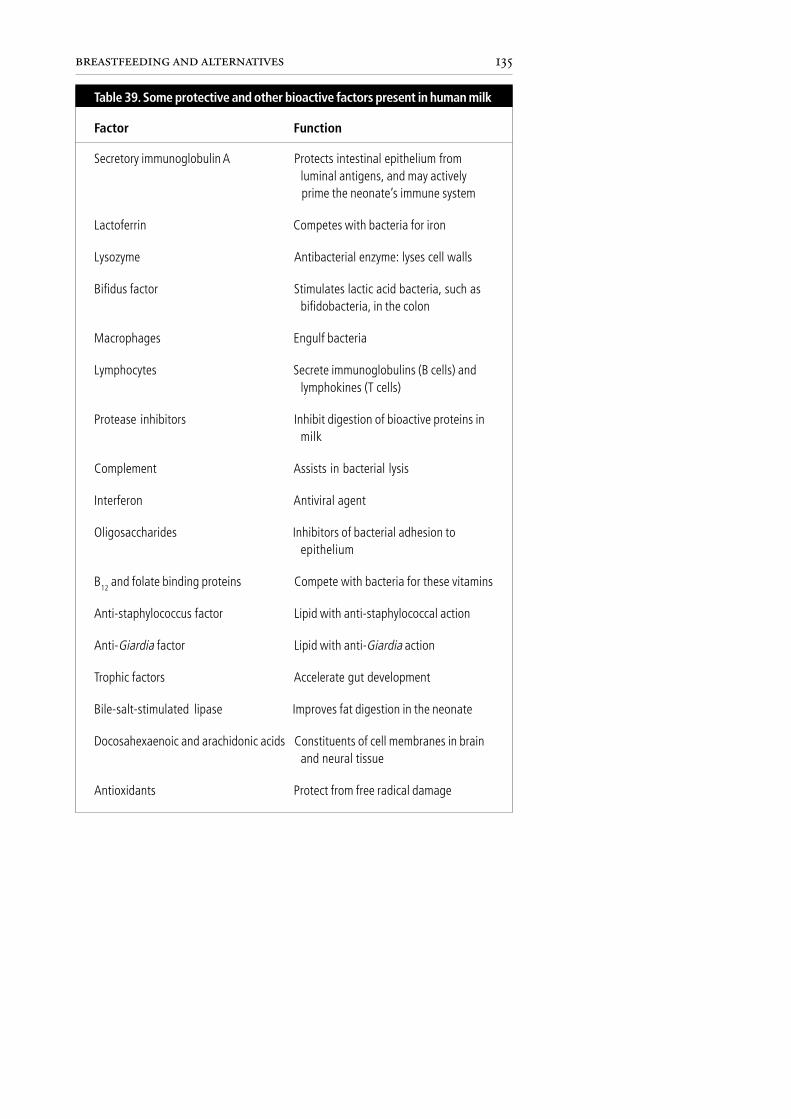
135breastfeeding and alternatives
Factor Function
Secretory immunoglobulin A Protects intestinal epithelium fromluminal antigens, and may activelyprime the neonate’s immune system
Lactoferrin Competes with bacteria for iron
Lysozyme Antibacterial enzyme: lyses cell walls
Bifidus factor Stimulates lactic acid bacteria, such asbifidobacteria, in the colon
Macrophages Engulf bacteria
Lymphocytes Secrete immunoglobulins (B cells) andlymphokines (T cells)
Protease inhibitors Inhibit digestion of bioactive proteins inmilk
Complement Assists in bacterial lysis
Interferon Antiviral agent
Oligosaccharides Inhibitors of bacterial adhesion toepithelium
B12 and folate binding proteins Compete with bacteria for these vitamins
Anti-staphylococcus factor Lipid with anti-staphylococcal action
Anti-Giardia factor Lipid with anti-Giardia action
Trophic factors Accelerate gut development
Bile-salt-stimulated lipase Improves fat digestion in the neonate
Docosahexaenoic and arachidonic acids Constituents of cell membranes in brainand neural tissue
Antioxidants Protect from free radical damage
Table 39. Some protective and other bioactive factors present in human milk
136 chapter 7
decrease. Breastfeeding therefore both diminishes the negative impact ofillness on nutritional status and provides a clean source of fluid to counterdehydration.
The concentrations of anti-infective substances in breast-milk are sustainedbeyond the first year of life and continue to offer significant protectionagainst infection thereafter. In addition, the production of immunoproteinsappears to be independent of women’s nutritional and socioeconomic sta-tus (15). In a number of studies from countries with a high prevalence ofinfection, infants that breastfeed into their second year have significantlyimproved survival compared to those that have ceased breastfeeding(9,16–18).
The evidence that breastfeeding protects against infectious disease is great-est for diarrhoeal disease: formula-fed infants suffer a significantly highernumber of diarrhoeal episodes than infants who are breastfed. The risk ofnecrotizing enterocolitis, a common gastrointestinal disease in neonatalintensive care units, is also greater in formula-fed infants than in infantsreceiving human milk, and the protective effects of breast-milk remain – ata reduced level – even when infants are only partially breastfed (19).
There is strong evidence that breastfeeding also protects against lower respi-ratory disease. In a recent study (20), breastfeeding was found to protectyoung children against pneumonia, especially in the first months of life.Formula-fed infants were 17 times more likely to be admitted to hospitalfor pneumonia than breastfed infants. Furthermore, a number of studies(21–24) have demonstrated a protective effect of breastfeeding againstotitis media. Breastfeeding may also be protective against bacteraemia andmeningitis (25–27), botulism (28) and urinary tract infection (29), al-though the evidence is less strong.
Active stimulation of the immune systemMost of the protective effects of breastfeeding against infectious disease arepassive, that is, the immunoprotective factors in breast-milk protect themucosal surfaces of the gastrointestinal and respiratory tracts and therebyreduce the risk of infection. There is also evidence, however, that breast-milk has an active influence on the infant’s immune system. At 4 months ofage, the thymus gland of breastfed infants is twice the size of that offormula-fed infants (30). Furthermore, the response to certain vaccines isbetter in breastfed than in formula-fed infants (31). There is also evidencethat the protective effect against infection lasts for years after breastfeedingceases. The factor in human milk responsible for the priming of the infant’s
137breastfeeding and alternatives
own immune system is not known, but candidates are T and B lymphocytes,anti-ideotypic antibodies, cytokines or growth factors (31).
Chronic diseaseStudies investigating the impact of infant feeding on chronic illness arelimited by their retrospective design. An inverse relationship betweeninsulin-dependent diabetes mellitus (IDDM) and breastfeeding durationhas been reported (32–34). IDDM is an autoimmune disease, and it ispossible that breastfeeding has a positive influence on the infant’s immunesystem. Early exposure (< 4 months of age) to cow’s milk protein may alsoact as a trigger for the early onset of IDDM (35–37). There is also someevidence to suggest that breastfeeding may protect against Crohn’s disease,ulcerative colitis (38) and childhood cancers (39), such as leukaemia (40).Further investigations are needed to confirm these claims.
AdiposityIt has been argued that breastfeeding prevents adiposity later in childhood.In a study from Germany (41) of more than 13 000 children, those thathad been breastfed longest were significantly less likely to be obese at 5–6 years of age. Other studies have reported a similar effect.
AllergyIt has been hypothesized that breastfeeding protects against allergic disease(42). First, human milk provides immunological factors that may protectthe infant from exposure and reaction to antigens. Second, breastfeedingresults in delayed exposure to many potentially allergenic substances presentin foods. Breastfeeding protects against the development of cow’s milkallergy, but the question of whether it protects against other allergic dis-eases, and whether protection against the symptoms of food allergy extendsbeyond the period of exclusive breastfeeding, remains unresolved (43–45).More studies are required to define the complex relationship between in-fant feeding and atopic disease.
Sudden infant death syndromeIn several studies, lack of breastfeeding has been a significant risk factor forsudden infant death syndrome, and has remained significant after control-ling for potentially confounding factors (46,47).
Breastfeeding and cognitive developmentBeneficial long-term effects of breastfeeding on IQ and cognitive develop-ment have been reported in several studies. In a meta-analysis of 20 studiescomparing differences in cognitive development between breastfed and
138 chapter 7
formula-fed infants, breastfed infants had a three-point advantage afteradjusting for confounders such as socioeconomic status and maternal edu-cation (48).
Maternal–infant bonding and infant developmentBreastfeeding favours early bonding between mother and infant, and this islikely to play a key role in the development of optimal parental caringbehaviour (49). Breastfeeding mothers may be more closely attuned andresponsive to their infants than those who bottle-feed. Furthermore, it ispossible that a young woman at risk of abusing her child might establish amore favourable relationship if given early support for breastfeeding, andthis area deserves exploration (50). Beneficial effects of breastfeeding onlong-term development and IQ have been reported in both preterm andfull-term infants, but it is very difficult to distinguish the effects of feedingfrom those of other factors, including the parenting skills, IQ and educa-tion of the parents. A child that is not breastfed may receive less attentionfrom and stimulation by his or her mother. Mothers who have chosen notto breastfeed should be encouraged to interact with their babies to the sameextent as those who have, so as to facilitate bonding and to stimulate theinfant’s language and psychosocial development.
Lactational amenorrhoeaLactational amenorrhoea refers to the inhibitory effects of breastfeeding onovulation during the postpartum period. The duration of postpartuminfertility is extended by breastfeeding in proportion to the frequency andduration of infant suckling. Suckling increases the secretion of prolactinand inhibits that of gonadotrophin releasing hormone. The interactionbetween prolactin and gonadotrophin-releasing hormone prevents the re-sumption of the normal pre-ovulatory surge in luteinizing hormone, therebysuppressing ovulation.
Reducing maternal fertility extends the intervals between successive preg-nancies and leads to a decrease in the number of births, if other forms ofcontraception are not used. Increasing the space between births so thatinfants are conceived 18–23 months after a previous live birth (51) isstrongly associated with improved child health and survival and has a numberof positive effects on maternal health (Table 38). The contraceptive effectof breastfeeding is estimated to be 98% for the first 6 months postpartum,in women who are amenorrhoeic and either fully or nearly fully breastfeedingon demand (52–54). Exclusive, on-demand breastfeeding therefore repre-sents a valuable method of contraception where other methods are notreadily available or acceptable. It should therefore be promoted not only for
139breastfeeding and alternatives
the direct advantages it confers to the infant in terms of nutrition andprotection from disease, but also for the indirect effects it exerts on mater-nal fertility and consequently on child spacing, and the health and survivalof future children (55).
Breastfeeding and maternal postpartum weight lossInvestigations of the relationship between lactation and maternal post-partum weight have produced conflicting results, largely because of limita-tions in the design of studies. Of those studies that defined breastfeeding aslasting more than 3 months, however, the majority reported a positiveassociation between weight loss and the duration of lactation while theremaining two found no association (7). There would appear to be noreliable evidence to support fears that breastfeeding increases the risk ofmaternal obesity, and it is likely that breastfeeding helps mothers regaintheir pre-pregnancy weight. Gradual weight loss (up to 2 kg per month)during lactation is normal.
IMPORTANCE OF MATERNAL NUTRITION
Women of poor nutritional status can produce sufficient milk of adequatequantity and quality to support normal infant growth. Nevertheless, ma-ternal nutrient stores will be depleted and this can be detrimental if theintervals between pregnancies are short and there is insufficient time forthem to be replenished. Furthermore, there is evidence that the fat contentof breast-milk may be compromised if maternal fat stores are low. Toensure an optimal quality and quantity of breast-milk without compro-mising the health of the mother, it is thus important to optimize maternalnutritional status throughout pregnancy and lactation.
The increases in the mother’s tissue mass and metabolic activity associatedwith pregnancy lead to an increase in her energy requirements. It has beenestimated that the average energy cost of pregnancy for women with a pre-pregnancy weight of approximately 60 kg is around 293 MJ (70 000 kcal)(56). This apparent extra energy requirement, however, is rarely matched byan equivalent need to increase food intake, and direct measurements offood intake during pregnancy usually show only a small increase in the thirdtrimester and virtually no change before then. The increase in energy re-quirements may therefore be balanced by a combination of (a) a decrease inactivity to offset the increased energy costs of movement, (b) variousenergy-saving metabolic adaptations such as a reduction in postprandialthermogenesis and a reduction in basal metabolic rate, and (c) hypertrophyof the gastrointestinal absorptive surface area. Women should try to achieve a
140 chapter 7
healthy body weight and optimal nutritional status before becoming preg-nant, and while pregnant should aim for a desirable increase in body weight.
The energy costs of lactation are much more than those of pregnancy.The major determinant of the extra energy needed during lactation isthe energy content of the milk produced. Assuming a milk productionof approximately 750 ml/day and a gross energy content of milk ofabout 2.8 kJ (0.67 kcal)/ml, approximately 2.1 MJ (500 kcal)/day aresecreted in milk. Additional energy will also be required to cover the costs ofsynthesizing breast-milk. It is therefore estimated that the additional dietaryenergy needs of lactation are approximately 1.4–1.8 MJ (325–425 kcal) perday above pre-pregnancy levels while full, on-demand breastfeeding per-sists and the extra maternal energy stores laid down during pregnancy re-main available.
Good maternal nutrition during pregnancy and lactation to meet increasedenergy costs is therefore highly desirable. Nevertheless, there is generalinternational consensus, based on scientific evidence from developing coun-tries where protein–energy deficiency and undernutrition are widespread,that even underweight and/or anaemic women can sustain adequate milkproduction for as long as is recommended. Indeed, results from the major-ity of studies suggest that, unless the mother is both extremely thin (bodymass index < 18.5) and in sustained negative energy balance (57), adverseeffects of undernutrition on lactation are unlikely.
In many parts of the WHO European Region there is a strong belief, oftenperpetuated by health professionals, that loss of maternal weight and/oranaemia are contraindications to breastfeeding. Consequently some healthprofessionals believe that a large number of women are not capable ofbreastfeeding, and have discouraged it and instead have promoted the use ofcommercial infant formula. Health professionals require education andtraining to provide them with the information they need to reassure moth-ers that neither weight loss nor being underweight or anaemic are reasonsfor not breastfeeding. It is nevertheless important that women receive ad-vice on how to improve their nutritional status. All women of childbearingage must be made aware of the importance of consuming a balanced diet,including plenty of fresh fruit and vegetables (more than 400 g/day). Thetraining module on “Healthy food and nutrition for women and theirfamilies” (58), including the booklet for mothers Healthy eating duringpregnancy and breastfeeding, are available from the Regional Office andprovide a useful guide, as do the CINDI dietary guide and the WHO foodpyramid (59). It should be remembered that low rates of breastfeeding in

141breastfeeding and alternatives
most countries of the Region are not due to physiological barriers but tosocial and psychological ones. Thus, improvements in nutritional statusand the prevention of anaemia will not alone automatically result in im-proved breastfeeding practices. Ways in which breastfeeding rates can beincreased are discussed in more detail on pages 146–152.
Substantial expansion of the erythrocyte mass increases iron requirementsin the second and third trimesters of pregnancy and iron deficiency anaemiaof pregnancy may be common, especially where iron intake or absorption islow and/or iron requirements are increased. It is therefore important toinform women which foods are good sources of iron and to recommendthose that contain both iron and its enhancers. Excessive consumption offoods rich in inhibitors of iron absorption at the same time as foods con-taining non-haem iron should also be discouraged. Current recommenda-tions can be found in Chapter 6, which is devoted to a fuller discussion ofthe iron needs and metabolism of the infant.
PRACTICAL ASPECTS OF BREASTFEEDING
Establishing breastfeedingImmediately after birth the healthy baby instinctively searches for food. Inthe first couple of hours of life outside the womb, the baby is alert, activeand ready to feed, and ideally breastfeeding should begin within the firsthour. To facilitate this process, the baby should remain in skin-to-skincontact with the mother from immediately after birth until the end of thefirst feed. Mothers should be encouraged and helped to have skin-to-skincontact with their babies as much as possible during the first days afterdelivery, and mother and baby should be accommodated together. Thepractices that help and hinder breastfeeding are outlined in Table 40.
Good positioning of the baby’s body is a prerequisite for good attachmentat the breast and thereby adequate milk production and intake. Most diffi-culties can be avoided if good attachment and positioning are achievedduring the first few feeds. Fig. 15 illustrates the difference between a wellattached and poorly attached baby at the breast. The WHO/UNICEFtraining course on breastfeeding counselling (61) and WHO’s practicalguide for health workers (62) provide valuable information on attachmentand positioning, and on breastfeeding in general.
Breastfeeding on demand is the key to establishing and maintaining opti-mum lactation. As long as the baby is adequately positioned and attached atthe breast, and the mother breastfeeds frequently (8–12 times in 24 hours),

142 chapter 7
Practices that can hinder Practices that can helpbreastfeeding breastfeeding
Separation of mother and baby Skin-to-skin contact between mother andbaby
Delaying the first feed Breastfeeding soon after birth (within1 hour)
Restricting the frequency of feeding Frequent, on-demand (baby-led) feeding
Feeding to a strict timetable Letting the baby come off the breastspontaneously
Taking the baby off the breast before the Good positioning and attachment of thebaby is finished baby at the breast
Giving other fluids before the first Exclusive breastfeedingbreastfeed
Giving supplementary feeds of artificial Exclusive breastfeedingmilk
Giving plain water, dextrose, glucose or Exclusive breastfeedingsucrose water or “teas” between feeds
Saying anything that makes a mother Building a mother’s confidence throughdoubt her ability to produce milk kindness and encouragement
Giving free samples of commercial babymilks
Isolating the mother from those whosupport breastfeeding
Using nipple shields, bottle teats and Avoiding nipple shields, bottle teats andpacifiers pacifiers
Using drugs during childbirth thatsedate the baby
Washing the nipples before or after Avoiding creams and ointments on theevery breastfeed nipples; avoiding soap on the breasts
and not washing them too often beforebreastfeeding
Source: WHO Regional Office for Europe (60).
Table 40. Practices that help and hinder breastfeeding
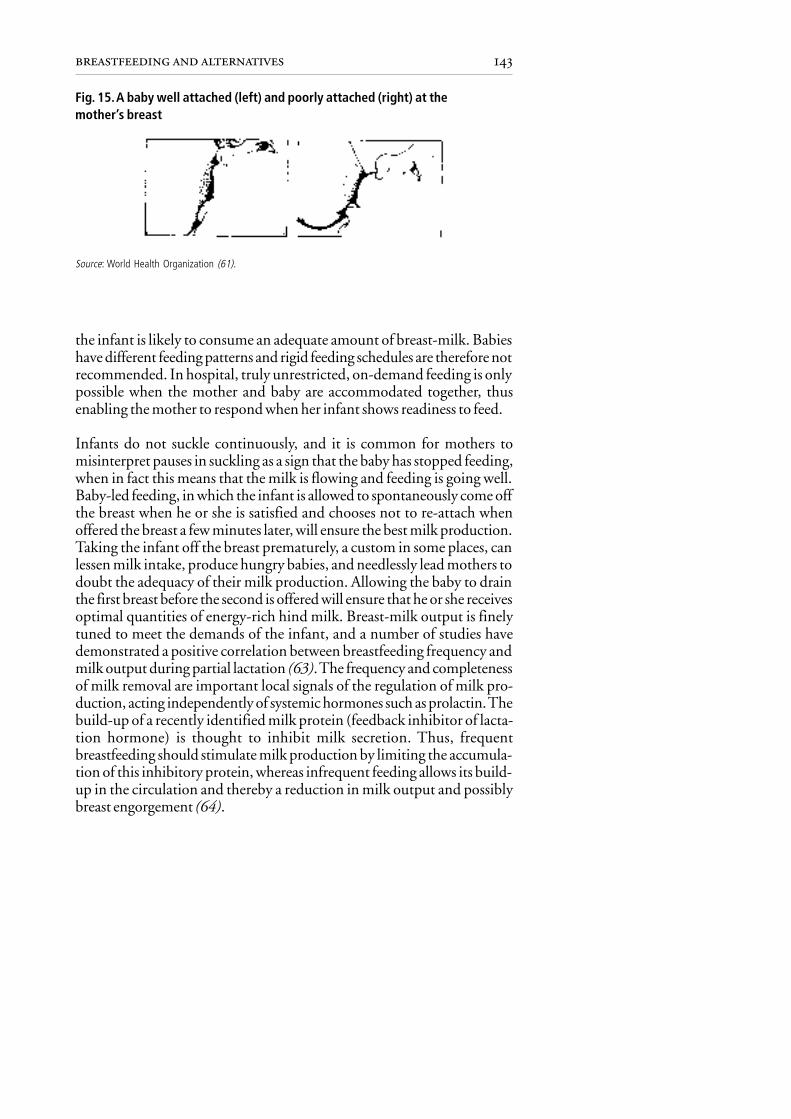
143breastfeeding and alternatives
Fig. 15. A baby well attached (left) and poorly attached (right) at themother’s breast
Source: World Health Organization (61).
the infant is likely to consume an adequate amount of breast-milk. Babieshave different feeding patterns and rigid feeding schedules are therefore notrecommended. In hospital, truly unrestricted, on-demand feeding is onlypossible when the mother and baby are accommodated together, thusenabling the mother to respond when her infant shows readiness to feed.
Infants do not suckle continuously, and it is common for mothers tomisinterpret pauses in suckling as a sign that the baby has stopped feeding,when in fact this means that the milk is flowing and feeding is going well.Baby-led feeding, in which the infant is allowed to spontaneously come offthe breast when he or she is satisfied and chooses not to re-attach whenoffered the breast a few minutes later, will ensure the best milk production.Taking the infant off the breast prematurely, a custom in some places, canlessen milk intake, produce hungry babies, and needlessly lead mothers todoubt the adequacy of their milk production. Allowing the baby to drainthe first breast before the second is offered will ensure that he or she receivesoptimal quantities of energy-rich hind milk. Breast-milk output is finelytuned to meet the demands of the infant, and a number of studies havedemonstrated a positive correlation between breastfeeding frequency andmilk output during partial lactation (63). The frequency and completenessof milk removal are important local signals of the regulation of milk pro-duction, acting independently of systemic hormones such as prolactin. Thebuild-up of a recently identified milk protein (feedback inhibitor of lacta-tion hormone) is thought to inhibit milk secretion. Thus, frequentbreastfeeding should stimulate milk production by limiting the accumula-tion of this inhibitory protein, whereas infrequent feeding allows its build-up in the circulation and thereby a reduction in milk output and possiblybreast engorgement (64).

144 chapter 7
Sustaining lactationTo sustain milk production, infants should suckle regularly and the inten-sity and duration of breastfeeding should be maintained. Colostrum, se-creted during the first few days of life, is particularly rich in immuno-protective factors and some vitamins and minerals, and should not bediscarded or withheld from infants in favour of prelacteal feeds. Exclusivebreastfeeding provides milk of sufficient quantity and quality to meet theincreasing needs of the growing infant until about 6 months of age. Evenmothers of twins can exclusively breastfeed until around 6 months. Wheninfant demand increases, and the mother responds by breastfeeding moreoften and longer at each feed, maternal milk production can increase withindays and possibly within hours. Human lactation is flexible, and currentevidence suggests that in most cases milk intake by a single infant is farbelow the mother’s capacity for milk production. Practices that interferewith the infant’s desire or ability to nurse effectively, such as the provision ofsupplementary fluids (water, glucose, dextrose or sugar water, teas, herbaldrinks, juices, gripe water, milks and other fluids) are not necessary, willdisplace the richer, more nutrient-dense breast-milk, and will interfere withinfant suckling and thereby compromise the establishment and continua-tion of breastfeeding. Even in warm climates, as long as they are exclusivelybreastfed, infants can conserve fluids and maintain adequate hydrationwithout receiving any additional fluids.
In the first few months of life, irreversible milk insufficiency is rare. How-ever, mothers often lack confidence in their ability to provide sufficientmilk to meet their baby’s needs and this fear is often reinforced by doctorsand other health professionals. Anxiety may have a negative impact on milksecretion, and mothers thus need active and ongoing support to breastfeedwell into the second year or beyond. Poor weight gain raises the possibilitythat the infant is not receiving enough milk from the mother. However,this may be an indication to improve counselling and breastfeeding supportrather than to start using alternatives to breast-milk.
Methods of assessing the adequacy of infant growth are largely based on theuse of “growth charts”, and these should be used with caution. Some growthreference standards are outdated and are based predominantly on data fromformula-fed American infants as opposed to international data from exclu-sively breastfed infants. Breastfed infants have different growth patterns(velocity) than their formula-fed counterparts (65), but there is no evidenceto suggest the slower rates of infant growth achieved with exclusivebreastfeeding for the first few months of life are suboptimal or harmful.Perceived poor nutritional status and “slow” growth, however, are reasons

145breastfeeding and alternatives
given for the premature termination of breastfeeding and inappropriate intro-duction of formula or transitional foods. New WHO standards based onexclusively and partially breastfed infants are currently being compiled (seeChapter 10).
Breastfeeding beyond 6 monthsIn the first year of life, the human body undergoes its most rapid phase ofgrowth. Most healthy infants double their birth weight in the first 6 monthsand triple it in the first year, and at the same time body composition changesdramatically. Exclusive breastfeeding will fully satisfy the nutritional needsof most infants until about 6 months of age. As the baby gets older, biggerand more active, however, nutritional requirements can no longer be metby breast-milk alone (3) (see Fig. 1). Special transitional foods – comple-mentary foods specifically designed to meet the particular nutritional or physi-ological needs of the infant (see Chapter 8) – are needed to fill the gap betweenwhat is provided by breast-milk and the total nutritional needs of the infant.
The introduction of transitional foods does not mean the cessation ofbreastfeeding. On the contrary, for the first year of life breast-milk shouldcontinue to be a main source of food, and should preferably provide be-tween one third and one half of average total energy intake towards the endof the first year. The purpose of complementary foods is to provide addi-tional energy and nutrients, and they should ideally not displace breast-milkduring the first 12 months. To ensure breast-milk volume is maintained,and to stimulate milk production, mothers should continue to breastfeedtheir infants frequently during the period of complementary feeding.
When expressed as an approximate percentage of total daily requirements,and assuming a range of intakes of breast-milk during the complementaryfeeding period, complementary foods need to provide 5–30% of vitamin A,20–45% of protein, 50–80% of thiamin, 50–65% of riboflavin, 60% ofcalcium, 85% of zinc and almost 100% of iron needs (3). The estimatessuggest that almost no vitamin B
6, vitamin B
12, vitamin C or folate should
be needed from complementary foods, because human milk has a sufficientcontent of these micronutrients. Human milk therefore represents a veryvaluable source of nutrients well beyond the time it ceases to be the soleprovider of them.
There are a number of external factors that influence the length of time amother is able to breastfeed her child. Of these, maternity leave and thebreastfeeding rights of working women are of primary concern and havebeen highlighted in the Innocenti Declaration (66; and see Annex 1, page 272).

146 chapter 7
Women represent a significant proportion of the workforce in most Euro-pean countries, and for many women economic constraints will mean thatthey must return to work while still breastfeeding. Return to the workplaceforces mothers, and thereby infants, to conform to schedules that are likelyto constrain the flexibility required for breastfeeding on demand. Thefrequency of breastfeeding is therefore likely to decrease, and consequentlybreast-milk volume can decline. Expression of milk (using hand expressionor a pump) to be fed back to the baby and breastfeeding at night help tomaintain milk production, and it should be possible to continue with atleast two or three breastfeeds per day throughout the later part of infancyand beyond. The provision of crèche facilities and/or lactation roomswhere mothers can express and store their milk, help mothers continuein their decision to breastfeed and will improve breastfeeding frequency.Furthermore, the establishment of crèche facilities in the workplacewill benefit all mother–infant relationships, whether or not the infant isbreastfed.
WHO and UNICEF currently recommend that breastfeeding should con-tinue for up to 2 years and possibly longer. Evidence supporting the con-tinuation of breastfeeding into the second year of life is strongest in settingswhere hygiene is poor and infection rates are high. In these conditions,prolonged breastfeeding (for up to 2 or 3 years) has been found to protectagainst infectious disease and to have a positive association with child sur-vival (16,17). In industrialized countries, the benefits of prolongedbreastfeeding are less evident (67). As a result, the American Academy ofPediatrics (5) recommends breastfeeding for at least 12 months and con-tinuation as long as mother and infant desire, while European countriessuch as Denmark and the United Kingdom tend to give no recommenda-tion on duration of breastfeeding beyond the first 6 months. For the WHOEuropean Region it is therefore recommended that breastfeeding shouldpreferably continue beyond the first year of life, and in populations withhigh rates of infection continued breastfeeding through the second year oflife and longer will benefit the infant.
HOW TO INCREASE THE DURATION AND INCIDENCE OFBREASTFEEDING
Many factors affect how women feed their infants and the length of timethey breastfeed them. These include traditional health care practices, theinfluence of family and friends, the living environment (urban or rural),socioeconomic status, maternal education, employment and workplace,commercial pressures, and knowledge and availability of breast-milk

147breastfeeding and alternatives
substitutes. Sociocultural factors also determine beliefs and attitudes, aswell as practices, related to breastfeeding (see Chapter 9).
Women’s perceptions of infant feeding are often formed before they be-come pregnant or give birth. They may vary with ethnicity, marital statusand age (68,69) and prior experience, including how a woman was herselffed as a baby (70). The baby’s father and grandmothers are particularlypowerful forces in influencing the mother’s decision to breastfeed, and thepregnant woman’s perception of her partner’s attitude toward breastfeedingmay also influence her decision. Around the time of childbirth, importantinfluences include female peers – friends, sisters and other relatives (71) –and male partners (72).
Breastfeeding rates are also influenced by cultural attitudes, which differboth between and within countries. These differences cannot be explainedby socioeconomic factors alone. To improve the initiation and duration ofbreastfeeding it is essential to address local attitudes, but changing publicperception of the best way to feed infants and young children is a bigchallenge. Health education programmes that promote the benefits ofbreastfeeding need to target both men and women at all levels of society, inorder to bring about a change in the public’s perception of the social accept-ability of breastfeeding, in both private and public places, and culturalattitudes to it. Health education programmes in schools should stress theadvantages of breastfeeding, and emphasize that the breast is an organ ofinfant nutrition.
Baby Friendly Hospital InitiativeCurrent health care practices are often at odds with recommendations onthe best ways to successfully establish breastfeeding. The “ten steps to suc-cessful breastfeeding” shown in Box 3 are the foundation of the BabyFriendly Hospital Initiative launched worldwide by UNICEF and WHOin 1992 (73). They summarize the maternity practices necessary to establisha supportive environment for women wishing to breastfeed and thereby tobring about improvements in the incidence and duration of breastfeeding.The Initiative also prohibits the supply of free and low-cost infant formulain hospitals, and demands the elimination of advertising and promotionalactivities for infant formula or bottle feeding. To become a baby friendlyhospital, every facility that contributes to maternity services and to the careof newborn infants must implement the 10 steps.
Reinforcing this, the Forty-fifth World Health Assembly in 1992 urgedMember States to encourage and support all public and private health

148 chapter 7
1. Have a written breastfeeding policy that is routinely communicated to allhealth care staff.
2. Train all health care staff in skills necessary to implement this policy.
3. Inform all pregnant women about the benefits and management ofbreastfeeding.
4. Help mothers initiate breastfeeding within a half hour of birth.
5. Show mothers how to breastfeed, and how to maintain lactation even if theyshould be separated from their infants.
6. Give newborn infants no food and drink other than breast-milk, unlessmedically indicated.
7. Practise rooming-in – allow mothers and infants to remain together 24 hours aday.
8. Encourage breastfeeding on demand.
9. Give no artificial teats or pacifiers (also called dummies or soothers) tobreastfeeding infants.
10. Foster the establishment of breastfeeding support groups and refer mothers tothem on discharge from the hospital or clinic.
Box 3. Ten steps to successful breastfeeding
facilities providing maternity services so that they become “baby-friendly”.It should be recognized that mothers choosing not to breastfeed will alsobenefit from baby-friendly practices such as skin-to-skin contact, rooming-in and feeding on demand.
The effect of the Initiative on the duration of breastfeeding and the preva-lence of infection has been examined in a large-scale study in Belarus (M.S.Kramer, personal communication, 1999). The majority of hospitals in thecountry were randomized to either implement the Initiative or to continuewith traditional practice.
The training and continued education of hospital staff are central to therealization of the aims of the Baby Friendly Hospital Initiative. It is

149breastfeeding and alternatives
expected that all hospital staff and community workers will have a positiveattitude to breastfeeding and be able to offer consistent and accurate advicein a language and style that parents understand. A woman’s decision tobreastfeed is significantly influenced by health professionals, and mothersshould be given continued support, encouragement and advice on theirdecision to breastfeed, which could extend into the second year and beyondaccording to current WHO/UNICEF recommendations. There is strongevidence that conflicting advice from health professionals is related to earlycessation of breastfeeding. To ensure consistency of information, local pub-lic health policies on child nutrition should be developed with the helpof parents. In addition, governments are urged to implement the Inter-national Code of Marketing of Breast-milk Substitutes (74) and subse-quent relevant World Health Assembly resolutions, and companies thatmanufacture breast-milk substitutes are urged to adhere to it (the full textsof the Code and of the relevant resolutions are given in Annex 1). Further-more, health professionals should have good knowledge of the provisionsof the Code because they have a number of responsibilities under it (75).
The Code was adopted by the World Health Assembly in 1981 as a “mini-mum requirement” to be enacted “in its entirety” in “all countries”. TheCode does not try to stop the availability or sale of breast-milk substitutes,but it does seek to stop activities that persuade people to use them. Mostimportantly, it also protects children fed these products by ensuring thatlabelling is safe and that decisions are made on the basis of truly independenthealth advice. The key provisions are summarized in Box 4.
Since 1981, eight resolutions have been adopted by the World HealthAssembly, further clarifying and strengthening the Code. Important provi-sions made in these resolutions stipulate that:
• follow-on milks are not necessary and complementary foods should notbe promoted too early;
• obstacles to breastfeeding should be removed from health services, theworkplace and the community;
• complementary feeding practices should be fostered from about 6 monthsof age, emphasizing continued breastfeeding and local foods;
• there should be no free or subsidized supplies of breast-milk substitutesin any part of the health care system;
• governments should ensure that financial support for professionals work-ing in infant and young child health does not create conflicts of interest;
• governments should ensure truly independent monitoring of the Codeand subsequent relevant resolutions; and

150 chapter 7
• the marketing of complementary foods should not undermine exclu-sive and sustained breastfeeding.
These resolutions have the same status as the Code itself and should be readtogether with it.
1. No advertising of any breast-milk substitutes (any product marketed orrepresented to replace breast-milk) or feeding bottles or teats.
2. No free samples or free or low-cost supplies to mothers.
3. No promotion of products in or through health care facilities.
4. No contact between marketing personnel and mothers (mothercraft nurses ornutritionists paid by companies to advise or teach).
5. No gifts or personal samples to health workers or their families.
6. Product labels should be in an appropriate language and no words or picturesidealizing artificial feeding (pictures of infants or health claims) should be used.
7. Only scientific and factual information to be given to health workers.
8. Governments should ensure that objective and consistent information isprovided on infant and young child feeding.
9. All information on artificial infant feeding, including labels, should clearlyexplain the benefits of breastfeeding and warn of the costs and hazardsassociated with artificial feeding.
10. Unsuitable products, such as sweetened condensed milk, should not bepromoted for babies.
11. All products should be of a high quality and take account of the climatic andstorage conditions of the country in which they are to be used.
12. Manufacturers and distributors should comply with the Code [and all theresolutions] independently of any government action to implement it.
Box 4. Summary of World Health Assembly resolutions on theInternational Code of Marketing of Breast-milk Substitutes

151breastfeeding and alternatives
Member countries of the European Union and countries joining the Unionmust harmonize their national legislation with that of the Union, includingthe European Commission’s Directive on Infant Formulae and Follow-onFormulae (76). Directives give instructions to countries on the transforma-tion of their provisions into national law, but those instructions are notalways absolute, leaving governments with some discretion. Comparedwith the Code, the European Directive has weaker labelling requirements.It applies only to infant formula and follow-on formula and not to breast-milk substitutes, bottles and teats, and it permits certain forms of promo-tion such as advertising in specialist baby care and scientific publications.There is therefore a fear in some accession countries that the adoption of thestricter Code legislation will prejudice future membership of the EuropeanUnion. Although the European Directive contains mandatory language,however, it does permit member states to adopt more restrictive provisionsin relation to advertising, and good examples exist in Denmark andLuxembourg.
Continued support for breastfeedingKnowledge is only one of a number of factors that can influence a mother’sintention to breastfeed, and it may not have much effect by itself. Givinginformation about the benefits of breastfeeding might influence those whohave not already made a decision or who are undecided, but increasing socialsupport may also be effective in enabling women to decide to breastfeedand to carry out their decision.
Continuing support to sustain breastfeeding can be provided in a variety ofways. Traditionally, in most societies, a woman’s family and close commu-nity give her the help she needs – although practices in this respect are notalways optimal. In many countries, however, young women lack positiverole models from whom to learn breastfeeding skills. As societies change, inparticular with urbanization, support from health workers or from friendswho are also mothers, and from the child’s father, becomes more impor-tant. Evidence suggests that full breastfeeding for the recommended time isconsistently associated with support and approval from the male partnerand the mother’s mother (77).
Both professional and peer group networks are therefore essential and shouldbe developed to support, protect and promote breastfeeding. There is anurgent need to explore the potential of community groups and counsellors,since they may be more able than formal health services to provide thefrequent one-to-one help that mothers need to build their confidence andto overcome difficulties. Throughout western Europe there are highly

152 chapter 7
effective mother-to-mother support networks, some of which are nowexpanding into eastern Europe. Policy-makers should identify potentialsupport systems in the community, such as churches and localnongovernmental organizations, and develop these as focal points for peersupport groups. Furthermore, in order to attain the goals outlined in theInnocenti Declaration (66), governments should develop nationalbreastfeeding policies, including legislation to protect the breastfeedingrights of working women. This legislation should cover issues such asmaternity leave and also ways to make women’s working environmentsmore conducive to breastfeeding, by for example the provision of crèchefacilities and adequate nursing breaks.
CONTRAINDICATIONS TO BREASTFEEDING
There are few absolute contraindications to breastfeeding, although manyhave been cited in the past. The literature from the former Soviet Unionincludes renal failure, heart insufficiency, cancer, psychiatric illness, thyro-toxicosis, acute viral and bacterial infections, fever of unknown origin, andhaemolytic disease of the newborn, but these are not now regarded as beingcontraindications. The principal contraindications are infection of themother with certain viruses, especially HIV, and some drugs taken bywomen when they are breastfeeding.
HIV infectionIt is now recognized that if an HIV-infected woman breastfeeds, there is arisk that her infant will be infected with HIV through her breast-milk. It istherefore crucial that policies are developed to reduce or eliminate this routeof transmission.
In countries where commercial infant formula is available and affordable,and where sanitary conditions do not expose formula-fed infants to anexcess risk of bacterial contamination, HIV-positive mothers are advisednot to breastfeed. In many countries, however, and especially those with ahigh prevalence of HIV, this is not the case and there is an urgent need todevelop policies to tackle the problem.
In September 1999, WHO, UNICEF and UNAIDS issued a joint policystatement on HIV and infant feeding (Annex 2), which takes into accountthe available scientific evidence of transmission through breast-milk andwhich promotes the fully informed choice of infant feeding methods byHIV-positive women. In 1998 these three agencies produced a set of guide-lines (78) intended to help decision-makers define what action should be
153breastfeeding and alternatives
taken in their own countries or local areas. Above all, health care profession-als must ensure that the policies developed comply with human rightsagreements, and principally that:
All men and women irrespective of their HIV status have the right to determine thecourse of their reproductive health, and to have access to information and services thatallow them to protect their own and their family’s health. When the welfare of chil-dren is concerned, decisions should be made that are in keeping with children’s bestinterest.
The overall objective is to prevent HIV transmission through breast-milkwhile continuing to protect, promote and support breastfeeding for HIV-negative women and those of unknown HIV status. The issues aremultisectoral and will be of relevance to decision-makers in a number offields including health, nutrition, family planning, education and socialwelfare. A fuller discussion of ways to prevent mother-to-child transmis-sion of HIV, together with the key elements required to establish a policyon HIV and infant feeding, can be found in Annex 2.
Environmental contaminationConcerns have been raised about the risks to infants from breast-milkcontaminated by environmental pollutants. However, the risks of con-tinued exposure to a chemical through breastfeeding have to be bal-anced against the risks of infection or nutritional deprivation whenbreastfeeding is curtailed or discontinued (79). Thus, despite the pres-ence of polychlorinated biphenyls, dioxins and furans in human milk,breastfeeding should be encouraged and promoted because of theconvincing evidence of the benefits of human milk to the overall healthand development of infants (80). Furthermore, no major studies havedemonstrated that pesticides at the concentrations found in breast-milklead to adverse health outcomes in children exposed throughbreastfeeding (81).
Therapeutic drugsMost therapeutic drugs given to a lactating mother are excreted in her milk.While in general drugs should be avoided if not necessary, there are only afew drugs for which it is necessary to stop or postpone breastfeeding.Among these are anticancer drugs (antimetabolites) and radioactive sub-stances (Table 41). Some drugs (such as ergotamine) may be toxic to theinfant, some (such as estrogens) inhibit lactation, while others (such asphenobarbitone) inhibit suckling. Often it is possible to use an alternativedrug or to continue breastfeeding while observing the infant for possible

154 chapter 7
Breastfeeding contraindicated Anticancer drugs (antimetabolites)Radioactive substances (stop
breastfeeding temporarily)
Continue breastfeedingSide effects possible Psychiatric drugs and anticonvulsantsMonitor baby for drowsiness
Use alternative drug if possible Chloramphenicol, tetracyclines,metronidazole
Quinolone antibiotics (e.g. ciprofloxacin)
Monitor baby for jaundice Sulfonamides, dapsoneSulfamethoxazole + trimethoprim
(cotrimoxazole)Sulfadoxine + pyrimethamine (Fansidar)
Use alternative drug Estrogens, including estrogen-containingcontraceptives
Thiazide diureticsErgometrine
Safe in usual dosage: monitor baby Most commonly used drugs:Analgesics and antipyretics: short
courses of paracetamol, acetylsalicylicacid, ibuprofen; occasional doses ofmorphine and pethidine
Antibiotics: ampicillin, amoxicillin,cloxacillin and other penicillins
ErythromycinAnti-tuberculars, anti-leprotics (see
dapsone above)Antimalarials (except mefloquine,
Fansidar), anthelminthicsAntifungalsBronchodilators (e.g. salbutamol),
corticosteroidsAntihistamines, antacids, drugs for
diabetesMost antihypertensives, digoxinNutritional supplements of iodine, iron,
vitamins
Table 41. Breastfeeding and maternal medication
Source: WHO/UNICEF (82).

155breastfeeding and alternatives
side effects. Furthermore, it is possible that drugs in breast-milk can causehypersensitivity in the infant even when concentrations are too low to causea pharmacological effect.
Illegal drug useThe avoidance of breastfeeding is recommended where mothers are usingillegal drugs.
TuberculosisWomen with tuberculosis who choose to breastfeed should receive a fullcourse of chemotherapy. Timely and properly used chemotherapy is thebest way to prevent transmission of tubercle bacilli to the baby. All anti-tuberculosis drugs are compatible with breastfeeding and a woman takingthem can safely breastfeed her baby. The exception is in women with newlydiagnosed active tuberculosis infection, who should be advised to discon-tinue breastfeeding until they have received at least 2 weeks of chemo-therapy. The baby should receive isoniazid prophylaxis and BCG immuni-zation (83).
Hepatitis B and CBreast-milk can contain hepatitis B surface antigen (HBsAg), and it hasbeen suggested that breastfeeding represents a route by which infants mayacquire hepatitis B virus infection. There is no evidence, however, thatbreastfeeding increases the risk of transmission to the infant (84). Hepatitis Bvaccine will substantially reduce perinatal transmission, and could elimi-nate risk of transmission through breastfeeding. Even when hepatitis Cvirus has been detected in breast-milk, breastfed infants have not beeninfected and mothers positive for hepatitis C virus RNA should be advisedto breastfeed (85,86).
SmokingNicotine can reduce the volume of human milk produced and inhibit itsrelease, and may also cause irritability and poor weight gain in infancy.Women who smoke have lower circulating prolactin levels, which mayshorten the period of lactation and reduce the duration of lactational amen-orrhoea. Also, the vitamin C concentration in the milk of smoking moth-ers tends to be lower than that in the milk of nonsmokers (87). Breastfeedingmothers should be encouraged to stop or reduce smoking, but breastfeedingremains the best feeding choice even when smoking continues. Smokingafter a breastfeed rather than before will reduce the level of harmful sub-stances in breast-milk.

156 chapter 7
ALTERNATIVES TO BREASTFEEDING
Breastfeeding is normally the best way to feed infants. Nevertheless, thereare situations where it may be preferable or necessary to substitute breast-milk with an alternative. In addition to the contraindications summarizedabove, there will be situations where the mother, despite efforts to continuebreastfeeding, will not be able to maintain lactation that will fully meet theinfant’s nutritional requirements. When cessation of breastfeeding is con-sidered, the risk of giving other than breast-milk should be less than thepotential risks associated with continued breastfeeding. Before startinggiving other than breast-milk, it is vital to consider the following issues.
• Feeding needs to provide all the infant’s nutritional requirements ascompletely as possible. No substitute fully replicates the nutrient con-tent of breast-milk.
• Breast-milk substitutes lack the properties of breast-milk that protectagainst infection. Bacteria may contaminate breast-milk substitutes dur-ing preparation, and it is essential that feeds are prepared and givenhygienically (see Chapter 12). Even when hygiene is good, artificially fedinfants suffer a significantly higher rate of gastrointestinal and respira-tory infections than breastfed infants.
• The use of breast-milk substitutes is expensive. A recent study con-ducted in the United States (88) estimated the cost of using a breast-milkalternative to be approximately US $800 for the first year of life. This costhas to be borne by individual families and translates into costs to communi-ties, with an impact at the population level. In addition to formula, the costsof fuel, water and health care need to be taken into account.
• Women who do not breastfeed lose the benefits of lactational amenor-rhoea. In populations where contraceptives are not readily available, thiswill potentially translate into short birth intervals and compromisedmaternal health unless women have easy access to family planning serv-ices soon after delivery.
• Not breastfeeding can affect mother–infant bonding, resulting in lackof stimulation for the infant. Mothers should be helped to ensure thatnon-breastfed infants receive as much attention as breastfed infants.
Commercial infant formulaMost commercial infant formulas are based on cow’s milk, and have beendesigned to mimic the nutrient composition of human milk. Thus the

157breastfeeding and alternatives
concentrations of protein and of electrolytes such as sodium, potassiumand chloride are lower than those in cow’s milk, while the levels of certainminerals, primarily iron and to a lesser extent zinc, are higher (Table 36).Commercial infant formulas lack the non-nutritional, bioactive compo-nents of human milk (protective and trophic factors), and the quality oftheir proteins and lipids (amino acid and fatty acid profiles) may not beoptimal for the needs of the baby (see below). Nevertheless, commercialinfant formulas provide a satisfactory alternative sole source of nutrition toyoung infants up to about 6 months of age. Even after the introduction ofcomplementary foods, formula continues to make a major contribution toinfant energy and nutrient requirements and, in the absence of breastfeeding,it should be the main fluid in the diet for the first 9 months and possiblybeyond.
Commercial infant formula is usually available as a milk powder that has tobe reconstituted with water. The instructions on the tin or carton forpreparing the formula should be followed exactly to ensure that it is not tooconcentrated or diluted. Overconcentration can overload the infant withsalts and protein, which can be dangerous, and overdilution can lead tomalnutrition. Health workers should be able to demonstrate to mothersand families how to make up breast-milk substitutes properly.
Compositional guidelines for commercial infant formulas have been agreedin the Codex Alimentarius, and these are defined according to the energydensity of feeds, that is the energy per 100 ml using products with65 kcal/100 ml as typical. It must be stressed that when commercialinfant formula is recommended as the best alternative to breastfeeding, it isassumed that the formula meets the standards dictated in the Codex (89).In some countries, however, commercial infant formula may be substand-ard owing to the absence of, or lack of enforcement of, national regulations.
Cow’s milk and milk from other animals
Cow’s milkInfants should not be given unmodified cow’s milk as a drink before the ageof 9 months. If infants are fed formula, cow’s milk can be gradually intro-duced into their diet between the ages of 9 and 12 months. If there are noeconomic constraints, however, it may be better to continue with formulauntil 12 months of age.
Cow’s milk differs greatly from human milk in both the quality and quan-tity of nutrients, and lacks the trophic and immunological factors present in

158 chapter 7
human milk (Table 36). In terms of nutrients, whole cow’s milk containsgreater amounts of protein and minerals (calcium, sodium, phosphorus,chloride, magnesium and potassium) and less carbohydrate, essential fattyacids (linoleic and α-linolenic acids) and long-chain polyunsaturated fattyacids, iron, zinc, vitamin C and niacin. Not only does cow’s milk have ahigher concentration of total protein, but its quality differs from humanmilk and its proteins are potentially allergenic to the human infant.
Home-prepared formulas
Milk formulas prepared at home from cow’s milk, or that of other mam-mals such as goats and sheep, are sometimes used to feed infants. These areoften deficient in many nutrients, most importantly iron, which is presentin low levels and has poor bioavailability. Home-prepared formulas maycause gastrointestinal bleeding if based on unmodified cow’s milk (seeChapter 6). They should be given only when commercial infant formula isnot available. Nevertheless, they offer a better alternative than unmodifiedcow’s milk. The younger the infant, the more important it is that he or shereceives infant formula as opposed to cow’s milk. If there are economicconstraints limiting the availability of commercial infant formula, the useof formula should be given priority in the first months after birth, becausethese are the most important from the point of view of optimal infantnutrition and development. Where commercial iron-fortified infant for-mula is not available, fresh animal milks or dried milk should be modifiedaccording to the recipes below, and iron supplements should be given.Preparations of other micronutrients (such as zinc, which may be sprinkledon foods) are currently being developed, and may in the future offer a wayof improving the micronutrient density of home-prepared formulas.
Modified animal milks
Because cow’s milk has a higher solute load than human milk, it must bediluted with boiled water to reduce its concentration. This will have anegative impact on energy density, and therefore sugar should be added.
WHO recommends the following recipe for home-prepared formula (60).
• Boil 70 ml of water.• Add 130 ml of boiled cow’s or goat’s milk to make 200 ml of feed.• Add 1 level teaspoonful (5 g) of sugar.
This recipe can also be used if the milk is made up from tinned whole milkpowder. The milk should be prepared according to the instructions on thelabel and then modified following the recipe above.

159breastfeeding and alternatives
Goat’s milk should be modified in the same way as cow’s milk. Sheep’smilk, however, has a very high protein content and therefore requires moredilution. The following recipe should be used when modifying sheep’s milk.
• Boil 100 ml of water.• Add 100 ml of boiled sheep’s milk to make 200 ml of feed.• Add 1 level teaspoonful (5 g) of sugar.
Like cow’s milk, both goat’s and sheep’s milk are low in iron and vitamin D,and are also low in folate compared with human and cow’s milk. Whilegoat’s milk is comparatively low in vitamin A, sheep’s milk contains morethan cow’s milk.
Unmodified goat’s and sheep’s milk should not be given to infants underthe age of 1 year, and thereafter only if precautions against mineral andvitamin deficiencies have been taken, together with action to ensure micro-biological safety.
Unsuitable breast-milk substitutesSkimmed and semi-skimmed milk are not recommended for feeding in-fants under the age of 1 year. Skimmed milk has had most of the fatremoved, and semi-skimmed milk about half of the fat removed, andneither provides enough energy for the growing infant. Sweetened con-densed milk is also not recommended owing to its high sugar content. Fruitjuices, sugar-water and dilute cereal gruels are sometimes given instead ofmilk feeds, but these are not recommended as alternatives because of theirnutritional incompleteness.
Bottles and cupsBottles and artificial teats are one method of feeding infants when theycannot be fed directly from the breast. Cup feeding, however, is becomingincreasingly popular and is particularly recommended in areas where hy-giene is poor, and for feeding infants under special conditions.
Both bottles and artificial teats can be harmful because:
• bottle feeding increases the risk of diarrhoea (where hygiene is poor),dental disease and otitis media, and may change oral dynamics;
• bottle feeding increases the risk that the infant will receive inadequatestimulation and attention during feeds;
• bottles and teats need to be thoroughly cleaned with a brush and thenboiled to sterilize them and this takes time and fuel;

160 chapter 7
• sweetened solids are often added to bottle feeds and this increases the riskof dental caries, as does the practice of dipping pacifiers and teats inhoney or sugar; and
• bottles may cause “nipple confusion”, which may compromisebreastfeeding frequency and intensity.
An alternative method of feeding infants who cannot breastfeed is by cup.This is recommended particularly for infants who are expected to breastfeedlater, and in situations where hygienic care of bottles and teats is difficult.The correct technique for cup feeding allows the infant to control intake;milk should not be “poured” into the mouth.
The arguments in favour of cup feeding are that:
• the risk of poor attachment to the breast is less;• the baby uses his or her tongue while feeding;• cup feeding is baby-led, the baby pacing his or her own intake in time
and quantity;• cups are safer than bottles because they are easier to clean with soap and water;• cups are less likely than bottles to be carried around for a long time,
thereby giving bacteria the opportunity to multiply;• cup feeding requires the mother or other caregiver to hold and have
more contact with the infant, thus providing more psychosocial stimu-lation than bottle feeding; and
• cup feeding is better than feeding with a cup and spoon, because spoonfeeding takes longer and the mother may stop before the infant has hadenough.
The way to feed an infant with a cup is as follows (90).
• Hold the infant sitting upright or semi-upright on your lap.• Support the infant’s back and neck with one arm.• Hold the small cup of milk to the infant’s lips.• Tip the cup so that the milk just reaches the infant’s lips. The cup rests
lightly on the infant’s lower lip, and the edges of the cup touch the outerpart of the infant’s upper lip.
• The infant becomes alert and opens his or her mouth and eyes. A low-birth-weight infant will start to take the milk into his or her mouth withthe tongue. A full-term or older infant sucks or sips the milk, spillingsome of it.
• DO NOT POUR the milk into the infant’s mouth. Just hold the cup tothe infant’s lips and let him or her take it.

161breastfeeding and alternatives
• When infants have had enough, they will close their mouth and will nottake any more. An infant who has not taken enough may take more thenext time, or the frequency of feeding may need to be increased.
• Do not try to make the infant drink a certain amount. Let the infantdecide when he or she has had enough.
• Measure the infant’s intake over 24 hours rather than at each feeding.
PacifiersPacifiers are used worldwide and are believed by some health professionalsand lay people to be harmless or even necessary and beneficial for an infant’sdevelopment (91). However, as with artificial teats, pacifiers may reducethe time spent suckling at the breast and thereby interfere with demandfeeding, resulting in suppression of breast-milk production. They may alteroral dynamics and affect language development. Furthermore, pacifiers arefrequently infected with Candida albicans and some children who usepacifiers may have oral thrush, which may resist treatment until the pacifieris discarded. Moreover, pacifiers may affect care because they are used assubstitutes by caregivers for time and attention. If used, pacifiers should notbe dipped into sweet foods such as jams and honey because of the risk ofdental caries (see Chapter 11).
REFERENCES
1. DEPARTMENT OF HEALTH, UNITED KINGDOM. Weaning and the weaningdiet. Report of the Working Group on the Weaning Diet of the Committeeon Medical Aspects of Food Policy. London, H.M. Stationery Office,1994 (Report on Health and Social Subjects, No. 45).
2. LAWRENCE, P.B. Breast milk: best source of nutrition for term andpreterm infants. Pediatric clinics of North America, 41: 925–941 (1994).
3. Complementary feeding of young children in developing countries: a re-view of current scientific knowledge. Geneva, World Health Organiza-tion, 1998 (document WHO/NUT/98.1).
4. O’CONNOR, D.L. Folate status during pregnancy and lactation. In:Allen, L.H. et al., ed. Nutrient regulation during pregnancy, lactationand infant growth. New York, Plenum Press, 1994, pp. 157–172.
5. AMERICAN ACADEMY OF PEDIATRICS. Working Group on Breastfeeding.Breastfeeding and the use of human milk. Pediatrics, 100: 1035–1039(1997).
6. HEINIG, M.J. & DEWEY, K.G. Health advantages of breastfeeding forinfants: a critical review. Nutrition research reviews, 9: 89–110 (1996).
7. HEINIG, M.J. & DEWEY, K.G. Health effects of breastfeeding for moth-ers: a critical review. Nutrition research reviews, 10: 35–56 (1997).

162 chapter 7
8. GOLDING, J. Breastfeeding: benefits and hazards. Methodology and sum-mary of results. Early human development, 49 (Suppl.): S45–S74 (1997).
9. VICTORA, C.G. ET AL. Evidence for protecting by breast-feeding againstinfant deaths from infectious diseases in Brazil. Lancet, 2: 319–322(1987).
10. BRIEND, A. ET AL. Breastfeeding, nutritional state, and child survival inrural Bangladesh. British medical journal, 296: 879–882 (1988).
11. FORSYTH, J.S. The relationship between breast-feeding and infant healthand development. Proceedings of the Nutrition Society, 54: 407–418(1995).
12. WILSON, A.C. ET AL. Relation of infant diet to childhood health: sevenyear follow up of cohort of children in Dundee infant feeding study.British medical journal, 346: 21–25 (1998).
13. CUSHING, A.H. ET AL. Breastfeeding reduces the risk of respiratoryillness in infants. American journal of epidemiology,147: 863–870 (1999).
14. HOWIE, P.W. ET AL. Protective effect of breastfeeding against infection.British medical journal, 300: 11–16 (1990).
15. WEAVER, L.T. ET AL. Human milk IgA concentrations during the firstyear of lactation. Archives of disease in childhood, 78: 235–239 (1998).
16. BRIEND, A. & BARI, A. Breastfeeding improves survival, but not nutri-tional status, of 12–35 month old children in rural Bangladesh. Euro-pean journal of clinical nutrition, 43: 603–608 (1989).
17. MØLBAK, K. ET AL. Prolonged breastfeeding, diarrhoeal disease, andsurvival of children in Guinea-Bissau. British medical journal,308:1403–1406 (1994).
18. MITRA, A.K. & RABBANI, F. The importance of breastfeeding in mini-mising mortality and morbidity from diarrhoeal diseases: the Bangla-desh perspective. Journal of diarrhoeal disease research, 13: 1–7 (1995).
19. SCHANLER, R.J. & ATKINSON, S.A. Effects of nutrients in human milkon the recipient premature infant. Journal of mammary gland biologyand neoplasia, 4: 297–307 (1999).
20. CÉSAR, J.A. ET AL. Impact of breastfeeding on admission for pneumoniaduring postneonatal period in Brazil: nested case-control study. Britishmedical journal, 318: 1316–1320 (1999).
21. TEELE, D.W. ET AL. Greater Boston Otitis Media Study Group. Epide-miology of otitis media during the first seven years of life in children ingreater Boston: a prospective, cohort study. Journal of infectious diseases,160: 83–94 (1989).
22. DUNCAN, B. ET AL. Exclusive breastfeeding for at least 4 months pro-tects against otitis media. Pediatrics, 91: 867–872 (1993).
23. OWEN, M.J. ET AL. Relation of infant feeding practices, cigarette smokeexposure, and group child care to the onset and duration of otitis media

163breastfeeding and alternatives
with effusion in the first two years of life. Journal of pediatrics, 123:702–711 (1993).
24. DEWEY, K.G. ET AL. Differences in morbidity between breast-fed andformula-fed infants. Journal of pediatrics, 126: 696–702 (1995).
25. ANDERSSON, B. ET AL. Inhibition of attachment of Streptococcuspneumoniae and Haemophilus influenzae by human milk and receptoroligosaccharides. Journal of infectious diseases, 153: 232–237 (1986).
26. COCHI, S.L. ET AL. Primary invasive Haemophilus influenzae type bdisease: a population-based assessment of risk factors. Journal of pediatrics,108: 887–896 (1986).
27. TAKALA, A.K. ET AL. Risk factors of invasive Haemophilus influenzaetype b disease among children in Finland. Journal of pediatrics, 115:694–701 (1989).
28. ARNON, S.S. ET AL. Protective role of human milk against sudden deathfrom infant botulism. Journal of pediatrics, 100: 568–573 (1982).
29. PISACANE, A. ET AL. Breastfeeding and urinary tract infection. Journal ofpediatrics, 120: 87–89 (1992).
30. HASSELBALCH, H. ET AL. Decreased thymus size in formula-fed infantscompared with breast-fed infants. Acta paediatrica, 85: 1029–1032(1996).
31. HANSON, L.A. Breastfeeding provides passive and likely long-lastingactive immunity. Annals of allergy, asthma, and immunology, 81: 523–533 (1998).
32. GERSTEIN, H.C. Cow’s milk exposure and type I diabetes mellitus.Diabetes care, 17: 13–19 (1994).
33. VERGE, C.F. ET AL. Environmental factors in childhood IDDM. Diabe-tes care, 17: 1381–1389 (1994).
34. VIRTANEN, S.M. & ARO, A. Dietary factors and the aetiology of diabe-tes. Annals of medicine, 26: 469–478 (1994).
35. KARJALAINEN, J. ET AL. A bovine albumin peptide as a possible trigger ofinsulin-dependent diabetes mellitus. New England journal of medicine,327: 302–307 (1992).
36. SAUKKONEN, T. ET AL. Children with newly diagnosed IDDM haveincreased levels of antibodies to bovine serum albumin but not toovalbumin. Childhood Diabetes in Finland study group. Diabetes care,17: 970–976 (1994).
37. LEVY-MARCHAL, C. ET AL. Antibodies against bovine albumin and otherdiabetes markers in French children. Diabetes care, 18: 1089–1094(1995).
38. RIGAS, A. ET AL. Breastfeeding and maternal smoking in the etiology ofCrohn’s disease and ulcerative colitis in childhood. Annals of epidemiol-ogy, 3: 387–392 (1993).

164 chapter 7
39. DAVIS, M.K. Review of the evidence for an association between infantfeeding and childhood cancer. International journal of cancer, 11 (Suppl.):29–33 (1998).
40. SHU, X.O. ET AL. Breastfeeding and risk of childhood acute leukaemia.Journal of the National Cancer Institute, 91: 1765–1772 (1999).
41. VON KRIES, R. ET AL. Breastfeeding and obesity: cross sectional study.British medical journal, 319: 147–150 (1999).
42. BAHNA, S.L. Breast milk and special formulas in prevention of milk allergy.Advances in experimental medicine and biology, 310: 445–451 (1991).
43. KRAMER, M.S. Does breastfeeding help protect against atopic disease?Biology, methodology, and a golden jubilee of controversy. Journal ofpediatrics, 112: 181–190 (1988).
44. KAY, J. ET AL. The prevalence of childhood atopic eczema in a generalpopulation. Journal of the American Academy of Dermatology, 30: 35–39 (1994).
45. GOLDING, J. ET AL. Eczema, asthma and allergy. Early human develop-ment, 49 (Suppl.): S121–S130 (1997).
46. HOFFMAN, H.J. ET AL. Risk factors for SIDS. Results of the NationalInstitute of Child Health and Human Development SIDS Coopera-tive Epidemiological Study. Annals of the New York Academy of Sci-ences, 533: 13–31 (1988).
47. FORD, R.P.K. ET AL. Breastfeeding and the risk of sudden infant deathsyndrome. International journal of epidemiology, 22: 885–890 (1993).
48. ANDERSON, J.W. ET AL. Breast-feeding and cognitive development: ameta-analysis.American journal of clinical nutrition,70: 525–535 (1999).
49. KENNEL, J.H. & KLAUS, M.H. Early mother-infant contact. Effects onthe mother and the infant. Bulletin of the Menninger Clinic, 43: 69–78(1979).
50. ARMSTRONG, H.C. Breastfeeding as the foundation of care. Food andnutrition bulletin, 16: 299–312 (1995).
51. ZUE, B.P. ET AL. Effect of the interval between pregnancies on perinataloutcomes. New England journal of medicine, 340: 589–594 (1999).
52. Consensus statement. Breastfeeding as a family planning method. Lan-cet, 2: 1204–1205 (1988).
53. KENNEDY, K.I. & VISNESS, C.M. Contraceptive efficacy of lactationalamenorrhoea. Lancet, 339: 227–229 (1992).
54. LABBOK, M.H ET AL. The Lactational Amenorrhoea Method (LAM): apostpartum introductory family planning method with policy andprogram implications. Advances in contraception, 10: 93–109 (1994).
55. Breastfeeding and child spacing. What health workers need to know.Geneva, World Health Organization,1988 (document WHO/MCH/FP/88.1).

165breastfeeding and alternatives
56. DEPARTMENT OF HEALTH, UNITED KINGDOM. Dietary reference valuesfor food energy and nutrients for the United Kingdom. Report of the Panelon Dietary Reference Values of the Committee on Medical Aspects of FoodPolicy. London, H.M. Stationery Office, 1991 (Report on Health andSocial Subjects, No. 41).
57. BROWN, K.H. & DEWEY, K.G. Relationships between maternal nutri-tional status and milk energy output of women in developing coun-tries. In: Picciano, M.F. & Lönnerdal, B., ed. Mechanisms regulatinglactation and infant nutrient utilization. New York, Wiley-Liss, 1992,pp. 77–95.
58. Healthy food and nutrition for women and their families. Training courseand workshop curriculum for health professionals. Copenhagen, WHORegional Office for Europe, 2000 (document AMS 5018052).
59. CINDI dietary guide. Copenhagen, WHO Regional Office for Eu-rope, 2000 (document AMS 5018028).
60. Infant feeding in emergencies: a guide for mothers. Copenhagen, WHORegional Office for Europe, 1997 (document EUR/ICP/LVNG 01 02 08).
61. Breastfeeding counselling: training course. Vol. 2. Trainer’s guide. Geneva,World Health Organization, 1993 (document WHO/CDR/93.4).
62. VINTHER, T. & HELSING, E. Breastfeeding: how to support success. Apractical guide for health workers. Copenhagen, WHO Regional Officefor Europe, 1997 (document EUR/ICP/LVNG 01 02 12).
63. PRENTICE, A. ET AL. Evidence for local feedback control of human milksecretion. Biochemical Society transactions, 17: 122 (1989).
64. WILDE, C.J. ET AL. Breastfeeding: matching supply with demand inhuman lactation. Proceedings of the Nutrition Society, 54: 401–406(1995).
65. DEWEY, K.G. ET AL. WHO Working Group on Infant Growth. Growthof breast fed infants deviates from current reference data: a pooledanalysis of US, Canadian, and European data sets. Pediatrics, 96: 495–503 (1995).
66. Resolution WHA45.34 of the Forty-fifth World Health Assembly. In:Handbook of resolutions and decisions of the World Health Assembly andthe Executive Board, Vol. 3, 3rd ed. Geneva, World Health Organiza-tion, 1993, pp.64–66.
67. PRENTICE, A. Breast feeding and the older infant. Acta paediatricascandinavica, 374 (Suppl.): 78–88 (1991).
68. BARONOWSKI, T. ET AL. Social support, social influence, ethnicity and thebreastfeeding decision. Social science and medicine,17: 1599–1611 (1983).
69. LIZARRAGA, J.L. ET AL. Psychosocial and economic factors associatedwith infant feeding intentions of adolescent mothers. Journal of adoles-cent health, 13: 676–681 (1992).

166 chapter 7
70. ENTWISLE, D.R. ET AL. Sociopsychological determinants of women’sbreastfeeding behavior: a replication and extension. American journal oforthopsychiatry, 52: 244–260 (1982).
71. LABBOK, M.H. & SIMON, S.R. A community study of a decade of in-hospital breast-feeding: implications for breast-feeding promotion.American journal of preventive medicine, 4: 62–66 (1988).
72. GIUGLIANI, E.R.J. ET AL. Effect of breastfeeding support from differentsources on mother’s decisions to breastfeed. Journal of human lactation,10: 157–161 (1994).
73. Evidence for the ten steps to successful breastfeeding. Geneva, WorldHealth Organization, 1998 (document WHO/CHD/98.9).
74. International Code of Marketing of Breast-milk Substitutes. Geneva,World Health Organization, 1981.
75. Protecting infant health. A health worker’s guide to the InternationalCode of Marketing of Breast-milk Substitutes. Penang, International BabyFood Action Network, 1993.
76. Commission Directive 91/321/EEC on infant formulae and follow-on formulae. Official journal of the European Communities, L 175: 35(1991).
77. PEREZ-ESCAMILLA, R. ET AL. Determinants of lactation performanceacross time in an urban population from Mexico. Social science andmedicine, 37: 1069–1078 (1993).
78. HIV and infant feeding. Geneva, World Health Organization, 1998(documents WHO/FRH/NUT 98.1, 98.2 and 98.3).
79. Principles for evaluating health risks from chemicals during infancy andearly childhood: The need for a special approach. Geneva, World HealthOrganization, 1986 (Environmental Health Criteria, No. 59).
80. GRANDJEAN, P. ET AL., ED. Assessment of health risks in infants associatedwith exposure to PCBs, PCDDs and PCDFs in breast milk. Report on aWHO Working Group. Copenhagen, WHO Regional Office for Eu-rope, 1988 (document EUR/ICP/CEH 533; Environmental HealthSeries, No. 29).
81. US NATIONAL RESEARCH COUNCIL. Pesticides in the diets of infants andyoung children. Washington, DC, National Academy Press, 1993.
82. Breastfeeding and maternal medication. Geneva, World Health Or-ganization, 1995 (document WHO/CDR/95.11).
83. Treatment of tuberculosis: guidelines for national programmes, 2nd ed.Geneva, World Health Organization, 1997 (document WHO/TB/97.220).
84. DE MARTINO, M. ET AL. Should hepatitis B surface antigen positivemothers breast feed? Archives of disease in childhood, 60: 972–974(1985).

167breastfeeding and alternatives
85. SPENCER, J.D. ET AL. Transmission of hepatitis C virus to infants ofhuman immunodeficiency virus-negative intravenous drug-using moth-ers: rate of infection and assessment of risk factors for transmission.Journal of viral hepatology, 4: 395–409 (1997).
86. KAGE, M. ET AL. Hepatitis C virus RNA present in saliva but absent inbreast-milk of the hepatitis C carrier mother. Journal of gastroenterologyand hepatology, 12: 518–521 (1997).
87. ORTEGA, R.M. ET AL. The influence of smoking on vitamin C statusduring the third trimester of pregnancy and on vitamin C levels inmaternal milk. Journal of the American College of Nutrition, 17: 379–384 (1998).
88. KOTLOFF, K.L. ET AL. Diarrhoeal morbidity during the first 2 years oflife among HIV-infected infants. Journal of the American Medical Asso-ciation, 271: 448–452 (1994).
89. JOINT FAO/WHO FOOD STANDARDS PROGRAMME. Recommended in-ternational standards for foods for infants and children. Rome, CodexAlimentarius Commission, 1976 (CAC/RS 72/74-1976).
90. Cup feeding. BFHI news. The Baby-Friendly Hospital Initiative news-letter. New York, United Nations Children’s Fund, May/June 1999.
91. VICTORA, C.G. ET AL. Pacifier-use and short breastfeeding duration:cause, consequence or coincidence? Pediatrics, 99: 445–453 (1997).