FEED THE FUTURE UGANDA COMMODITY …...DEHYDRATED PRECOOKED BEANS PROJECT FEASIBILITY STUDY &...
148
FEED THE FUTURE UGANDA COMMODITY PRODUCTION AND MARKETING ACTIVITY DEHYDRATED PRECOOKED BEANS PROJECT FEASIBILITY STUDY & PRODUCT TEST Final Report Submitted to Prepared by Research World International Ltd P.O. Box 34148, Kampala Tel+256 04 14 699901 , 0776 642 764 GRYPHON GROUP LTD P.O.BOX 12036 KAMPALA UGANDA PHONE +256-7811-49371 EMAIL: [email protected] WEBSITE:WWW.CHIKITABEANSPROJECT.COM
Transcript of FEED THE FUTURE UGANDA COMMODITY …...DEHYDRATED PRECOOKED BEANS PROJECT FEASIBILITY STUDY &...

FEED THE FUTURE UGANDA COMMODITY PRODUCTION AND MARKETING ACTIVITY
DEHYDRATED PRECOOKED BEANS PROJECT
FEASIBILITY STUDY & PRODUCT TEST
Final Report
Submitted to
Prepared by
Research World International Ltd
P.O. Box 34148, Kampala
Tel+256 04 14 699901 , 0776 642 764
GRYPHON GROUP LTD P.O.BOX 12036 KAMPALA UGANDA PHONE +256-7811-49371 EMAIL: [email protected] WEBSITE:WWW.CHIKITABEANSPROJECT.COM
Dehydrated Precooked Beans Feasibility Study& Product Test Draft Report Page ii of 94
Table of Contents
LIST OF TABLES ................................................................................................................................................................... V
LIST OF FIGURES ............................................................................................................................................................... VII
ACRONYMS......................................................................................................................................................................... IX
DEFINITION OF KEY TERMS .................................................................................................................................................. X
EXECUTIVE SUMMARY ........................................................................................................................................................ XI
CHAPTER 1 – INTRODUCTION .............................................................................................................................................. 1
1.1 INTRODUCTION ............................................................................................................................................................... 1
1.2 BACKGROUND ................................................................................................................................................................ 1
1.3 SURVEY OBJECTIVES ........................................................................................................................................................ 1
1.3.1 Overall objective .................................................................................................................................................... 1 1.3.2 Specific objectives
.................................................................................................................................................. 1
CHAPTER 2 – LITERATURE REVIEW ....................................................................................................................................... 3
2.1 OVERVIEW OF THE BEANS SUBSECTOR ................................................................................................................................ 3
2.2 VALUE CHAIN OF BEANS IN UGANDA .................................................................................................................................. 3
2.3 BEANS PRODUCTION IN UGANDA ...................................................................................................................................... 5
2.3.1 Bean varieties grown in Uganda ............................................................................................................................ 5
2.3.2 Bean growing areas ............................................................................................................................................... 6
2.4 BEANS CONSUMPTION IN UGANDA .................................................................................................................................... 6
2.4.1 Domestic market .................................................................................................................................................... 6
2.4.2 International market .............................................................................................................................................. 7
2.5 NUTRITIONAL STANDARDS ................................................................................................................................................ 8
2.6 LIMITATIONS TO BEAN CONSUMPTION ................................................................................................................................ 8
2.6 OPPORTUNITIES IN THE BEANS SUB-SECTOR ......................................................................................................................... 9
2.7 THE POTENTIAL FOR DEHYDRATED PRECOOKED BEANS ........................................................................................................... 9
CHAPTER 3 – RESEARCH METHODOLOGY .......................................................................................................................... 11

Dehydrated Precooked Beans Feasibility Study& Product Test Draft Report Page iii of 94
3.1 STUDY DESIGN ............................................................................................................................................................. 11 3.2 FEASIBILITY STUDY
........................................................................................................................................................ 11
3.2.1 Sampling .............................................................................................................................................................. 12 3.2.1.1 Schools .......................................................................................................................................................................... 12
3.2.1.2 Restaurants .......................................................................................................................................................................... 13 3.2.1.3 Relief Agencies ..................................................................................................................................................................... 13 3.2.1.4 Government Institutions ...................................................................................................................................................... 13
3.2.2 Secondary Data .................................................................................................................................................... 15
3.3 PRODUCT TEST ............................................................................................................................................................. 15
3.3.1 Sampling .............................................................................................................................................................. 16
3.3.2 Product that was tested ....................................................................................................................................... 18
3.3.3 Order of rotation .................................................................................................................................................. 18
3.3.4 Beans Preparation ................................................................................................................................................ 18
3.4 DATA COLLECTION PROCEDURES, METHODS AND INSTRUMENTS .......................................................................................... 18
3.4.1 Tool development ................................................................................................................................................ 18
3.4.2 Pre-testing of instruments ................................................................................................................................... 19
3.4.3 Tool administration .............................................................................................................................................. 20
3.4.4 Recruitment of team ............................................................................................................................................ 21
3.4.5 Training and Orientation ...................................................................................................................................... 21
3.4.6 Data Collection process explained further ........................................................................................................... 23
3.5 DATA PROCESSING, ANALYSIS, MANAGEMENT AND REPORTING ........................................................................................... 23
3.5.1 Data Processing ................................................................................................................................................... 23
3.5.2 Data analysis ........................................................................................................................................................ 23
3.6 QUALITY CONTROL ........................................................................................................................................................ 24
CHAPTER 4 – SURVEY FINDINGS......................................................................................................................................... 25
Dehydrated Precooked Beans Feasibility Study& Product Test Draft Report Page iv of 94
SECTION I: FEASIBILITY STUDY FINDINGS ....................................................................................................................... 25
4.1 SIZE & SCOPE OF INSTITUTIONAL MARKET OF BEANS IN UGANDA .......................................................................................... 25
4.1.1 Beans Purchase .................................................................................................................................................... 25
4.1.2 Pricing of beans .................................................................................................................................................... 28
4.1.3 Quality of beans ................................................................................................................................................... 31
4.1.4 Fuel consumption ................................................................................................................................................. 32
4.1.5 Storage practices ................................................................................................................................................. 35
4.1.6 Transportation ..................................................................................................................................................... 35
4.1.7 Labour .................................................................................................................................................................. 36
4.2 BEAN CATEGORY PREFERENCES ........................................................................................................................................ 37
4.2.1 Varieties of beans purchased ................................................................................................................................... 37
4.2.2 Type of beans purchased/consumed .................................................................................................................... 39
4.3 DATA ON CURRENT BEAN CONSUMPTION AND USAGE .......................................................................................................... 40
4.3.1 Quantities cooked per day ................................................................................................................................... 40
4.3.2 Factors that determine quantity of beans cooked ............................................................................................... 41
4.3.3 Preparation of beans ............................................................................................................................................ 43
4.3.4 Consumption of beans ......................................................................................................................................... 43
4.3.5 Left over handling ................................................................................................................................................ 44
4.4 DATA ON THE NUTRITION STANDARD PREFERENCES FOR THE VARIOUS INSTITUTIONS................................................................. 45
4.4.1 Awareness of the nutritional value of beans........................................................................................................ 45
4.4.2 Fortified foods ...................................................................................................................................................... 46
4.5 CONSTRAINTS FACED WITH THE CURRENT BEAN PRODUCT .................................................................................................... 47
4.5.1 Problems faced with the current beans ............................................................................................................... 47
4.5.2 Solutions to the problems faced with the current beans ..................................................................................... 48
4.6 ACCEPTABILITY OF A DEHYDRATED PRECOOKED BEAN PRODUCT ............................................................................................. 49
4.6.1 Awareness of dehydrated precooked beans ....................................................................................................... 49
4.6.1 Suitability of dehydrated precooked beans ......................................................................................................... 49
4.6.2 Likelihood to buy dehydrated precooked beans .................................................................................................. 50
4.6.3 Likelihood to recommend dehydrated precooked beans ..................................................................................... 50

Dehydrated Precooked Beans Feasibility Study& Product Test Draft Report Page v of 94
SECTION II: NEW PRODUCT EVALUATION ................................................................................................................... 51
4.7 SPONTANEOUS THOUGHTS AND PERCEPTIONS ON THE PRODUCT ........................................................................................... 51
4.7.1 Initial thoughts and perceptions on dehydrated precooked beans ...................................................................... 51
4.7.2 Appearance of the beans before preparation ...................................................................................................... 51
4.7.3 Smell of the beans before preparation................................................................................................................. 53
4.7.4 Overall attribute rating ........................................................................................................................................ 54 4.7.4.1 Thoughts on the beans ................................................................................................................................................. 54 4.7.4.2 Likeness on the beans ................................................................................................................................................... 55
4.7.5 Individual attribute rating .................................................................................................................................... 56 4.7.5.1 Appearance of the beans after preparation ................................................................................................................. 59 4.7.5.2 Reasons for rating of appearance of the beans after preparation ................................................................................ 60 4.7.5.3 Taste of the beans after preparation ............................................................................................................................ 61 4.7.5.4 Reasons for rating of tastiness of the beans after preparation .................................................................................... 62 4.7.5.5 Color of the beans after preparation .......................................................................................................................... 62 4.7.5.6 Reasons for rating of color of the beans after preparation ........................................................................................ 63 4.7.5.7 Aroma of the beans after preparation .......................................................................................................................... 64 4.7.5.8 Reasons for rating of aroma of the beans after preparation ........................................................................................ 64 4.7.5.9 Texture/mouth feel of the beans after preparation ..................................................................................................... 65 4.7.5.10 Reasons for rating of texture of the beans after preparation ....................................................................................... 65 4.7.5.11 Quality of the dehydrated precooked beans ................................................................................................................ 66 4.7.5.12 Comparison of dehydrated precooked beans with current beans ............................................................................... 66 4.8 LIKES, DISLIKES AND SUGGESTIONS FOR IMPROVEMENT ON THE DEHYDRATED PRECOOKED BEANS ............................................... 68
4.8.1 Likes for dehydrated precooked beans................................................................................................................. 68
4.8.2 Dislikes for dehydrated precooked beans ............................................................................................................ 68
3.9.3 Suggestions for improvement for dehydrated precooked beans ......................................................................... 69
4.9 LIKELIHOOD TO PURCHASE/CONSUME DEHYDRATED PRECOOKED BEANS ................................................................................ 70

Dehydrated Precooked Beans Feasibility Study& Product Test Draft Report Page vi of 94
4.9.1 The need for dehydrated precooked beans ......................................................................................................... 70
4.9.2 Purchase/consumption intent ............................................................................................................................. 71
4.9.3 Anticipated purchase frequency .......................................................................................................................... 72
4.9.4 Likelihood to purchase dehydrated precooked beans .......................................................................................... 72
4.9. 5 Quantities of the dehydrated precooked beans likely to buy .......................................................................... 73
4.9.6 Price willing to pay for a kilo gram of the dehydrated precooked beans ............................................................. 73
4.10 LIKELIHOOD TO RECOMMEND DEHYDRATED PRECOOKED BEANS ............................................................................................ 74
4.10.1 Likelihood to recommend dehydrated precooked beans to other institutions ................................................ 74
CHAPTER 5: RECOMMENDATIONS AND CONCLUSIONS ..................................................................................................... 75
5.1 RECOMMENDATIONS ..................................................................................................................................................... 75
5.2 CONCLUSIONS .............................................................................................................................................................. 77
APPENDICES ...................................................................................................................................................................... 78
APPENDIX 1: LIST OF CURRENT BEAN TYPES IN UGANDA ................................................................................................................... 79 APPENDIX 2: LIST OF INSTITUTIONS THAT PARTICIPATED IN THE
STUDY ................................................................................................ 80
LIST OF TABLES
Table 1: Bean production per hectare 2004/2008 .....................................................................................................5 Table 2: Area of production of beans per region
2008/2009 .....................................................................................6 Table 3: Table showing the targeted sample vis-a-vis achieved sample per district
............................................. 14 Table 4: Table showing the targeted sample size for product test ......................................................................... 17 Table 5: Table
showing the achieved sample size for product test ...................................................................... 17 Table 6: Place of beans purchase
............................................................................................................................ 26 Table 7: Frequency of beans purchase
Dehydrated Precooked Beans Feasibility Study& Product Test Draft Report Page vii of 94
................................................................................................................... 26 Table 8: Quantities of beans purchased per time
................................................................................................... 27 Table 9: Packaging size
............................................................................................................................................ 27 Table 10: Pricing of 1kg of beans
............................................................................................................................. 28 Table 11: A table showing months of the year when price of beans is lowest
....................................................... 30
Table 12: A table showing months of the year when price of beans is highest ...................................................... 30 Table 13: A table showing quantity of firewood
spent on cooking beans per term ............................................... 33 Table 14: A table showing the various challenges faced in obtaining the fuel used in cooking beans
by the various institutions ............................................................................................................................................................... 33
Table 15: A table showing the delivery of beans and who meets the cost of delivery ........................................... 36 Table 16: A table showing bean varieties usually
purchased .................................................................................. 37 Table 17: A table showing preferred bean varieties
............................................................................................... 38 Table 18: A table showing quantities of beans cooked per day by the various institutions
................................... 40 Table 19: A table showing factors that determine quantity cooked per day by district, setting and institution type
................................................................................................................................................................................. 42
Table 20: A table showing days and meals when beans are consumed ................................................................. 43
Table 21: A table showing problems institutions face with their current beans .................................................... 47 Table 22: A table showing the suitability of
dehydrated precooked beans ............................................................ 49 Table 23: A table showing institutions` likelihood to recommend dehydrated precooked
beans ......................... 50 Table 24 showing respondents` feedback on the appearance of the dehydrated precooked beans .................... 53 Table 25: A figure
showing a rating of respondent`s thoughts on the dehydrated precooked beans by
demographics .......................................................................................................................................................... 54
Table 26: A table showing respondents` rating of how they like the dehydrated precooked beans before
preparation .............................................................................................................................................................. 55

Dehydrated Precooked Beans Feasibility Study& Product Test Draft Report Page viii of 94
Table 27 showing the summary of respondents` feedback during the product test .............................................. 56 Table 28: A table showing respondents` rating of
the appearance of the like the dehydrated precooked beans
before after preparation ......................................................................................................................................... 60
Table 29: A figure showing respondents` feedback on the taste of the beans after preparation across
demographics .......................................................................................................................................................... 61
Table 30: A table showing respondents` feedback on the color taste of the beans after preparation across
demographics .......................................................................................................................................................... 63
Table 31: A table showing respondents rating of the aroma of the beans after preparation ................................ 64 Table 32: A table showing respondents rating on
the quality of the dehydrated precooked beans ..................... 66
Table 33: A table showing the anticipated purchase frequency for dehydrated precooked beans ....................... 72 Table 34: A table showing respondents` likelihood
to purchase dehydrated precooked beans. ........................... 72 Table 35: A table showing quantities of dehydrated precooked beans respondents are likely to buy
.................. 73 Table 36: A table showing respondents` likelihood to recommend dehydrated precooked beans to others ....... 74

Dehydrated Precooked Beans Feasibility Study& Product Test Draft Report Page ix of 94
LIST OF FIGURES
Figure 1: Picture showing the pre-testing process of preparing the dehydrated precooked beans ...................... 19 Figure 2: Picture showing the tool being administered
by an interviewer to the learners .................................... 20 Figure 3: Picture showing the tool being administered by an interviewer to a Kikomando Joint owner
............... 21
Figure 4: Picture showing training of the field teams ............................................................................................. 22
Figure 5: Picture showing training of the field teams ............................................................................................. 22 Figure 6: A figure showing proportion of institutions
that purchase beans and place of purchase ....................... 25
Figure 7: Price Variations in months ....................................................................................................................... 29 Figure 8: Pie charts showing the effect of price on
purchase behavior/decision ................................................... 31 Figure 9: A graph showing respondents thoughts on quality of beans purchased
................................................. 31 Figure 10: A graph showing feedback on the quality of beans the various institutions purchase ......................... 32 Figure 11: A
figure showing the different types of fuel used to prepare beans by the various institutions .......... 32 Figure 12: A figure showing solutions to the challenges faced in
obtaining fuel used by various institutions ...... 34 Figure 13: Likelihood to buy a product that requires less fuel ................................................................................ 34
Figure 14: A figure showing the type of storage used by the various institutions to store beans ......................... 35 Figure 15: A figure showing mode of delivery to
business premises ...................................................................... 35 Figure 16: A figure showing challenges faced in obtaining the required labour force
........................................... 36 Figure 17: A graph showing types of beans purchased ........................................................................................... 39 Figure 18: Reasons
for bean type preference ......................................................................................................... 40 Figure 19: A bar graph showing factors that determine the quantity of
beans cooked per day ............................ 41 Figure 20: Time taken to fully prepare the beans ................................................................................................... 43 Figure
21: A graph showing how institutions handle their leftovers ...................................................................... 44 Figure 22: A figure showing institutional knowledge on
the nutritional value of beans ........................................ 45 Figure 23: A graph showing knowledge of and likelihood to purchased fortified foods
........................................ 46 Figure 24: A graph showing purchase consideration for fortified foods by institution and setting ....................... 46 Figure 25: A figure
showing responsiveness to the various problems faced with the beans by the institutions ... 48 Figure 26: A bar graph showing solutions to the problems faced with
current beans ........................................... 48 Figure 27: Awareness of dehydrated precooked beans .......................................................................................... 49

Dehydrated Precooked Beans Feasibility Study& Product Test Draft Report Page x of 94
Figure 28: A graph showing likelihood to buy a bean product that has a long shelf life, free of pests…. .............. 50 Figure 29: A figure showing respondents` initial
thoughts and perceptions on dehydrated precooked beans ..... 51 Figure 30: A figure showing respondents` feedback on the appearance of the dehydrated
precooked beans
before preparation .................................................................................................................................................. 51
Figure 31: A figure showing respondents` feedback on the smell of the dehydrated precooked beans before
preparation .............................................................................................................................................................. 53
Figure 32: A figure showing a rating of respondent`s thoughts on the dehydrated precooked beans .................. 54 Figure 33: A bar graph showing respondents`
feedback on the appearance of the beans after preparation .... 59 Figure 34: A figure showing respondents` feedback on the appearance of the dehydrated
precooked beans after
preparation .............................................................................................................................................................. 60
Figure 35: A figure showing rating of respondents` thoughts on the tastiness of the beans after preparation .... 61 Figure 36: A figure showing respondent`s feedback
on the taste of the beans after preparation ........................ 62
Figure 37: A figure showing respondents rating of the color of the beans after preparation .............................. 62 Figure 38: A figure showing respondents` feedback
on the color of the dehydrated precooked beans after
preparation .............................................................................................................................................................. 63
Figure 39: A figure showing respondents` feedback on the aroma of the dehydrated precooked beans after
preparation .............................................................................................................................................................. 64
Figure 40: A figure showing feedback respondents` rating on the texture of the beans after preparation .......... 65 Figure 41: A figure showing respondents feedback
on the texture of the dehydrated precooked beans after
preparation .............................................................................................................................................................. 65
Figure 42: A figure showing respondents` comparison of dehydrated precooked beans to the current beans they
consume/purchase .................................................................................................................................................. 66
Figure 43: A figure showing reasons for above comparisons for the comparison between dehydrated precooked
beans and the current beans ................................................................................................................................... 67 Figure 44: A figure showing the various likes for
dehydrated precooked beans .................................................... 68 Figure 45: A figure showing the various dislikes for dehydrated precooked beans
............................................... 68 Figure 46: A figure showing respondents` suggestions for improvement of dehydrated precooked beans.......... 69 Figure 47: A figure
showing the institutional need for dehydrated precooked beans ........................................... 70 Figure 48: A figure showing respondents` intent to purchase dehydrated

Dehydrated Precooked Beans Feasibility Study& Product Test Draft Report Page xi of 94
precooked beans ............................... 71 Figure 49: A figure showing reasons for purchase/consumption intent ................................................................. 71 Figure 50:
A figure showing average price respondents are willing to pay for 1 kg of dehydrated precooked beans
................................................................................................................................................................................. 73
ACRONYMS
Measure Definition
FAO Food and Agriculture Organisation
FTF-CPM Feed the Future Uganda Commodity Production and Marketing Activity
RWI Research World International
MAAIF Ministry of Agriculture, Animal Industry and Fisheries
USAID United States Agency for International Development
UNDP United Nations Development Programme

Dehydrated Precooked Beans Feasibility Study& Product Test Draft Report Page xii of 94
DEFINITION OF KEY TERMS Term Definition
Kikomando Joint A roadside kitchen stall where basic foods are prepped and sold to passers by
Relief Agency An organization that provides aid for people in need, especially in disaster areas
Government body An established organization or foundations, especially one dedicated to education, public
service, or culture run by government.
Institution In this case it refers to all the target respondents in the survey which include a primary school,
a secondary school, a restaurant, Kikomando Joints, Relief Agency and Government body.
Dehydrated precooked
beans These are beans that have been fully cooked and dehydrated to remove moisture up to less
than 10 degrees Celsius.
Learners As used in this report, these refer to students and pupils.
Caterers Someone who arranges the delivery, preparation and presentation of food for consumers

Dehydrated Precooked Beans Feasibility Study& Product Test Draft Report Page xiii of 94
EXECUTIVE SUMMARY
Feed the Future Commodity Production and Marketing Activity (FTF-CPM) commissioned Research World International Limited in the month of May 2016 to conduct
a feasibility study and product test for dehydrated precooked beans in Kampala, Jinja, Mbarara, and Gulu districts of Uganda.
The overall objective of this assignment was to establish the availability of market for dehydrated precooked beans in Uganda`s institutional markets and to assess
consumers’ willingness to buy the dehydrated precooked beans product.
This survey was conducted using quantitative methods of sampling, data collection and analysis study. Face-to face Personal interview approach was used during
collection of data. The survey was single phased and encompassed both the feasibility study component as well as the product test component. The target respondents
interviewed were 44 schools, 1 relief agency, 1 government institutions, 65 restaurants and 75 Kikomando joints. In some cases we employed random sampling
techniques, while in other cases where targeted institutions were difficult to find or locate, purposive and snowballing techniques was used.
The key findings and recommendations of the study were that: 91% of institutions are likely to buy dehydrated precooked beans especially among retail shops which
is where they should be sold and distributed; Suppliers of beans need to produce enough quantities of dehydrated precooked that can meet the demand of beans,
especially in schools, government and relief agencies; In order for suppliers of beans to be competitive, they need to be aware of current bean prices on the market
so that they can provide affordable competitive prices to their customers; 52.7% of institutions are yearning to buy precooked beans since they use less fuel especially
in rural areas; most institutions prefer yellow beans while others prefer Kanyeebwa and Nambaale; Major problems found with beans is that they take long to cook,
they have weevils while the dehydrated precooked beans are hard and they smell bad. There is need to put in place solutions to overcome these problems.

Dehydrated Precooked Beans Feasibility Study& Product Test Draft Report Page ii of 94
Conclusion and the way forward is that the suppliers of dehydrated precooked beans should proceed with their production and distribution especially among schools
and government institutions/agencies as that is where there is ready market for them. However, there is need to improve on the various gaps that have been
highlighted in this report concerning the dehydrated precooked beans.

CHAPTER 1 – INTRODUCTION
1.1 Introduction
Feed the Future Commodity Production and Marketing Activity (FTF-CPM) commissioned Research World International Limited to conduct a feasibility study
and product test for dehydrated precooked beans in Kampala, Jinja, Mbarara, and Gulu districts of Uganda.
This document serves as a draft report of the findings from the survey. It is divided into four chapters known as; Chapter one consisting of the introduction
which is largely what was agreed upon at inception of the survey, Chapter two consisting of review of past literature, Chapter three comprising of summary of
the findings, while Chapter four contains the recommendations and conclusions.
1.2 Background
Feed the Future Commodity Production and Marketing Activity`s (FTF-CPM) key objective is to achieve sustainable increase in the production and marketing
of high quality maize, beans and coffee in the 34 FTF focus districts. In support of the beans value chain, the activity partnered with Gryphon Group to introduce
a dehydrated pre-cooked bean product to Uganda`s institutional market. However, before any investments are made into the complete production of the
product, they saw it necessary to carry out a feasibility study and product test in the primary, secondary and tertiary markets. Results from the survey will be
used in formulating a viable business strategy and a product that is tailor made for the institutional market.
Following a competitive process and negotiations, FTF-CPM contracted Research World International to implement a survey amongst schools, relief agencies,
government institutions and the food service industry aimed at establishing the availability of a market for dehydrated precooked beans in the institutional
markets.
1.3 Survey Objectives
1.3.1 Overall objective
The overall objective of this assignment was to establish the availability of a market for dehydrated precooked beans in Uganda`s institutional markets and to
assess consumers’ willingness to buy the dehydrated precooked beans product.

1.3.2 Specific objectives
The specific objectives of this assignment were categorised into two as shown below;
A. Feasibility study for dehydrated precooked beans:-
• To gather data on the nutrition standard preferences for the various institutions
• To gather data on current bean consumption and usage
• To determine constraints faced with the current bean product
• To establish bean category preferences
• To determine the size and scope of the institutional market for dehydrated precooked beans in Uganda
• To gauge the acceptability of a dehydrated precooked bean product
B. Product test for dehydrated precooked bean product:-
• To gather spontaneous thoughts and perceptions on the product
• To establish likes and dislikes, and suggestions for improvement on proposed product
• To determine likelihood to purchase the product and at what prices

CHAPTER 2 – LITERATURE REVIEW
Given the importance of beans, it is necessary to understand what the situation of the bean sub-sector in Uganda is in terms of production, marketing and
consumption. This chapter presents a review of past literature from a number of studies and elaborates the theoretical basis for the study.
2.1 Overview of the Beans Subsector
Beans are the most important legume for human consumption in the world. According to (FAO, 2011), the most important legume in Uganda is beans, followed
by ground nuts, soya bean, cowpea, and pigeon pea. While beans are considered a low status food, the “meat of the poor”, they provide the second most
important source of protein after maize and the third most important source of calories after maize and cassava (Pachico, 1993). It is estimated that about 20
million MT of beans are produced annually with a market value of US $10 billion. The leading countries in the production of beans in 2010 by volume were
India, Brazil, Myanmar, USA and China (FAOSTAT, 2012).
In the East African Community (EAC) Region, Uganda is ranked second to Tanzania in the production of common beans also known as Phaseolus Vulgaris
(UNDP, 2013)1. In Uganda, beans provide 25% of the total dietary calorie intake and 45% of the protein intake and with their short growing cycle and
adaptability to a wide range of growing conditions they are a vital source of income for many families, contributing up to 9% of household income in some
areas. As a traditional staple food, beans are a major source of affordable protein, complex carbohydrates, essential micronutrients, dietary fiber, vitamin B
and antioxidants in the nutritionally challenged diets of both the rural and urban poor.
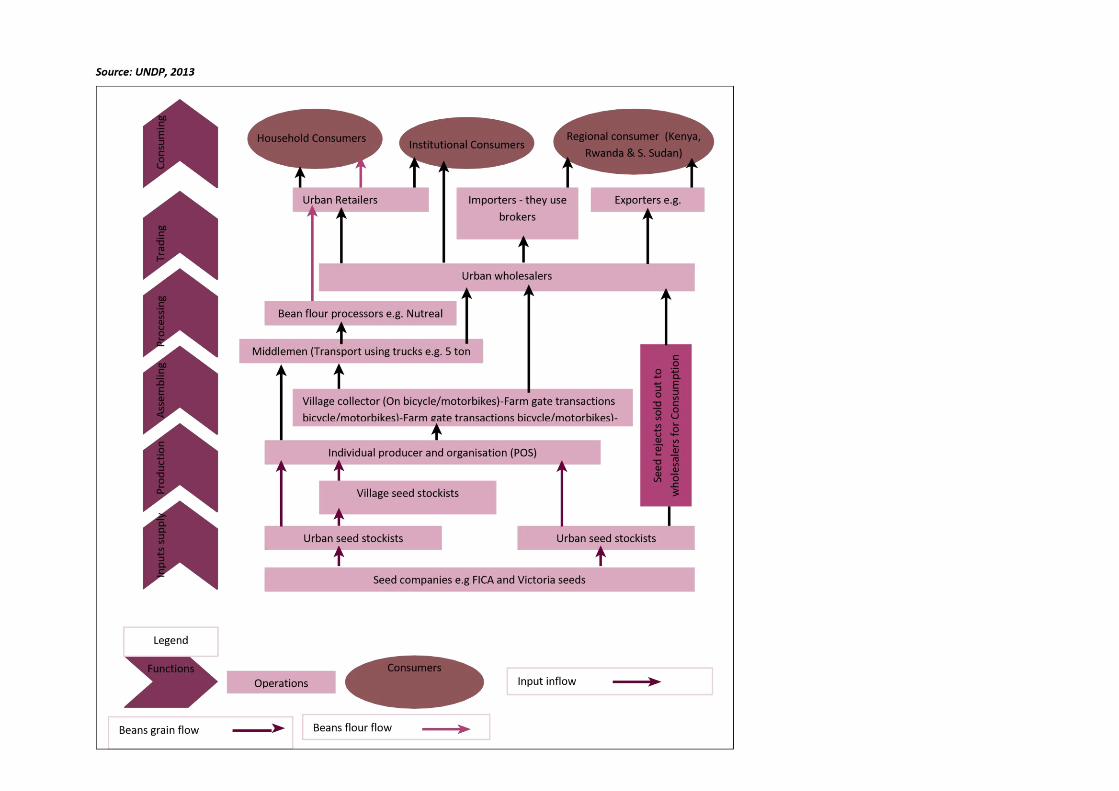
2.2 Value chain of beans in Uganda
The value chain of bean grain and bean seed as shown below is a map of the key micro-level actors of the bean grain value chain. These are the input suppliers,
producers, assemblers, processors, traders and consumers. Bean consumption is through three channels of households, institutions and regional trade.2
1 http://ussp.ifpri.info/files/2011/10/bean-marketing-in-uganda-nkonya-2001.pdf
2 United National Development Programme. (n.d.). United National Development Programme Home page . Retrieved 11 20, 2016, from United National Development
Programme Uganda Website
2.3 Beans Production in Uganda
The common bean (Phaseolus vulgaris) is a basic constituent to the traditional diet of most Ugandans. Beans are grown in two seasons (March to June, and
September to November). The September to November season records high yields due to the high amount of rainfall. For instance, in 2008/2009 growing
season, 59% of all the beans produced was during this season (MAAIF, 2010). Productivity of beans in Uganda recorded a sharp decline in 2006 from 478,000
metric tonnes to 424,000 metric tonnes. However, between 2004 and 2010, production increased by 2% (MAAIF, 2010)3. This increase in production was
associated with the increasing population. Uganda has been ranked the second producer of beans after Tanzania in the East African Community.
According to the Uganda agriculture Census report of 2008/2009 that was conducted by Uganda Bureau of Statistics, it was shown that the area under beans
production had been an average 851,000 ha between 2004 and 2008, with quantity produced averaging 445,400 tonnes over the same period as shown in the
table below:
Table 1: Bean production per hectare 2004/2008
Source: UBOS (2008/2009), Statistical Abstract
According to a market assessment and baseline study by USAID in 20104, it is stated that a large part of the bean production in Uganda takes place on small
farms ranging from 1 to 10 ha in size. Resource-poor farmers with very few inputs grow beans primarily on small-scale, marginal farms. Women farmers, who
have little or no access to fertilizers and other inputs, grow beans, often intercropping them with cereals (maize, millet, sorghum, etc.) In the circumstances, it
is not surprising that average yields are low. Much of the bean crop is lost to diseases as well as insect pests or drought, low soil fertility and other factors.
Higher yielding climbing varieties have been adopted in some parts of the country.
3 MAAIF,2010. The Agricultural Sector Development Strategy and Investment Plan 2010/2011 -2014/15
4 http://pdf.usaid.gov/pdf_docs/Pnadw642.pdf
Year 2004 2005 2006 2007 2008
Area Planted (000 Ha) 812 828 849 870 896
Quantity (000 MT) 455 478 424 430 440
2.3.1 Bean varieties grown in Uganda
A number of bean varieties are grown in Uganda with notable diversity in terms of seeds type and adaptation. Local market preferences and variances in
climatic and agronomic conditions generally dictate which varieties are popular. There is some bias towards the large-seeded types in Uganda where farmers
grow and maintain seed mixtures of all sizes and colors. The grain is an important cash crop and the leaves are also an important vegetable in some parts of
the country.
According to Waluse (2012), specifically, Ugandan bean farmers traditionally grow varietal mixtures of variable growth habits. However, some production of
single varieties is also practiced, especially for urban markets. In Kalyebara (2008), it was found that farmers grow the traditional varieties for the household
consumption, and the improved varieties for commercial purposes. There are several varieties within the country, with most of the traditional varieties having
degenerated into what is commonly referred to as “local” varieties (Uganda’s grain subsector report, 2007). See appendix 1 for list of current common bean
varieties
2.3.2 Bean growing areas
Beans are produced in all the districts of Uganda with outputs ranging from a lowly 1,000 tonnes a year to as much as 30,000 tonnes in some districts. High
yields occur in areas with well distributed rainfall and fertile soils. According to a survey by (UBOS, 2010), 81% of all Ugandan households cultivate beans, with
the western region leading in terms of numbers of households growing beans, followed by central, eastern and northern regions in that order as illustrated
below. The main districts growing beans include:
Kabale, Kapchorwa, Mbale, Apac, Lira, Hoima, and Busoga region; Masindi, Mubende and Gulu. Table 2: Area of production of beans per region 2008/2009
2.4 Beans consumption in Uganda
2.4.1 Domestic market
Beans are the most important legume for human consumption in the world. They are estimated to be the second most important source of dietary protein
and the third most important source of calories. They are an important staple food in sub-Saharan Africa, particularly in rural areas of Eastern Africa.
In Uganda, beans are a major staple and a key source of food security for both rural and urban populations. Consumer preferences for beans differ, depending
on seed types, color, shape, and brilliance or seed coat luster. However, many consumers prefer beans with the sweet taste and fast cooking attributes. There
is higher demand for bean varieties with these attributes than those which have very attractive seed appearance. Beans are often combined with such energy
sources as maize, plantains (matooke), or root crops (sweet potatoes, cassava, yams, etc). The high nutritional value of beans in terms of the percentage of
protein is an important complement to these starchy foods. In addition, the high mineral content of beans, especially iron and zinc, is advantageous in cases
of high prevalence of micronutrient deficiencies such as iron deficiency anemia.
The Uganda census on Agriculture of 2008/2009 established that out of the 929,000 MT of beans produced during the 2008/2009 seasons, 32% of the produce
was consumed, 23% was stored and 12% were used for other purposes (UBOS-UCA, 2010)5. The demand for common beans in Uganda in 2010 was estimated
to be 464,000 MT and it is projected that, it will rise to 641,000 MT by 2020 (Abate et al., 2011). Per capita consumption of beans in Uganda is estimated to be
19 Kg/Yr much of which is institutional demand (schools, World Food Program, prisons, Ministry of Defense, Police, Prime minister’s office for relief distribution)
and individual buyers. The key drivers of demand of these beans are mainly prices, population growth and availability.
According to Education Management Information System data sheet (2012) the total number of primary schools in Uganda is 22,501. Of these primary schools,
8,337,069 students are enrolled. Of which 4,168,931 are boys and 4,168,130 are girls. In addition, the data sheet shows that 7,097,382 of these students are
enrolled in government schools while 1,121,833 students are enrolled in private schools.
Ibid, (2012)6 states that the total number of secondary schools in Uganda is 3,038. Of these secondary schools, 1,240,437 students are enrolled. Of which,
669,334 are boys and 578103 are girls. In addition the data sheet states that 2,143 are government schools while 895 are private secondary schools. Further
details show that 590,801 students are enrolled in the private secondary schools while 656,636 students are enrolled in government secondary schools.
5 UBOS. & MAAIF. 2010. Uganda Census of Agriculture 2008/2009. Kampala: Uganda Bureau of Statistics and Ministry of Agriculture, Animal Industry and Fisheries.
6 EMIS Data sheet 2000-2012. Kampala: Ministry of Education and Sports
According to a survey conducted by UBOS in 2009, most beans produced are consumed locally. Out of the quantities produced between 2004 and 2008
generally over 90% is estimated to have been consumed locally with insignificant amounts being sold informally to neighboring countries. National annual
consumption of beans is estimated at about 58 kg per capita.
According to a study done on staple foods by USAID in 20107, it is stated that apart from the World Food Programme, the main buyers of beans are institutions
(schools, hospitals, police, prisons, restaurants, etc.), buying either from village stores or large urban traders. Volumes purchased differ according to the size
of the institution. Small institutions buy between 2 and 5 100-kg bags of beans every week, while large institutions procure big volumes of between 5-10 100-
kg bags of beans per week. Purchases are mainly done on credit basing on the ruling price in the market.
2.4.2 International market
There is a significant market for Ugandan beans within the region, but as noted earlier, most of the beans produced are consumed domestically. In spite of
this, however, some amounts are exported to the region. Exports are primarily in unprocessed form with little value added. Over 90% of Uganda`s bean market
is across the borders. Such trade is categorized into formal and informal operations.
The informal trade is particularly significant at the border points of Uganda and Kenya, Sudan, DRC, Tanzania, and Rwanda. According to a Market Assessment
that was done by USAID in 2010, it was estimated that about 90 –120 Kg bags of beans were ferried to Kenya through Busia border point. The major participants
in this trade were found to be youth who either carry their commodities on bicycles or cross the border points on foot. Beans are carried in small quantities of
up to 5 kilograms. The two groups involved in informal trade are the foreign buyers who travel from neighbouring countries into Uganda to purchase the beans
and Ugandan exporters, who include large scale producers, traders/ and companies who mainly export their beans formally through the border points.
The formal bean trade is still very small with World Food Programme being the largest exporter of beans from Uganda. Majority of beans are exported to the
neighbouring countries. WFP uses two procurement mechanisms namely; Agriculture and Marketing Support Programme, the WFP purchases beans mainly
from farmer groups who can supply at least 40 MT and by other community based organizations. WF`s Vulnerability and Assessment Unit ensures that farmer
groups are paid a fair price. Producer groups are also assisted with market information on commodity prices throughout the country. This programme is
working well in eastern, central and western Uganda, where farmers have good surpluses every year. The WFP also purchases from traders who can stock bulk
and/or supply at least 200 MT of beans. Kampala has the biggest bean traders with sufficient volumes for export.
7 http://pdf.usaid.gov/pdf_docs/Pnadw642.pdf
2.5 Nutritional standards
According to the US Dry bean council, dry beans and other legumes are some of the most widely available, inexpensive and nutritionally complete staple foods.
In the Dietary Guidelines for Americans 2010, scientists recommend that adults consume three cups of beans per week to promote health and reduce the risk
of chronic diseases.8
As both a vegetable and a non-meat protein source, beans contain nutrients found in both food groups. They are also a nutrient-rich source of complex
carbohydrates and contain dietary fiber, proven to reduce the risk of heart disease and some cancers and to aid in weight maintenance.
According to East Africa Community (2013), it is stated that dry beans for human consumption should meet the specifications set out in the East African
Standards for dry beans.9 These are can be summarized as the quality requirements, general requirements, specific requirements, contaminants, Hygiene,
packaging and labeling requirements.
2.6 Limitations to bean consumption
One of the biggest limiting factors to bean consumption is the time required to cook them and, consequently, the amount of fuel or firewood required for
cooking. According to UNDP 2010 report on the bean value chain, consumption has been marginal over the years due to the reduction in per capita
consumption of beans caused by:10
• The hard to cook characteristics of beans which require a lot of time to cook and consume a considerable amount of energy. This characteristic of
beans make urban consumer biased against bean based meals due to the inadequacy in the time they have to prepare food,
• The effect of flatulence on consumers causing discomfort to consumer
• A wrong perception has been assigned to bean meals branding them as inferior. This can be seen in some names given to beans such as ‘poor man’s
meat’ and the minimal attention on building consumers’ demand.
Other factors explaining slow development of the bean sub-sector include: under-developed bean markets as most of the trade is informal with very few
market off-takers and limited value addition
8 http://www.usdrybeans.com/nutrition/guidelines/
9 East African Community. 2013. Final Draft East African Standard :Dry beans specifications, East African Community
10 UNDP.2012. A Value Chain Analysis of the Dry Bean Sub-sector in Uganda

The low status accorded to beans by consumers is caused by the high infestation of beans with storage pests especially “bruchids” and Hard to cook effect
(HTC) as a result of inadequate postharvest handling and poor storage, poor storage also leads to high post-harvest losses of beans leading to increased prices
for the consumer and low returns for the producers, and the current inadequate value addition processing into bean-food-products is also caused by poor
post-harvest handling which reduces the quality of raw beans with respect to the basic requirements for processing.
2.6 Opportunities in the beans sub-sector
According to the Uganda Investment Authority (UIA) report on the foods and beverages industry, market for dry beans exists, locally, regionally, and
internationally. Demand exists in East and Western Uganda, across borders within the region and for relief agencies (up to 300,000 MT per annum)11 with the
instability in the region fueling the demand. Within the region, beans could be canned for the local, regional and export markets.
2.7 The potential for dehydrated precooked beans
Beans are a key source of protein among low income households and institutions. In recent years, the rapid expansion of urban populations, rising incomes,
and high costs of energy have fuelled the demand for fast-cooking, processed foods. Canned or frozen beans are sometimes available, but are only affordable
to a minority of wealthy consumers. Developing affordable bean products is therefore increasingly important.
According to the Kenyan National Agricultural Research Organization, by engaging farmers and the private sector to introduce a range of precooked bean
products to suit different consumers, the East African precooked beans' project will impact in a number of ways farmers and consumers across East
Africa. This is further emphasized by the Director of National Crops Resources Research Institute (NaCRRI) as published in the Daily Monitor in 2015, that
processing pre-cooked beans there will improve nutrition content, incomes and conserve the environment in terms of saving on biomass energy as well as
boost farmer production of beans since there will be ready market provided by processing industries.
In a similar thought Ugen, M. (2014), emphasizes that developing a viable precooked bean industry requires reliable production of appropriate bean varieties,
effective marketing systems, and competitive food products acceptable to consumers.12 He further adds that dehydrated precooked beans if introduced will
have the following benefits;
11 UIA.2000. Investing in Uganda`s food and beverages Industry
12 Ugen, M. (2014). precooked beans for nutrition ,food and income in Uganda. Kampala, Uganda : National Agriculture Research Organization
• Increased availability of bean varieties with high nutritional content (protein, iron, and zinc) suitable for precooking, produced by 7,500 smallholder
farmers.
• Increased bean production at the household level, supported by increased market demand.
• Job creation in new agro-enterprises at various stages of the value chain (production, grading, bulking, packaging, transportation, and marketing),
especially for women and youth.
• Increased incomes at household level from the sale of beans.
• Greater consumption of beans by households in rural, urban, and peri-urban areas.
• Less wood used in cooking beans and less time spent by women collecting it.
• Empowerment of various social groups (women, men, and youth) engaged in adding value to beans.
The need to develop a bean product that will take a much shorter preparation time yet still affordable comes with a need for the private sector to collaborate
with farmers to boost the bean value chain. With a product in mind such as dehydrated precooked beans, that can possibly address these needs, there is a
need to first of all conduct a feasibility study for this product to establish whether it is viable to invest in its production and secondly to test the product with
the intended consumers to find out whether it will be accepted.
CHAPTER 3 – RESEARCH METHODOLOGY
3.1 Study Design
The design of this survey was formative in nature. This survey was conducted using quantitative methods of sampling, data collection and analysis study. Face-
to-face Personal interview approach was used during collection of data. The survey was single phased and encompassed both the feasibility study component
as well as the product test component. Described below were the survey procedures followed:
Survey Procedures

• The survey was done in schools, relief agencies, government bodies and food services industry (Kikomando joints and restaurants). These institutions were
sampled from the urban/rural setting of Kampala, Jinja, Mbarara, and Gulu.
• We used a single phased approach where both the feasibility study and product test were done concurrently.
• Due to the nature of the respondents, for all the interviews, appointments were set with the various in charges at each of the institutions prior to the time
of the interview and respondents informed of the need to take part in both the feasibility study as well as the product test. At this point, the in charges
were also informed of any assistance we needed from them in terms of space to carry out the product test as well as a list of potential respondents we
needed to take part in the survey. The in charges provided consent for the institution`s willingness to participate in the survey and also facilitated the
availability of other respondents.
• On the date of the interview, the interviewers were tasked with ensuring that the in charge avails them with the appropriate respondents and again obtain
individual consent from these respondents. for example in schools we interviewed the bursar/HM/Deputy Head teacher (i.e. any one of them that was
well versed with the purchase activities of the institution), a head cook, and 12 learners, in Kikomando joints & restaurants, we interviewed the business
owner or someone who managed the day-to-day running of the business, In relief agencies and government institutions, we interviewed the person in
charge of procurement.
• At each institution, an average interview of both feasibility study and product test took between 2 hours to two hours and 30 minutes.
3.2 Feasibility Study
We adopted the quantitative research approach. This approach entailed use of surveys that were intended to capture information on current product usage
and consumption; quantities purchased annually, challenges faced with current beans, storage practices, labour costs, fuel consumption, nutritional standards,
and acceptability of dehydrated precooked beans among others.
Information was gathered through face-to-face personal interviews with targeted primary and secondary markets. These included;
• Primary markets: School administrators
• Secondary markets: Administrators of Kikomando joints and restaurants and persons in charge of procurement/welfare in relief agencies and
government institutions.

3.2.1 Sampling
The survey took place in Kampala, Jinja, Mbarara, and Gulu. In some cases, we employed random sampling techniques, while in other cases where targeted
institutions were difficult to find or locate, purposive and snowballing techniques was used.
3.2.1.1 Schools
Within schools, the target population included the caterer/head cook who knows the amount of food cooked per day for each student/learner, the deputy
head teacher/ Head Teacher who is usually the one in charge of purchases, the school bursar who executes the purchase.
With the aid of district specific data for each of the districts, we categorised the schools as government aided and non-government aided, day and boarding,
primary and secondary, rural and urban. As such in each district, we targeted to achieve a sample of 16 schools.
Sample size
To arrive at the 16 schools, we adopted the formula for a sample size required for an experiment designed to investigate the behaviour of an unknown
population mean will be influenced by the following:
• value selected for α, the risk of rejecting a true hypothesis,
• value of β, the risk of accepting a false null hypothesis when a particular value of the alternative hypothesis is true,
• value of the population standard deviation
Assuming that α=0.05 and β=0.50 then this give us a value of 16 (you may refer to the table on
http://www.itl.nist.gov/div898/handbook/prc/section2/prc222.htm).
The number of schools per district was based on the assumption that we can able to calculate and compare means on been consumption per schools
Sampling frame

The sampling frame was a list of primary and secondary schools in the four districts of Kampala, Jinja, Mbarara and Gulu. The list got from Education
Management Information System in Uganda provided us with the data on the domains of selection that is boarding, rural and government or private. Our
sampling frame for schools the was obtained from the Ministry of Education
Sample design
Each school was taken as a cluster hence adopted cluster sampling design within the schools.
3.2.1.2 Restaurants
In each of the urban places at least three major markets were identified that serve low and middle income people in terms of meals. From each district 16
restaurant owners who manage the purchase of food were targeted to be interviewed using face-to-face approach.
3.2.1.3 Relief Agencies
The survey targeted 3 relief agencies in Kampala that invest a lot in purchasing food for relief. Individual staffs who are in charge of purchase of food for relief
in the selected agencies were the target key respondents. Out of the 3 relief agencies, only World Food programme accepted to participate in the study while
World Vision and Red Cross said they do not buy beans and were therefore unable to participate in the study. Both the two agencies indicated to us that they
are supplied beans by World Food Programme.
3.2.1.4 Government Institutions
The survey focused on institutions that purchase beans in bulk. We targeted to interview persons in charge of purchases/Welfare from 3 institutions in Kampala.
Out of the 3, only Office of the Prime Minister accepted to participate in the study while Uganda Police Force, Uganda Prisons Service, and Uganda People`s
Defence Forces (UPDF) said they can only participate in the study with permission from Ministry of Defence which required stretching of the timelines to
accommodate for securing such permission hence they were left out.
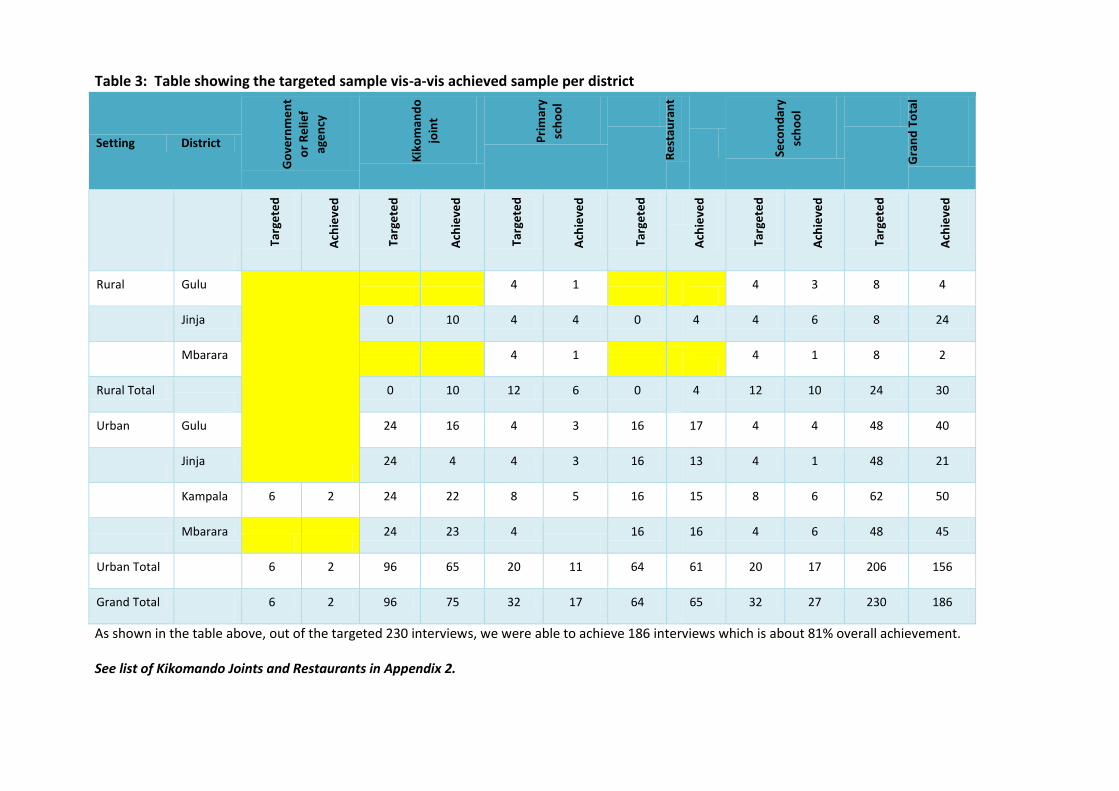
Table 3: Table showing the targeted sample vis-a-vis achieved sample per district
Setting District
Rural Gulu
4 1
4 3 8 4
Jinja 0 10 4 4 0 4 4 6 8 24
Mbarara
4 1
4 1 8 2
Rural Total
0 10 12 6 0 4 12 10 24 30
Urban Gulu 24 16 4 3 16 17 4 4 48 40
Jinja 24 4 4 3 16 13 4 1 48 21
Kampala 6 2 24 22 8 5 16 15 8 6 62 50
Mbarara
24 23 4
16 16 4 6 48 45
Urban Total
6 2 96 65 20 11 64 61 20 17 206 156
Grand Total 6 2 96 75 32 17 64 65 32 27 230 186
As shown in the table above, out of the targeted 230 interviews, we were able to achieve 186 interviews which is about 81% overall achievement.
See list of Kikomando Joints and Restaurants in Appendix 2.

3.2.2 Secondary Data
Secondary data has been gathered to validate and fill any gaps from the primary data. The RWI team of consultants has conducted desk review that has given
us the opportunity to further understand the bean market. This has been put as a separate section called Literature review. See section 2
3.3 Product Test
We adopted the quantitative research approach. This approach entailed use of surveys that were intended to capture information on the sensory reaction,
spontaneous thoughts, perceptions, likes and dislikes, pricing, acceptability of the proposed product during the product test.
Information was gathered through central location tests (CLT) with targeted primary, secondary market in Kampala, Jinja, Mbarara, and Gulu with an
urban/rural split.
Central Location Tests
This technique is appropriate in instances where contact with the product being tested is necessary. Participants were recruited at the various institutions to
participate in the research at a central, convenient and spacious location like at the cafeteria or a room recommended by the institution; the product test
was conducted and questionnaire completed at that time. Since the research required us to test one product for all the respondents, we employed the
monadic test scenario.
This scenario is used in situations where a new product is yet to be launched or is being developed for a particular set of target consumers in order to find out
whether the product will be accepted by the intended consumers.
Target respondents
We targeted the primary, secondary as explained below:-
Primary market: The targets were learners and administrators in the sampled schools within the four districts in both rural and urban setting.
Secondary market: We targeted business owners/managers in the institutions in the food service industry like Kikomando joints and restaurants, Procurement
Managers with in the relief agencies and government institutions in the urban areas of the four districts.
The criteria for inclusion will be based on the following criteria:
Should be an institution in the 4 districts where the survey is being conducted
Should have a procurement/purchase decision maker available and consenting to be interviewed/participate in this survey.
The criteria for exclusion will be failure to meet all the above criteria.
Respondent Recruitment Criteria
We targeted institutions that purchase beans more regularly and in large quantities. For a respondent to qualify for this research they had to fall in any of the
following categories; schools, institutions in the food service industry like Kikomando Joints and restaurants, relief agencies and government institutions.
Respondent Recruitment
The very institutions used for the feasibility study were given priority for the product test. To minimise on recruitment time, recruitment for the feasibility
study and product test took place at the same time implying that a respondent gave consent to participate in both studies at once.
In all institutions, upon getting consent, while the interview for the feasibility study was going on, the set up for the product test was also happening at the
same time. This was aimed at minimising time spent within an institution.
In schools, we liaised with selected teachers regarding the selection of students to participate. Students were selected from various class levels except in
schools where at the time of visit only one class was available. Upon identifying the learners and a venue, set up for the product test was done.
3.3.1 Sampling
The same institutions sampled for the feasibility study were considered for the product test. While the same administrators/owners/chefs in the institutions
sampled above took part in the product test, in the schools, we also recruited learners who are the consumers of beans.
Sample size for the learners The number of learners per school was determined using the formula below
The Kish (1965) formula was used for the sample size determination. The formula is as stated below
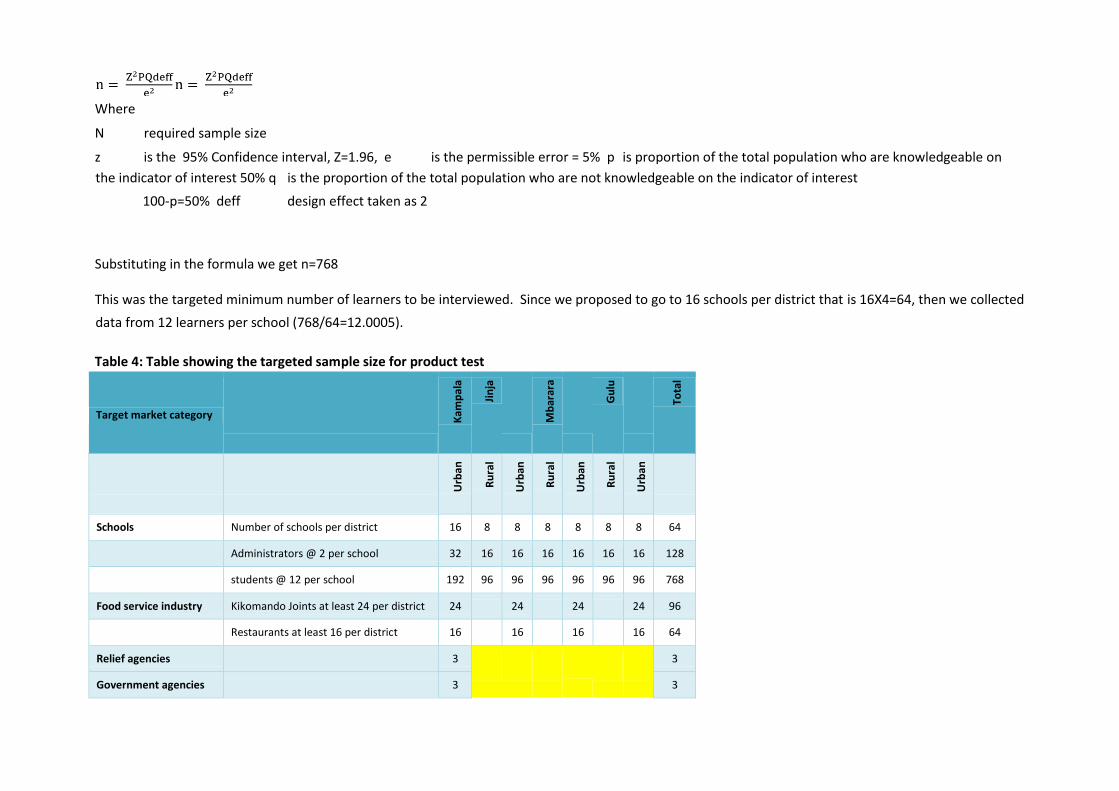
Where
N required sample size
z is the 95% Confidence interval, Z=1.96, e is the permissible error = 5% p is proportion of the total population who are knowledgeable on
the indicator of interest 50% q is the proportion of the total population who are not knowledgeable on the indicator of interest
100-p=50% deff design effect taken as 2
Substituting in the formula we get n=768
This was the targeted minimum number of learners to be interviewed. Since we proposed to go to 16 schools per district that is 16X4=64, then we collected
data from 12 learners per school (768/64=12.0005).
Table 4: Table showing the targeted sample size for product test
Target market category
Schools Number of schools per district 16 8 8 8 8 8 8 64
Administrators @ 2 per school 32 16 16 16 16 16 16 128
students @ 12 per school 192 96 96 96 96 96 96 768
Food service industry Kikomando Joints at least 24 per district 24 24 24 24 96
Restaurants at least 16 per district 16 16 16 16 64
Relief agencies 3
3
Government agencies 3 3

Targeted sample size 1,126
Table 5: Table showing the achieved sample size for product test
District Business of organization
Gulu Kikomando joint 16 16
Primary school 40
30 70
Restaurant 17 17
Secondary school 84
29 113
Gulu Total
124 92 216
Jinja Kikomando joint
10 4 14
Primary school 69 30 99
Restaurant 4 13 17
Secondary school 75 14 89
Jinja Total
158 61 219
Kampala Government or Relief agency
2 2
Kikomando joint 22 22
Primary school 95 95
Restaurant 15 15
Secondary school 77 77
Kampala Total
211 211

Mbarara Kikomando joint
25 25
Primary school 40
12 52
Restaurant 14 14
Secondary school 26
140 166
Mbarara Total
66 191 257
Grand Total 348 555 903
3.3.2 Product that was tested
The dehydrated precooked beans that were tested were provided by Gryphon Group who is in partnership with Feed the Future Uganda Commodity
Production and Marketing Activity. Every institution selected had an opportunity to test the product.
3.3.3 Order of rotation
At the end of the exercise, our objective was to ensure that each target respondent has a chance to test the product. Since it was one product, we adopted
the monadic testing where all respondents were given the opportunity to test this product.

3.4 Data Collection Procedures, Methods and Instruments
3.4.1 Tool development
We designed one tool encompassing both the feasibility study questions and product test questions. Since there were some questions that were specific to
particular institutions, we further split it into two; one tool was for schools and food service industry while the second tool was for Relief agencies and
Government institutions. These were designed in conjunction with Feed the Future Uganda Commodity Production and Marketing Activity.
3 .3.4 Beans Preparation
Light charcoal stove and bring
water to boil
Soak the product
in hot water for about 15 - 20 minutes such that it can reconstitute
Prepare your ingredients
including cooking oil, onions,
tomatoes green pepper, curry
powder, and any other spices as may be desired
In a pre - heated sauce pan, add
oil, then onions, green pepper , tomatoes, salt
and any other
spices as may be desired. After the spice mixture is ready, add your
reconstituted beans/maize. Add
an appropriate amount of water and leave to boil for 5 - 10 minutes
Thereafter, serve the
sauce with any type of
food.
Questionnaire
This was used to collect data during both the feasibility study capturing current bean consumption, usage, fuel used, constraints with current product, bean
category preferences, preferred nutritional standards, acceptability of a dehydrated pre-cooked bean product, an estimate of size and scope of the proposed
product, acceptability of dehydrated precooked beans and the product test capturing spontaneous thoughts and perceptions towards the product, likes and
dislikes likelihood to purchase and prices.
The tools used were in English since all selected respondents had a minimum education background that enabled them to communicate in English.
3.4.2 Pre-testing of instruments
The data collection tool was pre-tested internally to test the flow of the tool, comprehension, ease or difficulty of administration and statement, level of
discomfort, confidence in response, and social desirability. The interviews were be led by interviewers.
Consent forms and information sheets were being prepared. The information sheets among others gave summarized but exhaustive information about FTF-
CPM, study goals, study exclusion and inclusion criteria and relevant contacts to refer to in case of discontent by the respondent.
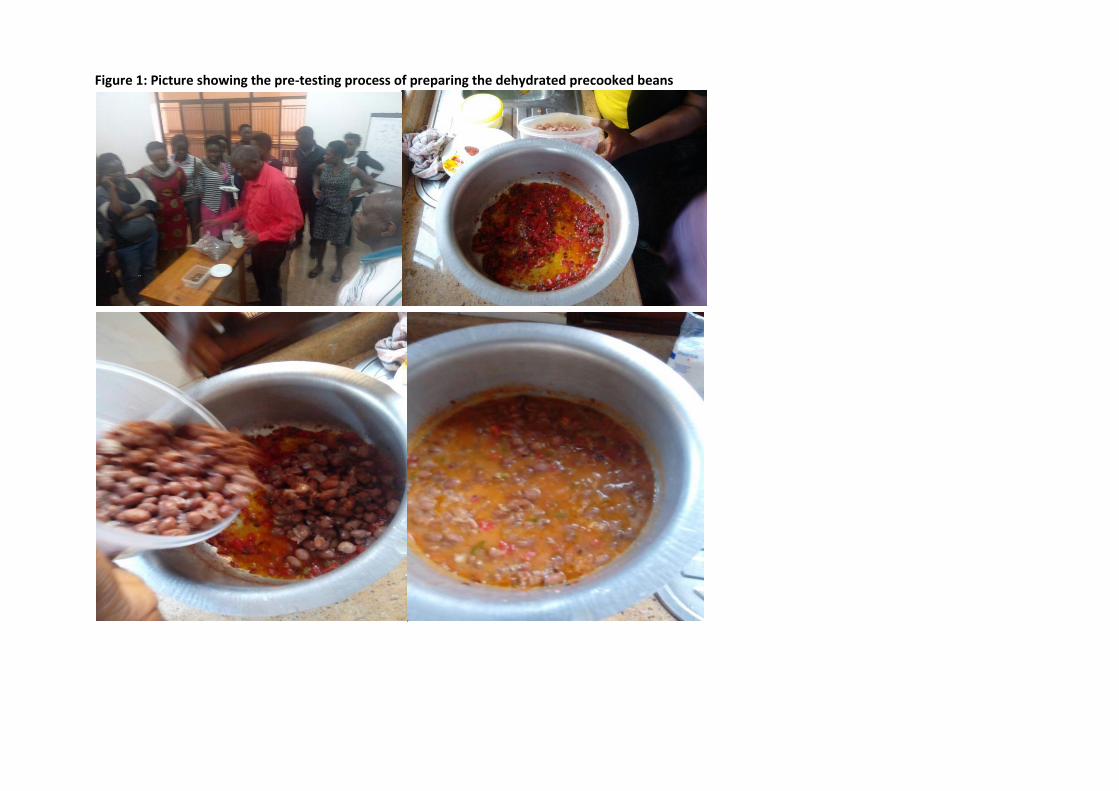
Figure 1: Picture showing the pre-testing process of preparing the dehydrated precooked beans

3.4.3 Tool administration
The questionnaire was administered by the interviewer by reading questions aloud and prompting where necessary. Respondents tested the product sample
availed after which they shared their feedback to the interviewer noted the responses onto the hard copy questionnaire after which they were keyed in
Mobile phones. Mobile phones were programmed with the questionnaire for data collection using Survey Togo platform. All interviews were done face to
face between the interviewer and respondents.
Figure 2: Picture showing the tool being administered by an interviewer to the learners
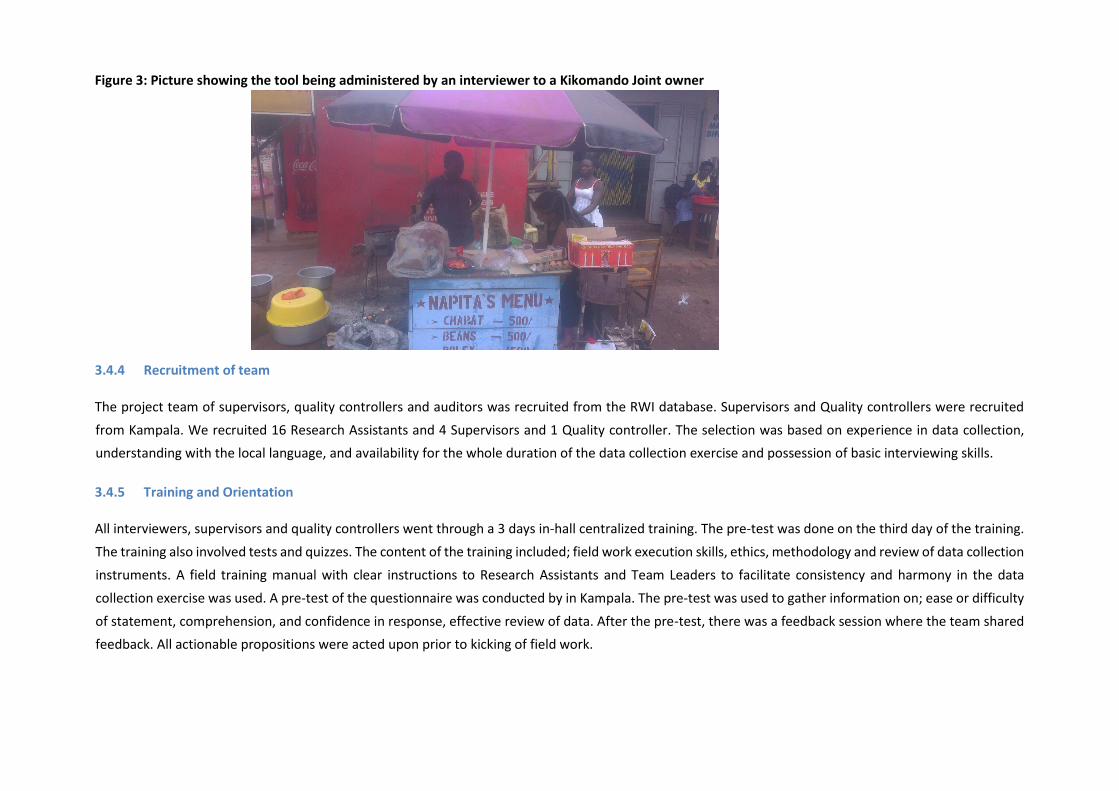
Figure 3: Picture showing the tool being administered by an interviewer to a Kikomando Joint owner
3.4.4 Recruitment of team
The project team of supervisors, quality controllers and auditors was recruited from the RWI database. Supervisors and Quality controllers were recruited
from Kampala. We recruited 16 Research Assistants and 4 Supervisors and 1 Quality controller. The selection was based on experience in data collection,
understanding with the local language, and availability for the whole duration of the data collection exercise and possession of basic interviewing skills.
3.4.5 Training and Orientation
All interviewers, supervisors and quality controllers went through a 3 days in-hall centralized training. The pre-test was done on the third day of the training.
The training also involved tests and quizzes. The content of the training included; field work execution skills, ethics, methodology and review of data collection
instruments. A field training manual with clear instructions to Research Assistants and Team Leaders to facilitate consistency and harmony in the data
collection exercise was used. A pre-test of the questionnaire was conducted by in Kampala. The pre-test was used to gather information on; ease or difficulty
of statement, comprehension, and confidence in response, effective review of data. After the pre-test, there was a feedback session where the team shared
feedback. All actionable propositions were acted upon prior to kicking of field work.
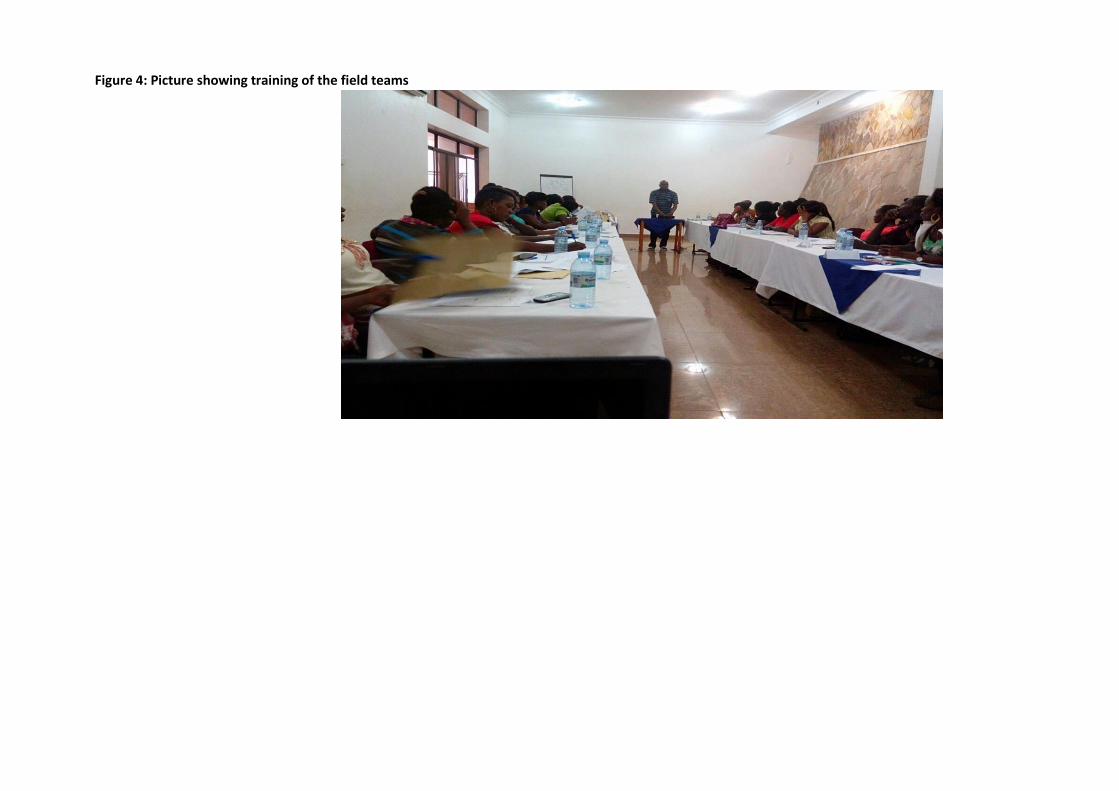
Figure 4: Picture showing training of the field teams

Figure 5: Picture showing training of the field teams

3.4.6 Data Collection process explained further
Every institution was assigned 2 interviewers and 1 supervisor.
Upon arrival at the institution, interviewers were required to introduce themselves to the attendant and seek for permission to talk to the person with whom
the appointment was secured. After identifying the contact person, the interviewers had to reintroduce themselves, RWI, Feed the Future-CPM and the study
to this person including any assistance they required. In cases, where the contact person was not the appropriate respondent, they were required to request
for the right respondent.
Upon getting consent to participate in the survey from the appropriate respondent, they would bring to their attention the need for the head cook, and the
learners. After which, as one of the interviewers proceeded with the feasibility study, the 2nd interviewer was required to set up for the product test and
organize the learners.
Upon completion of the feasibility study interview, the team then proceeded to take part in the product test.
During the product test in schools, we adopted the classroom approach where learners were given the opportunity to fill in their own questionnaire with the
help of the interviewers. The class room approach has a number of advantages;
Upon completion of the product test, interviewers were encouraged to thank respondents for their time before proceeding to the next institution.
In cases where the respondent was not available at the agreed time, the team would request for a reschedule. Every institution was given at least 2 call backs,
after which we had to substitute with another institution of the same characteristics.
3.5 Data Processing, Analysis, Management and Reporting
3.5.1 Data Processing
As earlier stated, for this project, all data processing was done in-house. During Scripting of the questionnaire into the Tabs, quality and logic checks were put
into consideration to ensure that no outliers in the data are accepted. All data was stored on our in-house server. RWI has in-house desk quality controllers
for this project. They are tasked with reviewing the data on a daily basis. All data was reviewed and approved before cleaning and analysis can start.

3.5.2 Data analysis
Data was analyzed using univariate analysis (such as analysis of single-variable distributions), bivariate analysis, and more generally, multivariate analysis.
Multivariate analysis refers to all statistical methods that simultaneously analyze multiple measurements on each individual or object under investigation. As
such, many multivariate techniques are extensions of univariate and bivariate analysis. We used Stata, SPSS and excel spread sheet for the analysis
3.6 Quality Control
Recruitment and Training of Interviewers: Suitable interviewers were selected from the RWI database. During selection, priority was given to interviewers
that had a mix of skills and experiences required in the retail audit.
Accompaniments: The Field Supervisor & team leaders accompanied 10% of all interviews conducted by each interviewer. The purpose of this was to ensure
that the interviewers followed all the instructions and procedures and conducted the interviews according to standards specified. While accompanying, the
Field Supervisors kept note of all problems encountered.
Physical Back-checks: Of all interviews conducted by each interviewer, 5% was back-checked. The Field Supervisors made direct and personal contact with
the respondent (face-to-face) to ascertain whether the interviews were done. They also re-asked a few relevant questions to validate some of the data and
answers given by the respondent.
Call backs: During data collection we occasionally called back the outlets to confirm whether our auditors indeed visited the outlets. Our quality controller
was required to make call backs of not less than 30% of the sample.
Spot checks: The Quality Controller and supervisors made unannounced spot-checks on the field team. This way, the field team was kept in check.
Communication with the office: A Whatsapp group was used for day to day communication among the teams. This was used to share any challenges faced
so that other interviewers could see and learn simultaneously. Supervisors were also under strict instruction to call the office and share updates every day.
Itinerary: An itinerary for both the field supervisors and interviewers was developed and followed during fieldwork and any changes were communicated to
the office in time. The itinerary for the interviewer clearly stated the date, the location, daily activity and the interviews to be done in each area. The field
supervisor’s itinerary indicates the number of questionnaires to be accompanied, spot checked and back-checked.
CHAPTER 4 – SURVEY FINDINGS
This chapter presents the findings for both the Feasibility study and product test of dehydrated precooked beans. It is has been sectioned into two; section I
entails the feasibility study findings while section II entails the new product evaluation findings.
The data has been aggregated by total sample, institution type, district, and urban and rural split. This data was collected from 19th October 2016 to 4th
November 2016.
SECTION I: FEASIBILITY STUDY FINDINGS
This section entails findings focused on the current bean market in Uganda and well as the acceptability of a dehydrated precooked bean product in Uganda`s
institutional market. This includes; size and scope of the institutional market, bean category preferences, data on current bean consumption and usage,
nutritional standards preferences, fuel consumption, challenges with current beans, storage practices, labour and transportation costs for beans in Uganda
institutional market.
4.1 Size & Scope of institutional market of beans in Uganda
This sub section entails findings focused on the current bean market. It includes; beans purchase, source of beans, average quantities purchased, frequency
of purchase, pricing of beans, market size of beans, projected annual demand for beans, storage practices, fuel consumption, labour & transportation, and
feedback on quality of beans.

4.1.1 Beans Purchase
Figure 6: A figure showing proportion of institutions that purchase beans and place of purchase
99%
1%
Portion of schools that purchase beans every semester.
Yes No
Obtain beans from school garden:
Farmers2%
Produce stores18%
Retail Shops71%
Others9%
Where institutions buy their beans.
Farmers Produce stores Retail Shops Others
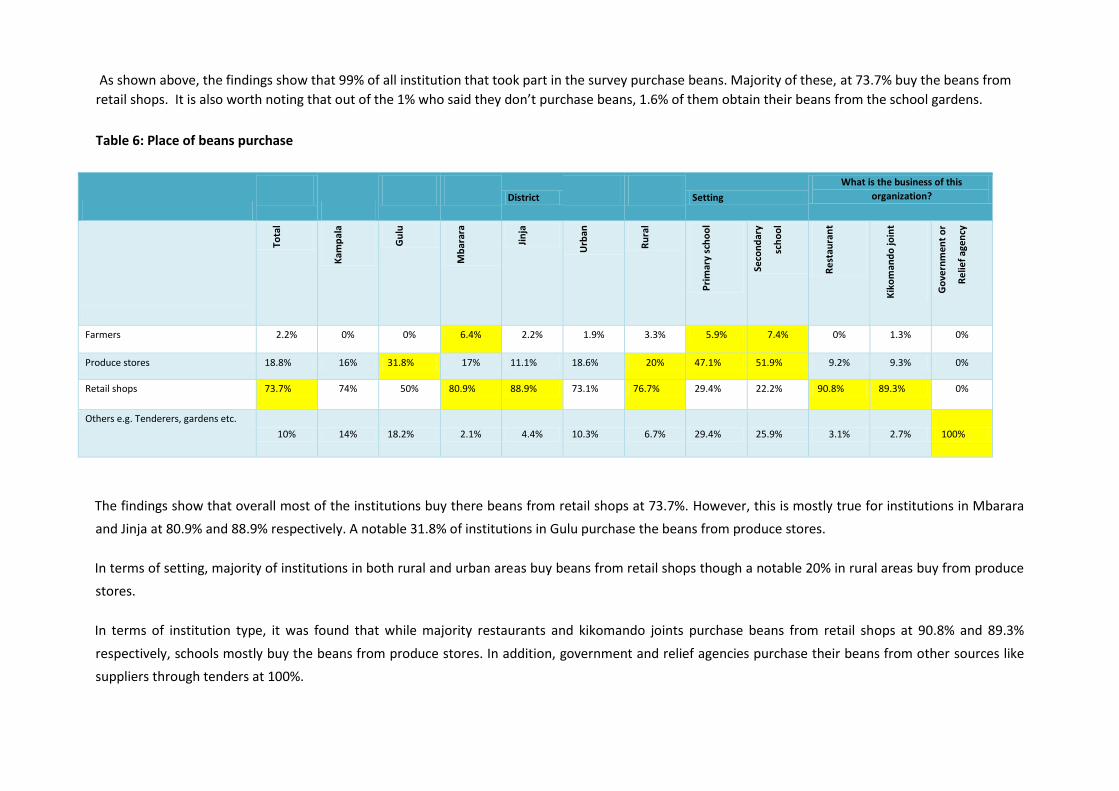
As shown above, the findings show that 99% of all institution that took part in the survey purchase beans. Majority of these, at 73.7% buy the beans from
retail shops. It is also worth noting that out of the 1% who said they don’t purchase beans, 1.6% of them obtain their beans from the school gardens.
Table 6: Place of beans purchase
District
Setting
What is the business of this
organization?
Farmers 2.2% 0% 0% 6.4% 2.2% 1.9% 3.3% 5.9% 7.4% 0% 1.3% 0%
Produce stores 18.8% 16% 31.8% 17% 11.1% 18.6% 20% 47.1% 51.9% 9.2% 9.3% 0%
Retail shops 73.7% 74% 50% 80.9% 88.9% 73.1% 76.7% 29.4% 22.2% 90.8% 89.3% 0%
Others e.g. Tenderers, gardens etc. 10% 14% 18.2% 2.1% 4.4% 10.3% 6.7% 29.4% 25.9% 3.1% 2.7% 100%
The findings show that overall most of the institutions buy there beans from retail shops at 73.7%. However, this is mostly true for institutions in Mbarara
and Jinja at 80.9% and 88.9% respectively. A notable 31.8% of institutions in Gulu purchase the beans from produce stores.
In terms of setting, majority of institutions in both rural and urban areas buy beans from retail shops though a notable 20% in rural areas buy from produce
stores.
In terms of institution type, it was found that while majority restaurants and kikomando joints purchase beans from retail shops at 90.8% and 89.3%
respectively, schools mostly buy the beans from produce stores. In addition, government and relief agencies purchase their beans from other sources like
suppliers through tenders at 100%.

Table 7: Frequency of beans purchase
Total Primary school Secondary school Restaur ant Kikomando joint
Government or
Relief agency
Base 186 17 27 65 75 *2
Daily 69.9% 5.9% 0% 92.3% 92% 0%
Weekly 5.4% 5.9% 11.1% 4.6% 4% 0%
Monthly 8.6% 41.2% 25.9% 1.5% 1.3% 0%
Quarterly/termly 8.6% 29.4% 37% 0% 0% 50%
Semi annually 1.1% 0% 0% 1.5% 1.3% 0%
Others e.g. whenever there is a need 6.5% 17.6% 25.9% 0% 1.3% 50%
The findings show that majority of institutions buy the beans on a daily basis at 69.9% though this is largely true for restaurants at 92.3% and Kikomando
joints at 92%.
Looking at the schools, majority of primary schools buy their beans on a monthly basis at 41.2%, and most secondary schools purchase the beans on a termly
basis at 37%. In addition, government agencies and relief agencies mostly buy on a quarterly/termly basis and whenever there is a need at 50% and 50%
respectively.
Table 8: Quantities of beans purchased per time
Min(Kg) Max(Kg) Mean(Kg)
Business of organization
Kikomando joint (37%) 0.5 30 5
Restaurant (32%) 1 2,000 66
Primary school (15%) 3 15,000 1,643
Secondary school (13%) 319 115,000 9,598

Government or Relief agency (0%) 1,000 1,500,000 750,500
Total (100%) 0.5 1,500,000 9,638
Table 8 shows, overall the minimum quantity of beans that can be purchased at any given time by an institution is 0.5 Kg while the maxim quantity is 1,500,000
Kg of beans. The findings show that on average primary schools purchase 1,643 Kgs of beans whenever they make a purchase while secondary schools
purchase 9,598 Kg of beans. In addition, government/relief agencies purchase 750,500 Kg of beans on average whenever they make a purchase.
Comparing frequency of purchase and quantities of beans purchased at any given time, while schools and government or relief agencies purchase less times,
they usually buy beans in larger quantities than Kikomando and Restaurants that tend buy more often (on a daily basis). Table 9: Packaging size
Total Primary school
Secondary school Restaurant Kikomando joint
Government or Relief agency
Base 186 17 27 65 75 *2
1KG 44% 5.9% 7.4% 56.9% 56.2% 0%
2KG 9.2% 0% 0% 15.4% 9.6% 0%
100KG 31% 82.4% 70.4% 15.4% 17.8% 50%
Other 15.8% 11.8% 22.2% 12.3% 16.4% 50%
44% of the institutions purchase beans packed in 1Kg while 31% of the institutions buy beans packed in 100kgs.
The restaurants and Kikomando Joints are the institutions that mainly buy beans packed in 1Kg while Primary schools, secondary schools and government or
relief agencies mainly buy beans packed in 100kgs.

4.1.2 Pricing of beans
Table 10: Pricing of 1kg of beans
Min (UGX.) Max (UGX.) Mean (UGX.)
Business of organization
Primary school (15%) 1,800 3,000 2,588
Secondary school (13%) 1,800 3,500 2,461
Restaurant (32%) 2,000 4,500 2,634
Kikomando joint (37%) 1,200 3,800 2,635
Government or Relief agency (0%) 2,100 2,800 2,450
Total (100%) 1,200 4,500 2,603
Setting
Urban (61%) 1,200 4,500 2,599
Rural (38%) 1,800 3,200 2,623
Total (100%) 1,200 4,500 2,603

Findings show that overall, average price paid for 1 Kilogram of beans is UGX. 2603. However, it tends to be lower for institutions in urban areas at UGX.2,
599 and highest for Kikomando joints who but it averagely at UGX. 2,635.
The lowest price at which the beans are bought is UGX. 1,200 by Kikomando joints in urban areas while the highest price is UGX. 4,500 by restaurants in urban
areas
Comparing quantities purchased and pricing per Kg, institutions that buy in beans large quantities ant any given time (schools and government/relief
agencies) have their average price per Kg lower than those that buy in less quantities (Restaurants & Kikomando Joints) that is between UGX.2,450UGX.2,588
and between UGX. 2,634-UGX.2, 635 respectively.
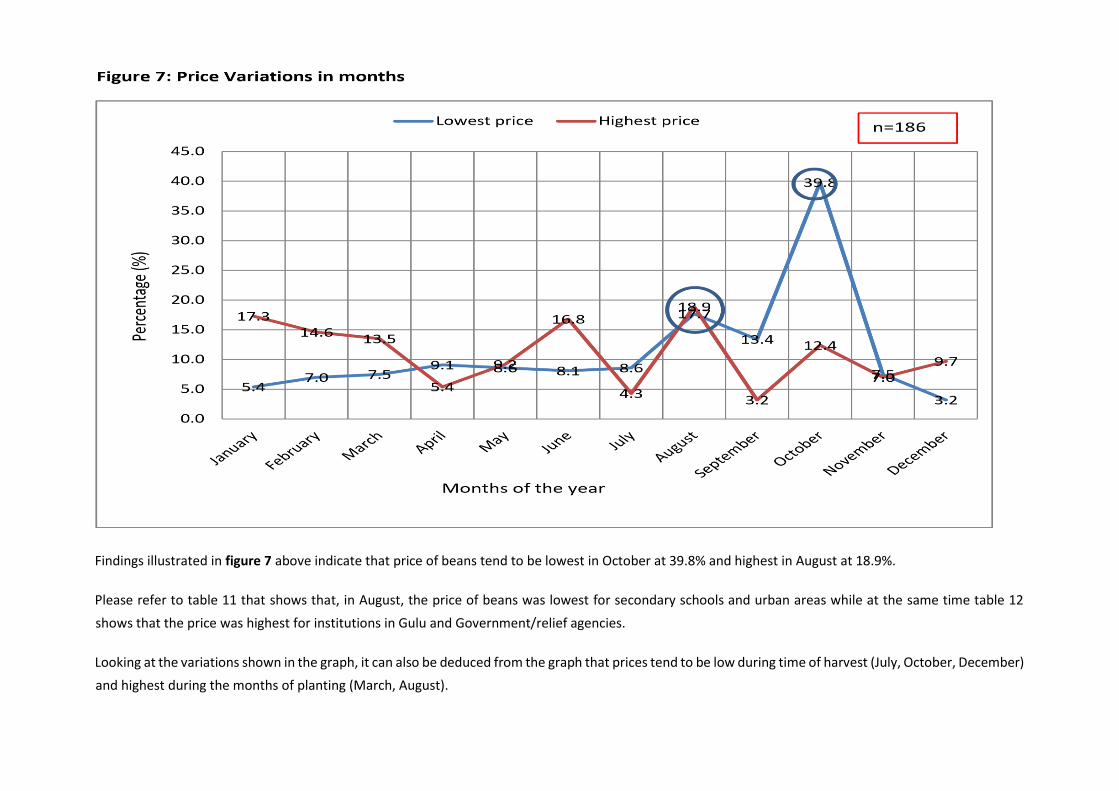
Findings illustrated in figure 7 above indicate that price of beans tend to be lowest in October at 39.8% and highest in August at 18.9%.
Please refer to table 11 that shows that, in August, the price of beans was lowest for secondary schools and urban areas while at the same time table 12
shows that the price was highest for institutions in Gulu and Government/relief agencies.
Looking at the variations shown in the graph, it can also be deduced from the graph that prices tend to be low during time of harvest (July, October, December)
and highest during the months of planting (March, August).

Table 11: A table showing months of the year when price of beans is lowest
District Setting What is the business of this organization?
Base 50 44 47 45 156 30 17 27 65 75 *2 186
% % % % % % % % % % % %
January 2.0 13.6 0.0 6.7 4.5 10.0 23.5 7.4 1.5 4.0 0.0 5.4
February 6.0 13.6 0.0 8.9 6.4 10.0 17.6 3.7 6.2 6.7 0.0 7.0
March 8.0 13.6 2.1 6.7 7.1 10.0 5.9 11.1 4.6 8.0 50.0 7.5
April 4.0 20.5 2.1 11.1 10.3 3.3 5.9 7.4 12.3 6.7 50.0 9.1
May 4.0 22.7 4.3 4.4 9.0 6.7 5.9 7.4 12.3 6.7 0.0 8.6
June 4.0 29.5 0.0 0.0 8.3 6.7 23.5 11.1 7.7 4.0 0.0 8.1
July 2.0 15.9 14.9 2.2 9.0 6.7 11.8 11.1 7.7 8.0 0.0 8.6
August 26.0 6.8 19.1 17.8 17.9 16.7 17.6 22.2 15.4 18.7 0.0 17.7
September 20.0 9.1 12.8 11.1 13.5 13.3 11.8 14.8 18.5 9.3 0.0 13.4
October 50.0 6.8 59.6 40.0 38.5 46.7 29.4 44.4 38.5 40.0 100.0 39.8
November 12.0 2.3 6.4 8.9 8.3 3.3 0.0 7.4 10.8 4.0 100.0 7.5
December 4.0 2.3 0.0 6.7 2.6 6.7 0.0 0.0 3.1 5.3 0.0 3.2
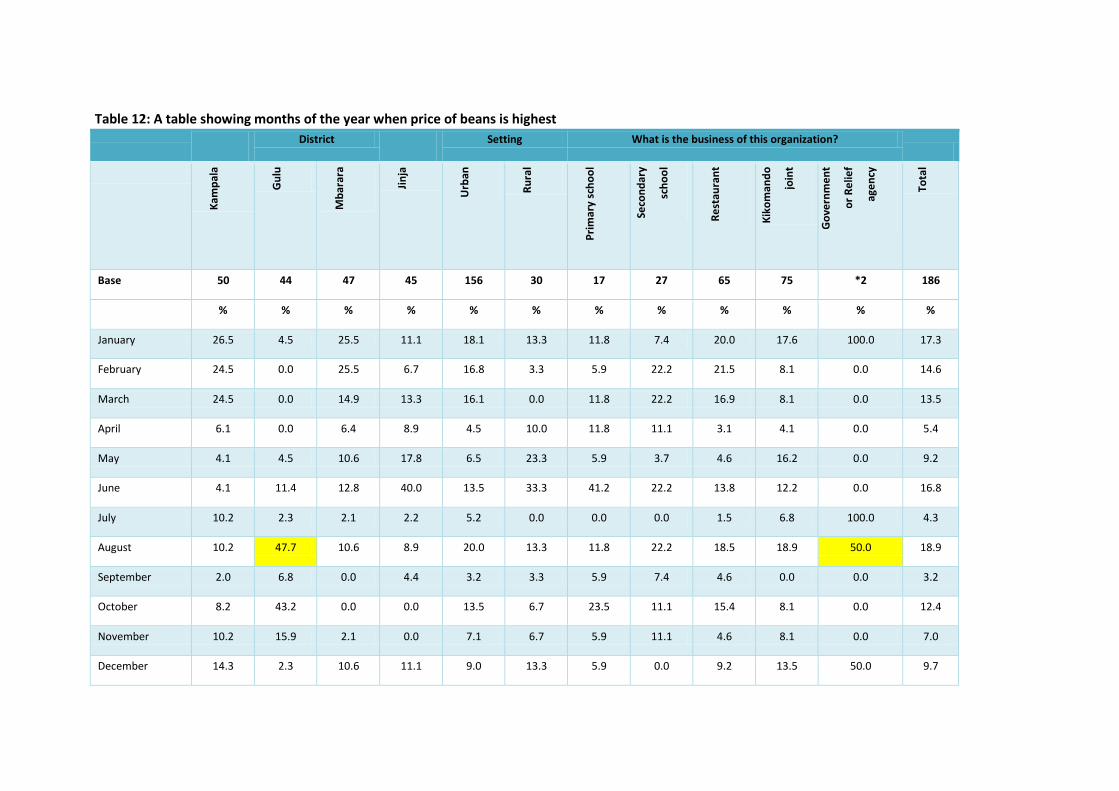
Table 12: A table showing months of the year when price of beans is highest
District Setting What is the business of this organization?
Base 50 44 47 45 156 30 17 27 65 75 *2 186
% % % % % % % % % % % %
January 26.5 4.5 25.5 11.1 18.1 13.3 11.8 7.4 20.0 17.6 100.0 17.3
February 24.5 0.0 25.5 6.7 16.8 3.3 5.9 22.2 21.5 8.1 0.0 14.6
March 24.5 0.0 14.9 13.3 16.1 0.0 11.8 22.2 16.9 8.1 0.0 13.5
April 6.1 0.0 6.4 8.9 4.5 10.0 11.8 11.1 3.1 4.1 0.0 5.4
May 4.1 4.5 10.6 17.8 6.5 23.3 5.9 3.7 4.6 16.2 0.0 9.2
June 4.1 11.4 12.8 40.0 13.5 33.3 41.2 22.2 13.8 12.2 0.0 16.8
July 10.2 2.3 2.1 2.2 5.2 0.0 0.0 0.0 1.5 6.8 100.0 4.3
August 10.2 47.7 10.6 8.9 20.0 13.3 11.8 22.2 18.5 18.9 50.0 18.9
September 2.0 6.8 0.0 4.4 3.2 3.3 5.9 7.4 4.6 0.0 0.0 3.2
October 8.2 43.2 0.0 0.0 13.5 6.7 23.5 11.1 15.4 8.1 0.0 12.4
November 10.2 15.9 2.1 0.0 7.1 6.7 5.9 11.1 4.6 8.1 0.0 7.0
December 14.3 2.3 10.6 11.1 9.0 13.3 5.9 0.0 9.2 13.5 50.0 9.7
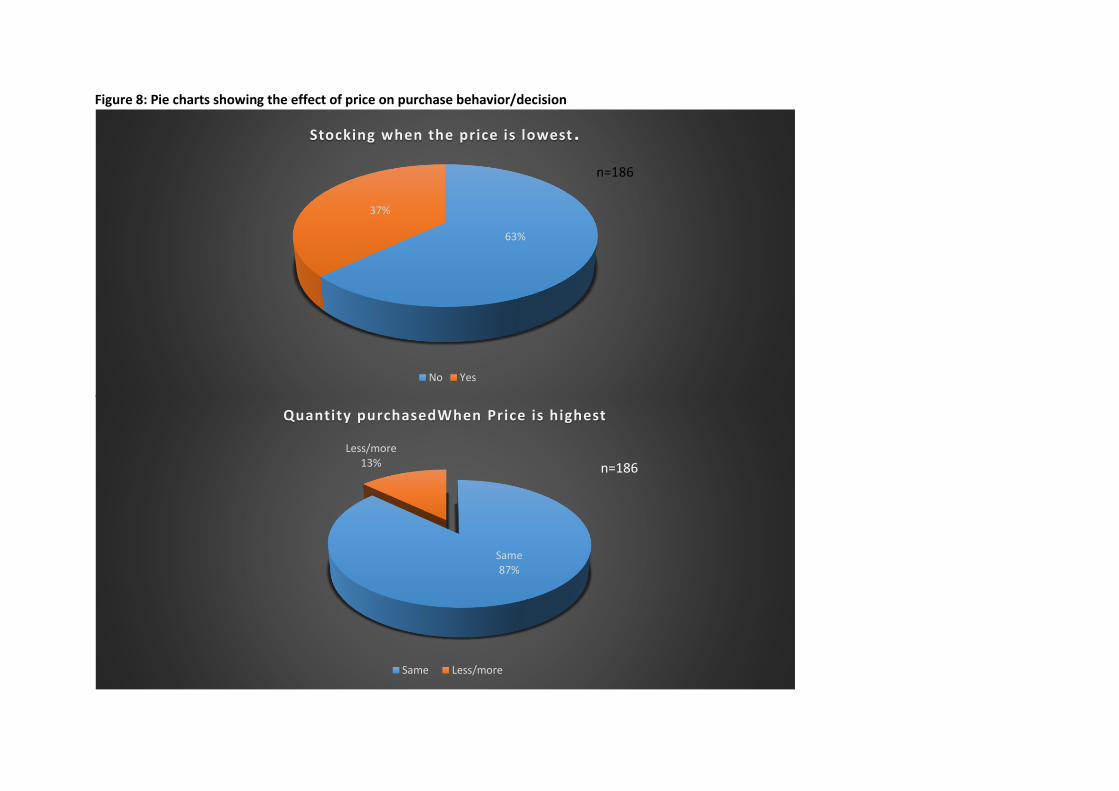
Same 87%
Less/more13%
Quantity purchasedWhen Price is highest
Same Less/more
n=186
Figure 8: Pie charts showing the effect of price on purchase behavior/decision
63%
37%
Stocking when the price is lowest .
No Yes
n=186

Findings in Figure 8 above indicate that even when prices are high, majority of the institutions buy the same quantities of beans at 87%. However, when asked
if they do some stocking when price is lowest, more than 1/3 institutions said they don`t.
We can deduce that a change in price has very small effect on an institution`s purchase behavior.
4.1.3 Quality of beans
Figure 9: A graph showing respondents thoughts on quality of beans purchased
0%
10%
20%
30%
40%
50%
60%
70%
80%
OVERALL (186)
PRIMARY SCHOOLS
(17)
SECONDARY SCHOOLS
(27)
RESTAURANT (65)
KIKOMANDO JOINT (75)
KAMPALA (50)
GULU (44) MBARARA (47)
JINJA (45) URBAN (156) RURAL (30)
17% 18%22%
14%17%
4%
18% 19%
27%
16%20%
60%
71%
59% 60%57%
60%
68%
57%53%
59%63%
20%
12%15%
25%
19%
30%
14%17% 18%
21%17%
4%0%
4%2%
7% 6%
0%
6%2%
5%
0%
.
Chart showing respondents opinions of the dry uncooked beans they purchase
Neither Good nor bad Good
TYPE OF INSTITUTION DISTRICT SETTING

Findings in Figure 9 above indicate that overall, majority of institutions think that the quality of their beans is good at 60%. This is mostly true for primary
schools at 71%, institutions in Gulu district at 68% and those in rural setting at 63%. Worth noting is that government/relief agencies are generally happy with
the quality of beans they purchase at 100%.
In terms of districts, institutions in Kampala are the most happy with the quality of beans they purchase at 90% while those in Jinja were the most unhappy
at 71%. In terms of setting, institutions in both rural and urban setting expressed the same sentiment on the quality of the beans they buy at 80% respectively.
From figure 8 below, the main reason why institutions were happy with the quality of the beans is because the beans do not have weevils at 16%.
Figure 10: A graph showing feedback on the quality of beans the various institutions purchase
Findings in figure 10 indicate that majority of the institutions said that the quality of beans was good because they did not have weevils at 16%.
0% 2% 4% 6% 8% 10% 12% 14% 16%
They do not have weevils
Customers like the beans
Short preparation time
Fresh and tender
Soup yield is good
Good overall quality
Beans may have weevils but are cheap
Tasty
Have no stones
Delicious.
16%
13%
12%
10%
9%
9%
7%
7%
7%
5%
Figure 10: Graph showing Feedback on the quality of beans the various institutions purchase
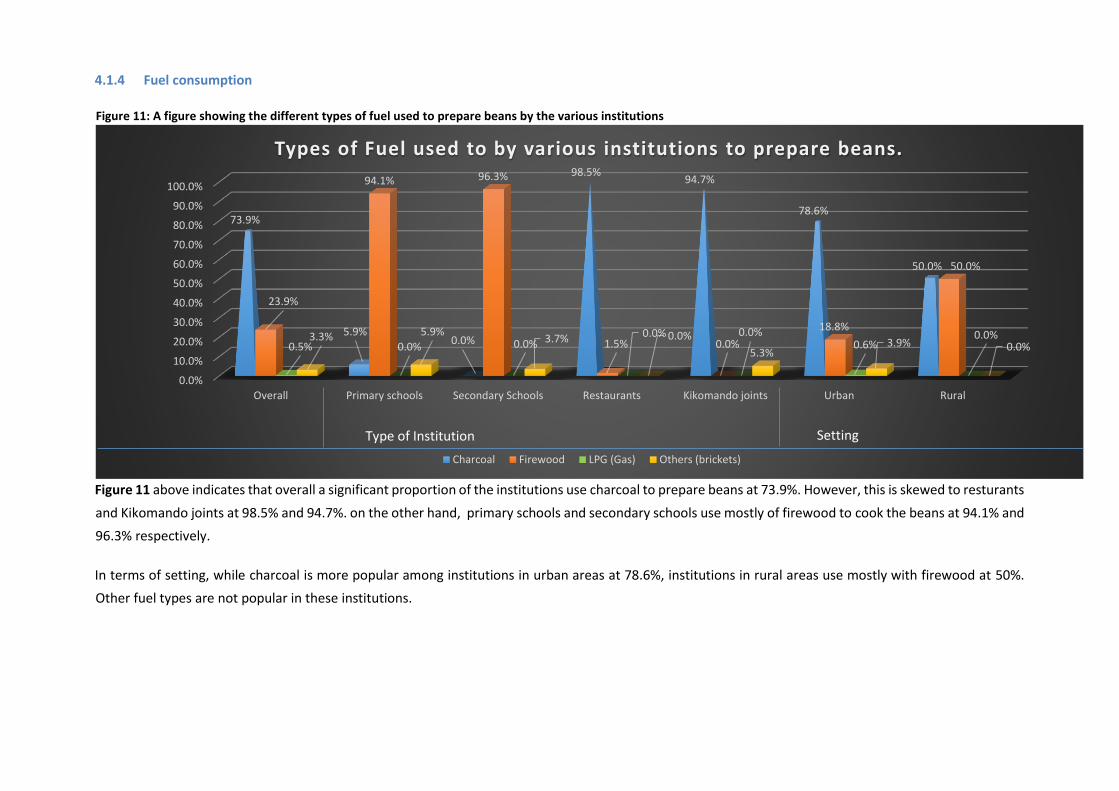
4.1.4 Fuel consumption
Figure 11: A figure showing the different types of fuel used to prepare beans by the various institutions
Figure 11 above indicates that overall a significant proportion of the institutions use charcoal to prepare beans at 73.9%. However, this is skewed to resturants
and Kikomando joints at 98.5% and 94.7%. on the other hand, primary schools and secondary schools use mostly of firewood to cook the beans at 94.1% and
96.3% respectively.
In terms of setting, while charcoal is more popular among institutions in urban areas at 78.6%, institutions in rural areas use mostly with firewood at 50%.
Other fuel types are not popular in these institutions.
0.0%
10.0%
20.0%
30.0%
40.0%
50.0%
60.0%
70.0%
80.0%
90.0%
100.0%
Overall Primary schools Secondary Schools Restaurants Kikomando joints Urban Rural
73.9%
5.9%0.0%
98.5%94.7%
78.6%
50.0%
23.9%
94.1% 96.3%
1.5% 0.0%
18.8%
50.0%
0.5% 0.0% 0.0%0.0% 0.0%
0.6%0.0%3.3% 5.9%
3.7% 0.0%
5.3%3.9% 0.0%
Types of Fuel used to by various institutions to prepare beans.
Charcoal Firewood LPG (Gas) Others (brickets)
Type of Institution Setting
Table 13: A table showing quantity of firewood spent on cooking beans per term
Tonnes of firewood Overall (44) Ty pe of institution
Primary school (17) Secondary school (27)
1-5 34% 44% 23%
6-10 14% 6% 19%
11-15 7% 13% 4%
16-20 7% 19% 0%
Above 20 39% 19% 54%
As illustrated in table 13, overall majority of schools spend above 20 tonnes of firewood on cooking beans per term at 39%. This is mostly true for secondary
schools at 54%. Primary schools mostly spend 1-5 tonnes of firewood per term at 44%.
Table 14: A table showing the various challenges faced in obtaining the fuel used in cooking beans by the various institutions
Business of organization Setting
Base 184 17 27 65 75 154 30
Expensive 48.4% 58.8% 48.1% 60.0% 36.0% 48.1% 50.0%
Difficulty in obtaining 12.0% 29.4% 37.0% 9.2% 1.3% 11.0% 16.7%
High transport costs 14.7% 35.3% 48.1% 9.2% 2.7% 13.0% 23.3%
Difficult to use 20.1% 11.8% 40.7% 12.3% 21.3% 20.8% 16.7%
Others 47.8% 52.9% 40.7% 41.5% 54.7% 46.8% 53.3%
Findings in Table 14 above indicate that overall, the biggest challenge with fuel is that it is expensive at 48.4%. This is distantly followed by the difficulty to
use at 20.1% and high transport costs at 14.7%.
Looking at the various institutions, schools have more challenges with the fuel they use to cook the beans than any other institution. Restaurants find the fuel
they use expensive at 60.0% while Kikomando joints find the fuel difficult to use at 21.3%.
In terms of setting, institutions in rural areas have more challenges in obtaining fuel than those in urban areas.
Figure 12: A figure showing solutions to the challenges faced in obtaining fuel used by various institutions
Surprisingly at 29%, majority of the respondents said that the challenges they face in obtaining fuel have no practical solutions. However, at 9% some
respondents know that ensuring charcoal obtained is of good quality and also buying & stocking once would solve the problems they have with the fuel they
obtain.
0% 5% 10% 15% 20% 25% 30%
No practical solutions
Ensure charcoal is of good quality
Buy at once and stock
Use energy saving stoves
Switch to another supplier
Use sun drying
Get from nearby tree planting
Alternative fuel sources
Contract suppliers
Purchase from the source of firewood
Use own truck for easy firewood collection
29%
9%
9%
7%
5%
5%
4%
3%
3%
2%
2%
Figure 13:Solutions to challenges of obtaining firewood cooking fuel.
Figure 13: Likelihood to buy a product that requires less fuel
From Figure 13, overall, majority of the institutions would buy a product that requires less fuel at 52.7%. This is mostly true for institutions in rural areas at
56.7%. This could probably be because as shown in Table 14 above, institutions in rural areas have more challenges in obtaining fuel than those in urban
areas.
4.1.5 Storage practices
Figure 14: A figure showing the type of storage used by the various institutions to store beans
0.0%
20.0%
40.0%
60.0%
80.0%
100.0%
120.0%
Overall (184) Primary School (17) Secondary School(27)
Restaurant (65) Kikomando joint(75)
Urban (154) Rural (30)
14.1%5.9%
22.2%15.4% 12.0% 15.6%
6.7%
52.7% 64.7%
55.6%58.5%
44.0%
51.9%56.7%
33.2% 29.4%22.2% 26.2%
44.0%32.5% 36.7%
Likehood to buy a product that requires less fuel
Not Sure Would Buy Definitely Would buy
Type of Institution Setting
Findings in Figure 14 above show that a notable proportion of institutions store their beans in sacks at 33.9%. This is mostly true for schools and
government/relief agencies as well as institutions in rural areas at 46.7%.
33.9%
88.2%92.6%
20.0%10.7%
100.0%
31.4%
46.7%
5.9%
11.8%
0.0%
4.6% 8.0%
0.0%
5.1%
6.6%
61.3%
11.8% 7.4%
75.4%81.3%
0.0%
64.1%
46.7%
Chart showing type of bean storage
Others In Containers In Sacks
TYPE OF INSTITUTION SETTING
4.1.6 Transportation
Figure 15: A figure showing mode of delivery to business premises
Findings indicate that majority of the institutions that took part in the survey have their beans delivered on foot to their premises at 69%.
0% 10% 20% 30% 40% 50% 60% 70%
On foot
Trucks
Boda Bodas
Delivered by Supplier
School van/truck
Taxi
Pickup trucks
Wheelbarrows
69%
12%
11%
5%
3%
2%
1%
1%
Figure 15: A figure showing mode of delivery to business premises

Table 15: A table showing the delivery of beans and who meets the cost of delivery
Business of organization
Who does the delivery?
Self 83.9% 52.9% 48.1% 95.4% 94.7% 50%
Supplier 17.2% 47.1% 66.7% 4.6% 2.7% 50%
Other 2.2% 0% 0% 3.1% 2.7% 0%
Who meets the cost for delivery?
Self 67.7% 58.8% 48.1% 73.8% 72% 50%
Supplier (part of the cost) 11.3% 29.4% 48.1% 1.5% 2.7% 0%
Other 21% 11.8% 3.7% 24.6% 25.3% 50%
Findings in Table 15 show that overall, majority of institutions make their own deliveries at 83.9% and also meet the cost of deliver at 67.7%. However, it is
worth noting that both scenarios are mostly true for restaurants and Kikomando joints at 95.4% and 94.7% respectively.
Deliveries to secondary schools are said to be done by mostly suppliers at 66.7% and this cost is shared between the supplier and institution at 48.1%. On the
contrary, deliveries to primary schools are mostly done by the institution itself at 52.9% and the same applies to meeting cost of delivery at 58.8%.
4.1.7 Labour
Figure 16: A figure showing challenges faced in obtaining the required labour force
Findngs in bar graph above reveal that the biggest challenge faced in obtaining the required labour force is the unreliability/untrustworthiness of workers
at 28%.
Dehydrated Precooked Beans Feasibility Study & Product Test Draft Report November 2016 Page 53 of 148
4.2 Bean category preferences
This subsection entails findings focused on bean varieties and types purchased.
4.2.1 Varieties of beans purchased
Table 16: A table showing bean varieties usually purchased
District Setting Institution type
Base 186 50 44 47 45 156 30 17 27 65 75 *2
Yellow 62% 72% 52% 55% 67% 64% 53% 47% 22% 74% 71% 0%
Nambaale 43% 56% 2% 66% 44% 45% 33% 47% 56% 45% 37% 0%
Kanyeebwa 30% 16% 43% 9% 53% 26% 50% 53% 37% 28% 24% 0%
Massavu 17% 36% 0% 4% 24% 17% 13% 12% 15% 15% 20% 0%
Others 15% 14% 14% 19% 11% 14% 20% 6% 33% 8% 13% 100%
Small white 5% 2% 11% 0% 7% 3% 17% 18% 7% 3% 3% 0%
Obote 3% 4% 9% 0% 0% 3% 7% 0% 15% 0% 3% 0%
Small black 2% 0% 7% 0% 2% 1% 7% 6% 7% 0% 1% 0%
Kaula 1% 0% 5% 0% 0% 1% 0% 6% 0% 2% 0% 0%

Looking at Table 16 findings show that overall yellow beans are the mostly purchased and preferred beans at 62% closely followed by Nambaale. This is largely
true for restaurants at 74% and Kikomando Joints at 71%, institutions in Kampala at 72% and those in urban areas at 64%.
The findings show that the popularly purchased varieties by district were, in Kampala, Yellow, Nambaale & Masavu were populary purchased varieties; in Gulu,
Small white, Obote, Small Black & Kaula; Mbarara-Nambale & other varieties, while in Jinja, Yellow, Nambaale, Kanyebwa.
In terms of setting, Institutions in urban areas largely purchase Yellow and Nambaale beans while those in rural areas buy Kanyeebwa, small white & small
black.
In terms of institution type, Primary schools mostly buy Kanyeebwa at 53%, while secondary schools mostly buy Nambaale bean variety at 56%, government
institution/relief agencies mostly buy other bean varieties.
Table 17: A table showing preferred bean varieties
District Setting Institution type
Total Kampala Gulu Mbarara Jinja Urban Rural
Primary
school Secondary
school Restaurant
Kikomand
o joint
Governme nt or Relief
agency
Base 186 50 44 47 45 156 30 17 27 65 75 *2
Yellow 38% 46% 39% 47% 20% 42% 17% 12% 15% 54% 40% 0%
Nambale 15% 22% 0% 32% 4% 17% 7% 12% 26% 11% 16% 0%
Kanyeebwa 13% 2% 34% 2% 16% 12% 20% 35% 15% 11% 9% 0%
Masavu 4% 10% 0% 2% 2% 4% 3% 0% 4% 0% 8% 0%
small white 2% 2% 7% 0% 0% 1% 7% 12% 4% 0% 1% 0%
Obote 1% 0% 5% 0% 0% 0% 7% 0% 7% 0% 0% 0%
Kaula 1% 0% 2% 0% 0% 1% 0% 0% 0% 2% 0% 0%
Dehydrated Precooked Beans Feasibility Study & Product Test Draft Report November 2016 Page 55 of 148
small black 1% 0% 2% 0% 0% 1% 0% 0% 4% 0% 0% 0%
Others 26% 18% 11% 17% 58% 23% 40% 29% 26% 23% 25% 100%
Findings in the Table 17 above indicate that overall, yellow beans were the most preferred beans variety
Looking at the districts, Yellow beans were preferred in Kampala, Gulu, and Mbarara at 46%, 39%, & 47% respectively. Institutions in Jinja prefer other beans
varieties at 58%.
In terms of setting, institutions in urban areas prefer yellow beans at 42% compared to their counterparts in rural areas that prefer other beans varieties at
40%.
Looking at institution type, Primary schools prefer Kanyeebwa beans at 35%, secondary schools prefer Nambaale beans at 26%, Restaurants and Kikomando
joints prefer yellow beans at 54% and 40% respectively. In addition, Government agencies prefer other beans varieties.
From the above findings, it is worth noting that every district has its own preferred beans variety.
4.2.2 Type of beans purchased/consumed
Figure 17: A pie chart showing types of beans purchased
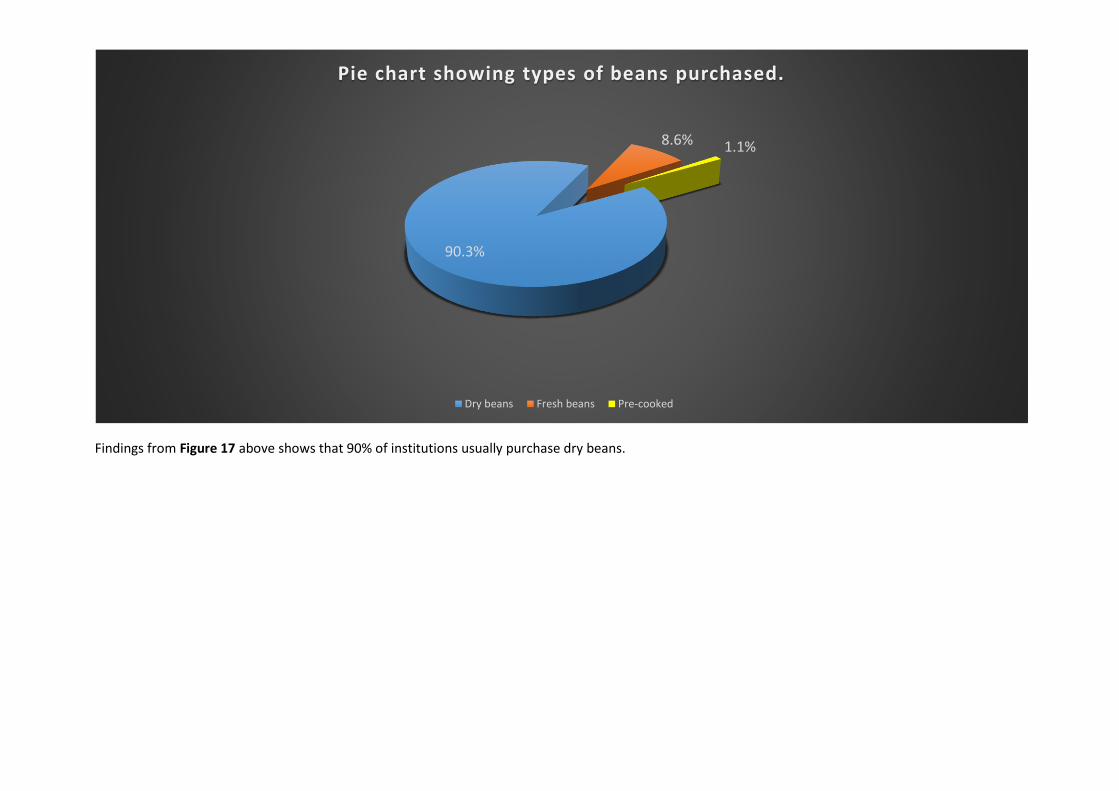
Findings from Figure 17 above shows that 90% of institutions usually purchase dry beans.
90.3%
8.6% 1.1%
Pie chart showing types of beans purchased.
Dry beans Fresh beans Pre-cooked

Dehydrated Precooked Beans Feasibility Study & Product Test Draft Report November 2016 Page 57 of 148
Findings in Figure 18 above indicate that increase in size at 29% and ease to obtain at 22% were key reason for preference of beans type.
This could imply that for any new product in the market needs to have expansion properties as well as be readily available in the market and within reach
from the various target customers.
4.3 Data on current bean consumption and usage
This sub section entails findings focused on consumption and usage of beans at by the institutional market. It includes; quantity cooked per day and factors
determining quantity cooked, preparation time, and left over handling.
4.3.1 Quantities cooked per day
Table 18: A table showing quantities of beans cooked per day by the various institutions
Min (Kg) Max (Kg) Mean (Kg)
Institution type
Primary school (17) 2 150 25.5
0% 5% 10% 15% 20% 25% 30%
They expand better
Easy to obtain
Dried uncooked beans have a long shelf life
Soup yield is good
They are cheap
Easy to store
Take less time to get ready
They are preferred by customers
Good for kikomando
The customers don’t like fresh beans
They are tasty
29%22%
19%10%
8%6%
4%3%
2%2%2%
Figure 18: Reasons for bean type preference

Secondary school (27) 5 330 74.7
Restaurant (65) 0 20 3.3
Kikomando joint (75) 0.5 30 3.9
Findings in Table 18 above indicate that on average, institutions can cook between 0.5 Kg to 330 Kg of beans. Expectedly, schools prepare more beans in a day
than any other institution but this is more skewed to secondary schools who prepare on average 74.7 kg of beans.
Dehydrated Precooked Beans Feasibility Study & Product Test Draft Report November 2016 Page 40 of 94
4.3.2 Factors that determine quantity of beans cooked
Figure 19: A bar graph showing factors that determine the quantity of beans cooked per day
Findings in Figure 19 above indicate that overall, the key determining factor for quantity of beans cooked in a day is the number of plates/customers to be
served at 48.9%. This is closely followed by the number of students/people to be served at 45.2%.
0.0% 5.0% 10.0% 15.0% 20.0% 25.0% 30.0% 35.0% 40.0% 45.0% 50.0%
Number of customers to be served
Number of students/people
Preparation time requirement
Cost of purchasing beans
Quantities available
others
48.9%
45.2%
15.6%
9.7%
9.1%
5.4%
Figure 19: A bar graph showing factors that determine the quantities of beans cooked per day
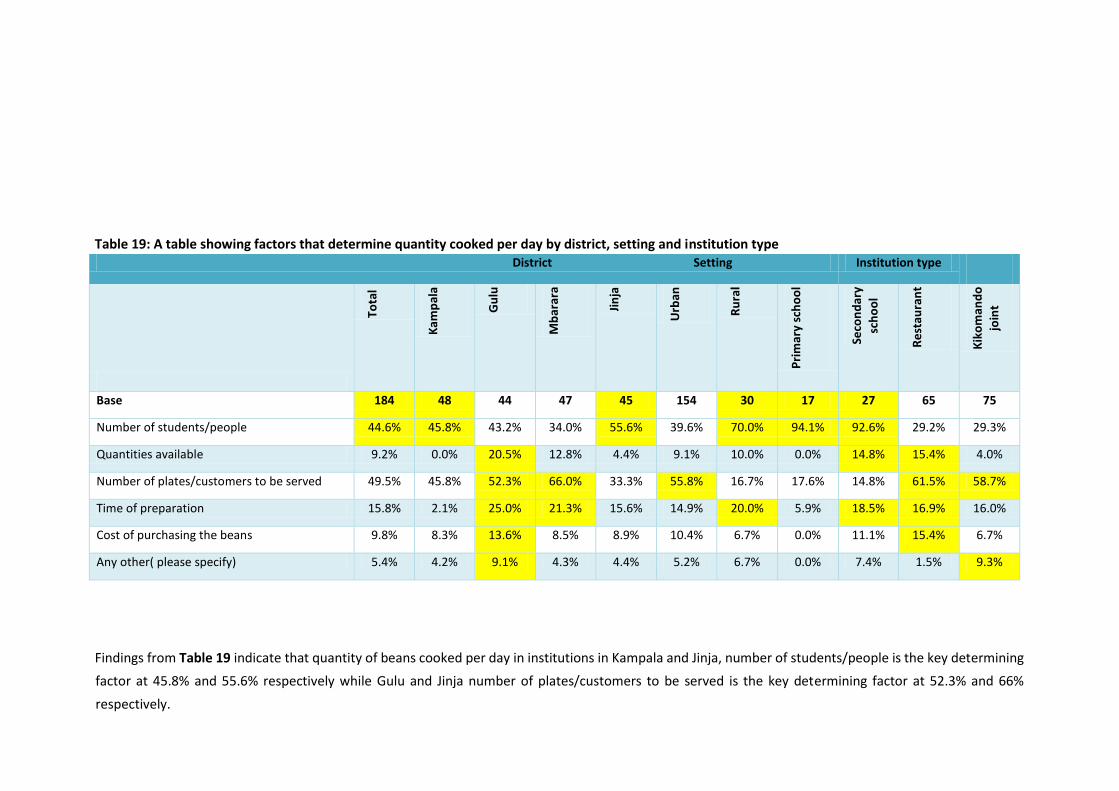
Table 19: A table showing factors that determine quantity cooked per day by district, setting and institution type District Setting Institution type
Base 184 48 44 47 45 154 30 17 27 65 75
Number of students/people 44.6% 45.8% 43.2% 34.0% 55.6% 39.6% 70.0% 94.1% 92.6% 29.2% 29.3%
Quantities available 9.2% 0.0% 20.5% 12.8% 4.4% 9.1% 10.0% 0.0% 14.8% 15.4% 4.0%
Number of plates/customers to be served 49.5% 45.8% 52.3% 66.0% 33.3% 55.8% 16.7% 17.6% 14.8% 61.5% 58.7%
Time of preparation 15.8% 2.1% 25.0% 21.3% 15.6% 14.9% 20.0% 5.9% 18.5% 16.9% 16.0%
Cost of purchasing the beans 9.8% 8.3% 13.6% 8.5% 8.9% 10.4% 6.7% 0.0% 11.1% 15.4% 6.7%
Any other( please specify) 5.4% 4.2% 9.1% 4.3% 4.4% 5.2% 6.7% 0.0% 7.4% 1.5% 9.3%
Findings from Table 19 indicate that quantity of beans cooked per day in institutions in Kampala and Jinja, number of students/people is the key determining
factor at 45.8% and 55.6% respectively while Gulu and Jinja number of plates/customers to be served is the key determining factor at 52.3% and 66%
respectively.

In terms of setting, institutions in urban areas number of plates/customers to be served is the main determining factor for quantity of beans cooked per day
at 55.8% while for those in rural areas, number of students/people is the key determining factor at 70%.
Expectedly, in schools, number of students/people to be served is the biggest determinant at over 90% while for restaurants and kikomando, it is the number
of plates/customers to be served at 61.5% and 58.7% respectively.
Based on these findings, it is worth noting that for all institutions, number of people to be served is the major determining factor of quantities cooked per
day. This could imply that institutions targeting more consumers of beans are more likely to buy and cook beans in larger quantities than those who target a
small proportion of the population.
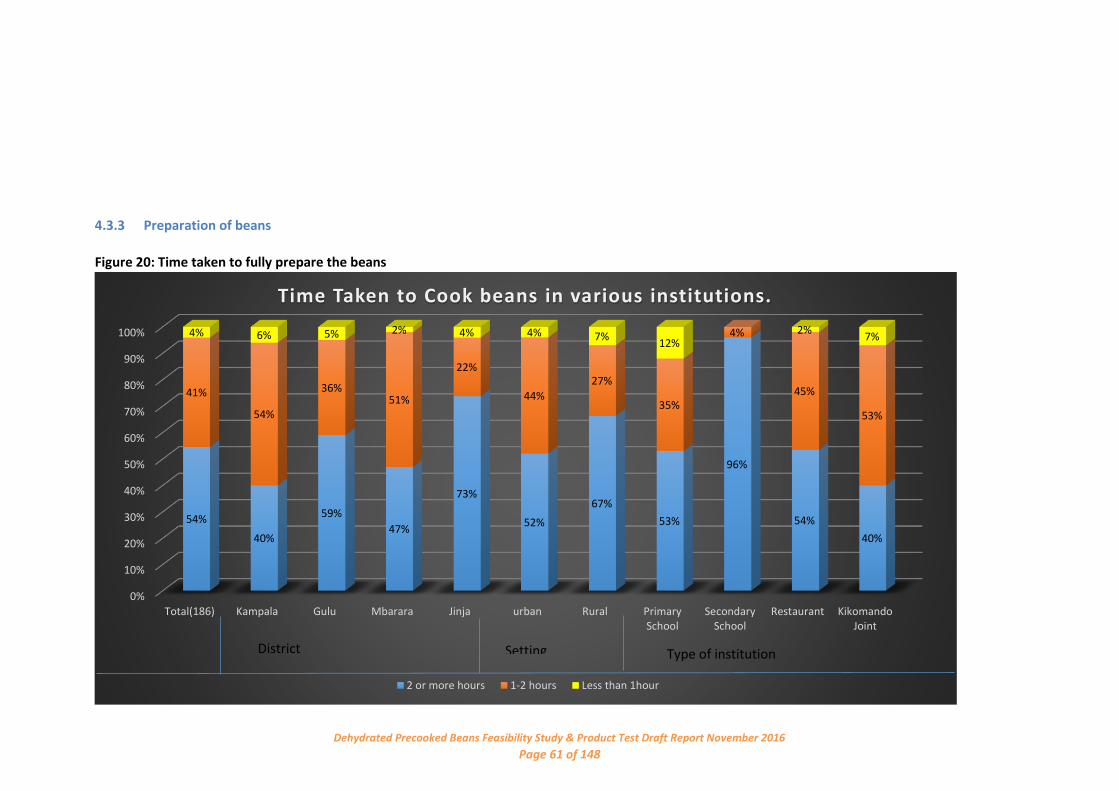
Dehydrated Precooked Beans Feasibility Study & Product Test Draft Report November 2016 Page 61 of 148
4.3.3 Preparation of beans
Figure 20: Time taken to fully prepare the beans
0%
10%
20%
30%
40%
50%
60%
70%
80%
90%
100%
Total(186) Kampala Gulu Mbarara Jinja urban Rural PrimarySchool
SecondarySchool
Restaurant KikomandoJoint
54%
40%
59%
47%
73%
52%
67%
53%
96%
54%
40%
41%
54%
36%51%
22%
44%
27%
35%
4%
45%
53%
4% 6% 5% 2% 4% 4% 7%12%
2%7%
Time Taken to Cook beans in various institutions.
2 or more hours 1-2 hours Less than 1hour
District Setting Type of institution
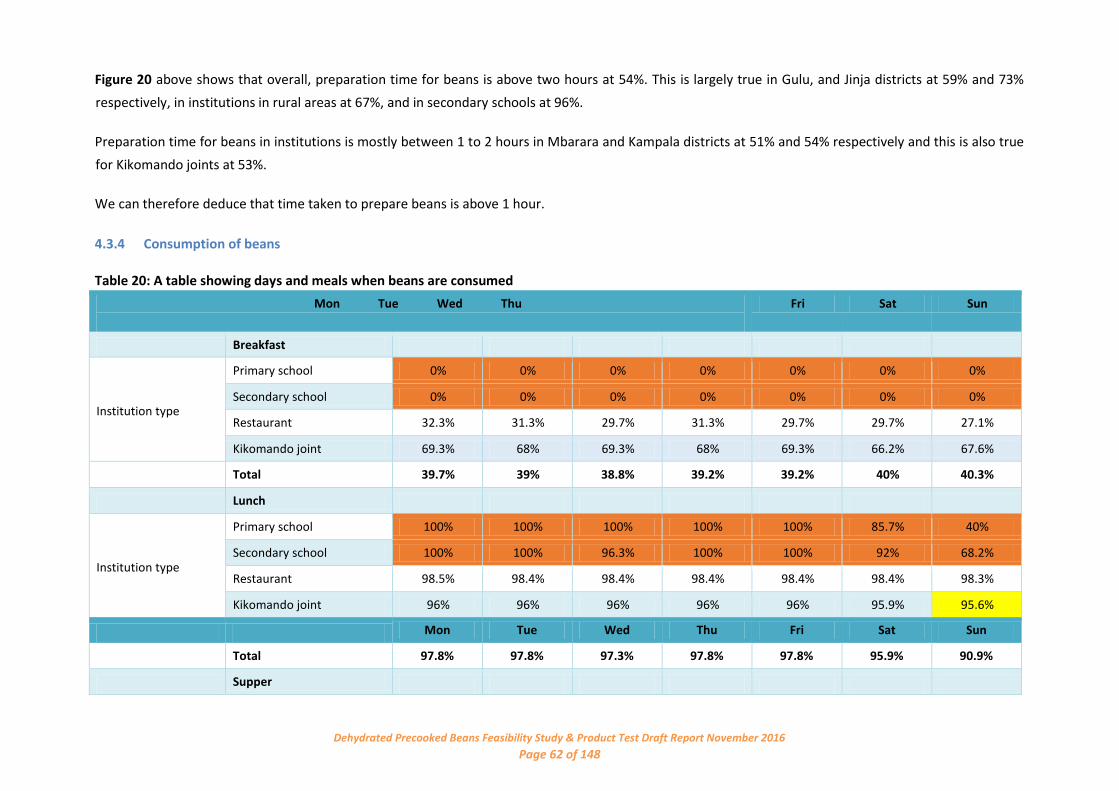
Dehydrated Precooked Beans Feasibility Study & Product Test Draft Report November 2016 Page 62 of 148
Figure 20 above shows that overall, preparation time for beans is above two hours at 54%. This is largely true in Gulu, and Jinja districts at 59% and 73%
respectively, in institutions in rural areas at 67%, and in secondary schools at 96%.
Preparation time for beans in institutions is mostly between 1 to 2 hours in Mbarara and Kampala districts at 51% and 54% respectively and this is also true
for Kikomando joints at 53%.
We can therefore deduce that time taken to prepare beans is above 1 hour.
4.3.4 Consumption of beans
Table 20: A table showing days and meals when beans are consumed
Mon Tue Wed Thu
Fri Sat Sun
Breakfast
Institution type
Primary school 0% 0% 0% 0% 0% 0% 0%
Secondary school 0% 0% 0% 0% 0% 0% 0%
Restaurant 32.3% 31.3% 29.7% 31.3% 29.7% 29.7% 27.1%
Kikomando joint 69.3% 68% 69.3% 68% 69.3% 66.2% 67.6%
Total 39.7% 39% 38.8% 39.2% 39.2% 40% 40.3%
Lunch
Institution type
Primary school 100% 100% 100% 100% 100% 85.7% 40%
Secondary school 100% 100% 96.3% 100% 100% 92% 68.2%
Restaurant 98.5% 98.4% 98.4% 98.4% 98.4% 98.4% 98.3%
Kikomando joint 96% 96% 96% 96% 96% 95.9% 95.6%
Mon Tue Wed Thu Fri Sat Sun
Total 97.8% 97.8% 97.3% 97.8% 97.8% 95.9% 90.9%
Supper
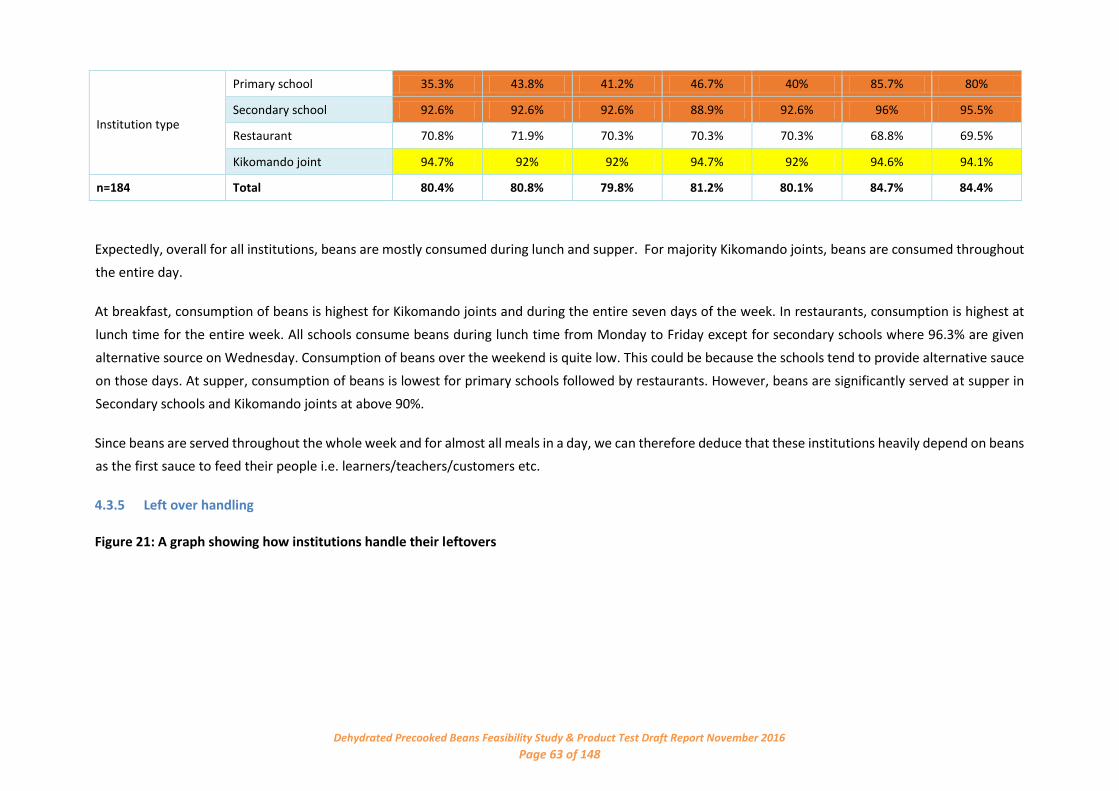
Dehydrated Precooked Beans Feasibility Study & Product Test Draft Report November 2016 Page 63 of 148
Institution type
Primary school 35.3% 43.8% 41.2% 46.7% 40% 85.7% 80%
Secondary school 92.6% 92.6% 92.6% 88.9% 92.6% 96% 95.5%
Restaurant 70.8% 71.9% 70.3% 70.3% 70.3% 68.8% 69.5%
Kikomando joint 94.7% 92% 92% 94.7% 92% 94.6% 94.1%
n=184 Total 80.4% 80.8% 79.8% 81.2% 80.1% 84.7% 84.4%
Expectedly, overall for all institutions, beans are mostly consumed during lunch and supper. For majority Kikomando joints, beans are consumed throughout
the entire day.
At breakfast, consumption of beans is highest for Kikomando joints and during the entire seven days of the week. In restaurants, consumption is highest at
lunch time for the entire week. All schools consume beans during lunch time from Monday to Friday except for secondary schools where 96.3% are given
alternative source on Wednesday. Consumption of beans over the weekend is quite low. This could be because the schools tend to provide alternative sauce
on those days. At supper, consumption of beans is lowest for primary schools followed by restaurants. However, beans are significantly served at supper in
Secondary schools and Kikomando joints at above 90%.
Since beans are served throughout the whole week and for almost all meals in a day, we can therefore deduce that these institutions heavily depend on beans
as the first sauce to feed their people i.e. learners/teachers/customers etc.
4.3.5 Left over handling
Figure 21: A graph showing how institutions handle their leftovers
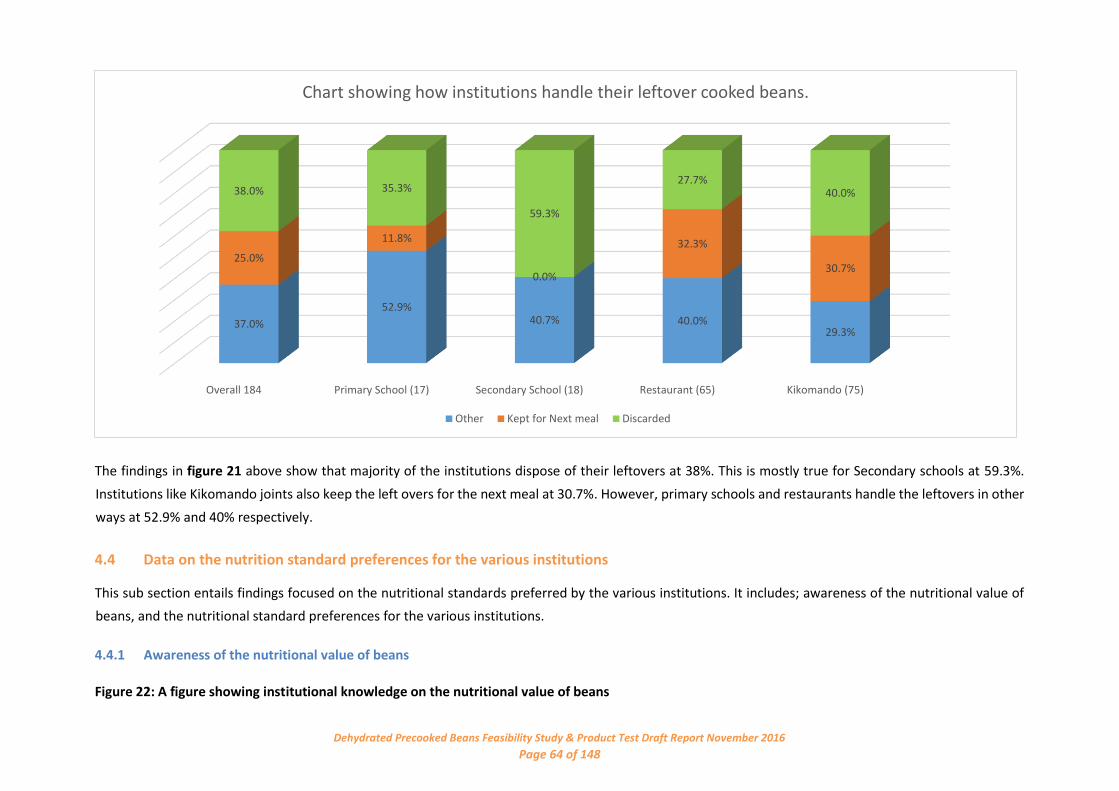
Dehydrated Precooked Beans Feasibility Study & Product Test Draft Report November 2016 Page 64 of 148
The findings in figure 21 above show that majority of the institutions dispose of their leftovers at 38%. This is mostly true for Secondary schools at 59.3%.
Institutions like Kikomando joints also keep the left overs for the next meal at 30.7%. However, primary schools and restaurants handle the leftovers in other
ways at 52.9% and 40% respectively.
4.4 Data on the nutrition standard preferences for the various institutions
This sub section entails findings focused on the nutritional standards preferred by the various institutions. It includes; awareness of the nutritional value of
beans, and the nutritional standard preferences for the various institutions.
4.4.1 Awareness of the nutritional value of beans
Figure 22: A figure showing institutional knowledge on the nutritional value of beans
Overall 184 Primary School (17) Secondary School (18) Restaurant (65) Kikomando (75)
37.0%
52.9%40.7% 40.0%
29.3%
25.0%
11.8%
0.0%
32.3%
30.7%
38.0% 35.3%
59.3%
27.7%40.0%
Chart showing how institutions handle their leftover cooked beans.
Other Kept for Next meal Discarded

Dehydrated Precooked Beans Feasibility Study & Product Test Draft Report November 2016 Page 65 of 148
As illustrated in Figure 22, overall institutional awareness of the nutritional value of beans was significantly high at 66.1%. This was true for majority of the
institutions except restaurants where a notable 43.1% was not aware of the nutritional value of beans.
No
Yes
Primary School (17) Secondary school(17)
Restaurant (65) Kikomando joint (75) Government/ReliefAgency (2)
Urban (156) Rural( 30)
17.6%11.1%
43.1%38.7%
0.0%
37.8%
13.3%
82.4%88.9%
56.9%61.3%
100.0%
62.2%
86.7%
Chart showing institutional knowledge on nutritional value of beans
No Yes

Dehydrated Precooked Beans Feasibility Study & Product Test Draft Report November 2016 Page 66 of 148
4.4.2 Fortified foods
Figure 23: A graph showing knowledge of and likelihood to purchased fortified foods
Findings in Figure 23 above indicate that only 30.1% were aware of fortified foods. And of these, only
33.9% claimed to have ever purchased it.
Chart Title
NO YES HAVE NEVER PURCHASED HAVE PURCHASED
69.9%30.1%
Ever heard of. (Base =186) Ever Purchased (Base=156)
NO YES
YES:33.9%

Dehydrated Precooked Beans Feasibility Study & Product Test Draft Report November 2016 Page 67 of 148
Figure 24: A graph showing purchase consideration for fortified foods by institution and setting
Figure 24 above shows that overall, only few institutions would consider buying fortified foods at 46.2%. This is mostly true for primary schools, secondary
schools and government/relief agencies at 64.7%,
55.6% and 50% respectively and those institutions in rural setting at 63.3%.
46.2%
64.7%55.6%
41.5% 42.7%50.0%
42.9%
63.3%
53.8%
35.3%44.4%
58.5% 57.3%50.0%
57.1%
36.7%
Chart showing purchase consideration of foritified foods.
YES NO
Type of institution Setting

Dehydrated Precooked Beans Feasibility Study & Product Test Draft Report November 2016 Page 68 of 148
This means that any organisations seeking to market fortified foods should give priority to schools and relief/government agencies.
4.5 Constraints faced with the current bean product
This sub section entails findings focused on the problems institutional market is facing with the beans they currently use. This includes; problems faced with
current beans and solutions to the problems
4.5.1 Problems faced with the current beans
Table 21: A table showing problems institutions face with their current beans
Institutional type
Base 186 17 27 65 75 2
Long preparation time 60.8% 70.6% 59.3% 70.8% 52% 0%
Are easily attacked by pests like weevils 39.2% 52.9% 59.3% 33.8% 34.7% 0%
They are too hard 31.7% 29.4% 40.7% 35.4% 26.7% 0%
They are expensive to purchase 27.4% 11.8% 33.3% 27.7% 29.3% 0%
Storage 10.2% 11.8% 18.5% 12.3% 4% 50%
Customers say they are of poor quality 5.9% 11.8% 11.1% 4.6% 4% 0%
Consumers don’t like the taste of the beans 4.8% 5.9% 3.7% 3.1% 6.7% 0%
Consumers don’t like their color 3.2% 0.0% 7.4% 1.5% 4% 0%
Dehydrated Precooked Beans Feasibility Study & Product Test Draft Report November 2016 Page 69 of 148
Findings in the Table 21 above indicate that overall, the time of preparation is a key challenge faced with the current bean at 60.8%. This is mostly true in
primary schools at 70.6% and restaurants at 70.8%. This is distantly followed by proneness to weevil attacks at 39.2%. This constraint is mostly experienced
in schools.
31.7% of the institutions said that the beans are too hard especially in secondary schools and restaurants. 27.4% said they are expensive especially in secondary
schools and Kikomando joints. 10.2% had difficulty in storing the beans especially in secondary schools and Government institutions. 5.9% said that their
customers said that the beans are of poor quality especially in primary and secondary schools. 4.8% said that their customers don’t like the taste of the beans
especially in primary schools and Kikomando joints. Lastly, 3.2% said that consumers do not like the color of the beans especially in secondary schools.
Government/relief agencies have one key challenge which is storage at 50%. It is also worth noting that schools have more challenges with their current beans
than any other institutions
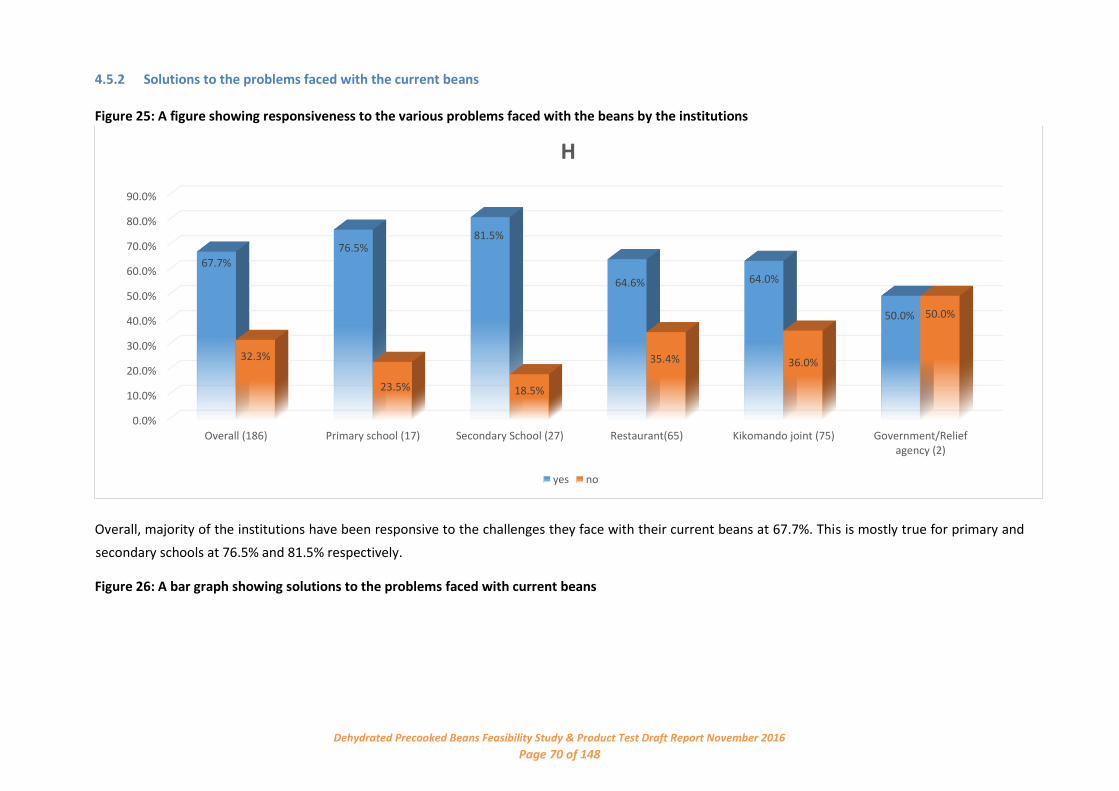
Dehydrated Precooked Beans Feasibility Study & Product Test Draft Report November 2016 Page 70 of 148
4.5.2 Solutions to the problems faced with the current beans
Figure 25: A figure showing responsiveness to the various problems faced with the beans by the institutions
Overall, majority of the institutions have been responsive to the challenges they face with their current beans at 67.7%. This is mostly true for primary and
secondary schools at 76.5% and 81.5% respectively.
Figure 26: A bar graph showing solutions to the problems faced with current beans
0.0%
10.0%
20.0%
30.0%
40.0%
50.0%
60.0%
70.0%
80.0%
90.0%
Overall (186) Primary school (17) Secondary School (27) Restaurant(65) Kikomando joint (75) Government/Reliefagency (2)
67.7%
76.5%81.5%
64.6% 64.0%
50.0%
32.3%
23.5% 18.5%
35.4% 36.0%
50.0%
H
yes no
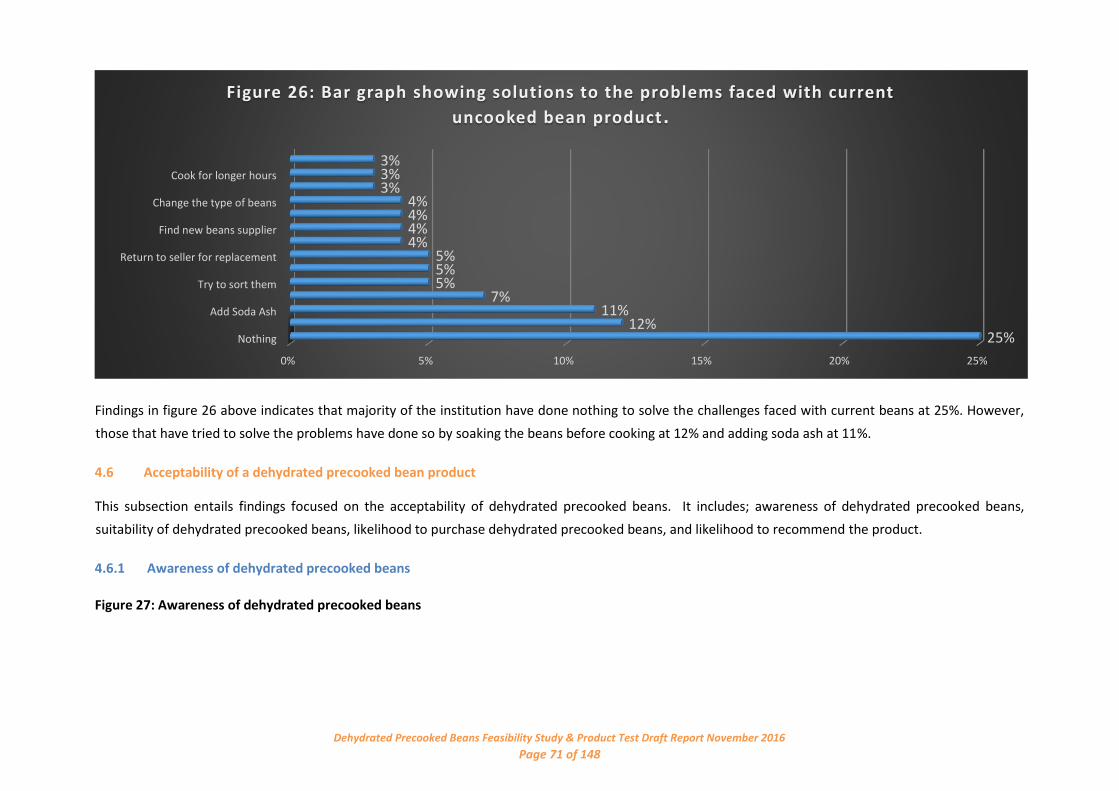
Dehydrated Precooked Beans Feasibility Study & Product Test Draft Report November 2016 Page 71 of 148
Findings in figure 26 above indicates that majority of the institution have done nothing to solve the challenges faced with current beans at 25%. However,
those that have tried to solve the problems have done so by soaking the beans before cooking at 12% and adding soda ash at 11%.
4.6 Acceptability of a dehydrated precooked bean product
This subsection entails findings focused on the acceptability of dehydrated precooked beans. It includes; awareness of dehydrated precooked beans,
suitability of dehydrated precooked beans, likelihood to purchase dehydrated precooked beans, and likelihood to recommend the product.
4.6.1 Awareness of dehydrated precooked beans
Figure 27: Awareness of dehydrated precooked beans
0% 5% 10% 15% 20% 25%
Nothing
Add Soda Ash
Try to sort them
Return to seller for replacement
Find new beans supplier
Change the type of beans
Cook for longer hours
25%12%
11%7%
5%5%5%
4%4%4%4%
3%3%3%
Figure 26: Bar graph showing solutions to the problems faced with current
uncooked bean product .
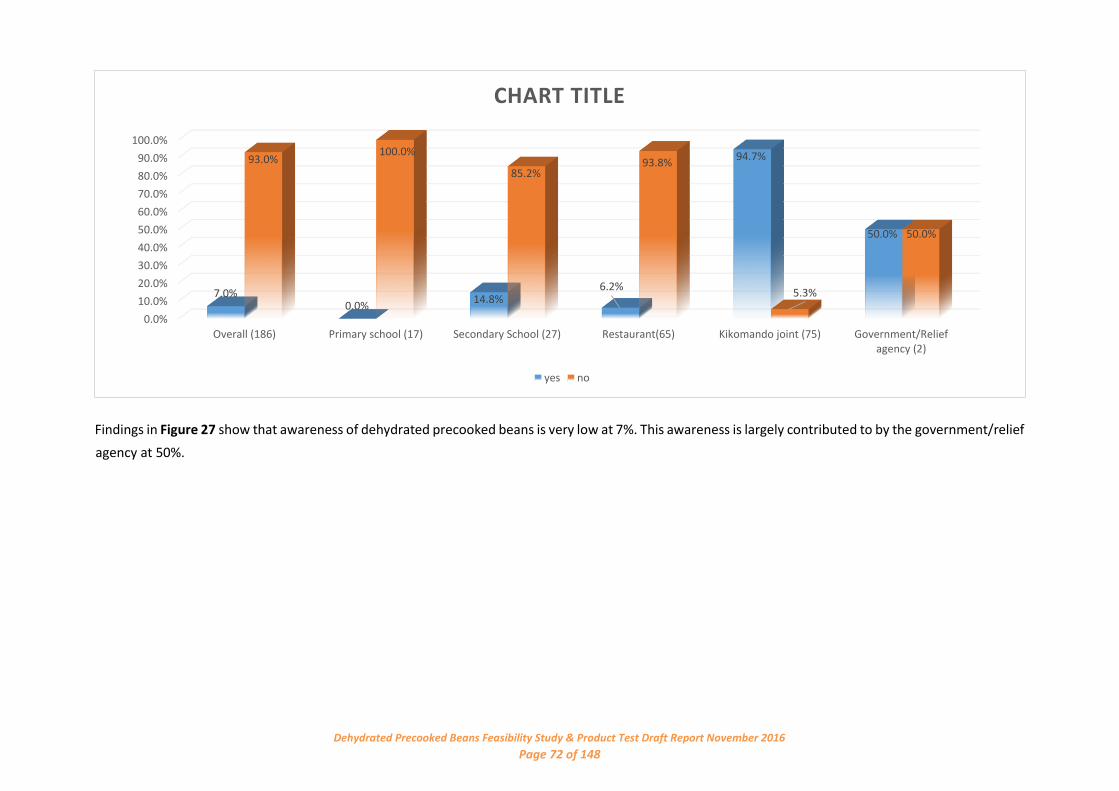
Dehydrated Precooked Beans Feasibility Study & Product Test Draft Report November 2016 Page 72 of 148
Findings in Figure 27 show that awareness of dehydrated precooked beans is very low at 7%. This awareness is largely contributed to by the government/relief
agency at 50%.
0.0%
10.0%
20.0%
30.0%
40.0%
50.0%
60.0%
70.0%
80.0%
90.0%
100.0%
Overall (186) Primary school (17) Secondary School (27) Restaurant(65) Kikomando joint (75) Government/Reliefagency (2)
7.0%0.0%
14.8%6.2%
94.7%
50.0%
93.0%100.0%
85.2%93.8%
5.3%
50.0%
CHART TITLE
yes no

Dehydrated Precooked Beans Feasibility Study & Product Test Draft Report November 2016 Page 73 of 148
4.6.1 Suitability of dehydrated precooked beans
Table 22: A table showing the suitability of dehydrated precooked beans
Total (186) 1.6% 3.8% 26.9% 57.5% 10.2%
District Kampala(50) 2.0% 8.0% 14.0% 64.0% 12.0%
Gulu(44) 0.0% 0.0% 25.0% 68.2% 6.8%
Mbarara(47) 2.1% 2.1% 17.0% 61.7% 17.0%
Jinja(45) 2.2% 4.4% 53.3% 35.6% 4.4%
Setting Urban(156) 1.3% 3.8% 24.4% 59.6% 10.9%
Rural(30) 3.3% 3.3% 40.0% 46.7% 6.7%
Business of
organization Primary school(17) 5.9% 0.0% 17.6% 64.7% 11.8%
Secondary school(27) 3.7% 3.7% 29.6% 59.3% 3.7%
Restaurant(65) 0.0% 3.1% 27.7% 58.5% 10.8%
Kikomando joint(75) 1.3% 5.3% 28.0% 54.7% 10.7%
Government or Relief agency(2)
0.0% 0.0% 0.0% 50.0% 50.0%
Findings in the table above indicate that 57.5% of the respondents found the dehydrated precooked beans suitable for them at 57.5%. This is true for all
institutions except those in Jinja where a significant proportion were indifferent about the product`s suitability to them at 53.3%.

Dehydrated Precooked Beans Feasibility Study & Product Test Draft Report November 2016 Page 74 of 148
4.6.2 Likelihood to buy dehydrated precooked beans
Figure 28: A pie chart showing likelihood to buy a bean product that has a long shelf life, free of pests….
Findings in Figure 28 above indicate that majority of institutions a likely to buy dehydrated precooked beans at 91%.
4.6.3 Likelihood to recommend dehydrated precooked beans
Table 23: A table showing institutions` likelihood to recommend dehydrated precooked beans
Min
Max Mean
District
91%
8%1%
Figure 28: A pie chart showing l ikelihood to buy a bean product that has a long shelf l ife, free of pests
likely not sure unlikely
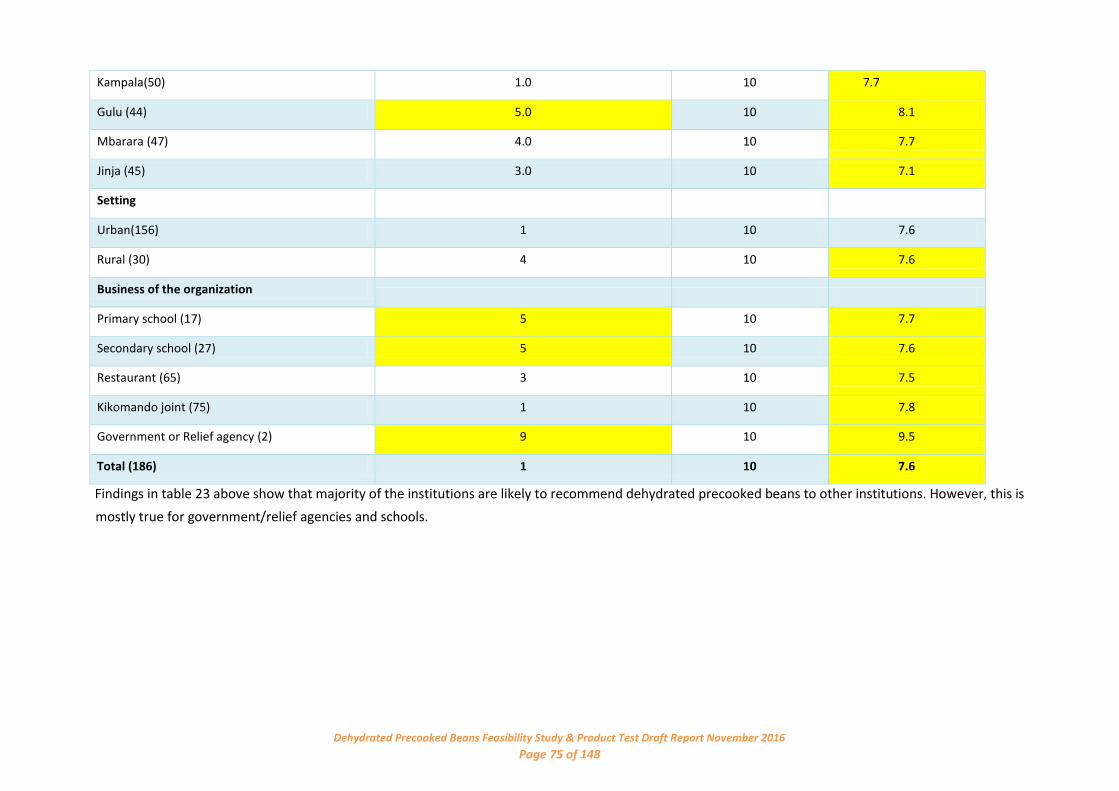
Dehydrated Precooked Beans Feasibility Study & Product Test Draft Report November 2016 Page 75 of 148
Kampala(50) 1.0 10 7.7
Gulu (44) 5.0 10 8.1
Mbarara (47) 4.0 10 7.7
Jinja (45) 3.0 10 7.1
Setting
Urban(156) 1 10 7.6
Rural (30) 4 10 7.6
Business of the organization
Primary school (17) 5 10 7.7
Secondary school (27) 5 10 7.6
Restaurant (65) 3 10 7.5
Kikomando joint (75) 1 10 7.8
Government or Relief agency (2) 9 10 9.5
Total (186) 1 10 7.6
Findings in table 23 above show that majority of the institutions are likely to recommend dehydrated precooked beans to other institutions. However, this is
mostly true for government/relief agencies and schools.

Dehydrated Precooked Beans Feasibility Study & Product Test Draft Report November 2016 Page 76 of 148
SECTION II: NEW PRODUCT EVALUATION
This section presents findings on the thoughts and opinions on the dehydrated precooked beans and how the product will fare in Uganda`s institutional
market. This includes spontaneous thoughts and opinions on the product, likes and dislikes, suggestions for improvement, likelihood to purchase dehydrated
precooked beans, Price willing to pay for each Kilo gram, and likelihood to recommend.
4.7 Spontaneous thoughts and perceptions on the product
This sub section entails findings focused on the spontaneous thoughts; overall attribute rating and individual attribute rating for the dehydrated precooked
beans.
4.7.1 Initial thoughts and perceptions on dehydrated precooked beans
Figure 29: A figure showing respondents` initial thoughts and perceptions on dehydrated precooked beans

Dehydrated Precooked Beans Feasibility Study & Product Test Draft Report November 2016 Page 77 of 148
Findings in figure 29 above show that before seeing the product, overall, majority of the respondents thought dehydrated precooked beans are beans that
are cooked and dried at 49.3%. This is distantly followed by half-cooked beans at 22.7%.
4.7.2 Appearance of the beans before preparation
Figure 30: A figure showing respondents` feedback on the appearance of the dehydrated precooked beans before preparation
0.0% 5.0% 10.0% 15.0% 20.0% 25.0% 30.0% 35.0% 40.0% 45.0% 50.0%
Beans that are cooked and dried
Half cooked beans
Nothing
Good to taste
Beans with nutrients added
Snacks
Processed beans
Fast cooking beans
Beans without water
Beans soaked and not cooked.
49.3%
22.7%
7.7%
4.9%
4.5%
2.9%
1.8%
1.8%
1.4%
0.8%
Figure 29: A figure showing respondents' initial thoughts and perceptions on dehyrated pre-cooked beans

Dehydrated Precooked Beans Feasibility Study & Product Test Draft Report November 2016 Page 78 of 148
Findings illustrated in figure 30 above show that 23% of the respondents said that the beans before preparation looked like ground nuts at 23%. This was
closely followed by those who said they looked like cooked dry beans at 19.9%.
Table 24 showing respondents` feedback on the appearance of the dehydrated precooked beans
Institution type
0.0% 5.0% 10.0% 15.0% 20.0% 25.0%
Look like ground nuts (peanuts)
Look like cooked and dried beans
Cracked/broken chips which are dried
They look hard
They look like beans
Spoilt beans with bean weavils
Look like half cooked beans
No opinion
Look like raw ordinary beans
They look delicious
They look soft
They do not look like beans
They are not like normal beans
Appear like they have been stored for long
They look tasteless
They look like smoked beans
Look like packed food.
23.0%
19.9%
17.1%
9.1%
7.4%
5.4%
3.8%
3.8%
3.3%
2.8%
2.5%
2.4%
1.8%
1.3%
1.3%
1.1%
1.1%
Figure 30: A graph showing respondents feedback on appearance of the dehydrated pre-cooked beans before preparation.

Dehydrated Precooked Beans Feasibility Study & Product Test Draft Report November 2016 Page 79 of 148
Total
Kikomando joint Primary school Restauran t Secondary school
Base 901 77 316 63 445
% % % % %
Look like ground nuts
23 49 19.9 56.3 18.2
Look like cooked dried beans 19.9 4.1 19.6 12.5 23.1 Cracked/broken chips which are dried 17.1 12.2 16 6.3 20 They look hard 9.1 2 9.6 0 10.6 They look like beans 7.4 4.1 10.3 0 6.5 Spoilt beans with bean weevils 5.4 6.1 5.8 2.1 5.5 Nothing 3.8 4.1 3.5 6.3 3.6 Looks like half cooked beans 3.8 2 3.5 0 4.7 Look like raw ordinary beans 3.3 2 3.8 6.3 2.6 They look delicious 2.8 0 3.2 0 3.1 They are soft 2.5 2 2.9 2.1 2.3 Do not look like beans 2.4 6.1 3.5 4.2 0.8 They were not like ordinary beans 1.8 0 1.9 0 2.1 Tasteless beans 1.3 0 1 0 1.8 Look like they have been there for many years
1.3 0 2.2 2.1 0.5
Looks like packed food 1.1 4.1 1.6 0 0.5 They are like smoked beans 1.1 6.1 1 2.1 0.5
All respondent types namely Kikomando joints, restaurants, primary schools and secondary schools said the dehydrated precooked beans mainly look like
groundnuts before preparation. 19.9% of the respondents said the dehydrated precooked beans looked like cooked dry beans especially in secondary schools
at 23.1% while 17.1% said they look like dried broken chips.
4.7.3 Smell of the beans before preparation
Figure 31: A figure showing respondents` feedback on the aroma of the dehydrated precooked beans before preparation

Dehydrated Precooked Beans Feasibility Study & Product Test Draft Report November 2016 Page 80 of 148
The findings in figure 31 above indicate that a significant proportion of the respondents said that the dehydrated precooked beans smelt like ordinary cooked
beans at 34.5% a significant proportion of the respondents at 21.6% also said the beans smelt bad.
0.0% 5.0% 10.0% 15.0% 20.0% 25.0% 30.0% 35.0%
They smell like ordinary cooked beans
they smell bad
they smell attractive
they don’t smell like beans
They don’t have any smell
smell like raw beans
they smell like beans with additives
nothing
Smell like jackfruit seeds.
34.5%
21.9%
19.5%
12.2%
7.8%
2.3%
2.0%
0.3%
0.3%
Figure 31: A figure showing respondents feedback on the aroma of the dehydrated
precooked beans before preparation .
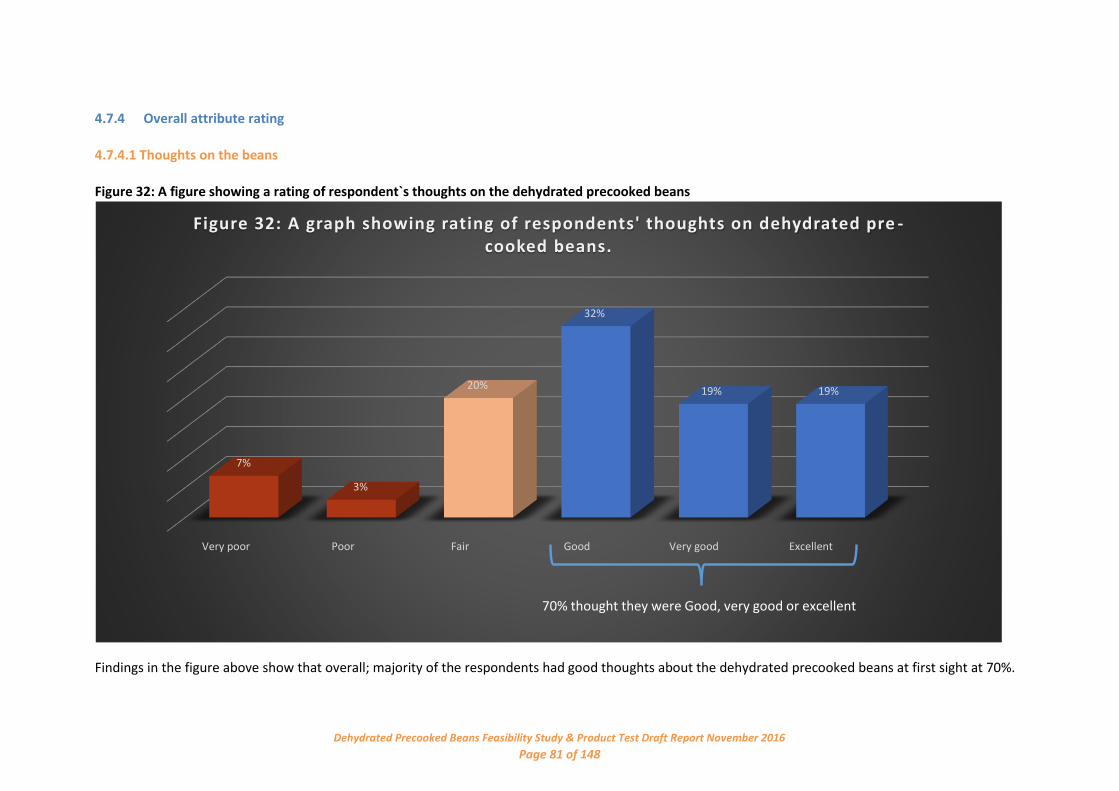
Dehydrated Precooked Beans Feasibility Study & Product Test Draft Report November 2016 Page 81 of 148
4.7.4 Overall attribute rating
4.7.4.1 Thoughts on the beans
Figure 32: A figure showing a rating of respondent`s thoughts on the dehydrated precooked beans
Findings in the figure above show that overall; majority of the respondents had good thoughts about the dehydrated precooked beans at first sight at 70%.
Very poor Poor Fair Good Very good Excellent
7%
3%
20%
32%
19% 19%
Figure 32: A graph showing rating of respondents' thoughts on dehydrated pre -cooked beans.
70% thought they were Good, very good or excellent
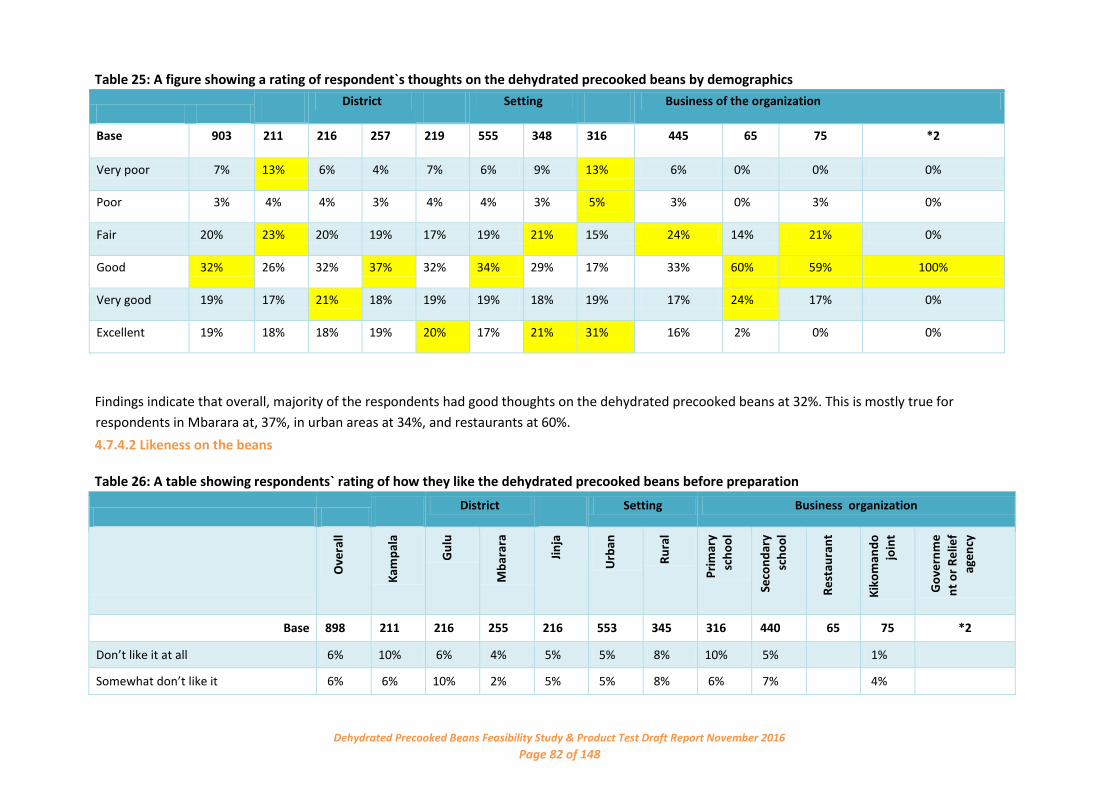
Dehydrated Precooked Beans Feasibility Study & Product Test Draft Report November 2016 Page 82 of 148
Table 25: A figure showing a rating of respondent`s thoughts on the dehydrated precooked beans by demographics
District Setting Business of the organization
Base 903 211 216 257 219 555 348 316 445 65 75 *2
Very poor 7% 13% 6% 4% 7% 6% 9% 13% 6% 0% 0% 0%
Poor 3% 4% 4% 3% 4% 4% 3% 5% 3% 0% 3% 0%
Fair 20% 23% 20% 19% 17% 19% 21% 15% 24% 14% 21% 0%
Good 32% 26% 32% 37% 32% 34% 29% 17% 33% 60% 59% 100%
Very good 19% 17% 21% 18% 19% 19% 18% 19% 17% 24% 17% 0%
Excellent 19% 18% 18% 19% 20% 17% 21% 31% 16% 2% 0% 0%
Findings indicate that overall, majority of the respondents had good thoughts on the dehydrated precooked beans at 32%. This is mostly true for
respondents in Mbarara at, 37%, in urban areas at 34%, and restaurants at 60%.
4.7.4.2 Likeness on the beans
Table 26: A table showing respondents` rating of how they like the dehydrated precooked beans before preparation
District Setting Business organization
Base 898 211 216 255 216 553 345 316 440 65 75 *2
Don’t like it at all 6% 10% 6% 4% 5% 5% 8% 10% 5% 1%
Somewhat don’t like it 6% 6% 10% 2% 5% 5% 8% 6% 7% 4%
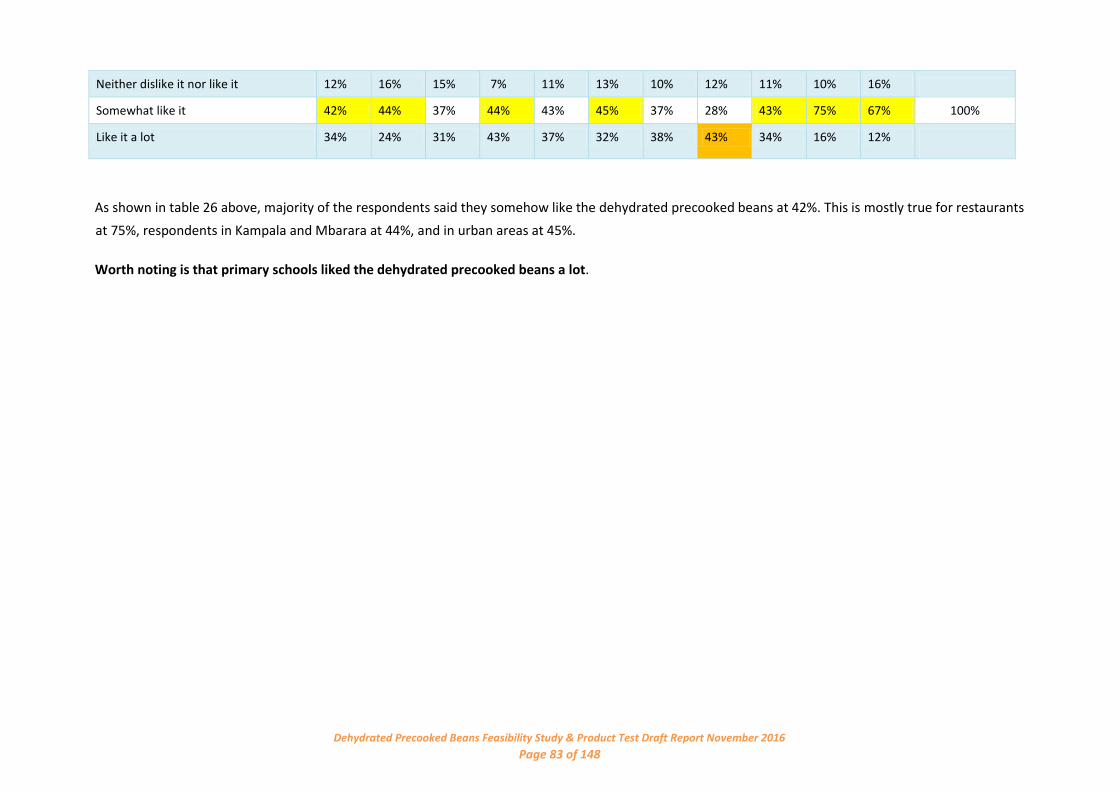
Dehydrated Precooked Beans Feasibility Study & Product Test Draft Report November 2016 Page 83 of 148
Neither dislike it nor like it 12% 16% 15% 7% 11% 13% 10% 12% 11% 10% 16%
Somewhat like it 42% 44% 37% 44% 43% 45% 37% 28% 43% 75% 67% 100%
Like it a lot 34% 24% 31% 43% 37% 32% 38% 43% 34% 16% 12%
As shown in table 26 above, majority of the respondents said they somehow like the dehydrated precooked beans at 42%. This is mostly true for restaurants
at 75%, respondents in Kampala and Mbarara at 44%, and in urban areas at 45%.
Worth noting is that primary schools liked the dehydrated precooked beans a lot.
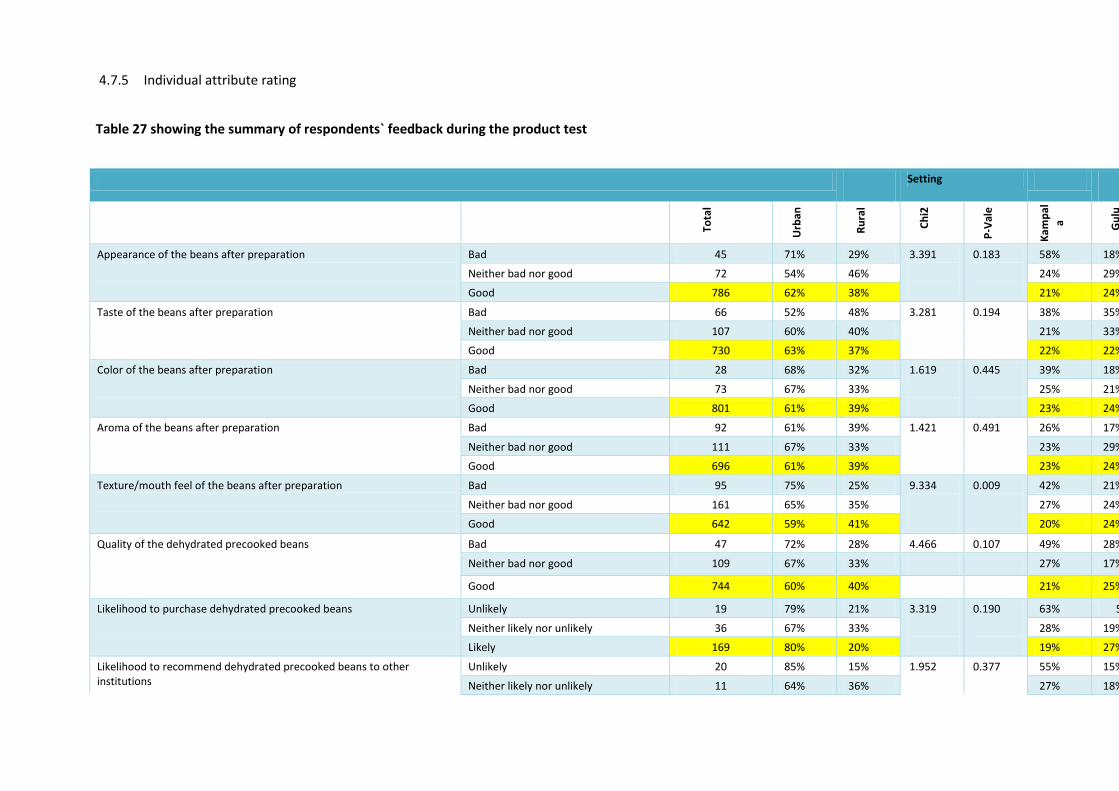
4.7.5 Individual attribute rating
Table 27 showing the summary of respondents` feedback during the product test
Setting Districts
Appearance of the beans after preparation
Bad 45 71% 29% 3.391
0.183
58% 18% 18% 7% 34.353
0.000
Neither bad nor good 72 54% 46% 24% 29% 25% 22%
Good 786 62% 38% 21% 24% 29% 25%
Taste of the beans after preparation
Bad 66 52% 48% 3.281
0.194
38% 35% 12% 15% 26.648
0.000
Neither bad nor good 107 60% 40% 21% 33% 28% 18%
Good 730 63% 37% 22% 22% 30% 26%
Color of the beans after preparation
Bad 28 68% 32% 1.619
0.445
39% 18% 21% 21% 7.164
0.306
Neither bad nor good 73 67% 33% 25% 21% 23% 32%
Good 801 61% 39% 23% 24% 29% 24%
Aroma of the beans after preparation
Bad 92 61% 39% 1.421
0.491
26% 17% 30% 26% 4.291
0.637
Neither bad nor good 111 67% 33% 23% 29% 29% 20%
Good 696 61% 39% 23% 24% 28% 25%
Texture/mouth feel of the beans after preparation
Bad 95 75% 25% 9.334
0.009
42% 21% 24% 13% 31.275
0.000
Neither bad nor good 161 65% 35% 27% 24% 32% 17%
Good 642 59% 41% 20% 24% 28% 28%
Quality of the dehydrated precooked beans
Bad 47 72% 28% 4.466 0.107 49% 28% 13% 11% 25.624
0.000
Neither bad nor good 109 67% 33% 27% 17% 28% 28%
Good 744 60% 40% 21% 25% 29% 25%
Likelihood to purchase dehydrated precooked beans
Unlikely 19 79% 21% 3.319
0.190
63% 5% 11% 21% 29.618
0.000
Neither likely nor unlikely 36 67% 33% 28% 19% 11% 42%
Likely 169 80% 20% 19% 27% 33% 22%
Likelihood to recommend dehydrated precooked beans to other institutions
Unlikely 20 85% 15% 1.952 0.377 55% 15% 25% 5% 15.829 0.015
Neither likely nor unlikely 11 64% 36% 27% 18% 9% 45%

Likely 179 79% 21%
21% 26% 27% 26%

Appearance of the beans after preparation
Comparing 62% of the urban respondents and 38% rural respondents who said that the appearance of beans after preparation was good, the probability
associated with a Chi Square statistic of 3.391 with a P value greater than 0.05 indicates that there is a weak relationship between whether or not the
appearance of the beans was perceived the same in both settings.
In terms of districts, comparing Kampala-21%, Gulu-24%, Mbarara-29%, and Jinja-25% of the respondents who said the appearance of the beans after
preparation was good, the probability associated with a Chi Square statistic of 34.353 with a P Value <0.05 of indicates that there is a strong relationship
between whether or not the appearance of the beans was perceived the same across all the district.
Taste of the beans after preparation
Comparing 63% of the urban respondents and 37% rural respondents who said that the taste of beans after preparation was good, the probability associated
with a Chi Square statistic of 3.281 with a P value greater than 0.05 indicates that there is a weak relationship between whether or not the taste of the beans
was perceived the same in both settings.
In terms of districts, comparing Kampala-22%, Gulu-22%, Mbarara-30%, and Jinja-26% of the respondents who said the taste of the beans after preparation
was good, the probability associated with a Chi Square statistic of 26.64 with a P Value <0.05 of indicates that there is a strong relationship between whether
or not the taste of the beans was perceived the same across all the districts.
Color of the beans after preparation
Comparing 61% of the urban respondents and 39% rural respondents who said that the color of beans after preparation was good, the probability associated
with Chi Square statistic of 1.619 with a P value greater than 0.05 indicates that there is a weak relationship between whether or not the color of the beans
was perceived the same in both settings.
In terms of districts, comparing Kampala-23%, Gulu-24%, Mbarara-29%, and Jinja-24% of the respondents who said the color of the beans after preparation
was good, the probability associated with Chi Square statistic of 7.164 with a P Value <0.05 of indicates that there is a weak relationship between whether or
not the color of the beans was perceived across all the districts
Aroma of the beans after preparation

Comparing 61% of the urban respondents and 39% rural respondents who said that the aroma of beans after preparation was good, the probability associated
with Chi Square statistic of 1.421 with a P value greater than 0.05 indicates that there is a weak relationship between whether or not the aroma of the beans
was perceived the same in both settings.
In terms of districts, comparing Kampala-23%, Gulu-24%, Mbarara-28%, and Jinja-25% of the respondents who said the aroma of the beans after preparation
was good, the probability associated with Chi Square statistic of 4.291 with a P Value >0.05 of indicates that there is a weak relationship between whether or
not the aroma of the beans was perceived the same across the districts.
Texture/mouth feel of the beans after preparation
Comparing 59% of the urban respondents and 41% rural respondents who said that the texture of beans after preparation was good, the probability associated
with Chi Square statistic of 9.344 with a P value less than 0.05 indicates that there is a strong relationship between whether or not the texture of the beans
was perceived the same in both settings.
In terms of districts, comparing Kampala-20%, Gulu-24%, Mbarara-28%, and Jinja-28% of the respondents who said the appearance of the beans after
preparation was good, the probability associated with Chi Square statistic of 31.275 with a P Value <0.05 of indicates that there is a strong relationship
between whether or not the texture of the beans was perceived the same across the districts.
Quality of the dehydrated precooked beans
Comparing 60% of the urban respondents and 40% rural respondents who said that the quality of the dehydrated precooked beans was good, the probability
associated with Chi Square statistic of 4.466 with a P value greater than 0.05 indicates that there is a weak relationship between whether or not the quality
of the dehydrated precooked beans was perceived the same in both settings.
In terms of districts, comparing Kampala-21%, Gulu-25%, Mbarara-29%, and Jinja-25% of the respondents who said the quality of the dehydrated precooked
beans was good, the probability associated with Chi Square statistic of 25.624 with a P Value <0.05 of indicates that there is a strong relationship between
whether or not the quality of the beans was perceived the same across all the districts.
Likelihood to purchase dehydrated precooked beans
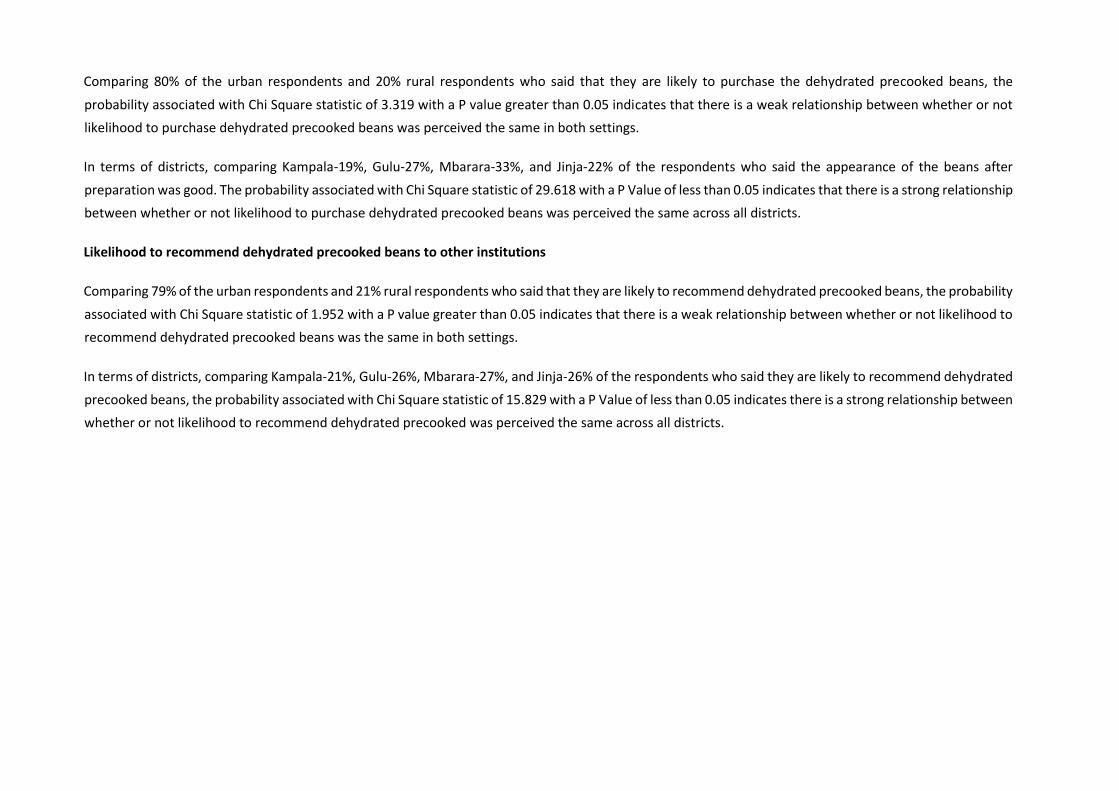
Comparing 80% of the urban respondents and 20% rural respondents who said that they are likely to purchase the dehydrated precooked beans, the
probability associated with Chi Square statistic of 3.319 with a P value greater than 0.05 indicates that there is a weak relationship between whether or not
likelihood to purchase dehydrated precooked beans was perceived the same in both settings.
In terms of districts, comparing Kampala-19%, Gulu-27%, Mbarara-33%, and Jinja-22% of the respondents who said the appearance of the beans after
preparation was good. The probability associated with Chi Square statistic of 29.618 with a P Value of less than 0.05 indicates that there is a strong relationship
between whether or not likelihood to purchase dehydrated precooked beans was perceived the same across all districts.
Likelihood to recommend dehydrated precooked beans to other institutions
Comparing 79% of the urban respondents and 21% rural respondents who said that they are likely to recommend dehydrated precooked beans, the probability
associated with Chi Square statistic of 1.952 with a P value greater than 0.05 indicates that there is a weak relationship between whether or not likelihood to
recommend dehydrated precooked beans was the same in both settings.
In terms of districts, comparing Kampala-21%, Gulu-26%, Mbarara-27%, and Jinja-26% of the respondents who said they are likely to recommend dehydrated
precooked beans, the probability associated with Chi Square statistic of 15.829 with a P Value of less than 0.05 indicates there is a strong relationship between
whether or not likelihood to recommend dehydrated precooked was perceived the same across all districts.

4.7.5.1 Appearance of the beans after preparation
Figure 33: A Pie Chart showing respondents` feedback on the appearance of the beans after preparation
Findings in Figure 33 above show that overall, majority of the respondents were happy with the appearance of the beans after preparation at 87% confirming
that the appearance was either good or very good while 13% did not like the appearance of the beans.
Table 28: A table showing respondents` rating of the appearance of the like the dehydrated precooked beans before after preparation
2%3%
8%
46%
41%
13%
Pie Charts showing respondents' feedback on the appearance of the beans after preparation.
Very bad bad Neutral Good Very good

District Setting Business of the organization
Base 903 211 216 257 219 555 348 316 445 65 75 *2
Very bad 2% 7% 0% 0% 0% 3% 1% 4% 1% 0% 0% 0%
Bad 3% 6% 3% 3% 1% 3% 3% 2% 4% 0% 5% 0%
Neither bad nor good 8% 8% 10% 7% 7% 7% 9% 8% 9% 5% 9% 0%
Good 46% 45% 54% 44% 42% 50% 39% 27% 50% 79% 69% 100%
Very good 41% 35% 33% 46% 50% 37% 48% 59% 37% 16% 16% 0%
As shown inn table 29 above, majority of the respondents liked the appearance of the dehydrated recooked beans at 87%, this was true across all the
demographics.
4.7.5.2 Reasons for rating of appearance of the beans after preparation
Figure 34: A figure showing respondents` feedback on the appearance of the dehydrated precooked beans after preparation
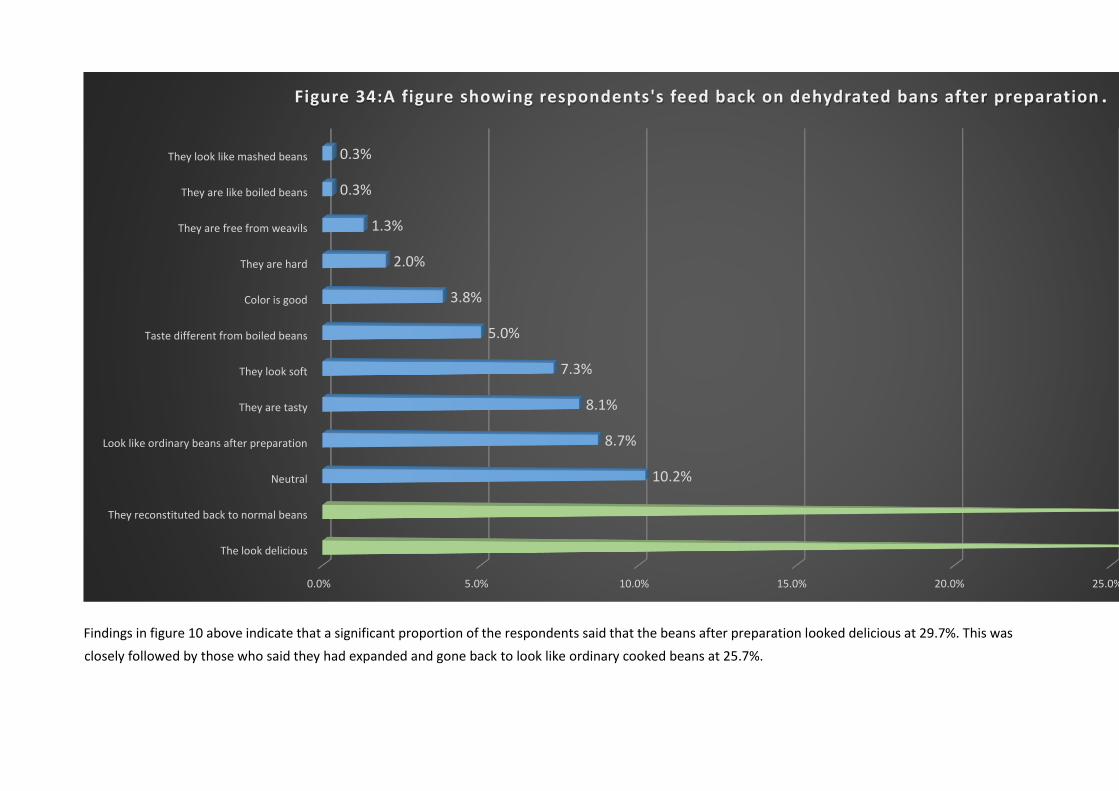
Findings in figure 10 above indicate that a significant proportion of the respondents said that the beans after preparation looked delicious at 29.7%. This was
closely followed by those who said they had expanded and gone back to look like ordinary cooked beans at 25.7%.
0.0% 5.0% 10.0% 15.0% 20.0% 25.0%
The look delicious
They reconstituted back to normal beans
Neutral
Look like ordinary beans after preparation
They are tasty
They look soft
Taste different from boiled beans
Color is good
They are hard
They are free from weavils
They are like boiled beans
They look like mashed beans
10.2%
8.7%
8.1%
7.3%
5.0%
3.8%
2.0%
1.3%
0.3%
0.3%
Figure 34:A figure showing respondents's feed back on dehydrated bans after preparation .
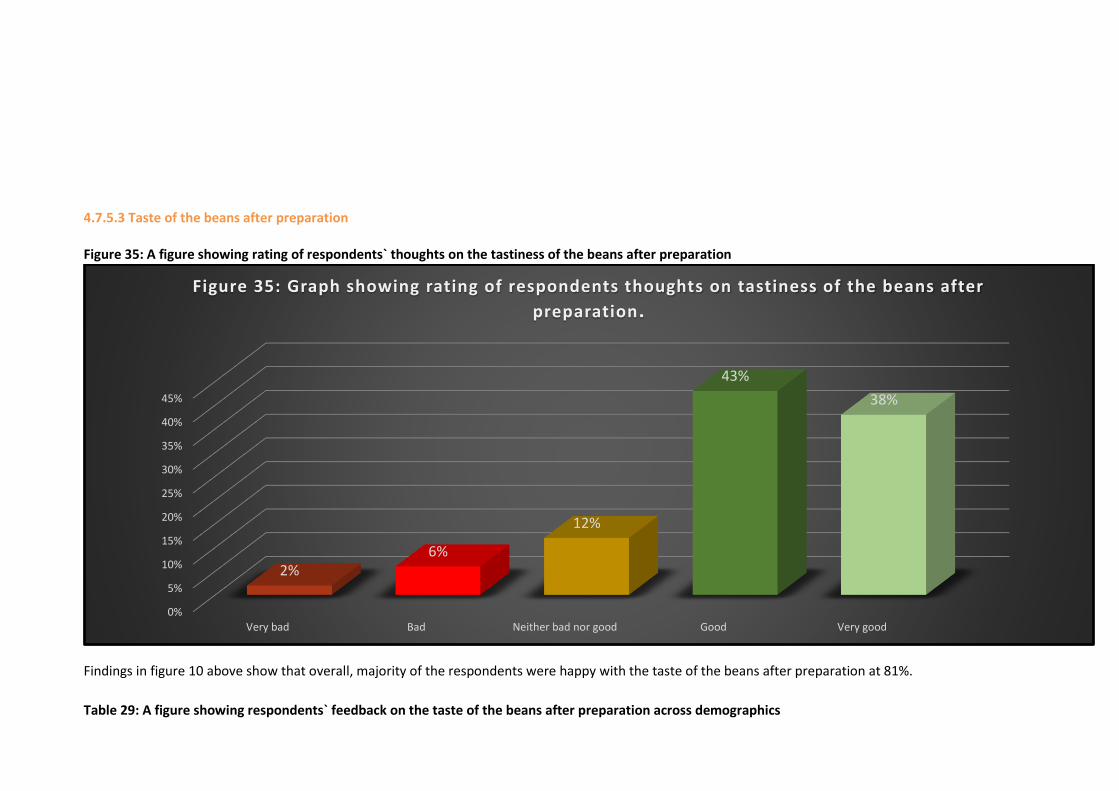
4.7.5.3 Taste of the beans after preparation
Figure 35: A figure showing rating of respondents` thoughts on the tastiness of the beans after preparation
Findings in figure 10 above show that overall, majority of the respondents were happy with the taste of the beans after preparation at 81%.
Table 29: A figure showing respondents` feedback on the taste of the beans after preparation across demographics
0%
5%
10%
15%
20%
25%
30%
35%
40%
45%
Very bad Bad Neither bad nor good Good Very good
2%6%
12%
43%
38%
Figure 35: Graph showing rating of respondents thoughts on tastiness of the beans after
preparation.

District Setting
Business of the organization
Base 903 211 216 257 219 555 348 316 445 65 75 *2
Very bad 2% 4% 2% 0% 1% 2% 2% 3% 1% 0% 0% 0%
Bad 6% 8% 8% 3% 4% 5% 7% 5% 7% 2% 5% 0%
Neither bad nor good 12% 11% 16% 12% 9% 12% 12% 9% 13% 13% 16% 50%
Good 43% 48% 42% 42% 38% 48% 34% 28% 44% 75% 65% 50%
Very good 38% 29% 31% 43% 48% 35% 44% 55% 35% 11% 13% 0%
Findings from the table above indicate that majority of the respondents found the taste of the beans after preparation good at 43%. This was mostly true for
those in Kampala at 48%, in urban areas at 48%, and restaurants at 75%. However, worth noting is that the taste of the beans was liked across all
demographics.
4.7.5.4 Reasons for rating of tastiness of the beans after preparation
Figure 36: A figure showing respondent`s feedback on the taste of the beans after preparation
Findings illustrated in figure 38 above indicate that a significant proportion of respondents said the beans are delicious at 59.2%.
This is a clear depiction of the rating in table 10 above where majority of the respondents were happy with the taste of the beans at 81%.
0.0% 10.0% 20.0% 30.0% 40.0% 50.0% 60.0%
They are delicious
Taste like ordinary beans
The taste is bad
Taste good because of ingredients
Taste different from usual beans
Nothing
They have a hard mouth feel
They taste half cooked
They are appetising
Taste saltless
They taste melodious
59.2%
13.2%
8.9%
6.8%
6.4%
4.1%
3.7%
1.7%
1.3%
1.3%
0.5%
Figure 36: Graph showing respondents' feed back on pre -cooked dehydrated beans
after tasting prepared sample .

4.7.5.5 Color of the beans after preparation
Figure 37: A figure showing respondents rating of the color of the beans after preparation
0.0%
5.0%
10.0%
15.0%
20.0%
25.0%
30.0%
35.0%
40.0%
45.0%
50.0%
Very bad bad Neither good nor bad Good Very good
0.0%3.0%
8.0%
49.0% 40.0%
Figure 37: Chart showing respondents's rating of the color of pre -cooked dehydrated
beans after preparation.
89%
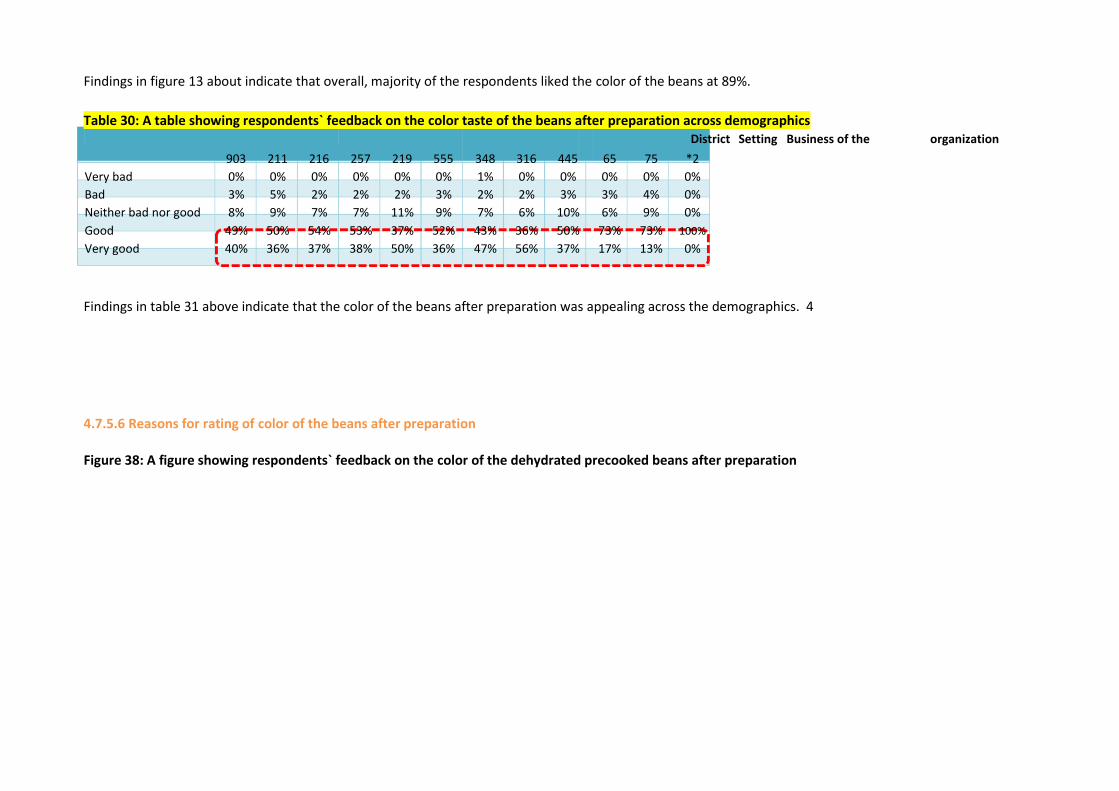
Findings in figure 13 about indicate that overall, majority of the respondents liked the color of the beans at 89%.
Table 30: A table showing respondents` feedback on the color taste of the beans after preparation across demographics District Setting Business of the organization
903 211 216 257 219 555 348 316 445 65 75 *2 Very bad 0% 0% 0% 0% 0% 0% 1% 0% 0% 0% 0% 0% Bad 3% 5% 2% 2% 2% 3% 2% 2% 3% 3% 4% 0% Neither bad nor good 8% 9% 7% 7% 11% 9% 7% 6% 10% 6% 9% 0% Good 49% 50% 54% 53% 37% 52% 43% 36% 50% 73% 73% 100% Very good 40% 36% 37% 38% 50% 36% 47% 56% 37% 17% 13% 0%
Findings in table 31 above indicate that the color of the beans after preparation was appealing across the demographics. 4
4.7.5.6 Reasons for rating of color of the beans after preparation
Figure 38: A figure showing respondents` feedback on the color of the dehydrated precooked beans after preparation

The findings in the figure 14 above indicate that majority of the respondents said the color of the dehydrated precooked beans after preparation looks like for
ordinary beans at 52%.
This could explain why majority of them at 89% said they were happy with the color as shown in table
11.
4.7.5.7 Aroma of the beans after preparation
Table 31: A table showing respondents rating of the aroma of the beans after preparation
0% 10% 20% 30% 40% 50% 60%
Color is like normal beans
Color is appetizing
The don’t look like normal beans
Nothing.
52%
25%
14%
9%
Figure 38: Graph showing feedback on the color of the dehydrated pre -cooked beans after
preparation.

Findings in the table above indicate that overall, majority of the respondents said that the beans after preparation had somewhat good aroma at 45%. This
was mostly true for respondents in Kampala at 48%, in urban setting at 47%, and restaurants at 68%.
However, worth noting is that across all demographics, the aroma of the beans was appealing to majority respondents.
4.7.5.8 Reasons for rating of aroma of the beans after preparation
Figure 39: A figure showing respondents` feedback on the aroma of the dehydrated precooked beans after preparation

Findings illustrated in figure 39 above shows that a significant proportion of the respondents said the dehydrated precooked beans after preparation had a
pleasant smell at 33.7%. Likewise, a significant proportion also said that the spices gave the beans a very good smell.
This analysis could explain why majority of the respondents at 78% said they were happy with the aroma of the beans after preparation.
0.0% 5.0% 10.0% 15.0% 20.0% 25.0% 30.0% 35.0%
Have a pleasant smell
The spices gave the beans a very good smell
Smell like ordinary beans
Unpleasant smell
They don’t smell like ordinary beans
Nothing
Smell like half cooked beans
33.7%
21.7%
18.9%
15.7%
8.8%
3.8%
0.5%
Figure 39: A graph showing the respondents feedback on the aroma of the
dehydrated pre-cooked beans after preparation .

4.7.5.9 Texture/mouth feel of the beans after preparation
Figure 40: A figure showing feedback respondents` rating on the texture of the beans after preparation
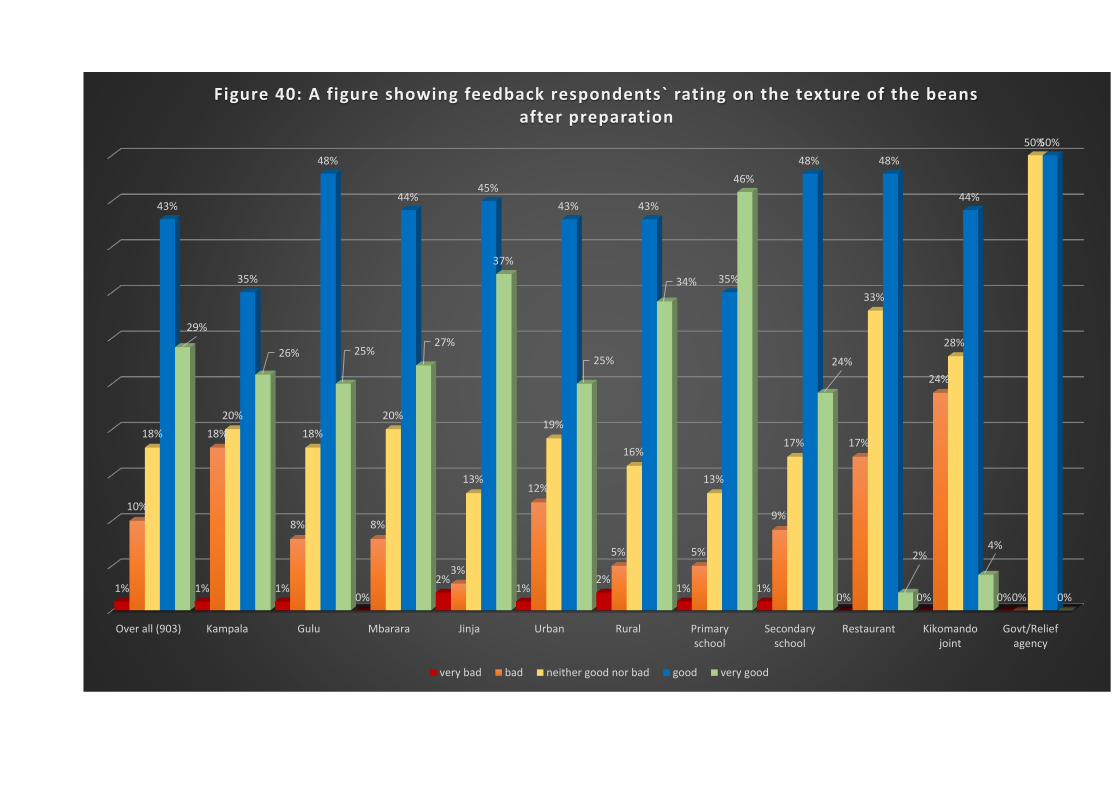
Over all (903) Kampala Gulu Mbarara Jinja Urban Rural Primaryschool
Secondaryschool
Restaurant Kikomandojoint
Govt/Reliefagency
1% 1% 1%0%
2%1%
2%1% 1%
0% 0% 0%
10%
18%
8% 8%
3%
12%
5% 5%
9%
17%
24%
0%
18%
20%
18%
20%
13%
19%
16%
13%
17%
33%
28%
50%
43%
35%
48%
44%45%
43% 43%
35%
48% 48%
44%
50%
29%
26% 25%27%
37%
25%
34%
46%
24%
2%4%
0%
Figure 40: A figure showing feedback respondents` rating on the texture of the beans after preparation
very bad bad neither good nor bad good very good

As shown in figure 40 above, overall, majority of the respondents rated liked as good at 43%. This was a true across most of the demographics except in
primary schools where 46% of the respondents found the texture very good.
4.7.5.10 Reasons for rating of texture of the beans after preparation
Figure 41: A figure showing respondents feedback on the texture of the dehydrated precooked beans after preparation

Findings illustrated in the figure above indicate that a significant proportion of the respondents said the dehydrated precooked beans felt hard after
preparation at 26.1%. This was closely followed by those who said that they were delicious due to the added ingredients at 25.6%.
4.7.5.11 Quality of the dehydrated precooked beans
Table 32: A table showing respondents rating on the quality of the dehydrated precooked beans
District Setting Business of the organization
Base 903 211 216 257 219 555 348 316 445 63 75 *2
Very bad 1% 1% 1% 1% 1% 1% 1% 1% 0% 0% 0%
Bad 4% 9% 5% 2% 1% 6% 2% 3% 5% 5% 8% 0%
Neither bad nor good 12% 14% 9% 12% 14% 13% 10% 9% 12% 14% 17% 50%
Good 50% 49% 48% 53% 51% 51% 50% 39% 55% 67% 60% 50%
Very good 32% 26% 38% 32% 33% 30% 36% 47% 27% 14% 15% 0%
0.0% 5.0% 10.0% 15.0% 20.0%
Have a coarse mouth feel.
Delicious due to ingredients added.
A very soft
Are easy to chew and swallow
Taste like ordinary beans
Have bad taste.
Have unique taste different from other beans
Half cooked/not ready
Nothing.
20.3%
17.4%
6.9%
6.8%
4.2%
0.9%
0.8%
Figure 41: A figure showing respondents feed back on the texture of the dehydrated pre -cooked beans after preparation

Findings in the table above indicate that overall, 50% of the respondents said the quality of the beans was good. This was mostly true for those in urban areas
at 51% and those in Mbarara at 53%. Worth noting is that majority of the respondents in primary schools said the quality beans was very good at 47%.
4.7.5.12 Comparison of dehydrated precooked beans with current beans
Figure 42: A figure showing respondents` comparison of dehydrated precooked beans to the current beans they consume/purchase
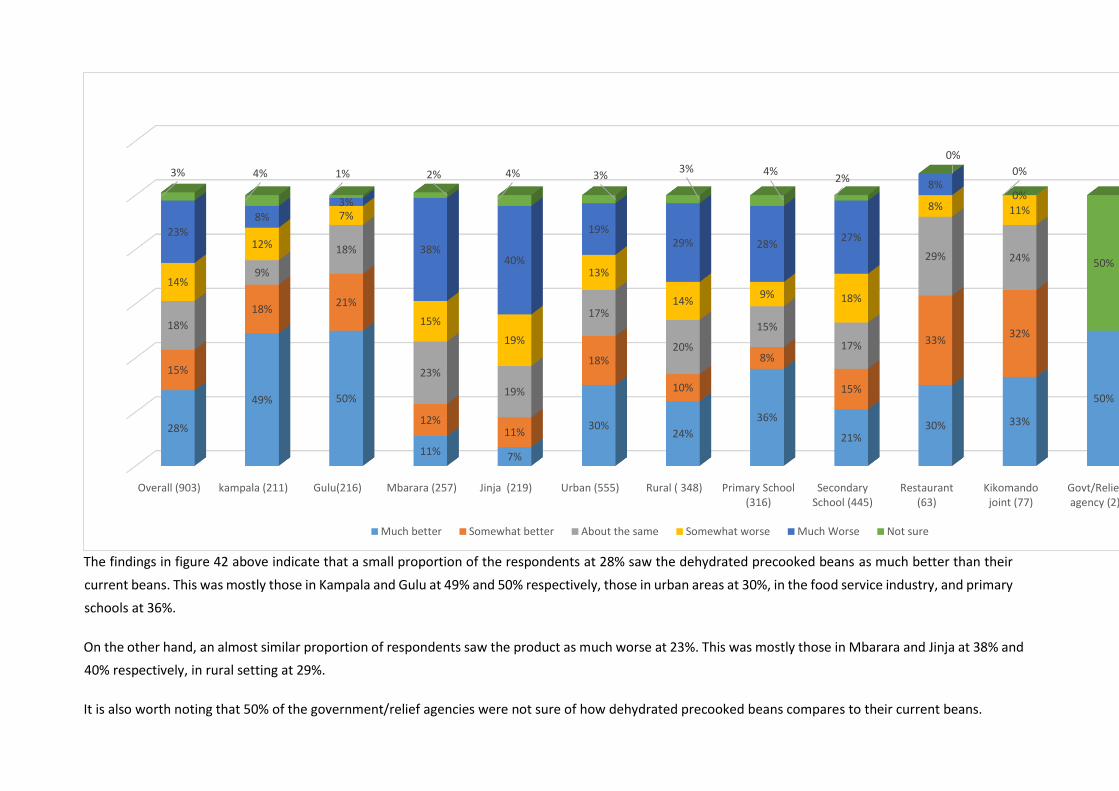
The findings in figure 42 above indicate that a small proportion of the respondents at 28% saw the dehydrated precooked beans as much better than their
current beans. This was mostly those in Kampala and Gulu at 49% and 50% respectively, those in urban areas at 30%, in the food service industry, and primary
schools at 36%.
On the other hand, an almost similar proportion of respondents saw the product as much worse at 23%. This was mostly those in Mbarara and Jinja at 38% and
40% respectively, in rural setting at 29%.
It is also worth noting that 50% of the government/relief agencies were not sure of how dehydrated precooked beans compares to their current beans.
Overall (903) kampala (211) Gulu(216) Mbarara (257) Jinja (219) Urban (555) Rural ( 348) Primary School(316)
SecondarySchool (445)
Restaurant(63)
Kikomandojoint (77)
Govt/Reliefagency (2)
28%
49% 50%
11% 7%
30%24%
36%
21%30% 33%
50%
15%
18%21%
12%11%
18%
10%
8%
15%
33%32%
18%
9%
18%
23%
19%
17%
20%
15%
17%
29% 24%
14%
12%
7%
15%
19%
13%
14%9% 18%
8% 11%
23%8%
3%
38%40%
19%29% 28%
27%
8%0%
3% 4% 1% 2% 4% 3%3% 4%
2%
0%
0%
50%
Much better Somewhat better About the same Somewhat worse Much Worse Not sure
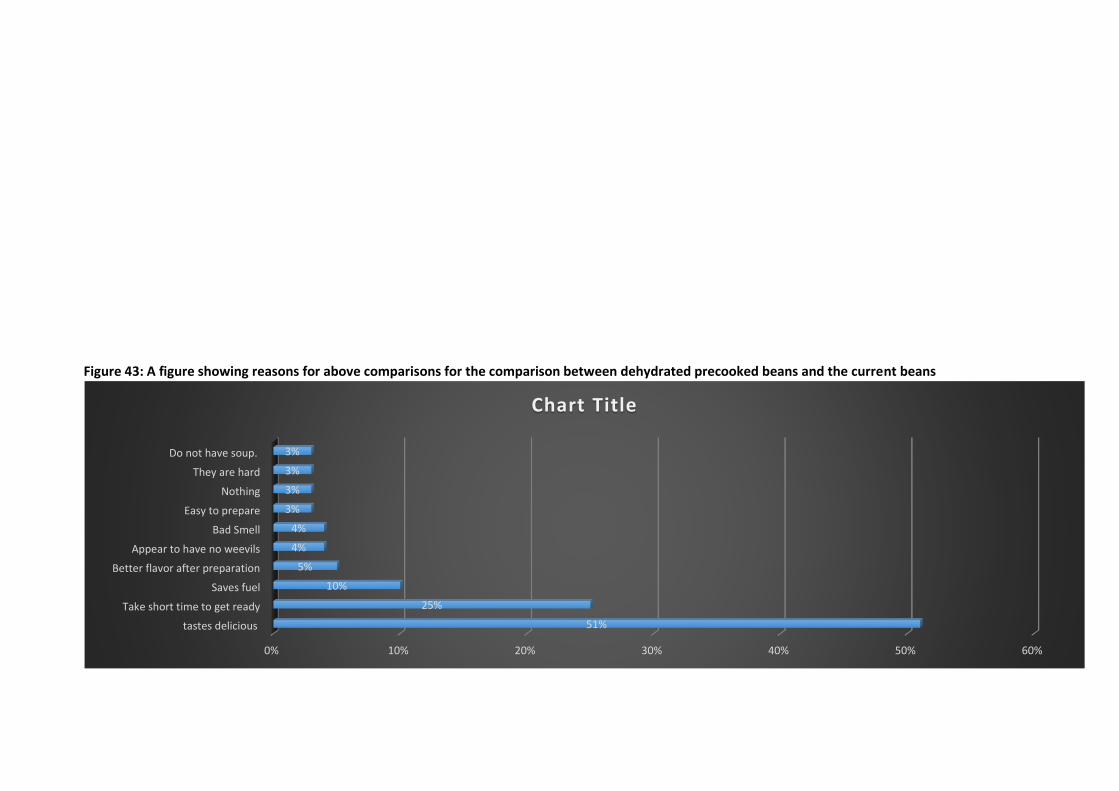
Figure 43: A figure showing reasons for above comparisons for the comparison between dehydrated precooked beans and the current beans
0% 10% 20% 30% 40% 50% 60%
tastes delicious
Take short time to get ready
Saves fuel
Better flavor after preparation
Appear to have no weevils
Bad Smell
Easy to prepare
Nothing
They are hard
Do not have soup.
51%
25%
10%
5%
4%
4%
3%
3%
3%
3%
Chart Title

51% of the respondents said the dehydrated precooked beans tasted more delicious and appetising. This was followed by 25% who said the beans take a shorter
time to prepare then their current beans.
Looking at all the responses mentioned, it is worth noting that the dehydrated precooked beans had more positive responses in comparison with their current
beans.
4.8 Likes, dislikes and suggestions for improvement on the dehydrated precooked beans
This sub section entails findings focused on the likes and dislikes for dehydrated precooked beans by the institutional market as well as suggestions for
improvement of the product.
4.8.1 Likes for dehydrated precooked beans
Figure 44: A figure showing the various likes for dehydrated precooked beans
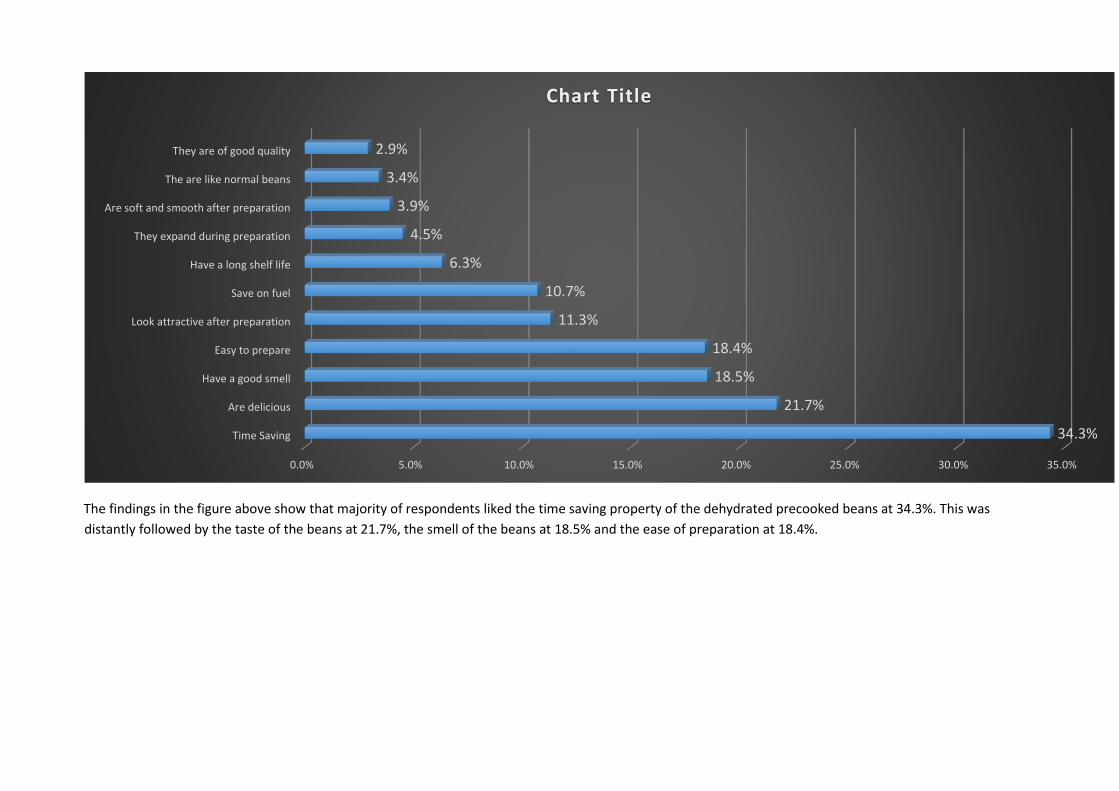
The findings in the figure above show that majority of respondents liked the time saving property of the dehydrated precooked beans at 34.3%. This was
distantly followed by the taste of the beans at 21.7%, the smell of the beans at 18.5% and the ease of preparation at 18.4%.
0.0% 5.0% 10.0% 15.0% 20.0% 25.0% 30.0% 35.0%
Time Saving
Are delicious
Have a good smell
Easy to prepare
Look attractive after preparation
Save on fuel
Have a long shelf life
They expand during preparation
Are soft and smooth after preparation
The are like normal beans
They are of good quality
34.3%
21.7%
18.5%
18.4%
11.3%
10.7%
6.3%
4.5%
3.9%
3.4%
2.9%
Chart Title

4.8.2 Dislikes for dehydrated precooked beans
Figure 45: A figure showing the various dislikes for dehydrated precooked beans

From the findings in figure 45, while a significant proportion of the respondents said they had no dislike for the dehydrated precooked beans at 25.3%, a
significant proportion said the smell was not so good at 24.4%. This was distantly followed by the hardness of the beans.
Comparing the likes and dislikes of dehydrated precooked beans, we can say that while the respondents appreciated the functional benefits of the product,
there was a concern on the self-expressive benefits of the dehydrated precooked beans.
0.0% 5.0% 10.0% 15.0% 20.0%
The aroma is not so good
Nothing
they are a little hard
Are not attractive before preparation
Have tasteless soup
They break
Nutrients have been removed
They are too soft and turn into porridge
Taste undercooked
Produce colorless soup when soaked
Not fresh
They can not be planted.
18.8%
10.3%
5.0%
3.8%
3.4%
2.3%
1.8%
1.6%
1.3%
0.3%
Figure 45: Chart showing various dislikes for dehydrated pre -coooked beans.
3.9.3 Suggestions for improvement for dehydrated precooked beans
Figure 46: A figure showing respondents` suggestions for improvement of dehydrated precooked beans

Findings illustrated in the bar graph above show that while a significant proportion the respondents had no suggestion for improvement at 21.3%, a notable
proportion those that had suggestions said flavour/ingredients should be added to the beans and the beans should be able to become soft after soaking at
15.9% and 15.5% respectively.
Looking at the list of improvements, there is need to develop a product that is not so far in terms of appearance and traditional features from the kind of beans
that the respondents are used to seeing.
0.0% 5.0% 10.0% 15.0%
Nothing
Add flavor/ingredients
beans should soften after soaking
The aroma
size and nature
Retain the original shape of the beans
Make them retain original color
Retain original soup.
Add nutrients
Improve on appearance before packing
Increase time of getting ready
Improve on the quality
Add soda ash
Avail other bean varieties
Remove rosemary herb.
15.9%
15.5%
13.2%
8.3%
4.5%
4.5%
4.2%
4.0%
3.9%
3.8%
3.3%
1.9%
1.4%
0.8%
Figure 46: A figure showing respondents` suggestions for improvement of dehydrated precooked beans

4.9 Likelihood to purchase/consume dehydrated precooked beans
This sub section entails findings focused on the need for dehydrated precooked beans, purchase intent, purchase likelihood, price willing to pay for a kilo gram
of the product.
4.9.1 The need for dehydrated precooked beans

Figure 47: A figure showing the institutional need for dehydrated precooked beans
Findings in figure 47 show that there is a need for dehydrated precooked beans at 43%. This is mostly skewed to institutions in Jinja at 56%, in rural areas and
Kikomando joints at 47%.
Looking at the business categories, primary and secondary schools see dehydrated precooked beans mainly as a minor improvement of what they currently
use at 34% and 33% respectively. This is the same case for government/relief agencies at 100%.
In terms of district, while institutions in Jinja, Kampala, and Mbarara see a need for this product, institutions in Gulu on the other hand sees dehydrated
precooked beans as a minor improvement of what they currently use at 45%.
0%
20%
40%
60%
80%
100%
Overall (231) kampala (55) Gulu(53) Mbarara (65) Jinja (58) Urban (178) Rural ( 53) Primary School(32)
SecondarySchool (28)
Restaurant (65) Kikomando joint(75)
43% 44%
26%
43%
56%
40%
53%44%
39% 42%47%
27% 24%
45%18%
23%
27%
28%
34%
33% 26% 18%
21%15%
17% 34%
16%
23%
15% 19%
18% 25%
20%
9%17% 11%
4% 5%10%
4% 3%10% 7%
15%
Institutional need for dehydrated pre-cooked beans
Precooked beans are only option Precooked beans are minor improvement About the same as current product Prefer to use uncooked beans

This could mean that there is a need to develop a winning marketing strategy that can be used to market this product to the various institutions by capitalising
of the positive attributes of the product.
4.9.2 Purchase/consumption intent
Figure 48: A figure showing respondents` intent to purchase dehydrated precooked beans
Findings in the figure 48 above indicate that majority respondents would buy/consume dehydrated precooked beans at 86%.
Figure 49: A figure showing reasons for purchase/consumption intent
yes, 86%
no, 14%
Percentage of Respondents who intend to purchase dehydrated pre-cooked beans.
yes no

Findings in the bar graph above indicate that majority of the institutions would buy the beans mainly because they are time saving at 39.9% while those that
would not buy is because of the bad smell at 4.4%.
0.0% 5.0% 10.0% 15.0% 20.0% 25.0% 30.0% 35.0%
Saves time
Easy to prepare
They are tasty
Save on fuel
Bad smell
Improve on quality
Have long shelf life
Nothing
Have nice aroma
It has a bad experience
Doubtful of the nutrient content.
Are nutritious
20.3%
16.7%
16.0%
4.4%
4.2%
3.7%
3.4%
2.9%
1.8%
1.3%
1.1%
Figure 49: A figure showing reasons for purchase/consumption intent
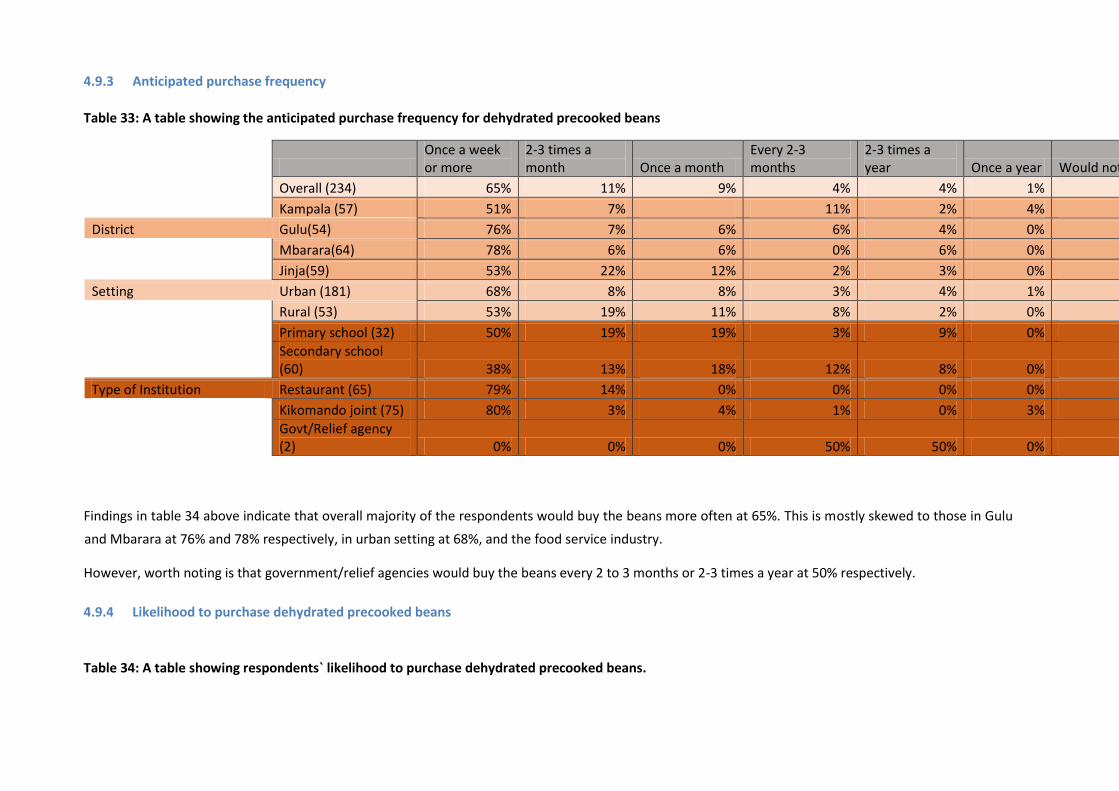
4.9.3 Anticipated purchase frequency
Table 33: A table showing the anticipated purchase frequency for dehydrated precooked beans
Once a week or more
2-3 times a month Once a month
Every 2-3 months
2-3 times a year Once a year Would not use it
Overall (234) 65% 11% 9% 4% 4% 1% 7%
Kampala (57) 51% 7% 11% 2% 4% 16%
District Gulu(54) 76% 7% 6% 6% 4% 0% 2%
Mbarara(64) 78% 6% 6% 0% 6% 0% 3%
Jinja(59) 53% 22% 12% 2% 3% 0% 8%
Setting Urban (181) 68% 8% 8% 3% 4% 1% 7%
Rural (53) 53% 19% 11% 8% 2% 0% 8%
Primary school (32) 50% 19% 19% 3% 9% 0% 0%
Secondary school (60) 38% 13% 18% 12% 8% 0% 10%
Type of Institution Restaurant (65) 79% 14% 0% 0% 0% 0% 6%
Kikomando joint (75) 80% 3% 4% 1% 0% 3% 9%
Govt/Relief agency (2) 0% 0% 0% 50% 50% 0% 0%
Findings in table 34 above indicate that overall majority of the respondents would buy the beans more often at 65%. This is mostly skewed to those in Gulu
and Mbarara at 76% and 78% respectively, in urban setting at 68%, and the food service industry.
However, worth noting is that government/relief agencies would buy the beans every 2 to 3 months or 2-3 times a year at 50% respectively.
4.9.4 Likelihood to purchase dehydrated precooked beans
Table 34: A table showing respondents` likelihood to purchase dehydrated precooked beans.

District
Setting
Business of the
organization
227 54 54 61 58 175 52 30 55 65 75 2
Very unlikely 2% 4% 0% 2% 3% 2% 2% 0% 4% 2% 3% 0%
Unlikely 6% 19% 2% 2% 3% 6% 6% 0% 4% 5% 12% 0%
Neutral 16% 19% 13% 7% 26% 14% 23% 23% 16% 14% 12% 100%
Likely 64% 48% 72% 70% 64% 64% 63% 67% 73% 68% 55% 0%
Very likely 12% 11% 13% 20% 3% 14% 6% 10% 4% 11% 19% 0%
Findings illustrated in table 34 above indicate that overall majority of the respondents are likely to buy dehydrated precooked beans at 64%. This is mostly
skewed to those in Gulu and Mbarara at 72% and 70% respectively, in urban setting at 64%, and in secondary schools at 73%.
Worth noting is that all at 100%, government/relief agencies were neutral about their likelihood to buy dehydrated precooked beans.

4.9. 5 Quantities of the dehydrated precooked beans likely to buy
Table 35: A table showing quantities of dehydrated precooked beans respondents are likely to buy
Quantities they are willing to buy in Kg
Min Max Mean
District
Kampala (50) 1 110,000 4,640
Gulu (51) 1 30,000 1,003
Mbarara (58) 1 6,000 168
Jinja (53) 1 6,000 247
Setting Urban (166) 1 110,000 1,566
Rural (46) 1 30,000 1,003
Business of organization
Primary school (19) 1 6,000 395
Secondary school (26) 2 30,000 3,306
Restaurant (61) 1 200 7
Kikomando joint (74) 1 50 5
Government or Relief agency (2) 100,000 110,000 105,000
Total (212) 1 110,000 1,444
Findings illustrated in table 36 above show that on average, the minimum number of Kgs that can be bought are 5kg while the maximum number are 105,000
Kg.
4.9.6 Price willing to pay for a kilo gram of the dehydrated precooked beans
Figure 50: A figure showing average price respondents are willing to pay for 1 kg of dehydrated precooked beans

As illustrated in figure 50 above, overall on average, respondents are willing to pay Uganda shillings
2,478 for 1 kilo gram of dehydrated pre-cooked beans. However, this is higher for primary schools who on average can pay up to Uganda shillings 3,105 for 1
Kg of dehydrated precooked beans and lower for Kikomando Joints at Ugx. 2,427, those in Jinja at Shillings 2,474 and those in rural areas at Shillings 2,441.
4.10 Likelihood to recommend dehydrated precooked beans
This sub section entails findings focused on the likelihood to recommend dehydrated precooked beans to other institutions.
4.10.1 Likelihood to recommend dehydrated precooked beans to other institutions

Table 36: A table showing respondents` likelihood to recommend dehydrated precooked beans to others
Findings in the table above show that overall majority of the respondents are willing to recommend dehydrated precooked beans to their counterparts at
85%.This is true across all demographics.
CHAPTER 5: RECOMMENDATIONS AND CONCLUSIONS
This section includes our recommendations and conclusions of the study
5.1 Recommendations
1. Purchase of beans
99% of all institutions that took part in the survey purchase beans. 73.7% of these buy the beans from retail shops. Findings also show that 91% of the
institutions are likely to buy dehydrated precooked beans. It is therefore worth noting that there is a high market for beans in Uganda especially from
retail shops which is where they should be sold and distributed.
2. Quantities of beans purchased
On average, primary schools purchase 1,643 Kgs of beans whenever they make a purchase while secondary schools purchase 9,598 Kg of beans. In
addition, government/relief agencies purchase 750,500 Kg of beans on average whenever they make a purchase. There is therefore need for suppliers
of beans to produce enough quantities that can meet the demand of beans, especially in schools, government and relief agencies.
3. Pricing of beans
Overall the average price paid for 1 Kilogram of beans in Uganda is UGX. 2603. However, it tends to be lower for institutions in urban areas at UGX.2,
599 and highest for Kikomando joints who but it averagely at UGX. 2,635. The lowest price at which the beans are bought is UGX. 1,200 by Kikomando
joints in urban areas while the highest price is UGX. 4,500 by restaurants in urban areas.
In order for suppliers of beans to be competitive, there is need for them to be aware of these prices of beans so that they can provide affordable
competitive prices to their customers.
4. Quality of beans
60% of institutions believe that the quality of their beans is good especially primary schools and government/relief agencies. There is therefore need for
the suppliers of beans to provide good quality beans to their customers.
5. Challenges faced in obtaining fuel
The main challenge faced by the institutions relates to cost of transportation of fuel for cooking the beans. Dehydrated pre-cooked beans would bridge
the gap and reduce on the cost incurred by the institutions in buying fuel. This is the main advantage that dehydrated pre-cooked beans brings. As seen
in the data, overall, majority of the institutions at 52.7% are yearning to buy a product that requires less fuel especially those in rural areas.
6. Bean category preferences
Whereas there were very many varieties of beans in the market, findings from this survey indicate that yellow beans are most preferred. This preference
was noted across all the districts averaging at 45%.
Differential preference of bean type was also observed at the different levels of institutions. While the primary schools had higher preference for
Kanyeebwa beans, secondary schools on the other hand preferred Nambaale beans. Restaurants and Kikomando joints prefer yellow beans and
government agencies prefer other beans varieties.
One can therefore conclude that different regions have got different preferences for beans, especially North and South, with North preferring yellow
beans while the South prefers other bean varieties such as Nambale and Kanyebwa. Whereas this is not very significant attention should be put on the
category of beans variety for the various school levels and regions.
7. Problems with current beans
Findings indicate that 60.8% of the institutions face a key challenge with the overall time taken to prepare beans. This is mostly true in primary schools
at 70.6% and restaurants at 70.8%. Another problem the institutions face is proneness of the beans to weevil attacks. This is mostly experienced in
schools. The use of dehydrated precooked beans would reduce time taken in preparation of beans. However, there is need to put in place solution to
overcome the proneness of beans to weevils.
8. Appearance of dehydrated precooked beans
23% of the respondents said that the dehydrated precooked beans looked like ground nuts before preparation while 19.9% said they looked like cooked
dry beans. There is therefore a need to ensure that the initial appearance of the dehydrated precooked beans look like real beans.
On the other hand, 29.7% of the respondents said that after preparation the beans looked delicious. This is a good aspect that should be maintained.
9. Smell of the dehydrated precooked beans
While 34.5% of the respondents said that the dehydrated precooked beans smelt like ordinary cooked beans, 21.9% said the beans had a bad smell. The
suppliers need to ensure that they improve on the smell of the beans.
10. Taste of the beans
43% of the respondents said that the taste of the beans after preparation was good. This was mostly true for those in Kampala and urban areas at 48%
and restaurants at 75%. This is a good aspect that should be maintained.
11. Mouth feel
26.1% of the respondents said the dehydrated precooked beans felt hard after preparation. The dehydrated precooked beans should be processed in
such a way that they will become soft after preparation.
5.2 Conclusions
This report has therefore provided a detailed explanation of understanding of the current beans market and acceptability of dehydrated precooked beans.
The major highlights of the report have included; the background and introduction to the report, literature review, methodology used, key findings,
recommendations and conclusions.
On that note, we recommend that the supplier of dehydrated precooked beans should proceed with their production and distribution especially among
schools and government institutions/agencies as that is where there is ready market for them. However, there is need to improve on the various gaps on the
product that have been highlighted in this report concerning the dehydrated precooked beans.

APPENDICES

Appendix 1: List of current bean types in Uganda


Appendix 2: List of restaurants and Kikomando Joints that participated in the study District Institution Type Organization Name
Gulu Kikomando Joint L.A Kikomando
Gulu Kikomando Joint Majje Chapati & Kikomando Acholi
Road
Gulu Kikomando Joint Zirye Foods Adjacent Buganda Pub
Gulu Kikomando Joint Waku Peter's Kikomado Joint
Gulu Kikomando Joint Onek Martin's Kikomado Joint
Gulu Kikomando Joint Okwir Francis's Kikomando Joint
Gulu Kikomando Joint Nakoko Dan's Kikomando Joint
Gulu Kikomando Joint Busisa George's Kikomando
Gulu Kikomando Joint Mafabi Ismail kikomando Joint
Gulu Kikomando Joint Hamisi Kibeyi kikomando Joint
Gulu Kikomando Joint Opiyo Simon kikomando Joint
Gulu Kikomando Joint Nsubuga Umarkikomando Joint
Gulu Kikomando Joint Stephen Oweka's Kikomando Joint
Gulu Kikomando Joint Okello Francise`S Kikomando Joint
Gulu Kikomando Joint Kyasanku Phillip
Gulu Kikomando Joint Chebet Lilian
Jinja Kikomando Joint Bulo Kikomando Joint
Jinja Kikomando Joint Delicous Rolex Kikomando
Jinja Kikomando Joint Fair Way Kikomando
Jinja Kikomando Joint Mafabi's Chapati (Masese Stage )
Jinja Kikomando Joint Mateng's Kikomando
Jinja Kikomando Joint Musitasa's Chapati Joint
Jinja Kikomando Joint Mzee Salongo's Kikomando

Jinja Kikomando Joint Napita Kikomando Joint Along Dalia
Road
Jinja Kikomando Joint Robert's Chapati
Jinja Kikomando Joint Henry's Chapti Shop
Jinja Kikomando Joint Laston's Chapati
Jinja Kikomando Joint Waiswa's Kikomando Joint
Jinja Kikomando Joint Yazid's Chapatis
Jinja Kikomando Joint Yesu Asobola
Kampala Kikomando Joint Budaka Boys
Kampala Kikomando Joint Isamonos Kikomando
Kampala Kikomando Joint Kings Chapati And Snacks
Kampala Kikomando Joint Maama Urban Hotel And
Kikomando
Kampala Kikomando Joint Waswa Ronald's Kikomando Joint
Kampala Kikomando Joint Wambalya Simon's Kikomando Joint
Kampala Kikomando Joint Tukamubugama Joseph's
Kikomando Joint
Kampala Kikomando Joint Semanda Robert's Kikomando Joint
Kampala Kikomando Joint Ronnie Nseko's Kikomando Joint
Kampala Kikomando Joint Owili Emmanuel's Kikomando
Kampala Kikomando Joint Mwanga Yusuf's Kikomado Joint
Kampala Kikomando Joint Mangeni David's Kikomando Joint
Kampala Kikomando Joint Kyonkyo Francis's Kikomando Joint
Kampala Kikomando Joint Kule Boaz's Kikomando Joint
Kampala Kikomando Joint Kopia Richard's Kikomando Joint
Kampala Kikomando Joint Kibuuka Ambrose's Kikomando Joint
Kampala Kikomando Joint Kamwada James's Kikomando Joint

Kampala Kikomando Joint Kakembo Dickson's Kikomando Joint
Kampala Kikomando Joint John Sempijja's Kikomando Joint
Kampala Kikomando Joint Ddumba Rawrence's Kikomando Joint
Kampala Kikomando Joint Bazam Tasaga's Kikomando Joint
Kampala Kikomando Joint Nakulima Amina kikomando Joint
Mbarara Kikomando Joint Best Kikomando
Mbarara Kikomando Joint Bosmilah Kikomando Joint
Mbarara Kikomando Joint Direct Chapati
Mbarara Kikomando Joint Hassan Co Chappati And Rolex
Mbarara Kikomando Joint Kawomera Chapatti
Mbarara Kikomando Joint Obama Best Chapat
Mbarara Kikomando Joint Sarah's Kikomando Joint
Mbarara Kikomando Joint Wambede Bashir's Kikomado Joint
Mbarara Kikomando Joint Umaru Sebunya's Kikomado Joint
Mbarara Kikomando Joint Turyatunga Pidson's Kikomado Joint
Mbarara Kikomando Joint Turyahikayo Arthur's Kikomado Joint
Mbarara Kikomando Joint Tumusiime Junior's Kikomado Joint
Mbarara Kikomando Joint Tumugumye Benard's Kikomando Joint Kisenyi
Mbarara Kikomando Joint Ronald's Kikomado Joint
Mbarara Kikomando Joint Natukunda Ketty's Kikomando Joint
Omukajogo
Mbarara Kikomando Joint Mungereza John's Kikomado Joint
Mbarara Kikomando Joint Manzi Martin's Kikomado Joint
Mbarara Kikomando Joint Kusimakwe Ivan's Kikomado Joint
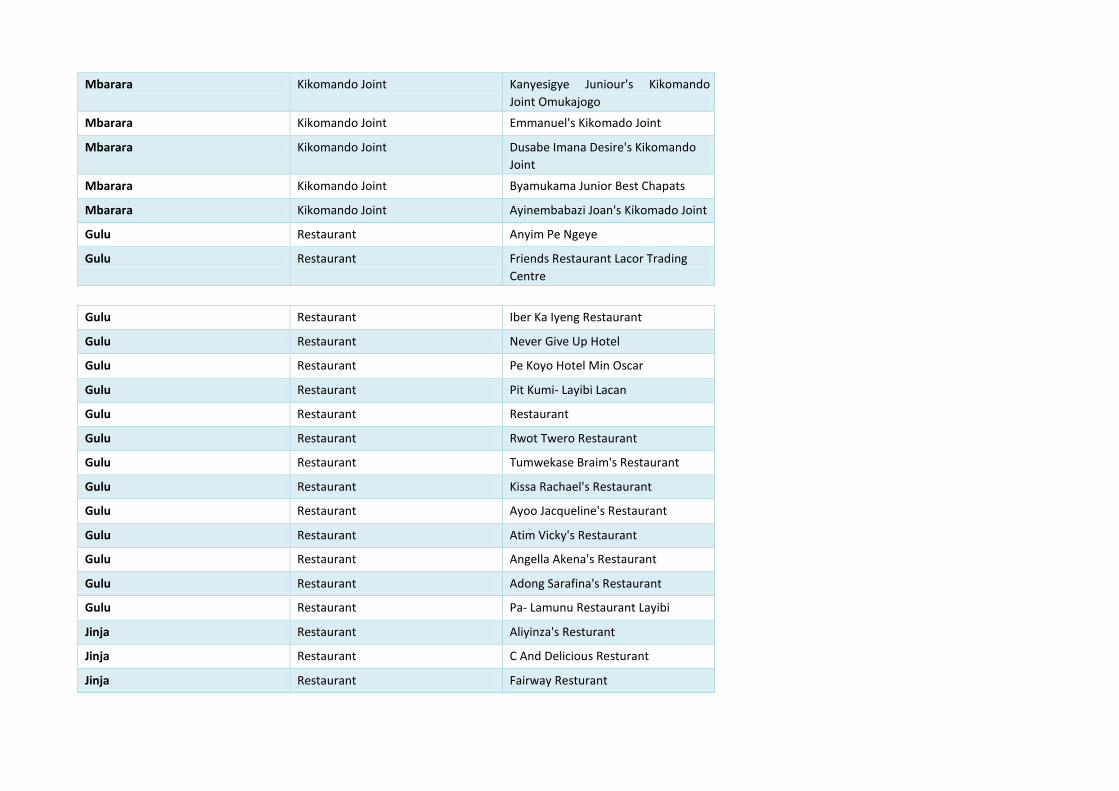
Mbarara Kikomando Joint Kanyesigye Juniour's Kikomando
Joint Omukajogo
Mbarara Kikomando Joint Emmanuel's Kikomado Joint
Mbarara Kikomando Joint Dusabe Imana Desire's Kikomando Joint
Mbarara Kikomando Joint Byamukama Junior Best Chapats
Mbarara Kikomando Joint Ayinembabazi Joan's Kikomado Joint
Gulu Restaurant Anyim Pe Ngeye
Gulu Restaurant Friends Restaurant Lacor Trading
Centre
Gulu Restaurant Iber Ka Iyeng Restaurant
Gulu Restaurant Never Give Up Hotel
Gulu Restaurant Pe Koyo Hotel Min Oscar
Gulu Restaurant Pit Kumi- Layibi Lacan
Gulu Restaurant Restaurant
Gulu Restaurant Rwot Twero Restaurant
Gulu Restaurant Tumwekase Braim's Restaurant
Gulu Restaurant Kissa Rachael's Restaurant
Gulu Restaurant Ayoo Jacqueline's Restaurant
Gulu Restaurant Atim Vicky's Restaurant
Gulu Restaurant Angella Akena's Restaurant
Gulu Restaurant Adong Sarafina's Restaurant
Gulu Restaurant Pa- Lamunu Restaurant Layibi
Jinja Restaurant Aliyinza's Resturant
Jinja Restaurant C And Delicious Resturant
Jinja Restaurant Fairway Resturant

Jinja Restaurant Hajjat's Restaurant Ambacot Near
The Mosque
Jinja Restaurant Hotel 13 In Walukuba Market
Jinja Restaurant Maa.A Wusieni
Jinja Restaurant Maama Akim Resturant
Jinja Restaurant Mama Ibra Resturant
Jinja Restaurant Mama Milly Restaurant
Jinja Restaurant Mama Milly Restaurant At
Walukuba West
Jinja Restaurant Mama Rashima Resturant
Jinja Restaurant Mama Siyati Resturant At Jinja
Central Market
Jinja Restaurant Nakaziba's Restaurant
Jinja Restaurant Oliver Resturant
Jinja Restaurant Sadat Products Kutchrd-Jinja
Jinja Restaurant Wairaka Resturant
Jinja Restaurant Continenental Restaurant Bugembe
Kampala Restaurant 14th Close Restaurant
Kampala Restaurant Afuga Restaurant
Kampala Restaurant Bizzu Restaurant
Kampala Restaurant Jozes Restaurant And Takeaway
Kampala Restaurant Mama Ken Makerere
Kampala Restaurant Mama Shiba
Kampala Restaurant Mugabi And Sons Restaurant
Kampala Restaurant Najjuma Restaurant
Kampala Restaurant Rahma Restaurant And Take Away
Kampala Restaurant Restaurant
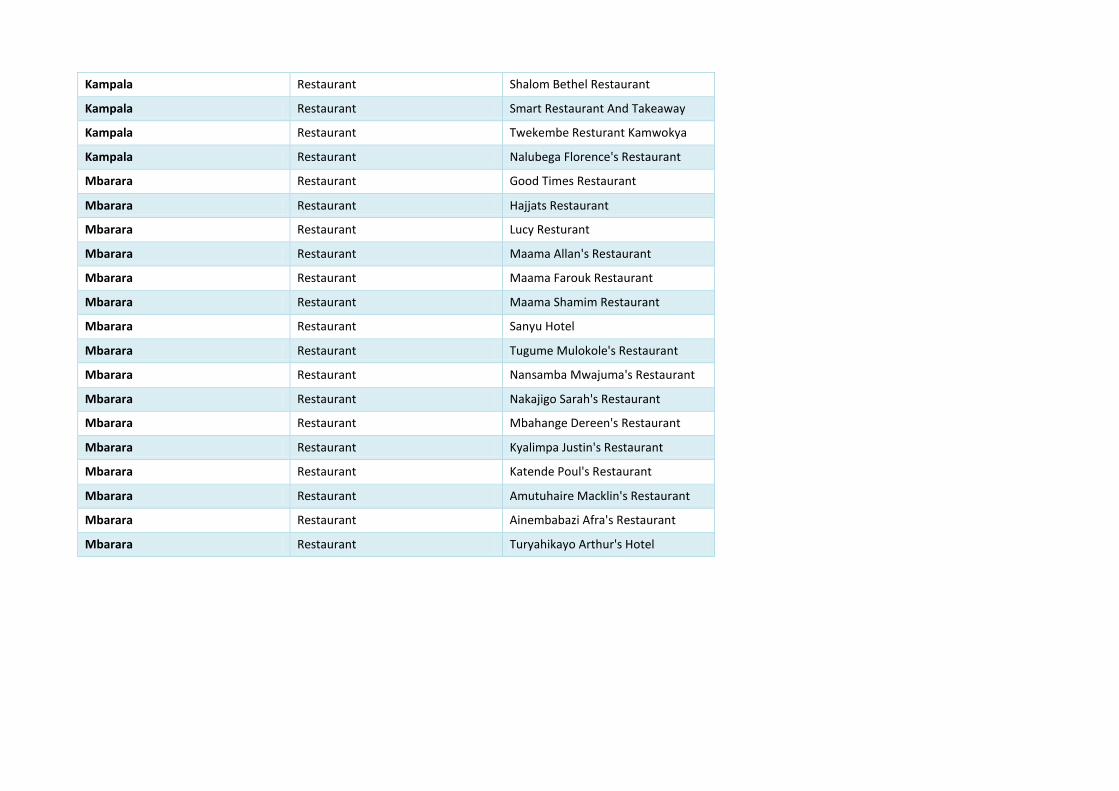
Kampala Restaurant Shalom Bethel Restaurant
Kampala Restaurant Smart Restaurant And Takeaway
Kampala Restaurant Twekembe Resturant Kamwokya
Kampala Restaurant Nalubega Florence's Restaurant
Mbarara Restaurant Good Times Restaurant
Mbarara Restaurant Hajjats Restaurant
Mbarara Restaurant Lucy Resturant
Mbarara Restaurant Maama Allan's Restaurant
Mbarara Restaurant Maama Farouk Restaurant
Mbarara Restaurant Maama Shamim Restaurant
Mbarara Restaurant Sanyu Hotel
Mbarara Restaurant Tugume Mulokole's Restaurant
Mbarara Restaurant Nansamba Mwajuma's Restaurant
Mbarara Restaurant Nakajigo Sarah's Restaurant
Mbarara Restaurant Mbahange Dereen's Restaurant
Mbarara Restaurant Kyalimpa Justin's Restaurant
Mbarara Restaurant Katende Poul's Restaurant
Mbarara Restaurant Amutuhaire Macklin's Restaurant
Mbarara Restaurant Ainembabazi Afra's Restaurant
Mbarara Restaurant Turyahikayo Arthur's Hotel