FEED STRUCTURE AND CONTENT PRODUCTION PROCESSES · of corn on mill energy consumption and pellet...
40
AMINOTec® TOPICS ON FEED PRODUCTION AND OPERATIONS EDITION 1 | NOVEMBER 2018 FEED STRUCTURE AND PRODUCTION PROCESSES IMPACT ON POULTRY LIVE PRODUCTION FEED COST IS THE MOST DOMINANT FACTOR IN POULTRY PRODUCTION COST. WHILE FEED PRODUCTION COST IS ONLY A MINOR PART OF THIS, FEED PRODUCTION PROCESSES HAVE A MAJOR INFLUENCE ON FEED QUALITY, … CONTENT 03 Feed structure and production processes impact on poultry live production vessel/wagon discharge lorry discharge vessel/wagon discharge … cooling granulating premix additive conditioning and pelletizing intake and storage 1 mixing 4 5 finished products load 6 dosing 2 grinding 3 20 How to Manage Reduce Shrink Reduce Shrink 34 Leading Brazilian Feed Production chooses Evonik
Transcript of FEED STRUCTURE AND CONTENT PRODUCTION PROCESSES · of corn on mill energy consumption and pellet...

AMINOTec®TOPICS ON FEED PRODUCTION AND OPERATIONS EDITION 1 | NOVEMBER 2018
FEED STRUCTURE AND PRODUCTION PROCESSES IMPACT ON POULTRY LIVE PRODUCTIONFEED COST IS THE MOST DOMINANT FACTOR IN POULTRY PRODUCTION COST. WHILE FEED PRODUCTION COST IS ONLY A MINOR PART OF THIS, FEED PRODUCTION PROCESSES HAVE A MAJOR INFLUENCE ON FEED QUALITY, …
CONTENT
03Feed structure and
production processes impact on poultry live
production
vessel/wagondischarge
lorrydischarge
vessel/wagondischarge
… coolinggranulating
premixadditive
conditioning and pelletizing
intake and storage
1mixing
4 5finished
products load
6dosing
2grinding
3
20How to Manage Reduce Shrink
Reduce Shrink
34Leading Brazilian Feed Production chooses Evonik

“Certain aspects are common to feed producers around the world and the necessity to supply healthy feed to the food supply chain at com-petitive cost is probably the most prominent.”
DETLEF BUNZEL, HEAD OF APPLIED FEED TECHNOLOGY, EVONIK NUTRITION & CARE GMBH
DEAR READER,THE GLOBAL FEED INDUSTRY IS QUITE DIVERSE AS AGRICULTURAL PRODUCTION CHANGES WITH CLIMATIC CONDITIONS AND AS REGIONAL OR NATIONAL REGULA-TIONS AND HABITS INFLUENCE LIVESTOCK PRODUCTION AS WELL AS CONSUMER PREFERENCES. Certain aspects, though, are common to feed producers around the world and the necessity to supply healthy feed to the food supply chain at competitive cost is probably the most prominent.
The structure of feed has an impact on both aspects, production cost and animal health. While pelleted feed is the standard in broiler production, Bunzel highlights options of reducing feed production cost by optimizing particle size distribution of the mash before pelleting or even introducing whole grains into the diet. Mubarak discusses the impact of such scenarios on broiler livestock production as well as health status of broilers. There seem to be opportunities for synergies in feed and livestock production in considering coarser particle sizes for broiler feed or even whole grain feeding.
Another topic that is high on the agenda of feed mill managers is how to manage and explain
inventory losses in feed production. Such losses, commonly referred to as shrink, add to the cost of feed production without adding any value. Bunzel points out reasons for shrink and describe best pratices to manage and reduce shrink throughout the process steps.
For decades Evonik has been providing con-sulting and handling solutions dedicated and optimized to support customers with using their products in feed production. Recently the hun-dredth system was started up by Evonik’s team at a leading Brazilian feed producer. Lara gives some background on the project. You may also want to access our website for more details by scanning the QR code.
P.S.: Please come back to us with questions or comments ([email protected]). As always, suggestions for topics of your interest for future editions of AMINOTec® are highly welcome.
2 AMINOTec® | EDITION 1 | NOVEMBER 2018

KEY INFORMATIONMixing, grinding and pelleting are the core processes involved in in feed production. Pelleted feed is particularly prevalent in broiler production, because of the ease of handling and distribution of pellets, as well as its positive effect on feed intake and weight gain. It is well accepted that grinding has a major impact on mixing and pellet quality. At the same time, feed pro-ducers adapt feed structure to the specific needs of different species. Broiler feed typically has a coarser structure compared to swine or aqua feed, considering the digestive system of broilers and, specifically, the grinding function of the gizzard.
Other feeding regimes for broilers such as whole grain feeding have developed, based on regional availability of raw mate-rials and preferences of farmers. In the context of recent discussions and research, however, further feeding plans have been developed for broilers which have been shown to have positive effects on animal health and welfare.
After describing different approaches of grain handling on processes in feed and live production, nutritional aspects of various feeding regimes will be discussed.
FEED STRUCTURE AND PRODUCTION PROCESSES IMPACT ON POULTRY LIVE PRODUCTIONAuthor: Mubarak Ali, PhD ([email protected]), Senior Technical Service Manager Evonik (SEA) Pte. Ltd.Singapore; co-author: Detlef Bunzel
FEED COST IS THE MOST DOMINANT FACTOR IN POULTRY PRODUCTION COST. WHILE FEED PRODUCTION COST IS ONLY A MINOR PART OF THIS, FEED PRODUCTION PROCESSES HAVE A MAJOR INFLUENCE ON FEED QUALITY, WHICH IN TURN HAS AN IMPACT ON THE MAIN KPIS OF LIVE PRODUCTION, SUCH AS FEED INTAKE, BODY WEIGHT AND FEED CONVERSION RATE.
PICTURE 01Roller mill and hammer mill complement specific strengths in step grinding process (CPM)
roller mill
hammer mill
3

GRINDINGFrom a process perspective, an appro-priate mash structure is an important precondition to ensure good miscibility and homogeneity, as well as stability of the mixture during further transportation and processing. Engster (2014) dis-cussed the importance of homogeneity of the mash in terms of its effect on ani-mal performance in AMINOTec, Edition 1, 2014. In AMINOBatch Working Precision Tests, Evonik found that the particle size of the mash has an influence on coefficients of variation. The evidence for this included the analysis of supple-mental amino acids (Bunzel, AMINONews Review 2009, AMINOBatch® Working Precision Test – A Valuable Tool to Evaluate Working Precision of your Mixing Plant).
According to Fahrenholz (2017), “…particle size reduction is the second-most common feed manufacturing process (mixing is first), and therefore has a substantial performance impact in the global sense. Grinding is most typi-cally associated with the size reduction of cereal grains.” He further explains that “the reduction in particle size leads to increased ingredient surface area, leading to more intimate interaction with digestive acids and enzymes in the GIT (gastro-intestinal tract). … The lack of adequate gizzard function, and resultant reduced GIT retention time, has a nega-tive impact on live performance. As a result, interest in coarse particle inclusion has grown considerably recently.” These nutritional aspects of the grinding process will be discussed in more detail at a later stage.
On the other hand, particle size is known to be related to pellet quality, which may have an effect on animal performance (McKinney and Teter, 2004, figure 1). As pellet quality and durability depends on various factors, we can find differ-ent evaluations of their relative impact. Reimer (1992) states that 20 % of pel-let quality is related to grinding (only dominated by formulation and on the same level as conditioning, figure 2). According to Fahrenholz (2012) particle size has the least impact out of seven influence factors he evaluated; the high-est impact in this comparative trial was assigned to compression ratio of the die, followed by conditioning temperature and level of fat addition (figure 3)
FCR d 38–45
2,05
2,00
1,95
1,850 20 40 60 80 100
FCR Linear (FCR)
y = –0,0014x + 1,9976R2 = 0,9154
Pellet Quality [% Pellets]
1,90
Weight gain d 38–45 [g]
740
720
700
680
640
620
Weight gain Linear [Weight gain]
y = 0,7x+651R2 = 0,9225
Pellet Quality [% Pellets]
660
0 20 40 60 80 100
FIGURE 01McKinney and Teeter, 2004: Impact of pellet quality on weight gain and feed conversation rate.
4 AMINOTec® | EDITION 1 | NOVEMBER 2018

FIGURE 02Relative impact of process parameters on pellet quality (Reimer, 1992)
FIGURE 03Factors influencing pellet daurability (Fahrenholz, 2012)
In a review by Amerah et. al.(2007) of the implications of feed particle size on the digestion and performance of poultry, a general industry consensus is assumed that in “broiler diets based on maize or sorghum, optimum par-ticle size should be between 600 and 900 μm”. Here the authors conclude that “available data clearly show that grain particle size is more critical in mash diets than in pelleted or crumble diets” … and “suggest that coarser grinding to a more uniform particle size improves the performance of birds maintained on mash diets”. In the same review, the research authors point out that “the reduction of feed particle size is the second largest energy cost after that of pelleting in the broiler industry (Reece et al., 1985) and likely to be the largest user of energy in the layer industry where pelleting is not per-formed (Deaton et al., 1989). … Dozier (2002) estimated that the utility usage comprised 25 to 30 % of the manufac-turing cost of broiler feed. … Thus, any reduction in energy consumption
from grinding could significantly lower feed cost.“ Again, nutritional effects will be addressed in more detail at a later stage.
Djuro M. Vukmirović et. al. conducted research in 2014 into the “Influence of grinding method and grinding intensity of corn on mill energy consumption and pellet quality” at the University of Novi Sad. Here the experts examined how grinding different structures of corn on a hammer mill versus a roller mill affects subsequent conditioning and pelleting quality. Six different par-ticle size distributions were compared with GMD (geometric mean diameter) varying from fine (671 µm) to very coarse (2108 µm), three of which were produced on a hammer mill, three on a roller mill. To achieve differences in particle size distribution, openings were used on the hammer mill sieves with 3, 6 and 9 mm. On the roller mill, the gap between the lower pair of rollers was set to 1.4, 2.0 and 2.6 mm (table 1 and figure 4).
THUS, ANY REDUCTION IN ENERGY CON-SUMPTION FROM GRINDING COULD SIGNIFICANTLY LOWER FEED COST.
0,5
5,4
2,8
0,6
71,1
10,9 40 %
Formulation
20 % Grinding
20 % Conditioning
15 % Die
5 % Drying/Cooling
In a review by Amerah et. al.(2007) of the implications of feed particle size on the digestion and performance of poultry, a general industry consensus is assumed that in “broiler diets based on maize or sorghum, optimum particle size should be between 600 and 900 µm”. Here the authors conclude that “available data clearly show that grain particle size is more critical in mash diets than in pelleted or crumble diets” … and “suggest that coarser grinding
In a review by Amerah et. al.(2007) of the implications of feed particle size on the digestion and performance of poultry, a general industry consensus is assumed that in “broiler diets based on maize or sorghum, optimum particle size should be between 600 and 900 µm”. Here the authors conclude that “available data clearly show that grain particle size is more critical in mash diets than in pelleted or crumble diets” … and “suggest that coarser grinding
In a review by Amerah et. al.(2007) of the implications of feed particle size on the digestion and performance of poultry, a general industry consensus is assumed that in “broiler diets based on maize or sorghum, optimum particle size should be between 600 and 900 µm”. Here the authors conclude that “available data clearly show that grain particle size is more critical in mash diets than in pelleted or crumble diets” … and “suggest that coarser grinding to a more uniform particle size improves the performance of birds maintained on mash diets”. In the same review, the research authors point out that “the reduction of feed particle size is the second largest energy cost after that of pelleting in the broiler industry (Reece et al., 1985) and likely to be the largest user of energy in the layer industry where pelleting is not performed (Deaton et al., 1989). … Dozier (2002) estimated that the utility usage comprised 25 to 30% of the manufacturing cost of broiler feed. … Thus, any reduction in energy consumption from grinding could significantly lower feed cost.“
particie size
fat
DDGS
feed rate
conditioning temp
retention time
die L:D
5

Table 01: Geometric mean diameters (GMD) and geometric standard deviations (GSD) obtained with different mill type (hammer mill (HM) or roller mill (RM)) and different grinding intensity (fine (F), medium (M), coarse (C) and very coarse (VC))
GRINDING TREATMENT GMD / μm GSD / μm
HM-F 671 2.66
HM-M 1144 2.82
RM-M 1119 2.17
HM-C 1581 2.69
RM-C 1542 2.27
RM-VC 2108 2.09
FIGURE 04Comparison of particle size distributions for different grinding treatments (different mill type (hammer mill (HM) or roller mill (RM)) and different grinding intensity (fine (F), medium (M), coarse (C) and very coarse (VC)).
6 AMINOTec® | EDITION 1 | NOVEMBER 2018

Mill type and grinding intensity
2.00
1.50
1.00
0.50
0.00HM-F HM-M/RM-M HM-C/RM-C
kWh/t
RM-VCSpec
ific e
nerg
y co
nsum
ptio
n of
mill
a
bc c
dd
FIGURE 05Influence of mill type (hammer mill (HM) or roller mill (RM)) and grinding intensity (fine (F), medium (M), coarse (C) and very coarse (VC)) on specific energy consump-tion of mill and on pellet durability index. Values with different letters are signifi-cantly different (p <0.05).
Authors conclude that high energy savings are possible by coarser grinding (figure 5). Energy consumption and mill throughput increase over-proportionally with increasing sieve opening (and GMD) on a hammer mill. With roller mills, however, further energy savings are possible with comparative GMD. Furthermore, roller mills produce more
uniform particle size distributions with lower GSD (geometric standard devia-tion), and corn ground on the roller mill clearly showed better pellet durability under comparative pelleting conditions.
This research seems to suggest a way forward for those committed to saving energy in the grinding process. Specifi-
cally, it involves improving the structure of the mash by aiming for coarser particle size distributions, but without affect-ing pellet quality. Moreover, this way forward would reduce production costs and may also have positive effects on live production as further detailed below.
Mill type and grinding intensity
HM-F HM-M/RM-M HM-C/RM-C
Pellet durability index [%]
RM-VC
89.83±0.65ª
85.69±0.27b
91.72±0.47ad
90.68±0.85ad
91.90±0.19d
79.25±1.27c
7

WHOLE GRAIN FEEDINGIn 2014 Singh et. al. published a com-prehensive review paper on whole grain feeding. Here they state that “In broilers, whole wheat feeding is common com-mercial practice in Europe (particularly Scandinavia, United Kingdom and the Netherlands), Australasia and Canada under a variety of forms. In some parts of the world, whole wheat feeding is also used as part of a strategy for broiler breeders and table egg layers.” The main driver of this development is the potential of reducing feed cost by elimi-nating the grinding stage. Furthermore, the authors quote Gabriel et al., 2008: “this also meets consumer demands for a natural feeding system and improved animal welfare”.
There are several strategies used to introduce whole grain into the feeding system, which depend on the existing
infrastructure at feed mills and farms, as well as the availability and cost of raw materials (figure 6).
Most research on whole grain feeding focuses on whole wheat. According to a review by Addollahi (2018), only three studies were conducted “evaluat-ing the effects of maize inclusion into pelleted broiler diets either in the form of cracked (Dozier III et al., 2006; Clark et al., 2009) or whole grain (Singh et al., 2014d)”. It is important to note that whole or cracked grains will replace only part of the grain of the diet. The rest of the diet will be a concentrate to provide amino acids, minerals, vitamins and trace elements as needed. It is also important to consider that the propor-tion of whole, or cracked grain in the diet, needs to be adapted to the age of the birds.
In the feed mill whole grain (namely wheat), or cracked maize, could be applied at the pre-pelleting or post-pelleting stages. In the case of post-pelleting, it usually involves mixing with crumbled pellets to ensure good handling properties and mix stability. Adding whole grain pre-pelleting might be a good compromise for feed millers who wish to benefit from reduced feed production costs, while maintaining the advantages of pelleted feed. These include, for example, advantages related to handling and distribution, utilizing existing equipment and infrastructure and well-proven processes. When using cracked corn, it may be necessary to assess detrimental effects on pellet qual-ity and possible negative impacts on feed intake of broilers versus energy savings.
FIGURE 06Different methods for feeding of whole grain in poultry
Whole Grain feeding
Mixed feeding Sequential feedingFree choice feeding
PelletMash
Pre pelleting inclusion of whole grain
Post pelleting inclusion of whole grain
8 AMINOTec® | EDITION 1 | NOVEMBER 2018

In terms of farming, three feeding strate-gies have been implemented with each requiring different infrastructure and management processes in live production. With sequential feeding, commercial feed concentrate and whole grain are handled on the same feeding system alternately, or in sequence, one after the other. With free choice feeding, commercial feed concentrate and whole grain are offered in parallel on separate feeding lines. With mixed feeding, whole grain is add-ed proportionally into the feeding line, or is topped up onto the silo load while the silo is being replenished. Again, nutri-tional aspects of such strategies will be discussed at a later stage.
In any case, when considering farm mix-ing and feed production, it is important
for the feed mill, as well as the farmer, to manage interfaces and adapt diets. Here this can involve taking into account the nutritional requirements based on the feeding strategy, namely the pro-portion and nutritional value of grains that may be added in farms. The FAO has published a guideline, laying down requirements for on-farm feeding. Figure 7 depicts necessary planning and produc-tion processes that must be followed to ensure feed safety and quality. Imple-mentation and daily maintenance of such processes certainly comes at a cost; and farmers will evaluate such costs and bal-ance them against the potential savings they may have when adding whole grain in farms. This will most probably only pay off in the case that they use home grown grains.
Mixing
Return to supplier
Fall
Re-processing if possible
Quality Control
Quality Control
Production Plan Specificationfor material
Purchase of the materials
Receipt & Inspection of material
Qualified personnel could
perform these tasks
Pass
Storage
Feed animals
Materials for processing
Formulation
Weighing
Check list
Labeling & packing
FIGURE 07Source: Avitech Animal Health Pvt. Ltd, adapted
9

Effect of particle size and feed form on growth performanceThe importance of particle size in poul-try diets has been recognized because of its various benefits in terms of giz-zard development and improvement in growth performance (Abdollahi et al., 2018). Various studies over the last few decades have demonstrated that particle size has a positive impact on the feed intake of broilers fed mash diets. Table 2 shows that feed intake in broil-ers fed mash diets can be increased by also increasing particle size, and the table also shows that effect varies with the age of birds and type of grain. Atta-wong et al. (2014) recommends that corn particle size of around 805 micron is sufficient for younger birds (<28 days). However, the older the birds get, a larger corn particle size is most likely to be required. Feed intake of crumbled or pelleted diets, for example, was not affected by particle size of maize or wheat (as shown in Table 3). Weight gain and feed efficiency improved with increases in particle size of grains in either in mash or pelted diets, but here
the results are contradictory (Tables 2 and 3). Auttawong et al. (2013) tested two dietary levels of coarse corn (0 or 35 %) on broiler performance and noted an improvement in levels of feed effi-ciency with coarse corn (1080 microns) with ad libitum feeding over restricted feeding.
Similarly, Xu et al. (2015) observed improved zootechnical parameters and digestive functions of broiler birds when crumble-pelleted diets con-tained 50 % coarse corn. The authors reported improvement in body weight (130 g) and feed conversion ratio (12 points) in broilers aged 42 days and over. This correlates well with the increased gizzard weight (2.75 mg/g body weight), increased digesta reten-tion time (0.78 h), improved apparent ileal digestibility of energy (8.2 %) and also improved apparent ileal digestibil-ity of nitrogen (12.4%) in broilers fed diets with 50% coarse corn compared to those fed without any coarse corn.
PARTICLE SIZE HAS A POSITIVE IMPACT ON THE FEED INTAKE OF BROILERS FED MASH DIETS.
PICTURE 02Feed structure from mash to pellets impacts production cost , handling properties and KPIs in live production
10 AMINOTec® | EDITION 1 | NOVEMBER 2018
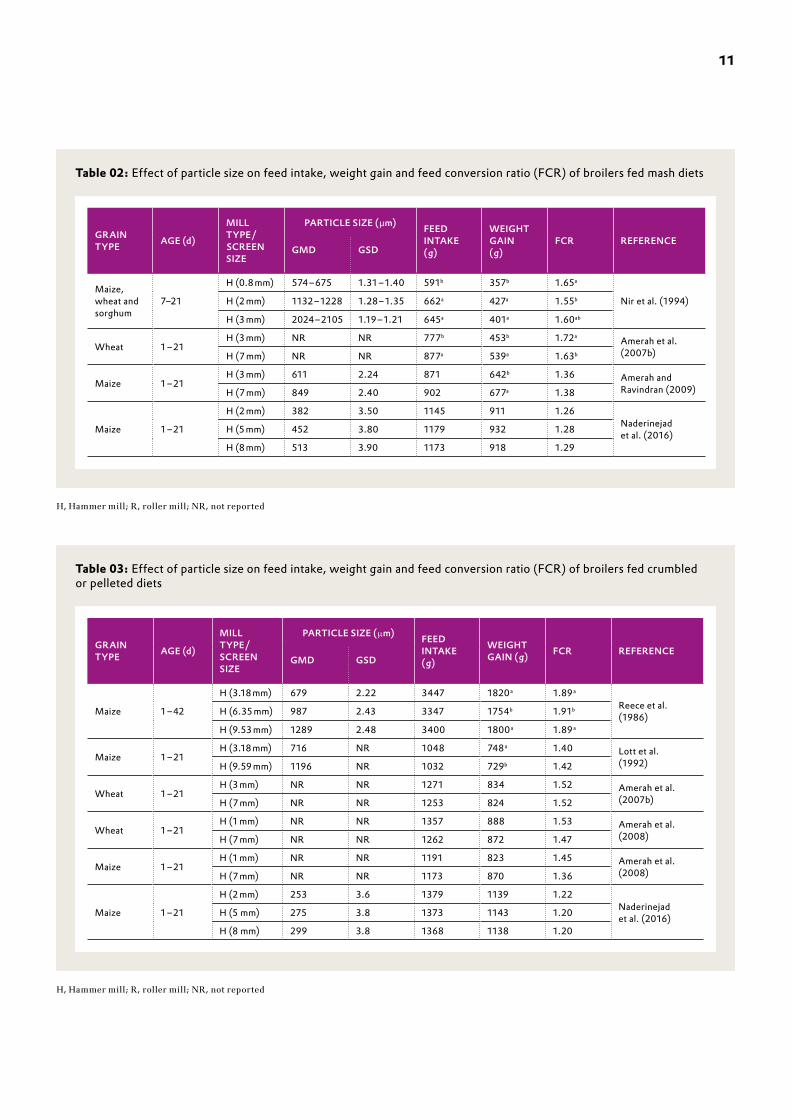
Table 02: Effect of particle size on feed intake, weight gain and feed conversion ratio (FCR) of broilers fed mash diets
GRAIN TYPE AGE (d)
MILL TYPE / SCREEN SIZE
PARTICLE SIZE (µm) FEED INTAKE (g)
WEIGHT GAIN (g)
FCR REFERENCEGMD GSD
Maize, wheat and sorghum
7–21
H (0.8 mm) 574 – 675 1.31 – 1.40 591b 357b 1.65a
Nir et al. (1994)H (2 mm) 1132 – 1228 1.28 – 1.35 662a 427a 1.55b
H (3 mm) 2024 – 2105 1.19 – 1.21 645a 401a 1.60ab
Wheat 1 – 21H (3 mm) NR NR 777b 453b 1.72a Amerah et al.
(2007b)H (7 mm) NR NR 877a 539a 1.63b
Maize 1 – 21H (3 mm) 611 2.24 871 642b 1.36 Amerah and
Ravindran (2009)H (7 mm) 849 2.40 902 677a 1.38
Maize 1 – 21
H (2 mm) 382 3.50 1145 911 1.26Naderinejad et al. (2016)H (5 mm) 452 3.80 1179 932 1.28
H (8 mm) 513 3.90 1173 918 1.29
H, Hammer mill; R, roller mill; NR, not reported
Table 03: Effect of particle size on feed intake, weight gain and feed conversion ratio (FCR) of broilers fed crumbled or pelleted diets
GRAIN TYPE AGE (d)
MILL TYPE / SCREEN SIZE
PARTICLE SIZE (µm) FEED INTAKE (g)
WEIGHT GAIN (g) FCR REFERENCE
GMD GSD
Maize 1 – 42
H (3.18 mm) 679 2.22 3447 1820 a 1.89 a
Reece et al. (1986)H (6.35 mm) 987 2.43 3347 1754b 1.91b
H (9.53 mm) 1289 2.48 3400 1800 a 1.89 a
Maize 1 – 21H (3.18 mm) 716 NR 1048 748 a 1.40 Lott et al.
(1992)H (9.59 mm) 1196 NR 1032 729b 1.42
Wheat 1 – 21H (3 mm) NR NR 1271 834 1.52 Amerah et al.
(2007b)H (7 mm) NR NR 1253 824 1.52
Wheat 1 – 21H (1 mm) NR NR 1357 888 1.53 Amerah et al.
(2008)H (7 mm) NR NR 1262 872 1.47
Maize 1 – 21H (1 mm) NR NR 1191 823 1.45 Amerah et al.
(2008)H (7 mm) NR NR 1173 870 1.36
Maize 1 – 21
H (2 mm) 253 3.6 1379 1139 1.22Naderinejad et al. (2016)H (5 mm) 275 3.8 1373 1143 1.20
H (8 mm) 299 3.8 1368 1138 1.20
H, Hammer mill; R, roller mill; NR, not reported
11

FIGURE 08This shows the effect of feed form (mash and crumble-pellet) and feed particle size (fine, medium and coarse) on average feed intake, average daily gain and feed conversion ratio of broilers (aged 1-40 days). Fine, medium and coarse particle sizes were achieved by grinding the macro ingredients (wheat, corn and soybean meal) in the hammer mill to pass through 2, 5 and 8 mm sieves, respectively. (Mingbin et al., 2015)
Average daily gain (g/d)
55
57
59
61
65
63
Fine Medium
Feed particle size
Coarse
a
c
a
b
a
b
Crumble-pellet Mash
Average daily feed intake (g/d)
90
95
100
105
110
Fine Medium
Feed particle size
Coarse
a
c
a
b
a
b
Crumble-pellet Mash
Feed conversation ratio
1,65
1,66
1,67
1,68
1,69
Fine Medium
Feed particle size
Coarse
Crumble-pellet Mash
Various examinations have also been made into the effect of particle size reduction of commonly used by-prod-ucts in poultry feed, such as distillers dried grains with solubles (DDGS) and soybean meal (SBM). Pacheco et al. (2013, 2014) conducted experiments to evaluate the effect of particle size of DDGS and SBM on live performance of broilers.
In the first experiment, two particle sizes (700 and 350 microns) of DDGS were tested. Results showed that birds fed pelleted diets containing 350
micron DDGS had both greater body weight and higher performance levels. Pacheco et al. (2014) also evaluated the effect of particle size of SBM (410 or 1025 microns) and DDGS (480 or 745 microns) on pellet quality and live performance. Here the inclusion of fine SBM (410 microns) was shown to improve pellet quality, whereas coarse SBM (1025 microns) had positive effect on live performance.
For DDGS, however, fine particle size decreased pellet durability whereas overall pellet durability index values
were similar. Fine DDGS (480 microns) also increased feed intake and body weight without any impact on feed efficiency. Here coarse DDGS (745 microns) in broiler diet, however, increased gizzard weight. Therefore, it can be concluded that coarse particle size of DDGS and SBM in broiler diets results in better growth performance. The physical form of feed also has significant impact on broilers’ growth performance (Dozier et al. 2010). Many studies, for example, have reported improvement in broiler performance when fed pellet feed
12 AMINOTec® | EDITION 1 | NOVEMBER 2018

compared to mash feed (Amerah et al., 2008; Chewning et al., 2012; Mingbin et al., 2015). Use of crumble or pel-let form of feed was found to reduce the feed wastage and prevents particle selection.
The pelleting process also improves palatability and increases nutrient digest-ibility (Mingbin et al., 2015). Zang et al. (2009), for example, also reported improvement in feed intake, weight gain and feed efficiency when broilers were fed pelleted diets. Mingbin et al. (2015) conducted a study to evaluate the effects of feed form (mash and crumble-pellet) and feed particle size (fine, medium and coarse) on performance and digestive tract development of broilers. Results showed that feed form had a greater effect than feed particle size on broiler performance and digestive tract devel-opment. Here the study also concluded that the effect of feed particle size was dependent on feed form.
Figure 8 shows on effect of feed form and feed particle size on growth perfor-mance of broilers. Impact of feed particle size is more critical in birds fed mash diets. This observation was in line with Svihus et al. (2004) wherein the authors concluded that the pelleting of mash diet could negate the effect of feed particle size.
It should be recognized that it is not only particle size which is important, but also that the uniformity of particle size in feed is of great significance when striving to fully exploit the genetic potential of fast-growing broilers. Chickens are known to prefer for large particle sized feed. However, due to current feeding prac-tices whereby crumble/pelleted diets are used, exploring the uniformity of grain
particle size on broiler performance gained little attention among the researchers (Amerah et al., 2007a).
Published studies indicate that broiler performance increases with an increase in particle size of grains. The effect of the particle size of grains on a broiler’s feed intake, is far clearer for mash diets than for pelleted diets. As a result, coarse mash feeding has been practiced for a long time in many countries. Mash diets have been replaced with crumble-pelleted diets in current feeding practices of broilers. Broilers fed pelleted diets show higher feed intake and weight gain levels compared to those fed mash diets at same particle size (Figure 8).
Pelleting has been shown to improve feed intake, weight gain and feed efficiency (Zang et al., 2009). Coarse particle size of grains or by-products, either in mash or pelleted diets, may improve weight gain and feed effi-ciency. Similarly, the physical form of feed also has a significant effect on a broiler’s growth performance.
PICTURE 03Pelleted feed is prevalant in broiler production
PHYSICAL FORM OF FEED HAS SIGNIFICANT IMPACT ON GROWTH PERFORMANCE OF BROILERS
13

Table 04: Effect of feed particle size on the relative weight (g/kg body weight) of gastrointestinal tract (GIT) segments in broilers (Adapted from Zaefarian et al., 2016)
GIT SEGMENTS GRAIN TYPE FEED PARTICLES REFERENCE
FINE MEDIUM COARSE
Gizzard Wheat 14.90 16.2 17.50 Svihus et al. (2004)
Crop
Wheat
– 3.20 3.00
Amerah et al. (2007)
Proventriculus – 5.52 5.30
Gizzard – 16.4 15.70
Duodenum – 6.30 6.00
Jejunum – 13.20 12.20
Ileum – 9.10 8.70
Caeca – 1.90 1.90
Crop
Wheat
3.04 – 3.05
Amerah et al. (2008)
Proventriculus 3.84 – 3.95
Gizzard 9.03 – 10.00
Duodenum 5.12 – 5.20
Jejunum 11.6 – 11.70
Ileum 7.90 – 7.60
Caeca 1.48 – 1.63
Crop
Maize
2.90 – 3.30
Amerah et al. (2008)
Proventriculus 4.62 – 4.28
Gizzard 9.40 – 12.6
Duodenum 5.25 – 5.24
Jejunum 10.80 – 10.50
Ileum 7.50 – 6.90
Caeca 1.59 – 1.42
Proventriculus
Maize
– 4.47 4.56
Amerah and Ravin-dran (2009)
Gizzard – 19.80 20.70
Small intestine – 19.02 19.09
Caeca – 1.52 1.50
Proventriculus
Maize
2.38 – 2.27
Xu et al. (2015)Gizzard 8.11 – 9.21
Jejunum 12.56 – 11.27
Ileum 10.88 – 10.41
Pancreas
Maize
2.73 2.90 2.82
Naderinejad et al. (2016)
Proventriculus 3.91 4.13 3.87
Gizzard 12.90 14.90 15.00
Small intestine 22.8 23.10 22.10
Caeca 3.22 3.35 3.20
14 AMINOTec® | EDITION 1 | NOVEMBER 2018

Effect of particle size on gastrointestinal tract development and gut health Feed particle size influences the devel-opment of the gastrointestinal tract to a greater extent when the broilers are fed mash diets, as opposed to pelleted diets. Reducing the particle size property dur-ing the pelleting process may result in suboptimal gizzard development and changes in the morphology and microbi-ota profile of the intestinal tract (Zaefar-ian et al., 2016). A large particle size helps the gizzard to function properly, and is also beneficial to gut health devel-opment in broilers (Svihus et al., 2004; Choct, 2009). Naderinejad et al. (2016) also found that coarse grinding of maize in pelleted diets had a positive effect on gizzard development and functionality, which is in turn beneficial for nutrient utilization and growth performance.
The gizzard is extremely good at grind-ing the feed to a consistent particle
size (Hetland et al., 2004). A well-developed gizzard also improves grind-ing activity and gut motility (Ferket, 2000). It increases cholecystokinin release, which stimulates the secretion of pancreatic enzymes and gastro-duodenal reflexes (Duke, 1982; Svihus et al., 2004). Coarse particles reduce the digesta rate in gizzard and lower the pH of gizzard (Nir et al., 1994). The low pH of gizzard may increase pepsin activity (Gabriel et al., 2003) and pro-tein efficiency. It also reduces the risk of coccidiosis (Cumming, 1994) and feed-borne pathogens (Engberg et al., 2002).
The effect of feed particle size on seg-ments of broiler gastrointestinal tract is presented in Table 4. Feed particle size also affects the intestinal tract segments other than the gizzard, but the results are contradictory. Nir et al. (1995)
reported no difference in the weight of intestinal segments with an increase in maize particle size from 0.6 to 2.17 mm. Xu et al. (2015) also reported non-significant differences for intestinal length, and the ratio of intestinal length to body weight when 50% coarse corn is included in pelleted diets. However, Amerah et al. (2007a) reported a reduc-tion in the relative weight of small intes-tinal segments with an increase in wheat particle size.
Limited data has been reported on the effect of feed particle size on intestinal morphology and microbiota profile. Amerah et al. (2007a) reported a non-significant change in villus height, crypt depth, and epithelial thickness in the duodenum with an increase in maize particle size. However, Liu et al. (2006) and Xu et al. (2015) reported a
Table 05: Effect of corn particle size on cecal microbial populations in 21-d-old chicks in experiment 1 as determined by quantitative PCR1 (Adapted from Jacobs et al., 2010)
CORN PARTICLE SIZE LOG10 CFU/g OF DM
BIFIDOBACTERIA LACTOBACILLI ESCHERICHIA COLI
557 µm 8.25a 11.00a 10.32
858 µm 7.69ab 11.43ab 10.99
1210 µm 7.44ab 11.37ab 10.84
1387 µm 7.23b 11.57b 10.55
Pooled SEM 0.34 0.16 0.34
a, b Means within a column with no common superscript, and which thus differs significantly (P < 0.05). 1 Means represents 4 replicates of 6 chicks each per treatment.
15

FIGURE 10Effect of pre- and post-pellet inclusion levels of whole wheat (WW) on growth performance from 7 to 28 days post-hatch. (Truong et al., 2017)
FIGURE 09Effect of pre- and post-pellet inclusion levels of whole wheat (WW) on gizzard weight, and pH of gizzard digesta. (Truong et al., 2017)
Relative gizzard weight (g/kg)
0
5
10
20
25
15
WW 4.5 %WW 4.5 % WW 18.0 %WW 9.0 % WW 4.5 % WW 18.0 %WW 9.0 %Pre-pelletControl Post-pellet
a ab ab bc c de
Gizzard digesta (pH)
0
5
10
20
25
15
WW 4.5 %WW 4.5 % WW 18.0 %WW 9.0 % WW 4.5 % WW 18.0 %WW 9.0 %Pre-pelletControl Post-pellet
c bc cbc
ab ab a
b b b b b b a
c bc bc ab abc ab a
Relative gizzard weight (g/kg)
0
1000
2000
3000
1,4
1,45
1,5
1,55
WW 4.5 % WW 18.0 %WW 9.0 % WW 4.5 % WW 18.0 %WW 9.0 %Pre-pelletControl Post-pellet
Feed intake (g) weight gain (g)
a
b b
bb
bb
Feed conversation ratio
16 AMINOTec® | EDITION 1 | NOVEMBER 2018

positive effect of coarse maize on intesti-nal morphology. The inclusion of coarse maize reduced the number of mast cells in the duodenum, jejunum, and ileum compared with finely ground maize (Liu et al., 2006).
Mast cells translate stress signals to release a wide range of neurotransmit-ters and pro-inflammatory cytokines, which can have dramatic effects on the gastrointestinal physiology of broilers (Vicuna, 2015). Reduction in mast cells in the small intestine is also beneficial. An increase in mast cell numbers reflects Eimeria infection in broilers (Morris et al., 2004). Furthermore, particle size of ingredients also affects the intestinal microbiota profile. Jacobs et al. (2010), for example, reported changes in cecal microbiota profiles when using different corn particle sizes.
The effects of corn particle size on cecal microbial populations are presented in Table 5. The lacto-bacilli population was significantly increased (P < 0.05) when the larg-est corn particle size of 1,387 µm was included in the diet. Increase in lactobacilli spp. concentration is considered to be beneficial because it can prevent colonization of patho-gens such as E. coli (Engberg et al., 2002). The bifidobacteria popula-tion was significantly decreased with increasing corn particle size from 557 µm to 1,387 µm. However, E. coli populations was not affected by corn particle size. Singh et al. (2014) also found that the counts of Lactobacillus spp. and Bifidobacteria spp. increased and those of Clostrid-ium, Campylobacter and Bacteroides species were decreased with increas-
AN INCREASE IN MAST CELL NUM-BERS REFLECTS EIMERIA INFEC-TION IN BROILERS
FIGURE 11Gastro intestinal tract of chicken features crop and gizzard to grind and digest coarse particles
Intestine
Crop
Gizzard
17

ing inclusion levels of coarse maize (0 to 600 g/kg). Coarse mash diets can also increase the Lactobacilli populations in the ceca and rectum (Engberg et al., 2002).
It can be concluded that large particle size not only influence the development of gastro intestinal tract, but also change the cecal microbial populations. Large
particle sizes also increase the Lactobacilli counts and reduce the pathogenic bacteria in a broiler’s caecum.
Effect of whole grain feeding on growth performance and gut healthThe primary aims of feeding whole grains to broilers is to reduce feed cost and to improve digestive functions (Singh et al. 2014). It also has a positive impact on gut health by encouraging the colonization of beneficial bacteria, and reduces incidences of coccidio-sis (Cumming, 1989). Engberg et al. (2004) reported that whole wheat feeding can reduce intestinal numbers of Clostridium perfringens, which is impor-tant for prevention of necrotic enteritis.
Another finding is that whole grain feeding practices meet consumer demands for a natural feeding system, and are also good for animal welfare (Gabriel et al., 2008). Whole wheat feeding as part of a free choice feeding system resulted in increases in weight and length of the segments of the small intestine (Singh et al., 2015). Fernandes et al. (2013) also reported that the weight of small intestine increases in case of broiler diets containing 50 or 100% of whole sorghum grain. Cecum length was also significantly increased when birds were fed diets containing whole sorghum grain.
The intestine is the biggest immune organ inside a bird’s body which con-tributes further to better health and
immune response. It has been reported that a whole grain feeding approach helps in preventing the enlargement of proventriculus and atrophy of the gizzard which are common problems with pelleted diets (Singh et al. 2014). Whole wheat administered via free choice feeding methods increase the relative gizzard weight, irrespective of whether mash or pellet forms of feed are used (Singh et al., 2014).
Another claim, is that the gizzard is a pace maker of gut motility and even reverses peristalsis in broilers (Ferket, 2000), whilst whole grain feeding may also influence starch digestive dynamics, and provide more gradually or slowly digestible starch. This effect on starch digestion may lead to improvements in energy utilization and feed efficiency (Liu et al. 2015). Wu et al. (2004) reported that, pre-pellet, 20% whole grain addition improved energy utiliza-tion. Published studies on whole grain feeding, however, reported contradic-tory results. Many studies, for example, reported beneficial effects of whole grain feeding on broiler performance, whereas others reported no advantage or even poorer performance (Singh et al. 2014).
Whole grain can be incorporated into
poultry feed either pre or post steam pelleting, and here offered as either intact pellets or as a whole grain pel-leted concentrate blend (Moss et al., 2018). The practice of feeding whole grains to broilers along with balanced concentrate is currently becoming more accepted in certain regions, including Europe, Canada, Australia and New Zealand. Chicken meat production is an extensively integrated process in Austra-lia and New Zealand. In New Zealand, whole wheat is usually incorporated into broiler diet prior to steam pelleting, whereas in Australia, whole wheat is added post pelleting.
The effect of pre- and post-pellet inclu-sions of whole wheat in broiler diet on gizzard weight, gizzard digesta pH and growth performance is presented in Fig-ures 9 and 10 (Truong et al. 2017). The post-pellet inclusion of whole wheat in broiler diets had a greater effect than pre-pellet inclusions. Compared to ground grain control diet, post-pellet whole wheat inclusions increased rela-tive gizzard weight, reduced gizzard digesta pH and also reduced incidences of dilated proventriculus. Feed efficiency was also significantly improved in all diets containing whole wheat included (pre- and post-pellet).
18 AMINOTec® | EDITION 1 | NOVEMBER 2018

ConclusionsThe particle size of grains and by-products used in broiler feed effect both pellet quality and growth performance. Particle size also has a positive impact on the development of the gastrointestinal tract, mainly the development and functionality of the gizzard. Large particles help broilers’ gizzards to function well, and also help their overall gut health development.
For mash diets, however, the impact of particle size is more critical. The use of large particle size of grains increases the Lactobacilli count, and also reduces the population of pathogenic bacteria. Whole grain feeding improves digestive functions and encourages the colonization of beneficial bac-terial. It reduces pathogenic challenges, including, mainly, the incidence of coccidiosis. The post-pellet inclusion of whole grain showed greater impacts
on broiler performance compared to pre-pellet inclusions through increased relative gizzard weight, low gizzard digesta pH, and reduced incidences of dilated proventriculus.
Energy costs involved in producing pelleted feed may be reduced by aiming for coarser particle size distributions and employing adapted grinding regimes. This would include the use of roller mills, while also making sure to maintain pellet quality and broiler performance. Further opportunities may also be discovered when looking into whole grain breeder feeding regimes which may offer benefi-cial effects on feed cost, on performance, and also on overall gut health aspects. In all of these cases, regional and infrastructure-related factors will play a key role.
19

vessel/wagondischarge
lorrydischarge
vessel/wagondischarge
… coolinggranulating
premixadditive
conditioning and pelletizing
intake and storage
1mixing
4 5finished
products load
6dosing
2grinding
3
ALL MANAGERS RESPONSIBLE FOR OPERATIONS WHICH DEAL WITH COMMODITIES ARE FAMILIAR WITH THE TEDIOUS TASK OF KEEPING INVENTORIES AND, EVEN WORSE, OF RECONCILING INVENTORY DISCREPANCIES.
HOW TO MANAGE AND REDUCE SHRINK IN FEED PRODUCTIONAuthor: Detlef Bunzel ([email protected]), VP Applied Feed Technology, Evonik Nutrition & Care GmbH, Hanau, Germany
SIMPLIFIED FEED MILL PROCESS DIAGRAM
FIGURE 01
20 AMINOTec® | EDITION 1 | NOVEMBER 2018

vessel/wagondischarge
lorrydischarge
vessel/wagondischarge
… coolinggranulating
premixadditive
conditioning and pelletizing
intake and storage
1mixing
4 5finished
products load
6dosing
2grinding
3
KEY INFORMATIONWhenever inventories are lower than expected, we talk about shrink. Within the feed industry, shrink of up to 1 % of the feed mill output is regarded as being in the standard or expected range (Fahrenholz, 2017). To appreciate the
concept of shrink from an accounting perspective, it helps to translate this into dollars. So, for an annual feed produc-tion of 200 000 mt at a price of 250 $/mt, 1 % of shrink therefore accounts for an annual loss of 500 000 $.
In the following paragraphs we will examine the feed production process step by step, focusing on aspects that are most prone to have a serious impact on inventories.
INTAKE & STORAGEProducts arrive at the feed mill in vari-ous forms of delivery, depending on a range of factors such as the local infra-structure, product origin and volumes handled. While in the Americas, and also in some Asian countries, standard feed formulation is based on corn and soy as macro ingredients, in Europe, however, a much higher number of main ingredients is common. In the US main ingredients, which are locally produced, typically arrive in railcars or trucks, whilst in northern European countries, large sized feed mills are often located at rivers or canals, and receive their bulk ingredients by ship. On the other hand, in some regions in Asia and Africa, often even main ingredients are manually handled in bags due to poor local trans-port infrastructure. Minor ingredients and micro ingredients are also typically handled in bags, big-bags or drums.
Methods used to keeping stock of ingre-dients delivered in full bulk, or as pack-aged goods, vary considerably. While bulk deliveries are generally recorded by weight, for example, packaged goods are usually recorded by the amount of package units.
Depending on who delivers the full bulk, the load may come with shipping documents and an invoice based on the
weighing ticket of the supplier, or it may come directly from the farm without a weighing ticket.
In the first case, the feed mill will check the weight of the load, then compare it with the net weight according to the bill of lading. With full bulk loads, two weighing tickets are normally necessary to secure the net weight at the point of loading, i. e. the weight of the full truck load after filling, minus the weight of the empty truck entering the bulk fill-ing station.
A related process is carried out at the feed mill when discharging, i. e. a full truck entering the feed mill minus empty truck leaving the feed mill. Truck scales with a weighing capacity of 60 mt typi-cally have a resolution of 10 or 20 kg, i. e. the smallest weight change that can be detected on the scale is 10 or 20 kg. This depends on the regulatory standards that the weights and measures authority apply, which differs in the US and in Europe (cp. Table 1 and 2, Mettler Toledo, 2013). According to weights and measures regulations, the weighing accuracy of a truck scale must be within ± 1.5 x resolution during veri-fication, and must stay within ± 3 x reso-lution within the maintenance period, i. e. in between verification intervals.
21

Based on all of this, weight differences between the bulk weight on the bill of lading, and feed mill weighing ticket of 2 x 3 x 20 kg = 120 kg, are still within the tolerance of scale accuracy within the maintenance interval. This is, of course, assuming that one scale has the maximum weight plus deviation, while the second scale is to the maximum weight minus deviation. With a full truck load of 20 to 25 mt, this differ-ence is in the range of 0.5 % of the payload. The same range of accuracy of ± 0.5 % is typical for class 1 bulk hopper scales.
Therefore, it is important to devise a system which can be used on a daily basis to account for such weight differ-ences for incoming bulk ingredients. It is good practice to keep track of dif-ferences for each supplier separately. Differences should be random and balanced out over time. In case a pat-tern of regular shortages emerges, claims should be filed with suppliers on a monthly or quarterly basis – depending on the number of bulk loads – to compensate for shortages.
Depending on the infrastructure of bulk storage systems, inventories of bulk products can only be cal-culated by measuring or estimating volumes of bulk and multiplying the amount by the bulk density. This process, however, is obviously prone to human error.
Depending on the logistics of the plant, inventory differences may also be due to accounting differ-ences of full bulk loads in railcars or trucks. Specifically, these may apply to loads which have arrived on-site, but whose full bulk has not been discharged and has therefore not been counted during stock tak-ing. This is therefore irrespective of any shipping documents which may have been processed and therefore already show due inventory in the accounting system. Such differences relating to full truck loads or rail-cars typically are therefore usually balanced in the following month, when the stock has entered the system physically, i. e. when bulk has been transferred from railcars or trucks into the storage system.
Table 02: There are various accuracy specificationlevels defined by OIML: C3, C4, and C6, and these differences can be observed in the range of truck scalesavailable. Most truck scale applications are C3 (used in the chart above). A very small percentage of truckscales are C6, which provides a stricter degree of accuracy tolerance.
SCALE CAPAC-ITY (kg.)
TRUCK WEIGHT (kg.)
ALLOWABLE ERROR (kg.)
60 000 10 000 – 40 000 40
40 000 – 60 000 60
80 000(multi-range)
10 000 – 40 000 40
40 000 – 60 000 60
60 000 – 80 000 100
Table 01: NIST / NTEP Accuracy ToleranceHandbook 44 outlines a step-based tolerance thatincreases with every additional 5 % of the scale’scapacity used.
SCALE CAPAC-ITY (lbs.)
TRUCK WEIGHT (lbs.)
ALLOWABLE ERROR (lbs.)
200 000 40 000 – 50 000 100
50 000 – 60 000 120
60 000 – 70 000 140
70 000 – 80 000 160
IT IS GOOD PRACTICE TO KEEP TRACK OF DIFFERENCES FOR EACH SUPPLIER SEPARATELY.
22 AMINOTec® | EDITION 1 | NOVEMBER 2018

With packaged goods, stock is calcu-lated based on counting package units. Despite this process, stock differences may still occur based on counting errors. Even with packaged goods, it is good practice to double-check the accuracy of the nominal weight of package units on a randomized basis. Again, depending on the nominal weight, filling tolerances of ± 1 % for an individual package unit are possible. E. g. with 25 kg bags the actual net weight may vary ± 250 g. On average bags of one delivery should contain the nominal weight of 25 kg. Thus, a full pallet of 40 x 25 kg bags should add up to 1 000 kg.
With packaged goods, damaged package units may result in product spills and losses. Such losses must also be accounted for in stock taking and claimed for from the suppliers, assuming the damage was obvious upon delivery, and before unloading.
Depending on the delivery form (bulk or packaged) and the origin of ingredi-ents, incoming raw materials are cleaned during intake, e. g. stones and other residues are removed. Here feed mill managers certainly have often devel-
oped their own methods for calculat-ing acceptable losses for each product at this stage. A major Brazilian feed miller, for example, may accept losses of 0.1 … 0.5 % for maize and classify this as ‘normal’. Hicks (1992) describes handling losses as being “due to loss of volatile compounds such as oils, mechanical losses from broken kernels and foreign material, and possibly also due to respiration of the seed itself. The 3-year on-farm average (of handling losses) was 0.82 % compared to 0.88 % for the commercial facilities” accord-ing to research published by Iowa State University.
According to Weber (1995) “grains are living beings and, as such, even biologically disrupted from the plant at the moment of their maturation, they breathe, release carbon dioxide (CO2), water (H2O) and heat.” This reaction causes a loss of grain mass and is affected by storage conditions, such as moisture and temperature of the grain mass.
Kongskilde describe this process in the technical publication ‘Grain Biology’, as follows: “Germinative grain breathes. Each kernel gets oxygen from the air
and burns food from its endosperm. This process gives off heat, water, and carbon dioxide. This process in grain is called respiration. In many countries, respira-tion during the storage period is causing a dry matter loss of 1 % or more.” Figure 2.1 and 2.2 show the loss in weight due to CO2 respiration of wheat and barley depending on grain moisture contents and on grain temperature at a moisture of 17 %.
Depending on ambient temperatures and relative humidity, i. e. depending on climatic conditions, grain will adapt and stabilize its moisture content to an equilibrium as shown in table 3 (Sadaka, FSA1074). At any given storage tem-perature, the equilibrium moisture of the grain will drop with the relative humid-ity of the ambient air and vice versa.
Making use of this phenomenon, in some parts of the world incoming raw materials are sun-dried in the yard upon delivery, before filling them into the storage bins. This is done to avoid product losses due to excessive moisture of the grains in storage bins, and to reduce energy costs for venting and drying during storage.
FIGURE 2.1 + 2.2Respiration increases with grain moisture content at a given temperature and with grain temperature at a given moisture content (Kongskilde)
mg CO₂ Produced/1000g dry matter/24 hours
100
00° 5° 10° 15° 20° 35°
Respiration depend on temperature
Wheat, 17% mc.
Grain temperature
50
25° 30°
mg CO₂ Produced/1000g dry matter/24 hours
1500
1000
012 13 14 15 16 25
Respiration of wheat and barely
Grain moisture (%)
500
17 18 19 20 21 22 23 24
23

Moisture content of grain must be adjusted to the range as shown in table 4, by using ventilation, heating or cool-ing systems to ensure a safe storage considering ambient temperature and humidity for long term storage.
By reducing the humidity of grain, the weight of the grain will decrease as a result of the water evaporating in the drying process. The amount of water loss or shrink can be seen in table 5: When reducing the humidity from 20 % to 12 % to a safe, warm climate at which to store grain (cp. table 4), 91 kg of water has evaporated, result-ing in a shrink of 9.1 % (Kongskilde).
To best manage the issue of shrink in grain storage, it is important to consider potential weight loss in grain mass through respiration, and through loss of moisture by drying. Furthermore, aeration procedures must be adapted to environmental conditions and control systems, must be implemented to avoid
unnecessary losses by germination, fungal growth or insect infestations (figure 3, Kongskilde).
Another effect that may occur with product intake and on-site transporta-tion into storage systems, relates to appararent shrink (or gain) by incor-rectly-positioned distribution systems, e. g. leaking outlet slides of trough chain conveyors or leaking turn-heads or two-way distributors (picture 1). Assuming product A is filled into bin 1, but the turn-head is incorrectly positioned in between bin 1 and bin 2, part of product A will end up in bin 2. This will be noted during stock taking as ‘shrink’ in bin 1, and ‘gain’ in bin 2.
Furthermore, it is obvious that any leaking gates, couplings or pipe ducts, will cause spillages and result in product losses. This is not only true for the intake area, but for all process steps in the feed mill.
Table 03: Corn Equilibrium Moisture Content
RELATIVE HUMIDITY (%)
Tem
pera
ture
(°F)
25 30 35 40 45 50 55 60 65 70 75 80 85 90
35 9.3 10.3 11.2 12.1 13.0 13.9 14.8 15.7 16.6 17.6 18.7 19.8 21.2 22.9
40 9.1 10.0 10.9 11.8 12.7 13.5 14.4 15.3 16.2 17.1 18.2 19.3 20.7 22.3
45 8.8 9.8 10.6 11.5 12.3 13.2 14.0 14.9 15.8 16.7 17.7 18.9 20.2 21.8
50 8.6 9.5 10.4 11.2 12.0 12.9 13.7 14.5 15.4 16.3 17.3 18.5 19.8 21.4
55 8.4 9.3 10.1 11.0 11.8 12.6 13.4 14.2 15.1 16.0 17.0 18.1 19.3 20.9
60 8.2 9.1 9.9 10.7 11.5 12.3 13.1 13.9 14.8 15.7 16.6 17.7 18.9 20.5
65 8.0 8.9 9.7 10.5 11.3 12.0 12.8 13.6 14.5 15.3 16.3 17.4 18.6 20.1
70 7.9 8.7 9.5 10.3 11.0 11.8 12.6 13.4 14.2 15.0 16.0 17.0 18.2 19.8
75 7.7 8.5 9.3 10.1 10.8 11.6 12.3 13.1 13.9 14.8 15.7 16.7 17.9 19.4
80 7.6 8.4 9.1 9.9 10.6 11.4 12.1 12.9 13.7 14.5 15.4 16.4 17.6 19.1
85 7.4 8.2 9.0 9.7 10.4 11.2 11.9 12.6 13.4 14.3 15.2 16.2 17.3 18.8
90 7.3 8.1 8.8 9.5 10.3 11.0 11.7 12.4 13.2 14.0 14.9 15.9 17.0 18.5
95 7.2 7.9 8.7 9.4 10.1 10.8 11.5 12.2 13.0 13.8 14.7 15.6 16.8 18.2
100 7.1 7.8 8.5 9.2 9.9 10.6 11.3 12.0 12.8 13.6 14.5 15.4 16.5 17.9
ANY LEAKING GATES, COUPLINGS OR PIPE DUCTS, WILL CAUSE SPILL-AGES AND RESULT IN PRODUCT LOSSES.
24 AMINOTec® | EDITION 1 | NOVEMBER 2018

Table 04: Safe moisture content for grains in long- and shortterm storage1
GRAIN TYPE LONG TERM (ONE YEAR)SHORT TERM (30 TO 60 DAYS)
WARM TEMPERATURES COOL TEMPERATURES
Corn 12 % 12 % 15 %
Sorghum 12 % 12 % 15 %
Rough Rice 12 % 12 % 14 %
Soybean 11 % 11 % 14 %
Wheat 12 % 12 % 14 %
Table 05: Weight in kg of water lost when one ton of damp grain is dried.
INITIAL MOISTURE CONTENT %
FINAL MOISTURE CONTENT %
19 18 17 16 15 14 13 12 11 10
30 136 146 157 167 176 186 195 205 213 222
29 125 134 145 155 165 174 184 193 202 211
28 111 122 133 143 153 163 172 182 191 200
27 99 110 120 131 141 151 161 170 180 189
26 86 98 108 119 129 140 149 159 169 178
25 74 85 96 107 118 128 138 148 157 167
24 62 73 84 95 106 116 126 136 146 156
23 49 61 72 83 94 105 115 125 135 145
22 37 49 60 71 82 93 103 114 124 133
21 25 37 48 60 71 81 92 102 112 122
20 12 24 36 48 59 70 80 91 101 111
19 12 24 36 47 58 69 80 90 100
18 12 24 35 47 57 68 79 89
17 12 24 35 46 57 67 78
16 12 23 35 45 56 67
15 12 23 34 45 56
PICTURE 01Turnhead and two-way distributor
1 http://www.ag.ndsu.edu/extension-aben/documents/ae905.pdf
25

FIGURE 03Values of grain temperature, relative humidity and moisture content for safe storage, insect and fungal heating, and fall in germination
PICTURE 02Grain storage system with elevator and trough chain conveyor distribution system
Temperature °C
SafeFall in germination
Lower limit for insect heating.
Lower limit for germination.
Lower limit for fungal heating.
Insect heatingFungal heating
m.c.0
10
0 % 10 % 15 % 20 % 25 %
20
30
40
A
A
B
C
B C
26 AMINOTec® | EDITION 1 | NOVEMBER 2018

DOSING, GRINDING & MIXINGWith dosing systems, be it dry bulk or liquid dosing, whenever metering (weighing or volumetric metering systems) comes into play, errors may occur that are related to metering accuracy, as described in detail for truck scales.
Any scale certified for legal-for-trade applications will be subject to regular inspection by weight and measures authorities, based on the respective regulations. In feed mills, this will usu-ally apply for truck scales or hopper scales in bulk loading systems, as well as bagging equipment. Other in-pro-cess metering systems are not subject to regular inspection and verification by authorities.
Depending on the metering / weigh-ing system, errors may range from 0. 1...1 % of the design capacity of the equipment. Therefore, it is a good practice to do a thorough mainte-nance and check weighing / metering accuracy of process scales and liquid meters, at least once a year. As pro-cess scales or metering systems are part of a more complex process stage, the system accuracy also depends on other factors that may be related to the process design, or the equipment maintenance.
PICTURE 03Examples of badly maintained platform scales of micro dosing systems
DEPENDING ON THE METERING/ WEIGHING SYSTEM, ERRORS MAY RANGE FROM 0.1...1 % OF THE DESIGN CAPACITY OF THE EQUIPMENT.
Picture 3 shows examples of several platform scales of AMINOSys® dosing systems that Evonik engineers discovered during annual service visits to feed mills. Accumulated product spills block scale movement, which in turn affects weighing accuracy. Spills may even attract rodents or birds who then attempt to build their nests inside the protected area of the platform scale. Rodents even managed to do severe damage to connecting cables to load cells by gnawing at them, and this caused downtime for troubleshooting and corrective maintenance.
27

Humidity difference grinding maizel (%)
–0,00 %
–0,00 %
–0,11 %
–0,05 %
–0,17 %
–0,08 %
–0,40 %
–0,42 %
–0,33 %
–0,64 %
0,08 %
–0,09 %
–0,14 %
–0,26 %
–0,22 %
–0,70 –0,60 –0,50 –0,40 –0,30 –0,20 –0,10 0,00 0,10 0,20
2015 2016 2017 Jan Feb Mar Apr May Jun Jul Aug Sep Oct Nov Dec
Humidity difference conditioning (%)
0,11
0,12
0,12
0,13
0,13
0,14
0,14
0,15
2015 2016 2017 Jan Feb Mar Apr May Jun Jul Aug Sep Oct Nov Dec
0,13 %12,66 %
13,80 %
12,80 %
12,92 %
13,80 %
13,34 %
13,68 %
13,66 %
13,58 %
12,16 %
12,78 %
13,25 %13,98 %
13,31 %
Humidity difference pelleting (%)
–0,01 %
–0,44 %
–0,24 %
–0,19 %
–0,50 %
–0,57 %
–0,56 %
0,12 %0,08 %
–0,11 %
0,87 %
–0,36 %
–0,67 %
–0,48 %
–0,22 %
–1,50
–1,00
–0,50
0,00
0,50
1,00
1,50
2015 2016 2017 Jan Feb Mar Apr May Jun Jul Aug Sep Oct Nov Dec
FIGURE 04Humidity differences of process steps in two feed mills in Brazil
Rio Grande do Sul
28 AMINOTec® | EDITION 1 | NOVEMBER 2018

Humidity difference conditioning (%)
2015 2016 2017 Jan Feb Mar Apr May Jun Jul Aug Sep Oct Nov Dec
0,14 %14,84 %
15,03 %
15,95 %
15,36 %
14,92 %
14,69 %14,78 %
15,08 %
14,20 %
15,66 %14,87 %
15,17 %
14,11 %
14,99 %
0,13 0,13 0,14 0,14 0,15 0,15 0,16 0,16 0,17
Humidity difference pelleting (%)
–0,01 %
–1,22 %
–0,53 %
–1,38 %
–1,45 %
–0,95 %
–0,91 %
–1,45 %
–0,47 %
–0,65 %
–1,02 %
–1,18 %
–1,15 %
–1,29 %
–1,04 %–1,50
–1,00
–0,50
0,00
0,50
1,00
1,50
2015 2016 2017 Jan Feb Mar Apr May Jun Jul Aug Sep Oct Nov Dec
Humidity difference grinding maize (%)
–0,00 %
–0,00 %
0,05 %
–0,11 %
–0,03 %
–0,52 %
–0,30 %
–0,27 %
–0,10 %
–0,15 %
0,08 %
–0,54 %
–0,32 %
–0,20 %
–0,20 %–0,70 –0,60 –0,50 –0,40 –0,30 –0,20 –0,10 0,00 0,10 0,20
2015 2016 2017 Jan Feb Mar Apr May Jun Jul Aug Sep Oct Nov Dec
Minas Gerais
29
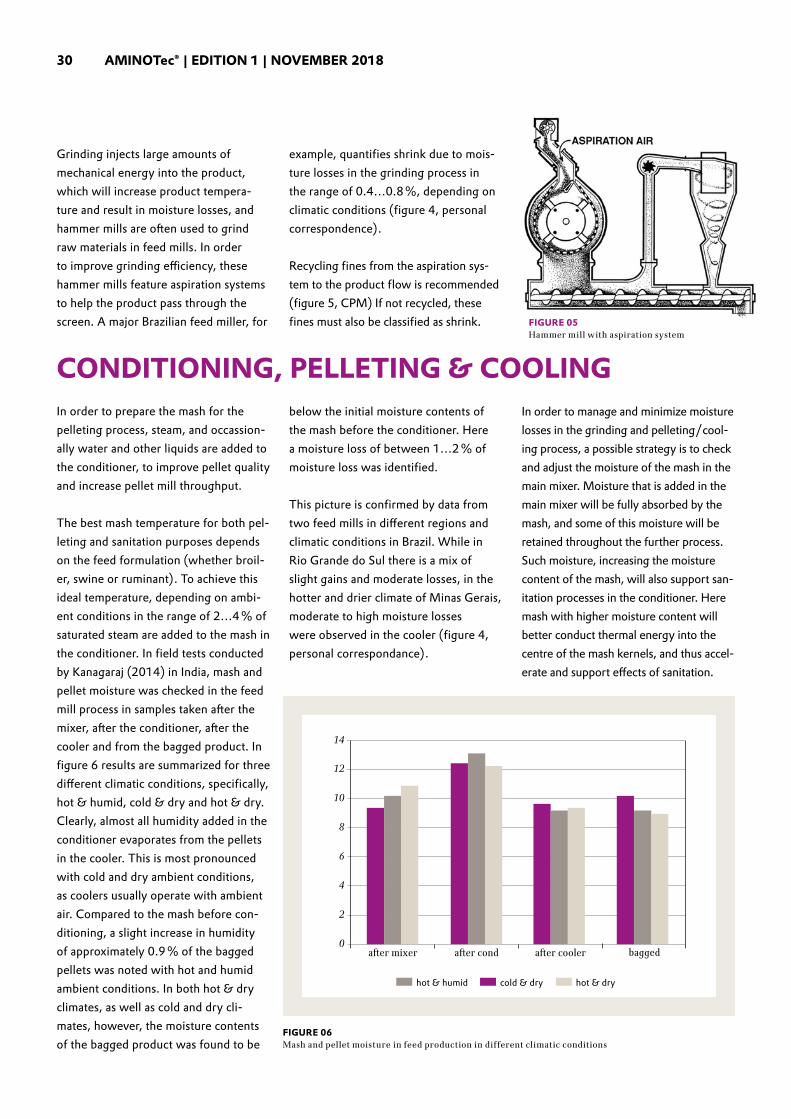
Grinding injects large amounts of mechanical energy into the product, which will increase product tempera-ture and result in moisture losses, and hammer mills are often used to grind raw materials in feed mills. In order to improve grinding efficiency, these hammer mills feature aspiration systems to help the product pass through the screen. A major Brazilian feed miller, for
example, quantifies shrink due to mois-ture losses in the grinding process in the range of 0.4…0.8 %, depending on climatic conditions (figure 4, personal correspondence).
Recycling fines from the aspiration sys-tem to the product flow is recommen ded (figure 5, CPM) If not recycled, these fines must also be classified as shrink.
CONDITIONING, PELLETING & COOLINGIn order to prepare the mash for the pelleting process, steam, and occassion-ally water and other liquids are added to the conditioner, to improve pellet quality and increase pellet mill throughput.
The best mash temperature for both pel-leting and sanitation purposes depends on the feed formulation (whether broil-er, swine or ruminant). To achieve this ideal temperature, depending on ambi-ent conditions in the range of 2…4 % of saturated steam are added to the mash in the conditioner. In field tests conducted by Kanagaraj (2014) in India, mash and pellet moisture was checked in the feed mill process in samples taken after the mixer, after the conditioner, after the cooler and from the bagged product. In figure 6 results are summarized for three different climatic conditions, specifically, hot & humid, cold & dry and hot & dry. Clearly, almost all humidity added in the conditioner evaporates from the pellets in the cooler. This is most pronounced with cold and dry ambient conditions, as coolers usually operate with ambient air. Compared to the mash before con-ditioning, a slight increase in humidity of approximately 0.9 % of the bagged pellets was noted with hot and humid ambient conditions. In both hot & dry climates, as well as cold and dry cli-mates, however, the moisture contents of the bagged product was found to be
below the initial moisture contents of the mash before the conditioner. Here a moisture loss of between 1…2 % of moisture loss was identified.
This picture is confirmed by data from two feed mills in different regions and climatic conditions in Brazil. While in Rio Grande do Sul there is a mix of slight gains and moderate losses, in the hotter and drier climate of Minas Gerais, moderate to high moisture losses were observed in the cooler (figure 4, personal correspondance).
In order to manage and minimize moisture losses in the grinding and pelleting / cool-ing process, a possible strategy is to check and adjust the moisture of the mash in the main mixer. Moisture that is added in the main mixer will be fully absorbed by the mash, and some of this moisture will be retained throughout the further process. Such moisture, increasing the moisture content of the mash, will also support san-itation processes in the conditioner. Here mash with higher moisture content will better conduct thermal energy into the centre of the mash kernels, and thus accel-erate and support effects of sanitation.
hot & humid cold & dry hot & dry
8
10
12
14
6
4
2
0a�er mixer a�er cond a�er cooler bagged
FIGURE 06Mash and pellet moisture in feed production in different climatic conditions
FIGURE 05Hammer mill with aspiration system
30 AMINOTec® | EDITION 1 | NOVEMBER 2018

Table 6 shows the effect of conditioning temperature and time on the mash at 3 different levels of moisture, specifically 5, 10 and 15 % of moisture. It is obvious
that for each conditioning temperature and time, the kill rate of salmonella expressed as a percentage, was at its highest at the highest moisture level.
In the cooling process dust is withdrawn from the cooler with the air flow.
Table 06: Effect of time, temperature and moisture on the destruction of Salmonella enteritidis in animal feed (Reimann, 1996) from: D. Ziggers, Feed Tech Volume 5, Number 6
TEMPERATURE TIME PERCENT REDUCTION AT DIFFERENT MOISTURE LEVELS
(°F) (°C) (seconds) 5 % moisture 10 % moisture 15 % moisture
160 71 20 68,22 83,44 90,06
40 73,50 86,35 97,43
80 83,57 90,80 99,70
170 77 20 87,36 92,36 98,24
40 80,93 96,91 98,91
80 91,61 93,49 99,73
180 82 20 79,92 98,09 99,80
40 89,14 99,02 99,99
80 91,62 99,12 99,98
During the cooling process, a blower creates an airstrem. A cyclone is then used to separate the dust from the air-stream, then recycles the air. Most of the fine dust particles are so tiny, that
although they will be separated from the air stream initially, they will later be recycled back into the airstream via the cyclone. According to Fahrenholz (2017) even in high efficiency cyclones,
0.075 lb of dust emissions may be expected per ton of feed (34 g/ton). With an annual production of 100 000 mt this would add up to 3 to 4 mt shrink by dust emissions.
31

COLLECTION AND RECYCLING OF START-UP PRODUCTS FROM THE PELLET MILL
We need to define and implement procedures on how to deal with start-up products from the pellet mill, products needed for flushing of production lines and fines collected in aspiration systems etc. Whenever possible, such products should be c ollected and recycled, or used as ingredients in certain formulations, where appropriate.
1
!Spillages of mash attract rodents
YOU SHOULD BE AWARE OF THIS
GENERAL REMARKS AND CONCLUSIONSThe best way for feed mill managers to keep the issue of shrink under control is to implement meaningful and strict housekeeping routines. Among those are regular checks of equipment, connections, gates for leaks and spillages. Cleaning procedures should be followed and enforced as these help to minimize shrink and avoid losses by pest infestations and rodents that are attracted by spills of organic materials, such as grain or feed mash.
HOW TO KEEP ISSUE OF SHRINK UNDER CONTROL:
32 AMINOTec® | EDITION 1 | NOVEMBER 2018

DOCUMENTATION OF SHRINK RELATED TO CLEANING AND DRYING
There is also a need to develop procedures to quantify and document shrink related to the cleaning and drying processes upon receipt of raw materials. Such losses cannot be avoided as grain moisture must be kept in a certain range to ensure safe storage conditions, and, also, to avoid losses through mould growth, insect infestations or germination.
3
IMPLEMENTING OF QUALITY CONTROL PROCESSES
Sampling and quality control processes also need to be put in place for incoming raw materials, to make sure deviations from specifications are recognized and well documented, be it related to product quality, weight deviations or packaging quality. Only well documented deviations from specifications can be claimed for from suppliers.
2
IMPLEMENTATION OF APPROPRIATE MOISTURE CONTROL OF THE MASH AND WATER ADDITION
Losses of moisture in the feed production processes (namely grinding and cooling) are also unavoidable. But those losses could be minimized by implementing appropriate moisture con-trol of the mash, and, where necessary, adding water into the main mixer to adjust moisture and secure an appropriate level for the further mixing, conditioning and pelleting process.
4
RECONCELING INVENTORY
Finally, reconciling inventory (in terms of ingredients and finished feed is an operational and administrative task that requires, and deserves, thorough and continuous attention. Stock taking is a tedious job, but results are only reliable if it is conducted responsibly by welltrained and experienced staff on a daily basis.
To reconcile inventories in the accounting system, the amount of beginning stock plus incoming goods must be compared to ending stock plus consumption (how much stock has been used up). The difference between both, is therefore the shrink (or ‘gain’).
5
shrink
Shrink (or gain) = (beginning stock + goods received) – (ending inventory + consumption)
A team effort of operators, accounting staff and managers is most definitely requiredto keep shrink under control. Causes for physical stock differences are multiple, as we have explored in detail in this article. In addition to this, accounting errors may well make life more complicated – but addressing this issue would perhaps require a discussion entirely of its own.
33

LEADING BRAZILIAN FEED PRODUCTION CHOOSES EVONIKMarco Lara ([email protected]), Regional Manager Handling Solution and Feed Milling Technology, Evonik Degussa Brasil Ltda. Sao Paulo, Brazil
ONE OF BRAZIL’s TOP PORK PRODUCERS HAS CHOSEN EVONIK’s LEADING DOSING SYSTEM TO SECURE AN INCREASE IN ITS FEED PRODUCTIVITY AND QUALITY LEVELS.
The Alibem Alimentos feed mill and premix plant in Santa Rosa, Rio Grande do Sul, has implemented Evonik’s high precision dosing system, AMINOSys®.
“Customers need to improve the use of, supplemental amino acids and Evonik offers innovative, accurate and reliable solutions that bring proven economic results” says Marco Lara, regional manager of handling solutions and feed milling technology.
All living organisms require amino acids to synthesize proteins and secure the growth of lean tissue. By using the AMINOSys®, Alibem will now be able to better manage
handling and high precision dosing of crystalline or granular bulk amino acids, ensuring that their pork products are of the highest possible quality.
The flexible AMINOSys® system is part of an installation project comprised of consulting, hardware and software solu-tions which automatically dose amino acids in feed.
AMINOSys® is designed as a modular sys-tem that supports receiving amino acids in big bags, or in full bulk silos. It doses and conveys amino acids directly to the batch mixer or simply replenishes bins of an already existing micro dosing system.
PICTURE 01The Alibem Alimentos feed mill and premix plant in Santa Rosa, Rio Grande
AMINOSys® IS DESIGNED AS A MODULAR SYSTEM THAT SUPPORTS RECEIVING AMINO ACIDS IN BIG BAGS, OR IN FULL BULK SILOS.
34 AMINOTec® | EDITION 1 | NOVEMBER 2018

3-IN-ONE SOLUTION FOR ALIBEMThe Alibem Alimentos group spe-cializes in the slaughter, processing, commercialization and distribution of quality pork and beef products, and produces animal protein in the form of pork (ALIBEM brand) and beef (AGRA brand). It is the second larg-est swine processing company in the state of Rio Grande do Sul, and the 5th largest in terms of slaughter num-bers in the whole of Brazil. As part of the recent installation, three systems of Evonik’s state-of-the art equip-
ment have now been integrated into Alibem’s feed production, supporting two compound feed mix lines, and a premix line.
“Our mission is to satisfy all the means involved, through sustain-able growth, ensuring investments in the areas of environment, biosafety, genetics, production and marketing along with providing social develop-ment,” said Mr. Maximiliano Chang Lee, CEO of the Alibem group.
LOWER COSTS, HIGHER QUALITYAs well as supplying the Brazilian market, Alibem also exports to several countries. Its demand for Evonik’s equipment arose due to its rapid growth in recent years, resulting in a significant increase in feed production.
“The AMINOSys® equipment will improve the production process, and the quality and volume of premix produced. It will also increase the company’s confidence in dosing accu-racy, reducing production costs and optimizing labour, since it has enabled workers to relocate from the premix area to other areas that need support” said Fabricio Ruschel, executive director of the agriculture and live-stock division.
Paulo Teixeira, Business Director for Animal Nutrition in Brazil said the installation of the AMINOSys® dos-ing system will provide to Alibem’s business due to the decrease in operational costs, with an impact on the reduction of labour, availability of storage area for other ingredients, and precision in the dosage of amino acids.
This installation in Brazil is officially Evonik’s 100th such project in the country. To celebrate this milestone Evonik recently held an inauguration ceremony involving 120 people, including executives from Evonik, Alibem and project partners. After a dinner party at the Santa Rosa Gaucho Traditions Center, the colourful event was brought to life with a wide range of traditional dance performances.
LEADING SUPPORT TO THE ANIMAL NUTRITION SECTORThe improvement of feed quality and productivity of production plants are constant challenges for companies involved in the animal production supply chain. Since the 1940s, Evonik has been helping to meet this challenge by producing supplemental amino acids for animal feed. It has also provided optimized solutions for the feed production market.
“We act according to the new challenges, providing pioneering systems and services of excellence, contributing to help, develop and improve the business of compa-nies,” said Rogerio Ott, business manager of Evonik and responsible for Alibem account.
S I N C E T H E
1940s
35

FIRST-CLASS REPUTATION IN BRAZILIn Brazil, Evonik is recognized by the feed production market as the lead-ing company which supplies a quality dosing solution for dry bulk amino acids. With the first AMINOSys® imple-mented in the 1990s, AMINOSys® has gone on to establish itself as one of the most accurate and efficient micro-dosing solutions for amino acids.
Proof of the robustness of the equip-ment and the AMINOSys® solution is that the systems initially installed in Brazil onlyneeded an upgrade in 2015. This means they managed to operate reliably and successfully for over 20 years.
This serves as testament not just to the quality of Evonik’s products and
systems, but also to the presence, motivation and dedication of its highly professional team. Their staff are fully committed to training customers, providing prompt support in trouble-shooting and corrective maintenance, as well as implementing world-quality preventive maintenance programs.
In addition to AMINOSys®, Evonik has developed a range of tools to sup-port feed mills such as AMINOBatch® and AMINOBatch® Working Precision Test, which help improve the blending process. Since they were first imple-mented, these tools have contributed to a significant improvement in the quality of food produced in Brazil.
AMINOSys® HAS GONE ON TO ESTABLISH ITSELF AS ONE OF THE MOST ACCURATE AND EFFICIENT MICRO-DOSING SOLUTIONS FOR AMINO ACIDS.
Watch the AMINOSys video! https://metamino-hub.evonik.com/front/Article/8sqx1s59U
36 AMINOTec® | EDITION 1 | NOVEMBER 2018

ARTICLE1 :Feed structure and production processes impact on poultry live production
Abdollahi, M. R., F. Zaefarian, and V. Ravindran. 2018. Feed intake response of broilers: Impact of feed processing. Animal Feed Science and Technology 237: 154-165.
Amerah, A. M., and V. Ravindran. 2009. Influence of particle size and microbial phytase supplementation on the perfor-mance, nutrient utilisation and digestive tract parameters of broiler starters. Animal Production Science 49 (8): 704-710.
Amerah, A. M. et al. 2007. Feed particle size: Implications on the digestion and performance of poultry. World’s Poultry Science Journal, Vol. 63.
Amerah, A. M., V. Ravindran, R. G. Lentle, and D. G. Thom-as. 2007a. Feed particle size: Implications on the digestion and performance of poultry. World's Poultry Science Journal 63 (3): 439-455.
Amerah, A. M., V. Ravindran, R. G. Lentle, and D. G. Thom-as. 2007b. Influence of feed particle size and feed form on the performance, energy utilization, digestive tract develop-ment, and digesta parameters of broiler starters. Poultry Science 86 (12): 2615-2623.
Amerah, A. M., V. Ravindran, R. G. Lentle, and D. G. Thom-as. 2008. Influence of feed particle size on the performance, energy utilization, digestive tract development, and digesta parameters of broiler starters fed wheat-and corn-based diets. Poultry science 87 (11): 2320-2328.
Attawong, S., A. C. Fahrenholz, and J. Brake. 2014. The effect of dietary corn particle size and post-pellet liquid fat application on broiler live performance. Poultry Science 93 (Esuppl. 1):26. Presented at PSA Annual Meeting, Corpus Christi, TX.
Auttawong, S., J. Brake, C. Stark, and S. Yahav. 2013. Time-limited feeding of grower feed negates the effects of corn particle size, dietary energy level, and post-pellet liquid fat application on broiler live performance from 14 to 28 days of age. Poultry Science 92 (ESuppl. 1):32.
Bunzel, D. 2009. AMINONews Review 2009, AMINOBatch® Working Precision Test – A Valuable Tool to Evaluate Working Precision of your Mixing Plant
Chewning, C. G., C. R. Stark, and J. Brake. 2012. Effects of particle size and feed form on broiler performance. Journal of Applied Poultry Research 21: 830-837.
Choct, M. 2009. Managing gut health through nutrition. British Poultry Science 50 (1): 9-15.
Cumming, R. B. 1994. Opportunities for whole grain feed-ing. In: Proceedings 9th European poultry conference, Vol. II. Worlds Poultry Science Association: Glasgow, UK: 219-222.
Duke, G. E. 1982. Gastrointestinal motility and its regulation. Poultry Science, 61 (7): 1245-1256.
Dozier III, W. A., K. C. Behnke, C. K. Gehring, and S. L. Branton. 2010. Effects of feed form on growth performance and processing yields of broiler chickens during a 42-day production period. Journal of Applied Poultry Research 19 (3): 219-226.
Engberg, R. M., M. S. Hedemann, and B. B. Jensen. 2002. The influence of grinding and pelleting of feed on the micro-bial composition and activity in the digestive tract of broiler chickens. British Poultry Science 43 (4): 569-579.
Engster, H. M. 2014. Effects of Feed Mix Quality on Animal Performance. AMINOTec Edition 1.
Fahrenholz, A. and J. Brake. 2015. Feed Particle Size and Poultry Performance. Presented at the Midwest Poultry Federation Convention 2015
Fahrenholz, A. 2012. Evaluation factors affecting pellet dura-bility and enery consumption in a pilot feed mill and compar-ing methods for evaluating pellet durability, an abstract for a dissertation, Kansas State University, Manhattan, Kansas: 82 – 85.
Ferket, P. 2000. Feeding whole grains to poultry improves gut health. Feedstuffs 72 (37): 12-13.
Fernandes, E. A., W. J. S. Pereira, L. Hackenhaar, R. M. Rodrigues, and R. Terra. 2013. The use of whole grain sor-ghum in broiler feeds. Revista Brasileira de Ciência Avícola 15: 217-222.
FAO, Manual of Good Practices for the Feed Industry, section 4, On-farm production and use of feed and feed ingredients
Gabriel, I., S. Mallet, M. Leconte, G. Fort, and M. Naciri. 2003. Effects of whole wheat feeding on the development of coccidial infection in broiler chickens. Poultry Science 82 (11): 1668-1676.
Gabriel, I., S. Mallet, M. Leconte, A. Travel, and J. P. Lalles. 2008. Effects of whole wheat feeding on the development of the digestive tract of broiler chickens. Animal Feed Science and Technology 142 (1-2): 144-162.
Hetland, H., M. Choct, and B. Svihus. 2004. Role of insolu-ble non-starch polysaccharides in poultry nutrition. World's Poultry Science Journal 60 (4): 415-422.
Jacobs, C. M., P. L. Utterback, and C. M. Parsons. 2010. Effects of corn particle size on growth performance and nutrient utilization in young chicks. Poultry Science 89 (3): 539-544.
Liu, Y. H., X. S. Piao, D. Y. Ou, Y. H. Cao, D. S. Huang, and D. F. Li. 2006. Effects of particle size and physical form of diets on mast cell numbers, histamine, and stem cell fac-tor concentration in the small intestine of broiler chickens. Poultry Science 85 (12): 2149-2155.
Liu, S. Y., H. H. Truong, and P. H. Selle. 2015. Whole-grain feeding for chicken-meat production: possible mechanisms driving enhanced energy utilisation and feed conversion. Animal Production Science 55 (5): 559-572.
McKinney and Teeter. 2004. Poultry Science 83: 1165-1174.
Mingbin, Lv, L. Yan, Z. Wang, S. An, M. Wu, and Z. Lv. 2015. Effects of feed form and feed particle size on growth performance, carcass characteristics and digestive tract devel-opment of broilers. Animal Nutrition 1 (3): 252-256.
Morris, Bruce C., H. D. Danforth, D. J. Caldwell, F. W. Pier-son, and A. P. McElroy. 2004. Intestinal mucosal mast cell immune response and pathogenesis of two Eimeria acervulina isolates in broiler chickens. Poultry Science 83: 1667-1674.
Moss, A. F., H. H. Truong, S. Y. Liu, and P. H. Selle. 2018. Inclusion levels and modes of whole grain incorporation into wheat-based rations differentially influence the performance of broiler chickens. British Poultry Science 59 (1): 110-120.
Naderinejad, S., F. Zaefarian, M. R. Abdollahi, A. Hassanaba-di, H. Kermanshahi, and V. Ravindran. 2016. Influence of feed form and particle size on performance, nutrient utilisa-tion, and gastrointestinal tract development and morphom-etry in broiler starters fed maize-based diets. Animal Feed Science and Technology 215: 92-104.
Nir, I., R. Hillel, G. Shefet, and Z. Nitsan. 1994. Effect of grain particle size on performance. 2. Grain texture interac-tions. Poultry Science 73: 781-791.
Nir, I., R. Hillel, I. Ptichi, and G. Shefet. 1995. Effect of par-ticle size on performance. 3. Grinding pelleting interactions. Poultry Science 74 (5): 771-783.
Pacheco, W. J., A. C. Fahrenholz, C. R. Stark, P. R. Ferket, and J. Brake. 2013. Effect of particle size and inclusion level of Distillers Dried Grains with Solubles (DDGS) and pellet quality on growth performance and gastro-intestinal (GIT) development of broilers. Poultry Science 92 (E-Suppl. 1):14. Presented at PSA Annual Meeting, San Diego, CA.
Pacheco, W. J., A. C. Fahrenholz, C. R. Stark, P. R. Ferket, and J. Brake. 2014. Effect of particle size of distillers dried grains with solubles and soybean meal on pellet quality, nutrient digestibility, and broiler live performance. Poultry Science 93 (E-suppl. 1):24. Presented at PSA Annual Meet-ing, Corpus Christi, TX.
Reece, F. N., B. D. Lott, and J. W. Deaton. 1986. The effects of hammer mill screen size on ground corn particle size, pellet durability, and broiler performance. Poultry Science 65 (7): 1257-1261.
Reimer, L. 1992. Conditioning. In: Proc. Northern Crops Institute Feed Mill Management and Feed Manufacturing Technol. Short Course, California Pellet Mill Co. Crawfords-ville, IN: 7.
Singh, Y., A. M. Amerah, and V. Ravindran. 2014. Whole grain feeding: Methodologies and effects on performance, digestive tract development and nutrient utilisation of poul-try. Animal Feed Science and Technology 190: 1-18.
Svihus, B., E. Juvik, H. Hetland, and Å. Krogdahl. 2004. Causes for improvement in nutritive value of broiler chicken diets with whole wheat instead of ground wheat. British Poultry Science 45 (1): 55-60.
Truong, H. H., A. F. Moss, S. Y. Liu, and P. H. Selle. 2017. Pre-and post-pellet whole grain inclusions enhance feed conversion efficiency, energy utilisation and gut integrity in broiler chickens offered wheat-based diets. Animal Feed Science and Technology 224: 115-123.
Vukmirovic, Dj.M. et al. 2016. Corn on mill energy con-sumption and pellet quality, Hem. ind. 70 (1) 67–72.
Vicuna, E. 2015. Intestinal inflammation of model inducing gut lekage by different methods in broiler chickens using FITC-d as a marker. Thesis for Master in Poultry Science. University of Arkanas, Fayetteville.
Wu, Y. B., V. Ravindran, D. G. Thomas, M. J. Birtles, and W. H. Hendriks. 2004. Influence of method of whole wheat inclusion and xylanase supplementation on the performance, apparent metabolisable energy, digestive tract measurements and gut morphology of broilers. British Poultry Science 45 (3): 385-394.
Xu. Y., C. R. Stark, P. R. Ferket, C. M. Williams, W. J. Pacheco, and J. Brake. 2015. Effect of dietary coarsely ground corn on broiler live performance, gastrointestinal tract development, apparent ileal digestibility of energy and nitrogen, and digesta particle size distribution and retention time. Poultry Science 94:53-60.
Zaefarian, F., M. R. Abdollahi, and V. Ravindran. 2016. Particle size and feed form in broiler diets: impact on gastro-intestinal tract development and gut health. World's Poultry Science Journal 72 (2): 277-290.
Zang, J. J., X. S. Piao, D. S. Huang, J. J. Wang, X. Ma, and Y. X. Ma. 2009. Effects of feed particle size and feed form on growth performance, nutrient metabolizability and intestinal morphology in broiler chickens. Asian-Australasian Journal of
Animal Sciences 22 (1): 107-112.
ARTICLE 2: How to Manage Reduce Shrink
CPM, Economics of Grinding for Pelleted Feeds, (https://www.cpm.net/downloads/Economics%20of%20Grind-ing%20for%20Pelleted%20Feeds.pdf, 22.5.2018). Fahr-enholz, A.C. et al., Strategies to reduce shrink during feed production, Feedstuffs, April 3, 2017. Hicks, D.R., Cloud, H.A., Calculating Grain Weight Shrinkage in Corn Due to Mechanical Drying, NCH 61, February 1992, Electronic version July 2001.
Kanagaraj, M., Controlling feed moisture variation, Asian Poultry Magazine, June 2014
Kongskilde Industries A/S, Grain Biology. (http://www.google.com/url?sa=t&rct=j&q=&esrc=s&source=web&cd=3&cad=rja&uact=8&ved=2ahUKEwip8-Lo-JjbAhVFVsAKHeoKAeUQFjACegQIARA7&url=http%3A%2F%2Fwww.kongskilde-industries.com%2F-%2Fmedia%2FDLG%2FKongskilde%2FDownloadLib%2FBrochures%2FGrain-Handling%2FSystem-solutions%2FGrain-Biology%2FGrain_biology_EXP_UK.ashx%3Fla%3Den&usg=AOvVaw1BWKD_XKZ_-qSDsTWsPp64, 22.5.2018)
METTLER TOLEDO - Truck Scale Buying Guide, 01/2013 Mettler-Toledo AG MarCom Industrial.
Samy Sadaka, Rusty Bautista, Grain Drying Tools: Equilibrium Moisture Content Tables and Psychrometric Charts, Agricul-ture and Natural Resources, FSA1074.
Weber, E., 1995, Armazenagem Agrícola, Porto Alegre, Kepler Weber Industrial.
Ziggers, D., Feed Tech Volume 5, Number 6.
ARTICLE 3: Leading Brazilian Feed Production chooses Evonik
–
REFERENCES
37

A WINNING COMBINATION
Our customers receive more than products – we offer a combination of targeted services, digital tools and prod-ucts. Our experts are at your side with specialized knowledge and experience to help them unlock the full value of our products. We maintain offices in more than 60 countries. Our scientists stay in close contact with universities, research institutes and other members of the scientific community. And they share their knowledge in our scientific papers and training.
We have 13 labs on 5 continents that provide NIR and wet chemistry services, placing leading analytical capacity for essential amino acids at your disposal. This gives you the advantage of fast and convenient assessments of the compo-nents of your raw materials and their quality – key information in formulat-ing the best diet for a given animal. To enable you to implement the low protein concept, we offer the whole portfolio of amino acids. We can also deliver gut health solutions.
Since micro ingredients are relatively expensive, we have developed handling solutions with exact dosing systems and homogeneous mixing to avoid waste. This way you can use every gram of our product.
With nine plants and over 50 warehous-es worldwide, we can deliver reliably – on time and in the right quantity. Count on us, not only for an excellent product, but for a whole package that adds up to best results.
OWN OFFICES IN 60 COUNTRIES
13 LABS ON 5 CONTINENTS
9 ANIMAL NUTRITION PRODUCTION FACILITIES WORLDWIDE
38 AMINOTec® | EDITION 1 | NOVEMBER 2018

WHO WE ARE IN A NUTSHELLEVONIK IS ONE OF THE WORLD’s LEADING SPECIALTY CHEMICALS COMPANIES. THE CENTRAL ELEMENTS OF OUR STRATEGY FOR SUSTAINED VALUE CREATION ARE PROFITABLE GROWTH, EFFICIENCY AND VALUES. IN 2017 EVONIK’s MORE THAN 36,000 EMPLOYEES GENERATED SALES OF €14.4 BILLION.
AVERAGE AGE OF EMPLOYEES 2016
41.8 years
R&D EXPENSES
€438 million
EVONIK ANIMAL NUTRITION
Evonik Animal Nutrition is a highly reliable, globally operating provider of science-driven products and services for sustainable and efficient production of meat, fish, eggs and milk. The orga-nization is marked by scientific excel-lence and sensitivity to the needs of our customers and society.
OUR MISSION
We use science to improve sustainability, health and efficiency along the food chain to feed growing populations with animal protein for generations to come.
WHAT WE STAND FOR
Our unique combination of scientific excellence and customer-centered products and services sets us clearly apart. Our customers know they can count on us, because everything we do is firmly rooted in proven science and implementation expertise.
In dialogSo many ways to reach us – whether via e-mail, telephone or a personal visit. Whatever your preference, we look forward to serving you.
DETLEF BUNZEL Rodenbacher Chaussee 4 63457 Hanau-Wolfgang Germany [email protected] www.evonik.com
Check out our LinkedIn company page for the latest news.
#EvonikAnimalNutrition
39

EVONIK NUTRITION & CARE GMBH Animal Nutrition Business Line
[email protected] www.evonik.com / animal-nutrition
This information and any recommendations, techni-cal or otherwise, are presented in good faith and believed to be correct as of the date prepared. Recipients of this information and recommendations must make their own determination as to its suit-ability for their purposes. In no event shall Evonik assume liability for damages or losses of any kind or nature that result from the use of or reliance upon this information and recommendations. EVONIK EXPRESSLY DISCLAIMS ANY REPRESENTATIONS AND WARRANTIES OF ANY KIND, WHETHER EXPRESS OR IMPLIED, AS TO THE ACCURACY, COMPLETENESS, NON-INFRINGEMENT, MER-CHANTABILITY AND / OR FITNESS FOR A PAR-TICULAR PURPOSE (EVEN IF EVONIK IS AWARE OF SUCH PURPOSE) WITH RESPECT TO ANY INFORMATION AND RECOMMENDATIONS PROVIDED. Reference to any trade names used by other companies is neither a recommendation nor an endorsement of the corresponding product, and does not imply that similar products could not beused. Evonik reserves the right to make any changes to the information and / or recommendations at any time, without prior or subsequent notice.
Europe Evonik Nutrition & Care GmbH Rodenbacher Chaussee 4 63457 Hanau-Wolfgang, Germany Phone +49 6181 59-6766 Fax +49 6181 59-6696
Middle East Africa Evonik Africa (Pty) Ltd. IBG Business Park 11 Enterprise Avenue Midridge Ext 10 Midrand 1685, South Africa Phone +27 11 697-0715
North America Evonik Corporation 1701 Barrett Lakes Blvd. Suite 340 Kennesaw, GA 30144, USA Phone +1 678 797-4300 Fax +1 678 797-4313
Latin America Evonik Degussa Brasil Ltda Rua Arquiteto Olavo Redig de Campos, 105 Torre A 04711-904 – São Paulo – SP – Brasil Phone +55 11 3146-4135
Asia North Evonik Degussa (China) Co., Ltd. Unit 1005 A, Tower D1, DRC Liangmaqiao Diplomatic Office Building, 19 Dongfang East Road, Chaoyang District, Beijing 100600, P.R. China Phone +86 10 6587-5300 Fax +86 10 8527-5986
Asia South Evonik (SEA) Pte Ltd 3 International Business Park #07 – 18 Nordic European Centre Singapore 609927 Singapore Phone +65 6809-6666 Fax +65 6809-667