FedEx 09 Annual Report 2005 2006 2007 2008 2009 In millions, except earnings per share 2009 (1) 2008...
66
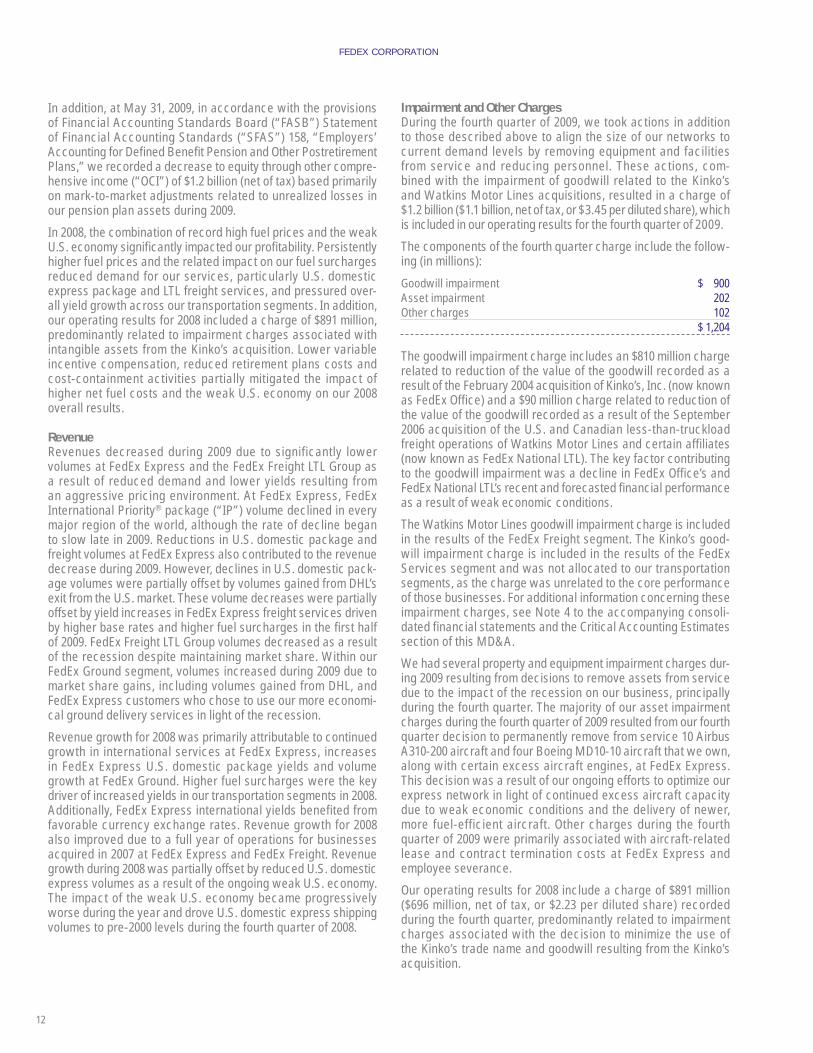
8 (1) Results for 2009 include a charge of $1.2 billion ($1.1 billion, net of tax, or $3.45 per diluted share) primarily related to impairment charges associated with goodwill and aircraft. (2) Results for 2008 include a charge of $891 million ($696 million, net of tax, or $2.23 per diluted share) predominately related to impairment charges associated with intangible assets from the Kinko’s acquisition. (3) Shows the value, at the end of each of the last five fiscal years, of $100 invested in FedEx Corporation common stock or the relevant index on May 31, 2004, and assumes reinvestment of dividends. Fiscal year ended May 31. Financial Highlights FedEx Corporation Dow Jones Transportation Average S&P 500 COMPARISON OF FIVE-YEAR CUMULATIVE TOTAL RETURN (3) $160 --------------------------------------------------------------------------------------------------------------------------------------------------------------------------------------------------------------------------------- $150 --------------------------------------------------------------------------------------------------------------------------------------------------------------------------------------------------------------------------------- $140 --------------------------------------------------------------------------------------------------------------------------------------------------------------------------------------------------------------------------------- $130 --------------------------------------------------------------------------------------------------------------------------------------------------------------------------------------------------------------------------------- $120 --------------------------------------------------------------------------------------------------------------------------------------------------------------------------------------------------------------------------------- $110 --------------------------------------------------------------------------------------------------------------------------------------------------------------------------------------------------------------------------------- $100 --------------------------------------------------------------------------------------------------------------------------------------------------------------------------------------------------------------------------------- $90 --------------------------------------------------------------------------------------------------------------------------------------------------------------------------------------------------------------------------------- $80 --------------------------------------------------------------------------------------------------------------------------------------------------------------------------------------------------------------------------------- $70 --------------------------------------------------------------------------------------------------------------------------------------------------------------------------------------------------------------------------------- 2004 2005 2006 2007 2008 2009 In millions, except earnings per share 2009 (1) 2008 (2) Percent Change Operating Results Revenues $35,497 $37,953 (6) Operating income 747 2,075 (64) Operating margin 2.1% 5.5 % Net income 98 1,125 (91) Diluted earnings per share 0.31 3.60 (91) Average common and common equivalent shares 312 312 0 Capital expenditures 2,459 2,947 (17) Financial Position Total assets $24,244 $25,633 (5 ) Long-term debt, including current portion 2,583 2,008 29 Common stockholders’ investment 13,626 14,526 (6) REVENUE (IN BILLIONS) OPERATING MARGIN DILUTED EARNINGS PER SHARE RETURN ON AVERAGE EQUITY DEBT TO TOTAL CAPITALIZATION STOCK PRICE (MAY 31 CLOSE) 2005 2005 16.4% $29.4 2006 2006 17.1% $32.3 2007 2007 16.7% $35.2 2008 2008 (2) 8.3% $38.0 2009 2009 (1) 0.7% $35.5 2005 2005 22.6% 8.4% 2006 2006 17.5% 9.3% 2007 2007 17.3% 9.3% 2008 (2) 2008 12.1% 5.5% 2009 (1) 2009 15.9% 2.1% 2005 2005 $89.42 $4.72 2006 2006 $109.27 $5.83 2007 2007 $111.62 $6.48 2008 (2) 2008 $91.71 $3.60 2009 (1) 2009 $55.43 $0.31
Transcript of FedEx 09 Annual Report 2005 2006 2007 2008 2009 In millions, except earnings per share 2009 (1) 2008...

8
(1) Results for 2009 include a charge of $1.2 billion ($1.1 billion, net of tax, or $3.45 per diluted share) primarily related to impairment charges associated with goodwill and aircraft. (2) Results for 2008 include a charge of $891 million ($696 million, net of tax, or $2.23 per diluted share) predominately related to impairment charges associated with intangible assets from the Kinko’s acquisition.(3) Shows the value, at the end of each of the last five fiscal years, of $100 invested in FedEx Corporation common stock or the relevant index on May 31, 2004, and assumes reinvestment of dividends. Fiscal year ended May 31.
Financial Highlights
FedEx Corporation Dow Jones Transportation Average S&P 500
COMPArISOn OF FIVE-yEAr CUMULATIVE TOTAL rETUrn(3)
$160 ---------------------------------------------------------------------------------------------------------------------------------------------------------------------------------------------------------------------------------
$150 ---------------------------------------------------------------------------------------------------------------------------------------------------------------------------------------------------------------------------------
$140 ---------------------------------------------------------------------------------------------------------------------------------------------------------------------------------------------------------------------------------
$130 ---------------------------------------------------------------------------------------------------------------------------------------------------------------------------------------------------------------------------------
$120 ---------------------------------------------------------------------------------------------------------------------------------------------------------------------------------------------------------------------------------
$110 ---------------------------------------------------------------------------------------------------------------------------------------------------------------------------------------------------------------------------------
$100 ---------------------------------------------------------------------------------------------------------------------------------------------------------------------------------------------------------------------------------
$90 ---------------------------------------------------------------------------------------------------------------------------------------------------------------------------------------------------------------------------------
$80 ---------------------------------------------------------------------------------------------------------------------------------------------------------------------------------------------------------------------------------
$70 ---------------------------------------------------------------------------------------------------------------------------------------------------------------------------------------------------------------------------------
2004 2005 2006 2007 2008 2009
In millions, except earnings per share 2009 (1) 2008 (2) Percent Change
Operating Resultsrevenues $35,497 $37,953 (6 )Operating income 747 2,075 (64 )Operating margin 2.1 % 5.5 %net income 98 1,125 (91 )Diluted earnings per share 0.31 3.60 (91 )Average common and common equivalent shares 312 312 0 Capital expenditures 2,459 2,947 (17 ) Financial PositionTotal assets $24,244 $25,633 (5 )Long-term debt, including current portion 2,583 2,008 29Common stockholders’ investment 13,626 14,526 (6 )
REVENUE (IN BILLIONS) OPERATING MARGIN DILUTED EARNINGS PER SHARE
RETURN ON AVERAGE EQUITY DEBT TO TOTAL CAPITALIZATION STOCK PRICE (MAY 31 CLOSE)
2005
2005
16.4%
$29.4
2006
2006
17.1%
$32.3
2007
2007
16.7%
$35.2
2008
2008(2)
8.3%
$38.0
2009
2009(1)
0.7%
$35.5
2005
2005
22.6%
8.4%
2006
2006
17.5%
9.3%
2007
2007
17.3%
9.3%
2008(2)
2008
12.1%
5.5%
2009(1)
2009
15.9%
2.1%
2005
2005
$89.42
$4.72
2006
2006
$109.27
$5.83
2007
2007
$111.62
$6.48
2008(2)
2008
$91.71
$3.60
2009(1)
2009
$55.43
$0.31

9
MANAGEMENT’S DISCUSSION AND ANALYSIS OF RESULTS OF OPERATIONS AND FINANCIAL CONDITION
Overview of Financial SectionThe fi nancial section of the FedEx Corporation (“FedEx”) Annual Report (“Annual Report”) consists of the following Management’s Discussion and Analysis of Results of Operations and Financial Condition (“MD&A”), the Consolidated Financial Statements and the notes to the Consolidated Financial Statements, and Other Financial Information, all of which include information about our signifi cant accounting policies, practices and the transactions that underlie our fi nancial results. The following MD&A describes the principal factors affecting the results of operations, liquidity, capital resources, contractual cash obligations and the critical accounting estimates of FedEx. The discussion in the fi nancial section should be read in conjunction with the other sections of this Annual Report and our detailed discussion of risk factors included in this MD&A.
ORGANIZATION OF INFORMATIONOur MD&A is comprised of three major sections: Results of Operations, Financial Condition and Critical Accounting Estimates. These sections include the following information:
• Results of Operations includes an overview of our consolidated 2009 results compared to 2008, and 2008 results compared to 2007. This section also includes a discussion of key actions and events that impacted our results, as well as a discussion of our outlook for 2010.
• The overview is followed by a fi nancial summary and analysis (including a discussion of both historical operating results and our outlook for 2010) for each of our reportable transportation segments.
• Our fi nancial condition is reviewed through an analysis of key elements of our liquidity, capital resources and contractual cash obligations, including a discussion of our cash fl ow statements and our fi nancial commitments.
• We conclude with a discussion of the critical accounting esti-mates that we believe are important to understanding certain of the material judgments and assumptions incorporated in our reported fi nancial results.
DESCRIPTION OF BUSINESSWe provide a broad portfolio of transportation, e-commerce and business services through companies competing collectively, operating independently and managed collaboratively, under the respected FedEx brand. Our primary operating companies include Federal Express Corporation (“FedEx Express”), the world’s largest express transportation company; FedEx Ground Package System, Inc. (“FedEx Ground”), a leading provider of small-package ground delivery services; and FedEx Freight Corporation, a leading U.S. provider of less-than-truckload (“LTL”) freight services. Our FedEx Services segment provides customer-facing sales, marketing, information technology and customer service support to our transportation segments. In addition, the FedEx Services segment provides customers with retail access to FedEx Express and FedEx Ground shipping services through FedEx Offi ce and Print Services, Inc. (“FedEx Offi ce”). These companies represent our major service lines and form the core of our reportable segments. See “Reportable Segments” for fur-ther discussion.
The key indicators necessary to understand our operating results include:
• the overall customer demand for our various services;
• the volumes of transportation services provided through our networks, primarily measured by our average daily volume and shipment weight;
• the mix of services purchased by our customers;
• the prices we obtain for our services, primarily measured by yield (revenue per package or pound or revenue per hundred-weight for LTL freight shipments);
• our ability to manage our cost structure (capital expenditures and operating expenses) to match shifting volume levels; and
• the timing and amount of fl uctuations in fuel prices and our ability to recover incremental fuel costs through our fuel surcharges.
The majority of our operating expenses are directly impacted by revenue and volume levels. Accordingly, we expect these operat-ing expenses to fl uctuate on a year-over-year basis consistent with the change in revenues and volume. The following discus-sion of operating expenses describes the key drivers impacting expense trends beyond changes in revenues and volume.
Except as otherwise specifi ed, references to years indicate our fi scal year ended May 31, 2009 or ended May 31 of the year ref-erenced and comparisons are to the prior year. References to our transportation segments include, collectively, our FedEx Express, FedEx Ground and FedEx Freight segments.

FEDEX CORPORATION
10
Results of OperationsCONSOLIDATED RESULTSThe following table compares revenues, operating income, operating margin, net income and diluted earnings per share (dollars in millions, except per share amounts) for the years ended May 31: Percent Change 2009 (1) 2008 (2) 2007 (3) 2009/2008 2008/2007
Revenues $ 35,497 $ 37,953 $ 35,214 (6) 8Operating income 747 2,075 3,276 (64) (37)Operating margin 2.1% 5.5% 9.3% (340)bp (380)bpNet income $ 98 $ 1,125 $ 2,016 (91) (44)Diluted earnings per share $ 0.31 $ 3.60 $ 6.48 (91) (44)(1) Operating expenses include a charge of $1.2 billion ($1.1 billion, net of tax, or $3.45 per diluted share), primarily related to impairment charges associated with goodwill and aircraft (described below).(2) Operating expenses include a charge of $891 million ($696 million, net of tax, or $2.23 per diluted share), predominantly related to impairment charges associated with intangible assets from the Kinko’s acquisition (described below).(3) Operating expenses include a charge of $143 million at FedEx Express associated with upfront compensation and benefi ts under a labor contract with our pilots ratifi ed in October 2006. The impact of this contract on second quarter net income was $78 million net of tax, or $0.25 per diluted share.
The following table shows changes in revenues and operating income by reportable segment for 2009 compared to 2008, and 2008 compared to 2007 (in millions): Revenues Operating Income (Loss) Dollar Change Percent Change Dollar Change Percent Change 2009/2008 2008/2007 2009/2008 2008/2007 2009/2008 2008/2007 2009/2008 2008/2007
FedEx Express segment (1) $ (2,057) $ 1,740 (8) 8 $ (1,107) $ (90) (58) (5)FedEx Ground segment 296 708 4 12 71 (86) 10 (10)FedEx Freight segment (2) (519) 348 (11) 8 (373) (134) (113) (29)FedEx Services segment (3) (161) 2 (8) – 81 (891) 9 NMOther and Eliminations (15) (59) NM NM – – – – $ (2,456) $ 2,739 (6) 8 $ (1,328) $ (1,201) (64) (37)(1) FedEx Express segment 2009 operating expenses include a charge of $260 million, primarily related to aircraft-related asset impairments. FedEx Express segment 2007 operating expenses include a charge of $143 million associated with upfront compensation and benefi ts under our pilot labor contract.(2) FedEx Freight segment 2009 operating expenses include a charge of $100 million, primarily related to impairment charges associated with goodwill related to the Watkins Motor Lines (now known as FedEx National LTL) acquisition. FedEx Freight segment results include the results of FedEx National LTL from the date of its acquisition on September 3, 2006.(3) FedEx Services segment 2009 operating expenses include a charge of $810 million, related to impairment charges associated with goodwill related to the Kinko’s acquisition. FedEx Services segment 2008 operating expenses include a charge of $891 million, predominantly related to impairment charges associated with intangible assets from the Kinko’s acquisition. The normal, ongoing net operating costs of the FedEx Services segment are allocated back to the transportation segments.
The following graphs for FedEx Express, FedEx Ground and the FedEx Freight LTL Group, which comprises the FedEx Freight and FedEx National LTL businesses of FedEx Freight Corporation, show selected volume statistics (in thousands) for the years ended May 31:
Average Daily LTL ShipmentsFedEx Freight LTL Group
79.7
66.7
78.2
74.4
85.0
80.0
75.0
70.0
65.0
60.02006 2007 2008 2009
FedEx Freight LTL Group
Average Daily Package Volume FedEx Express and FedEx Ground
(1)
3,404
2,815
3,1263,365
3,3763,536
3,3293,399
3,800
3,600
3,400
3,200
3,000
2,800
2,600
2,4002006 2007 2008 2009
FedEx Express FedEx Ground
(1) Package statistics do not include the operations of FedEx SmartPost.

MANAGEMENT’S DISCUSSION AND ANALYSIS
11
(1) Package statistics do not include the operations of FedEx SmartPost.
The following graphs for FedEx Express, FedEx Ground and the FedEx Freight LTL Group show selected yield statistics for the years ended May 31:
FedEx ExpressRevenue per Package – Yield
$20.72
$21.28
$22.08
$21.30
$23.00
$22.00
$21.00
$20.00
$19.002006 2007 2008 2009
FedEx Express
FedEx Ground (1)
Revenue per Package – Yield
$7.02
$7.21
$7.48
$7.70
$8.00
$7.75
$7.50
$7.25
$7.00
$6.752006 2007 2008 2009
FedEx Ground
FedEx Freight LTL GroupLTL Revenue per Hundredweight – Yield
$16.84
$18.65
$19.65$19.07
$21.00
$20.00
$19.00
$18.00
$17.00
$16.00
$15.002006 2007 2008 2009
FedEx Freight LTL Group
OverviewGlobal economic conditions deteriorated significantly during 2009, resulting in lower revenue and earnings. Our results for 2009 refl ect reduced demand for most of our services, particularly at our FedEx Express and FedEx Freight segments. Business and consumer spending, a key driver of volumes shipped across our networks, contracted signifi cantly in 2009. Declines in U.S. domes-tic volumes at FedEx Express were partially mitigated by the exit of a key competitor (DHL) from the market, as we gained approxi-mately half of this competitor’s total U.S. domestic shipments. While we acquired signifi cant volumes from this competitor, these shipments generally were at lower weights and yields than our other volumes. We experienced the weakest LTL freight environ-ment in decades, resulting in an extraordinary decline in demand for our LTL freight services, although we were able to maintain our market share. FedEx Express package yields and FedEx Freight LTL Group yields were negatively impacted by a more competitive pricing environment, as competitors are seeking to protect market share and sustain operations during the current recession.
In response to weak business conditions, we implemented several actions in 2009 to lower our cost structure, including base salary reductions for U.S. salaried personnel effective January 1, 2009,
a suspension of 401(k) company-matching contributions effective February 1, 2009, elimination of variable compensation payouts, implementation of a hiring freeze and signifi cant volume-related reductions in labor hours and line-haul expenses. In addition, we have exercised stringent control over discretionary spending, such as travel, entertainment and professional fees. Further, we optimized our networks by adjusting routes and equipment types, temporarily idling equipment, consolidating facilities and defer-ring facility expansions and aircraft purchases to better match current demand levels. These cost-reduction activities partially mitigated the impact of the weak global economy on our results for 2009. Rapidly declining fuel costs during 2009 and the timing lag between such declines and adjustments to our fuel surcharges provided a signifi cant benefi t to our results, predominantly at FedEx Express and FedEx Ground.
Our operating results for 2009 were negatively impacted by fourth quarter charges of $1.2 billion ($1.1 billion, net of tax, or $3.45 per diluted share), related primarily to the impairment of goodwill related to the Kinko’s and Watkins Motor Lines acquisitions and certain aircraft-related assets at FedEx Express (described below).
FEDEX CORPORATION
12
In addition, at May 31, 2009, in accordance with the provisions of Financial Accounting Standards Board (“FASB”) Statement of Financial Accounting Standards (“SFAS”) 158, “Employers’ Accounting for Defi ned Benefi t Pension and Other Postretirement Plans,” we recorded a decrease to equity through other compre-hensive income (“OCI”) of $1.2 billion (net of tax) based primarily on mark-to-market adjustments related to unrealized losses in our pension plan assets during 2009.
In 2008, the combination of record high fuel prices and the weak U.S. economy signifi cantly impacted our profi tability. Persistently higher fuel prices and the related impact on our fuel surcharges reduced demand for our services, particularly U.S. domestic express package and LTL freight services, and pressured over-all yield growth across our transportation segments. In addition, our operating results for 2008 included a charge of $891 million, predominantly related to impairment charges associated with intangible assets from the Kinko’s acquisition. Lower variable incentive compensation, reduced retirement plans costs and cost-containment activities partially mitigated the impact of higher net fuel costs and the weak U.S. economy on our 2008 overall results.
RevenueRevenues decreased during 2009 due to significantly lower volumes at FedEx Express and the FedEx Freight LTL Group as a result of reduced demand and lower yields resulting from an aggressive pricing environment. At FedEx Express, FedEx International Priority® package (“IP”) volume declined in every major region of the world, although the rate of decline began to slow late in 2009. Reductions in U.S. domestic package and freight volumes at FedEx Express also contributed to the revenue decrease during 2009. However, declines in U.S. domestic pack-age volumes were partially offset by volumes gained from DHL’s exit from the U.S. market. These volume decreases were partially offset by yield increases in FedEx Express freight services driven by higher base rates and higher fuel surcharges in the fi rst half of 2009. FedEx Freight LTL Group volumes decreased as a result of the recession despite maintaining market share. Within our FedEx Ground segment, volumes increased during 2009 due to market share gains, including volumes gained from DHL, and FedEx Express customers who chose to use our more economi-cal ground delivery services in light of the recession.
Revenue growth for 2008 was primarily attributable to continued growth in international services at FedEx Express, increases in FedEx Express U.S. domestic package yields and volume growth at FedEx Ground. Higher fuel surcharges were the key driver of increased yields in our transportation segments in 2008. Additionally, FedEx Express international yields benefi ted from favorable currency exchange rates. Revenue growth for 2008 also improved due to a full year of operations for businesses acquired in 2007 at FedEx Express and FedEx Freight. Revenue growth during 2008 was partially offset by reduced U.S. domestic express volumes as a result of the ongoing weak U.S. economy. The impact of the weak U.S. economy became progressively worse during the year and drove U.S. domestic express shipping volumes to pre-2000 levels during the fourth quarter of 2008.
Impairment and Other ChargesDuring the fourth quarter of 2009, we took actions in addition to those described above to align the size of our networks to current demand levels by removing equipment and facilities from service and reducing personnel. These actions, com-bined with the impairment of goodwill related to the Kinko’s and Watkins Motor Lines acquisitions, resulted in a charge of $1.2 billion ($1.1 billion, net of tax, or $3.45 per diluted share), which is included in our operating results for the fourth quarter of 2009.
The components of the fourth quarter charge include the follow-ing (in millions):
Goodwill impairment $ 900Asset impairment 202Other charges 102 $ 1,204
The goodwill impairment charge includes an $810 million charge related to reduction of the value of the goodwill recorded as a result of the February 2004 acquisition of Kinko’s, Inc. (now known as FedEx Offi ce) and a $90 million charge related to reduction of the value of the goodwill recorded as a result of the September 2006 acquisition of the U.S. and Canadian less-than-truckload freight operations of Watkins Motor Lines and certain affi liates (now known as FedEx National LTL). The key factor contributing to the goodwill impairment was a decline in FedEx Offi ce’s and FedEx National LTL’s recent and forecasted fi nancial performance as a result of weak economic conditions.
The Watkins Motor Lines goodwill impairment charge is included in the results of the FedEx Freight segment. The Kinko’s good-will impairment charge is included in the results of the FedEx Services segment and was not allocated to our transportation segments, as the charge was unrelated to the core performance of those businesses. For additional information concerning these impairment charges, see Note 4 to the accompanying consoli-dated fi nancial statements and the Critical Accounting Estimates section of this MD&A.
We had several property and equipment impairment charges dur-ing 2009 resulting from decisions to remove assets from service due to the impact of the recession on our business, principally during the fourth quarter. The majority of our asset impairment charges during the fourth quarter of 2009 resulted from our fourth quarter decision to permanently remove from service 10 Airbus A310-200 aircraft and four Boeing MD10-10 aircraft that we own, along with certain excess aircraft engines, at FedEx Express. This decision was a result of our ongoing efforts to optimize our express network in light of continued excess aircraft capacity due to weak economic conditions and the delivery of newer, more fuel-efficient aircraft. Other charges during the fourth quarter of 2009 were primarily associated with aircraft-related lease and contract termination costs at FedEx Express and employee severance.
Our operating results for 2008 include a charge of $891 million ($696 million, net of tax, or $2.23 per diluted share) recorded during the fourth quarter, predominantly related to impairment charges associated with the decision to minimize the use of the Kinko’s trade name and goodwill resulting from the Kinko’s acquisition.

MANAGEMENT’S DISCUSSION AND ANALYSIS
13
The impairment of the Kinko’s trade name was due to the deci-sion to minimize the use of the Kinko’s trade name and rebrand the company as FedEx Offi ce over the next several years. We believe the FedEx Offi ce name better describes the wide range of services available at the company’s retail centers and takes full advantage of the FedEx brand. The goodwill impairment charge resulted from a decline in the fair value of the FedEx Office reporting unit in light of economic conditions, the unit’s recent and forecasted fi nancial performance and the decision to reduce the rate of network expansion. These 2008 impairment charges are included in operating expenses in the accompanying consoli-dated statements of income. The charges were included in the results of the FedEx Services segment and were not allocated to our transportation segments, as the charges were unrelated to the core performance of those businesses.
Operating IncomeThe following table compares operating expenses as a percent of revenue for the years ended May 31: Percent of Revenue 2009 2008 2007
Operating expenses: Salaries and employee benefi ts 38.8% 37.4% 39.0% Purchased transportation 12.8 12.2 11.3 Rentals and landing fees 6.8 6.4 6.7 Depreciation and amortization 5.6 5.1 5.0 Fuel 10.7 11.6 9.7 Maintenance and repairs 5.3 5.5 5.5 Impairment and other charges 3.4 2.3 – Other 14.5 14.0 13.5 Total operating expenses 97.9 94.5 90.7Operating margin 2.1% 5.5% 9.3%
Operating income and operating margin declined signifi cantly in 2009, as weak economic conditions drove decreases in volumes at FedEx Express and the FedEx Freight LTL Group and contributed to a more competitive pricing environment that pressured yields. The impairment and other charges described above also nega-tively impacted operating income and margin in 2009. Operating income and margin in 2009 were also negatively impacted by reduced base copy revenues and expenses associated with organizational changes at FedEx Offi ce. The cost-reduction ini-tiatives (described above) partially mitigated the negative impact of these factors.
The following graphs for our transportation segments show our average cost of jet and vehicle fuel per gallon and the year-over-year percentage change in total fuel expense for the years ended May 31:
Fuel expenses decreased 14% during 2009, primarily due to decreases in fuel consumption and the average price per gallon of fuel. Jet fuel usage decreased 9% during 2009, as we reduced fl ight hours in light of lower business levels.
Average Fuel Costper Gallon
$2.04 $2.12
$2.77$2.62$2.56 $2.65
$3.31
$3.04
$3.75
$3.25
$2.75
$2.25
$1.75
$1.252006 2007 2008 2009
JetVehicle
Year-Over-Year Percentage Change inTotal Fuel Expense
8%
29%
-14%
45%
30%
15%
0%
-15%
-30%2006/2007 2007/2008 2008/2009
Fuel Expense
MANAGEMENT’S DISCUSSION AND ANALYSIS
13
The impairment of the Kinko’s trade name was due to the deci-sion to minimize the use of the Kinko’s trade name and rebrand the company as FedEx Office over the next several years. We believe the FedEx Office name better describes the wide range of services available at the company’s retail centers and takes full advantage of the FedEx brand. The goodwill impairment charge resulted from a decline in the fair value of the FedEx Office reporting unit in light of economic conditions, the unit’s recent and forecasted financial performance and the decision to reduce the rate of network expansion. These 2008 impairment charges are included in operating expenses in the accompanying consoli-dated statements of income. The charges were included in the results of the FedEx Services segment and were not allocated to our transportation segments, as the charges were unrelated to the core performance of those businesses.
Operating IncomeThe following table compares operating expenses as a percent of revenue for the years ended May 31: Percent of Revenue 2009 2008 2007
Operating expenses: Salaries and employee benefits 38.8% 37.4% 39.0% Purchased transportation 12.8 12.2 11.3 Rentals and landing fees 6.8 6.4 6.7 Depreciation and amortization 5.6 5.1 5.0 Fuel 10.7 11.6 9.7 Maintenance and repairs 5.3 5.5 5.5 Impairment and other charges 3.4 2.3 – Other 14.5 14.0 13.5 Total operating expenses 97.9 94.5 90.7Operating margin 2.1% 5.5% 9.3%
Operating income and operating margin declined significantly in 2009, as weak economic conditions drove decreases in volumes at FedEx Express and the FedEx Freight LTL Group and contributed to a more competitive pricing environment that pressured yields. The impairment and other charges described above also nega-tively impacted operating income and margin in 2009. Operating income and margin in 2009 were also negatively impacted by reduced base copy revenues and expenses associated with organizational changes at FedEx Office. The cost-reduction ini-tiatives (described above) partially mitigated the negative impact of these factors.
The following graphs for our transportation segments show our average cost of jet and vehicle fuel per gallon and the year-over-year percentage change in total fuel expense for the years ended May 31:
Fuel expenses decreased 14% during 2009, primarily due to decreases in fuel consumption and the average price per gallon of fuel. Jet fuel usage decreased 9% during 2009, as we reduced flight hours in light of lower business levels.
Average Fuel Costper Gallon
$2.04 $2.12
$2.77$2.62$2.56 $2.65
$3.31
$3.04
$3.75
$3.25
$2.75
$2.25
$1.75
$1.252006 2007 2008 2009
JetVehicle
Year-Over-Year Percentage Change inTotal Fuel Expense
8%
29%
-14%
45%
30%
15%
0%
-15%
-30%2006/2007 2007/2008 2008/2009
Fuel Expense

FEDEX CORPORATION
14
Fuel prices decreased rapidly and signifi cantly during 2009 after peaking during the fi rst quarter, while changes in fuel surcharges for FedEx Express and FedEx Ground lagged these decreases by approximately six to eight weeks. We experienced the opposite effect during 2008, as fuel prices signifi cantly increased. This volatility in fuel prices and fuel surcharges resulted in a net ben-efi t to income in 2009, based on a static analysis of the impact to operating income of year-over-year changes in fuel prices com-pared to changes in fuel surcharges. This analysis considers the estimated benefi ts of the reduction in fuel surcharges included in the base rates charged for FedEx Express services. However, this analysis does not consider the negative effects that the signifi cantly higher fuel surcharge levels have on our business, including reduced demand and shifts by our customers to lower-yielding services. While fl uctuations in fuel surcharge rates can be signifi cant from period to period, fuel surcharges represent one of the many individual components of our pricing structure that impact our overall revenue and yield. Additional components include the mix of services purchased, the base price and extra service charges we obtain for these services and the level of pricing discounts offered. In order to provide information about the impact of fuel surcharges on the trend in revenue and yield growth, we have included the comparative fuel surcharge rates in effect for 2009, 2008 and 2007 in the accompanying discussions of each of our transportation segments.
Operating income and operating margin declined during 2008, as the weak U.S. economy and substantially higher fuel costs pres-sured volume growth at FedEx Express and the FedEx Freight LTL Group. The impairment charges at FedEx Offi ce also negatively affected operating income and margin in 2008. As described above, fuel volatility negatively affected earnings in 2008.
Operating income and margin in 2008 were also negatively impacted by increased net operating costs at FedEx Offi ce and costs of expansion of our domestic express services in China. Higher purchased transportation expenses at FedEx Ground, primarily due to costs associated with independent contractor incentive programs and higher rates paid to our contractors (including higher fuel supplement costs), also had a negative impact on 2008 results. Other operating expenses increased during 2008 primarily due to the full-year inclusion of our 2007 business acquisitions, including the consolidation of the results of our China joint venture at FedEx Express, and higher legal, consulting and insurance costs at FedEx Ground. Lower variable incentive compensation and reduced retirement plans costs, combined with cost-containment activities, partially mitigated the impact of higher net fuel costs and the weak U.S. economy on our overall results for 2008.
Other Income and ExpenseInterest expense decreased $13 million during 2009 due to increased capitalized interest primarily related to progress payments on aircraft purchases, which was partially offset by interest costs on higher debt balances. Interest income decreased $18 million during 2009, primarily due to lower inter-est rates. Net interest expense decreased $1 million during 2008 primarily due to decreased interest expense related to lower debt balances and increased capitalized interest. The 2008 decrease in interest expense was partially offset by decreased interest income due to lower cash balances.
Income TaxesOur effective tax rates of 85.6% for 2009 and 44.2% for 2008 were signifi cantly impacted by the goodwill impairment charges related to the Kinko’s acquisition, which are not deductible for income tax purposes. Our effective tax rate was 37.3% in 2007, which was favorably impacted by the conclusion of various state and federal audits and appeals. The 2007 rate reduction was partially offset by tax charges incurred as a result of a reorganization in Asia associated with our acquisition in China. For 2010, we expect our effective tax rate to be between 38% and 39%. The actual rate, however, will depend on a number of factors, including the amount and source of operating income. Additional information on income taxes, including our effec-tive tax rate reconciliation and liabilities recorded under FASB Interpretation No. (“FIN”) 48, “Accounting for Uncertainty in Income Taxes,” can be found in Note 11 of the accompanying consolidated fi nancial statements.

MANAGEMENT’S DISCUSSION AND ANALYSIS
15
These acquisitions expanded our portfolio of services to include long-haul LTL freight services and domestic express services in the United Kingdom and China. See Note 3 of the accompa-nying consolidated fi nancial statements for further information about these acquisitions. We paid the purchase price for these acquisitions from available cash balances, which included the net proceeds from our $1 billion senior unsecured debt offer-ing completed during 2007. During 2009, 2008 and 2007, we also made other immaterial acquisitions that are not presented in the table above.
Employees Under Collective Bargaining ArrangementsThe pilots of FedEx Express, who represent a small percent-age of our total employees, are employed under a collective bargaining agreement. During the second quarter of 2007, the pilots ratifi ed a new four-year labor contract that included signing bonuses and other upfront compensation of $143 million, as well as pay increases and other benefi t enhancements. These costs were partially mitigated by reductions in the variable incentive compensation of our other employees. The effect of this new agreement on second quarter 2007 net income was $78 million net of tax, or $0.25 per diluted share.
OutlookWe expect continued softness in demand for our services in 2010, as shipping volumes are expected to remain relatively fl at as the global recession persists, particularly in the fi rst half of 2010. Our results for the fi rst half of 2009 included the benefi t of signifi -cantly stronger economic activity and rapidly declining fuel costs, creating diffi cult year-over-year comparisons. The timing and pace of any economic recovery is diffi cult to predict, and our outlook for 2010 refl ects our expectations for continued chal-lenges in growing volume and yield in this environment. Revenues in 2010 are expected to be negatively impacted by lower yields resulting from lower fuel surcharges due to more stable fuel prices and an aggressive pricing environment for our services. We anticipate volume growth at the FedEx Ground segment due to continued market share gains and fl at volumes at the FedEx Express segment for 2010. Further, we expect LTL shipments to decrease for 2010 due to the continued excess capacity in this market. However, if excess capacity exits the LTL industry in 2010, we have the network, resources and capabilities to manage any resulting incremental volumes. Despite the benefi t of numerous cost-reduction activities in 2009 (described above), earnings in 2010 will be negatively impacted by lower revenues as a result of the yield and volume pressures described above. If economic conditions deteriorate further, additional actions will be necessary to reduce the size of our networks. However, we will not compromise our outstanding service levels or take actions that negatively impact the customer experience in exchange for short-term cost reductions.
Our capital expenditures for 2010 are expected to be approxi-mately $2.6 billion, as we will continue to balance the need to control spending with the opportunity to make investments with high returns, such as in substantially more fuel-effi cient Boeing 757 (“B757”) and Boeing 777 Freighter (“B777F”) aircraft. Moreover, we will continue to invest in critical long-term strategic projects focused on enhancing and broadening our service offer-ings to position us for stronger growth under improved economic conditions. However, we could reduce 2010 capital expenditures should conditions worsen. For additional details on key 2010 capi-tal projects, refer to the Liquidity Outlook section of this MD&A.
All of our businesses operate in a competitive pricing environ-ment, exacerbated by continuing volatile fuel prices, which impact our fuel surcharge levels. Historically, our fuel surcharges have largely offset incremental fuel costs; however, volatility in fuel costs may impact earnings because adjustments to our fuel surcharges lag changes in actual fuel prices paid. Therefore, the trailing impact of adjustments to our fuel surcharges can signifi cantly affect our earnings either positively or negatively in the short-term.
As described in Note 17 of the accompanying consolidated fi nancial statements and the “Independent Contractor Matters” section of our FedEx Ground segment MD&A, we are involved in a number of litigation matters and other proceedings that challenge the status of FedEx Ground’s owner-operators as independent contractors. FedEx Ground anticipates continuing changes to its relationships with its contractors. The nature, tim-ing and amount of any changes are dependent on the outcome of numerous future events. We cannot reasonably estimate the potential impact of any such changes or a meaningful range of potential outcomes, although they could be material. However, we do not believe that any such changes will impair our ability to operate and profi tably grow our FedEx Ground business.
See “Risk Factors” for a discussion of these and other poten-tial risks and uncertainties that could materially affect our future performance.
Business AcquisitionsDuring 2007, we made the following acquisitions: Purchase PriceSegment Business Acquired Rebranded Date Acquired (in millions)
FedEx Freight Watkins Motor Lines FedEx National LTL September 3, 2006 $787FedEx Express ANC Holdings Ltd. FedEx U.K. December 16, 2006 241FedEx Express Tianjin Datian W. Group Co., Ltd. (“DTW Group”) N/A March 1, 2007 427

FEDEX CORPORATION
16
Seasonality of BusinessOur businesses are seasonal in nature. Seasonal fl uctuations affect volumes, revenues and earnings. Historically, the U.S. express package business experiences an increase in volumes in late November and December. International business, particu-larly in the Asia-to-U.S. market, peaks in October and November in advance of the U.S. holiday sales season. Our fi rst and third fi scal quarters, because they are summer vacation and post win-ter-holiday seasons, have historically experienced lower volumes relative to other periods. Normally, the fall is the busiest shipping period for FedEx Ground, while late December, June and July are the slowest periods. For the FedEx Freight LTL Group, the spring and fall are the busiest periods and the latter part of December, January and February are the slowest periods. For FedEx Offi ce, the summer months are normally the slowest periods. Shipment levels, operating costs and earnings for each of our companies can also be adversely affected by inclement weather, particularly in our third fi scal quarter.
NEW ACCOUNTING PRONOUNCEMENTSNew accounting rules and disclosure requirements can signifi cantly impact our reported results and the comparability of our financial statements. We believe the following new accounting pronouncements are relevant to the readers of our fi nancial statements.
On May 31, 2007, we adopted SFAS 158. SFAS 158 requires recog-nition in the balance sheet of the funded status of defi ned benefi t pension and other postretirement benefi t plans, and the recogni-tion in OCI of unrecognized gains or losses and prior service costs or credits. The adoption of SFAS 158 resulted in a $982 million charge to shareholders’ equity at May 31, 2007 through accumu-lated other comprehensive income (“AOCI”).
Additionally, SFAS 158 requires the measurement date for plan assets and liabilities to coincide with the plan sponsor’s year end. On June 1, 2008, we made our transition election for the measurement date provision of SFAS 158 using the two-measure-ment approach. Under this approach, we completed two actuarial measurements, one at February 29, 2008 and the other at June 1, 2008. This approach required us to record the net periodic benefi t cost for the transition period from March 1, 2008 through May 31, 2008 as an adjustment to beginning retained earnings ($44 million, net of tax) and actuarial gains and losses for the period (a gain of $372 million, net of tax) as an adjustment to the open-ing balance of AOCI. These adjustments increased the amount recorded for our pension assets by $528 million. Our actuarial gains resulted primarily from a 19-basis-point increase in the discount rate for our primary pension plan and an increase in plan assets at June 1, 2008. For additional information on the adop-tion of SFAS 158, see Note 12 to the accompanying consolidated fi nancial statements.
On June 1, 2008, we adopted SFAS 157, “Fair Value Measurements,” which provides a common defi nition of fair value, establishes a uniform framework for measuring fair value and requires expanded disclosures about fair value measurements. There is a one-year deferral of the adoption of the standard as it relates to nonfi nancial assets and liabilities. Therefore, the adoption of SFAS 157 had no impact on our fi nan-cial statements at June 1, 2008.
In December 2007, the FASB issued SFAS 141R, “Business Combinations,” and SFAS 160, “Noncontrolling Interests in Consolidated Financial Statements, an amendment of Accounting Research Bulletin (“ARB”) No. 51.” These new standards sig-nifi cantly change the accounting for and reporting of business combination transactions, including noncontrolling interests (previously referred to as minority interests). For example, these standards require the acquiring entity to recognize the full fair value of assets acquired and liabilities assumed in the transaction and require the expensing of most transaction and restructuring costs. Both standards are effective for us beginning June 1, 2009 (fi scal 2010) and are applicable only to transactions occurring after the effective date.
In December 2008, the FASB issued FASB Staff Position (“FSP”) 132(R)-1, “Employers’ Disclosures about Postretirement Benefi t Plan Assets.” This FSP provides guidance on the objectives an employer should consider when providing detailed disclosures about assets of a defi ned benefi t pension plan or other postre-tirement plan. These disclosure objectives include investment policies and strategies, categories of plan assets, signifi cant concentrations of risk and the inputs and valuation techniques used to measure the fair value of plan assets. This FSP will be effective for our fi scal year ending May 31, 2010.
In April 2009, the FASB issued FSP No. 107-1 and Accounting Principles Board Opinion (“APB”) No. 28-1, “Interim Disclosures about Fair Value of Financial Instruments.” This FSP and APB amends SFAS 107, “Disclosures about Fair Value of Financial Instruments,” to require disclosures about the fair value of fi nan-cial instruments for interim reporting periods in addition to annual reporting periods. This FSP and APB will be effective for our fi rst quarter of fi scal year 2010.
In May 2009, the FASB issued SFAS No. 165, “Subsequent Events,” which establishes general standards of accounting for and disclosures of events that occur after the balance sheet date but before fi nancial statements are issued or are available to be issued. This standard will require us to disclose the date through which we have evaluated subsequent events and the basis for that date. This standard will be effective for our fi rst quarter of fi scal year 2010.

MANAGEMENT’S DISCUSSION AND ANALYSIS
17
REPORTABLE SEGMENTSFedEx Express, FedEx Ground and the FedEx Freight LTL Group represent our major service lines and, along with FedEx Services, form the core of our reportable segments. Our reportable seg-ments as of May 31, 2009 included the following businesses:
FedEx Express Segment FedEx Express (express transportation)
FedEx Trade Networks (global trade services)
FedEx Ground Segment FedEx Ground (small-package ground delivery)
FedEx SmartPost (small-parcel consolidator) FedEx Freight Segment FedEx Freight LTL Group: FedEx Freight (regional LTL freight transportation) FedEx National LTL (long-haul LTL freight transportation) FedEx Custom Critical (time-critical transportation) Caribbean Transportation Services (airfreight forwarding)
FedEx Services Segment FedEx Services (sales, marketing and information technology functions)
FedEx Offi ce (document and business services and package acceptance)
FedEx Customer Information Services (“FCIS”) (customer service, billings and collections)
FedEx Global Supply Chain Services (logistics services)
Effective June 1, 2009, Caribbean Transportation Services, Inc. (“CTS”), a business in the FedEx Freight segment, was integrated into FedEx Express to leverage synergies between CTS and FedEx Express and to gain cost effi ciencies by maximizing the use of FedEx Express assets for this service offering.
FEDEX SERVICES SEGMENTThe FedEx Services segment includes: FedEx Services, which pro-vides sales, marketing and information technology support to our other companies; FCIS, which is responsible for customer service, billings and collections for FedEx Express and FedEx Ground U.S. customers; FedEx Global Supply Chain Services, which provides a range of logistics services to our customers; and FedEx Offi ce, which provides retail access to our customers for our package transportation businesses and an array of document and busi-ness services.
The costs of the sales, marketing and information technology support provided by FedEx Services and the customer service functions of FCIS, together with the normal, ongoing net oper-ating costs of FedEx Global Supply Chain Services and FedEx Offi ce, are allocated primarily to the FedEx Express and FedEx Ground segments based on metrics such as relative revenues or estimated services provided. We believe these allocations approximate the net cost of providing these functions. The $810 million fourth quarter 2009 impairment charge for the Kinko’s goodwill and the $891 million 2008 charge predominantly associated with impairment charges for the Kinko’s trade name and goodwill were not allocated to the FedEx Express or FedEx Ground segments, as the charges were unrelated to the core performance of those businesses.
FedEx Services segment revenues, which reflect the opera-tions of FedEx Offi ce and FedEx Global Supply Chain Services, decreased 8% during 2009. Revenue generated from new FedEx Offi ce locations added in 2008 and 2009 did not offset declines in base copy revenues, incremental operating costs associated with the new locations and expenses associated with organizational changes. Therefore, the allocated net operating costs of FedEx Offi ce increased during 2009 despite ongoing cost management efforts. In September 2008, FedEx Offi ce began implementation of organizational changes intended to improve profi tability and enhance the customer experience.
The operating expenses line item “Intercompany charges” on the accompanying unaudited fi nancial summaries of our trans-portation segments includes the allocations from the FedEx Services segment to the respective transportation segments. The “Intercompany charges” caption also includes allocations for administrative services provided between operating com-panies and certain other costs such as corporate management fees related to services received for general corporate oversight, including executive offi cers and certain legal and fi nance func-tions. Management evaluates transportation segment fi nancial performance based on operating income.
OTHER INTERSEGMENT TRANSACTIONSCertain FedEx operating companies provide transportation and related services for other FedEx companies outside their report-able segment. Billings for such services are based on negotiated rates, which we believe approximate fair value, and are refl ected as revenues of the billing segment. These rates are adjusted from time to time based on market conditions. Such intersegment rev-enues and expenses are eliminated in the consolidated results and are not separately identifi ed in the following segment infor-mation, as the amounts are not material.

FEDEX CORPORATION
18
FEDEX EXPRESS SEGMENTThe following table compares revenues, operating expenses, operating income and operating margin (dollars in millions) for the years ended May 31: Percent Change 2009/ 2008/ 2009 2008 2007 2008 2007
Revenues: Package: U.S. overnight box $ 6,074 $ 6,578 $ 6,485 (8) 1 U.S. overnight envelope 1,855 2,012 1,990 (8) 1 U.S. deferred 2,789 2,995 2,883 (7) 4 Total U.S. domestic package revenue 10,718 11,585 11,358 (7) 2 International Priority (IP) 6,978 7,666 6,722 (9) 14 International domestic (1) 565 663 370 (15) 79 Total package revenue 18,261 19,914 18,450 (8) 8 Freight: U.S. 2,165 2,398 2,412 (10) (1) International Priority Freight 1,104 1,243 1,045 (11) 19 International airfreight 369 406 394 (9) 3 Total freight revenue 3,638 4,047 3,851 (10) 5 Other (2) 465 460 380 1 21 Total revenues 22,364 24,421 22,681 (8) 8
Operating expenses: Salaries and employee benefi ts 8,217 8,451 8,234(4) (3) 3 Purchased transportation 1,112 1,208 1,098 (8) 10 Rentals and landing fees 1,613 1,673 1,610 (4) 4 Depreciation and amortization 961 944 856 2 10 Fuel 3,281 3,785 2,946 (13) 28 Maintenance and repairs 1,351 1,512 1,444 (11) 5 Impairment and other charges 260 (3) – – NM – Intercompany charges 2,103 2,134 2,046 (1) 4 Other 2,672 2,813 2,456 (5) 15 Total operating expenses 21,570 22,520 20,690 (4) 9Operating income $ 794 $ 1,901 $ 1,991 (58) (5)Operating margin 3.6% 7.8% 8.8% (420)bp (100)bp(1) International domestic revenues include our international domestic express operations, primarily in the United Kingdom, Canada, China and India. We reclassifi ed the prior period international domestic revenues previously included within other revenues to conform to the current period presentation.(2) Other revenues includes FedEx Trade Networks. (3) Represents charges associated with aircraft-related asset impairments and other charges primarily associated with aircraft-related lease and contract termination costs and employee severance.(4) Includes a charge of $143 million for signing bonuses and other upfront compensation associated with a four-year labor contract with our pilots.
The following table compares selected statistics (in thousands, except yield amounts) for the years ended May 31: Percent Change 2009/ 2008/ 2009 2008 2007 2008 2007
Package Statistics (1)
Average daily package volume (ADV): U.S. overnight box 1,127 1,151 1,174 (2) (2) U.S. overnight envelope 627 677 706 (7) (4) U.S. deferred 849 895 898 (5) – Total U.S. domestic ADV 2,603 2,723 2,778 (4) (2) IP 475 517 487 (8) 6 International domestic (2) 298 296 134 1 121 Total ADV 3,376 3,536 3,399 (5) 4
Revenue per package (yield): U.S. overnight box $ 21.21 $ 22.40 $ 21.66 (5) 3 U.S. overnight envelope 11.65 11.66 11.06 – 5 U.S. deferred 12.94 13.12 12.59 (1) 4 U.S. domestic composite 16.21 16.68 16.04 (3) 4 IP 57.81 58.11 54.13 (1) 7 International domestic (2) 7.50 8.80 10.77 (15) (18) Composite package yield 21.30 22.08 21.28 (4) 4
Freight Statistics (1)
Average daily freight pounds: U.S. 7,287 8,648 9,569 (16) (10) International Priority Freight 1,959 2,220 1,878 (12) 18 International airfreight 1,475 1,817 1,831 (19) (1) Total average daily freight pounds 10,721 12,685 13,278 (15) (4)
Revenue per pound (yield): U.S. $ 1.17 $ 1.09 $ 0.99 7 10 International Priority Freight 2.22 2.20 2.18 1 1 International airfreight 0.99 0.88 0.84 13 5 Composite freight yield 1.34 1.25 1.14 7 10(1) Package and freight statistics include only the operations of FedEx Express.(2) International domestic statistics include our international domestic express operations, primarily in the United Kingdom, Canada, China and India.
FEDEX CORPORATION
18
FEDEX EXPRESS SEGMENTThe following table compares revenues, operating expenses, operating income and operating margin (dollars in millions) for the years ended May 31: Percent Change 2009/ 2008/ 2009 2008 2007 2008 2007
Revenues: Package: U.S. overnight box $ 6,074 $ 6,578 $ 6,485 (8) 1 U.S. overnight envelope 1,855 2,012 1,990 (8) 1 U.S. deferred 2,789 2,995 2,883 (7) 4 Total U.S. domestic package revenue 10,718 11,585 11,358 (7) 2 International Priority (IP) 6,978 7,666 6,722 (9) 14 International domestic (1) 565 663 370 (15) 79 Total package revenue 18,261 19,914 18,450 (8) 8 Freight: U.S. 2,165 2,398 2,412 (10) (1) International Priority Freight 1,104 1,243 1,045 (11) 19 International airfreight 369 406 394 (9) 3 Total freight revenue 3,638 4,047 3,851 (10) 5 Other (2) 465 460 380 21 Total revenues 22,364 24,421 22,681 (8) 8
Operating expenses: Salaries and employee benefits 8,217 8,451 8,234(4) (3) 3 Purchased transportation 1,112 1,208 1,098 (8) 10 Rentals and landing fees 1,613 1,673 1,610 (4) 4 Depreciation and amortization 961 944 856 2 10 Fuel 3,281 3,785 2,946 (13) 28 Maintenance and repairs 1,351 1,512 1,444 (11) 5 Impairment and other charges 260 (3) – – NM – Intercompany charges 2,103 2,134 2,046 (1) 4 Other 2,672 2,813 2,456 (5) 15 Total operating expenses 21,570 22,520 20,690 (4) 9Operating income $ 794 $ 1,901 $ 1,991 (58) (5)Operating margin 3.6% 7.8% 8.8% (420)bp (100)bp(1) International domestic revenues include our international domestic express operations, primarily in the United Kingdom, Canada, China and India. We reclassified the prior period international domestic revenues previously included within other revenues to conform to the current period presentation.(2) Other revenues includes FedEx Trade Networks. (3) Represents charges associated with aircraft-related asset impairments and other charges primarily associated with aircraft-related lease and contract termination costs and employee severance.(4) Includes a charge of $143 million for signing bonuses and other upfront compensation associated with a four-year labor contract with our pilots.
The following table compares selected statistics (in thousands, except yield amounts) for the years ended May 31: Percent Change 2009/ 2008/ 2009 2008 2007 2008 2007
Package Statistics (1)
Average daily package volume (ADV): U.S. overnight box 1,127 1,151 1,174 (2) (2) U.S. overnight envelope 627 677 706 (7) (4) U.S. deferred 849 895 898 (5) – Total U.S. domestic ADV 2,603 2,723 2,778 (4) (2) IP 475 517 487 (8) 6 International domestic (2) 298 296 134 1 121 Total ADV 3,376 3,536 3,399 (5) 4
Revenue per package (yield): U.S. overnight box $ 21.21 $ 22.40 $ 21.66 (5) 3 U.S. overnight envelope 11.65 11.66 11.06 – 5 U.S. deferred 12.94 13.12 12.59 (1) 4 U.S. domestic composite 16.21 16.68 16.04 (3) 4 IP 57.81 58.11 54.13 (1) 7 International domestic (2) 7.50 8.80 10.77 (15) (18) Composite package yield 21.30 22.08 21.28 (4) 4
Freight Statistics (1)
Average daily freight pounds: U.S. 7,287 8,648 9,569 (16) (10) International 1,959 2,220 1,878 (12) 18 International airfreight 1,475 1,817 1,831 (19) (1) Total average daily freight pounds 10,721 12,685 13,278 (15) (4)
Revenue per pound (yield): U.S. $ 1.17 $ 1.09 $ 0.99 7 10 International 2.22 2.20 2.18 1 1 International airfreight 0.99 0.88 0.84 13 5 Composite freight yield 1.34 1.25 1.14 7 10(1) Package and freight statistics include only the operations of FedEx Express.(2) International domestic statistics include our international domestic express operations, primarily in the United Kingdom, Canada, China and India.
Priority Freight
Priority Freight
1

MANAGEMENT’S DISCUSSION AND ANALYSIS
19
FedEx Express Segment RevenuesFedEx Express segment revenues decreased 8% in 2009 due to a decrease in volumes in virtually all services as a result of the signifi cant deterioration in global economic conditions and lower yields driven by unfavorable exchange rates, lower package weights and a more competitive pricing environment. IP volume declined in every major region of the world. During 2009, volume gains resulting from DHL’s exit from the U.S. domestic market were not enough to offset the negative impact of weak global economic conditions. While we acquired signifi cant volumes from this competitor, these shipments were generally at lower weights and yields than our other volumes.
The decrease in composite package yield in 2009 was driven by decreases in U.S. domestic package, international domes-tic and IP yields. U.S. domestic package yield decreased 3% in 2009 due to lower package weights and a lower rate per pound. International domestic yield decreased 15% during 2009 due to unfavorable exchange rates and a lower rate per pound. IP yield decreased 1% during 2009 due to unfavorable exchange rates and lower package weights, partially offset by a higher rate per pound. Composite freight yield increased in 2009 due to general rate increases and higher fuel surcharges.
FedEx Express revenues increased in 2008 primarily due to increases in fuel surcharges, growth in IP volume and the impact of favorable currency exchange rates. Revenue increases during 2008 were partially offset by decreased volumes in U.S. domestic package and freight services, as the weak U.S. economy and persistently higher fuel prices and the related impact on our fuel surcharges restrained demand for these services.
The increase in composite package yield in 2008 was driven by increases in IP and U.S. domestic yields, partially offset by decreased international domestic yield. IP yield increased in 2008, primarily due to favorable exchange rates, higher fuel surcharges and increases in package weights. U.S. domestic package yield increased in 2008 primarily due to higher fuel surcharges and general rate increases. International domestic yield decreased during 2008 as a result of the inclusion of lower-yielding services from the companies acquired in 2007. Composite freight yield increased in 2008 due to the impact of changes in service mix, higher fuel surcharges and favorable exchange rates.
IP volume growth during 2008 resulted from increased demand in Asia, U.S. outbound and Europe. Increased international domestic volumes during 2008 were driven by business acquisitions in the second half of 2007. U.S. domestic package and freight volumes decreased during 2008, as the weak U.S. economy and rising fuel prices negatively impacted demand for these services.
In January 2009 and 2008, we implemented a 6.9% average list price increase on FedEx Express U.S. domestic and U.S. outbound package and freight shipments and made various changes to other surcharges, while we lowered our fuel surcharge index by two percentage points. Our fuel surcharges are indexed to the spot price for jet fuel. Using this index, the U.S. domestic and outbound fuel surcharge and the international fuel surcharges ranged as follows, for the years ended May 31:
2009 2008 2007
U.S. Domestic and Outbound Fuel Surcharge: Low –% 13.50% 8.50% High 34.50 25.00 17.00 Weighted-Average 17.45 17.06 12.91 International Fuel Surcharges: Low – 12.00 8.50 High 34.50 25.00 17.00 Weighted-Average 16.75 16.11 12.98
FedEx Express Segment Operating IncomeThe following table compares operating expenses as a percent of revenue for the years ended May 31: Percent of Revenue 2009 2008 2007
Operating expenses: Salaries and employee benefi ts 36.7% 34.6% 36.3% (2) Purchased transportation 5.0 4.9 4.8 Rentals and landing fees 7.2 6.9 7.1 Depreciation and amortization 4.3 3.9 3.8 Fuel 14.7 15.5 13.0 Maintenance and repairs 6.0 6.2 6.4 Impairment and other charges 1.2 (1) – –
Intercompany charges 9.4 8.7 9.0 Other 11.9 11.5 10.8 Total operating expenses 96.4 92.2 91.2 Operating margin 3.6% 7.8% 8.8% (1) Includes a charge of $260 million related to impairment charges associated with aircraft-related assets and other charges primarily associated with aircraft-related lease and contract termination costs and employee severance.(2) Includes a charge of $143 million for signing bonuses and other upfront compensation associated with a four-year labor contract with our pilots.
FedEx Express segment operating income and operating margin declined in 2009 as a result of the continued weak global econ-omy and high fuel prices in the fi rst half of 2009, both of which limited demand for our U.S. domestic package and IP services.
During 2009, in response to weak business conditions, we imple-mented several actions (in addition to those described above in the Overview section) to lower our cost structure, including signifi cant volume-related reductions in fl ight hours. We also low-ered fuel consumption and maintenance costs, as we temporarily grounded a limited number of aircraft due to excess capacity in the current economic environment. Our cost-containment activi-ties also included deferral of merit-based pay increases. All of these actions partially mitigated the impact of lower volumes on our results.
During the fourth quarter of 2009, we took additional actions to align the size of our networks to current demand levels by remov-ing equipment and facilities from service and reducing personnel. As a result of these actions, we recorded charges of $199 million for the impairment of certain aircraft and aircraft engines and $57 million for aircraft-related lease and contract termination and employee severance costs related to workforce reductions.

FEDEX CORPORATION
20
Fuel costs decreased 13% in 2009 due to decreases in fuel consumption and the average price per gallon of fuel. Fuel sur-charges were suffi cient to offset fuel costs for 2009, based on a static analysis of the impact to operating income of the year-over-year changes in fuel prices compared to changes in fuel surcharges. This analysis considers the estimated benefits of the reduction in fuel surcharges included in the base rates charged for FedEx Express services. However, this analysis does not consider the negative effects that the signifi cantly higher fuel surcharge levels have on our business, including reduced demand and shifts to lower-yielding services. Maintenance and repairs expense decreased 11% primarily due to a volume-related reduction in flight hours and the permanent and temporary grounding of certain aircraft due to excess capacity in the current economic environment.
Operating results for 2008 were negatively impacted by record high fuel prices, the continued weak U.S. economy and our continued investment in domestic express services in China. However, revenue growth in IP services, reduced retirement plan costs, the favorable impact of foreign currency exchange rates and lower variable incentive compensation partially offset the impact of these factors on operating income during 2008.
Fuel costs increased in 2008 due to an increase in the average price per gallon of fuel. The volatility in fuel prices and fuel sur-charges resulted in a net benefi t to income in 2008, based on a static analysis of the year-over-year changes in fuel prices com-pared to changes in fuel surcharges. This analysis considers the estimated benefi ts of the reduction in fuel surcharges included in the base rates charged for FedEx Express services.
Other operating expenses increased during 2008 principally due to the inclusion of our 2007 business acquisitions, including the full consolidation of the results of our China joint venture. Purchased transportation costs increased in 2008 primarily due to the inclusion of our 2007 business acquisitions, the impact of higher fuel costs and IP volume growth, which requires a higher utilization of contract pickup and delivery services. These increases in purchased transportation costs were partially offset by the elimination of payments by us for pickup and delivery ser-vices provided by our former China joint venture partner, as we acquired this business in the second half of 2007. The increase in depreciation expense during 2008 was principally due to aircraft purchases and our 2007 business acquisitions. Intercompany charges increased during 2008 primarily due to increased net operating costs at FedEx Offi ce associated with declines in copy revenues, as well as higher expenses associated with store expansion, advertising and promotions, and service improvement activities. This increase was partially offset by lower allocated fees from FedEx Services due to cost-containment activities.
FedEx Express Segment OutlookWe expect revenues to decline at FedEx Express in 2010 as a result of signifi cantly lower fuel surcharges and the ongoing global recession. U.S. domestic and IP package volumes are expected to be fl at, and yields are expected to be negatively impacted by a competitive pricing environment and the ongoing global recession.
FedEx Express segment operating income and operating margin are expected to increase slightly in 2010. We expect the full year impact of actions taken in 2009 to lower our cost structure, com-bined with additional cost-containment initiatives in 2010, will be mostly offset by a signifi cant decline in revenues.
Capital expenditures at FedEx Express are expected to increase in 2010 driven by incremental investments for the new B777F aircraft, the fi rst of which is expected to enter revenue service in 2010. These aircraft capital expenditures are necessary to achieve signifi cant long-term operating savings and to support projected long-term international volume growth.
FEDEX GROUND SEGMENTThe following table compares revenues, operating expenses, operating income and operating margin (dollars in millions) and selected package statistics (in thousands, except yield amounts) for the years ended May 31: Percent Change 2009/ 2008/ 2009 2008 2007 2008 2007
Revenues $ 7,047 $ 6,751 $ 6,043 4 12Operating expenses: Salaries and employee benefi ts 1,102 1,073 1,006 3 7 Purchased transportation (1) 2,918 2,878 2,430 1 18 Rentals 222 189 166 17 14 Depreciation and amortization 337 305 268 10 14 Fuel (1) 9 14 13 (36) 8 Maintenance and repairs 147 145 134 1 8 Intercompany charges 710 658 569 8 16 Other 795 753 635 6 19 Total operating expenses 6,240 6,015 5,221 4 15Operating income $ 807 $ 736 $ 822 10 (10)Operating margin 11.5% 10.9% 13.6% 60bp Average daily package volume: FedEx Ground 3,404 3,365 3,126 1 8 FedEx SmartPost 827 618 599 34 3Revenue per package (yield): FedEx Ground $ 7.70 $ 7.48 $ 7.21 3 4 FedEx SmartPost $ 1.81 $ 2.09 $ 1.88 (13) 11(1) We reclassifi ed certain fuel supplement costs related to our independent contractors from fuel expense to purchased transportation expense to conform to the current period presentation.
(270)bp

MANAGEMENT’S DISCUSSION AND ANALYSIS
21
FedEx Ground Segment RevenuesFedEx Ground segment revenues increased 4% in 2009 due to yield improvement at FedEx Ground and volume growth at both FedEx SmartPost and FedEx Ground. FedEx Ground volume growth during 2009 resulted from market share gains, including volumes gained from DHL’s exit from the U.S. market, and con-tinued growth in the FedEx Home Delivery service. FedEx Ground volumes also benefi ted from existing FedEx Express customers’ opting for lower-cost FedEx Ground offerings. Yield improvement at FedEx Ground during 2009 was primarily due to higher base rates (partially offset by higher customer discounts), increased extra service revenue and higher fuel surcharges.
FedEx SmartPost picks up shipments from customers and deliv-ers them to various points within the United States Postal Service (“USPS”) network for fi nal delivery. FedEx SmartPost revenue and yield represent the amount charged to customers net of post-age paid to the USPS. FedEx SmartPost volume growth during 2009 resulted from market share gains, including volumes gained from DHL’s exit from the U.S. market. Yields at FedEx SmartPost decreased 13% during 2009 due to changes in customer and service mix.
FedEx Ground segment revenues increased during 2008 due to volume and yield growth. Volume growth at FedEx Ground resulted from market share gains and the customer appeal of our cost-effective alternative to overnight air delivery services. Average daily volumes at FedEx Ground increased during 2008 due to increased commercial business and the continued growth of our FedEx Home Delivery service. Yield improvement during 2008 was primarily due to the impact of general rate increases, higher extra service revenue (primarily through our residential, additional handling and large package surcharges) and higher fuel surcharges, partially offset by higher customer discounts and a lower average weight and zone per package.
In January 2009, we implemented a 5.9% average list price increase and made various changes to other surcharges on FedEx Ground shipments. In January 2008, we implemented a 4.9% average list price increase and made various changes to other surcharges on FedEx Ground shipments. The FedEx Ground fuel surcharge is based on a rounded average of the national U.S. on-highway average prices for a gallon of diesel fuel, as pub-lished by the Department of Energy. Our fuel surcharge ranged as follows for the years ended May 31: 2009 2008 2007
Low 2.25% 4.50% 3.50% High 10.50 7.75 5.25 Weighted-Average 6.61 5.47 4.18
FedEx Ground Segment Operating IncomeThe following table compares operating expenses as a percent of revenue for the years ended May 31: Percent of Revenue 2009 2008 2007
Operating expenses: Salaries and employee benefi ts 15.6% 15.9% 16.7% Purchased transportation 41.4 42.6 40.2 Rentals 3.1 2.8 2.8 Depreciation and amortization 4.8 4.5 4.4 Fuel 0.1 0.2 0.2 Maintenance and repairs 2.1 2.1 2.2 Intercompany charges 10.1 9.8 9.4 Other 11.3 11.2 10.5 Total operating expenses 88.5 89.1 86.4 Operating margin 11.5% 10.9% 13.6%
FedEx Ground segment operating income and operating margin increased during 2009 primarily due to the timing impact of fuel surcharges and yield growth. Rapidly declining fuel costs and the timing lag between such declines and adjustments to our fuel surcharges provided a signifi cant benefi t to FedEx Ground results for 2009.
Rent expense increased 17% and depreciation expense increased 10% during 2009 primarily due to higher spending on material handling equipment and facilities associated with our multi-year network expansion plan. Purchased transportation costs increased slightly in 2009 as a result of higher rates paid to our independent contractors and costs associated with our indepen-dent contractor programs (described below), partially offset by a decrease in fuel costs. The increase in salaries and employee benefi ts expense during 2009 was partially offset by the base salary reductions and suspension of 401(k) company-matching contributions described in the Overview section. Intercompany charges increased 8% during 2009 primarily due to allocated telecommunication expenses (formerly a direct charge), higher general and administrative costs and higher allocated customer service costs. Other operating expenses increased 6% during 2009 primarily due to higher reserve requirements for liability insurance. Lower legal costs, including settlements, partially offset the increase in other operating expenses in 2009.
FedEx Ground segment operating income decreased during 2008, as revenue growth was more than offset by higher independent contractor-related costs, the net impact of increased fuel costs, costs associated with our multi-year network expansion plan, higher intercompany charges and higher legal costs (including fees paid to external counsel, settlement costs and loss accruals). However, lower variable incentive compensation partially offset the net impact of these factors on operating income during 2008.

FEDEX CORPORATION
22
Purchased transportation costs increased during 2008 as a result of higher rates paid to our independent contractors (including the impact of higher fuel costs) and costs associated with our independent contractor programs (described below). Fuel sur-charges were not suffi cient to offset the effect of fuel costs on our year-over-year operating results for 2008, due to the timing lag that exists between when we purchase fuel and when our indexed fuel surcharges automatically adjust.
Intercompany charges increased during 2008 primarily due to increased net operating costs at FedEx Offi ce associated with declines in copy revenues, as well as higher expenses asso-ciated with store expansion, advertising and promotions, and service improvement activities. In addition, higher allocated sales and marketing and customer service costs from FedEx Services contributed to the increase in intercompany charges for 2008. Other operating expenses increased during 2008, primarily due to higher legal, consulting and insurance costs. Depreciation expense and rent expense increased in 2008 primarily due to higher spending on material handling equipment and facilities associated with our multi-year capacity expansion plan.
Independent Contractor MattersFedEx Ground faces increased regulatory and legal uncertainty with respect to its independent contractors. As part of its opera-tions, FedEx Ground has made changes to its relationships with contractors that, among other things, provide incentives for improved service and enhanced regulatory and other compli-ance by our contractors. During the second quarter of 2008, FedEx Ground announced an ongoing nationwide program, which provides greater incentives to certain of its contractors who choose to grow their businesses by adding routes. Also, during the second quarter of 2008, FedEx Ground offered special incentives to encourage California-based single route contrac-tors to transform their operations into multiple-route businesses or sell their routes to others.
During 2009, because of state-specific legal and regulatory issues, FedEx Ground offered special incentives to encourage each New Hampshire-based and Maryland-based single-route pickup-and-delivery contractor to assume responsibility for the pickup-and-delivery operations of an entire geographic service area that includes multiple routes. These programs were well received, and the aggregate amount of these incentives was immaterial.
As of May 31, 2009, approximately 60% of all service areas nationwide are supported by multiple-route contractors, which comprise approximately 35% of all FedEx Ground pickup-and-delivery contractors.
FedEx Ground is involved in numerous purported or certifi ed class-action lawsuits, state tax and other administrative pro-ceedings and Internal Revenue Service audits that claim or are examining whether the company’s owner-operators should be treated as employees, rather than independent contractors. For a description of these proceedings, see Note 17 of the accompany-ing consolidated fi nancial statements.
FedEx Ground Segment Outlook We expect the FedEx Ground segment to have continued revenue growth in 2010, led by increases in commercial and FedEx Home Delivery average daily volumes due to market share gains. FedEx SmartPost volumes are also expected to grow due to market share gains and the introduction of new services. Yield improve-ment at FedEx Ground is expected to be limited in 2010 as a result of a competitive pricing environment and decreases in fuel sur-charges. Yields at FedEx SmartPost are expected to decline due to service mix changes.
FedEx Ground segment operating income in 2010 is expected to increase slightly, as revenue growth will be mostly offset by costs associated with network expansion and ongoing enhancements to our independent contractor model.
Capital spending is expected to decline slightly in 2010 with the majority of our spending resulting from our continued network expansion and productivity-enhancing technologies. We are com-mitted to investing in the FedEx Ground network because of the long-term benefi ts we will experience from these investments.
We will continue to vigorously defend various attacks against our independent contractor model and incur ongoing legal costs as a part of this process. While we believe that FedEx Ground’s owner-operators are properly classifi ed as independent contrac-tors, it is reasonably possible that we could incur a material loss in connection with one or more of these matters or be required to make material changes to our contractor model. However, we do not believe that any such changes will impair our ability to operate and profi tably grow our FedEx Ground business.

MANAGEMENT’S DISCUSSION AND ANALYSIS
23
FEDEX FREIGHT SEGMENTThe following table shows revenues, operating expenses, operat-ing (loss)/income and operating margin (dollars in millions) and selected statistics for the years ended May 31: Percent Change 2009/ 2008/ 2009 2008 2007 (2) 2008 2007
Revenues $ 4,415 $ 4,934 $ 4,586 (11) 8 Operating expenses: Salaries and employee benefi ts 2,247 2,381 2,250 (6) 6 Purchased transportation 540 582 465 (7) 25 Rentals 139 119 112 17 6 Depreciation and amortization 224 227 195 (1) 16 Fuel 520 608 468 (14) 30 Maintenance and repairs 153 175 165 (13) 6 Impairment and other charges 100 (1) – – NM – Intercompany charges 109 81 61 35 33 Other 427 432 407 (1) 6 Total operating expenses 4,459 4,605 4,123 (3) 12 Operating (loss)/income $ (44) $ 329 $ 463 (113) (29)Operating margin (1.0)% 6.7% 10.1% (770)bp (340)bp Average daily LTL shipments (in thousands) 74.4 79.7 78.2 (7) 2 Weight per LTL shipment (lbs) 1,126 1,136 1,130 (1) 1 LTL yield (revenue per hundredweight) $ 19.07 $ 19.65 $ 18.65 (3) 5 (1) Represents impairment charges associated with goodwill related to the Watkins Motor Lines acquisition and other charges primarily associated with employee severance. (2) Includes the results of FedEx National LTL from the date of its acquisition on September 3, 2006.
FedEx Freight Segment RevenuesFedEx Freight segment revenues decreased 11% in 2009 primarily due to a decrease in average daily LTL shipments and lower LTL yield. Average daily LTL shipments decreased 7% during 2009 as a result of the current economic recession, which has resulted in the weakest LTL environment in decades. Despite these con-ditions, we maintained market share. LTL yield decreased 3% during 2009 due to the continuing effects of the competitive pric-ing environment and lower fuel surcharges.
FedEx Freight segment revenues increased in 2008 primarily due to the full-year inclusion of the FedEx National LTL acquisition. LTL yield increased during 2008, refl ecting higher yields from longer-haul FedEx National LTL shipments, higher fuel surcharges (despite a fuel surcharge rate reduction in the fi rst quarter of 2008) and the impact of the January 2008 general rate increase. Average daily LTL shipments grew slightly in 2008, refl ecting the full-year inclusion of FedEx National LTL.
In January 2009, we implemented 5.7% general rate increases for FedEx Freight and FedEx National LTL shipments. In January 2008, we implemented a 5.48% general rate increase for FedEx Freight and a commensurate general rate increase for FedEx National LTL. The indexed LTL fuel surcharge is based on the average of the national U.S. on-highway average prices for a gallon of diesel fuel, as published by the Department of Energy. The indexed LTL fuel surcharge ranged as follows for the years ended May 31: 2009 2008 2007
Low 8.3% 14.5% 14.0% High 23.9 23.7 21.2 Weighted-Average 15.7 17.7 17.8
FedEx Freight Segment Operating (Loss)/IncomeThe following table compares operating expenses as a percent of revenue for the years ended May 31: Percent of Revenue 2009 2008 2007
Operating expenses: Salaries and employee benefi ts 50.9% 48.3% 49.1% Purchased transportation 12.2 11.8 10.1 Rentals 3.1 2.4 2.4 Depreciation and amortization 5.0 4.6 4.3 Fuel 11.8 12.3 10.2 Maintenance and repairs 3.5 3.5 3.6 Impairment and other charges 2.3 (1) – – Intercompany charges 2.5 1.6 1.3 Other 9.7 8.8 8.9 Total operating expenses 101.0 93.3 89.9 Operating margin (1.0)% 6.7% 10.1% (1) Represents impairment charges associated with goodwill related to the Watkins Motor Lines acquisition and other charges primarily associated with employee severance.
The decrease in average daily LTL shipments and the com-petitive pricing environment driven by the U.S. recession and excess capacity in the market had a signifi cant negative impact on operating income and operating margin in 2009. In addition, we recorded a charge of $90 million related to the impairment of goodwill related to the Watkins Motor Lines acquisition and a charge of $10 million primarily related to employee severance.
In response to the current economic environment, excess capacity in the LTL market and reduced shipment volumes, we implemented several actions throughout 2009 to lower our cost structure. These actions included consolidating FedEx Freight regional offi ces, removing equipment from service and reducing hours and personnel to better match current demand levels.
Fuel costs decreased 14% during 2009 due primarily to a lower average price per gallon of diesel fuel and decreased fuel con-sumption due to lower volume levels. Based on a static analysis of the year-over-year changes in fuel costs compared to changes in fuel surcharges, fuel surcharges offset the impact of fuel costs for 2009. However, this analysis does not consider other effects that fuel prices and related fuel surcharges levels have on our business, including changes in customer demand and the impact on base rates and rates paid to our third-party transportation providers. Purchased transportation costs decreased 7% dur-ing 2009 primarily due to lower shipment volumes and decreased

FEDEX CORPORATION
24
utilization of third-party providers. Maintenance and repairs expense decreased 13% in 2009 primarily due to lower shipment volumes and rebranding costs for FedEx National LTL incurred in 2008. Rent expense increased 17% during 2009 primarily due to service center expansions related to strategically investing in key markets for long-term growth. Intercompany charges increased 35% during 2009 primarily due to allocated telecommunication expenses (formerly a direct charge) and higher allocated informa-tion technology costs from FedEx Services.
FedEx Freight segment operating income and operating margin decreased substantially in 2008 primarily due to the net impact of higher fuel costs and a fuel surcharge rate reduction in the fi rst quarter of 2008, along with higher purchased transportation costs due to increased utilization of and rates paid to third-party transportation providers. Lower variable incentive compensa-tion partially offset the net impact of these factors on operating income during 2008.
In 2008, the full-year inclusion of FedEx National LTL in our results impacted the comparability of all our operating expenses. Fuel costs increased during 2008 due to an increase in the average price per gallon of diesel fuel, which also increased rates paid to our third-party transportation providers. Fuel surcharges were not suffi cient to offset incremental fuel costs for 2008, based on a static analysis of the year-over-year changes in fuel prices compared to changes in fuel surcharges. Purchased transpor-tation costs increased in 2008 primarily due to the inclusion of FedEx National LTL, which uses a higher proportion of these services, and higher rates paid to our third-party transportation providers. Including incremental costs from FedEx National LTL, depreciation expense increased during 2008 due to investments in information technology and equipment purchased to sup-port ongoing replacement requirements and long-term volume growth. Intercompany charges increased during 2008 primarily due to higher allocated marketing and information technology costs from FedEx Services.
FedEx Freight Segment Outlook We expect a decline in demand for LTL freight services in 2010 as a result of the continued weak economic conditions and excess capacity in the LTL industry. Ultimately, we believe it is prob-able that excess capacity will be reduced within the LTL industry given the current economic environment. Industry conditions will result in lower revenues and negatively impact operating income at the FedEx Freight LTL Group, particularly in the fi rst half of 2010. However, we expect volume growth in the second half of 2010. Given the cost-reduction actions taken in 2009, we are well positioned to manage through the current economic recession. If excess capacity exits the LTL industry in 2010, we have the net-work, resources and capabilities to manage resulting incremental volumes. We will continue to focus on cost-containment activi-ties during 2010, including further productivity improvements and ongoing integration of information technology platforms across our LTL business.
Capital spending is expected to increase slightly in 2010 with the majority of our spending resulting from the replacement of transportation and handling equipment and information technology projects.
Financial ConditionLIQUIDITYCash and cash equivalents totaled $2.292 billion at May 31, 2009, compared to $1.539 billion at May 31, 2008 and $1.569 billion at May 31, 2007. The following table provides a summary of our cash fl ows for the years ended May 31 (in millions): 2009 2008 2007
Operating activities: Net income $ 98 $ 1,125 $ 2,016 Noncash impairment charges 1,103 882 – Other noncash charges and credits 2,554 2,305 1,988 Changes in assets and liabilities (1,002) (847) (447) Cash provided by operating activities 2,753 3,465 3,557 Investing activities: Business acquisitions, net of cash acquired (3) (4) (1,310) Capital expenditures and other (2,380) (2,893) (2,814) Cash used in investing activities (2,383) (2,897) (4,124) Financing activities: Proceeds from debt issuances 1,000 – 1,054 Principal payments on debt (501) (639) (906) Dividends paid (137) (124) (110) Other 38 146 155 Cash provided by (used in) fi nancing activities 400 (617) 193Effect of exchange rate changes on cash (17) 19 6 Net increase (decrease) in cash and cash equivalents $ 753 $ (30) $ (368)
Cash Provided by Operating Activities. Cash fl ows from oper-ating activities decreased $712 million in 2009 primarily due to reduced income and a $600 million increase in contributions to our tax-qualifi ed U.S. domestic pension plans (“U.S. Retirement Plans”), partially offset by a $307 million reduction in income tax payments. Noncash charges and credits increased in 2009 due to our goodwill and asset impairment charges. Cash fl ows from operating activities decreased $92 million in 2008 primarily due to higher operating costs, particularly fuel and purchased trans-portation, partially offset by year-over-year reductions in income tax payments of $248 million. We made tax-deductible voluntary contributions to our U.S. Retirement Plans of $1.1 billion during 2009, $479 million during 2008 and $482 million during 2007.

MANAGEMENT’S DISCUSSION AND ANALYSIS
25
Cash Used for Investing Activities. Capital expenditures dur-ing 2009 were 17% lower largely due to decreased spending at FedEx Express and FedEx Services. Capital expenditures during 2008 were 2% higher largely due to planned expenditures for facility expansion at FedEx Express and FedEx Ground. During 2007, $1.3 billion of cash was used for the FedEx National LTL, FedEx U.K., DTW Group and other acquisitions. See Note 3 of the accompanying consolidated fi nancial statements for further discussion of these acquisitions. See “Capital Resources” for a discussion of capital expenditures during 2009 and 2008.
Debt Financing Activities. We have a shelf registration statement fi led with the Securities and Exchange Commission (“SEC”) that allows us to sell, in one or more future offerings, any combination of our unsecured debt securities and common stock.
In January 2009, we issued $1 billion of senior unsecured debt under our shelf registration statement, comprised of fi xed-rate notes totaling $250 million due in January 2014 and $750 million due in January 2019. The fi xed-rate notes due in January 2014 bear interest at an annual rate of 7.375%, payable semi-annually, and the fi xed-rate notes due in January 2019 bear interest at an annual rate of 8.00%, payable semi-annually. A portion of the net proceeds were used for repayment of our $500 million aggre-gate principal amount of 3.5% notes that matured on April 1, 2009. We plan to use the remaining net proceeds for working capital and general corporate purposes, including the repayment upon maturity of all or a portion of our $500 million aggregate principal amount of 5.50% notes maturing on August 15, 2009.
A $1 billion revolving credit agreement is available to fi nance our operations and other cash fl ow needs and to provide sup-port for the issuance of commercial paper. This revolving credit agreement expires in July 2010. Our revolving credit agreement contains a fi nancial covenant, which requires us to maintain a leverage ratio of adjusted debt (long-term debt, including the current portion of such debt, plus six times rentals and landing fees) to capital (adjusted debt plus total common stockholders’ investment) that does not exceed 0.7 to 1.0. Our leverage ratio of adjusted debt to capital was 0.6 to 1.0 at May 31, 2009. Under this fi nancial covenant, our additional borrowing capacity is capped. While our fourth quarter 2009 goodwill impairment charges and our SFAS 158 equity adjustment had a negative impact on our borrowing capacity, we continue to have signifi cant available borrowing capacity under this covenant. We are in compliance with this and all other restrictive covenants of our revolving credit agreement and do not expect the covenants to affect our opera-tions. As of May 31, 2009, no commercial paper was outstanding and the entire $1 billion under the revolving credit facility was available for future borrowings.
Dividends. We paid cash dividends of $137 million in 2009, $124 million in 2008 and $110 million in 2007. On June 8, 2009, our Board of Directors declared a dividend of $0.11 per share of com-mon stock. The dividend was paid on July 1, 2009 to stockholders of record as of the close of business on June 18, 2009. Each quarterly dividend payment is subject to review and approval by our Board of Directors, and we evaluate our dividend payment amount on an annual basis at the end of each fi scal year. In con-nection with our most recent annual evaluation of the quarterly dividend payment amount, and in light of current economic condi-tions, we decided not to increase the amount at that time.
CAPITAL RESOURCESOur operations are capital intensive, characterized by signifi -cant investments in aircraft, vehicles, technology, facilities and package-handling and sort equipment. The amount and timing of capital additions depend on various factors, including pre-existing contractual commitments, anticipated volume growth, domes-tic and international economic conditions, new or enhanced services, geographical expansion of services, availability of satisfactory fi nancing and actions of regulatory authorities.
The following table compares capital expenditures by asset category and reportable segment for the years ended May 31 (in millions): Percent Change 2009/ 2008/ 2009 2008 2007 2008 2007
Aircraft and related equipment $ 925 $ 998 $ 1,107 (7) (10)Facilities and sort equipment 742 900 674 (18) 34Vehicles 319 404 445 (21) (9)Information and technology investments 298 366 431 (19) (15)Other equipment 175 279 225 (37) 24 Total capital expenditures $ 2,459 $ 2,947 $ 2,882 (17) 2FedEx Express segment $ 1,348 $ 1,716 $ 1,672 (21) 3FedEx Ground segment 636 509 489 25 4FedEx Freight segment 240 266 287 (10) (7)FedEx Services segment 235 455 432 (48) 5Other – 1 2 NM NM Total capital expenditures $ 2,459 $ 2,947 $ 2,882 (17) 2
Capital expenditures during 2009 were lower than the prior year primarily due to decreased spending at FedEx Express for facilities and aircraft and aircraft-related equipment. Prior year FedEx Express capital expenditures included construction of a new regional hub in Greensboro, N.C., sort expansion of the Indianapolis hub, expansion of the Memphis hub and construc-tion of a new offi ce building in Memphis. FedEx Services capital expenditures decreased in 2009 primarily due to the planned reduction in FedEx Offi ce network expansion, decreased spend-ing and the postponement of several information technology projects, along with the substantial completion of information technology facility expansions in the prior year. Capital spending at FedEx Ground increased in 2009 due to increased spending on facilities and sort equipment associated with its comprehensive network expansion plan. Capital expenditures increased during 2008 primarily due to increased spending at FedEx Express for facility expansion and expenditures at FedEx Services for infor-mation technology facility expansions and the addition of new FedEx Offi ce locations.

FEDEX CORPORATION
26
LIQUIDITY OUTLOOK We had $2.3 billion in cash and cash equivalents as of May 31, 2009. For 2010, we believe that our existing cash and cash equivalents, cash fl ow from operations, and available fi nancing sources will be adequate to meet our liquidity needs, including working capital, capital expenditure requirements and debt pay-ment obligations (described above). Although we expect higher capital expenditures in 2010, we anticipate that our cash fl ow from operations will exceed our investing activities, excluding any acquisitions. We are closely managing our capital spending based on current and anticipated volume levels and will defer or limit capital additions where economically feasible, while con-tinuing to invest strategically for future growth.
Secured fi nancing may be used to obtain capital assets if we determine that it best suits our needs. Historically, we have been successful in obtaining unsecured fi nancing, from both domes-tic and international sources, although the marketplace for such investment capital can become restricted depending on a variety of economic factors, as we experienced in 2009. During 2009, global credit markets experienced signifi cant liquidity disrup-tions, and continued uncertainty in the credit markets has made fi nancing terms for borrowers less attractive and in cer-tain cases resulted in the unavailability of certain types of debt fi nancing, such as commercial paper. Although these factors may make it more diffi cult or expensive for us to access credit markets, we still have access to credit, as evidenced by our debt issuance in the third quarter of 2009.
The American Recovery and Reinvestment Act of 2009 was signed into law in February 2009. Among other things, this law extends the bonus tax depreciation deductions for qualified assets acquired and placed into service during calendar year 2009. As a result of this extension, we estimate that the net benefi t from bonus tax depreciation provisions passed in 2008 and 2009 could be approximately $50 million in 2010; however, the actual amount is subject to the nature and timing of our capital expenditures in 2010, which may be impacted by economic conditions.
Our capital expenditures are expected to be $2.6 billion in 2010 and will include spending for aircraft and related equipment at FedEx Express, network expansion at FedEx Ground and revenue equipment at FedEx Freight. We also continue to invest in produc-tivity-enhancing technologies. We expect approximately 61% of capital expenditures in 2010 will be designated for growth initia-tives and 39% for ongoing maintenance activities. Our expected capital expenditures for 2010 include $1.1 billion in investments for aircraft and aircraft-related equipment at FedEx Express. Aircraft-related capital outlays include the B757s, the fi rst of which entered revenue service in 2009 and which are substan-tially more fuel-effi cient per unit than the aircraft type they are replacing, and the new B777Fs, the fi rst of which is expected to enter revenue service in 2010. These aircraft-related capital expenditures are necessary to achieve signifi cant long-term operating savings and to support projected long-term interna-tional volume growth. Our ability to delay the timing of these aircraft-related expenditures is limited without incurring signifi -cant costs to modify existing purchase agreements.
In December 2008, we reached an agreement with Boeing to defer the delivery of certain B777F aircraft by up to 17 months. In addition, in January 2009, we exercised our option with Boeing to purchase an additional 15 B777F aircraft and obtained an option to purchase an additional 15 B777F aircraft. Our obligation to pur-chase these additional aircraft is conditioned upon there being no event that causes FedEx Express or its employees not to be cov-ered by the Railway Labor Act of 1926, as amended. Accordingly, we have now agreed, subject to the above contractual condition, to purchase a total of 30 B777F aircraft and hold an option to purchase an additional 15 B777F aircraft.
During 2009, we made $1.1 billion in tax-deductible voluntary contributions to our U.S. Retirement Plans in order to improve their funded status. These contributions included $483 mil-lion in September 2008 and $600 million in May 2009. Our U.S. Retirement Plans have ample funds to meet benefi t payments. However, current market conditions have negatively impacted our plan asset values, resulting in the 2009 recognition of a $1.2 billion charge to OCI, and increasing our minimum expected funding requirements for 2010. For 2010, we anticipate making contributions to our U.S. Retirement Plans totaling approximately $850 million, including approximately $500 million in voluntary contributions and $350 million in minimum required contributions, beginning in the second quarter of 2010.
In June 2009, Standard & Poor’s reaffi rmed our senior unsecured debt credit rating of BBB and commercial paper rating of A-2 and our ratings outlook as “stable.” During the third quarter of 2009, Moody’s Investors Service reaffi rmed our senior unsecured debt credit rating of Baa2 and commercial paper rating of P-2. However, Moody’s downgraded our ratings outlook to “negative.” If our credit ratings drop, our interest expense may increase. If our commercial paper ratings drop below current levels, we may have diffi culty utilizing the commercial paper market. If our senior unsecured debt ratings drop below investment grade, our access to fi nancing may become limited.
In 2010, scheduled debt payments include $664 million of principal payments on unsecured notes and capitalized leases.

MANAGEMENT’S DISCUSSION AND ANALYSIS
27
We have certain contingent liabilities that are not accrued in our balance sheet in accordance with accounting principles generally accepted in the United States. These contingent liabilities are not included in the table above. In addition, we have historically made voluntary tax-deductible contributions to our U.S. Retirement Plans. These amounts have not been legally required and therefore are not refl ected in the table above. However, included in the table above are anticipated minimum required quarterly contributions totaling $350 million for 2010 that begin in the second quarter.
We have other long-term liabilities reflected in our balance sheet, including deferred income taxes, qualifi ed and nonquali-fi ed pension and postretirement healthcare plan liabilities and other self-insurance accruals. The payment obligations associ-ated with these liabilities are not refl ected in the table above due to the absence of scheduled maturities. Therefore, the timing of these payments cannot be determined, except for amounts estimated to be payable within 12 months, which are included in current liabilities.
Operating ActivitiesIn accordance with accounting principles generally accepted in the United States, future contractual payments under our operat-ing leases are not recorded in our balance sheet. Credit rating agencies routinely use information concerning minimum lease payments required for our operating leases to calculate our debt capacity. The amounts refl ected in the table above for operating leases represent future minimum lease payments under noncan-celable operating leases (principally aircraft and facilities) with an initial or remaining term in excess of one year at May 31, 2009. In the past, we fi nanced a signifi cant portion of our aircraft needs (and certain other equipment needs) using operating leases (a type of “off-balance sheet fi nancing”). At the time that the deci-sion to lease was made, we determined that these operating leases would provide economic benefi ts favorable to ownership with respect to market values, liquidity or after-tax cash fl ows.
The amounts reflected for purchase obligations represent noncancelable agreements to purchase goods or services that are not capital related. Such contracts include those for printing and advertising and promotions contracts. Open purchase orders that are cancelable are not considered unconditional purchase obligations for fi nancial reporting purposes and are not included in the table above. Such purchase orders often represent autho-rizations to purchase rather than binding agreements. See Note 16 of the accompanying consolidated fi nancial statements for more information.
Included in the preceding table within the caption entitled “Non-capital purchase obligations and other” is our estimate of the current portion of the liability for uncertain tax positions under FIN 48 of $5 million. We cannot reasonably estimate the timing of the long-term payments or the amount by which the liability will increase or decrease over time; therefore, the long-term portion of the liability ($67 million) is excluded from the preceding table. See Note 11 of the accompanying consolidated fi nancial state-ments for further information.
The amounts refl ected in the table above for interest on long-term debt represent future interest payments due on our long-term debt, all of which are fi xed rate.
Investing ActivitiesThe amounts refl ected in the table above for capital purchase obligations represent noncancelable agreements to purchase capital-related equipment. Such contracts include those for certain purchases of aircraft, aircraft modifi cations, vehicles, facilities, computers and other equipment contracts. In addition, we have committed to modify our DC10 aircraft for two-man cockpit configuration, which is reflected in the table above. Commitments to purchase aircraft in passenger confi guration do not include the attendant costs to modify these aircraft for cargo transport unless we have entered into noncancelable commitments to modify such aircraft. Open purchase orders that are cancelable are not considered unconditional purchase
CONTRACTUAL CASH OBLIGATIONSThe following table sets forth a summary of our contractual cash obligations as of May 31, 2009. Certain of these contractual obligations are refl ected in our balance sheet, while others are disclosed as future obligations under accounting principles generally accepted in the United States. Except for the current portion of long-term debt and capital lease obligations, this table does not include amounts already recorded in our balance sheet as current liabilities at May 31, 2009. Accordingly, this table is not meant to represent a forecast of our total cash expenditures for any of the periods presented. Payments Due by Fiscal Year (Undiscounted)(in millions) 2010 2011 2012 2013 2014 Thereafter Total
Operating activities: Operating leases $ 1,759 $ 1,612 $ 1,451 $ 1,316 $ 1,166 $ 7,352 $ 14,656 Non-capital purchase obligations and other 234 137 111 62 11 125 680 Interest on long-term debt 157 144 126 98 97 1,815 2,437 Required quarterly contributions to our U.S. Retirement Plans 350 – – – – – 350Investing activities: Aircraft and aircraft-related capital commitments 964 791 527 425 466 1,924 5,097 Other capital purchase obligations 69 – – – – – 69 Financing activities: Debt 500 250 – 300 250 989 2,289 Capital lease obligations 164 20 8 119 2 15 328 Total $ 4,197 $ 2,954 $ 2,223 $ 2,320 $ 1,992 $ 12,220 $ 25,906

FEDEX CORPORATION
28
obligations for fi nancial reporting purposes and are not included in the table above. Such purchase orders often represent autho-rizations to purchase rather than binding agreements. See Note 16 of the accompanying consolidated fi nancial statements for more information.
Financing ActivitiesWe have certain fi nancial instruments representing potential commitments, not refl ected in the table above, that were incurred in the normal course of business to support our operations, including surety bonds and standby letters of credit. These instru-ments are generally required under certain U.S. self-insurance programs and are also used in the normal course of international operations. The underlying liabilities insured by these instruments are refl ected in our balance sheets, where applicable. Therefore, no additional liability is refl ected for the surety bonds and letters of credit themselves.
The amounts refl ected in the table above for long-term debt rep-resent future scheduled payments on our long-term debt. In 2010, we have scheduled debt payments of $664 million, which includes $500 million of principal payments on our 5.5% unsecured notes maturing in August 2009 and principal and interest payments on capital leases.
Critical Accounting EstimatesThe preparation of financial statements in accordance with accounting principles generally accepted in the United States requires management to make signifi cant judgments and esti-mates to develop amounts refl ected and disclosed in the fi nancial statements. In many cases, there are alternative policies or esti-mation techniques that could be used. We maintain a thorough process to review the application of our accounting policies and to evaluate the appropriateness of the many estimates that are required to prepare the fi nancial statements of a complex, global corporation. However, even under optimal circumstances, estimates routinely require adjustment based on changing cir-cumstances and new or better information.
The estimates discussed below include the fi nancial statement elements that are either the most judgmental or involve the selec-tion or application of alternative accounting policies and are material to our fi nancial statements. Management has discussed the development and selection of these critical accounting esti-mates with the Audit Committee of our Board of Directors and with our independent registered public accounting fi rm.
RETIREMENT PLANSOverview. We sponsor programs that provide retirement benefi ts to most of our employees. These programs include defi ned ben-efi t pension plans, defi ned contribution plans and postretirement healthcare plans. The accounting for pension and postretirement healthcare plans includes numerous assumptions, such as: dis-count rates; expected long-term investment returns on plan assets; future salary increases; employee turnover; mortality; and retirement ages. These assumptions most signifi cantly impact our U.S. domestic pension plans.
We made signifi cant changes to our retirement plans during 2008 and 2009. Beginning January 1, 2008, we increased the annual company-matching contribution under the largest of our 401(k) plans covering most employees from a maximum of $500 to a maximum of 3.5% of eligible compensation. Employees not partic-ipating in the 401(k) plan as of January 1, 2008 were automatically enrolled at 3% of eligible pay with a company match of 2% of eligible pay effective March 1, 2008. As a temporary cost-control measure, we suspended 401(k) company-matching contributions for a minimum of one year effective February 1, 2009.
Effective May 31, 2008, benefi ts previously accrued under our primary pension plans using a traditional pension benefi t formula (based on average earnings and years of service) were capped for most employees, and those benefi ts will be payable begin-ning at retirement. Effective June 1, 2008, future pension benefi ts for most employees began to be accrued under a cash balance formula we call the Portable Pension Account. These changes did not affect the benefi ts of previously retired and terminated vested participants. In addition, these pension plans were modi-fi ed to accelerate vesting from fi ve years to three years for most participants.
Under the Portable Pension Account, the retirement benefi t is expressed as a dollar amount in a notional account that grows with annual credits based on pay, age and years of credited ser-vice, and interest on the notional account balance. Under the tax-qualifi ed plans, the pension benefi t is payable as a lump sum or an annuity at retirement at the election of the employee. An employee’s pay credits are determined each year under a graded formula that combines age with years of service for points. The plan interest credit rate will vary from year to year based on the selected U.S. Treasury index, with an interest rate equal to the greater of 4% or the one-year Treasury Constant Maturities rate plus 1%, but not greater than a rate based on the larger of the average 30-year Treasury note or the applicable provisions of the Internal Revenue Code.
Retirement Plans Costs. Retirement plans cost is included in the “Salaries and Employee Benefi ts” caption in our consolidated income statements. A summary of our retirement plans costs over the past three years is as follows (in millions): 2009 2008 2007
U.S. domestic and international pension plans $ 177 $ 323 $ 467 U.S. domestic and international defi ned contribution plans 237 216 176 Postretirement healthcare plans 57 77 55 $ 471 $ 616 $ 698
The determination of our annual retirement plans cost is highly sensitive to changes in the assumptions related to these plans because we have a large active workforce, a signifi cant amount of assets in the pension plans, and the payout of benefi ts will occur over an extended period in the future. Total retirement plans cost decreased $145 million in 2009, primarily due to a higher discount rate.

MANAGEMENT’S DISCUSSION AND ANALYSIS
29
Retirement plans cost in 2010 is expected to be approximately $500 million, an increase of approximately $29 million from 2009. This increase is attributable to increased pension plan expense as a result of the negative impact of current market conditions on our pension plan assets, which will be substantially offset by lower expenses on our 401(k) plans due to the temporary suspen-sion of the company-matching contribution.
Pension Cost. The components of pension cost for all pension plans are as follows (in millions): 2009 2008 2007
Service cost $ 499 $ 518 $ 540 Interest cost 798 720 707Expected return on plan assets (1,059) (985) (930)Recognized actuarial (gains) losses and other (61) 70 150Net periodic benefi t cost $ 177 $ 323 $ 467
Pension cost for our primary domestic pension plan was favor-ably affected in 2009 by approximately $210 million due to an increase in the discount rate driven by higher interest rates in the bond market year over year. Pension cost will be higher in 2010 by approximately $125 million due to signifi cant declines in the value of our plan assets due to current market conditions, partially offset by a higher discount rate.
Following is a discussion of the key estimates we consider in determining our pension cost:
Discount Rate. This is the interest rate used to discount the esti-mated future benefi t payments that have been accrued to date (the projected benefi t obligation, or PBO) to their net present value and to determine the succeeding year’s pension expense. The discount rate is determined each year at the plan measure-ment date. An increase in the discount rate decreases pension expense. The discount rate affects the PBO and pension expense based on the measurement dates, as described below. Discount Amounts Determined by MeasurementMeasurement Date (1) Rate Date and Discount Rate
5/31/2009 7.68% 2009 PBO and 2010 expense6/01/2008 7.15 2009 expense2/29/2008 6.96 2008 PBO2/28/2007 6.01 2007 PBO and 2008 expense2/28/2006 5.91 2006 PBO and 2007 expense(1) SFAS 158 required us to change our measurement date to May 31, beginning in 2009.
We determine the discount rate (which is required to be the rate at which the projected benefi t obligation could be effec-tively settled as of the measurement date) with the assistance of actuaries, who calculate the yield on a theoretical portfolio of high-grade corporate bonds (rated Aa or better) with cash fl ows that generally match our expected benefi t payments in future years. In selecting bonds for this theoretical portfolio, we focus on bonds that match cash fl ows to benefi t payments and limit our concentration of bonds by industry and issuer. This bond modeling technique allows for the use of non-callable and make-whole bonds that meet certain screening criteria to ensure that the selected bonds with a call feature have a low probability of being called. To the extent scheduled bond proceeds exceed the
estimated benefi t payments in a given period, the yield calculation assumes those excess proceeds are reinvested at the one-year forward rates implied by the Citigroup Pension Discount Curve.
The increase in the discount rate for 2010 was driven by cur-rent conditions in the market for high-grade corporate bonds, in which yields have strengthened signifi cantly since May 31, 2008. The discount rate assumption is highly sensitive, as the follow-ing table illustrates with our largest tax-qualifi ed U.S. domestic pension plan: Sensitivity (in millions) Effect on 2010 May 31, 2009 Pension Expense Effect on PBO
One-basis-point change in discount rate $1.5 $13.9 One-basis-point change in expected return on assets 1.2 –
At the February 29, 2008 and June 1, 2008 measurement dates, respectively, a one-basis-point change in the discount rate would have impacted the 2008 PBO by $16 million and 2009 expense by $1.7 million.
Plan Assets. The estimated average rate of return on plan assets is a long-term, forward-looking assumption that also materi-ally affects our pension cost. It is required to be the expected future long-term rate of earnings on plan assets. Our pension plan assets are invested primarily in listed securities, and our pension plans hold only a minimal investment in FedEx common stock that is entirely at the discretion of third-party pension fund investment managers.
Establishing the expected future rate of investment return on our pension assets is a judgmental matter. Management considers the following factors in determining this assumption:
• the duration of our pension plan liabilities, which drives the investment strategy we can employ with our pension plan assets;
• the types of investment classes in which we invest our pension plan assets and the expected compound geometric return we can reasonably expect those investment classes to earn over the next 10- to 15-year time period (or such other time period that may be appropriate); and
• the investment returns we can reasonably expect our investment management program to achieve in excess of the returns we could expect if investments were made strictly in indexed funds.
We review the expected long-term rate of return on an annual basis and revise it as appropriate. As part of our strategy to manage future pension costs and net funded status volatility, we are transitioning to a more liability-driven investment strategy, which will better align our plan assets and liabilities. This strategy will ultimately result in a greater concentration of fi xed-income investments.

FEDEX CORPORATION
30
The target asset allocations in the table above for 2009 refl ect tar-gets established in connection with our liability-driven investment strategy described above. Our actual asset allocations will con-tinue to transition to the target levels over time as we continue to implement this strategy. We have assumed an 8.0% compound geometric long-term rate of return on our U.S. domestic pen-sion plan assets for 2010, a decrease from 8.5% in 2009 and 2008 and 9.1% in 2007, as described in Note 12 of the accompanying consolidated fi nancial statements. This decrease was driven by lower expectations for future returns in light of recent losses in the equity markets and our shift in investment strategy, which will yield lower returns due to a heavier percentage of fi xed-income securities.
The actual historical return on our U.S. pension plan assets, calculated on a compound geometric basis, was approximately 7.5%, net of investment manager fees, for the 15-year period ended May 31, 2009 and 9.4%, net of investment manager fees, for the 15-year period ended February 29, 2008.
Pension expense is also affected by the accounting policy used to determine the value of plan assets at the measurement date. We use a calculated-value method to determine the value of plan assets, which helps mitigate short-term volatility in mar-ket performance (both increases and decreases) by amortizing the actuarial gains or losses over four years. Another method used in practice applies the market value of plan assets at the measurement date. In determining our 2010 pension expense, the calculated-value method signifi cantly mitigated the impact of asset value declines in the determination of our pension expense, reducing our expected 2010 expense by $135 million.
Salary Increases. The assumed future increase in salaries and wages is also a key estimate in determining pension cost. Generally, we correlate changes in estimated future salary increases to changes in the discount rate (since that is an indica-tor of general infl ation and cost of living adjustments) and general estimated levels of profi tability (since most incentive compensa-tion is a component of pensionable wages). In the future, based on the plan design changes discussed above, a one-basis-point across-the-board change in the rate of estimated future salary increases will have an immaterial impact on our pension costs.
Our assumed average future salary increases based on age and years of service are below. Assumed Average Future Salary Increases
2010 Projected 4.42%2009 4.49%2008 4.47%2007 3.46%
Funded Status. Following is information concerning the funded sta-tus under SFAS 158 of our pension plans as of May 31 (in millions): 2009 2008
Funded Status of Plans:Projected benefi t obligation (PBO) $ 11,050 $ 11,617 Fair value of plan assets 10,812 11,879 Funded status of the plans (238) 262 Employer contributions after measurement date – 15 Net funded status $ (238) $ 277 Components of Funded Status by Plans:Qualifi ed plans $ 278 $ 827Nonqualifi ed plans (318) (331)International plans (198) (219)Net funded status $ (238) $ 277Components of Amounts Included in Balance Sheets:Noncurrent pension assets $ 311 $ 827 Current pension and other benefi t obligations (31) (32) Noncurrent pension and other benefi t obligations (518) (518) Net amount recognized $ (238) $ 277 Cash Amounts:Cash contributions during the year $ 1,146 $ 548 Benefi t payments during the year $ 351 $ 318
The amounts recognized in the balance sheet under SFAS 158 refl ect a snapshot of the state of our long-term pension liabilities at the plan measurement date and the effect of mark-to-market accounting on plan assets. At May 31, 2009, in accordance with the provisions of SFAS 158, we recorded a decrease to equity through OCI of $1.2 billion (net of tax) to refl ect unrealized market losses during 2009. Those losses are subject to amortization over future years and may be refl ected in future income statements unless they are recovered.
To support our conclusions, we periodically commission asset/liability studies performed by third-party professional investment advisors and actuaries to assist us in our reviews. These studies project our estimated future pension payments and evaluate the effi ciency of the allocation of our pension plan assets into various investment categories. These studies also generate probability-adjusted expected future returns on those assets. The following table summarizes our current asset allocation strategy (dollars in millions): Plan Assets at Measurement Date 2009 2008Asset Class Actual Actual% Target% Actual Actual% Target%
Domestic equities $ 4,129 39% 30% $ 5,694 49% 53% International equities 1,724 16 15 2,481 21 17Private equities 357 3 5 406 4 5 Total equities 6,210 58 50 8,581 74 75Long-duration fi xed-income securities 2,535 24 45 1,778 15 15Other fi xed-income securities 1,861 18 5 1,302 11 10 $ 10,606 100% 100% $ 11,661 100% 100%
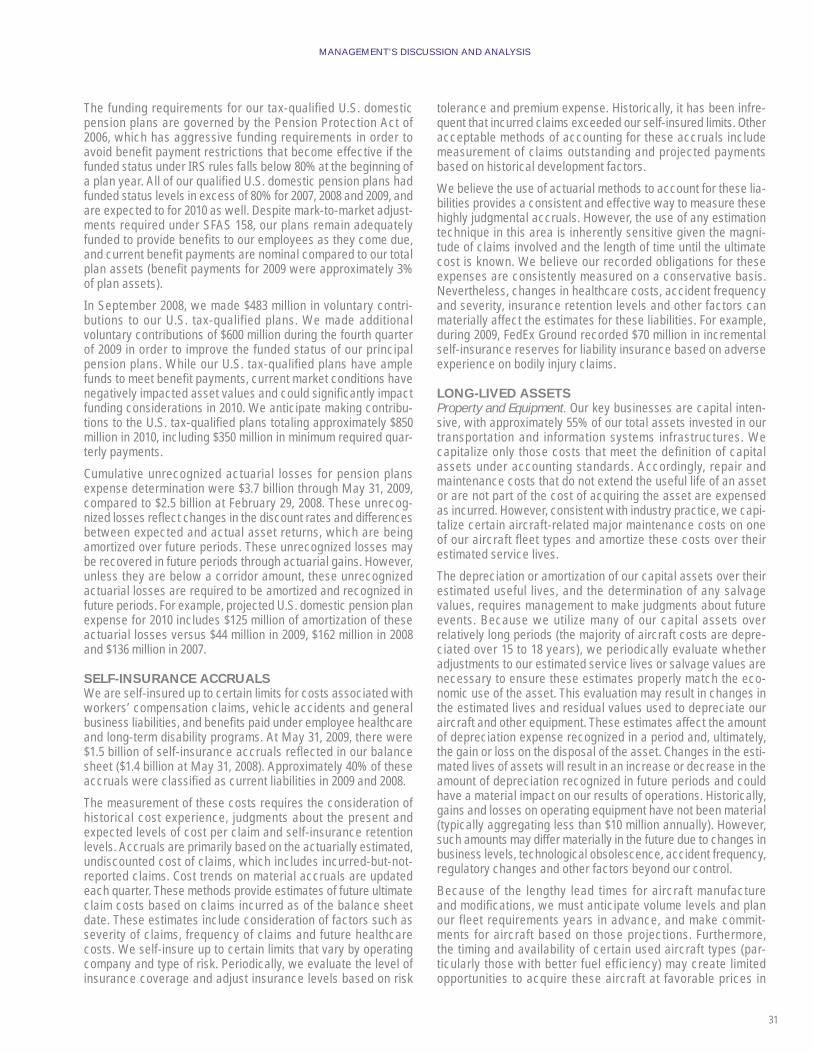
MANAGEMENT’S DISCUSSION AND ANALYSIS
31
The funding requirements for our tax-qualifi ed U.S. domestic pension plans are governed by the Pension Protection Act of 2006, which has aggressive funding requirements in order to avoid benefi t payment restrictions that become effective if the funded status under IRS rules falls below 80% at the beginning of a plan year. All of our qualifi ed U.S. domestic pension plans had funded status levels in excess of 80% for 2007, 2008 and 2009, and are expected to for 2010 as well. Despite mark-to-market adjust-ments required under SFAS 158, our plans remain adequately funded to provide benefi ts to our employees as they come due, and current benefi t payments are nominal compared to our total plan assets (benefi t payments for 2009 were approximately 3% of plan assets).
In September 2008, we made $483 million in voluntary contri-butions to our U.S. tax-qualified plans. We made additional voluntary contributions of $600 million during the fourth quarter of 2009 in order to improve the funded status of our principal pension plans. While our U.S. tax-qualifi ed plans have ample funds to meet benefi t payments, current market conditions have negatively impacted asset values and could signifi cantly impact funding considerations in 2010. We anticipate making contribu-tions to the U.S. tax-qualifi ed plans totaling approximately $850 million in 2010, including $350 million in minimum required quar-terly payments.
Cumulative unrecognized actuarial losses for pension plans expense determination were $3.7 billion through May 31, 2009, compared to $2.5 billion at February 29, 2008. These unrecog-nized losses refl ect changes in the discount rates and differences between expected and actual asset returns, which are being amortized over future periods. These unrecognized losses may be recovered in future periods through actuarial gains. However, unless they are below a corridor amount, these unrecognized actuarial losses are required to be amortized and recognized in future periods. For example, projected U.S. domestic pension plan expense for 2010 includes $125 million of amortization of these actuarial losses versus $44 million in 2009, $162 million in 2008 and $136 million in 2007.
SELF-INSURANCE ACCRUALSWe are self-insured up to certain limits for costs associated with workers’ compensation claims, vehicle accidents and general business liabilities, and benefi ts paid under employee healthcare and long-term disability programs. At May 31, 2009, there were $1.5 billion of self-insurance accruals refl ected in our balance sheet ($1.4 billion at May 31, 2008). Approximately 40% of these accruals were classifi ed as current liabilities in 2009 and 2008.
The measurement of these costs requires the consideration of historical cost experience, judgments about the present and expected levels of cost per claim and self-insurance retention levels. Accruals are primarily based on the actuarially estimated, undiscounted cost of claims, which includes incurred-but-not-reported claims. Cost trends on material accruals are updated each quarter. These methods provide estimates of future ultimate claim costs based on claims incurred as of the balance sheet date. These estimates include consideration of factors such as severity of claims, frequency of claims and future healthcare costs. We self-insure up to certain limits that vary by operating company and type of risk. Periodically, we evaluate the level of insurance coverage and adjust insurance levels based on risk
tolerance and premium expense. Historically, it has been infre-quent that incurred claims exceeded our self-insured limits. Other acceptable methods of accounting for these accruals include measurement of claims outstanding and projected payments based on historical development factors.
We believe the use of actuarial methods to account for these lia-bilities provides a consistent and effective way to measure these highly judgmental accruals. However, the use of any estimation technique in this area is inherently sensitive given the magni-tude of claims involved and the length of time until the ultimate cost is known. We believe our recorded obligations for these expenses are consistently measured on a conservative basis. Nevertheless, changes in healthcare costs, accident frequency and severity, insurance retention levels and other factors can materially affect the estimates for these liabilities. For example, during 2009, FedEx Ground recorded $70 million in incremental self-insurance reserves for liability insurance based on adverse experience on bodily injury claims.
LONG-LIVED ASSETSProperty and Equipment. Our key businesses are capital inten-sive, with approximately 55% of our total assets invested in our transportation and information systems infrastructures. We capitalize only those costs that meet the defi nition of capital assets under accounting standards. Accordingly, repair and maintenance costs that do not extend the useful life of an asset or are not part of the cost of acquiring the asset are expensed as incurred. However, consistent with industry practice, we capi-talize certain aircraft-related major maintenance costs on one of our aircraft fl eet types and amortize these costs over their estimated service lives.
The depreciation or amortization of our capital assets over their estimated useful lives, and the determination of any salvage values, requires management to make judgments about future events. Because we utilize many of our capital assets over relatively long periods (the majority of aircraft costs are depre-ciated over 15 to 18 years), we periodically evaluate whether adjustments to our estimated service lives or salvage values are necessary to ensure these estimates properly match the eco-nomic use of the asset. This evaluation may result in changes in the estimated lives and residual values used to depreciate our aircraft and other equipment. These estimates affect the amount of depreciation expense recognized in a period and, ultimately, the gain or loss on the disposal of the asset. Changes in the esti-mated lives of assets will result in an increase or decrease in the amount of depreciation recognized in future periods and could have a material impact on our results of operations. Historically, gains and losses on operating equipment have not been material (typically aggregating less than $10 million annually). However, such amounts may differ materially in the future due to changes in business levels, technological obsolescence, accident frequency, regulatory changes and other factors beyond our control.
Because of the lengthy lead times for aircraft manufacture and modifi cations, we must anticipate volume levels and plan our fleet requirements years in advance, and make commit-ments for aircraft based on those projections. Furthermore, the timing and availability of certain used aircraft types (par-ticularly those with better fuel effi ciency) may create limited opportunities to acquire these aircraft at favorable prices in
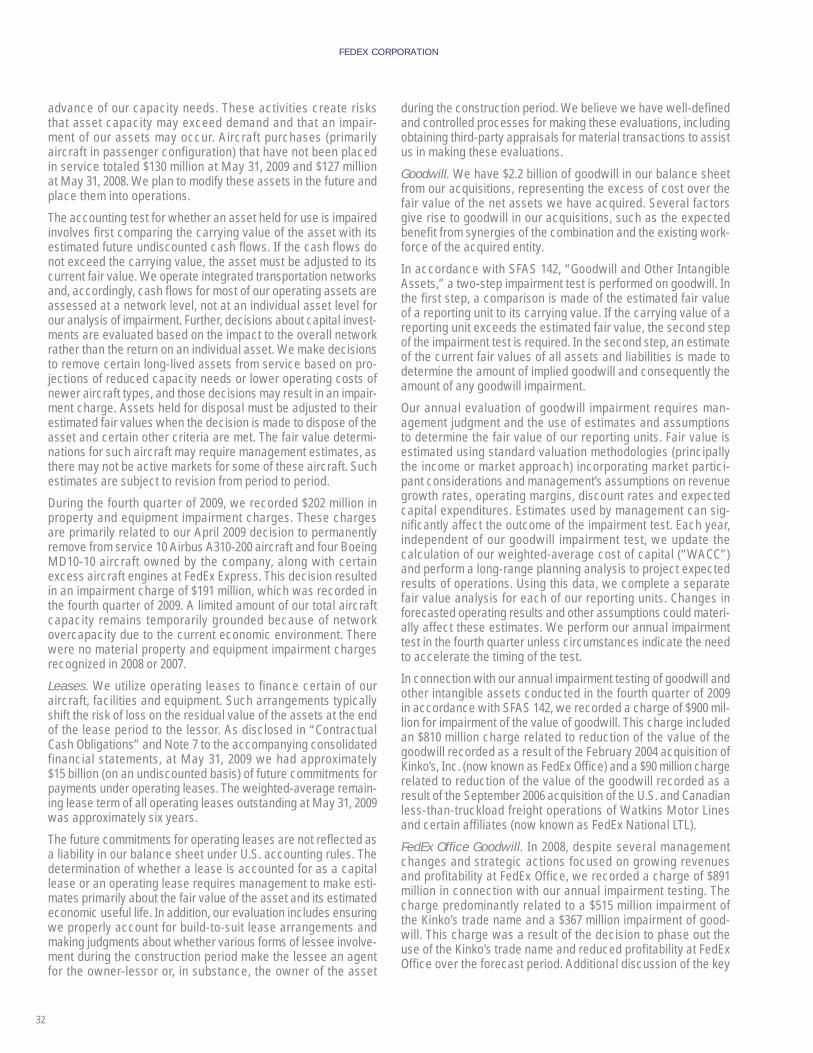
FEDEX CORPORATION
32
advance of our capacity needs. These activities create risks that asset capacity may exceed demand and that an impair-ment of our assets may occur. Aircraft purchases (primarily aircraft in passenger confi guration) that have not been placed in service totaled $130 million at May 31, 2009 and $127 million at May 31, 2008. We plan to modify these assets in the future and place them into operations.
The accounting test for whether an asset held for use is impaired involves fi rst comparing the carrying value of the asset with its estimated future undiscounted cash fl ows. If the cash fl ows do not exceed the carrying value, the asset must be adjusted to its current fair value. We operate integrated transportation networks and, accordingly, cash fl ows for most of our operating assets are assessed at a network level, not at an individual asset level for our analysis of impairment. Further, decisions about capital invest-ments are evaluated based on the impact to the overall network rather than the return on an individual asset. We make decisions to remove certain long-lived assets from service based on pro-jections of reduced capacity needs or lower operating costs of newer aircraft types, and those decisions may result in an impair-ment charge. Assets held for disposal must be adjusted to their estimated fair values when the decision is made to dispose of the asset and certain other criteria are met. The fair value determi-nations for such aircraft may require management estimates, as there may not be active markets for some of these aircraft. Such estimates are subject to revision from period to period.
During the fourth quarter of 2009, we recorded $202 million in property and equipment impairment charges. These charges are primarily related to our April 2009 decision to permanently remove from service 10 Airbus A310-200 aircraft and four Boeing MD10-10 aircraft owned by the company, along with certain excess aircraft engines at FedEx Express. This decision resulted in an impairment charge of $191 million, which was recorded in the fourth quarter of 2009. A limited amount of our total aircraft capacity remains temporarily grounded because of network overcapacity due to the current economic environment. There were no material property and equipment impairment charges recognized in 2008 or 2007.
Leases. We utilize operating leases to fi nance certain of our aircraft, facilities and equipment. Such arrangements typically shift the risk of loss on the residual value of the assets at the end of the lease period to the lessor. As disclosed in “Contractual Cash Obligations” and Note 7 to the accompanying consolidated financial statements, at May 31, 2009 we had approximately $15 billion (on an undiscounted basis) of future commitments for payments under operating leases. The weighted-average remain-ing lease term of all operating leases outstanding at May 31, 2009 was approximately six years.
The future commitments for operating leases are not refl ected as a liability in our balance sheet under U.S. accounting rules. The determination of whether a lease is accounted for as a capital lease or an operating lease requires management to make esti-mates primarily about the fair value of the asset and its estimated economic useful life. In addition, our evaluation includes ensuring we properly account for build-to-suit lease arrangements and making judgments about whether various forms of lessee involve-ment during the construction period make the lessee an agent for the owner-lessor or, in substance, the owner of the asset
during the construction period. We believe we have well-defi ned and controlled processes for making these evaluations, including obtaining third-party appraisals for material transactions to assist us in making these evaluations.
Goodwill. We have $2.2 billion of goodwill in our balance sheet from our acquisitions, representing the excess of cost over the fair value of the net assets we have acquired. Several factors give rise to goodwill in our acquisitions, such as the expected benefi t from synergies of the combination and the existing work-force of the acquired entity.
In accordance with SFAS 142, “Goodwill and Other Intangible Assets,” a two-step impairment test is performed on goodwill. In the fi rst step, a comparison is made of the estimated fair value of a reporting unit to its carrying value. If the carrying value of a reporting unit exceeds the estimated fair value, the second step of the impairment test is required. In the second step, an estimate of the current fair values of all assets and liabilities is made to determine the amount of implied goodwill and consequently the amount of any goodwill impairment.
Our annual evaluation of goodwill impairment requires man-agement judgment and the use of estimates and assumptions to determine the fair value of our reporting units. Fair value is estimated using standard valuation methodologies (principally the income or market approach) incorporating market partici-pant considerations and management’s assumptions on revenue growth rates, operating margins, discount rates and expected capital expenditures. Estimates used by management can sig-nifi cantly affect the outcome of the impairment test. Each year, independent of our goodwill impairment test, we update the calculation of our weighted-average cost of capital (“WACC”) and perform a long-range planning analysis to project expected results of operations. Using this data, we complete a separate fair value analysis for each of our reporting units. Changes in forecasted operating results and other assumptions could materi-ally affect these estimates. We perform our annual impairment test in the fourth quarter unless circumstances indicate the need to accelerate the timing of the test.
In connection with our annual impairment testing of goodwill and other intangible assets conducted in the fourth quarter of 2009 in accordance with SFAS 142, we recorded a charge of $900 mil-lion for impairment of the value of goodwill. This charge included an $810 million charge related to reduction of the value of the goodwill recorded as a result of the February 2004 acquisition of Kinko’s, Inc. (now known as FedEx Offi ce) and a $90 million charge related to reduction of the value of the goodwill recorded as a result of the September 2006 acquisition of the U.S. and Canadian less-than-truckload freight operations of Watkins Motor Lines and certain affi liates (now known as FedEx National LTL).
FedEx Offi ce Goodwill. In 2008, despite several management changes and strategic actions focused on growing revenues and profi tability at FedEx Offi ce, we recorded a charge of $891 million in connection with our annual impairment testing. The charge predominantly related to a $515 million impairment of the Kinko’s trade name and a $367 million impairment of good-will. This charge was a result of the decision to phase out the use of the Kinko’s trade name and reduced profi tability at FedEx Offi ce over the forecast period. Additional discussion of the key

MANAGEMENT’S DISCUSSION AND ANALYSIS
33
assumptions related to these charges is included in Note 4 to our consolidated fi nancial statements.
During 2009, the U.S. recession had a signifi cant negative impact on demand for FedEx Offi ce services, resulting in lower revenues and continued operating losses at this reporting unit. In response to these conditions, FedEx Offi ce initiated an internal reorganiza-tion designed to improve revenue-generating capabilities and reduce costs. Several actions were taken during 2009 to reduce FedEx Offi ce’s cost structure and position it for long-term growth under better economic conditions. These actions included head-count reductions, domestic store closures and the termination of operations in some international locations. In addition, we sub-stantially curtailed future network expansion in light of current economic conditions.
The valuation methodology to estimate the fair value of the FedEx Offi ce reporting unit was based primarily on an income approach. We believe use of the income approach is an appro-priate methodology for the FedEx Offi ce reporting unit because it is the most direct method of measuring enterprise value for this reporting unit. Because of the nature of the service offerings at FedEx Offi ce, it exhibits characteristics of a retailer, a business services provider and a printing provider. Accordingly, it is dif-fi cult to fi nd directly comparable companies for use under the market approach. However, market approach information was incorporated into our test to ensure the reasonableness of our conclusions on estimated value under the income approach. Key assumptions considered were the revenue, operating income and capital expenditure forecasts, the assessed growth rate in the periods beyond the detailed forecast period, and the discount rate.
For 2009, we used a discount rate of 12.0%, versus a discount rate of 12.5% in 2008. Our discount rate of 12.0% for 2009 rep-resents our WACC of the FedEx Offi ce reporting unit adjusted for company-specifi c risk premium to account for the estimated uncertainty associated with our future cash fl ows. The develop-ment of the WACC used in our estimate of fair value considered the following key factors:
• current market conditions for the equity-risk premium and risk-free interest rate;
• benchmark capital structures for guideline companies with characteristics similar to the FedEx Offi ce reporting unit;
• the size and industry of the FedEx Offi ce reporting unit; and
• risks related to the forecast of future revenues and profi tability of the FedEx Offi ce reporting unit.
The discount rate incorporates current market participant con-siderations, as indicated above, and decreased year over year, as increases in the WACC (due to general economic conditions) were offset by reductions in the company-specifi c risk premium. The company-specifi c risk premium was reduced primarily due to lower long-term growth and profi tability assumptions associated with the 2009 forecast. The WACC used in the estimate of fair value in future periods may be impacted by changes in market conditions (including those of market participants), as well as the specifi c future performance of the FedEx Offi ce reporting unit and are subject to change, based on changes in specifi c facts and circumstances.
The key drivers of enterprise value for FedEx Offi ce in 2008 were signifi cant improvements in long-term revenue and profi tabil-ity growth, as well as continued network expansion activities. Despite the benefi ts of the internal reorganization described above, the current and projected impact of the recession and the elimination of future network expansion signifi cantly reduced the value of the FedEx Offi ce reporting unit for 2009. The valua-tion of the FedEx Offi ce reporting unit was sensitive to both the underlying forecast assumptions and the discount rate assump-tions. For example, a 50-basis-point increase or decrease in the discount rate impacted the estimate of fair value by $40 million. Further, a 100-basis-point improvement or deterioration in the operating margin in each year of the forecast period impacted the fair value by $220 million.
Upon completion of the impairment test, we concluded that the recorded goodwill was impaired and recorded an impairment charge of $810 million during the fourth quarter of 2009. The remaining goodwill attributable to the FedEx Offi ce reporting unit is $362 million as of May 31, 2009. The goodwill impairment charge is included in operating expenses in the accompanying consolidated statements of income. This charge is included in the results of the FedEx Services segment and was not allocated to our transportation segments, as the charge was unrelated to the core performance of those businesses.
FedEx National LTL Goodwill. During 2009, the U.S. recession had a signifi cant negative impact on the LTL industry, resulting in steep volume declines, intense yield pressure and the exit of numerous small to medium competitors from the market. The out-look for the LTL market is uncertain due to the recession and the negative impact of aggressive pricing resulting from continued excess capacity in the market. The results for the FedEx National LTL reporting unit in 2009 refl ect the impact of the recession, with reduced revenues and increased operating losses.
The valuation methodology to estimate the fair value of the FedEx National LTL reporting unit was based primarily on a mar-ket approach (revenue multiples and/or earnings multiples) that considered market participant assumptions. We believe use of the market approach for FedEx National LTL is appropriate due to the forecast risk associated with the projections used under the income approach, particularly in the outer years of the forecast period (as described below). Further, there are directly com-parable companies to the FedEx National LTL reporting unit for consideration under the market approach. The income approach also was incorporated into the impairment test to ensure the rea-sonableness of our conclusions under the market approach. Key assumptions considered were the revenue, operating income and capital expenditure forecasts and market participant assump-tions on multiples related to revenue and earnings forecasts.
The forecast used in the valuation assumes operating losses will continue in the near-term due to the current economic condi-tions and excess capacity in the industry. However, the long-term outlook assumes that this excess capacity exits the market. This assumption drives signifi cant volume and yield improvement into the FedEx National LTL reporting unit in future periods. The decision to include an assumption related to the elimination of excess capacity from the market and the associated cash fl ows is signifi cant to the valuation and refl ects management’s outlook on the industry for future periods as of the valuation date.

FEDEX CORPORATION
34
In 2008, the estimated value of the FedEx National LTL reporting unit was attributable to its long-term cash-generating capa-bilities, and the forecasts used to value the reporting unit were prepared prior to the severe impact of the U.S. recession on its business. Although the forecast used in the valuation assumes long-term profi tability resulting from the elimination of excess capacity from the market, recent operating losses combined with projected near-term operating losses for the FedEx National LTL reporting unit, resulted in a signifi cant reduction in the value of this business from 2008. Accordingly, we recorded an impair-ment charge of $90 million during the fourth quarter of 2009. This charge represented substantially all of the goodwill resulting from this acquisition. The goodwill impairment charge is included in operating expenses in the accompanying consolidated state-ments of income and is included in the results of the FedEx Freight segment.
Other Reporting Units Goodwill. Our remaining reporting units with signifi cant recorded goodwill (excluding FedEx Offi ce and FedEx National LTL) include our FedEx Express reporting unit and our FedEx Freight reporting unit. We evaluated our remain-ing reporting units during the fourth quarter of 2009, and while the estimated fair value of these reporting units declined from 2008, the estimated fair value of each of our other reporting units signifi cantly exceeded their carrying values in 2009. As a result, no additional testing or impairment charges were necessary.
CONTINGENCIESWe are subject to various loss contingencies, including tax proceedings and litigation, in connection with our operations. Contingent liabilities are diffi cult to measure, as their measure-ment is subject to multiple factors that are not easily predicted or projected. Further, additional complexity in measuring these liabilities arises due to the various jurisdictions in which these matters occur, which makes our ability to predict their outcome highly uncertain. Moreover, different accounting rules must be employed to account for these items based on the nature of the contingency. Accordingly, signifi cant management judgment is required to assess these matters and to make determinations about the measurement of a liability, if any. Our material pending loss contingencies are described in Note 17 to our consolidated fi nancial statements. In the opinion of management, the aggre-gate liability, if any, of individual matters or groups of matters not specifi cally described in Note 17 is not expected to be material to our fi nancial position, results of operations or cash fl ows. The following describes our method and associated processes for evaluating these matters.
Tax Contingencies. We are subject to income and operating tax rules of the U.S., and its states and municipalities, and of the foreign jurisdictions in which we operate. Signifi cant judgment is required in determining income tax provisions, as well as deferred tax asset and liability balances, due to the complexity of these rules and their interaction with one another. We account for income taxes under SFAS 109, “Accounting for Income Taxes,” by recording both current taxes payable and deferred tax assets and liabilities. Our provision for income taxes is based on domestic and international statutory income tax rates in the jurisdictions in which we operate, applied to taxable income, reduced by appli-cable tax credits.
We account for operating taxes based on multi-state, local and foreign taxing jurisdiction rules in those areas in which we oper-ate. Provisions for operating taxes are estimated based upon these rules, asset acquisitions and disposals, historical spend and other variables. These provisions are consistently evaluated for reasonableness against compliance and risk factors.
Tax contingencies arise from uncertainty in the application of tax rules throughout the many jurisdictions in which we operate. These tax contingencies are impacted by several factors, includ-ing tax audits, appeals, litigation, changes in tax laws and other rules, and their interpretations, and changes in our business, among other things, in the various federal, state, local and foreign tax jurisdictions in which we operate. We regularly assess the potential impact of these factors for the current and prior years to determine the adequacy of our tax provisions. We continu-ally evaluate the likelihood and amount of potential adjustments and adjust our tax positions, including the current and deferred tax liabilities, in the period in which the facts that give rise to a revision become known. In addition, management considers the advice of third parties in making conclusions regarding tax consequences.
Effective June 1, 2007, we began to measure and record income tax contingency accruals in accordance with FIN 48. The cumula-tive effect of adopting FIN 48 was immaterial.
Under FIN 48, we recognize liabilities for uncertain income tax positions based on a two-step process. The fi rst step is to evalu-ate the tax position for recognition by determining if the weight of available evidence indicates that it is more likely than not that the position will be sustained on audit, including resolution of related appeals or litigation processes, if any. The second step requires us to estimate and measure the tax benefi t as the largest amount that is more than 50% likely to be realized upon ultimate settlement. It is inherently diffi cult and subjective to estimate such amounts, as we must determine the probability of various possible outcomes. We reevaluate these uncertain tax positions on a quarterly basis or when new information becomes avail-able to management. These reevaluations are based on factors including, but not limited to, changes in facts or circumstances, changes in tax law, successfully settled issues under audit and new audit activity. Such a change in recognition or measurement could result in the recognition of a tax benefi t or an increase to the related provision.
We classify interest related to income tax liabilities as interest expense, and if applicable, penalties are recognized as a com-ponent of income tax expense. The income tax liabilities and accrued interest and penalties that are due within one year of the balance sheet date are presented as current liabilities. The remaining portion of our income tax liabilities and accrued inter-est and penalties are presented as noncurrent liabilities. These noncurrent income tax liabilities are recorded in the caption “Other liabilities” in our consolidated balance sheets.
We measure and record operating tax contingency accruals in accordance with SFAS 5, “Accounting for Contingencies.” As discussed below, SFAS 5 requires an accrual of estimated loss from a contingency, such as a tax or other legal proceeding or claim, when it is probable that a loss will be incurred and the amount of the loss can be reasonably estimated.

MANAGEMENT’S DISCUSSION AND ANALYSIS
35
Other Contingencies. Because of the complex environment in which we operate, we are subject to other legal proceedings and claims, including those relating to general commercial matters, employment-related claims and FedEx Ground’s owner-operators. We account for these contingencies in accordance with SFAS 5, which requires an accrual of estimated loss from a contingency, such as a tax or other legal proceeding or claim, when it is prob-able (i.e., the future event or events are likely to occur) that a loss will be incurred and the amount of the loss can be reason-ably estimated. SFAS 5 requires disclosure of a loss contingency matter when, in management’s judgment, a material loss is rea-sonably possible or probable of occurring.
Our legal department maintains thorough processes to identify, evaluate and monitor the status of litigation and other loss con-tingencies as they arise and develop. Management has regular, comprehensive litigation and contingency reviews, including updates from internal and external counsel, to assess the need for accounting recognition of a loss or disclosure of these con-tingencies. In determining whether a loss should be accrued or a loss contingency disclosed, we evaluate, among other factors, the degree of probability of an unfavorable outcome or settlement and the ability to make a reasonable estimate of the amount of loss. Events may arise that were not anticipated and the outcome of a contingency may result in a loss to us that differs materially from our previously estimated liability.
Market Risk Sensitive Instruments and Positions
INTEREST RATESWhile we currently have market risk sensitive instruments related to interest rates, we have no signifi cant exposure to changing interest rates on our long-term debt because the interest rates are fi xed on all of our long-term debt. As disclosed in Note 6 to the accompanying consolidated fi nancial statements, we had out-standing fi xed-rate, long-term debt (exclusive of capital leases) with an estimated fair value of $2.4 billion at May 31, 2009 and $1.9 billion at May 31, 2008. Market risk for fi xed-rate, long-term debt is estimated as the potential decrease in fair value resulting from a hypothetical 10% increase in interest rates and amounts to $35 million as of May 31, 2009 and $27 million as of May 31, 2008. The underlying fair values of our long-term debt were estimated based on quoted market prices or on the current rates offered for debt with similar terms and maturities.
FOREIGN CURRENCYWhile we are a global provider of transportation, e-commerce and business services, the substantial majority of our transac-tions are denominated in U.S. dollars. The distribution of our foreign currency denominated transactions is such that foreign currency declines in some areas of the world are often offset by foreign currency gains in other areas of the world. The principal foreign currency exchange rate risks to which we are exposed are in the euro, Chinese yuan, Canadian dollar, British pound and Japanese yen. Historically, our exposure to foreign currency fl uctuations is more signifi cant with respect to our revenues than our expenses, as a signifi cant portion of our expenses are
denominated in U.S. dollars, such as aircraft and fuel expenses. During 2009, operating income was negatively impacted due to foreign currency fl uctuations. During 2008, foreign currency fl uctuations positively impacted operating income. However, favorable foreign currency fl uctuations also may have had an offsetting impact on the price we obtained or the demand for our services, which is not quantifi able. At May 31, 2009, the result of a uniform 10% strengthening in the value of the dollar relative to the currencies in which our transactions are denominated would result in a decrease in operating income of $2 million for 2010 (the comparable amount in the prior year was a decrease of $77 million, refl ecting higher international revenue in 2008). This theoretical calculation assumes that each exchange rate would change in the same direction relative to the U.S. dollar.
In practice, our experience has been that exchange rates in the principal foreign markets where we have foreign currency denominated transactions tend to have offsetting fl uctuations. Therefore, the calculation above is not indicative of our actual experience in foreign currency transactions. In addition to the direct effects of changes in exchange rates, fluctuations in exchange rates also affect the volume of sales or the foreign currency sales price as competitors’ services become more or less attractive. The sensitivity analysis of the effects of changes in foreign currency exchange rates does not factor in a potential change in sales levels or local currency prices.
COMMODITYWhile we have market risk for changes in the price of jet and vehicle fuel, this risk is largely mitigated by our fuel surcharges because our fuel surcharges are closely linked to market prices for fuel. Therefore, a hypothetical 10% change in the price of fuel would not be expected to materially affect our earnings.
However, our fuel surcharges have a timing lag (approximately six to eight weeks for FedEx Express and FedEx Ground) before they are adjusted for changes in fuel prices. Our fuel surcharge index also allows fuel prices to fl uctuate approximately 2% for FedEx Express and approximately 3% for FedEx Ground before an adjustment to the fuel surcharge occurs. Accordingly, our oper-ating income in a specifi c period may be signifi cantly affected should the spot price of fuel suddenly change by a substantial amount or change by amounts that do not result in an adjustment in our fuel surcharges.
OTHERWe do not purchase or hold any derivative fi nancial instruments for trading purposes.
Risk FactorsOur fi nancial and operating results are subject to many risks and uncertainties, as described below.
Our businesses depend on our strong reputation and the value of the FedEx brand. The FedEx brand name symbolizes high-quality service, reliability and speed. FedEx is one of the most widely recognized, trusted and respected brands in the world, and the FedEx brand is one of our most important and valuable assets. In addition, we have a strong reputation among customers and the

FEDEX CORPORATION
36
general public for high standards of social and environmental responsibility and corporate governance and ethics. The FedEx brand name and our corporate reputation are powerful sales and marketing tools, and we devote signifi cant resources to pro-moting and protecting them. Adverse publicity (whether or not justifi ed) relating to activities by our employees, contractors or agents could tarnish our reputation and reduce the value of our brand. Damage to our reputation and loss of brand equity could reduce demand for our services and thus have an adverse effect on our fi nancial condition, liquidity and results of operations, as well as require additional resources to rebuild our reputation and restore the value of our brand.
Labor organizations attempt to organize groups of our employees from time to time, and potential changes in labor laws could make it easier for them to do so. If we are unable to continue to maintain good relationships with our employees and prevent labor organi-zations from organizing groups of our employees, our operating costs could signifi cantly increase and our operational fl exibil-ity could be signifi cantly reduced. Despite continual organizing attempts by labor unions, besides the pilots of FedEx Express, all of our U.S. employees have thus far chosen not to unionize. The U.S. Congress is considering adopting changes in labor laws, however, that would make it easier for unions to organize small units of our employees. For example, in May 2009, the U.S. House of Representatives passed the FAA Reauthorization Act, which includes a provision that would remove most FedEx Express employees from the purview of the Railway Labor Act of 1926, as amended (the “RLA”). Should the House version of the FAA Reauthorization Act (or a similar bill removing FedEx Express from RLA jurisdiction) be passed by the entire Congress and signed into law by the President, it could expose our customers to the type of service disruptions that the RLA was designed to prevent — local work stoppages in key areas that interrupt the timely fl ow of shipments of time-sensitive, high-value goods throughout our global network. Such disruptions could threaten our ability to pro-vide competitively priced shipping options and ready access to global markets. There is also the possibility that the U.S. Congress could pass other labor legislation, such as the currently proposed Employee Free Choice Act (the “EFCA”) (also called “card-check legislation”), that could adversely affect our companies, such as FedEx Ground and FedEx Freight, whose employees are gov-erned by the National Labor Relations Act of 1935, as amended (the “NLRA”). The EFCA would amend the NLRA to substantially liberalize the procedures for union organization — for example, by eliminating employees’ absolute right to a secret ballot vote in union elections. The EFCA could also require imposition of an arbitrated initial contract that could include pay, benefi t and work rules that could adversely impact employers.
We rely heavily on technology to operate our transportation and business networks, and any disruption to our technology infrastructure or the Internet could harm our operations and our reputation among customers. Our ability to attract and retain customers and to compete effectively depends in part upon the sophistication and reliability of our technology network, includ-ing our ability to provide features of service that are important to our customers. Any disruption to the Internet or our technology infrastructure, including those impacting our computer systems and Web site, could adversely impact our customer service and our volumes and revenues and result in increased costs. While
we have invested and continue to invest in technology security initiatives and disaster recovery plans, these measures cannot fully insulate us from technology disruptions and the resulting adverse effect on our operations and fi nancial results.
Our transportation businesses may be impacted by the price and availability of fuel. We must purchase large quantities of fuel to operate our aircraft and vehicles, and the price and availability of fuel can be unpredictable and beyond our control. To date, we have been mostly successful in mitigating the expense impact of higher fuel costs through our indexed fuel surcharges, as the amount of the surcharges is closely linked to the market prices for fuel. If we are unable to maintain or increase our fuel surcharges because of competitive pricing pressures or some other reason, fuel costs could adversely impact our operating results. Even if we are able to offset the cost of fuel with our surcharges, high fuel surcharges could move our customers, especially in the U.S. domestic market, away from our higher-yielding express services to our lower-yielding ground services or even reduce customer demand for our services altogether. These effects were evident in the fi rst quarter of 2009, as fuel prices reached all-time highs. In addition, disruptions in the supply of fuel could have a negative impact on our ability to operate our transportation networks.
Our businesses are capital intensive, and we must make capi-tal expenditures based upon projected volume levels. We make signifi cant investments in aircraft, vehicles, technology, package handling facilities, sort equipment, copy equipment and other assets to support our transportation and business networks. We also make signifi cant investments to rebrand, integrate and grow the companies that we acquire. The amount and timing of capital investments depend on various factors, including our anticipated volume growth. For example, we must make commitments to purchase or modify aircraft years before the aircraft are actually needed. We must predict volume levels and fl eet requirements and make commitments for aircraft based on those projections. Missing our projections could result in too much or too little capac-ity relative to our shipping volumes. Overcapacity could lead to asset dispositions or write-downs and undercapacity could nega-tively impact service levels. For example, recent and current weak economic conditions and the delivery of newer, more fuel-effi cient aircraft have led to excess aircraft capacity at FedEx Express. As a result, during the fourth quarter of 2009, we decided to per-manently remove 14 aircraft and certain excess aircraft engines from service and thus recorded a charge of $191 million. A limited number of other aircraft remain temporarily grounded because of network overcapacity, and any future decisions to further alter our networks by eliminating additional aircraft or other assets may lead to additional asset impairment charges.
We face intense competition, especially during the current global recession. The transportation and business services markets are both highly competitive and sensitive to price and service, espe-cially in periods of little or no macro-economic growth. Some of our competitors have more fi nancial resources than we do, or they are controlled or subsidized by foreign governments, which enables them to raise capital more easily. We believe we compete effectively with these companies — for example, by providing more reliable service at compensatory prices. However, our com-petitors determine the charges for their services, and the current global recession has led to a very competitive pricing environ-ment within our industries. If the pricing environment becomes
37
FEDEX CORPORATION
irrational, it could limit our ability to maintain or increase our prices (including our fuel surcharges in response to rising fuel costs) or to maintain or grow our market share. In addition, main-taining a broad portfolio of services is important to keeping and attracting customers. While we believe we compete effectively through our current service offerings, if our competitors offer a broader range of services or more effectively bundle their ser-vices, it could impede our ability to maintain or grow our market share.
If we do not effectively operate, integrate, leverage and grow acquired businesses, our fi nancial results and reputation may suffer. Our strategy for long-term growth, productivity and profi t-ability depends in part on our ability to make prudent strategic acquisitions and to realize the benefi ts we expect when we make those acquisitions. In furtherance of this strategy, during 2007 we acquired the LTL freight operations of Watkins Motor Lines (renamed FedEx National LTL) and made strategic acquisitions in China, the United Kingdom and India. During 2004, we acquired Kinko’s, Inc. (now known as FedEx Offi ce). While we expect our past and future acquisitions to enhance our value proposition to customers and improve our long-term profi tability, there can be no assurance that we will realize our expectations within the time frame we have established, if at all, or that we can continue to support the value we allocate to these acquired businesses, including their goodwill or other intangible assets. As an exam-ple, during 2008 and 2009, we recorded aggregate charges of $1.8 billion for impairment of the value of the Kinko’s trade name and portions of the goodwill recorded as a result of the Kinko’s and Watkins Motor Lines acquisitions. These charges were nec-essary, among other reasons, because the recent and forecasted fi nancial performance of those companies did not meet our origi-nal expectations as a result of weak economic conditions.
FedEx Ground relies on owner-operators to conduct its line-haul and pickup-and-delivery operations, and the status of these owner-operators as independent contractors, rather than employees, is being challenged. FedEx Ground’s use of inde-pendent contractors is well suited to the needs of the ground delivery business and its customers, as evidenced by the strong growth of this business segment. We are involved in numerous class-action lawsuits (including many that have been certifi ed as class actions), several individual lawsuits and numerous tax and other administrative proceedings that claim that the com-pany’s owner-operators or their drivers should be treated as our employees, rather than independent contractors. We expect to incur certain costs, including legal fees, in defending the status of FedEx Ground’s owner-operators as independent contractors. We believe that FedEx Ground’s owner-operators are properly classifi ed as independent contractors and that FedEx Ground is not an employer of the drivers of the company’s independent contractors. However, adverse determinations in these matters could, among other things, entitle certain of our contractors and their drivers to the reimbursement of certain expenses and to the benefi t of wage-and-hour laws and result in employment and withholding tax and benefi t liability for FedEx Ground, and could result in changes to the independent contractor status of FedEx Ground’s owner-operators. If FedEx Ground is compelled to convert its independent contractors to employees, labor organizations could more easily organize these individuals, our
operating costs could increase materially and we could incur signifi cant capital outlays.
Increased security requirements could impose substantial costs on us, especially at FedEx Express. As a result of concerns about global terrorism and homeland security, governments around the world are adopting or are considering adopting stricter security requirements that will increase operating costs for businesses, including those in the transportation industry. For example, in July 2007, the U.S. Transportation Security Administration issued to us a Full All-Cargo Aircraft Operator Standard Security Plan, which contained many new and enhanced security requirements. These requirements are not static, but will change periodically as the result of regulatory and legislative requirements, and to respond to evolving threats. Until these requirements are adopted, we cannot determine the effect that these new rules will have on our cost structure or our operating results. It is reasonably possible, however, that these rules or other future security requirements could impose material costs on us.
The regulatory environment for global aviation rights may impact our air operations. Our extensive air network is critical to our suc-cess. Our right to serve foreign points is subject to the approval of the Department of Transportation and generally requires a bilateral agreement between the United States and foreign gov-ernments. In addition, we must obtain the permission of foreign governments to provide specifi c fl ights and services. Regulatory actions affecting global aviation rights or a failure to obtain or maintain aviation rights in important international markets could impair our ability to operate our air network.
We may be affected by global climate change or by legal, regula-tory or market responses to such change. Concern over climate change, including the impact of global warming, has led to sig-nifi cant U.S. and international legislative and regulatory efforts to limit greenhouse gas (“GHG”) emissions. For example, dur-ing 2009, the European Commission approved the extension of the European Union Emissions Trading Scheme (“ETS”) for GHG emissions, to the airline industry. We believe this decision vio-lates international treaties and air services agreements and is likely to be challenged by the U.S. Government. If the decision stands, however, then all FedEx Express fl ights to and from any airport in any member state of the European Union would be covered by the ETS requirements beginning in 2012, and each year we would be required to submit emission allowances in an amount equal to the carbon dioxide emissions from such fl ights. In addition, the U.S. House of Representatives has passed and the Senate is currently considering a bill that would regulate GHG emissions, and some form of federal climate change legislation is possible in the relatively near future. Increased regulation regarding GHG emissions, especially aircraft or diesel engine emissions, could impose substantial costs on us, especially at FedEx Express. These costs include an increase in the cost of the fuel and other energy we purchase and capital costs associ-ated with updating or replacing our aircraft or trucks prematurely. Until the timing, scope and extent of such regulation becomes known, we cannot predict its effect on our cost structure or our operating results. It is reasonably possible, however, that it could impose material costs on us. Moreover, even without such regulation, increased awareness and any adverse publicity in the global marketplace about the GHGs emitted by companies in the

FEDEX CORPORATION
38
airline and transportation industries could harm our reputation and reduce customer demand for our services, especially our air express services.
We are also subject to risks and uncertainties that affect many other businesses, including:
• the impact of any international confl icts or terrorist activities on the United States and global economies in general, the trans-portation industry or us in particular, and what effects these events will have on our costs or the demand for our services;
• any impacts on our businesses resulting from new domestic or international government laws and regulation, including tax, accounting, trade (such as protectionist measures enacted in response to the current weak economic conditions), labor (such as card-check legislation), environmental (such as cli-mate change legislation) or postal rules;
• our ability to manage our cost structure for capital expenditures and operating expenses, and match it to shifting and future cus-tomer volume levels;
• changes in foreign currency exchange rates, especially in the euro, Chinese yuan, Canadian dollar, British pound and Japanese yen, which can affect our sales levels and foreign currency sales prices;
• increasing costs, the volatility of costs and legal mandates for employee benefits, especially pension and healthcare benefi ts;
• signifi cant changes in the volumes of shipments transported through our networks, customer demand for our various ser-vices or the prices we obtain for our services;
• market acceptance of our new service and growth initiatives;
• any liability resulting from and the costs of defending against class-action litigation, such as wage-and-hour and discrimina-tion and retaliation claims, patent litigation, and any other legal proceedings;
• the impact of technology developments on our operations and on demand for our services;
• adverse weather conditions or natural disasters, such as earth-quakes and hurricanes, which can disrupt electrical service, damage our property, disrupt our operations, increase fuel costs and adversely affect shipment levels;
• widespread outbreak of an illness or any other communicable disease, or any other public health crisis;
• availability of fi nancing on terms acceptable to us and our abil-ity to maintain our current credit ratings, especially given the capital intensity of our operations and the current volatility of credit markets; and
• credit losses from our customers’ inability or unwillingness to pay for previously provided services as a result of, among other things, weak economic conditions and tight credit markets.
We are directly affected by the state of the economy. While the global, or macro-economic, risks listed above apply to most companies, we are particularly vulnerable. The transportation
industry is highly cyclical and especially susceptible to trends in economic activity, such as the current global recession. Our primary business is to transport goods, so our business levels are directly tied to the purchase and production of goods — key macro-economic measurements. When individuals and compa-nies purchase and produce fewer goods, we transport fewer goods. In addition, we have a relatively high fi xed-cost struc-ture, which is diffi cult to quickly adjust to match shifting volume levels. Moreover, as we grow our international business, we are increasingly affected by the health of the global economy. As a result, the current global recession has had a disproportionately negative impact on us and our recent fi nancial results.
Forward-Looking StatementsCertain statements in this report, including (but not limited to) those contained in “Outlook (including segment outlooks),” “Liquidity,” “Capital Resources,” “Liquidity Outlook,” “Contractual Cash Obligations” and “Critical Accounting Estimates,” and the “Retirement Plans” and “Contingencies” notes to the consoli-dated fi nancial statements, are “forward-looking” statements within the meaning of the Private Securities Litigation Reform Act of 1995 with respect to our fi nancial condition, results of operations, cash fl ows, plans, objectives, future performance and business. Forward-looking statements include those preceded by, followed by or that include the words “may,” “could,” “would,” “should,” “believes,” “expects,” “anticipates,” “plans,” “esti-mates,” “targets,” “projects,” “intends” or similar expressions. These forward-looking statements involve risks and uncertain-ties. Actual results may differ materially from those contemplated (expressed or implied) by such forward-looking statements, because of, among other things, the risk factors identifi ed above and the other risks and uncertainties you can fi nd in our press releases and SEC fi lings.
As a result of these and other factors, no assurance can be given as to our future results and achievements. Accordingly, a forward-looking statement is neither a prediction nor a guarantee of future events or circumstances and those future events or cir-cumstances may not occur. You should not place undue reliance on the forward-looking statements, which speak only as of the date of this report. We are under no obligation, and we expressly disclaim any obligation, to update or alter any forward-looking statements, whether as a result of new information, future events or otherwise.

39
FEDEX CORPORATION
Management’s Report on Internal Control Over Financial ReportingOur management is responsible for establishing and maintaining adequate internal control over fi nancial reporting (as defi ned in Rules 13a-15(f) and 15d-15(f) under the Securities Exchange Act of 1934, as amended). Our internal control over fi nancial reporting includes, among other things, defi ned policies and procedures for conducting and governing our business, sophisticated information systems for processing transactions and a properly staffed, professional internal audit department. Mechanisms are in place to monitor the effectiveness of our internal control over fi nancial reporting and actions are taken to correct defi ciencies identifi ed. Our procedures for fi nancial reporting include the active involvement of senior management, our Audit Committee and our staff of highly qualifi ed fi nancial and legal professionals.
Management, with the participation of our principal executive and fi nancial offi cers, assessed our internal control over fi nancial reporting as of May 31, 2009, the end of our fi scal year. Management based its assessment on criteria established in Internal Control–Integrated Framework issued by the Committee of Sponsoring Organizations of the Treadway Commission (the COSO criteria).
Based on this assessment, management has concluded that our internal control over fi nancial reporting was effective as of May 31, 2009.
The effectiveness of our internal control over fi nancial reporting as of May 31, 2009, has been audited by Ernst & Young LLP, the inde-pendent registered public accounting fi rm who also audited the Company’s consolidated fi nancial statements included in this Annual Report. Ernst & Young LLP’s report on the Company’s internal control over fi nancial reporting is included in this Annual Report .

FEDEX CORPORATION
40
Report of Independent Registered Public Accounting FirmThe Board of Directors and Stockholders FedEx Corporation
We have audited FedEx Corporation’s internal control over financial reporting as of May 31, 2009, based on criteria established in Internal Control — Integrated Framework issued by the Committee of Sponsoring Organizations of the Treadway Commission (the COSO criteria). FedEx Corporation’s management is responsible for maintaining effective internal control over financial reporting, and for its assessment of the effectiveness of internal control over financial reporting included in the accompanying Management’s Report on Internal Control over Financial Reporting. Our responsibility is to express an opinion on the company’s internal control over financial reporting based on our audit.
We conducted our audit in accordance with the standards of the Public Company Accounting Oversight Board (United States). Those standards require that we plan and perform the audit to obtain reasonable assurance about whether effective internal control over financial reporting was maintained in all material respects. Our audit included obtaining an understanding of internal control over financial reporting, assessing the risk that a material weakness exists, testing and evaluating the design and operating effectiveness of internal control based on the assessed risk, and performing such other procedures as we considered necessary in the circumstances. We believe that our audit provides a reasonable basis for our opinion.
A company’s internal control over financial reporting is a process designed to provide reasonable assurance regarding the reliabil-ity of financial reporting and the preparation of financial statements for external purposes in accordance with generally accepted accounting principles. A company’s internal control over financial reporting includes those policies and procedures that (1) pertain to the maintenance of records that, in reasonable detail, accurately and fairly reflect the transactions and dispositions of the assets of the company; (2) provide reasonable assurance that transactions are recorded as necessary to permit preparation of financial state-ments in accordance with generally accepted accounting principles, and that receipts and expenditures of the company are being made only in accordance with authorizations of management and directors of the company; and (3) provide reasonable assurance regarding prevention or timely detection of unauthorized acquisition, use, or disposition of the company’s assets that could have a material effect on the financial statements.
Because of its inherent limitations, internal control over financial reporting may not prevent or detect misstatements. Also, projections of any evaluation of effectiveness to future periods are subject to the risk that controls may become inadequate because of changes in conditions, or that the degree of compliance with the policies or procedures may deteriorate.
In our opinion, FedEx Corporation maintained, in all material respects, effective internal control over financial reporting as of May 31, 2009, based on the COSO criteria.
We also have audited, in accordance with the standards of the Public Company Accounting Oversight Board (United States), the consolidated balance sheets of FedEx Corporation as of May 31, 2009 and 2008, and the related consolidated statements of income, changes in stockholders’ investment and comprehensive income, and cash flows for each of the three years in the period ended May 31, 2009 of FedEx Corporation and our report dated July 10, 2009 expressed an unqualified opinion thereon.
Memphis, TennesseeJuly 10, 2009

41
FEDEX CORPORATION
Consolidated Statements of Income Years ended May 31,(In millions, except per share amounts) 2009 2008 2007
REVENUES $ 35,497 $ 37,953 $ 35,214OPERATING EXPENSES: Salaries and employee benefi ts 13,767 14,202 13,740 Purchased transportation 4,534 4,634 3,978 Rentals and landing fees 2,429 2,441 2,343 Depreciation and amortization 1,975 1,946 1,742 Fuel 3,811 4,409 3,428 Maintenance and repairs 1,898 2,068 1,952 Impairment and other charges 1,204 882 – Other 5,132 5,296 4,755 34,750 35,878 31,938
OPERATING INCOME 747 2,075 3,276OTHER INCOME (EXPENSE): Interest expense (85) (98) (136) Interest income 26 44 83 Other, net (11) (5) (8) (70) (59) (61)INCOME BEFORE INCOME TAXES 677 2,016 3,215PROVISION FOR INCOME TAXES 579 891 1,199NET INCOME $ 98 $ 1,125 $ 2,016BASIC EARNINGS PER COMMON SHARE $ 0.31 $ 3.64 $ 6.57 DILUTED EARNINGS PER COMMON SHARE $ 0.31 $ 3.60 $ 6.48
The accompanying notes are an integral part of these consolidated fi nancial statements.
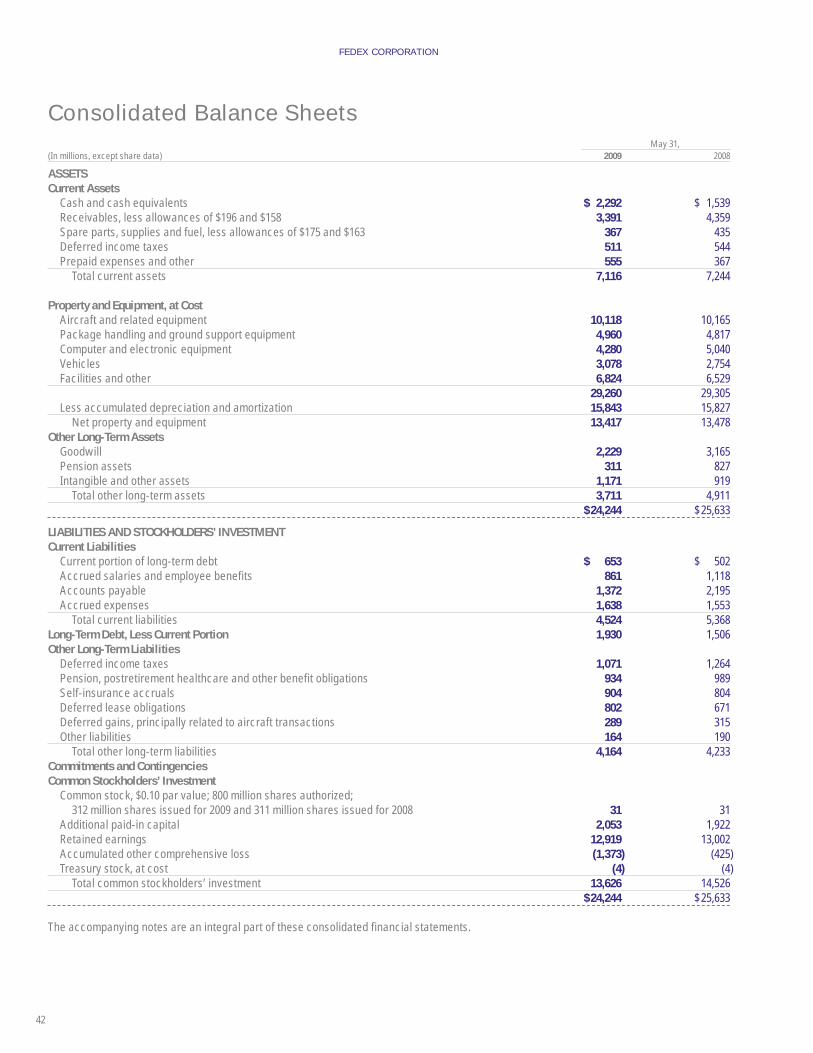
42
FEDEX CORPORATION
Consolidated Balance Sheets May 31,(In millions, except share data) 2009 2008
ASSETSCurrent Assets Cash and cash equivalents $ 2,292 $ 1,539 Receivables, less allowances of $196 and $158 3,391 4,359 Spare parts, supplies and fuel, less allowances of $175 and $163 367 435 Deferred income taxes 511 544 Prepaid expenses and other 555 367 Total current assets 7,116 7,244 Property and Equipment, at Cost Aircraft and related equipment 10,118 10,165 Package handling and ground support equipment 4,960 4,817 Computer and electronic equipment 4,280 5,040 Vehicles 3,078 2,754 Facilities and other 6,824 6,529 29,260 29,305 Less accumulated depreciation and amortization 15,843 15,827 Net property and equipment 13,417 13,478Other Long-Term Assets Goodwill 2,229 3,165 Pension assets 311 827 Intangible and other assets 1,171 919 Total other long-term assets 3,711 4,911 $ 24,244 $ 25,633
LIABILITIES AND STOCKHOLDERS’ INVESTMENT Current Liabilities Current portion of long-term debt $ 653 $ 502 Accrued salaries and employee benefi ts 861 1,118 Accounts payable 1,372 2,195 Accrued expenses 1,638 1,553 Total current liabilities 4,524 5,368 Long-Term Debt, Less Current Portion 1,930 1,506 Other Long-Term Liabilities Deferred income taxes 1,071 1,264 Pension, postretirement healthcare and other benefi t obligations 934 989 Self-insurance accruals 904 804 Deferred lease obligations 802 671 Deferred gains, principally related to aircraft transactions 289 315 Other liabilities 164 190 Total other long-term liabilities 4,164 4,233 Commitments and Contingencies Common Stockholders’ Investment Common stock, $0.10 par value; 800 million shares authorized; 312 million shares issued for 2009 and 311 million shares issued for 2008 31 31 Additional paid-in capital 2,053 1,922 Retained earnings 12,919 13,002 Accumulated other comprehensive loss (1,373) (425) Treasury stock, at cost (4) (4) Total common stockholders’ investment 13,626 14,526 $ 24,244 $ 25,633
The accompanying notes are an integral part of these consolidated fi nancial statements.

43
FEDEX CORPORATION
Consolidated Statements of Cash Flows Years ended May 31,(In millions) 2009 2008 2007
OPERATING ACTIVITIES Net income $ 98 $ 1,125 $ 2,016 Adjustments to reconcile net income to cash provided by operating activities: Depreciation and amortization 1,975 1,946 1,742 Provision for uncollectible accounts 181 134 106 Deferred income taxes and other noncash items 299 124 37 Noncash impairment charges 1,103 882 – Stock-based compensation 99 101 103 Changes in operating assets and liabilities, net of the effects of businesses acquired: Receivables 762 (447) (323) Other assets (196) (237) (85) Pension assets and liabilities, net (913) (273) (69) Accounts payable and other liabilities (628) 190 66 Other, net (27) (80) (36) Cash provided by operating activities 2,753 3,465 3,557
INVESTING ACTIVITIES Capital expenditures (2,459) (2,947) (2,882) Business acquisitions, net of cash acquired (3) (4) (1,310) Proceeds from asset dispositions and other 79 54 68 Cash used in investing activities (2,383) (2,897) (4,124)
FINANCING ACTIVITIES Principal payments on debt (501) (639) (906) Proceeds from debt issuances 1,000 – 1,054 Proceeds from stock issuances 41 108 115 Excess tax benefi ts on the exercise of stock options 4 38 45 Dividends paid (137) (124) (110) Other, net (7) – (5) Cash provided by (used in) fi nancing activities 400 (617) 193
CASH AND CASH EQUIVALENTS Effect of exchange rate changes on cash (17) 19 6Net increase (decrease) in cash and cash equivalents 753 (30) (368) Cash and cash equivalents at beginning of period 1,539 1,569 1,937 Cash and cash equivalents at end of period $ 2,292 $ 1,539 $ 1,569
The accompanying notes are an integral part of these consolidated fi nancial statements.
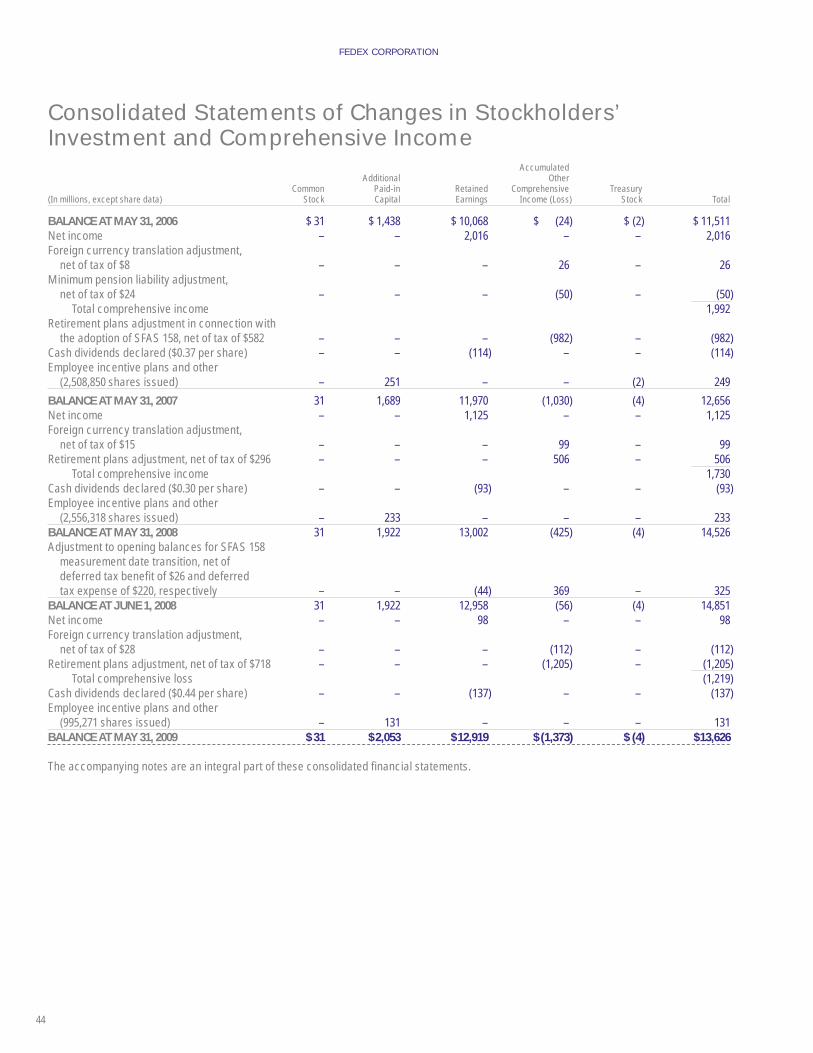
FEDEX CORPORATION
44
Consolidated Statements of Changes in Stockholders’ Investment and Comprehensive Income Accumulated Additional Other Common Paid-in Retained Comprehensive Treasury(In millions, except share data) Stock Capital Earnings Income (Loss) Stock Total
BALANCE AT MAY 31, 2006 $ 31 $ 1,438 $ 10,068 $ (24) $ (2) $ 11,511 Net income – – 2,016 – – 2,016 Foreign currency translation adjustment, net of tax of $8 – – – 26 – 26 Minimum pension liability adjustment, net of tax of $24 – – – (50) – (50) Total comprehensive income 1,992 Retirement plans adjustment in connection with the adoption of SFAS 158, net of tax of $582 – – – (982) – (982)Cash dividends declared ($0.37 per share) – – (114) – – (114)Employee incentive plans and other (2,508,850 shares issued) – 251 – – (2) 249
BALANCE AT MAY 31, 2007 31 1,689 11,970 (1,030) (4) 12,656 Net income – – 1,125 – – 1,125 Foreign currency translation adjustment, net of tax of $15 – – – 99 – 99 Retirement plans adjustment, net of tax of $296 – – – 506 – 506 Total comprehensive income 1,730 Cash dividends declared ($0.30 per share) – – (93) – – (93)Employee incentive plans and other (2,556,318 shares issued) – 233 – – – 233BALANCE AT MAY 31, 2008 31 1,922 13,002 (425) (4) 14,526Adjustment to opening balances for SFAS 158 measurement date transition, net of deferred tax benefi t of $26 and deferred tax expense of $220, respectively – – (44) 369 – 325BALANCE AT JUNE 1, 2008 31 1,922 12,958 (56) (4) 14,851Net income – – 98 – – 98Foreign currency translation adjustment, net of tax of $28 – – – (112) – (112) Retirement plans adjustment, net of tax of $718 – – – (1,205) – (1,205) Total comprehensive loss (1,219) Cash dividends declared ($0.44 per share) – – (137) – – (137)Employee incentive plans and other (995,271 shares issued) – 131 – – – 131 BALANCE AT MAY 31, 2009 $ 31 $ 2,053 $ 12,919 $ (1,373) $ (4) $ 13,626
The accompanying notes are an integral part of these consolidated fi nancial statements.

NOTES TO CONSOLIDATED FINANCIAL STATEMENTS
45
Note 1: Description of Business and Summary of Signifi cant Accounting PoliciesDESCRIPTION OF BUSINESSFedEx Corporation (“FedEx”) provides a broad portfolio of trans-portation, e-commerce and business services through companies competing collectively, operating independently and managed collaboratively, under the respected FedEx brand. Our primary operating companies include Federal Express Corporation (“FedEx Express”), the world’s largest express transportation company; FedEx Ground Package System, Inc. (“FedEx Ground”), a leading provider of small-package ground delivery services; and FedEx Freight Corporation, a leading U.S. provider of less-than-truckload (“LTL”) freight services. Our FedEx Services segment provides customer-facing sales, marketing, information technology and customer service support to our transportation segments. In addition, the FedEx Services segment provides cus-tomers with retail access to FedEx Express and FedEx Ground shipping services through FedEx Offi ce and Print Services, Inc. (“FedEx Offi ce”). These companies represent our major service lines and form the core of our reportable segments.
FISCAL YEARSExcept as otherwise specified, references to years indicate our fiscal year ended May 31, 2009 or ended May 31 of the year referenced.
PRINCIPLES OF CONSOLIDATIONThe consolidated fi nancial statements include the accounts of FedEx and its subsidiaries, substantially all of which are wholly owned. All signifi cant intercompany accounts and transactions have been eliminated in consolidation.
RECLASSIFICATIONSCertain reclassifi cations have been made to prior year fi nan-cial statements to conform to the current year presentation. For example, at FedEx Ground certain fuel supplement costs related to our independent contractors were reclassified from fuel expense to purchased transportation to conform to the current period presentation.
REVENUE RECOGNITIONWe recognize revenue upon delivery of shipments for our trans-portation businesses and upon completion of services for our business services, logistics and trade services businesses. Certain of our transportation services are provided with the use of independent contractors. FedEx is the principal to the transaction in most instances and in those cases revenue from these trans-actions is recognized on a gross basis. Costs associated with independent contractor settlements are recognized as incurred and included in the caption “Purchased transportation” in the accompanying consolidated statements of income. For shipments in transit, revenue is recorded based on the percentage of service completed at the balance sheet date. Estimates for future billing adjustments to revenue and accounts receivable are recognized at the time of shipment for money-back service guarantees and billing corrections. Delivery costs are accrued as incurred.
Our contract logistics, global trade services and certain transpor-tation businesses engage in some transactions wherein they act as agents. Revenue from these transactions is recorded on a net basis. Net revenue includes billings to customers less third-party charges, including transportation or handling costs, fees, commis-sions, and taxes and duties. These amounts are not material.
Certain of our revenue-producing transactions are subject to taxes assessed by governmental authorities, such as sales tax. We present these revenues net of tax.
CREDIT RISKWe routinely grant credit to many of our customers for transpor-tation and business services without collateral. The risk of credit loss in our trade receivables is substantially mitigated by our credit evaluation process, short collection terms and sales to a large number of customers, as well as the low revenue per trans-action for most of our services. Allowances for potential credit losses are determined based on historical experience and current evaluation of the composition of accounts receivable. Historically, credit losses have been within management’s expectations.
ADVERTISINGAdvertising and promotion costs are expensed as incurred and are classifi ed in other operating expenses. Advertising and pro-motion expenses were $379 million in 2009, $445 million in 2008 and $406 million in 2007.
CASH EQUIVALENTSCash in excess of current operating requirements is invested in short-term, interest-bearing instruments with maturities of three months or less at the date of purchase and is stated at cost, which approximates market value.
SPARE PARTS, SUPPLIES AND FUELSpare parts (principally aircraft related) are reported at weighted-average cost. Supplies and fuel are reported at average cost, which approximates actual cost on a first-in, first-out basis. Allowances for obsolescence are provided for spare parts expected to be on hand at the date the aircraft are retired from service. These allowances are provided over the estimated useful life of the related aircraft and engines. Additionally, allowances for obsolescence are provided for spare parts currently identifi ed as excess or obsolete. These allowances are based on manage-ment estimates, which are subject to change.
PROPERTY AND EQUIPMENTExpenditures for major additions, improvements, fl ight equipment modifi cations and certain equipment overhaul costs are capitalized when such costs are determined to extend the useful life of the asset or are part of the cost of acquiring the asset. Maintenance and repairs are charged to expense as incurred, except for certain aircraft-related major maintenance costs on one of our aircraft fleet types, which are capitalized as incurred and amortized over their estimated service lives. We capitalize certain direct internal and external costs associated with the development of internal-use software. Gains and losses on sales of property used in operations are classifi ed within operating expenses.
For fi nancial reporting purposes, we record depreciation and amortization of property and equipment on a straight-line basis

FEDEX CORPORATION
46
over the asset’s service life or related lease term, if shorter. For income tax purposes, depreciation is computed using acceler-ated methods when applicable. The depreciable lives and net book value of our property and equipment are as follows (dollars in millions): Net Book Value at May 31, Range 2009 2008
Wide-body aircraft and related equipment 15 to 25 years $5,139 $5,550 Narrow-body and feeder aircraft and related equipment 5 to 15 years 709 452 Package handling and ground support equipment 2 to 30 years 1,928 1,897 Computer and electronic equipment 2 to 10 years 782 943 Vehicles 3 to 15 years 1,107 1,007 Facilities and other 2 to 40 years 3,752 3,629
Substantially all property and equipment have no material resid-ual values. The majority of aircraft costs are depreciated on a straight-line basis over 15 to 18 years. We periodically evaluate the estimated service lives and residual values used to depre-ciate our property and equipment. This evaluation may result in changes in the estimated lives and residual values. Such changes did not materially affect depreciation expense in any period presented. Depreciation expense, excluding gains and losses on sales of property and equipment used in operations, was $1.8 billion in 2009, $1.8 billion in 2008 and $1.7 billion in 2007. Depreciation and amortization expense includes amortization of assets under capital lease.
CAPITALIZED INTERESTInterest on funds used to fi nance the acquisition and modifi cation of aircraft, including purchase deposits, construction of certain facilities, and development of certain software up to the date the asset is ready for its intended use is capitalized and included in the cost of the asset if the asset is actively under construction. Capitalized interest was $71 million in 2009, $50 million in 2008 and $34 million in 2007.
IMPAIRMENT OF LONG-LIVED ASSETSLong-lived assets are reviewed for impairment when circum-stances indicate the carrying value of an asset may not be recoverable. For assets that are to be held and used, an impair-ment is recognized when the estimated undiscounted cash fl ows associated with the asset or group of assets is less than their carrying value. If impairment exists, an adjustment is made to write the asset down to its fair value, and a loss is recorded as the difference between the carrying value and fair value. Fair val-ues are determined based on quoted market values, discounted cash fl ows or internal and external appraisals, as applicable. Assets to be disposed of are carried at the lower of carrying value or estimated net realizable value. We operate integrated transportation networks, and accordingly, cash fl ows for most of our operating assets are assessed at a network level, not at an individual asset level, for our analysis of impairment.
During the fourth quarter of 2009, we recorded $202 million in property and equipment impairment charges. These charges are primarily related to our April 2009 decision to permanently remove
from service 10 Airbus A310-200 aircraft and four Boeing MD10-10 aircraft owned by the company, along with certain excess aircraft engines at FedEx Express. This decision resulted in an impairment charge of $191 million, which was recorded in the fourth quarter of 2009. A limited amount of our total aircraft capacity remains temporarily grounded because of network overcapacity due to the current economic environment. There were no material property and equipment impairment charges recognized in 2008 or 2007.
GOODWILLGoodwill is recognized for the excess of the purchase price over the fair value of tangible and identifi able intangible net assets of businesses acquired. Several factors give rise to goodwill in our acquisitions, such as the expected benefi t from synergies of the combination and the existing workforce of the acquired entity. Goodwill is reviewed at least annually for impairment by compar-ing the fair value of each reporting unit with its carrying value (including attributable goodwill). Fair value for our reporting units is determined using an income or market approach incorporating market participant considerations and management’s assump-tions on revenue growth rates, operating margins, discount rates and expected capital expenditures. Fair value determinations may include both internal and third-party valuations. Unless cir-cumstances otherwise dictate, we perform our annual impairment testing in the fourth quarter.
INTANGIBLE ASSETSIntangible assets include customer relationships, trade names, technology assets and contract-based intangibles acquired in business combinations. Intangible assets are amortized over periods ranging from 2 to 15 years, either on a straight-line basis or an accelerated basis depending upon the pattern in which the economic benefi ts are realized.
PENSION AND POSTRETIREMENT HEALTHCARE PLANSOn May 31, 2007, we adopted Statement of Financial Accounting Standards (“SFAS”) 158, “Employers’ Accounting for Defi ned Benefit Pension and Other Postretirement Plans.” SFAS 158 requires recognition in the balance sheet of the funded status of defi ned benefi t pension and other postretirement benefi t plans, and the recognition in other comprehensive income (“OCI”) of unrecognized gains or losses and prior service costs or credits. The adoption of SFAS 158 resulted in a $982 million charge to shareholders’ equity at May 31, 2007 through accumulated other comprehensive income (“AOCI”).
Additionally, SFAS 158 requires the measurement date for plan assets and liabilities to coincide with the plan sponsor’s year end. On June 1, 2008, we made our transition election for the measurement date provision of SFAS 158 using the two-measurement approach. Under this approach, we completed two actuarial measurements, one at February 29, 2008 and the other at June 1, 2008. This approach required us to record the net periodic benefi t cost for the transition period from March 1, 2008 through May 31, 2008 as an adjustment to beginning retained earnings ($44 million, net of tax) and actuarial gains and losses for the period (a gain of $372 million, net of tax) as an adjustment to the opening balance of AOCI. These adjustments increased the amount recorded for our pension assets by $528 million. Our

NOTES TO CONSOLIDATED FINANCIAL STATEMENTS
47
actuarial gains resulted primarily from a 19-basis-point increase in the discount rate for our primary pension plan and an increase in plan assets at June 1, 2008.
Our defi ned benefi t plans are measured using actuarial tech-niques that refl ect management’s assumptions for discount rate, expected long-term investment returns on plan assets, salary increases, expected retirement, mortality, employee turnover and future increases in healthcare costs. We determine the discount rate (which is required to be the rate at which the projected ben-efi t obligation could be effectively settled as of the measurement date) with the assistance of actuaries, who calculate the yield on a theoretical portfolio of high-grade corporate bonds (rated Aa or better) with cash fl ows that generally match our expected benefi t payments in future years. A calculated-value method is employed for purposes of determining the expected return on the plan asset component of net periodic pension cost for our quali-fi ed U.S. pension plans. We generally do not fund defi ned benefi t plans when such funding provides no current tax deduction or when such funding would be deemed current compensation to plan participants.
At May 31, 2009, in accordance with the provisions of SFAS 158, we recorded a decrease to equity through OCI of $1.2 billion (net of tax) based primarily on mark-to-market adjustments related to unrealized losses in our pension plan assets during 2009.
INCOME TAXESDeferred income taxes are provided for the tax effect of tempo-rary differences between the tax basis of assets and liabilities and their reported amounts in the fi nancial statements. The liabil-ity method is used to account for income taxes, which requires deferred taxes to be recorded at the statutory rate expected to be in effect when the taxes are paid.
On June 1, 2007, we adopted Financial Accounting Standards Board (“FASB”) Interpretation No. (“FIN”) 48, “Accounting for Uncertainty in Income Taxes.” The cumulative effect of adop-tion was immaterial. We follow FIN 48 guidance to record uncertainties and make judgments in the application of complex tax regulations.
We recognize liabilities for uncertain income tax positions based on a two-step process. The fi rst step is to evaluate the tax posi-tion for recognition by determining if the weight of available evidence indicates that it is more likely than not that the position will be sustained on audit, including resolution of related appeals or litigation processes, if any. The second step requires us to estimate and measure the tax benefi t as the largest amount that is more than 50% likely to be realized upon ultimate settlement. It is inherently diffi cult and subjective to estimate such amounts, as we must determine the probability of various possible out-comes. We reevaluate these uncertain tax positions on a quarterly basis or when new information becomes available to manage-ment. These reevaluations are based on factors including, but not limited to, changes in facts or circumstances, changes in tax law, successfully settled issues under audit, and new audit activity. Such a change in recognition or measurement could result in the recognition of a tax benefi t or an increase to the tax accrual.
We classify interest related to income tax liabilities as inter-est expense, and if applicable, penalties are recognized as a component of income tax expense. The income tax liabilities
and accrued interest and penalties that are due within one year of the balance sheet date are presented as current liabilities. The remaining portion of our income tax liabilities and accrued interest and penalties are presented as noncurrent liabilities because payment of cash is not anticipated within one year of the balance sheet date. These noncurrent income tax liabilities are recorded in the caption “Other liabilities” in our consolidated balance sheets.
SELF-INSURANCE ACCRUALSWe are primarily self-insured for workers’ compensation claims, vehicle accidents and general liabilities, benefits paid under employee healthcare programs and long-term disability benefi ts. Accruals are primarily based on the actuarially estimated, undis-counted cost of claims, which includes incurred-but-not-reported claims. Current workers’ compensation claims, vehicle and gen-eral liability, employee healthcare claims and long-term disability are included in accrued expenses. We self-insure up to certain limits that vary by operating company and type of risk. Periodically, we evaluate the level of insurance coverage and adjust insurance levels based on risk tolerance and premium expense.
LEASESWe lease certain aircraft, facilities, equipment and vehicles under capital and operating leases. The commencement date of all leases is the earlier of the date we become legally obligated to make rent payments or the date we may exercise control over the use of the property. In addition to minimum rental payments, certain leases provide for contingent rentals based on equip-ment usage principally related to aircraft leases at FedEx Express and copier usage at FedEx Offi ce. Rent expense associated with contingent rentals is recorded as incurred. Certain of our leases contain fl uctuating or escalating payments and rent holiday peri-ods. The related rent expense is recorded on a straight-line basis over the lease term. The cumulative excess of rent payments over rent expense is accounted for as a deferred lease asset and recorded in “Intangible and other assets” in the accompa-nying consolidated balance sheets. The cumulative excess of rent expense over rent payments is accounted for as a deferred lease obligation. Leasehold improvements associated with assets utilized under capital or operating leases are amortized over the shorter of the asset’s useful life or the lease term.
DEFERRED GAINSGains on the sale and leaseback of aircraft and other property and equipment are deferred and amortized ratably over the life of the lease as a reduction of rent expense. Substantially all of these deferred gains are related to aircraft transactions.
FOREIGN CURRENCY TRANSLATIONTranslation gains and losses of foreign operations that use local currencies as the functional currency are accumulated and reported, net of applicable deferred income taxes, as a compo-nent of accumulated other comprehensive loss within common stockholders’ investment. Transaction gains and losses that arise from exchange rate fl uctuations on transactions denominated in a currency other than the local currency are included in the caption “Other, net” in the accompanying consolidated state-ments of income and were immaterial for each period presented. Cumulative net foreign currency translation gains in accumulated

FEDEX CORPORATION
48
other comprehensive loss were $56 million at May 31, 2009, $167 million at May 31, 2008 and $69 million at May 31, 2007.
EMPLOYEES UNDER COLLECTIVE BARGAINING ARRANGEMENTSThe pilots of FedEx Express, who represent a small percent-age of our total employees, are employed under a collective bargaining agreement. During the second quarter of 2007, the pilots ratifi ed a new four-year labor contract that included signing bonuses and other upfront compensation of $143 million, as well as pay increases and other benefi t enhancements. These costs were partially mitigated by reductions in the variable incentive compensation of our other employees. The effect of this new agreement on second quarter 2007 net income was $78 million net of tax, or $0.25 per diluted share.
STOCK-BASED COMPENSATIONWe recognize compensation expense for stock-based awards under the provisions of SFAS 123R, “Share-Based Payment,” and related interpretations. SFAS 123R requires recognition of compensation expense for stock-based awards using a fair value method. We adopted SFAS 123R in 2007 using the modifi ed pro-spective method, which resulted in prospective recognition of compensation expense for all outstanding unvested share-based payments based on the fair value on the original grant date.
DIVIDENDS DECLARED PER COMMON SHAREOn June 8, 2009, our Board of Directors declared a dividend of $0.11 per share of common stock. The dividend was paid on July 1, 2009 to stockholders of record as of the close of business on June 18, 2009. Each quarterly dividend payment is subject to review and approval by our Board of Directors, and we evaluate our dividend payment amount on an annual basis at the end of each fi scal year.
USE OF ESTIMATESThe preparation of our consolidated fi nancial statements requires the use of estimates and assumptions that affect the reported amounts of assets and liabilities, the reported amounts of rev-enues and expenses and the disclosure of contingent liabilities. Management makes its best estimate of the ultimate outcome for these items based on historical trends and other information available when the fi nancial statements are prepared. Changes in estimates are recognized in accordance with the accounting rules for the estimate, which is typically in the period when new information becomes available to management. Areas where the nature of the estimate makes it reasonably possible that actual results could materially differ from amounts estimated include: self-insurance accruals; retirement plan obligations; long-term incentive accruals; tax liabilities; accounts receivable allow-ances; obsolescence of spare parts; contingent liabilities; loss contingencies, such as litigation and other claims; and impairment assessments on long-lived assets (including goodwill).
Note 2: Recent Accounting PronouncementsNew accounting rules and disclosure requirements can signifi -cantly impact our reported results and the comparability of our fi nancial statements. We believe the following new accounting pronouncements, in addition to FIN 48 and SFAS 158, are rel-evant to the readers of our fi nancial statements.
On June 1, 2008, we adopted SFAS 157, “Fair Value Measurements,” which provides a common defi nition of fair value, establishes a uniform framework for measuring fair value and requires expanded disclosures about fair value measure-ments. There is a one-year deferral of the adoption of the standard as it relates to nonfi nancial assets and liabilities. Therefore, the adoption of SFAS 157 had no impact on our fi nancial statements at June 1, 2008.
In December 2007, the FASB issued SFAS 141R, “Business Combinations,” and SFAS 160, “Noncontrolling Interests in Consolidated Financial Statements, an amendment of Accounting Research Bulletin (“ARB”) No. 51.” These new standards sig-nifi cantly change the accounting for and reporting of business combination transactions, including noncontrolling interests (previously referred to as minority interests). For example, these standards require the acquiring entity to recognize the full fair value of assets acquired and liabilities assumed in the transaction and require the expensing of most transaction and restructuring costs. Both standards are effective for us beginning June 1, 2009 (fi scal 2010) and are applicable only to transactions occurring after the effective date.
In December 2008, the FASB issued FASB Staff Position (“FSP”) 132(R)-1, “Employers’ Disclosures about Postretirement Benefi t Plan Assets.” This FSP provides guidance on the objectives an employer should consider when providing detailed disclosures about assets of a defi ned benefi t pension plan or other postre-tirement plan. These disclosure objectives include investment policies and strategies, categories of plan assets, signifi cant concentrations of risk and the inputs and valuation techniques used to measure the fair value of plan assets. This FSP will be effective for our fi scal year ending May 31, 2010.
In April 2009, the FASB issued FSP No. 107-1 and Accounting Principles Board Opinion (“APB”) No. 28-1, “Interim Disclosures about Fair Value of Financial Instruments.” This FSP and APB amends SFAS 107, “Disclosures about Fair Value of Financial Instruments,” to require disclosures about the fair value of fi nancial instruments for interim reporting periods in addition to annual reporting periods. This FSP and APB will be effective for our fi rst quarter of fi scal year 2010.
In May 2009, the FASB issued SFAS No. 165, “Subsequent Events,” which establishes general standards of accounting for and disclosures of events that occur after the balance sheet date but before fi nancial statements are issued or are available to be issued. This standard will require us to disclose the date through which we have evaluated subsequent events and the basis for that date. This standard will be effective for our fi rst quarter of fi scal year 2010.

NOTES TO CONSOLIDATED FINANCIAL STATEMENTS
49
These acquisitions expanded our portfolio of services to include long-haul LTL freight services and domestic express services in the United Kingdom and China. These acquisitions were not material to our results of operations or fi nancial condition. The portion of the purchase price allocated to goodwill and other identifi ed intangible assets for the FedEx National LTL, FedEx U.K. and DTW Group acquisitions will be deductible for U.S. tax purposes over 15 years. During 2009, 2008 and 2007, we also made other immaterial acquisitions that are not presented in the table above.
Pro forma results of these acquisitions, individually or in the aggregate, would not differ materially from reported results in
any of the periods presented. The purchase prices were allocated as follows (in millions): FedEx National LTL FedEx U.K. DTW Group
Current assets $ 121 $ 68 $ 54Property and equipment 525 20 16Intangible assets 77 49 17Goodwill 121 168 348Other assets 3 2 10Current liabilities (60) (56) (18)Long-term liabilities – (10) –Total purchase price $ 787 $ 241 $ 427
Note 3: Business CombinationsDuring 2007, we made the following acquisitions: Purchase PriceSegment Business Acquired Rebranded Date Acquired (in millions)
FedEx Freight Watkins Motor Lines FedEx National LTL September 3, 2006 $ 787FedEx Express ANC Holdings Ltd. FedEx U.K. December 16, 2006 241FedEx Express Tianjin Datian W. Group Co., Ltd. (“DTW Group”) N/A March 1, 2007 427
The intangible assets acquired in the FedEx National LTL and FedEx U.K. acquisitions consist primarily of customer-related intangible assets, which will be amortized on an accelerated basis over their average estimated useful lives of seven years for FedEx National LTL and up to 12 years for FedEx U.K., with the majority of the amortization recognized during the fi rst four years. The intangible assets acquired in the DTW Group acquisition relate to the reacquired rights for the use of certain FedEx technology and service marks. These intangible assets will be amortized over their estimated useful lives of approximately two years.
We paid the purchase price for these acquisitions from available cash balances, which included the net proceeds from our $1 billion senior unsecured debt offering completed during 2007.
Note 4: Goodwill and IntangiblesGOODWILL The carrying amount of goodwill attributable to each reportable operating segment and changes therein follows (in millions): Purchase Purchase Impairment Adjustments Impairment Adjustments May 31, 2007 Charge and Other(1) May 31, 2008 Charge and Other (1) May 31, 2009
FedEx Express segment $ 1,088 $ – $ 35 $ 1,123 $ – $ (33) $ 1,090FedEx Ground segment 90 – – 90 – – 90FedEx Freight segment 777 – – 777 (90) – 687FedEx Services segment 1,542 (367) – 1,175 (810) (3) 362 $ 3,497 $ (367) $ 35 $ 3,165 $ (900) $ (36) $ 2,229(1) Primarily currency translation adjustments.

FEDEX CORPORATION
50
In accordance with SFAS 142, “Goodwill and Other Intangible Assets,” a two-step impairment test is performed on goodwill. In the fi rst step, a comparison is made of the estimated fair value of a reporting unit to its carrying value. If the carrying value of a reporting unit exceeds the estimated fair value, the second step of the impairment test is required. In the second step, an estimate of the current fair values of all assets and liabilities is made to determine the amount of implied goodwill and consequently the amount of any goodwill impairment.
In connection with our annual impairment testing of goodwill and other intangible assets conducted in the fourth quarter of 2009 in accordance with SFAS 142, we recorded a charge of $900 million for impairment of the value of goodwill. This charge included an $810 million charge related to reduction of the value of the goodwill recorded as a result of the February 2004 acquisition of Kinko’s, Inc. (now known as FedEx Offi ce), and a $90 million charge related to reduction of the value of the goodwill recorded as a result of the September 2006 acquisition of the U.S. and Canadian less-than-truckload freight operations of Watkins Motor Lines and certain affi liates (now known as FedEx National LTL).
FedEx Offi ce GoodwillDuring 2009, the U.S. recession had a signifi cant negative impact on demand for FedEx Offi ce services, resulting in lower revenues and continued operating losses at this reporting unit. In response to these conditions, FedEx Offi ce initiated an internal reorganiza-tion designed to improve revenue-generating capabilities and reduce costs. Several actions were taken during 2009 to reduce FedEx Offi ce’s cost structure and position it for long-term growth under better economic conditions. These actions included head-count reductions, domestic store closures and the termination of operations in some international locations. In addition, we sub-stantially curtailed future network expansion in light of current economic conditions.
The valuation methodology to estimate the fair value of the FedEx Offi ce reporting unit was based primarily on an income approach. We believe use of the income approach is an appro-priate methodology for the FedEx Offi ce reporting unit because it is the most direct method of measuring enterprise value for this reporting unit. Because of the nature of the service offerings at FedEx Offi ce, it exhibits characteristics of a retailer, a business services provider and a printing provider. Accordingly, it is dif-fi cult to fi nd directly comparable companies for use under the market approach. However, market approach information was incorporated into our test to ensure the reasonableness of our conclusions on estimated value under the income approach. Key assumptions considered were the revenue, operating income and capital expenditure forecasts, the assessed growth rate in the periods beyond the detailed forecast period, and the dis-count rate.
For 2009, we used a discount rate of 12.0%, versus a discount rate of 12.5% in 2008. Our discount rate of 12.0% for 2009 represents our estimated weighted-average cost of capital (“WACC”) of the FedEx Offi ce reporting unit adjusted for company-specifi c risk premium to account for the estimated uncertainty associated with our future cash fl ows. The development of the WACC used in our estimate of fair value considered the following key factors:
• current market conditions for the equity-risk premium and risk-free interest rate;
• benchmark capital structures for guideline companies with characteristics similar to the FedEx Offi ce reporting unit;
• the size and industry of the FedEx Offi ce reporting unit; and
• risks related to the forecast of future revenues and profi tability of the FedEx Offi ce reporting unit.
The discount rate incorporates current market participant con-siderations, as indicated above, and decreased year over year, as increases in the WACC (due to general economic conditions) were offset by reductions in the company-specifi c risk premium. The company-specifi c risk premium was reduced primarily due to lower long-term growth and profi tability assumptions associated with the 2009 forecast. The WACC used in the estimate of fair value in future periods may be impacted by changes in market conditions (including those of market participants), as well as the specifi c future performance of the FedEx Offi ce reporting unit and are subject to change, based on changes in specifi c facts and circumstances.
Upon completion of the impairment test, we concluded that the recorded goodwill was impaired and recorded an impairment charge of $810 million during the fourth quarter of 2009. The remaining goodwill attributable to the FedEx Offi ce reporting unit is $362 million as of May 31, 2009. The goodwill impairment charge is included in operating expenses in the accompanying consolidated statements of income. This charge is included in the results of the FedEx Services segment and was not allocated to our transportation segments, as the charge was unrelated to the core performance of those businesses.
FedEx National LTL GoodwillDuring 2009, the U.S. recession had a signifi cant negative impact on the LTL industry, resulting in steep volume declines, intense yield pressure and the exit of numerous small to medium competi-tors from the market. The outlook for the LTL market is uncertain due to the recession and the negative impact of aggressive pric-ing resulting from continued excess capacity in the market. The results for the FedEx National LTL reporting unit in 2009 refl ect the impact of the recession, with reduced revenues and increased operating losses.
The valuation methodology to estimate the fair value of the FedEx National LTL reporting unit was based primarily on a mar-ket approach (revenue multiples and/or earnings multiples) that considered market participant assumptions. We believe use of the market approach for FedEx National LTL is appropriate due to the forecast risk associated with the projections used under the income approach, particularly in the outer years of the forecast period (as described below). Further, there are directly com-parable companies to the FedEx National LTL reporting unit for consideration under the market approach. The income approach also was incorporated into the impairment test to ensure the rea-sonableness of our conclusions under the market approach. Key assumptions considered were the revenue, operating income and capital expenditure forecasts and market participant assump-tions on multiples related to revenue and earnings forecasts.

NOTES TO CONSOLIDATED FINANCIAL STATEMENTS
51
The forecast used in the valuation assumes operating losses will continue in the near-term due to the current economic condi-tions and excess capacity in the industry. However, the long-term outlook assumes that this excess capacity exits the market. This assumption drives signifi cant volume and yield improvement into the FedEx National LTL reporting unit in future periods. The decision to include an assumption related to the elimination of excess capacity from the market and the associated cash fl ows is signifi cant to the valuation and refl ects management’s outlook on the industry for future periods as of the valuation date.
We recorded an impairment charge of $90 million during the fourth quarter of 2009. This charge represented substantially all of the goodwill resulting from this acquisition. The goodwill impairment charge is included in operating expenses in the accompanying consolidated statements of income and is included in the results of the FedEx Freight segment.
Other Reporting Units GoodwillOur remaining reporting units with signifi cant recorded good-will (excluding FedEx Offi ce and FedEx National LTL) include our FedEx Express reporting unit and our FedEx Freight reporting unit. We evaluated our remaining reporting units during the fourth quarter of 2009, and while the estimated fair value of these report-ing units declined from 2008, the estimated fair value of each of our other reporting units signifi cantly exceeded their carrying values in 2009. As a result, no additional testing or impairment charges were necessary.
FedEx Offi ce Goodwill – 2008During 2008, several developments and strategic decisions occurred at FedEx Offi ce, including:
• FedEx Offi ce was reorganized as a part of the FedEx Services segment. FedEx Offi ce provides retail access to our customers for our package transportation businesses and an array of docu-ment and business services. Under FedEx Services, FedEx Offi ce benefi ts from the full range of resources and expertise of FedEx Services to continue to enhance the customer experience, pro-vide greater, more convenient access to the portfolio of services at FedEx, and increase revenues through our retail network.
• Senior management at FedEx Offi ce was reorganized with sev-eral positions terminated and numerous reporting realignments, including naming a new president and CEO.
• We determined that we would minimize the use of the Kinko’s trade name over the next several years.
• We began implementing revenue growth and cost management plans to improve fi nancial performance.
• We began pursuing a more disciplined approach to the long-term expansion of the retail network, reducing the overall level of expansion.
In connection with our annual impairment testing in the fourth quarter of 2008, the valuation methodology to estimate the fair value of the FedEx Offi ce reporting unit was based primarily on an income approach that considered market participant assump-tions to estimate fair value. Key assumptions considered were the revenue and operating income forecast, the assessed growth rate in the periods beyond the detailed forecast period, and the discount rate.
In performing our annual impairment test, the most signifi cant assumption used to estimate the fair value of the FedEx Offi ce reporting unit was the discount rate. We used a discount rate of 12.5%, representing the estimated WACC of the FedEx Offi ce reporting unit. The development of the WACC used in our esti-mate of fair value considered the following key factors:
• benchmark capital structures for guideline companies with characteristics similar to the FedEx Offi ce reporting unit;
• current market conditions for the risk-free interest rate;
• the size and industry of the FedEx Offi ce reporting unit; and
• risks related to the forecast of future revenues and profi tability of the FedEx Offi ce reporting unit.
Upon completion of the impairment test, we concluded that the recorded goodwill was impaired and recorded an impairment charge of $367 million during the fourth quarter of 2008. The good-will impairment charge is included in 2008 operating expenses in the accompanying consolidated statements of income. This charge was included in the results of the FedEx Services seg-ment and was not allocated to our transportation segments, as the charge was unrelated to the core performance of those businesses.
INTANGIBLE ASSETS The components of our identifi able intangible assets were as follows (in millions): May 31, 2009 May 31, 2008 Gross Carrying Accumulated Net Book Gross Carrying Accumulated Net Book Amount Amortization Value Amount Amortization Value
Customer relationships $ 207 $ (133) $ 74 $ 205 $ (95) $ 110 Contract related 79 (72) 7 79 (67) 12 Technology related and other 74 (62) 12 74 (51) 23 Kinko’s trade name 52 (27) 25 52 (8) 44 Total $ 412 $ (294) $ 118 $ 410 $ (221) $ 189

FEDEX CORPORATION
52
Prior to 2008, the intangible asset associated with the Kinko’s trade name was not amortized because it had an indefinite remaining useful life and our intent was to use it indefi nitely. During the fourth quarter of 2008, we made the decision to change the name of FedEx Kinko’s to FedEx Offi ce and rebrand our retail locations over the next several years. We believe the FedEx Offi ce name better describes the wide range of services available at our retail centers and takes full advantage of the FedEx brand. This change converted this asset to a fi nite life asset and resulted in an impairment charge of $515 million. We estimated the fair value of this intangible asset based on an income approach using the relief-from-royalty method. This approach is dependent on a number of factors, including esti-mates of future growth and trends, royalty rates in the category of intellectual property, discount rates and other variables. We base our fair value estimates on assumptions we believe to be reasonable, but which are inherently uncertain.
The $515 million impairment charge recorded during the fourth quarter of 2008 resulted in a remaining trade name balance of $52 million, which we began amortizing in the fourth quarter of 2008 on an accelerated basis, which will be fully amortized by May 2011. The trade name impairment charge is included in oper-ating expenses in the accompanying consolidated statements of income. The charge was included in the results of the FedEx Services segment and was not allocated to our transportation segments, as the charge was unrelated to the core performance of those businesses.
Amortization expense for intangible assets was $73 million in 2009, $60 million in 2008 and $42 million in 2007. Estimated amorti-zation expense for the next fi ve years is as follows (in millions):
2010 $ 47 2011 34 2012 11 2013 92014 10
Note 5: Selected Current LiabilitiesThe components of selected current liability captions were as follows (in millions): May 31, 2009 2008
Accrued Salaries and Employee Benefi ts Salaries $ 201 $ 193 Employee benefi ts, including variable compensation 143 404 Compensated absences 517 521 $ 861 $ 1,118
Accrued Expenses Self-insurance accruals $ 626 $ 577 Taxes other than income taxes 338 339 Other 674 637 $ 1,638 $ 1,553
Note 6: Long-Term Debt and Other Financing ArrangementsThe components of long-term debt (net of discounts) were as follows (in millions): May 31, 2009 2008
Senior unsecured debt Interest rate of 3.50%, due in 2009 $ – $ 500 Interest rate of 5.50%, due in 2010 500 499 Interest rate of 7.25%, due in 2011 250 250 Interest rate of 9.65%, due in 2013 300 300 Interest rate of 7.38%, due in 2014 250 – Interest rate of 8.00%, due in 2019 750 – Interest rate of 7.60%, due in 2098 239 239 2,289 1,788 Capital lease obligations 294 220 2,583 2,008 Less current portion 653 502 $ 1,930 $ 1,506
Scheduled annual principal maturities of debt, exclusive of capi-tal leases, for the fi ve years subsequent to May 31, 2009, are as follows (in millions):
2010 $ 500 2011 250 2012 – 2013 300 2014 250
Interest on our fi xed-rate notes is paid semi-annually. Long-term debt, exclusive of capital leases, had carrying values of $2.3 bil-lion compared with an estimated fair value of $2.4 billion at May 31, 2009, and $1.8 billion compared with an estimated fair value of $1.9 billion at May 31, 2008. The estimated fair values were determined based on quoted market prices or on the current rates offered for debt with similar terms and maturities.
We have a shelf registration statement fi led with the Securities and Exchange Commission that allows us to sell, in one or more future offerings, any combination of our unsecured debt securi-ties and common stock.
In January 2009, we issued $1 billion of senior unsecured debt under our shelf registration statement, comprised of fi xed-rate notes totaling $250 million due in January 2014 and $750 million due in January 2019. The fi xed-rate notes due in January 2014 bear interest at an annual rate of 7.375%, payable semi-annually, and the fi xed-rate notes due in January 2019 bear interest at an annual rate of 8.00%, payable semi-annually. A portion of the net proceeds were used for repayment of our $500 million aggre-gate principal amount of 3.5% notes that matured on April 1, 2009. We plan to use the remaining net proceeds for working capital and general corporate purposes, including the repayment upon maturity of all or a portion of our $500 million aggregate principal amount of 5.50% notes maturing on August 15, 2009.

NOTES TO CONSOLIDATED FINANCIAL STATEMENTS
53
A $1 billion revolving credit agreement is available to fi nance our operations and other cash fl ow needs and to provide sup-port for the issuance of commercial paper. This revolving credit agreement expires in July 2010. Our revolving credit agreement contains a fi nancial covenant, which requires us to maintain a leverage ratio of adjusted debt (long-term debt, including the current portion of such debt, plus six times rentals and landing fees) to capital (adjusted debt plus total common stockholders’ investment) that does not exceed 0.7 to 1.0. Our leverage ratio of adjusted debt to capital was 0.6 to 1.0 at May 31, 2009. As of May 31, 2009, no commercial paper was outstanding and the entire $1 billion under the revolving credit facility was available for future borrowings.
We issue other financial instruments in the normal course of business to support our operations. Letters of credit at May 31, 2009 were $606 million. The amount unused under our primary $500 million letter of credit facility totaled $45 million at May 31, 2009. This facility expires in July 2010. These instruments are required under certain U.S. self-insurance pro-grams and are also used in the normal course of international operations. The underlying liabilities insured by these instruments are refl ected in our balance sheets, where applicable. Therefore, no additional liability is refl ected for the letters of credit.
Our capital lease obligations include leases for aircraft and facilities. Our facility leases include leases that guarantee the repayment of certain special facility revenue bonds that have been issued by municipalities primarily to fi nance the acquisition and construction of various airport facilities and equipment. These bonds require interest payments at least annually, with principal payments due at the end of the related lease agreement.
Note 7: LeasesWe utilize certain aircraft, land, facilities, retail locations and equipment under capital and operating leases that expire at vari-ous dates through 2040. We leased 13% of our total aircraft fl eet under capital or operating leases as of May 31, 2009, compared with 14% as of May 31, 2008. In addition, supplemental aircraft are leased by us under agreements that provide for cancella-tion upon 30 days’ notice. Our leased facilities include national, regional and metropolitan sorting facilities, retail facilities and administrative buildings.
The components of property and equipment recorded under capi-tal leases were as follows (in millions):
May 31, 2009 2008
Aircraft $ 50 $ –Package handling and ground support equipment 165 165Vehicles 17 20Other, principally facilities 147 150 379 335 Less accumulated amortization 300 290 $ 79 $ 45
Rent expense under operating leases was as follows (in millions): For years ended May 31, 2009 2008 2007
Minimum rentals $ 2,047 $ 1,990 $ 1,916Contingent rentals (1) 181 228 241 $ 2,228 $ 2,218 $ 2,157(1) Contingent rentals are based on equipment usage.
A summary of future minimum lease payments under capital leases and noncancelable operating leases with an initial or remaining term in excess of one year at May 31, 2009 is as fol-lows (in millions): Operating Leases Aircraft Capital and Related Facilities and Total Operating Leases Equipment Other Leases
2010 $ 164 $ 512 $ 1,247 $ 1,7592011 20 526 1,086 1,6122012 8 504 947 1,4512013 119 499 817 1,3162014 2 472 694 1,166Thereafter 15 2,458 4,894 7,352Total 328 $ 4,971 $ 9,685 $ 14,656Less amount representing interest 34Present value of net minimum lease payments $ 294
The weighted-average remaining lease term of all operating leases outstanding at May 31, 2009 was approximately six years. While certain of our lease agreements contain covenants gov-erning the use of the leased assets or require us to maintain certain levels of insurance, none of our lease agreements include material fi nancial covenants or limitations.
FedEx Express makes payments under certain leveraged operating leases that are suffi cient to pay principal and interest on certain pass-through certifi cates. The pass-through certifi cates are not direct obligations of, or guaranteed by, FedEx or FedEx Express.
Note 8: Preferred StockOur Certifi cate of Incorporation authorizes the Board of Directors, at its discretion, to issue up to 4,000,000 shares of preferred stock. The stock is issuable in series, which may vary as to certain rights and preferences, and has no par value. As of May 31, 2009, none of these shares had been issued.

FEDEX CORPORATION
54
Note 9: Stock-Based CompensationOur total stock-based compensation expense for the years ended May 31 was as follows (in millions): 2009 2008 2007
Stock-based compensation expense $ 99 $ 101 $ 103
We have two types of equity-based compensation: stock options and restricted stock.
STOCK OPTIONSUnder the provisions of our incentive stock plans, key employees and non-employee directors may be granted options to purchase shares of our common stock at a price not less than its fair market value on the date of grant. Options granted have a maximum term of 10 years. Vesting requirements are determined at the discre-tion of the Compensation Committee of our Board of Directors. Option-vesting periods range from one to four years, with 82% of our options vesting ratably over four years.
RESTRICTED STOCKUnder the terms of our incentive stock plans, restricted shares of our common stock are awarded to key employees. All restrictions on the shares expire ratably over a four-year period. Shares are valued at the market price on the date of award. Compensation related to these awards is recognized as expense over the req-uisite service period.
For unvested stock options granted prior to June 1, 2006 and all restricted stock awards, the terms of these awards provide for continued vesting subsequent to the employee’s retirement. Compensation expense associated with these awards is recog-nized on a straight-line basis over the shorter of the remaining service or vesting period. This postretirement vesting provision was removed from all stock option awards granted subsequent to May 31, 2006.
VALUATION AND ASSUMPTIONSWe use the Black-Scholes option pricing model to calculate the fair value of stock options. The value of restricted stock awards is based on the stock price of the award on the grant date. We recognize stock-based compensation expense on a straight-
line basis over the requisite service period of the award in the “Salaries and employee benefi ts” caption in the accompanying consolidated statements of income.
The key assumptions for the Black-Scholes valuation method include the expected life of the option, stock price volatility, a risk-free interest rate, and dividend yield. Many of these assump-tions are judgmental and highly sensitive. Following is a table of the weighted-average Black-Scholes value of our stock option grants, the intrinsic value of options exercised (in millions), and the key weighted-average assumptions used in the valuation cal-culations for the options granted during the years ended May 31, and then a discussion of our methodology for developing each of the assumptions used in the valuation model: 2009 2008 2007
Weighted-average Black-Scholes value $ 23.66 $ 29.88 $ 31.60Intrinsic value of options exercised $ 7 $ 126 $ 145Black-Scholes Assumptions: Expected lives 5.5 years 5 years 5 years Expected volatility 23% 19% 22% Risk-free interest rate 3.284% 4.763% 4.879% Dividend yield 0.492% 0.337% 0.302%
Expected Lives. This is the period of time over which the options granted are expected to remain outstanding. Generally, options granted have a maximum term of 10 years. We examine actual stock option exercises to determine the expected life of the options. An increase in the expected term will increase com-pensation expense.
Expected Volatility. Actual changes in the market value of our stock are used to calculate the volatility assumption. We cal-culate daily market value changes from the date of grant over a past period equal to the expected life of the options to determine volatility. An increase in the expected volatility will increase com-pensation expense.
Risk-Free Interest Rate. This is the U.S. Treasury Strip rate posted at the date of grant having a term equal to the expected life of the option. An increase in the risk-free interest rate will increase compensation expense.
Dividend Yield. This is the annual rate of dividends per share over the exercise price of the option. An increase in the dividend yield will decrease compensation expense.
The following table summarizes information about stock option activity for the year ended May 31, 2009: Stock Options Weighted- Weighted-Average Aggregate Average Remaining Intrinsic Value Shares Exercise Price Contractual Term (in millions) (1)
Outstanding at June 1, 2008 16,677,806 $ 78.09 Granted 2,209,919 86.78 Exercised (788,091) 55.25 Forfeited (456,545) 95.30 Outstanding at May 31, 2009 17,643,089 $ 79.90 5.6 years $ 85 Exercisable 12,149,247 $ 71.15 4.5 years $ 83 Expected to vest 5,054,335 $ 99.25 8.1 years $ 2 Available for future grants 11,914,914(1) Only presented for options with market value at May 31, 2009 in excess of the exercise price of the option.

NOTES TO CONSOLIDATED FINANCIAL STATEMENTS
55
The options granted during the year ended May 31, 2009 are primarily related to our principal annual stock option grant in June 2008.
The following table summarizes information about vested and unvested restricted stock for the year ended May 31, 2009: Restricted Stock Weighted- Average Grant Shares Date Fair Value
Unvested at June 1, 2008 424,985 $ 103.97 Granted 197,180 90.57 Vested (177,494) 98.05 Forfeited (1,930) 100.35 Unvested at May 31, 2009 442,741 $ 100.40
During the year ended May 31, 2008, there were 174,418 shares of restricted stock granted with a weighted-average fair value of $114.40. During the year ended May 31, 2007, there were 175,005 shares of restricted stock granted with a weighted-average fair value of $109.90.
The following table summarizes information about stock option vesting during the years ended May 31: Stock Options Vested During Fair Value the Year (in millions)
2007 3,147,642 $ 65 2008 2,694,602 64 2009 2,414,815 64
As of May 31, 2009, there was $110 million of total unrecog-nized compensation cost, net of estimated forfeitures, related to unvested share-based compensation arrangements. This com-pensation expense is expected to be recognized on a straight-line basis over the remaining weighted-average vesting period of approximately two years.
Total shares outstanding or available for grant related to equity compensation at May 31, 2009 represented 9% of the total out-standing common and equity compensation shares and equity compensation shares available for grant.
Note 10: Computation of Earnings Per ShareThe calculation of basic and diluted earnings per common share for the years ended May 31 was as follows (in millions, except per share amounts): 2009 2008 2007
Net income $ 98 $ 1,125 $ 2,016 Weighted-average shares of common stock outstanding 311 309 307 Common equivalent shares: Incremental effect of shares from exercise of stock options and vesting of restricted stock 1 3 4Weighted-average common and common equivalent shares outstanding 312 312 311 Basic earnings per common share $ 0.31 $ 3.64 $ 6.57 Diluted earnings per common share $ 0.31 $ 3.60 $ 6.48 Antidilutive options excluded from diluted earnings per common share 12.6 4.8 0.4
Note 11: Income Taxes The components of the provision for income taxes for the years ended May 31 were as follows (in millions): 2009 2008 2007
Current provision (benefi t) Domestic: Federal $ (35) $ 514 $ 829 State and local 18 74 72 Foreign 214 242 174 197 830 1,075 Deferred provision (benefi t) Domestic: Federal 327 31 62 State and local 48 (2) 27 Foreign 7 32 35 382 61 124 $ 579 $ 891 $ 1,199
Pretax earnings of foreign operations for 2009, 2008 and 2007 were $106 million, $803 million and $648 million, respectively, which represents only a portion of total results associated with international shipments.

FEDEX CORPORATION
56
A reconciliation of the statutory federal income tax rate to the effective income tax rate for the years ended May 31 was as follows: 2009 2008 2007
Statutory U.S. income tax rate 35.0% 35.0% 35.0% Increase resulting from: Goodwill impairment 48.0 6.8 – State and local income taxes, net of federal benefi t 1.9 2.1 2.0 Other, net 0.7 0.3 0.3 Effective tax rate 85.6% 44.2% 37.3%
Our 2009 and 2008 effective tax rates were signifi cantly impacted by goodwill impairment charges related to the Kinko’s acquisi-tion, which are not deductible for income tax purposes. Our 2007 tax rate was favorably impacted by the conclusion of various state and federal tax audits and appeals. The 2007 rate reduc-tion was partially offset by tax charges incurred as a result of a reorganization in Asia associated with our acquisition in China, as described in Note 3.
The signifi cant components of deferred tax assets and liabilities as of May 31 were as follows (in millions): 2009 2008 Deferred Deferred Deferred Deferred Tax Assets Tax Liabilities Tax Assets Tax Liabilities
Property, equipment, leases and intangibles $ 406 $ 1,862 $ 321 $ 1,650 Employee benefi ts 384 143 401 364 Self-insurance accruals 392 – 359 – Other 491 222 426 224 Net operating loss/credit carryforwards 131 – 135 – Valuation allowances (137) – (124) – $ 1,667 $ 2,227 $ 1,518 $ 2,238
The net deferred tax liabilities as of May 31 have been classifi ed in the balance sheets as follows (in millions): 2009 2008
Current deferred tax asset $ 511 $ 544 Noncurrent deferred tax liability (1,071) (1,264) $ (560) $ (720)
We have $385 million of net operating loss carryovers in vari-ous foreign jurisdictions and $450 million of state operating loss carryovers. The valuation allowances primarily represent amounts reserved for operating loss and tax credit carryforwards, which expire over varying periods starting in 2010. As a result of this and other factors, we believe that a substantial portion of these deferred tax assets may not be realized.
Unremitted earnings of our foreign subsidiaries amounted to $191 million in 2009 and $147 million in 2008. We have not recog-nized deferred taxes for U.S. federal income tax purposes on the unremitted earnings of our foreign subsidiaries that are deemed to be permanently reinvested. Upon distribution, in the form of dividends or otherwise, these unremitted earnings would be sub-ject to U.S. federal income tax. Unrecognized foreign tax credits would be available to reduce a portion, if not all, of the U.S. tax liability. Determination of the amount of unrecognized deferred U.S. income tax liability is not practicable.
Our liabilities recorded under FIN 48 totaled $72 million at May 31, 2009 and $88 million at May 31, 2008, including $59 million at May 31, 2009 and $68 million at May 31, 2008 associated with positions that if favorably resolved would provide a benefi t to our effective tax rate. The change from the prior year relates primarily to the resolution of an immaterial state income tax matter during the second quarter of 2009. We classify interest related to income tax liabilities as interest expense, and if applicable, penalties are recognized as a component of income tax expense. The balance of accrued interest and penalties was $19 million on May 31, 2009 and $25 million on May 31, 2008. Total interest and penalties included in our statement of operations is immaterial.
We fi le income tax returns in the U.S., various U.S. states, and various foreign jurisdictions. During 2009, the Internal Revenue Service (“IRS”) completed its audit of our consolidated U.S. income tax returns for the 2004 through 2006 tax years. The completion of the audit did not have a material effect on our con-solidated fi nancial statements. We are no longer subject to U.S. federal income tax examination for years through 2006 except for specifi c U.S. federal income tax positions that are in various stages of appeal and/or litigation. No resolution date can be rea-sonably estimated at this time for these appeals and litigation, but their resolution is not expected to have a material effect on our consolidated fi nancial statements. We are also subject to ongo-ing audits in state, local and foreign tax jurisdictions throughout the world.
A reconciliation of the beginning and ending amount of unrecog-nized tax benefi ts is as follows (in millions):
Balance at June 1, 2007 $ 72 Increases for tax positions taken in the current year 16 Increases for tax positions taken in prior years 12 Decreases for tax positions taken in prior years (9) Settlements (3)Balance at May 31, 2008 $ 88 Increases for tax positions taken in the current year 7 Increases for tax positions taken in prior years 10 Decreases for tax positions taken in prior years (30) Settlements (3)Balance at May 31, 2009 $ 72
Included in the May 31, 2009 and May 31, 2008 balances are $7 million and $8 million, respectively, of tax positions for which the ultimate deductibility or income inclusion is certain but for which there may be uncertainty about the timing of such deductibility or income inclusion. It is diffi cult to predict the ultimate outcome or the timing of resolution for tax positions under FIN 48. Changes may result from the conclusion of ongoing audits, appeals or litigation in state, local, federal and foreign tax jurisdictions, or from the resolution of various proceedings between the U.S. and foreign tax authorities. Our liability for tax positions under FIN 48 includes no matters that are individually material to us. It is reasonably possible that the amount of the benefi t with respect to certain of our unrecognized tax positions will increase or decrease within the next 12 months, but an estimate of the range of the reasonably possible changes cannot be made. However, we do not expect that the resolution of any of our tax positions under FIN 48 will be material.
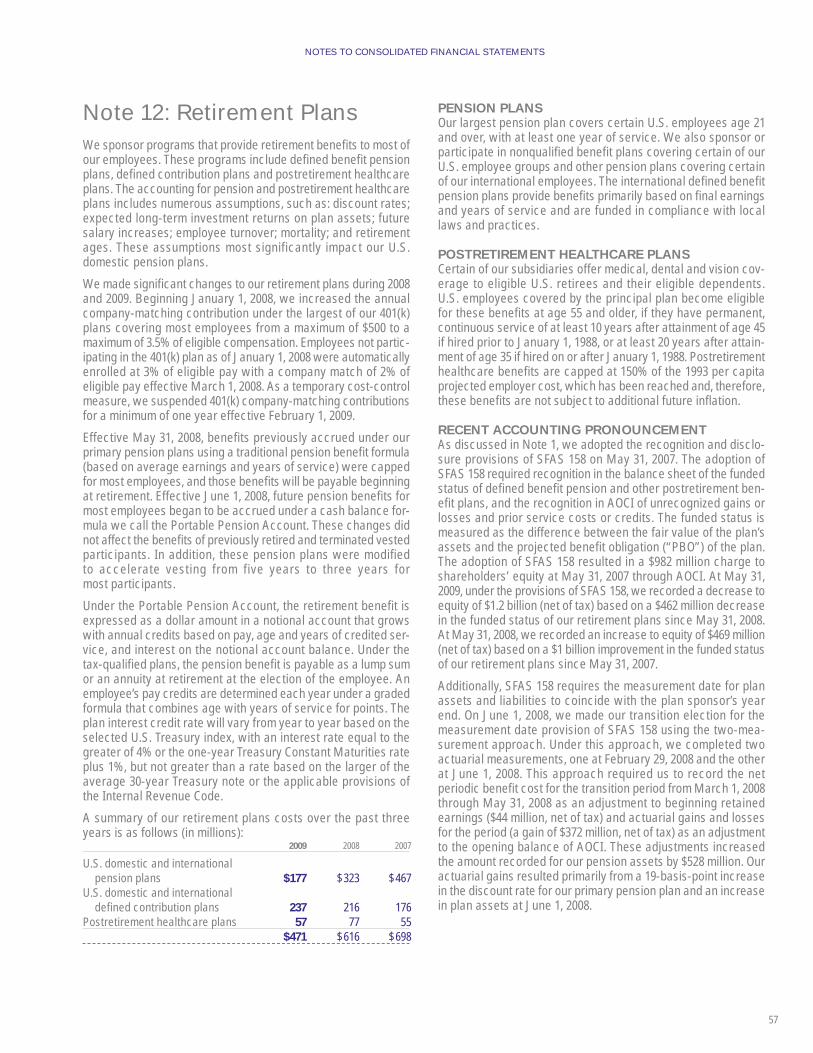
NOTES TO CONSOLIDATED FINANCIAL STATEMENTS
57
Note 12: Retirement Plans We sponsor programs that provide retirement benefi ts to most of our employees. These programs include defi ned benefi t pension plans, defi ned contribution plans and postretirement healthcare plans. The accounting for pension and postretirement healthcare plans includes numerous assumptions, such as: discount rates; expected long-term investment returns on plan assets; future salary increases; employee turnover; mortality; and retirement ages. These assumptions most significantly impact our U.S. domestic pension plans.
We made signifi cant changes to our retirement plans during 2008 and 2009. Beginning January 1, 2008, we increased the annual company-matching contribution under the largest of our 401(k) plans covering most employees from a maximum of $500 to a maximum of 3.5% of eligible compensation. Employees not partic-ipating in the 401(k) plan as of January 1, 2008 were automatically enrolled at 3% of eligible pay with a company match of 2% of eligible pay effective March 1, 2008. As a temporary cost-control measure, we suspended 401(k) company-matching contributions for a minimum of one year effective February 1, 2009.
Effective May 31, 2008, benefi ts previously accrued under our primary pension plans using a traditional pension benefi t formula (based on average earnings and years of service) were capped for most employees, and those benefi ts will be payable beginning at retirement. Effective June 1, 2008, future pension benefi ts for most employees began to be accrued under a cash balance for-mula we call the Portable Pension Account. These changes did not affect the benefi ts of previously retired and terminated vested participants. In addition, these pension plans were modifi ed to accelerate vesting from five years to three years for most participants.
Under the Portable Pension Account, the retirement benefi t is expressed as a dollar amount in a notional account that grows with annual credits based on pay, age and years of credited ser-vice, and interest on the notional account balance. Under the tax-qualifi ed plans, the pension benefi t is payable as a lump sum or an annuity at retirement at the election of the employee. An employee’s pay credits are determined each year under a graded formula that combines age with years of service for points. The plan interest credit rate will vary from year to year based on the selected U.S. Treasury index, with an interest rate equal to the greater of 4% or the one-year Treasury Constant Maturities rate plus 1%, but not greater than a rate based on the larger of the average 30-year Treasury note or the applicable provisions of the Internal Revenue Code.
A summary of our retirement plans costs over the past three years is as follows (in millions): 2009 2008 2007
U.S. domestic and international pension plans $ 177 $ 323 $ 467 U.S. domestic and international defi ned contribution plans 237 216 176 Postretirement healthcare plans 57 77 55 $ 471 $ 616 $ 698
PENSION PLANSOur largest pension plan covers certain U.S. employees age 21 and over, with at least one year of service. We also sponsor or participate in nonqualifi ed benefi t plans covering certain of our U.S. employee groups and other pension plans covering certain of our international employees. The international defi ned benefi t pension plans provide benefi ts primarily based on fi nal earnings and years of service and are funded in compliance with local laws and practices.
POSTRETIREMENT HEALTHCARE PLANSCertain of our subsidiaries offer medical, dental and vision cov-erage to eligible U.S. retirees and their eligible dependents. U.S. employees covered by the principal plan become eligible for these benefi ts at age 55 and older, if they have permanent, continuous service of at least 10 years after attainment of age 45 if hired prior to January 1, 1988, or at least 20 years after attain-ment of age 35 if hired on or after January 1, 1988. Postretirement healthcare benefi ts are capped at 150% of the 1993 per capita projected employer cost, which has been reached and, therefore, these benefi ts are not subject to additional future infl ation.
RECENT ACCOUNTING PRONOUNCEMENTAs discussed in Note 1, we adopted the recognition and disclo-sure provisions of SFAS 158 on May 31, 2007. The adoption of SFAS 158 required recognition in the balance sheet of the funded status of defi ned benefi t pension and other postretirement ben-efi t plans, and the recognition in AOCI of unrecognized gains or losses and prior service costs or credits. The funded status is measured as the difference between the fair value of the plan’s assets and the projected benefi t obligation (“PBO”) of the plan. The adoption of SFAS 158 resulted in a $982 million charge to shareholders’ equity at May 31, 2007 through AOCI. At May 31, 2009, under the provisions of SFAS 158, we recorded a decrease to equity of $1.2 billion (net of tax) based on a $462 million decrease in the funded status of our retirement plans since May 31, 2008. At May 31, 2008, we recorded an increase to equity of $469 million (net of tax) based on a $1 billion improvement in the funded status of our retirement plans since May 31, 2007.
Additionally, SFAS 158 requires the measurement date for plan assets and liabilities to coincide with the plan sponsor’s year end. On June 1, 2008, we made our transition election for the measurement date provision of SFAS 158 using the two-mea-surement approach. Under this approach, we completed two actuarial measurements, one at February 29, 2008 and the other at June 1, 2008. This approach required us to record the net periodic benefi t cost for the transition period from March 1, 2008 through May 31, 2008 as an adjustment to beginning retained earnings ($44 million, net of tax) and actuarial gains and losses for the period (a gain of $372 million, net of tax) as an adjustment to the opening balance of AOCI. These adjustments increased the amount recorded for our pension assets by $528 million. Our actuarial gains resulted primarily from a 19-basis-point increase in the discount rate for our primary pension plan and an increase in plan assets at June 1, 2008.

FEDEX CORPORATION
58
PENSION PLAN ASSUMPTIONSOur pension cost is materially affected by the discount rate used to measure pension obligations, the level of plan assets available to fund those obligations and the expected long-term rate of return on plan assets.
Beginning in 2009, we use a measurement date of May 31 for our pension and postretirement healthcare plans. Prior to 2009, our measurement date was February 28 (February 29 in 2008). Management reviews the assumptions used to measure pension costs on an annual basis. Economic and market conditions at the measurement date impact these assumptions from year to year and it is reason-ably possible that material changes in pension cost may be experienced in the future. Additional information about our pension plans can be found in the Critical Accounting Estimates section of Management’s Discussion and Analysis in this Annual Report.
Actuarial gains or losses are generated for changes in assumptions and to the extent that actual results differ from those assumed. These actuarial gains and losses are amortized over the remaining average service lives of our active employees if they exceed a corridor amount in the aggregate.
Predominantly all of our plan assets are actively managed. The investment strategy for pension plan assets is to utilize a diversifi ed mix of global public and private equity portfolios, together with public and private fi xed-income portfolios, to earn a long-term invest-ment return that meets our pension plan obligations. Active management strategies are utilized within the plan in an effort to realize investment returns in excess of market indices.
The weighted-average asset allocations for our domestic pension plans at the measurement date were as follows (dollars in millions): Plan Assets at Measurement Date 2009 2008Asset Class Actual Actual% Target% Actual Actual% Target%
Domestic equities $ 4,129 39% 30% $ 5,694 49% 53%International equities 1,724 16 15 2,481 21 17 Private equities 357 3 5 406 4 5 Total equities 6,210 58 50 8,581 74 75 Long-duration fi xed-income securities 2,535 24 45 1,778 15 15 Other fi xed-income securities 1,861 18 5 1,302 11 10 $ 10,606 100% 100% $ 11,661 100% 100%
Establishing the expected future rate of investment return on our pension assets is a judgmental matter. Management considers the following factors in determining this assumption:
• the duration of our pension plan liabilities, which drives the investment strategy we can employ with our pension plan assets;
• the types of investment classes in which we invest our pension plan assets and the expected compound geometric return we can reasonably expect those investment classes to earn over the next 10- to 15-year time period (or such other time period that may be appropriate); and
• the investment returns we can reasonably expect our investment management program to achieve in excess of the returns we could expect if investments were made strictly in indexed funds.
We review the expected long-term rate of return on an annual basis and revise it as appropriate. As part of our strategy to man-age future pension costs and net funded status volatility, we are transitioning to a more liability-driven investment strategy, which
will better align our plan assets and liabilities. This strategy will ultimately result in a greater concentration of fixed-income investments.
To support our conclusions, we periodically commission asset/liability studies performed by third-party professional investment advisors and actuaries to assist us in our reviews. These stud-ies project our estimated future pension payments and evaluate the effi ciency of the allocation of our pension plan assets into various investment categories. These studies also generate probability-adjusted expected future returns on those assets. The studies performed or updated supported the reasonableness of our expected rate of return of 8.5% for 2009 and 2008 and 9.1% for 2007. Based on conditions in global equity markets, we will reduce our estimated long-term rate of return on plan assets from 8.5% to 8.0% for 2010. For the 15-year period ended May 31, 2009, our actual returns were 7.5%.

NOTES TO CONSOLIDATED FINANCIAL STATEMENTS
59
The following table provides a reconciliation of the changes in the pension and postretirement healthcare plans’ benefi t obligations and fair value of assets over the two-year period ended May 31, 2009 and a statement of the funded status as of May 31, 2009 and 2008 (in millions): Pension Plans (1) Postretirement Healthcare Plans (1)
2009 2008 2009 2008
Accumulated Benefi t Obligation (“ABO”) $ 10,745 $ 11,212
Changes in Projected Benefi t Obligation (“PBO”) and Accumulated Postretirement Benefi t Obligation (“APBO”) PBO/APBO at the beginning of year $ 11,617 $ 12,209 $ 492 $ 525 Adjustments due to change in measurement date Service cost plus interest cost during gap period 309 – 16 – Additional experience during gap period (302) – (19) – Changes due to gap period cash fl ow (83) – (5) – Service cost 499 518 31 35 Interest cost 798 720 33 31 Actuarial (gain) loss (1,420) (1,531) (94) (56) Benefi ts paid (351) (318) (42) (40) Amendments (1) 1 – – Other (16) 18 21 (3) PBO/APBO at the end of year $ 11,050 $ 11,617 $ 433 $ 492 Change in Plan Assets Fair value of plan assets at beginning of year $ 11,879 $ 11,506 $ – $ – Adjustments due to change in measurement date Additional experience during gap period 522 – – – Changes due to gap period cash fl ow (76) – – – Actual return on plan assets (2,306) 141 – – Company contributions 1,146 548 21 64 Benefi ts paid (351) (318) (42) (40) Other (2) 2 21 (24) Fair value of plan assets at end of year $ 10,812 $ 11,879 $ – $ – Funded Status of the Plans $ (238) $ 262 $ (433) $ (492) Employer contributions after measurement date – 15 – 5 Net amount recognized $ (238) $ 277 $ (433) $ (487)Amount Recognized in the Balance Sheet at May 31: Noncurrent pension assets $ 311 $ 827 $ – $ – Current pension, postretirement healthcare and other benefi t obligations (31) (32) (26) (30) Noncurrent pension, postretirement healthcare and other benefi t obligations (518) (518) (407) (457)Net amount recognized $ (238) $ 277 $ (433) $ (487)Amounts Recognized in AOCI and not yet refl ected in Net Periodic Benefi t Cost: Net actuarial loss (gain) $ 3,731 $ 2,455 $ (248) $ (144) Prior service (credit) cost and other (1,220) (1,362) 2 2 Total $ 2,511 $ 1,093 $ (246) $ (142)Amounts Recognized in AOCI and not yet refl ected in Net Periodic Benefi t Cost expected to be amortized in next year’s Net Periodic Benefi t Cost: Net actuarial loss (gain) $ 130 $ 51 $ (12) $ (7) Prior service credit and other (113) (114) – –Total $ 17 $ (63) $ (12) $ (7)
(1) The measurement date for 2009 is May 31, 2009, and the measurement date for 2008 is February 29, 2008.
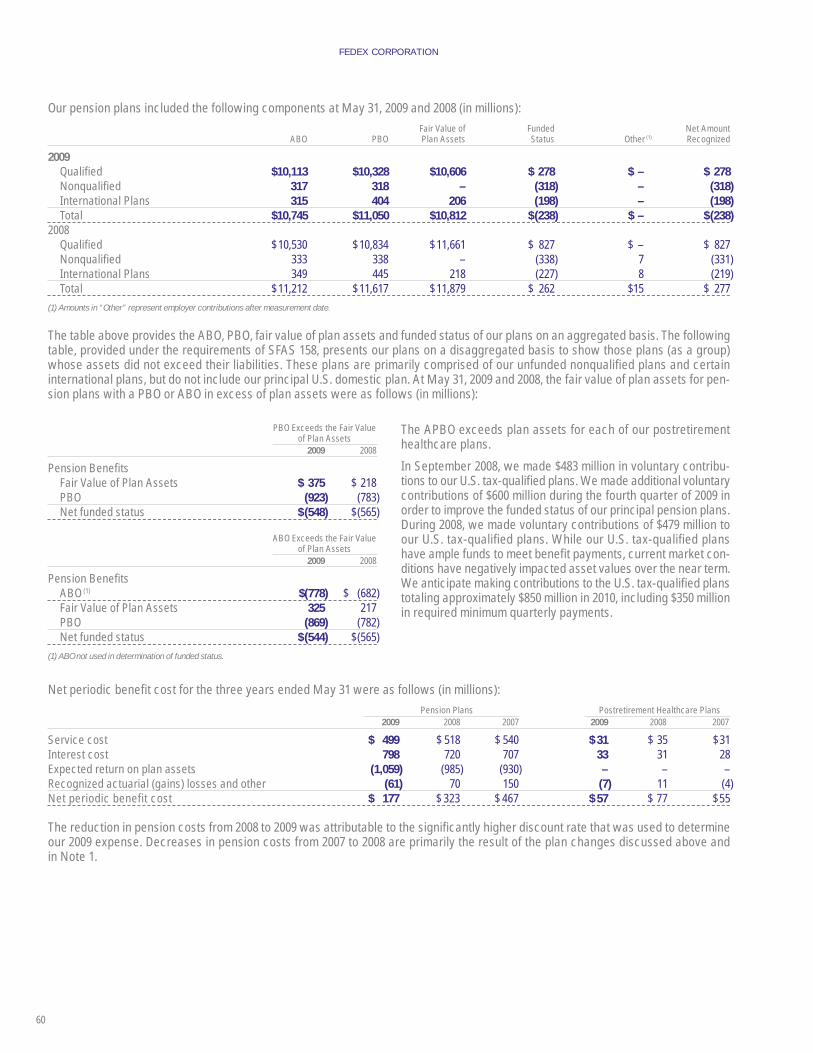
FEDEX CORPORATION
60
PBO Exceeds the Fair Value of Plan Assets 2009 2008
Pension Benefi ts Fair Value of Plan Assets $ 375 $ 218 PBO (923) (783) Net funded status $ (548) $ (565) ABO Exceeds the Fair Value of Plan Assets 2009 2008
Pension Benefi ts ABO (1) $(778) $ (682) Fair Value of Plan Assets 325 217 PBO (869) (782) Net funded status $ (544) $ (565)(1) ABO not used in determination of funded status.
The APBO exceeds plan assets for each of our postretirement healthcare plans.
In September 2008, we made $483 million in voluntary contribu-tions to our U.S. tax-qualifi ed plans. We made additional voluntary contributions of $600 million during the fourth quarter of 2009 in order to improve the funded status of our principal pension plans. During 2008, we made voluntary contributions of $479 million to our U.S. tax-qualifi ed plans. While our U.S. tax-qualifi ed plans have ample funds to meet benefi t payments, current market con-ditions have negatively impacted asset values over the near term. We anticipate making contributions to the U.S. tax-qualifi ed plans totaling approximately $850 million in 2010, including $350 million in required minimum quarterly payments.
Net periodic benefi t cost for the three years ended May 31 were as follows (in millions): Pension Plans Postretirement Healthcare Plans 2009 2008 2007 2009 2008 2007
Service cost $ 499 $ 518 $ 540 $ 31 $ 35 $ 31Interest cost 798 720 707 33 31 28Expected return on plan assets (1,059) (985) (930) – – –Recognized actuarial (gains) losses and other (61) 70 150 (7) 11 (4)Net periodic benefit cost $ 177 $ 323 $ 467 $ 57 $ 77 $ 55
The reduction in pension costs from 2008 to 2009 was attributable to the signifi cantly higher discount rate that was used to determine our 2009 expense. Decreases in pension costs from 2007 to 2008 are primarily the result of the plan changes discussed above and in Note 1.
Our pension plans included the following components at May 31, 2009 and 2008 (in millions): Fair Value of Funded Net Amount ABO PBO Plan Assets Status Other (1) Recognized
2009 Qualifi ed $ 10,113 $ 10,328 $ 10,606 $ 278 $ – $ 278 Nonqualifi ed 317 318 – (318) – (318) International Plans 315 404 206 (198) – (198) Total $ 10,745 $ 11,050 $ 10,812 $ (238) $ – $ (238) 2008 Qualifi ed $ 10,530 $ 10,834 $ 11,661 $ 827 $ – $ 827 Nonqualifi ed 333 338 – (338) 7 (331) International Plans 349 445 218 (227) 8 (219) Total $ 11,212 $ 11,617 $ 11,879 $ 262 $ 15 $ 277(1) Amounts in “Other” represent employer contributions after measurement date.
The table above provides the ABO, PBO, fair value of plan assets and funded status of our plans on an aggregated basis. The following table, provided under the requirements of SFAS 158, presents our plans on a disaggregated basis to show those plans (as a group) whose assets did not exceed their liabilities. These plans are primarily comprised of our unfunded nonqualifi ed plans and certain international plans, but do not include our principal U.S. domestic plan. At May 31, 2009 and 2008, the fair value of plan assets for pen-sion plans with a PBO or ABO in excess of plan assets were as follows (in millions):

NOTES TO CONSOLIDATED FINANCIAL STATEMENTS
61
Benefi t payments, which refl ect expected future service, are expected to be paid as follows for the years ending May 31 (in millions): Postretirement Pension Plans Healthcare Plans
2010 $ 432 $ 272011 455 292012 507 302013 584 312014 654 322015–2019 4,654 188
These estimates are based on assumptions about future events. Actual benefit payments may vary significantly from these estimates.
Future medical benefi t claims costs are estimated to increase at an annual rate of 9% during 2010, decreasing to an annual growth rate of 4.5% in 2029 and thereafter. Future dental benefi t costs are estimated to increase at an annual rate of 7% during 2010, decreasing to an annual growth rate of 4.5% in 2029 and there-after. A 1% change in these annual trend rates would not have a signifi cant impact on the APBO at May 31, 2009 or 2009 benefi t expense because the level of these benefi ts is capped.
Note 13: Business Segment InformationFedEx Express, FedEx Ground and the FedEx Freight LTL Group represent our major service lines and, along with FedEx Services, form the core of our reportable segments. Our reportable seg-ments as of May 31, 2009 included the following businesses:
FedEx Express Segment FedEx Express (express transportation)
FedEx Trade Networks (global trade services)
FedEx Ground Segment FedEx Ground (small-package ground delivery) FedEx SmartPost (small-parcel consolidator) FedEx Freight Segment FedEx Freight LTL Group: FedEx Freight (regional LTL freight transportation) FedEx National LTL (long-haul LTL freight transportation) FedEx Custom Critical (time-critical transportation) Caribbean Transportation Services (airfreight forwarding)
FedEx Services Segment FedEx Services (sales, marketing and information technology functions) FedEx Offi ce (document and business services and package acceptance) FedEx Customer Information Services (“FCIS”) (customer service, billings and collections) FedEx Global Supply Chain Services (logistics services)
Amounts recognized in OCI for all plans were as follows (in millions): 2009 2008 Postretirement Postretirement Pension Plans Healthcare Plans Pension Plans Healthcare Plans Gross Net of tax Gross Net of tax Gross Net of tax Gross Net of tax amount amount amount amount amount amount amount amount
Net gain (loss) and other, arising during period $ 1,944 $ 1,220 $ (94) $ (61) $ (685) $ (430) $ (56) $ (38)Gain (loss) from settlements and curtailments 2 1 – – (17) (10) 6 4Amortizations: Prior service credit 113 71 – – 113 70 – – Actuarial (losses) gains and other (49) (30) 7 4 (166) (104) 3 2Total recognized in OCI $ 2,010 $ 1,262 $ (87) $ (57) $ (755) $ (474) $ (47) $ (32)
Weighted-average actuarial assumptions for our primary U.S. pension plans, which represent substantially all of our PBO, are as follows: Pension Plans Postretirement Healthcare Plans 2009 2008 2007 2009 2008 2007
Discount rate used to determine benefi t obligation (1) 7.68% 6.96% 6.01% 7.27% 6.81% 6.08%Discount rate used to determine net periodic benefi t cost 7.15 6.01 5.91 7.13 6.08 6.08Rate of increase in future compensation levels used to determine benefi t obligation 4.42 4.51 4.47 – – –Rate of increase in future compensation levels used to determine net periodic benefi t cost (2) 4.49 4.47 3.46 – – –Expected long-term rate of return on assets 8.50 8.50 9.10 – – –(1) The assumed interest rate used to discount the estimated future benefi t payments that have been accrued to date (the PBO) to their net present value.(2) Average future salary increases based on age and years of service.

FEDEX CORPORATION
62
Effective June 1, 2009, Caribbean Transportation Services, Inc. (“CTS”), a business in the FedEx Freight segment, was integrated into FedEx Express to leverage synergies between CTS and FedEx Express and to gain cost effi ciencies by maximizing the use of FedEx Express assets for this service offering.
FEDEX SERVICES SEGMENTThe FedEx Services segment includes: FedEx Services, which provides sales, marketing and information technology support to our other companies; FCIS, which is responsible for customer service, billings and collections for FedEx Express and FedEx Ground U.S. customers; FedEx Global Supply Chain Services, which provides a range of logistics services to our customers; and FedEx Offi ce, which provides retail access to our customers for our package transportation businesses and an array of document and business services.
The costs of the sales, marketing and information technology support provided by FedEx Services and the customer service functions of FCIS, together with the normal, ongoing net operating costs of FedEx Global Supply Chain Services and FedEx Offi ce, are allocated primarily to the FedEx Express and FedEx Ground segments based on metrics such as relative revenues or estimated services provided. We believe these allocations approximate the net cost of providing these functions. The $810 million fourth quarter 2009 impairment charge for the Kinko’s goodwill and the $891 million 2008 charge predominantly associated with impairment charges for the Kinko’s trade name and goodwill were not allocated to the FedEx Express or FedEx Ground segments, as the charges were unrelated to the core performance of those businesses.
The operating expenses line item “Intercompany charges” on the accompanying unaudited fi nancial summaries of our transportation segments in Management’s Discussion and Analysis of Operations and Financial Condition (“MD&A”) includes the allocations from the FedEx Services segment to the respective transportation segments. The “Intercompany charges” caption also includes allocations for administrative services provided between operating companies and certain other costs such as corporate management fees related to services received for general corporate oversight, including executive offi cers and certain legal and fi nance functions. Management evaluates transportation segment fi nancial performance based on operating income.
OTHER INTERSEGMENT TRANSACTIONSCertain FedEx operating companies provide transportation and related services for other FedEx companies outside their reportable segment. Billings for such services are based on negotiated rates, which we believe approximate fair value, and are refl ected as revenues of the billing segment. These rates are adjusted from time to time based on market conditions. Such intersegment revenues and expenses are eliminated in the consolidated results and are not separately identifi ed in the following segment information, as the amounts are not material.
The following table provides a reconciliation of reportable segment revenues, depreciation and amortization, operating income (loss) and segment assets to consolidated fi nancial statement totals for the years ended or as of May 31 (in millions): FedEx FedEx FedEx FedEx Express Ground Freight Services Other and Consolidated Segment (1) Segment Segment (2) Segment (3) Eliminations Total
Revenues 2009 $ 22,364 $ 7,047 $ 4,415 $ 1,977 $ (306) $ 35,4972008 24,421 6,751 4,934 2,138 (291) 37,9532007 22,681 6,043 4,586 2,136 (232) 35,214Depreciation and amortization 2009 $ 961 $ 337 $ 224 $ 451 $ 2 $ 1,9752008 944 305 227 469 1 1,9462007 856 268 195 420 3 1,742Operating income (loss)
2009 $ 794 $ 807 $ (44) $ (810) $ – $ 7472008 1,901 736 329 (891) – 2,0752007 1,991 822 463 – – 3,276Segment assets (4)
2009 $ 13,483 $ 3,291 $ 3,044 $ 3,240 $ 1,186 $ 24,2442008 13,416 2,770 3,276 4,651 1,520 25,6332007 15,650 3,937 3,150 5,384 (4,121) 24,000(1) FedEx Express segment 2009 operating expenses include a charge of $260 million primarily related to aircraft-related asset impairments. FedEx Express segment 2007 operating expenses include a charge of $143 million associated with upfront compensation and benefi ts under our pilot labor contract.(2) FedEx Freight segment 2009 operating expenses include a charge of $100 million primarily related to impairment charges associated with goodwill related to the Watkins Motor Lines (now known as FedEx National LTL) acquisition. FedEx Freight segment results include the results of FedEx National LTL from the date of its acquisition on September 3, 2006.(3) FedEx Services segment 2009 operating expenses include a charge of $810 million related to impairment of goodwill resulting from the Kinko’s acquisition. FedEx Services segment 2008 operating expenses include a charge of $891 million predominantly related to impairment charges associated with the decision to minimize the use of the Kinko’s trade name and goodwill resulting from the Kinko’s acquisition. The normal, ongoing net operating costs of the FedEx Services segment are allocated back to the transportation segments.(4) Segment assets include intercompany receivables.

NOTES TO CONSOLIDATED FINANCIAL STATEMENTS
63
The following table presents revenue by service type and geographic information for the years ended or as of May 31 (in millions):
Revenue by Service Type 2009 2008 2007
FedEx Express segment: Package: U.S. overnight box $ 6,074 $ 6,578 $ 6,485 U.S. overnight envelope 1,855 2,012 1,990 U.S. deferred 2,789 2,995 2,883 Total domestic package revenue 10,718 11,585 11,358 International Priority (IP) 6,978 7,666 6,722 International domestic (1) 565 663 370 Total package revenue 18,261 19,914 18,450 Freight: U.S. 2,165 2,398 2,412 International Priority Freight 1,104 1,243 1,045 International airfreight 369 406 394 Total freight revenue 3,638 4,047 3,851 Other (2) 465 460 380 Total FedEx Express segment 22,364 24,421 22,681 FedEx Ground segment 7,047 6,751 6,043 FedEx Freight segment (3) 4,415 4,934 4,586 FedEx Services segment 1,977 2,138 2,136 Other and eliminations (306) (291) (232) $ 35,497 $ 37,953 $ 35,214
Geographical Information (4)
Revenues: U.S. $ 25,819 $ 27,306 $ 26,132 International 9,678 10,647 9,082 $ 35,497 $ 37,953 $ 35,214 Noncurrent assets: U.S. $ 13,560 $ 14,920 $ 14,191 International 3,568 3,469 3,180 $ 17,128 $ 18,389 $ 17,371(1) International domestic revenues include our international domestic express operations, primarily in the United Kingdom, Canada, China and India. We reclassifi ed the prior period international domestic revenues previously included within other revenues to conform to the current period presentation.(2) Other revenues includes FedEx Trade Networks.(3) Includes the operations of FedEx National LTL from the date of acquisition, September 3, 2006.(4) International revenue includes shipments that either originate in or are destined to locations outside the United States. Noncurrent assets include property and equipment, goodwill and other long-term assets. Flight equipment is allocated between geographic areas based on usage.
Note 14: Supplemental Cash Flow InformationCash paid for interest expense and income taxes for the years ended May 31 was as follows (in millions): 2009 2008 2007
Interest (net of capitalized interest) $ 61 $ 105 $ 136Income taxes 509 816 1,064
Note 15: Guarantees and Indemnifi cations In conjunction with certain transactions, primarily the lease, sale or purchase of operating assets or services in the ordinary course of business, we may provide routine guarantees or indemnifi ca-tions (e.g., environmental, fuel, tax and software infringement), the terms of which range in duration, and often they are not lim-ited and have no specifi ed maximum obligation. As a result, the overall maximum potential amount of the obligation under such guarantees and indemnifi cations cannot be reasonably estimated. Historically, we have not been required to make signifi cant pay-ments under our guarantee or indemnifi cation obligations and no amounts have been recognized in our fi nancial statements for the underlying fair value of these obligations.
Special facility revenue bonds have been issued by certain municipalities primarily to fi nance the acquisition and construc-tion of various airport facilities and equipment. These facilities were leased to us and are accounted for as either capital leases or operating leases. FedEx Express has unconditionally guaran-teed $755 million in principal of these bonds (with total future principal and interest payments of approximately $1.0 billion as of May 31, 2009) through these leases. Of the $755 million bond principal guaranteed, $204 million was included in capital lease obligations in our balance sheet at May 31, 2009. The remaining $551 million has been accounted for as operating leases.
The following table provides a reconciliation of reportable segment capital expenditures to consolidated totals for the years ended May 31 (in millions): FedEx FedEx FedEx FedEx Express Ground Freight Services Consolidated Segment Segment Segment Segment Other Total
2009 $ 1,348 $ 636 $ 240 $ 235 $ – $ 2,4592008 1,716 509 266 455 1 2,9472007 1,672 489 287 432 2 2,882

FEDEX CORPORATION
64
Note 16: Commitments Annual purchase commitments under various contracts as of May 31, 2009 were as follows (in millions): Aircraft- Aircraft (1) Related (2) Other (3) Total
2010 $ 710 $ 254 $ 648 $ 1,6122011 765 26 137 9282012 527 – 111 6382013 425 – 62 4872014 466 – 11 477Thereafter 1,924 – 125 2,049(1) Our obligation to purchase 15 of these aircraft (Boeing 777 Freighters, or B777Fs) is conditioned upon there being no event that causes FedEx Express or its employees not to be covered by the Railway Labor Act of 1926, as amended. (2) Primarily aircraft modifi cations.(3) Primarily vehicles, facilities, computers, advertising and promotions contracts and for 2010, a total of $350 million of required quarterly contributions to our U.S. domestic pension plans.
The amounts refl ected in the table above for purchase commit-ments represent noncancelable agreements to purchase goods or services. Commitments to purchase aircraft in passenger confi guration do not include the attendant costs to modify these aircraft for cargo transport unless we have entered into non-cancelable commitments to modify such aircraft. Open purchase orders that are cancelable are not considered unconditional pur-chase obligations for fi nancial reporting purposes and are not included in the table above.
In December 2008, we reached an agreement with Boeing to defer the delivery of certain B777F aircraft by up to 17 months. The rescheduled delivery dates have been refl ected in the table above. In addition, in January 2009, we exercised our option with Boeing to purchase an additional 15 B777F aircraft and obtained an option to purchase an additional 15 B777F aircraft. Our obli-gation to purchase these additional aircraft is conditioned upon there being no event that causes FedEx Express or its employees not to be covered by the Railway Labor Act of 1926, as amended. Accordingly, we have now agreed, subject to the above contrac-tual condition, to purchase a total of 30 B777F aircraft and hold an option to purchase an additional 15 B777F aircraft.
Deposits and progress payments of $544 million have been made toward aircraft purchases, options to purchase additional air-craft and other planned aircraft-related transactions. These deposits are classified in the “Intangible and other assets” caption of our consolidated balance sheets. Our primary air-craft purchase commitments include the B757 in passenger confi guration, which will require additional costs to modify for cargo transport, and the new B777F aircraft. In addition, we have committed to modify our DC10 aircraft for two-man cockpit confi gurations. Future payments related to these activities are included in the table above. Aircraft and aircraft-related con-tracts are subject to price escalations. The following table is
a summary of the number and type of aircraft we are commit-ted to purchase as of May 31, 2009, with the year of expected delivery: B757 B777F MD11 Total
2010 12 4 2 18 2011 16 4 – 20 2012 8 3 – 11 2013 – 3 – 3 2014 – 3 – 3 Thereafter – 13 – 13 Total 36 30 2 68
Note 17: ContingenciesWage-and-Hour. We are a defendant in a number of lawsuits containing various class-action allegations of wage-and-hour violations. The plaintiffs in these lawsuits allege, among other things, that they were forced to work “off the clock,” were not paid overtime or were not provided work breaks or other benefi ts. The complaints generally seek unspecifi ed monetary damages, injunctive relief, or both.
In February 2008, one of these wage-and-hour cases, Wiegele v. FedEx Ground, was certifi ed as a class action by a California federal court, and in April 2008, the U.S. Court of Appeals for the Ninth Circuit denied our petition to review the class certifi ca-tion ruling. The plaintiffs in Wiegele represent a class of FedEx Ground sort managers and dock service managers in California from May 10, 2002 to the present. The plaintiffs allege that FedEx Ground has misclassified the managers as exempt from the overtime requirements of California wage-and-hour laws and is correspondingly liable for failing to pay them overtime compensa-tion and provide them with rest and meal breaks. Subject to court approval, the plaintiffs have agreed to dismiss the sort managers, leaving only the dock service managers in the class.
In September 2008, in another one of these wage-and-hour cases, Tidd v. Adecco USA, Kelly Services and FedEx Ground, a Massachusetts federal court conditionally certifi ed a class limited to individuals who were employed by two temporary employment agencies and who worked as temporary pick-up-and-delivery drivers for FedEx Ground in the New England region within the past three years. Potential claimants must vol-untarily “opt in” to the lawsuit in order to be considered part of the class. In addition, in the same opinion, the court granted summary judgment in favor of FedEx Ground with respect to the plaintiffs’ claims for unpaid overtime wages. Accordingly, as to FedEx Ground, the conditionally certifi ed class of plaintiffs is now limited to a claim of failure to pay regular wages due under the federal Fair Labor Standards Act.
In April 2009, in another one of these wage-and-hour cases, Bibo v. FedEx Express, a California federal court granted class certifi -cation, certifying several subclasses of FedEx Express couriers in California from April 14, 2006 (the date of the settlement of the Foster class action) to the present. The plaintiffs allege that FedEx Express violated California wage-and-hour laws after the date of the Foster settlement. In particular, the plaintiffs allege,

NOTES TO CONSOLIDATED FINANCIAL STATEMENTS
65
among other things, that they were forced to work “off the clock” and were not provided with required meal breaks or split-shift premiums. We have asked the U.S. Court of Appeals for the Ninth Circuit to accept an appeal of the class certifi cation ruling.
These class certifi cation rulings do not address whether we will ultimately be held liable. We have denied any liability and intend to vigorously defend ourselves in these wage-and-hour lawsuits. We do not believe that any loss is probable in these lawsuits.
Independent Contractor — Lawsuits and State Administrative Proceedings. FedEx Ground is involved in approximately 50 class-action lawsuits (including 21 that have been certifi ed as class actions), several individual lawsuits and approximately 40 state tax and other administrative proceedings that claim that the com-pany’s owner-operators should be treated as employees, rather than independent contractors.
Most of the class-action lawsuits have been consolidated for administration of the pre-trial proceedings by a single federal court, the U.S. District Court for the Northern District of Indiana. With the exception of recently fi led cases that have been or will be transferred to the multidistrict litigation, discovery on class certifi cation and classifi cation issues and class certifi cation briefi ng are now complete. In October 2007, we received a deci-sion from the court granting class certifi cation in a Kansas action alleging state law claims on behalf of a statewide class and fed-eral law claims under the Employee Retirement Income Security Act of 1974 on behalf of a nationwide class. In January 2008, the U.S. Court of Appeals for the Seventh Circuit declined our request for appellate review of the class certifi cation decision. In March 2008, the court granted class certifi cation in 19 addi-tional cases and denied it in nine cases. The court has not yet ruled on class certifi cation in the other cases that are pending in the multidistrict litigation. Motions for summary judgment on the classifi cation issue (i.e., independent contractor vs. employee) are pending in all 20 of the multidistrict litigation cases that have been certifi ed as class actions.
In January 2008, one of the contractor-model lawsuits that is not part of the multidistrict litigation, Anfi nson v. FedEx Ground, was certifi ed as a class action by a Washington state court. The plaintiffs in Anfi nson represent a class of FedEx Ground single-route, pickup-and-delivery owner-operators in Washington from December 21, 2001 through December 31, 2005 and allege that the class members should be reimbursed as employees for their uni-form expenses and should receive overtime pay. In March 2009, a jury trial in the Anfi nson case was held, and the jury returned a verdict in favor of FedEx Ground, fi nding that all 320 class mem-bers were independent contractors, not employees. The plaintiffs have appealed the verdict. The other contractor-model lawsuits that are not part of the multidistrict litigation are not as far along procedurally as Anfi nson and are all currently stayed pending further developments in the multidistrict litigation.
FedEx Ground is also involved in several lawsuits, including one purported class action, brought by drivers of the company’s inde-pendent contractors who claim that they were jointly employed by the contractor and FedEx Ground.
Adverse determinations in these matters could, among other things, entitle certain of our contractors and their drivers to the reimbursement of certain expenses and to the benefi t of wage-and-hour laws and result in employment and withholding tax and benefi t liability for FedEx Ground, and could result in changes to the independent contractor status of FedEx Ground’s owner-operators. We believe that FedEx Ground’s owner-operators are properly classified as independent contractors and that FedEx Ground is not an employer of the drivers of the company’s independent contractors. Given the nature and status of these lawsuits, we cannot yet determine the amount or a reasonable range of potential loss, if any, but it is reasonably possible that such potential loss or such changes to the independent contrac-tor status of FedEx Ground’s owner-operators could be material. However, we do not believe that a material loss is probable in any of these matters.
Independent Contractor — IRS Audit. In October 2008, the IRS withdrew its tentative assessment of tax and penalties for the 2002 calendar year ($319 million plus interest) against FedEx Ground relating to the classifi cation of FedEx Ground’s owner-operators for federal employment tax purposes. The IRS is continuing its employment tax audit of FedEx Ground for the 2002 calendar year. We are engaged in discussions with the IRS audit team regarding this matter. We continue to believe that FedEx Ground’s owner-operators are independent contractors and that no loss is probable in this matter.
Independent Contractor — Shareholder Derivative Lawsuits. The Plumbers and Pipefi tters Local 51 Pension Fund and the Western Pennsylvania Bricklayers Pension Fund each fi led shareholder derivative lawsuits (which have now been consolidated) in Tennessee federal court naming FedEx Corporation as a nominal defendant and the members of the Board of Directors of FedEx Corporation as defendants (the Plumbers and Pipefi tters suit was fi led in May 2008 and the Bricklayers suit was fi led in June 2008). The derivative lawsuits, which are purportedly brought to assert the rights of FedEx Corporation, assert claims against the Board members for breach of fi duciary duty, abuse of control, gross mismanagement, waste of corporate assets and unjust enrich-ment in connection with the management of FedEx Ground — in particular, the classifi cation of FedEx Ground’s owner-operators as independent contractors. Given the preliminary status of these matters, we cannot yet determine the amount or a reasonable range of potential loss. However, we do not believe that any loss is probable.
Other. FedEx and its subsidiaries are subject to other legal pro-ceedings that arise in the ordinary course of their business. In the opinion of management, the aggregate liability, if any, with respect to these other actions will not have a material adverse effect on our fi nancial position, results of operations or cash fl ows.
Additional information about our contingencies can be found in the Critical Accounting Estimates section of Management’s Discussion and Analysis.
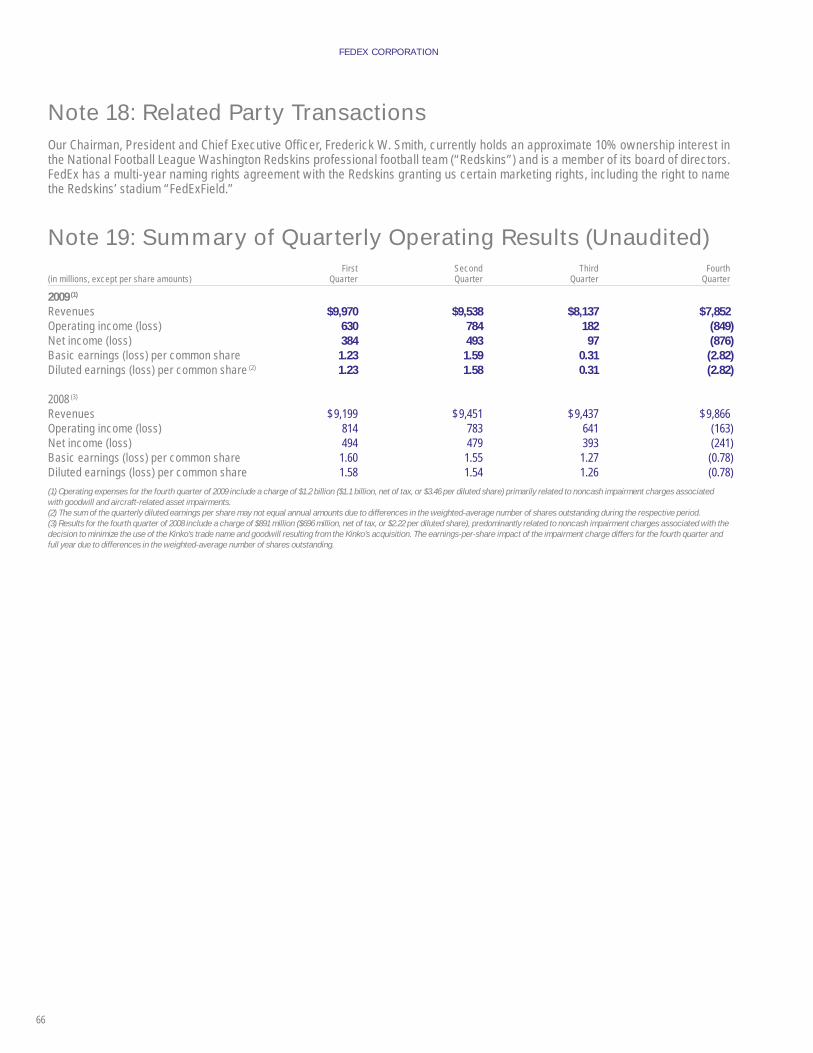
FEDEX CORPORATION
66
Note 18: Related Party TransactionsOur Chairman, President and Chief Executive Offi cer, Frederick W. Smith, currently holds an approximate 10% ownership interest in the National Football League Washington Redskins professional football team (“Redskins”) and is a member of its board of directors. FedEx has a multi-year naming rights agreement with the Redskins granting us certain marketing rights, including the right to name the Redskins’ stadium “FedExField.”
Note 19: Summary of Quarterly Operating Results (Unaudited) First Second Third Fourth(in millions, except per share amounts) Quarter Quarter Quarter Quarter
2009 (1)
Revenues $ 9,970 $ 9,538 $ 8,137 $ 7,852Operating income (loss) 630 784 182 (849)Net income (loss) 384 493 97 (876)Basic earnings (loss) per common share 1.23 1.59 0.31 (2.82)Diluted earnings (loss) per common share (2) 1.23 1.58 0.31 (2.82)
2008 (3)
Revenues $ 9,199 $ 9,451 $ 9,437 $ 9,866Operating income (loss) 814 783 641 (163)Net income (loss) 494 479 393 (241)Basic earnings (loss) per common share 1.60 1.55 1.27 (0.78)Diluted earnings (loss) per common share 1.58 1.54 1.26 (0.78)(1) Operating expenses for the fourth quarter of 2009 include a charge of $1.2 billion ($1.1 billion, net of tax, or $3.46 per diluted share) primarily related to noncash impairment charges associated with goodwill and aircraft-related asset impairments.(2) The sum of the quarterly diluted earnings per share may not equal annual amounts due to differences in the weighted-average number of shares outstanding during the respective period.(3) Results for the fourth quarter of 2008 include a charge of $891 million ($696 million, net of tax, or $2.22 per diluted share), predominantly related to noncash impairment charges associated with the decision to minimize the use of the Kinko’s trade name and goodwill resulting from the Kinko’s acquisition. The earnings-per-share impact of the impairment charge differs for the fourth quarter and full year due to differences in the weighted-average number of shares outstanding.

NOTES TO CONSOLIDATED FINANCIAL STATEMENTS
67
NOTES TO CONSOLIDATED FINANCIAL STATEMENTS
Note 20: Condensed Consolidating Financial StatementsWe are required to present condensed consolidating fi nancial information in order for the subsidiary guarantors (other than FedEx Express) of our public debt to continue to be exempt from reporting under the Securities Exchange Act of 1934.
The guarantor subsidiaries, which are wholly owned by FedEx, guarantee $1.7 billion of our debt. The guarantees are full and uncon-ditional and joint and several. Our guarantor subsidiaries were not determined using geographic, service line or other similar criteria, and as a result, the “Guarantor” and “Non-Guarantor” columns each include portions of our domestic and international operations. Accordingly, this basis of presentation is not intended to present our fi nancial condition, results of operations or cash fl ows for any purpose other than to comply with the specifi c requirements for subsidiary guarantor reporting.
Condensed consolidating fi nancial statements for our guarantor subsidiaries and non-guarantor subsidiaries are presented in the following tables (in millions):
CONDENSED CONSOLIDATING BALANCE SHEETS May 31, 2009 Guarantor Non-Guarantor Parent Subsidiaries Subsidiaries Eliminations Consolidated
ASSETSCurrent Assets Cash and cash equivalents $ 1,768 $ 272 $ 304 $ (52) $ 2,292 Receivables, less allowances 1 2,717 712 (39) 3,391 Spare parts, supplies and fuel, prepaid expenses and other, less allowances 1 838 83 – 922 Deferred income taxes – 486 25 – 511 Total current assets 1,770 4,313 1,124 (91) 7,116
Property and Equipment, at Cost 23 26,984 2,253 – 29,260 Less accumulated depreciation and amortization 17 14,659 1,167 – 15,843 Net property and equipment 6 12,325 1,086 – 13,417
Intercompany Receivable 758 – 379 (1,137) –Goodwill – 1,485 744 – 2,229Investment in Subsidiaries 11,973 2,129 – (14,102) –Pension Assets 311 – – – 311Other Assets 911 994 121 (855) 1,171 $ 15,729 $ 21,246 $ 3,454 $ (16,185) $ 24,244
LIABILITIES AND STOCKHOLDERS’ INVESTMENTCurrent Liabilities Current portion of long-term debt $ 500 $ 153 $ – $ – $ 653 Accrued salaries and employee benefi ts 26 711 124 – 861 Accounts payable 5 1,078 380 (91) 1,372 Accrued expenses 51 1,426 161 – 1,638 Total current liabilities 582 3,368 665 (91) 4,524Long-Term Debt, Less Current Portion 1,250 680 – – 1,930Intercompany Payable – 1,137 – (1,137) – Other Liabilities Deferred income taxes – 1,875 51 (855) 1,071 Other liabilities 271 2,732 90 – 3,093 Total other long-term liabilities 271 4,607 141 (855) 4,164 Stockholders’ Investment 13,626 11,454 2,648 (14,102) 13,626 $ 15,729 $ 21,246 $ 3,454 $ (16,185) $ 24,244

FEDEX CORPORATION
68
CONDENSED CONSOLIDATING BALANCE SHEETS May 31, 2008 Guarantor Non-Guarantor Parent Subsidiaries Subsidiaries Eliminations Consolidated
ASSETSCurrent Assets Cash and cash equivalents $ 1,101 $ 166 $ 272 $ – $ 1,539 Receivables, less allowances 4 3,310 1,083 (38) 4,359 Spare parts, supplies and fuel, prepaid expenses and other, less allowances 10 710 82 – 802 Deferred income taxes – 512 32 – 544 Total current assets 1,115 4,698 1,469 (38) 7,244
Property and Equipment, at Cost 24 26,658 2,623 – 29,305 Less accumulated depreciation and amortization 16 14,578 1,233 – 15,827 Net property and equipment 8 12,080 1,390 – 13,478
Intercompany Receivable 1,902 – 333 (2,235) –Goodwill – 2,299 866 – 3,165Investment in Subsidiaries 11,913 2,678 – (14,591) –Pension Assets 813 1 13 – 827Other Assets 381 744 153 (359) 919 $ 16,132 $ 22,500 $ 4,224 $ (17,223) $ 25,633 LIABILITIES AND STOCKHOLDERS’ INVESTMENTCurrent Liabilities Current portion of long-term debt $ 500 $ – $ 2 $ – $ 502 Accrued salaries and employee benefi ts 41 881 196 – 1,118 Accounts payable 3 1,774 456 (38) 2,195 Accrued expenses 25 1,301 227 – 1,553 Total current liabilities 569 3,956 881 (38) 5,368
Long-Term Debt, Less Current Portion 749 756 1 – 1,506Intercompany Payable – 2,235 – (2,235) –Other Liabilities Deferred income taxes – 1,518 105 (359) 1,264 Other liabilities 288 2,549 132 – 2,969 Total other long-term liabilities 288 4,067 237 (359) 4,233
Stockholders’ Investment 14,526 11,486 3,105 (14,591) 14,526 $ 16,132 $ 22,500 $ 4,224 $ (17,223) $ 25,633

NOTES TO CONSOLIDATED FINANCIAL STATEMENTS
69
CONDENSED CONSOLIDATING STATEMENTS OF INCOME Year Ended May 31, 2009 Guarantor Non-Guarantor Parent Subsidiaries Subsidiaries Eliminations Consolidated
REVENUES $ – $ 29,923 $ 5,851 $ (277) $ 35,497
OPERATING EXPENSES: Salaries and employee benefi ts 82 11,483 2,202 – 13,767 Purchased transportation – 3,362 1,211 (39) 4,534 Rentals and landing fees 4 2,134 296 (5) 2,429 Depreciation and amortization 2 1,706 267 – 1,975 Fuel – 3,554 257 – 3,811 Maintenance and repairs 1 1,755 142 – 1,898 Impairment and other charges – 1,098 106 – 1,204 Intercompany charges, net (193) 81 112 – – Other 104 4,198 1,063 (233) 5,132 – 29,371 5,656 (277) 34,750
OPERATING INCOME – 552 195 – 747
OTHER INCOME (EXPENSE): Equity in earnings of subsidiaries 98 103 – (201) – Interest, net (73) 28 (14) – (59) Intercompany charges, net 90 (118) 28 – – Other, net (17) (3) 9 – (11)
INCOME BEFORE INCOME TAXES 98 562 218 (201) 677 Provision for income taxes – 514 65 – 579NET INCOME $ 98 $ 48 $ 153 $ (201) $ 98
Year Ended May 31, 2008 Guarantor Non-Guarantor Parent Subsidiaries Subsidiaries Eliminations Consolidated
REVENUES $ – $ 31,464 $ 6,860 $ (371) $ 37,953
OPERATING EXPENSES: Salaries and employee benefi ts 98 11,660 2,444 – 14,202 Purchased transportation – 3,392 1,333 (91) 4,634 Rentals and landing fees 4 2,127 313 (3) 2,441 Depreciation and amortization 2 1,651 293 – 1,946 Fuel – 4,095 314 – 4,409 Maintenance and repairs 1 1,907 160 – 2,068 Impairment charges – 882 – – 882 Intercompany charges, net (204) (94) 298 – – Other 99 4,400 1,074 (277) 5,296 – 30,020 6,229 (371) 35,878
OPERATING INCOME – 1,444 631 – 2,075
OTHER INCOME (EXPENSE): Equity in earnings of subsidiaries 1,125 310 – (1,435) – Interest, net (44) 4 (14) – (54) Intercompany charges, net 51 (66) 15 – – Other, net (7) 3 (1) – (5)
INCOME BEFORE INCOME TAXES 1,125 1,695 631 (1,435) 2,016 Provision for income taxes – 687 204 – 891NET INCOME $ 1,125 $ 1,008 $ 427 $ (1,435) $ 1,125
NOTES TO CONSOLIDATED FINANCIAL STATEMENTS

FEDEX CORPORATION
70
CONDENSED CONSOLIDATING STATEMENTS OF INCOME Year Ended May 31, 2007 Guarantor Non-Guarantor Parent Subsidiaries Subsidiaries Eliminations Consolidated
REVENUES $ – $ 29,894 $ 5,671 $ (351) $ 35,214
OPERATING EXPENSES: Salaries and employee benefi ts 103 11,632 2,005 – 13,740 Purchased transportation – 3,063 950 (35) 3,978 Rentals and landing fees 3 2,082 261 (3) 2,343 Depreciation and amortization 2 1,513 227 – 1,742 Fuel – 3,218 210 – 3,428 Maintenance and repairs 1 1,830 121 – 1,952 Intercompany charges, net (193) (170) 363 – – Other 84 4,133 851 (313) 4,755 – 27,301 4,988 (351) 31,938
OPERATING INCOME – 2,593 683 – 3,276
OTHER INCOME (EXPENSE): Equity in earnings of subsidiaries 2,016 390 – (2,406) – Interest, net (22) (29) (2) – (53) Intercompany charges, net 29 (34) 5 – – Other, net (7) – (1) – (8)
INCOME BEFORE INCOME TAXES 2,016 2,920 685 (2,406) 3,215 Provision for income taxes – 971 228 – 1,199NET INCOME $ 2,016 $ 1,949 $ 457 $ (2,406) $ 2,016
CONDENSED CONSOLIDATING STATEMENTS OF CASH FLOWS Year Ended May 31, 2009 Guarantor Non-Guarantor Parent Subsidiaries Subsidiaries Eliminations Consolidated
CASH PROVIDED BY (USED IN) OPERATING ACTIVITIES $ (925) $ 3,357 $ 373 $ (52) $ 2,753
INVESTING ACTIVITIES Capital expenditures – (2,248) (211) – (2,459) Business acquisitions, net of cash acquired – – (3) – (3) Proceeds from asset dispositions and other – 69 10 – 79CASH USED IN INVESTING ACTIVITIES – (2,179) (204) – (2,383)
FINANCING ACTIVITIES Net transfers (to) from Parent 1,173 (1,066) (107) – – Payment on loan from Parent 17 – (17) – – Principal payments on debt (500) – (1) – (501) Proceeds from debt issuance 1,000 – – – 1,000 Proceeds from stock issuances 41 – – – 41 Excess tax benefi ts on the exercise of stock options 4 – – – 4 Dividends paid (137) – – – (137) Other, net (7) – – – (7)CASH PROVIDED BY (USED IN) FINANCING ACTIVITIES 1,591 (1,066) (125) – 400
CASH AND CASH EQUIVALENTS Effect of exchange rate changes on cash – (6) (11) – (17)Net increase (decrease) in cash and cash equivalents 666 106 33 (52) 753Cash and cash equivalents at beginning of period 1,101 166 272 – 1,539Cash and cash equivalents at end of period $ 1,767 $ 272 $ 305 $ (52) $ 2,292

NOTES TO CONSOLIDATED FINANCIAL STATEMENTS
71
CONDENSED CONSOLIDATING STATEMENTS OF CASH FLOWS Year Ended May 31, 2008 Guarantor Non-Guarantor Parent Subsidiaries Subsidiaries Eliminations Consolidated
CASH PROVIDED BY (USED IN) OPERATING ACTIVITIES $ (44) $ 3,070 $ 439 $ – $ 3,465
INVESTING ACTIVITIES Capital expenditures (1) (2,683) (263) – (2,947) Business acquisitions, net of cash acquired – – (4) – (4) Collection on (payment of) loan to Parent (5,971) 5,971 – – – Proceeds from asset dispositions and other – 34 20 – 54CASH USED IN INVESTING ACTIVITIES (5,972) 3,322 (247) – (2,897)
FINANCING ACTIVITIES Net transfers (to) from Parent 463 (296) (167) – – Dividend paid (to) from Parent 5,971 (5,971) – – – Principal payments on debt (551) (85) (3) – (639) Proceeds from stock issuances 108 – – – 108 Excess tax benefi ts on the exercise of stock options 38 – – – 38 Dividends paid (124) – – – (124) Other, net – – – – –CASH (USED IN) PROVIDED BY FINANCING ACTIVITIES 5,905 (6,352) (170) – (617)
CASH AND CASH EQUIVALENTS Effect of exchange rate changes on cash – 2 17 – 19Net (decrease) increase in cash and cash equivalents (111) 42 39 – (30)Cash and cash equivalents at beginning of period 1,212 124 233 – 1,569Cash and cash equivalents at end of period $ 1,101 $ 166 $ 272 $ – $ 1,539
Year Ended May 31, 2007 Guarantor Non-Guarantor Parent Subsidiaries Subsidiaries Eliminations Consolidated
CASH PROVIDED BY (USED IN) OPERATING ACTIVITIES $ (57) $ 2,741 $ 873 $ – $ 3,557
INVESTING ACTIVITIES Capital expenditures (1) (2,631) (250) – (2,882) Business acquisitions, net of cash acquired (175) (36) (1,099) – (1,310) Proceeds from asset dispositions – 47 21 – 68CASH USED IN INVESTING ACTIVITIES (176) (2,620) (1,328) – (4,124)
FINANCING ACTIVITIES Net transfers (to) from Parent (578) 40 538 – – Principal payments on debt (700) (206) – – (906) Proceeds from debt issuance 999 55 – – 1,054 Proceeds from stock issuances 115 – – – 115 Excess tax benefi ts on the exercise of stock options 45 – – – 45 Dividends paid (110) – – – (110) Other, net (5) – – – (5)CASH PROVIDED BY (USED IN) FINANCING ACTIVITIES (234) (111) 538 – 193
CASH AND CASH EQUIVALENTS Effect of exchange rate changes on cash – – 6 – 6Net (decrease) increase in cash and cash equivalents (467) 10 89 – (368)Cash and cash equivalents at beginning of period 1,679 114 144 – 1,937Cash and cash equivalents at end of period $ 1,212 $ 124 $ 233 $ – $ 1,569

FEDEX CORPORATION
72
FEDEX CORPORATION
Report of Independent Registered Public Accounting FirmThe Board of Directors and Stockholders FedEx Corporation
We have audited the accompanying consolidated balance sheets of FedEx Corporation as of May 31, 2009 and 2008, and the related consolidated statements of income, changes in stockholders’ investment and comprehensive income, and cash flows for each of the three years in the period ended May 31, 2009. These financial statements are the responsibility of the Company’s management. Our responsibility is to express an opinion on these financial statements based on our audits.
We conducted our audits in accordance with the standards of the Public Company Accounting Oversight Board (United States). Those standards require that we plan and perform the audit to obtain reasonable assurance about whether the financial statements are free of material misstatement. An audit includes examining, on a test basis, evidence supporting the amounts and disclosures in the financial statements. An audit also includes assessing the accounting principles used and significant estimates made by management, as well as evaluating the overall financial statement presentation. We believe that our audits provide a reasonable basis for our opinion.
In our opinion, the financial statements referred to above present fairly, in all material respects, the consolidated financial position of FedEx Corporation at May 31, 2009 and 2008, and the consolidated results of its operations and its cash flows for each of the three years in the period ended May 31, 2009, in conformity with U.S. generally accepted accounting principles.
As discussed in Note 1 to the consolidated financial statements, effective May 31, 2007 the Company adopted SFAS No. 158, “Employer’s Accounting for Defined Benefit Pension and Other Postretirement Benefit Plans — An Amendment of FASB Statements No. 87, 88, 106 and 132(R).”
We also have audited, in accordance with the standards of the Public Company Accounting Oversight Board (United States), FedEx Corporation’s internal control over financial reporting as of May 31, 2009, based on criteria established in Internal Control-Integrated Framework issued by the Committee of Sponsoring Organizations of the Treadway Commission and our report dated July 10, 2009 expressed an unqualified opinion thereon.
Memphis, TennesseeJuly 10, 2009

73
FEDEX CORPORATION
Selected Financial DataThe following table sets forth (in millions, except per share amounts and other operating data) certain selected consolidated fi nancial and operating data for FedEx as of and for the fi ve years ended May 31, 2009. This information should be read in conjunction with the Consolidated Financial Statements, Management’s Discussion and Analysis of Results of Operations and Financial Condition and other fi nancial data appearing elsewhere in this Annual Report. 2009 (1) 2008 (2) 2007 (3) 2006 (4) 2005 (5)
Operating ResultsRevenues $ 35,497 $ 37,953 $ 35,214 $ 32,294 $ 29,363Operating income 747 2,075 3,276 3,014 2,471Income before income taxes 677 2,016 3,215 2,899 2,313Net income 98 1,125 2,016 1,806 1,449
Per Share Data Earnings per share: Basic $ 0.31 $ 3.64 $ 6.57 $ 5.94 $ 4.81 Diluted $ 0.31 $ 3.60 $ 6.48 $ 5.83 $ 4.72Average shares of common stock outstanding 311 309 307 304 301Average common and common equivalent shares outstanding 312 312 311 310 307Cash dividends declared $ 0.44 $ 0.30 $ 0.37 $ 0.33 $ 0.29
Financial Position Property and equipment, net $ 13,417 $ 13,478 $ 12,636 $ 10,770 $ 9,643Total assets 24,244 25,633 24,000 22,690 20,404Long-term debt, less current portion 1,930 1,506 2,007 1,592 2,427Common stockholders’ investment 13,626 14,526 12,656 11,511 9,588
Other Operating Data FedEx Express aircraft fl eet 654 677 669 671 670Average full-time equivalent employees and contractors 247,908 254,142 241,903 221,677 215,838(1) Operating expenses include a charge of $1.2 billion ($1.1 billion, net of tax, or $3.45 per diluted share) primarily related to impairment charges associated with goodwill and aircraft. Additionally, common stockholders’ investment includes an other comprehensive income charge of $1.2 billion, net of tax, related to the funded status of our retirement plans at May 31, 2009.(2) Results for 2008 include a charge of $891 million ($696 million, net of tax, or $2.23 per diluted share) recorded during the fourth quarter, predominantly related to impairment charges associated with intangible assets from the Kinko’s acquisition. See Note 4 to the accompanying consolidated fi nancial statements. Additionally, results for 2008 and 2007 include several 2007 acquisitions, as described in Note 3 to the accompanying fi nancial statements.(3) Results for 2007 include a charge of $143 million at FedEx Express associated with upfront compensation and benefi ts under our labor contract with our pilots. See Note 1 to the accompanying consolidated fi nancial statements.(4) Results for 2006 include a charge of $79 million ($49 million, net of tax, or $0.16 per diluted share) to adjust the accounting for certain facility leases, predominantly at FedEx Express. (5) Results for 2005 include a charge of $48 million ($31 million, net of tax, or $0.10 per diluted share) at FedEx Express related to the Airline Stabilization Act and a $12 million, or $0.04 per diluted share, benefi t from an income-tax adjustment.