FEDERATED STATES OF MICRONESIA - IMF · FEDERATED STATES OF MICRONESIA ... to be at high risk of...
21
FEDERATED STATES OF MICRONESIA STAFF REPORT FOR THE 2015 ARTICLE IV CONSULTATION— DEBT SUSTAINABILITY ANALYSIS The first joint Bank-Fund Debt Sustainability Analysis assesses the Federated States of Micronesia (FSM) to be at high risk of debt distress. Under the baseline scenario that does not assume the implementation of the long-debated tax and growth-enhancing structural reforms, two debt indicators, namely, the present value of debt-to-GDP and debt-to-exports ratios are projected to exceed the indicative thresholds in the medium term. PV of public debt-to-GDP ratio will also rise gradually, while remaining under the threshold during the projection period. This points to the importance of undertaking further reforms, in particular those critical to enhancing growth and revenue, in order to bring the debt trajectory to a sustainable level. Background 1. The FSM is a 607-island microstate in the Pacific, composed of four states with a total population of slightly above 100,000. It is highly dependent on external aid provided mostly by the United States while adopting the U.S. dollar as legal tender. The loosely federated structure of the country makes policy decisions a complex task, as consensus across the national and the four state governments is required. This has hindered a number of critically important policy actions, including the long-debated tax reform package (introduction of a VAT in lieu of the state sales taxes and replacing the Gross Revenue Tax with a net income tax on corporations, among others, which will generate additional revenue of 4 percent of GDP) and growth-enhancing reforms, in particular, those related to address land tenure issues. 2. The FSM faces a long-term fiscal challenge as U.S. grants provided under the Compact of Free Association (Compact grants) will expire in FY2023, while the private sector is yet to become an engine of growth. A portion of the Compact grants has been disbursed into the Compact Trust Fund (CTF), jointly managed by the US and the FSM, with the intention that returns from the trust fund would Approved By Patrizia Tumbarello and Masato Miyazaki (IMF) Satu Kahkonen (IDA) Prepared by Staff of the International Monetary Fund and the International Development Association. April 24, 2015
Transcript of FEDERATED STATES OF MICRONESIA - IMF · FEDERATED STATES OF MICRONESIA ... to be at high risk of...

FEDERATED STATES OF
MICRONESIA STAFF REPORT FOR THE 2015 ARTICLE IV CONSULTATION—
DEBT SUSTAINABILITY ANALYSIS
The first joint Bank-Fund Debt Sustainability Analysis assesses the Federated States of Micronesia
(FSM) to be at high risk of debt distress. Under the baseline scenario that does not assume the
implementation of the long-debated tax and growth-enhancing structural reforms, two debt indicators,
namely, the present value of debt-to-GDP and debt-to-exports ratios are projected to exceed the
indicative thresholds in the medium term. PV of public debt-to-GDP ratio will also rise gradually, while
remaining under the threshold during the projection period. This points to the importance of
undertaking further reforms, in particular those critical to enhancing growth and revenue, in order to
bring the debt trajectory to a sustainable level.
Background
1. The FSM is a 607-island microstate in the Pacific, composed of four states with a total
population of slightly above 100,000. It is highly dependent on external aid provided mostly by the
United States while adopting the U.S. dollar as legal tender. The loosely federated structure of the country
makes policy decisions a complex task, as consensus across the national and the four state governments is
required. This has hindered a number of critically important policy actions, including the long-debated tax
reform package (introduction of a VAT in lieu of the state sales taxes and replacing the Gross Revenue Tax
with a net income tax on corporations, among others, which will generate additional revenue of 4 percent
of GDP) and growth-enhancing reforms, in particular, those related to address land tenure issues.
2. The FSM faces a long-term fiscal challenge as U.S. grants provided under the Compact of
Free Association (Compact grants) will expire in FY2023, while the private sector is yet to become an
engine of growth. A portion of the Compact grants has been disbursed into the Compact Trust Fund
(CTF), jointly managed by the US and the FSM, with the intention that returns from the trust fund would
Approved By Patrizia Tumbarello and
Masato Miyazaki (IMF)
Satu Kahkonen (IDA)
Prepared by Staff of the International Monetary Fund
and the International Development Association.
April 24, 2015
FEDERATED STATES OF MICRONESIA
2 INTERNATIONAL MONETARY FUND
contribute to Micronesia’s fiscal sustainability after FY2023. 1, 2
The FSM has also established its own trust
fund (FSM Trust Fund). However, at current pace of accumulation, returns from the trust funds are expected
to fall short of the expired Compact grants in FY2023.
3. The FSM’s debt management has been relatively prudent. The FSM’s external public and
publicly guaranteed (PPG) debt has been declining slowly from the peak of 31 percent of GDP in FY2009 to
27 percent in FY2013 (22 percent on present value (PV) basis). Most of the debt is concessional and is
contracted with official lenders. About two thirds is from the Asian Development Bank (ADB). Loans from
the US Department of Agriculture (Rural Development Program) account for about one third of the total
external PPG. The rest is from other bilateral and private lenders. Domestic debt is estimated to be less than
1 percent of GDP. All of the loans are denominated in U.S. dollars, legal tender in the FSM.
4. The analysis is based on the standard DSA framework for Low-Income Countries. Debt
sustainability is assessed in relation to policy-dependent debt burden thresholds. The FSM, with an average
score of 2.7 between 2011 and 2013 for the Country Policy and Institutional Assessment (CPIA), is
considered to have weak capacity. The DSA uses the indicative thresholds on the external public debt for
countries in this category whose remittances are not large3: 30 percent for the PV of debt-to-GDP ratio;
100 percent for the PV of debt-to-exports ratio; 200 percent for the PV of debt-to-revenue ratio; 15 percent
for the debt service-to-exports ratio; and 18 percent for the debt service-to-revenue ratio.
5. The key assumptions are consistent with the macroeconomic framework set out in the
Policy Note (Box 1). The baseline scenario assumes that the annual real GDP growth rate will be on
average 0.6 percent in the medium term, which reflects the historical track record of the FSM. Despite the
fiscal consolidation efforts under the Long-Term Fiscal Frameworks (LTFF) by all the state governments to
reduce their expenditures by 1–2 percent per year in real terms throughout the projection period, the
overall fiscal balance will worsen gradually, turning from surplus to deficit from FY2024. While the fiscal
deficit is assumed to be phased out gradually during the remaining 10 years of the projection period
through further fiscal consolidation, the financing gap is assumed to be filled by bilateral concessional
1 The Compact Trust Fund (CTF) was created to contribute to the long-term budgetary self-reliance of the FSM and
provide the FSM government with an ongoing source of revenue after FY2023. The amended Compacts and their
subsidiary agreements contain no commitments, either express or implied, regarding the level of the revenue that
will be generated by the trust fund, nor is there any commitment regarding the degree to which the revenue will
contribute to the long-term budgetary self-reliance of the FSM.
2 Compact grants disbursed in FY2013 for current and capital spending amounted to 25 percent of GDP. If
contributions to the CTF are included, the ratio rises to more than 30 percent of GDP.
3 Under the standard Debt Sustainability Framework for Low-Income Countries, large remittances are defined as both
greater than 10 percent of GDP and greater than 20 percent of exports of goods and services. In the case of the FSM,
the ratio of remittances-to-GDP is around 4 percent while that of remittances-to-exports of goods and services is
around 15 percent.

FEDERATED STATES OF MICRONESIA
INTERNATIONAL MONETARY FUND 3
external borrowing to safeguard priority development spending.4 The baseline scenario does not assume
major policy changes such as the implementation of the long-debated tax reform package.
6. Other assumptions under the baseline scenario include: gradual reduction of the financial
assistance as scheduled under the Compact of Free Association with the US before expiring in FY2023;
continued robust fishing license fee revenues (15 percent of GDP throughout the projection period5), which
helps strengthen the fiscal balances compared to the historical track record; increased allocation of budget
for infrastructure projects from the national to state governments (3 percent of GDP) starting from FY2015,
on account of continued stronger fishing license fees than before; transfer of half of the annual fiscal
surplus to trust funds established to generate revenue after the expiration of financial assistance under the
Compact in FY2023, reflecting on-going discussions in the country. 6 Additionally, the baseline scenario
assumes that the FSM authorities will continue to contract moderate amount of concessional loans to
finance investment projects implemented by state enterprises in line with the newly adopted ODA Policy.
PPG External Debt Sustainability
7. Under the baseline scenario, two of the debt indicators are projected to breach the
indicative thresholds from FY2027–30 and onwards. The ratio of PV of external PPG-to-GDP is expected
to exceed the threshold of 30 percent in FY2030 while the ratio of PV of external PPG debt-to-exports is
expected to exceed the threshold of 100 percent in FY2027. However, as the authorities will strengthen
fiscal consolidation efforts while safeguarding priority spending, the debt indicators will be stabilized
toward the end of the projection period, albeit at levels above the indicative thresholds. As the bulk of
external PPG debt is on concessional terms, the debt service to export ratio will remain below the relevant
threshold.
8. Stress tests confirm the vulnerability of the debt position relative to exports. In the most
extreme shock scenario - with export value growth in FY2015–16 one standard deviation below the
historical average - the PV of the external PPG debt-to-GDP will exceed the threshold of 30 percent
in FY2023, 7 years earlier than the baseline scenario. The PV of the external PPG debt-to-exports ratio will
exceed the threshold of 100 percent in FY2021, and will reach above 200 percent in FY2034.
4 The recently adopted “ODA Policy of the FSM” provides, among others, that loans, as means of financing initiatives,
shall only be considered if concessional in nature and where the estimated economic returns outweigh debt
obligations.
5 Fishing license fee revenue increased from 6 percent of GDP in FY2011 to 15 percent of GDP in FY2014. The “Nauru
Agreement Concerning Cooperation in the Management of Fisheries of Common Interest”, a regional agreement that
sets minimum benchmark fees for foreign fishing companies operating in the region, has strengthened the
bargaining power of its signatories including the FSM. Under this system, fishing companies pay a flat fee per vessel
per day with adjustment for the size of the vessel (VDS: Vessels Day Scheme). The FSM authorities assume that
fishing license fee revenue will be sustained in the medium term, despite the recent plunge in the price of tuna (from
the peak of $2,520 per ton in the third quarter of 2012 to $1,670 per ton in the fourth quarter of 2014).
6 Another half is assumed to be used for other purposes, including the proposed “2023 Investment Development
Fund” that envisages providing equity funds to private sector projects from a long-term perspective.
FEDERATED STATES OF MICRONESIA
4 INTERNATIONAL MONETARY FUND
0
5
10
15
20
25
30
35
2014 2019 2024 2029 2034
Alternative ScenarioThresholdBaseline
PV of debt-to GDP ratio
0
20
40
60
80
100
120
140
2014 2019 2024 2029 2034
Alternative ScenarioThresholdBaseline
PV of debt-to-exports ratio
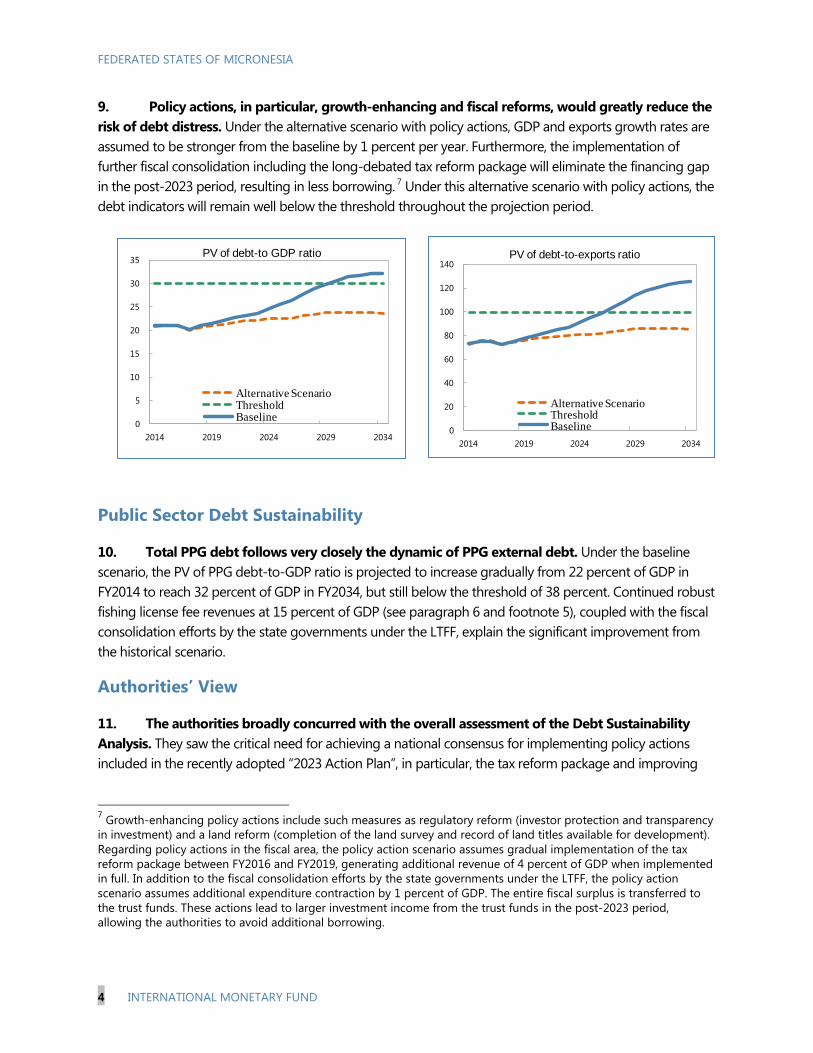
9. Policy actions, in particular, growth-enhancing and fiscal reforms, would greatly reduce the
risk of debt distress. Under the alternative scenario with policy actions, GDP and exports growth rates are
assumed to be stronger from the baseline by 1 percent per year. Furthermore, the implementation of
further fiscal consolidation including the long-debated tax reform package will eliminate the financing gap
in the post-2023 period, resulting in less borrowing. 7 Under this alternative scenario with policy actions, the
debt indicators will remain well below the threshold throughout the projection period.
Public Sector Debt Sustainability
10. Total PPG debt follows very closely the dynamic of PPG external debt. Under the baseline
scenario, the PV of PPG debt-to-GDP ratio is projected to increase gradually from 22 percent of GDP in
FY2014 to reach 32 percent of GDP in FY2034, but still below the threshold of 38 percent. Continued robust
fishing license fee revenues at 15 percent of GDP (see paragraph 6 and footnote 5), coupled with the fiscal
consolidation efforts by the state governments under the LTFF, explain the significant improvement from
the historical scenario.
Authorities’ View
11. The authorities broadly concurred with the overall assessment of the Debt Sustainability
Analysis. They saw the critical need for achieving a national consensus for implementing policy actions
included in the recently adopted “2023 Action Plan”, in particular, the tax reform package and improving
7 Growth-enhancing policy actions include such measures as regulatory reform (investor protection and transparency
in investment) and a land reform (completion of the land survey and record of land titles available for development).
Regarding policy actions in the fiscal area, the policy action scenario assumes gradual implementation of the tax
reform package between FY2016 and FY2019, generating additional revenue of 4 percent of GDP when implemented
in full. In addition to the fiscal consolidation efforts by the state governments under the LTFF, the policy action
scenario assumes additional expenditure contraction by 1 percent of GDP. The entire fiscal surplus is transferred to
the trust funds. These actions lead to larger investment income from the trust funds in the post-2023 period,
allowing the authorities to avoid additional borrowing.

FEDERATED STATES OF MICRONESIA
INTERNATIONAL MONETARY FUND 5
the business environment. The authorities also noted the need for further consolidating the institutional
capacity to manage debt, as called for in the “2023 Action Plan”.
Conclusion
12. The standard DSA framework for LICs assesses the FSM to be at high risk of debt distress.
The baseline scenario indicates that the PV of external debt-to-GDP and exports ratios could breach the
threshold between FY2027–30 and onwards. PV of public debt-to-GDP ratio will also rise gradually, while
remaining under the threshold during the projection period. Stress tests also confirm the vulnerability of
the debt position relative to exports. However, FSM’s vulnerability to debt distress is mitigated by a number
of factors. Most debt is on concessional terms and from development partners, the decline in external
support from the Compact will be gradual, sheltering the country from the risk of a sudden stop in foreign
financing, and the authorities are building up trust funds that will provide a stable source of funding after
FY2023.
13. The risk of debt distress is reduced under the alternative scenario where long-debated tax
and growth-enhancing structural reforms are implemented. FSM’s debt will be sustainable if the tax
and growth-enhancing structural reforms are implemented, as called for in the recently published “Action
Plan 2023”, though this remains contingent on the achievement of nation-wide consensus in a country with
a loosely federated structure.
FEDERATED STATES OF MICRONESIA
6 INTERNATIONAL MONETARY FUND
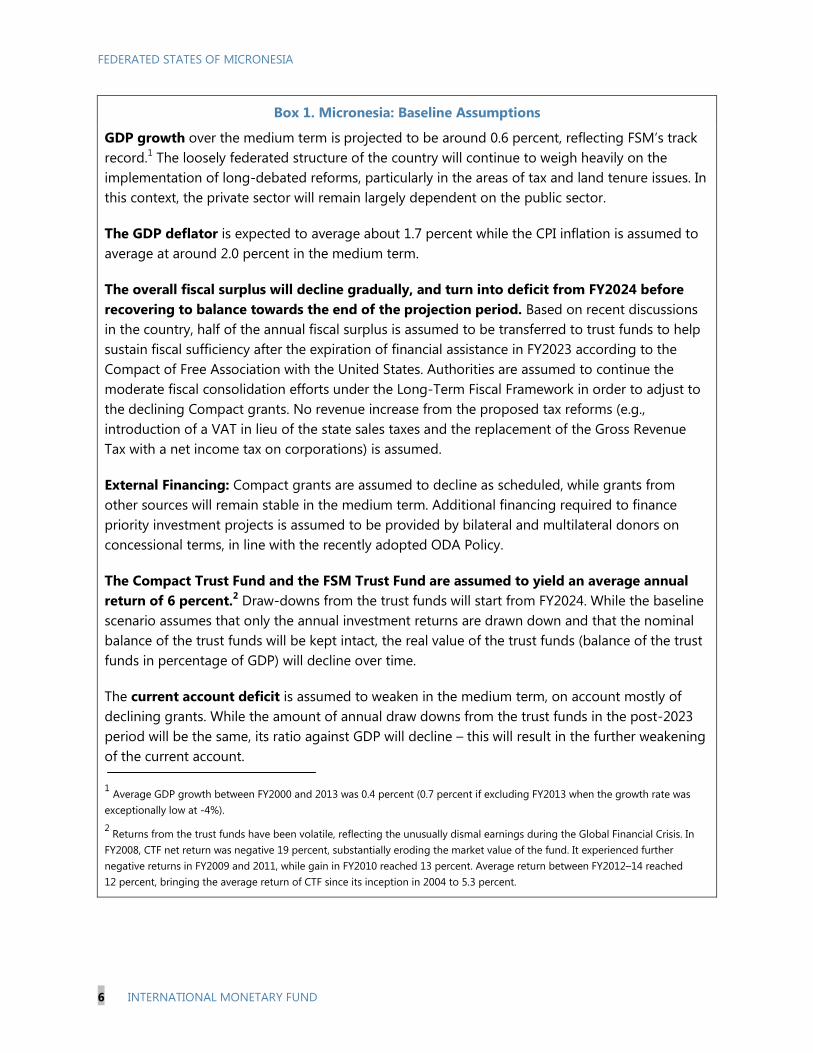
Box 1. Micronesia: Baseline Assumptions
GDP growth over the medium term is projected to be around 0.6 percent, reflecting FSM’s track
record.1 The loosely federated structure of the country will continue to weigh heavily on the
implementation of long-debated reforms, particularly in the areas of tax and land tenure issues. In
this context, the private sector will remain largely dependent on the public sector.
The GDP deflator is expected to average about 1.7 percent while the CPI inflation is assumed to
average at around 2.0 percent in the medium term.
The overall fiscal surplus will decline gradually, and turn into deficit from FY2024 before
recovering to balance towards the end of the projection period. Based on recent discussions
in the country, half of the annual fiscal surplus is assumed to be transferred to trust funds to help
sustain fiscal sufficiency after the expiration of financial assistance in FY2023 according to the
Compact of Free Association with the United States. Authorities are assumed to continue the
moderate fiscal consolidation efforts under the Long-Term Fiscal Framework in order to adjust to
the declining Compact grants. No revenue increase from the proposed tax reforms (e.g.,
introduction of a VAT in lieu of the state sales taxes and the replacement of the Gross Revenue
Tax with a net income tax on corporations) is assumed.
External Financing: Compact grants are assumed to decline as scheduled, while grants from
other sources will remain stable in the medium term. Additional financing required to finance
priority investment projects is assumed to be provided by bilateral and multilateral donors on
concessional terms, in line with the recently adopted ODA Policy.
The Compact Trust Fund and the FSM Trust Fund are assumed to yield an average annual
return of 6 percent.2 Draw-downs from the trust funds will start from FY2024. While the baseline
scenario assumes that only the annual investment returns are drawn down and that the nominal
balance of the trust funds will be kept intact, the real value of the trust funds (balance of the trust
funds in percentage of GDP) will decline over time.
The current account deficit is assumed to weaken in the medium term, on account mostly of
declining grants. While the amount of annual draw downs from the trust funds in the post-2023
period will be the same, its ratio against GDP will decline – this will result in the further weakening
of the current account.
1 Average GDP growth between FY2000 and 2013 was 0.4 percent (0.7 percent if excluding FY2013 when the growth rate was
exceptionally low at -4%).
2 Returns from the trust funds have been volatile, reflecting the unusually dismal earnings during the Global Financial Crisis. In
FY2008, CTF net return was negative 19 percent, substantially eroding the market value of the fund. It experienced further
negative returns in FY2009 and 2011, while gain in FY2010 reached 13 percent. Average return between FY2012–14 reached
12 percent, bringing the average return of CTF since its inception in 2004 to 5.3 percent.

FEDERATED STATES OF MICRONESIA
INTERNATIONAL MONETARY FUND 7
Figure 1. Micronesia: Indicators of Public and Publicly Guaranteed External Debt
Baseline Scenario, 2014–34 1/
Sources: Country authorities; and staff estimates and projections.
1/ The most extreme stress test is the test that yields the highest ratio on or before 2024. In figure b. it corresponds to a
Terms shock; in c. to a Terms shock; in d. to a Terms shock; in e. to a Terms shock and in figure f. to a Terms shock
Baseline Historical scenario Most extreme shock 1/
Threshold
2/ Tax reform package, generating additional revenue of 4 percent of GDP, is assumed to be gradually implemented at
all levels of government between 2016 and 2018. To be implemented, the tax reform package needs to be endorsed by
all the governments (national and state governments).
0
5
10
15
20
25
2014 2019 2024 2029 2034
f.Debt service-to-revenue ratio
0
5
10
15
20
25
30
35
40
45
-5
0
5
10
15
20
25
30
35
2014 2019 2024 2029 2034
Rate of Debt Accumulation
Grant-equivalent financing (% of GDP)
Grant element of new borrowing (% right scale)
a. Debt Accumulation
0
100
200
300
400
500
600
2014 2019 2024 2029 2034
c.PV of debt-to-exports ratio
0
20
40
60
80
100
120
140
2014 2019 2024 2029 2034
b.PV of debt-to GDP ratio
0
50
100
150
200
250
300
2014 2019 2024 2029 2034
d.PV of debt-to-revenue ratio
0
5
10
15
20
25
30
35
40
2014 2019 2024 2029 2034
e.Debt service-to-exports ratio

FEDERATED STATES OF MICRONESIA
8 INTERNATIONAL MONETARY FUND
Figure 2. Micronesia: Indicators of Public Debt,
Baseline Scenario, 2014–34 1/
Most extreme shock Combination
Sources: Country authorities; and staff estimates and projections.
1/ The most extreme stress test is the test that yields the highest ratio on or before 2024.
2/ Revenues are defined inclusive of grants.
Baseline
Public debt benchmark
Most extreme shock 1/
Historical scenario
Fix Primary Balance
-300
-250
-200
-150
-100
-50
0
50
100
150
200
250
2014 2016 2018 2020 2022 2024 2026 2028 2030 2032 2034
PV of Debt-to-Revenue Ratio 2/
-150
-100
-50
0
50
100
2014 2016 2018 2020 2022 2024 2026 2028 2030 2032 2034
PV of Debt-to-GDP Ratio
-20
-15
-10
-5
0
5
10
15
2014 2016 2018 2020 2022 2024 2026 2028 2030 2032 2034
Debt Service-to-Revenue Ratio 2/

FEDERATED STATES OF MICRONESIA
INTERNATIONAL MONETARY FUND 9
Table 1. Micronesia: External Debt Sustainability Framework,
Baseline Scenario, 2011–34 1/
(In percent of GDP, unless otherwise indicated)
Historical6/
Standard6/
Average Deviation 2020-2034
2011 2012 2013 2014 2015 2016 2017 2018 2019 2024 2034 Average
External debt (nominal) 1/ 29.1 27.7 27.1 26.4 26.5 26.7 25.6 27.3 28.8 36.0 48.1
of which: public and publicly guaranteed (PPG) 29.1 27.7 27.1 26.4 26.5 26.7 25.6 27.3 28.8 36.0 48.1
Change in external debt -0.4 -1.4 -0.6 -0.7 0.2 0.2 -1.1 1.7 1.5 2.0 0.2
Identified net debt-creating flows 16.7 11.4 11.3 -2.3 0.9 0.8 1.5 2.0 2.7 3.6 7.7
Non-interest current account deficit 17.2 12.0 9.4 13.3 3.6 -3.1 0.1 0.3 1.0 1.6 2.3 3.4 7.7 5.2
Deficit in balance of goods and services 57.4 51.5 54.1 53.4 50.1 50.0 50.0 50.0 50.0 50.6 50.1
Exports 24.4 29.4 28.1 28.7 27.8 28.0 27.9 28.0 27.9 27.1 25.7
Imports 81.8 80.8 82.2 82.1 77.9 77.9 77.9 77.9 77.9 77.7 75.7
Net current transfers (negative = inflow) -36.0 -33.9 -35.3 -39.2 3.6 -41.8 -35.3 -35.0 -34.2 -33.6 -33.0 -14.2 -13.0 -18.4
of which: official -33.5 -31.1 -31.1 -31.0 -30.8 -30.5 -29.7 -29.2 -28.5 -9.8 -8.5
Other current account flows (negative = net inflow) -4.2 -5.6 -9.4 -14.7 -14.7 -14.7 -14.7 -14.7 -14.8 -33.0 -29.4
Net FDI (negative = inflow) 0.3 0.3 0.2 0.0 0.7 0.2 0.2 0.2 0.2 0.2 0.2 0.2 0.2 0.2
Endogenous debt dynamics 2/ -0.7 -0.8 1.7 0.6 0.5 0.3 0.2 0.2 0.2 0.0 -0.3
Contribution from nominal interest rate 0.7 0.7 0.7 0.6 0.6 0.5 0.5 0.4 0.4 0.2 0.0
Contribution from real GDP growth -0.5 0.0 1.2 0.0 -0.1 -0.3 -0.2 -0.2 -0.2 -0.2 -0.3
Contribution from price and exchange rate changes -1.0 -1.5 -0.2 … … … … … … … …
Residual 3/ -17.1 -12.8 -11.9 1.6 -0.7 -0.6 -2.6 -0.3 -1.2 -1.6 -7.5
of which: exceptional financing (capital grants) -20.1 -21.0 -13.4 -13.0 7.2 -12.7 -12.7 -13.1 -13.2 -13.3 -13.3 -7.0 -5.6
PV of external debt 4/ ... ... 21.5 20.9 21.0 21.0 20.2 20.9 21.5 24.7 32.3
In percent of exports ... ... 76.7 72.9 75.4 75.3 72.3 74.8 77.2 91.3 125.7
PV of PPG external debt ... ... 21.5 20.9 21.0 21.0 20.2 20.9 21.5 24.7 32.3
In percent of exports ... ... 76.7 72.9 75.4 75.3 72.3 74.8 77.2 91.3 125.7
In percent of government revenues ... ... 80.3 55.9 67.9 68.2 65.5 67.8 69.8 50.4 71.3
Debt service-to-exports ratio (in percent) 6.7 5.3 6.7 7.9 8.0 7.1 6.4 6.2 5.9 5.9 6.4
PPG debt service-to-exports ratio (in percent) 6.7 5.3 6.7 7.9 8.0 7.1 6.4 6.2 5.9 5.9 6.4
PPG debt service-to-revenue ratio (in percent) 7.8 6.8 7.0 6.0 7.2 6.4 5.8 5.6 5.4 3.3 3.7
Total gross financing need (Millions of U.S. dollars) 58.9 45.1 36.1 -1.9 8.2 8.0 10.0 11.9 14.4 20.2 46.5
Non-interest current account deficit that stabilizes debt ratio 17.5 13.3 10.0 -2.4 -0.1 0.1 2.1 -0.1 0.8 1.4 7.5
Key macroeconomic assumptions
Real GDP growth (in percent) 1.8 0.1 -4.0 -0.4 2.5 0.1 0.3 1.0 0.9 0.9 0.8 0.6 0.6 0.6
GDP deflator in US dollar terms (change in percent) 3.4 5.3 0.6 3.0 1.7 0.0 0.0 0.0 1.8 1.3 1.9 1.7 1.7 1.7
Effective interest rate (percent) 5/ 2.7 2.4 2.4 2.6 0.1 2.2 2.1 2.0 1.8 1.8 1.5 0.6 0.0 0.4
Growth of exports of G&S (US dollar terms, in percent) 8.3 27.0 -7.7 7.6 14.1 2.4 -3.0 1.5 2.7 2.3 2.4 1.7 1.8 1.7
Growth of imports of G&S (US dollar terms, in percent) 5.8 4.3 -1.9 3.7 4.8 0.0 -4.9 1.0 2.7 2.2 2.7 2.0 2.1 2.1
Grant element of new public sector borrowing (in percent) ... ... ... ... ... 28.2 28.2 28.2 28.2 41.3 41.3 40.6 41.1 40.9Government revenues (excluding grants, in percent of GDP) 20.8 22.9 26.8 37.4 30.9 30.9 30.9 30.9 30.9 49.0 45.3 42.8Aid flows (in Millions of US dollars) 7/ 226.6 230.9 196.9 181.1 181.6 180.4 180.3 189.1 197.7 156.0 248.8
of which: Grants 136.8 140.6 111.7 98.1 97.9 95.3 96.6 97.8 98.8 17.4 15.8of which: Concessional loans 89.8 90.3 85.2 83.0 83.7 85.1 83.7 91.3 98.9 138.7 232.9
Grant-equivalent financing (in percent of GDP) 8/ ... ... ... 31.4 31.5 30.4 29.8 30.7 30.2 6.2 4.5 11.6
Grant-equivalent financing (in percent of external financing) 8/ ... ... ... 97.9 95.9 95.8 97.8 93.6 93.6 71.3 72.4 77.2
Memorandum items:
Nominal GDP (Millions of US dollars) 309.1 325.9 314.6 314.8 315.7 318.7 327.4 334.7 343.6 385.6 484.4
Nominal dollar GDP growth 5.3 5.4 -3.5 0.1 0.3 1.0 2.7 2.2 2.7 2.3 2.3 2.3
PV of PPG external debt (in Millions of US dollars) 67.7 65.9 66.2 67.1 66.2 70.0 74.0 95.3 156.3
(PVt-PVt-1)/GDPt-1 (in percent) -0.6 0.1 0.3 -0.3 1.2 1.2 1.6 0.9 1.4
Gross workers' remittances (Millions of US dollars) 14.1 14.3 14.4 14.4 14.5 14.5 14.6 14.6 14.7 15.1 16.0
PV of PPG external debt (in percent of GDP + remittances) ... ... 20.6 20.0 20.1 20.1 19.3 20.0 20.7 23.8 31.2
PV of PPG external debt (in percent of exports + remittances) ... ... 65.9 62.9 64.8 64.7 62.4 64.7 67.0 79.7 111.3
Debt service of PPG external debt (in percent of exports + remittances) ... ... 5.7 6.8 6.9 6.1 5.6 5.4 5.2 5.2 5.7
Sources: Country authorities; and staff estimates and projections. 0
1/ Includes both public and private sector external debt.
2/ Derived as [r - g - ρ(1+g)]/(1+g+ρ+gρ) times previous period debt ratio, with r = nominal interest rate; g = real GDP growth rate, and ρ = growth rate of GDP deflator in U.S. dollar terms.
3/ Includes exceptional financing (i.e., capital grants); changes in gross foreign assets; and valuation adjustments. For projections also includes contribution from price and exchange rate changes.
4/ Assumes that PV of private sector debt is equivalent to its face value.
5/ Current-year interest payments divided by previous period debt stock.
6/ Historical averages and standard deviations are generally derived over the past 10 years, subject to data availability.
7/ Defined as grants, concessional loans, and debt relief.
8/ Grant-equivalent financing includes grants provided directly to the government and through new borrowing (difference between the face value and the PV of new debt).
Actual Projections
FEDERATED STATES OF MICRONESIA
10 INTERNATIONAL MONETARY FUND
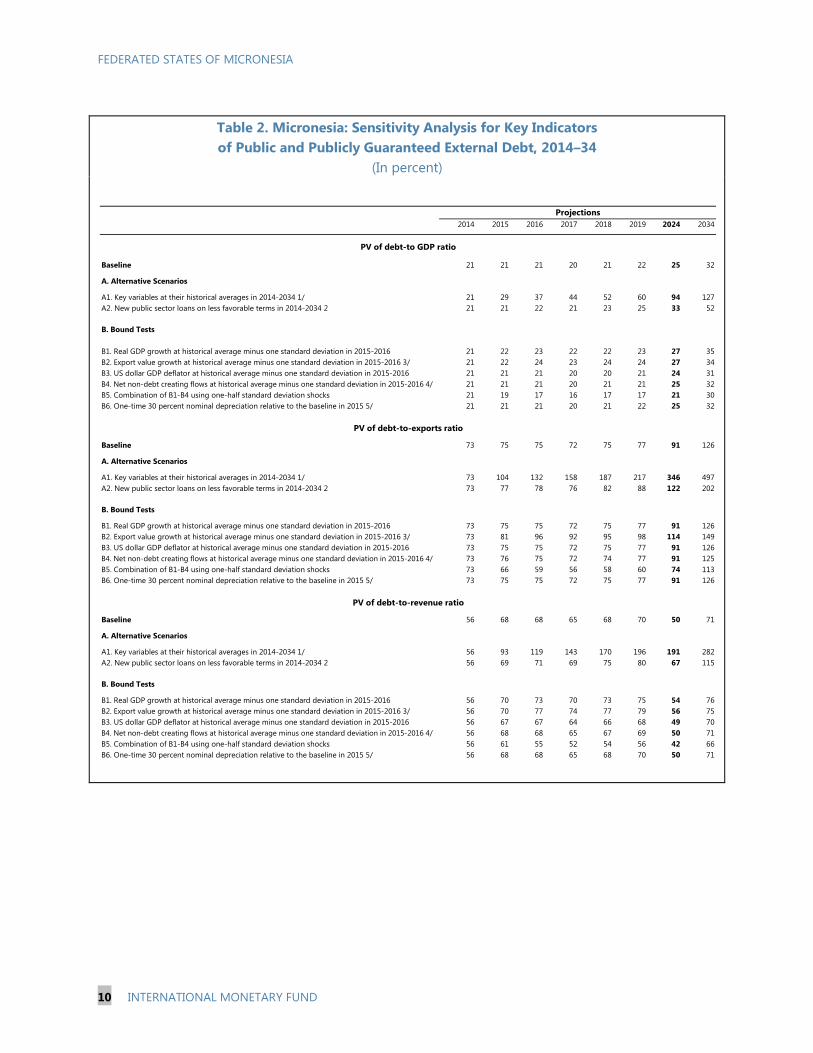
Table 2. Micronesia: Sensitivity Analysis for Key Indicators
of Public and Publicly Guaranteed External Debt, 2014–34
(In percent)
2014 2015 2016 2017 2018 2019 2024 2034
Baseline 21 21 21 20 21 22 25 32
A. Alternative Scenarios
A1. Key variables at their historical averages in 2014-2034 1/ 21 29 37 44 52 60 94 127
A2. New public sector loans on less favorable terms in 2014-2034 2 21 21 22 21 23 25 33 52
B. Bound Tests
B1. Real GDP growth at historical average minus one standard deviation in 2015-2016 21 22 23 22 22 23 27 35
B2. Export value growth at historical average minus one standard deviation in 2015-2016 3/ 21 22 24 23 24 24 27 34
B3. US dollar GDP deflator at historical average minus one standard deviation in 2015-2016 21 21 21 20 20 21 24 31
B4. Net non-debt creating flows at historical average minus one standard deviation in 2015-2016 4/ 21 21 21 20 21 21 25 32
B5. Combination of B1-B4 using one-half standard deviation shocks 21 19 17 16 17 17 21 30
B6. One-time 30 percent nominal depreciation relative to the baseline in 2015 5/ 21 21 21 20 21 22 25 32
Baseline 73 75 75 72 75 77 91 126
A. Alternative Scenarios
A1. Key variables at their historical averages in 2014-2034 1/ 73 104 132 158 187 217 346 497
A2. New public sector loans on less favorable terms in 2014-2034 2 73 77 78 76 82 88 122 202
B. Bound Tests
B1. Real GDP growth at historical average minus one standard deviation in 2015-2016 73 75 75 72 75 77 91 126
B2. Export value growth at historical average minus one standard deviation in 2015-2016 3/ 73 81 96 92 95 98 114 149
B3. US dollar GDP deflator at historical average minus one standard deviation in 2015-2016 73 75 75 72 75 77 91 126
B4. Net non-debt creating flows at historical average minus one standard deviation in 2015-2016 4/ 73 76 75 72 74 77 91 125
B5. Combination of B1-B4 using one-half standard deviation shocks 73 66 59 56 58 60 74 113
B6. One-time 30 percent nominal depreciation relative to the baseline in 2015 5/ 73 75 75 72 75 77 91 126
Baseline 56 68 68 65 68 70 50 71
A. Alternative Scenarios
A1. Key variables at their historical averages in 2014-2034 1/ 56 93 119 143 170 196 191 282
A2. New public sector loans on less favorable terms in 2014-2034 2 56 69 71 69 75 80 67 115
B. Bound Tests
B1. Real GDP growth at historical average minus one standard deviation in 2015-2016 56 70 73 70 73 75 54 76
B2. Export value growth at historical average minus one standard deviation in 2015-2016 3/ 56 70 77 74 77 79 56 75
B3. US dollar GDP deflator at historical average minus one standard deviation in 2015-2016 56 67 67 64 66 68 49 70
B4. Net non-debt creating flows at historical average minus one standard deviation in 2015-2016 4/ 56 68 68 65 67 69 50 71
B5. Combination of B1-B4 using one-half standard deviation shocks 56 61 55 52 54 56 42 66
B6. One-time 30 percent nominal depreciation relative to the baseline in 2015 5/ 56 68 68 65 68 70 50 71
PV of debt-to GDP ratio
Projections
PV of debt-to-exports ratio
PV of debt-to-revenue ratio

FEDERATED STATES OF MICRONESIA
INTERNATIONAL MONETARY FUND 11
Table 2. Micronesia: Sensitivity Analysis for Key Indicators
of Public and Publicly Guaranteed External Debt, 2014–34 (concluded)
(In percent)
2014 2015 2016 2017 2018 2019 2024 2034
Baseline 8 8 7 6 6 6 6 6
A. Alternative Scenarios
A1. Key variables at their historical averages in 2014-2034 1/ 8 8 8 8 9 10 18 36
A2. New public sector loans on less favorable terms in 2014-2034 2 8 8 8 7 7 7 10 16
B. Bound Tests
B1. Real GDP growth at historical average minus one standard deviation in 2015-2016 8 8 8 7 7 7 8 9
B2. Export value growth at historical average minus one standard deviation in 2015-2016 3/ 8 9 9 8 8 8 10 11
B3. US dollar GDP deflator at historical average minus one standard deviation in 2015-2016 8 8 8 7 7 7 8 9
B4. Net non-debt creating flows at historical average minus one standard deviation in 2015-2016 4/ 8 8 8 7 7 7 8 9
B5. Combination of B1-B4 using one-half standard deviation shocks 8 8 7 6 6 6 6 8
B6. One-time 30 percent nominal depreciation relative to the baseline in 2015 5/ 8 8 8 7 7 7 8 9
Baseline 6 7 6 6 6 5 3 4
A. Alternative Scenarios
A1. Key variables at their historical averages in 2014-2034 1/ 6 7 7 8 8 9 10 20
A2. New public sector loans on less favorable terms in 2014-2034 2 6 8 7 6 6 6 5 9
B. Bound Tests
B1. Real GDP growth at historical average minus one standard deviation in 2015-2016 6 8 7 7 7 7 5 6
B2. Export value growth at historical average minus one standard deviation in 2015-2016 3/ 6 8 7 7 6 6 5 6
B3. US dollar GDP deflator at historical average minus one standard deviation in 2015-2016 6 7 7 6 6 6 4 5
B4. Net non-debt creating flows at historical average minus one standard deviation in 2015-2016 4/ 6 8 7 6 6 6 4 5
B5. Combination of B1-B4 using one-half standard deviation shocks 6 8 7 6 6 6 4 5
B6. One-time 30 percent nominal depreciation relative to the baseline in 2015 5/ 6 8 7 6 6 6 4 5
Memorandum item:
Grant element assumed on residual financing (i.e., financing required above baseline) 6/ 35 35 35 35 35 35 35 35
Sources: Country authorities; and staff estimates and projections.
1/ Variables include real GDP growth, growth of GDP deflator (in U.S. dollar terms), non-interest current account in percent of GDP, and non-debt creating flows.
2/ Assumes that the interest rate on new borrowing is by 2 percentage points higher than in the baseline., while grace and maturity periods are the same as in the baseline.
3/ Exports values are assumed to remain permanently at the lower level, but the current account as a share of GDP is assumed to return to its baseline level after the shock (implicitly assuming
an offsetting adjustment in import levels).
4/ Includes official and private transfers and FDI.
5/ Depreciation is defined as percentage decline in dollar/local currency rate, such that it never exceeds 100 percent.
6/ Applies to all stress scenarios except for A2 (less favorable financing) in which the terms on all new financing are as specified in footnote 2.
Debt service-to-exports ratio
Projections
Debt service-to-revenue ratio
FEDERATED STATES OF MICRONESIA
12 INTERNATIONAL MONETARY FUND
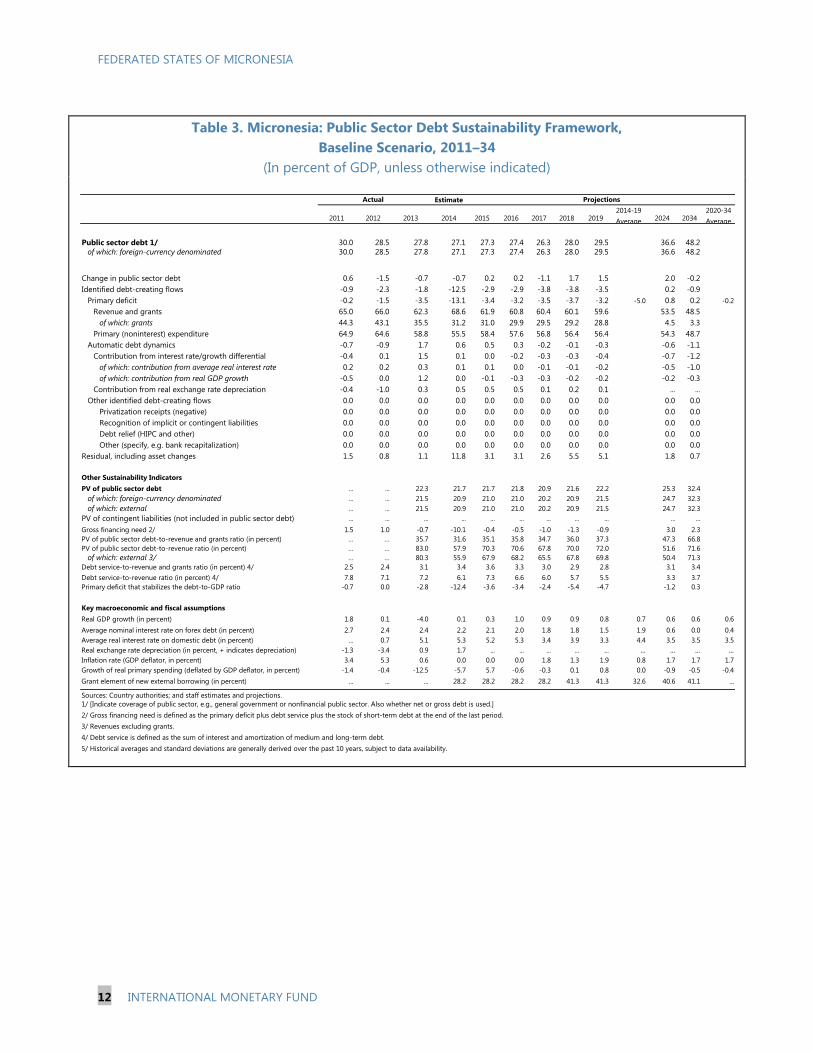
Table 3. Micronesia: Public Sector Debt Sustainability Framework,
Baseline Scenario, 2011–34
(In percent of GDP, unless otherwise indicated)
Estimate
2011 2012 2013 2014 2015 2016 2017 2018 20192014-19
Average 2024 20342020-34
Average
Public sector debt 1/ 30.0 28.5 27.8 27.1 27.3 27.4 26.3 28.0 29.5 36.6 48.2
of which: foreign-currency denominated 30.0 28.5 27.8 27.1 27.3 27.4 26.3 28.0 29.5 36.6 48.2
Change in public sector debt 0.6 -1.5 -0.7 -0.7 0.2 0.2 -1.1 1.7 1.5 2.0 -0.2
Identified debt-creating flows -0.9 -2.3 -1.8 -12.5 -2.9 -2.9 -3.8 -3.8 -3.5 0.2 -0.9
Primary deficit -0.2 -1.5 -3.5 -13.1 -3.4 -3.2 -3.5 -3.7 -3.2 -5.0 0.8 0.2 -0.2
Revenue and grants 65.0 66.0 62.3 68.6 61.9 60.8 60.4 60.1 59.6 53.5 48.5
of which: grants 44.3 43.1 35.5 31.2 31.0 29.9 29.5 29.2 28.8 4.5 3.3
Primary (noninterest) expenditure 64.9 64.6 58.8 55.5 58.4 57.6 56.8 56.4 56.4 54.3 48.7
Automatic debt dynamics -0.7 -0.9 1.7 0.6 0.5 0.3 -0.2 -0.1 -0.3 -0.6 -1.1
Contribution from interest rate/growth differential -0.4 0.1 1.5 0.1 0.0 -0.2 -0.3 -0.3 -0.4 -0.7 -1.2
of which: contribution from average real interest rate 0.2 0.2 0.3 0.1 0.1 0.0 -0.1 -0.1 -0.2 -0.5 -1.0
of which: contribution from real GDP growth -0.5 0.0 1.2 0.0 -0.1 -0.3 -0.3 -0.2 -0.2 -0.2 -0.3
Contribution from real exchange rate depreciation -0.4 -1.0 0.3 0.5 0.5 0.5 0.1 0.2 0.1 ... ...
Other identified debt-creating flows 0.0 0.0 0.0 0.0 0.0 0.0 0.0 0.0 0.0 0.0 0.0
Privatization receipts (negative) 0.0 0.0 0.0 0.0 0.0 0.0 0.0 0.0 0.0 0.0 0.0
Recognition of implicit or contingent liabilities 0.0 0.0 0.0 0.0 0.0 0.0 0.0 0.0 0.0 0.0 0.0
Debt relief (HIPC and other) 0.0 0.0 0.0 0.0 0.0 0.0 0.0 0.0 0.0 0.0 0.0
Other (specify, e.g. bank recapitalization) 0.0 0.0 0.0 0.0 0.0 0.0 0.0 0.0 0.0 0.0 0.0
Residual, including asset changes 1.5 0.8 1.1 11.8 3.1 3.1 2.6 5.5 5.1 1.8 0.7
Other Sustainability Indicators
PV of public sector debt ... ... 22.3 21.7 21.7 21.8 20.9 21.6 22.2 25.3 32.4
of which: foreign-currency denominated ... ... 21.5 20.9 21.0 21.0 20.2 20.9 21.5 24.7 32.3
of which: external ... ... 21.5 20.9 21.0 21.0 20.2 20.9 21.5 24.7 32.3
PV of contingent liabilities (not included in public sector debt) ... ... ... ... ... ... ... ... ... ... ...
Gross financing need 2/ 1.5 1.0 -0.7 -10.1 -0.4 -0.5 -1.0 -1.3 -0.9 3.0 2.3
PV of public sector debt-to-revenue and grants ratio (in percent) … … 35.7 31.6 35.1 35.8 34.7 36.0 37.3 47.3 66.8
PV of public sector debt-to-revenue ratio (in percent) … … 83.0 57.9 70.3 70.6 67.8 70.0 72.0 51.6 71.6
of which: external 3/ … … 80.3 55.9 67.9 68.2 65.5 67.8 69.8 50.4 71.3
Debt service-to-revenue and grants ratio (in percent) 4/ 2.5 2.4 3.1 3.4 3.6 3.3 3.0 2.9 2.8 3.1 3.4
Debt service-to-revenue ratio (in percent) 4/ 7.8 7.1 7.2 6.1 7.3 6.6 6.0 5.7 5.5 3.3 3.7
Primary deficit that stabilizes the debt-to-GDP ratio -0.7 0.0 -2.8 -12.4 -3.6 -3.4 -2.4 -5.4 -4.7 -1.2 0.3
Key macroeconomic and fiscal assumptions
Real GDP growth (in percent) 1.8 0.1 -4.0 0.1 0.3 1.0 0.9 0.9 0.8 0.7 0.6 0.6 0.6
Average nominal interest rate on forex debt (in percent) 2.7 2.4 2.4 2.2 2.1 2.0 1.8 1.8 1.5 1.9 0.6 0.0 0.4
Average real interest rate on domestic debt (in percent) ... 0.7 5.1 5.3 5.2 5.3 3.4 3.9 3.3 4.4 3.5 3.5 3.5
Real exchange rate depreciation (in percent, + indicates depreciation) -1.3 -3.4 0.9 1.7 ... ... ... ... ... ... ... ... ...
Inflation rate (GDP deflator, in percent) 3.4 5.3 0.6 0.0 0.0 0.0 1.8 1.3 1.9 0.8 1.7 1.7 1.7
Growth of real primary spending (deflated by GDP deflator, in percent) -1.4 -0.4 -12.5 -5.7 5.7 -0.6 -0.3 0.1 0.8 0.0 -0.9 -0.5 -0.4
Grant element of new external borrowing (in percent) ... ... ... 28.2 28.2 28.2 28.2 41.3 41.3 32.6 40.6 41.1 ...
Sources: Country authorities; and staff estimates and projections.
1/ [Indicate coverage of public sector, e.g., general government or nonfinancial public sector. Also whether net or gross debt is used.]
2/ Gross financing need is defined as the primary deficit plus debt service plus the stock of short-term debt at the end of the last period.
3/ Revenues excluding grants.
4/ Debt service is defined as the sum of interest and amortization of medium and long-term debt.
5/ Historical averages and standard deviations are generally derived over the past 10 years, subject to data availability.
Actual Projections

FEDERATED STATES OF MICRONESIA
INTERNATIONAL MONETARY FUND 13
Table 4. Micronesia: Sensitivity Analysis for Key Indicators of Public Debt 2014–34
2014 2015 2016 2017 2018 2019 2024 2034
Baseline 22 22 22 21 22 22 25 32
A. Alternative scenarios
A1. Real GDP growth and primary balance are at historical averages 22 25 29 32 37 42 62 87
A2. Primary balance is unchanged from 2014 22 16 9 2 -4 -10 -46 -134
A3. Permanently lower GDP growth 1/ 22 22 22 22 23 25 34 73
B. Bound tests
B1. Real GDP growth is at historical average minus one standard deviations in 2015-2016 22 23 26 26 28 30 43 74
B2. Primary balance is at historical average minus one standard deviations in 2015-2016 22 29 36 35 36 37 41 48
B3. Combination of B1-B2 using one half standard deviation shocks 22 27 33 33 35 37 46 69
B4. One-time 30 percent real depreciation in 2015 22 31 31 30 30 30 30 33
B5. 10 percent of GDP increase in other debt-creating flows in 2015 22 28 28 28 28 29 33 40
Baseline 32 35 36 35 36 37 47 67
A. Alternative scenarios
A1. Real GDP growth and primary balance are at historical averages 32 41 47 53 61 68 115 177A2. Primary balance is unchanged from 2014 32 25 15 3 -6 -16 -85 -277A3. Permanently lower GDP growth 1/ 32 35 37 36 38 41 63 148
B. Bound tests
B1. Real GDP growth is at historical average minus one standard deviations in 2015-2016 32 37 41 42 46 49 79 152B2. Primary balance is at historical average minus one standard deviations in 2015-2016 32 46 58 58 60 61 76 98B3. Combination of B1-B2 using one half standard deviation shocks 32 44 54 54 57 61 86 141B4. One-time 30 percent real depreciation in 2015 32 50 50 49 49 50 56 69B5. 10 percent of GDP increase in other debt-creating flows in 2015 32 45 47 46 47 49 61 82
Baseline 3 4 3 3 3 3 3 3
A. Alternative scenarios
A1. Real GDP growth and primary balance are at historical averages 3 4 4 3 4 4 6 11
A2. Primary balance is unchanged from 2014 3 4 3 2 2 2 -1 -15
A3. Permanently lower GDP growth 1/ 3 4 3 3 3 3 4 7
B. Bound tests
B1. Real GDP growth is at historical average minus one standard deviations in 2015-2016 3 4 3 3 3 3 4 8
B2. Primary balance is at historical average minus one standard deviations in 2015-2016 3 4 4 4 4 3 5 6
B3. Combination of B1-B2 using one half standard deviation shocks 3 4 4 4 4 3 5 8
B4. One-time 30 percent real depreciation in 2015 3 4 5 4 4 4 5 6
B5. 10 percent of GDP increase in other debt-creating flows in 2015 3 4 4 3 3 3 4 5
Sources: Country authorities; and staff estimates and projections.
1/ Assumes that real GDP growth is at baseline minus one standard deviation divided by the square root of the length of the projection period.
2/ Revenues are defined inclusive of grants.
PV of Debt-to-GDP Ratio
Projections
PV of Debt-to-Revenue Ratio 2/
Debt Service-to-Revenue Ratio 2/

Press Release No. 15/224
FOR IMMEDIATE RELEASE
May, 15, 2015
IMF Executive Board Concludes 2015 Article IV Consultation with
the Federated States of Micronesia
On May 11, the Executive Board of the International Monetary Fund (IMF) concluded the
2015 Article IV consultation1 with the Federated States of Micronesia (FSM).
Micronesia’s economy is stagnating, as externally-funded infrastructure projects are moving
slowly while difficulties in the business climate, in particular those related to land tenure
issues, continue to hold back private sector development. Staff estimates real GDP growth of
around 0.1 percent for the fiscal year 2014 (ending September), while inflation has dropped
to 0.7 percent on the back of falling oil prices. The current account strengthened in to
2½ percent of GDP in 2014, due mostly to a one-off increase in tax revenues and an increase
in fishing license fees. Growth in 2015 is projected to remain subdued at 0.3 percent, while
consumer prices are projected to further decline to -1.0 percent thanks to the continued pass
through of low oil prices.
The Micronesian economy is projected to grow at 0.6 percent in the medium term, while
risks on the outlook are tilted to the downside. The expiration in 2023 of grants provided
under the Compact of Free Association with the United States is a significant challenge for
Micronesia, requiring the country to implement wide-ranging reforms to enhance fiscal
sustainability and private sector growth. Damages caused by the recent Typhoon Maysak
have revealed again Micronesia’s vulnerability to tropical cyclones, while disaster assistance
arrangements with the United States help the nation to recover from those damages.
Some reforms have been started recently, in particular, fiscal consolidation efforts by the
state governments under the Long-Term Fiscal Frameworks (LTFF) and the establishment of
the Unified Revenue Authority (URA). A new legislation on credit unions is being prepared
to extend the supervisory authority of the Banking Board. The recently produced “2023
1 Under Article IV of the IMF's Articles of Agreement, the IMF holds bilateral discussions with members,
usually every year. A staff team visits the country, collects economic and financial information, and discusses
with officials the country's economic developments and policies. On return to headquarters, the staff prepares a
report, which forms the basis for discussion by the Executive Board.
International Monetary Fund
700 19th
Street, NW
Washington, D. C. 20431 USA

2
Action Plan” shows further policy actions that are required, including the implementation of
the tax reform package and regulatory reforms. Most of these policy actions will require
legislative measures – hence the critical importance in achieving a wide consensus in a nation
with a loosely federated structure.
Executive Board Assessment2
Executive Directors noted that medium-term growth prospects in the Federated States of
Micronesia (FSM) remain weak given sluggish private sector activity, while fiscal challenges
loom ahead, in particular, with the expiration of Compact grants in 2023. They also
expressed concern about the impact of the damage caused by Typhoon Maysak in April,
notwithstanding the provision of emergency assistance by the international community.
Directors stressed the importance of critical fiscal and structural reforms to help lift the
economy’s growth prospects and achieve fiscal sustainability beyond the expiration of the
Compact grants.
Directors called for the formulation of a realistic long-term fiscal framework based on a wide
consensus across the national and four state governments, with a view to achieving budgetary
self-reliance in the post-2023 period. While commending recent progress—including the
establishment of the Unified Revenue Authority, the transfer of the 2014 fiscal surplus to the
FSM trust fund, and the start of the Long-Term Fiscal Framework by the state
governments—Directors encouraged the authorities to redouble their efforts in strengthening
fiscal consolidation. They advised swift implementation of the long-debated tax reform
package, in order to raise the revenue-to-GDP ratio closer to regional averages. Directors
also noted the scope for improved prioritization of public spending, including through wage
moderation and expedited implementation of an updated infrastructure development plan.
Directors emphasized that improving the investment climate is key to achieving private-
sector-led growth in the FSM. They encouraged the authorities to undertake growth-
enhancing policy actions, particularly by addressing land tenure issues through land surveys
and registration. Efforts to strengthen investor protection and contract enforcement, and
expedited investment application approvals would also help to attract foreign direct
investment. In this regard, attention should be paid to safeguarding FSM’s cultural heritage
and pristine environment. Directors also supported greater bank credit expansion, including
to SMEs, in order to help boost economic activity and promote diversified growth. They
2 At the conclusion of the discussion, the Managing Director, as Chairman of the Board, summarizes the views
of Executive Directors, and this summary is transmitted to the country's authorities. An explanation of any
qualifiers used in summings up can be found here: http://www.imf.org/external/np/sec/misc/qualifiers.htm.

3
noted that business skills of SMEs should be strengthened to support formulation of more
bankable business projects.
Directors agreed that expanding regulatory oversight of credit unions would help to preserve
financial stability. They supported the authorities’ efforts to prepare a new Credit Union Act
that places credit unions under the supervision of the Banking Board, with technical
assistance from the Pacific Financial Technical Assistance Centre(PFTAC).
Directors encouraged the authorities to redouble efforts to strengthen the capacity to produce
timely economic statistics, with technical assistance from the Fund and other donors.

4
Micronesia: Selected Economic Indicators, FY2010–15 /1
Nominal GDP (FY2013): US$315 million
Population (FY2013): 103,679
GDP per capita (FY2013): US$3,034
IMF Quota: SDR 5.1 million
FY2010 FY2011 FY2012 FY2013 FY2014
FY201
5
Est. Proj.
Real sector (annual percent change)
Real GDP 3.2 1.8 0.1 -4.0 0.1 0.3
Consumer prices 3.7 4.3 6.3 2.1 0.7 -1.0
Employment 3.9 1.7 -2.6 -2.0 0.0 0.1
Public (incl. public enterprises) 1.1 -0.4 -0.8 -0.7 0.0 0.0
Private 7.1 3.8 -4.8 -3.9 0.1 0.2
Nominal wages 2.7 0.4 3.8 1.6 1.8 1.9
public average wage/private average wage 2.2 2.1 2.0 2.0 2.0 2.0
Consolidated government finance (in percent of GDP)
Revenue and grants 68.2 65.0 66.0 62.3 68.6 61.9
Revenue 21.6 20.8 22.9 26.8 37.4 30.9
Grants 2/ 46.6 44.3 43.1 35.5 31.2 31.0
Expenditure 67.8 65.6 65.3 59.6 56.1 59.0
Current 46.9 45.6 44.2 45.9 46.0 45.5
Capital 20.8 20.0 21.1 13.7 10.1 13.6
Overall balance 0.5 -0.6 0.8 2.8 12.5 2.8
Overall balance (exc. Grants) -46.1 -44.8 -42.4 -32.8 -18.7 -28.2
Commercial banks (in percentage of GDP; end of period)
Loans 19.0 17.9 17.4 17.2 18.0 …
Deposits 52.5 53.8 62.7 67.8 75.4 …
Interest rates (in percent, average for FY)
Consumer loans 14.9 14.4 14.2 15.7 15.7 …
Commercial loans 6.6 6.6 6.4 6.4 6.4 …
Balance of payments (in millions of U.S. dollars)
Trade balance -128.4 -134.0 -125.7 -131.1 -129.2 -119.1
Net services and income -29.8 -32.5 -25.8 -11.7 5.5 5.6
Private and official transfers 113.8 111.2 110.3 111.1 131.7 111.4
Current account -44.4 -55.3 -41.2 -31.6 8.0 -2.1
(in percent of GDP) -15.1 -17.9 -12.6 -10.1 2.5 -0.7
Current account excluding official transfers -153.4 -158.9 -142.5 -129.6 -89.6 -99.4
(in percent of GDP) -52.2 -51.4 -43.7 -41.2 -28.5 -31.5
External debt (in millions of U.S. dollars; end of period) 3/
Stock 86.4 89.8 90.3 85.2 83.0 83.7
(in percent of GDP) 29.4 29.1 27.7 27.1 26.4 26.5
Debt service 4.4 5.0 5.1 5.9 7.1 7.0
(in percent of exports of goods and services) 6.3 6.7 5.3 6.7 7.9 8.0
Exchange rate regime U.S. dollar is the official currency
Real effective exchange rate 4/ 109.9 109.5 112.4 115.1 115.8 n.a.
Sources: FSM authorities and IMF staff estimates.
1/ Fiscal year ending September 30.
2/ Excludes grants to the Compact Trust Fund.
3/ Government and public enterprise debt only.
4/ Calendar year. 2003=100.

Statement by KwangHae Choi, Alternate Executive Director
and Hyunjoon Lim, Government-Provided Advisor to the Executive Director
May 11, 2015
Background
On behalf of the Micronesian authorities, we appreciate staff’s well-organized and informative
assessment of the developments in the economy and the constructive dialogue with the
authorities.
The Federated States of Micronesia is a small Pacific island country which consists of four
autonomous states guaranteed by its constitution. Such autonomy and the geographical
dispersion among each state make it challenging to achieve social consensus on important
issues.
The most serious challenges facing Micronesia include concerns related to grants from the
United States which recently account for 25~30 percent of GDP. Grants are expected to expire in
FY2023. Therefore, the FSM’s sustainable growth in the long term will hinge on moving forward
the fiscal reforms in preparation for the expiration of grants, and fostering a larger role for the
private sector as a new engine of growth.
To address these challenges, the authorities recently initiated “Action Plan 2023” which aims at
addressing the fiscal and economic challenges leading up to and post FY2023. The Action Plan
targets achieving the FSM’s annual real growth rate of 2 percent, creating an environment for
private sector-driven growth, and strengthening fiscal consolidation over the remaining years at
the Compact.
In this regard, while the authorities broadly agree with staff on the outlook, ambitious reforms
and favorable development of global economy would play a pivotal role in helping to revive the
economic activity.
In addition, pursuing sustainable growth, the authorities highly appreciate the staff’s assessment
and recommendation. In particular, staff’s recommendations related to achievement of the
sustainable growth are largely in line with the Action Plan 2023, which are to promote the
country’s economic development, budgetary self-reliance, and economic self-sufficiency.
Economic Outlook
The authorities broadly agree with staff’s assessment of the outlook. However, the authorities
believe that there is a range of upside risks that could materialize, particularly with
implementation of reforms. Specifically, the authorities believe that the FSM’s economy will be

able to regain the momentum to 2 percent per annum on average over the remaining periods of
the Compact in case the country radically realigns its productive capacity by undertaking key
factors contained in the Action Plan and being helped by favorable factors as follows:
Fishing and tourism are expected to benefit from favorable external factors such as lower oil
prices and the gradual recovery of global economy.
The authorities continue to have dialogue with the stakeholders to address the unused
balance of allocated Compact grants for infrastructure projects. The authorities seek to
accelerate the spending on the infrastructure arrears of $126 million over the next four years,
and thereby help to reinvigorate the economy.
Last but not least, the authorities believe that an additional upside risk could arise from the
positive effects of the structural reforms on external and domestic confidence.
Pursuing Sustainable Growth
Fiscal Policy
Staff pointed out that from 2024 onwards, the FSM will face serious fiscal deficits without any
interventions or reforms. A key challenge in fiscal reforms for the country is that the fiscal policy
is implemented individually by the central and state governments, with separate expenditure and
revenue policies. The authorities agree on the need to put in place both revenue and expenditure
reforms that reflect the country’s long term objectives.
On the revenue front, the authorities highly appreciate staff’s emphasis on the central
importance of improved tax administration and tax reforms.
The authorities plan to lift a currently low tax-to-GDP ratio of 12 percent up to as high as 16
percent through a series of tax reforms, including through introduction of a value added tax
and net profits tax.
Going forward, the authorities seek to extend the URA to the remaining two states, enhance
the current operations of the state and national tax offices, and broaden personnel training
in anticipation of the broader tax reform.
This will be supported by sustained utilization of technical assistance from the Pacific Forum
Secretariat (PFTAC) and other development partners, incorporating wherever possible the lessons
from the experiences of comparable Pacific island countries that have already undertaken such
reforms. Complimenting these efforts and standing critical to the success of the reforms, will be a
more targeted public awareness program regarding the reforms.
On the expenditure front, a key policy objective is the need for national and state governments
to limit their expenditure growth to 2 percent per annum over the medium-to- long term and
thereby see total expenditure of government continue to decline as a percent of GDP by allowing
expenditure to keep track of inflation levels.
In particular, the authorities view the recent launch of state-level effort towards consolidation
under the Long-Term Fiscal Frameworks (LTFF) as important progress, and moreover
highlight their strong resolves to extend the LTFF to the national government level.
Concerning the large wage bill, the authorities note that salaries have been frozen since 1997
through a decision of Congress. The government recently undertook a public administration
reform project, under which it reviewed not only the salary freeze but also number of staff,
payment structures, and staff grading etc and is in the process of implementing the findings.
The authorities seek to strike right balance between revenue enhancing measures and revenue
sharing. In considering any revenue sharing with the states, the national government will seek to
ensure that the states take appropriate and corresponding measures, including enabling tax
reform legislation, improving the investment environment, and implementing expenditure
reforms.
Private Sector Development
The authorities fully agree with staff that improving the investment climate is key to achieving
private sector-led growth. They also acknowledge that compact grants, no matter how efficiently
administered, will not lead to better economic performances by 2023 without substantially
rebalancing sector grant usage to focus on private sector growth, that leads to achieving
budgetary self- reliance and economic self-sustainability. Despite the authorities’ steadfast
resolve to generate a business-friendly climate, it will be challenging to achieve social consensus
on the structural problems, including land tenure reform in the near term.
Specific issues for the FSM include dealing with insolvency, contract enforcement, investor
protection, access to credit, property rights, and business start-up challenges as well as land
leases and foreign investment. It is hoped that diverse measures for Regulatory reforms Covered
by the Action Plan 2023 will provide a cornerstone for enhancing protection for foreign investors
and reducing investment-related uncertainty. The Action Plan, in practice, contains diverse
measures and initiatives to expedite the construction of infrastructure which will help to enhance
the competitiveness of tourism and fishery sectors.
Regarding the ownership and leasing of land, the authorities also see merit in reviewing
restrictions imposed by Foreign Investment Acts at both levels of government to harmonize and

provide greater clarity on land tenure practices across the states, while respecting local investors’
legitimate interests. As is the case in other Pacific island countries, the land issue is so delicate
and intricately connected to people’s perception of inheritance and community that it needs to
be tackled sensitively to produce solution that are sustainable in the long term.
Financial Sector
The authorities welcome staff’s appraisal that the commercial banking sector is sound with
adequate capital and ample liquidity. Nevertheless, the authorities continue to extend their
regulatory efforts to credit unions. The authorities also note that continued reliance on the PFTAC
for technical assistance is critical to prepare for a Credit Union Act which will expand the Board’s
supervisory mandate of the Banking Board over credit unions. The newly created Insurance Board
will also benefit from technical assistance from the Fund and other agencies, to enhance its
supervisory capacity and strengthen foreign corporation auditing.
External Stability
We share staff’s view that risks to external stability are relatively contained given that its current
account deficits have largely been financed by concessional foreign grants for infrastructure
projects. Although this nature helps the FSM’s public debt to remain stable and low as a percent
of GDP, the authorities remain mindful of the external risks posed by foreign denominated loans.
Given this, the authorities are committed to closely monitoring the pressures from foreign loans
and the scheduled reduction of Compact grants, on external stability, and will continue their
efforts to reduce heavy external dependence for the energy and foods.