
Federalism. Defining Federalism The Constitutional Basis of Federalism.
Upload
isabella-bartonCategory
view
213download
0
Federalism and Benchmarking in Australia
Roger Wilkins, AOHead of Government & Public Sector Group, Australia & NZ, CitiFormer Director-General of The Cabinet Office in New South Wales, Australia
15 February, 2008

Table of Contents
Introduction 1
Benchmarking and Federal Reform 2
Review of Government Service Provision: Institutional Arrangements
Scope of Review
3
4
Reasons for measuring performance 5
Reasons for measuring comparative performance
Guiding Principles
Sources of Data
Review Process
Issues with the Review
Achievements
Performance monitoring in other countries
Where does Australia go from here?
National Reform Agenda
Case Study – Education
Questions
6
7
8
9-10
11-12
13
14
15-16
17-19
20-34
35

Introduction
Germany
The Constitution gives the Länder responsibility for administration of programs, for delivery of government services
Tax sharing arrangement - key taxes divided between the Länder and the Bund.
Australia
States have been the level of government that has delivered most services to citizens
Federal Government collects most of the revenue
Federal Government raises 80% of revenue in Australia
Large transfers from Federal to State
Benchmarking and Federalism

Benchmarking and Federal Reform
Public reporting of results by the States as a pre condition for more
fiscal autonomy
Public reporting of results as the basis for less central control and
more policy autonomy
Public reporting of results by the States as the basis for harnessing
competitive federalism and innovation
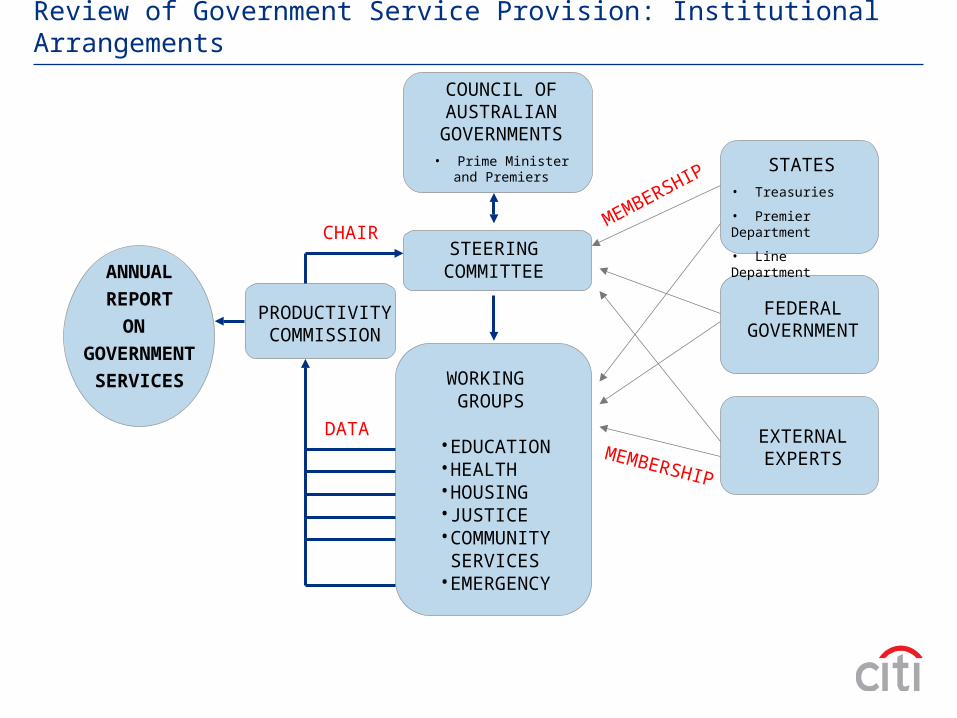
Review of Government Service Provision: Institutional Arrangements
MEMBERSHIP
PRODUCTIVITY COMMISSION
COUNCIL OF AUSTRALIAN
GOVERNMENTS
• Prime Minister and Premiers
STEERINGCOMMITTEE
WORKING GROUPS
•EDUCATION•HEALTH•HOUSING•JUSTICE•COMMUNITY SERVICES•EMERGENCY
MEMBERSHIP
STATES• Treasuries
• Premier Department
• Line Department
FEDERAL GOVERNMENT
EXTERNAL EXPERTS
ANNUAL
REPORT
ON
GOVERNMENT
SERVICES
CHAIR
DATA

Scope of Review
Children’s services School education Vocational education and training
Education• Public hospitals
• Primary and community health
• Breast cancer detection and management, and specialised mental health
Health
Police Courts administration Corrective services
Justice
Aged care services Services for people with a disability Children's services Protection and support services
Community Services
Fire and ambulance services
Emergency management
Public and community housing,
State owned and managed
Indigenous housing and Commonwealth Rent Assistance
Housing
1. Report on innovation and reforms2. Report on key indicators for Indigenous people

Reasons for measuring performance
Help clarify government objectives and responsibilities
Promote analysis of the relationships between agencies and between programs, allowing governments to coordinate policy within and across agencies
Make performance more transparent, allowing assessment of whether program objectives are being met
Provide governments with indicators of their performance over time
Inform the wider community about government service performance
Encourage ongoing performance improvement

Reasons for measuring comparative performance
0
30
60
90
120
NSW Vic Qld WA SA Tas ACT NT Aust
15 years 16 years 17 years 18 years 19 years
ExampleParticipation rate of people aged 15–19 in school education,
all schools, 2005
To verify good performance and identify those agencies which
are ‘getting it right’
To allow agencies to identify peer agencies that are delivering
better or more cost effective services
To generate additional incentives for agencies to address
substandard performance

1
Guiding Principles
Comprehensiveness
Comparability
Progressive data availability
A focus on outcomes
2
3
4
4
Guiding
Principles
1Lump circuitAccelerate lump circuit to upgrade initial earnings and lift processing capacity – in current plans but not for a few years
Timeliness

Sources of Data
The States collect most of the data. Many have their own internal benchmarking against State goals and objectives
There are Ministerial Councils for Health, Housing, Education and Training, Justice, Community Services and Emergency Management.
These consist of Ministers from all the States and the Federal Minister.
Most of these councils collect and publish information about outcomes in their own areas
There are a variety of Think Tanks, Research Institutions, Universities who do benchmarking studies
There are also international fora and studies e.g PISA
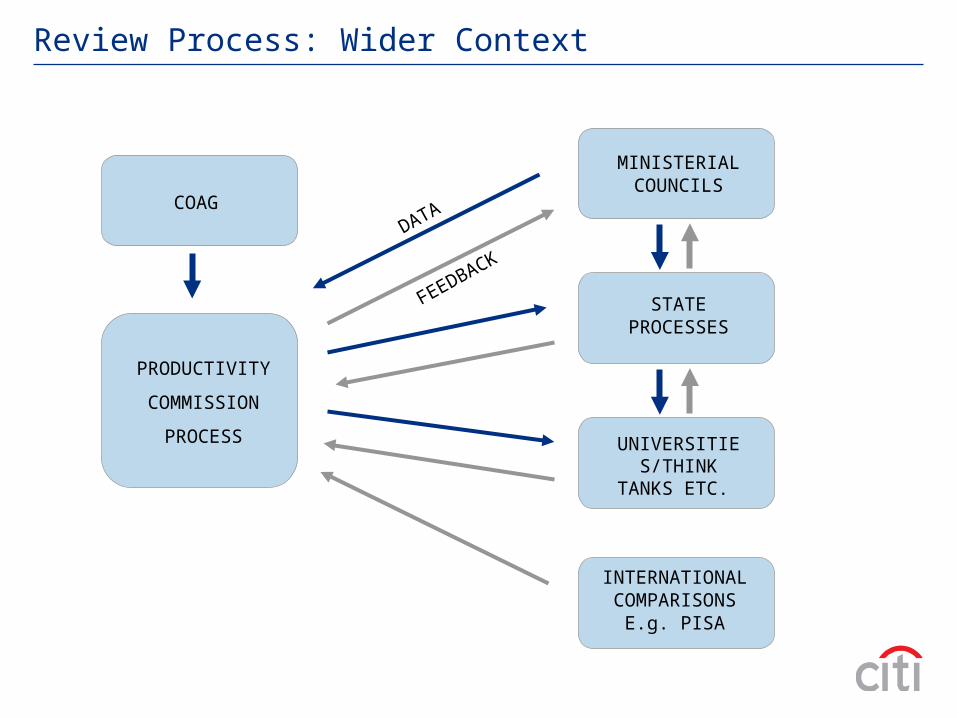
Review Process: Wider Context
COAG
PRODUCTIVITY
COMMISSION
PROCESS
MINISTERIAL COUNCILS
STATEPROCESSES
UNIVERSITIES/THINK TANKS
ETC.
INTERNATIONALCOMPARISONS
E.g. PISA
DATA
FEEDBACK

Review Process: Performance Indicator Framework
Program or serviceobjectives
Input Process Output Outcomes
External influences
Program effectiveness
Cost-effectiveness
Service
Technical efficiency
Reduction in loss oflife due to fire
Labour andcapital
ProcessFire
incidentsattended
Number of lives lostdue to fire
Weather
Fire service
Example: general model
Example: fire services

Issues with the Review: Policy Issues
41 2 3 5 6
This type of competition can be destructive or constructive
Competition Destructive/Constructive
MethodologyProblematic
Unrevealing No standards
Aspects of the methodology and the indicators adopted have been problematic
Insufficient attention to benchmarking as a diagnostic and management tool
Insufficiency
Approach of looking at State aggregates in Australia’s case is not very revealing
Introduction of standards has not been part of this exercise
Benchmarking can be a potent form of competition in a federal system

Issues with the Review: Technical Issues
Outcomes are critical - the objectives or outcomes of programs can be important issues of policy
A major source of complexity is the role of the private sector
What you measure determines how people behave
1. OUTCOMES 2. MEASURES
3. PRIVATE SECTOR
4. EFFECTIVENESS
There continues to be a paucity of information about cost-effectiveness
5. EQUITY
Few outcome indicators relate directly to equity

greater transparency and accountability by governments to their citizens
greater pressure on Ministers and departments to perform
forced departments to review their business strategies and programs
forced departments and agencies to cooperate more and better to get results that involve several government agencies
complex – need to compare “apples and apples”
tension or conflict between two very different objectives or set of objectives
2
Achievements
?
?

Performance monitoring in other countries
OECD
– The OECD Factbook provides more than 100 indicators cover a wide range of areas: economy, agriculture, education, energy, environment, foreign aid, health and quality of life, industry, information and communications, population/labour force, trade and investment, taxation, public expenditure and R&D.
– The information is outcome focused, and is not linked to specific service delivery agencies (OECD 2006).
United Kingdom
– In 2002, the United Kingdom introduced regular web-based reporting against public service agreements, and all key performance data on public service delivery is now available on a single website.
– Public service agreements measure agency performance by setting out the aim of the department or program, the supporting objectives and the key outcome-based targets that are to be achieved during a specified period (HM Treasury 2004).
New Zealand
– The New Zealand Ministry of Social Development produces an annual Social Report, which provides information on the health and well-being of New Zealand society.
– Indicators are used to measure levels of wellbeing, to monitor trends over time, and to make comparisons with other countries.
– A limited number of high level indicators are presented for each domain, but there is no attempt to comprehensively address the full range of objectives of any specific government service (Ministry of Social Development 2006).

Where does Australia go from here?

Where does Australia go from here?
The new Australian Government is embarking on a process of reforming the federal system
Scenarios
– we are likely to see a reform of the multiplicity of intergovernmental agreements to do two main things – broaden their scope and concentrate on outcomes rather than process
– we are likely to see a far greater convergence between economic policy and social policy
– Expect to see the adoption of national goals and standards that are outcome based
– Benchmarking should be a crucial part of this process
The National Reform Agenda
Reforms to extend boom
David Uren, Economics correspondent | January 19, 2008

National Reform Agenda
Life stage Indicative Outcomes
Conception to birth Significantly improve the proportion of children born healthy.Subsidiary outcome: The gap between Indigenous and non-Indigenous children is closed.
0-5 Significantly improve the proportion of children acquiring the basic skills for life and learning.Subsidiary outcome: The gap between Indigenous and non-Indigenous children is closed.
Agreed to by COAG, 14 July 2006

National Reform Agenda
Life stage Indicative Outcomes
School age Increase the proportion of young people meeting basic literacy and numeracy standards, and improve overall levels of achievement.
Reduce the prevalence of key risk factors that contribute to chronic disease.
Increase the proportion of young people making a smooth transition from school to work or further study.

National Reform Agenda
Life stage Indicative Outcomes
Working age Reduce the proportion of the working age population not participating and/or under-participating in paid employment due to illness, injury or disability
Increase the proportion of adults who have the skills and qualifications needed to enjoy active and productive working lives.
Reduce the incidence of preventable chronic disease and serious injury amongst the working age population
Reduce the prevalence of key risk factors that contribute to chronic disease.
Improve overall workforce participation, with a particular focus on income support recipients, the mature aged and women, in a manner consistent with the long term interests of the individual and the economy, giving due regard to productivity.Increased provision of flexible working arrangements within the workforce, in a manner consistent with the long term interests of the individual and the economy.
Increase the effectiveness of the health system in achieving health outcomes.

Case Study – Education

Media
ABC News R10 TUESDAY, 8 JANUARY, 2008
By Brian J. Caldwell
Kevin Rudd is to be congratulated on making education his top priority in government. There had been an air of expectancy for most of 2007, following his promise in January of an education revolution.
Are we serious about an education revolution? Rewarding qualityMerit pay would help stem the exodus of teachersAT the outset of the Rudd Government's
Neil HooleyJanuary 30, 2008
Students deserve genuine educational reform
Public school teachers slam funding plan
PRODUCTIVITY COMMISSION REPORT HIGHLIGHTS TASMANIA’S LITERACY AND
NUMERACY PROBLEMS
Thursday 31 January 2008

Australia’s formal system of education
Australian, State and Territory governments fund government and non‑government providers to deliver formal education and training services
Government providers include:
– government schools (preschool, primary and secondary),
– technical and further education (TAFE) institutes, and
– universities.
Non-government providers include:
– privately operated schools and preschools, and
– private registered training organisations (RTOs) in the Vocational Education and Training (VET) sector
Total government expenditure on education, 2005-06
Source: ABS (2007a); table BA.3.
55.2%
27.6%
9.5%
5.6% 2.1% Primary and secondaryeducation
University and tertiary educationnec
TAFE
Pre-school and other educationnot definable, or nec
Transportation of students

Outline of the Australian education and training system
Th
ird
leve
l(t
ert
iary
ed
uca
tion
)
S
eco
nd
leve
l 1
st s
tag
e
2
nd
sta
ge
Yea
rs 7
/8-1
0
Y
ears
11-
12
Fir
st le
vel
Ye
ars
1-6
/7
Undergraduate degreeGraduate diploma
Graduate certificateAdvanced diploma
DiplomaCertificate IVCertificate IIICertificate IICertificate I
Vo
catio
na
l ed
uca
tion
an
d t
rain
ing
Doctoral degreeMasters degree
Graduate diplomaGraduate certificate
Hig
he
r e
du
catio
n(u
niv
ers
itie
s)
Bachelor degreeAssociate degreeAdvanced diploma
Diploma
Year
12
11
10
9
8
7
6
5
4
3
2
1
Senior secondarycertificate of education
Primary education
Secondary education
16
Age
17
15
14
13
12
1312
11
10
9
8
7
6
5
18
Source: Adapted from National Office of Overseas Skills Recognition (2000).

2006 Snapshot
3.4 million full time school students attending 9612 schools in Australia, including 6902 government schools (ABS 2007b).
1.7 million people undertook VET programs in 2006, 1.2 million students participated in government recurrent funded programs.
There were approximately 984 000 students attending higher education institutions that received funding on behalf of students from the Australian Government in 2006, an increase of 2.8 per cent from 2005.
– These students undertook a variety of courses, ranging from diplomas to doctorates across a range of public and private providers.
– The most popular fields of education were management and commerce, and society and culture. Students in these fields undertook, for example, courses in accounting, tourism, marketing, political science, law, economics and criminology (DEST 2007).

Performance Indicators for all schools
Equity
PERFORMANCE
Access and equity measures for attendance,
participation and retention
Writing performance
Effectiveness
EfficiencyInputs per output
unit
Participation
Staff expenditure per student
User cost of capital per student
Student-to-staff ratio
Numeracy performance
Science literacy performance
Information and communication
technology literacy
performance
Retention
Recurrent expenditure per
student
Civics and citizenship
performance
Other areas to be identified
Student learning
Goals and Objectives
Key to indicators
Text
Text Data for these indicators not complete or not directly comparable
Text These indicators yet to be developed or data not collected for this Report
Data for these indicators comparable, subject to caveats to each chart or table
Reading performance
Outputs Outcomes
Destination
Completion
VET in schools participation
VET in schools attainment
Attendance

Effectiveness
Indicator of governments’ objective that young Australians should attain high standards of knowledge, skill and understanding in core curriculum areas.
Measures
Reading performance Proportion of assessed years 3, 5 and 7 students who achieved the national reading benchmark for a given year, reported by sex, Indigenous status and LBOTE status
Writing performance Proportion of assessed years 3, 5 and 7 students who achieved the national writing benchmark for a given year, reported by sex, Indigenous status and LBOTE status
Numeracy performance Proportion of assessed years 3, 5 and 7 students who achieved the national numeracy benchmark for a given year, reported by sex, Indigenous status and LBOTE status
Science Literacy Performance Proportion of sampled year 6 primary students achieving at or above the proficient standard in scientific literacy, reported by sex, Indigenous status, LBOTE status and geolocation (national data only are available for subgroups).
Source: Broker Research.
7 Science of Climate Change

Effectiveness
Indicator of governments’ objective that young Australians should attain high standards of knowledge, skill and understanding in core curriculum areas.
Measures
Civics & Citizenship performance Proportion of sampled year 6 and year 10 students achieving at or above the proficient standard in civic knowledge and understanding, reported by sex, Indigenous status, LBOTE status and geolocation (national data only are available for subgroups).
Info & Communication technology literacy performance
Proportion of sampled year 6 and year 10 students achieving at or above the proficient standard in ICT literacy
VET in schools participation & attainment
The number of school students undertaking VET (with new apprenticeships and traineeships disaggregated) as part of their senior secondary school certificate in a calendar year, as a proportion of all school students undertaking a senior secondary school certificate in that year.
The VET in schools attainment rate is defined as the number of school students enrolled in a senior secondary school certificate in a calendar year who have completed at least one VET unit of competency/module as a proportion of all school students undertaking a senior secondary school certificate in that year
Source: Broker Research.
7 Science of Climate Change

Effectiveness
Completion the number of students who meet the requirements of a year 12 certificate or equivalent expressed as a percentage of the potential year 12 population.
Destination the number of school leavers who left school in a given year and who in May the following year were attending post-school education and training, as a percentage of all school leavers in the given year. It is reported by highest level of schooling completed (year 12 or year 11 and below).
Measures

Example
Proportion of 15 year old students achieving level 3 or above, overall reading literacy scale, 2006
0
20
40
60
80
100
NSW Vic Qld WA SA Tas ACT NT Aust
Per
cen
t
Source: ACER (unpublished); table 4A.101.

Example
Proportion of year 7 students achieving the numeracy benchmark
0
20
40
60
80
100
NSW Vic Qld WA SA Tas ACT NT Aust
Per
cen
t
2002 2003 2004 2005
Source: MCEETYA (2005a, 2005b, 2006a, 2007a); tables 4A.38, 4A.55, 4A.73 and 4A.91.

EquityIndicator of governments’ objective to develop fully the talents and capacities of young people through
education and learning.
Measures
Attendance The number of actual full time equivalent ‘student days attended’ over the period as a percentage of the total number of possible student days attended over the period
Participation The number of 15–19 year old full time school students as a proportion of the estimated resident population of the same age
Retention The number of full time school students in a designated level/year of education as a percentage of their respective cohort group (which is either at the commencement of their secondary schooling — at year 7 or 8 — or at year 10).
Source: Broker Research.
7 Science of Climate Change

Example
0
30
60
90
120
NSW Vic Qld WA SA Tas ACT NT Aust
15 years 16 years 17 years 18 years 19 years
Participation rate of people aged 15–19 in school education, all schools, 2006
Source: ABS (2007); table 4A.114.

Efficiency
Indicator of governments’ objective to fund and/or provide education in an efficient manner.
Measures
Recurrent expenditure per student Government recurrent expenditure per FTE student. It is reported for in-school primary, in-school secondary and out-of-school services, and for government and non-government schools.
Staff expenditure per student Government recurrent expenditure on staff per student is defined as government expenditure on staff per FTE student in government schools. Expenditure on staff is the major component of spending on schools.
User cost of capital per student Dollars of UCC per FTE student
Student-to-staff ratio The number of FTE students per FTE staff. A low ratio means there are a small number of students per teacher.
Source: Broker Research.
7 Science of Climate Change

Example
0
2 500
5 000
7 500
10 000
12 500
NSW Vic Qld WA SA Tas ACT NT Aust
$/st
ud
ent
2001-02 2002-03 2003-04 2004-05 2005-06
Real government recurrent expenditure on staff per FTE student, government schools (2005-06 dollars)
Source: ABS (2003, 2004, 2005, 2006, 2007); MCEETYA NSSC (unpublished); table 4A.8.


IRS Circular 230 Disclosure: Citigroup Inc. and its affiliates do not provide tax or legal advice. Any discussion of tax matters in these materials (i) is not intended or written to be used, and cannot beused or relied upon, by you for the purpose of avoiding any tax penalties and (ii) may have been written in connection with the "promotion or marketing" of any transaction contemplated hereby("Transaction"). Accordingly, you should seek advice based on your particular circumstances from an independent tax advisor.
Any terms set forth herein are intended for discussionpurposes only and are subject to the final terms as set forth in separate definitive written agreements. This presentation is not a commitment to lend, syndicate afinancing, underwrite or purchase securities,or commit capital nor does it obligate us to enter into such a commitment, nor are we acting as a fiduciary to you. By accepting this presentation, subject to applicable lawor regulation, you agree to keep confidential the existence of and proposed terms for any Transaction.
Prior to entering into any Transaction, you should determine, without reliance upon us or our affiliates, the economic risks and merits (and independently determine that you are able to assume these risks)as well asthe legal, tax and accounting characterizationsand consequencesof any such Transaction. In this regard, by accepting this presentation, you acknowledge that (a) we are not in the business of providing (and you arenot relying on us for) legal, tax or accounting advice, (b) there may be legal, tax or accounting risks associatedwith any Transaction, (c) you should receive (and rely on) separate and qualified legal, tax and accountingadvice and (d) you should apprise senior management in your organization as to such legal, tax and accounting advice (and any risks associated with any Transaction) and our disclaimer as to these matters. Byacceptanceof these materials, you and we hereby agree that from the commencement of discussions with respect to any Transaction, and notwithstanding any other provision in this presentation, we hereby confirmthat no participant in any Transaction shall be limited from disclosing the U.S. tax treatment or U.S. tax structure of such Transaction.
We are required to obtain, verify and record certain information that identifies each entity that enters into a formal business relationship with us. We will ask for your complete name, street address, and taxpayer IDnumber. We may also request corporate formation documents, or other forms of identification, to verify information provided.
Any prices or levels contained herein are preliminary and indicative only and do not represent bids or offers. These indications are provided solely for your information and consideration, are subject to change at anytime without notice and are not intended as a solicitation with respect to the purchaseor sale of any instrument. The information contained in this presentation may include results of analyses from a quantitative modelwhich represent potential future events that may or may not be realized, and is not a complete analysis of every material fact representing any product. Any estimates included herein constitute our judgment as of thedate hereof and are subject to change without any notice. We and/or our affiliates may make a market in these instruments for our customersand for our own account. Accordingly, we may have a position in any suchinstrument at any time.
Although this material may contain publicly available information about Citi corporate bond research, fixed income strategy or economic and market analysis, Citi policy (i) prohibits employees from offering, directly orindirectly, a favorable or negative researchopinion or offering to change an opinion as consideration or inducement for the receipt of business or for compensation; and (ii) prohibits analysts from being compensated forspecific recommendations or views contained in research reports. So as to reduce the potential for conflicts of interest, as well as to reduce any appearance of conflicts of interest, Citi has enacted policies andprocedures designed to limit communications between its investment banking and research personnel to specifically prescribed circumstances.
[TRADEMARK SIGNOFF: add the appropriate signoff for the relevant legal vehicle]
© 2008 Citigroup Global Markets Inc. Member SIPC. All rights reserved. Citi and Citi and Arc Design are trademarks and service marks of Citigroup Inc. or its affiliates and are used and registered throughout the world.
© 2008 Citigroup Global Markets Limited. Authorized and regulated by the Financial Services Authority. All rights reserved. Citi and Citi and Arc Design are trademarks and service marks of Citigroup Inc. or its affiliates and are used and registered throughout the world.
© 2008 Citibank, N.A. All rights reserved. Citi and Citi and Arc Design are trademarks and service marks of Citigroup Inc. or its affiliates and are used and registered throughout the world.
© 2008 Citigroup Inc. All rights reserved. Citi and Citi and Arc Design are trademarks and service marks of Citigroup Inc. or its affiliates and are used and registered throughout the world.
© 2008 [Name of Legal Vehicle] [Name of regulatory body.] All rights reserved. Citi and Citi and Arc Design are trademarks and service marks of Citigroup Inc. or its affiliates and are used and registered throughout the world.


![Our [National] Federalism - Yale Law Journal · source: federalism now comes from federal statutes. It is “National Federalism”— statutory federalism, or “intrastatutory”](https://static.fdocuments.us/doc/165x107/5f84f6df3b712117dc60d34f/our-national-federalism-yale-law-journal-source-federalism-now-comes-from-federal.jpg)