FEDERAL TRANSIT BUS TEST - Trans Tech Bus · FEDERAL TRANSIT BUS TEST ... Volume 7, Part 665...
107
FEDERAL TRANSIT BUS TEST Performed for the Federal Transit Administration U.S. DOT In accordance with CFR 49, Volume 7, Part 665 Manufacturer: Chestnut Ridge dba Trans Tech Bus, a Transportation Collaborative Co. Model: Student Safety Transporter (SST) Submitted for Testing in Service-Life Category 5 Year / 150,000 Miles Report Number: LTI-BT-R1317 The Thomas D. Larson Pennsylvania Transportation Institute 201 Transportation Research Building The Pennsylvania State University University Park, PA 16802 (814) 865-1891 Bus Testing and Research Center 2237 Old Route 220 North Duncansville, PA 16635 (814) 695-3404
Transcript of FEDERAL TRANSIT BUS TEST - Trans Tech Bus · FEDERAL TRANSIT BUS TEST ... Volume 7, Part 665...
FEDERAL TRANSIT BUS TEST
Performed for the Federal Transit Administration U.S. DOT In accordance with CFR 49, Volume 7, Part 665
Manufacturer: Chestnut Ridge dba Trans Tech Bus, a Transportation Collaborative Co.
Model: Student Safety Transporter (SST)
Submitted for Testing in Service-Life Category 5 Year / 150,000 Miles
Report Number: LTI-BT-R1317
The Thomas D. Larson Pennsylvania Transportation Institute
201 Transportation Research Building The Pennsylvania State University
University Park, PA 16802 (814) 865-1891
Bus Testing and Research Center
2237 Old Route 220 North Duncansville, PA 16635
(814) 695-3404

Page 2 of 107

Page 3 of 107
TABLE OF CONTENTS
Page
EXECUTIVE SUMMARY .......................................................................................................................... 4 ABBREVIATIONS .................................................................................................................................... 6 BUS CHECK-IN ....................................................................................................................................... 7 1. MAINTAINABILITY
1.1 ACCESSIBILITY OF COMPONENTS AND SUBSYSTEMS ....................................... 20 1.2 SERVICING, PREVENTATIVE MAINTENANCE, AND REPAIR AND
MAINTENANCE DURING TESTING ........................................................................... 23 1.3 REPLACEMENT AND/OR REPAIR OF SELECTED SUBSYSTEMS ......................... 26
2. RELIABILITY - DOCUMENTATION OF BREAKDOWN AND REPAIR TIMES DURING TESTING ................................................................................................................ 30 3. SAFETY - A DOUBLE-LANE CHANGE (OBSTACLE AVOIDANCE TEST) .................................... 31 4. PERFORMANCE TESTS 4.1 PERFORMANCE - AN ACCELERATION, GRADEABILITY, AND TOP SPEED TEST ............................................................................................................... 34 4.2 PERFORMANCE – BUS BRAKING PERFORMANCE TEST……………………..…… 38 5. STRUCTURAL INTEGRITY
5.1 STRUCTURAL STRENGTH AND DISTORTION TESTS - STRUCTURAL SHAKEDOWN TEST ................................................................................................... 43
5.2 STRUCTURAL STRENGTH AND DISTORTION TESTS - STRUCTURAL DISTORTION ............................................................................................................... 47
5.3 STRUCTURAL STRENGTH AND DISTORTION TESTS - STATIC TOWING TEST ............................................................................................................ 59
5.4 STRUCTURAL STRENGTH AND DISTORTION TESTS - DYNAMIC TOWING TEST ............................................................................................................ 60
5.5 STRUCTURAL STRENGTH AND DISTORTION TESTS - JACKING TEST ......................................................................................................... 63
5.6 STRUCTURAL STRENGTH AND DISTORTION TESTS - HOISTING TEST ........................................................................................................ 65
5.7 STRUCTURAL DURABILITY TEST ............................................................................ 67 6. FUEL ECONOMY TEST - A FUEL CONSUMPTION TEST USING AN APPROPRIATE OPERATING CYCLE ............................................................................................ 73 7. NOISE
7.1 INTERIOR NOISE AND VIBRATION TESTS ............................................................ 88 7.2 EXTERIOR NOISE TESTS ......................................................................................... 93
8. EMISSIONS ........................................................................................................................................99
Page 4 of 107
EXECUTIVE SUMMARY
Chestnut Ridge dba Trans Tech Bus, a Transportation Collaborative submitted a model Student Safety Transporter (SST), gasoline-powered 15 seat/20-foot bus, for a 5 yr./150,000 mile STURAA test. The odometer reading at the time of delivery was 9,845 miles. Testing started on January 17, 2014 and was completed on May 16, 2014. The Check-In section of the report provides a description of the bus and specifies its major components.
The primary part of the test program is the Structural Durability Test, which also provides the information for the Maintainability and Reliability results. The Structural Durability Test was started on January 24, 2014 and was completed on April 2, 2014.
The interior of the bus is configured with seating for 15 passengers including the driver. At 150 lbs. per person, this load results in a measured gross vehicle weight of 10,260 lbs. Note: this test bus is not designed to accommodate standing passengers; therefore, GVW and SLW are the same 10,260 lbs. The first segment of the Structural Durability Test was performed with the bus loaded to a GVW of 10,260 lbs. The middle SLW segment was performed at the same weight of 10,260 lbs. and the final segment was performed at a curb weight of 12,300 lbs. Durability driving resulted in no unscheduled maintenance or failures.
Effective January 1, 2010 the Federal Transit Administration determined that the
total number of simulated passengers used for loading all test vehicles will be based on the full complement of seats and free-floor space available for standing passengers (150 lbs per passenger). The passenger loading used for dynamic testing will not be reduced in order to comply with Gross Axle Weight Ratings (GAWR’s) or the Gross Vehicle Weight Ratings (GVWR’s) declared by the manufacturer. Cases where the loading exceeds the GAWR and/or the GVWR will be noted accordingly. During the testing program, all test vehicles transported or operated over public roadways will be loaded to comply with the GAWR and GVWR specified by the manufacturer.
Accessibility, in general, was adequate, components covered in Section 1.3 (Repair and/or Replacement of Selected Subsystems) along with all other components encountered during testing, were found to be readily accessible and no restrictions were noted.
The Reliability section compiles failures that occur during Structural Durability Testing. Breakdowns are classified according to subsystems. The data in this section are arranged so that those subsystems with more frequent problems are apparent. The problems are also listed by class as defined in Section 2. This test bus encountered no failures.
The Safety Test, (a double-lane change, obstacle avoidance test) was safely performed in both right-hand and left-hand directions up to a maximum test speed of 45 mph. The performance of the bus is illustrated by a speed vs. time plot. Acceleration and gradeability test data are provided in Section 4, Performance. The average time to obtain 50 mph was 10.14 seconds. Top speed obtained on the dynamometer was 80 mph.
Page 5 of 107
The Stopping Distance phase of the Brake Test was completed with the following results; for the Uniform High Friction Test average stopping distances were 21.15’ at 20 mph, 42.62’ at 30 mph, 71.08’ at 40 mph and 88.50 at 45 mph. The average stopping distance for the Uniform Low Friction Test was 22.80’. There was no deviation from the test lane during the performance of the Stopping Distance phase. During the Stability phase of Brake Testing the test bus experienced no deviation from the test lane but did experience pull to the left during both approaches to the Split Friction Road surface. The Parking Brake phase was completed with the test bus maintaining the parked position for the full five minute period with no slip or roll observed in both the uphill and downhill positions.
The Shakedown Test produced a maximum final loaded deflection of 0.056 inches with a permanent set ranging between -0.002 to 0.003 inches under a distributed static load of 5,625 lbs. The Distortion Test was completed with all subsystems, doors and escape mechanisms operating properly. No water leakage was observed throughout the test. All subsystems operated properly.
The bus submitted for testing was not equipped with any type of tow eyes or tow hooks, therefore the Static Towing Test was not performed. The Dynamic Towing Test was performed by means of a front-lift tow. The towing interface was accomplished using a hydraulic under-lift wrecker. The bus was towed without incident and no damage resulted from the test. The manufacturer does not recommend towing the bus from the rear, therefore, a rear test was not performed. The Jacking and Hoisting Tests were also performed without incident. The bus was found to be stable on the jack stands, and the minimum jacking clearance observed with a tire deflated was 6.5 inches.
A Fuel Economy Test was run on simulated central business district, arterial, and commuter courses. The results were 8.14 mpg, 9.10 mpg, and 14.24 mpg respectively; with an overall average of 9.60 mpg.
A series of Interior and Exterior Noise Tests was performed. These data are listed in Section 7.1 and 7.2 respectively.
The Emissions Test was performed. These results are available in Section 8 of
this report.
Page 6 of 107
ABBREVIATIONS
ABTC - Altoona Bus Test Center
A/C - air conditioner
ADB - advance design bus
ATA-MC - The Maintenance Council of the American Trucking Association
CBD - central business district
CW - curb weight (bus weight including maximum fuel, oil, and coolant; but
without passengers or driver)
dB(A) - decibels with reference to 0.0002 microbar as measured on the "A" scale
DIR - test director
DR - bus driver
EPA - Environmental Protection Agency
FFS - free floor space (floor area available to standees, excluding ingress/egress areas,
area under seats, area occupied by feet of seated passengers, and the vestibule area)
GVL - gross vehicle load (150 lb for every designed passenger seating
position, for the driver, and for each 1.5 sq ft of free floor space)
GVW - gross vehicle weight (curb weight plus gross vehicle load)
GVWR - gross vehicle weight rating
MECH - bus mechanic
mpg - miles per gallon
mph - miles per hour
PM - Preventive maintenance
PSTT - Penn State Test Track
PTI - Pennsylvania Transportation Institute
rpm - revolutions per minute
SAE - Society of Automotive Engineers
SCH - test scheduler
SA - staff assistant
SLW - seated load weight (curb weight plus 150 lb for every designed passenger seating
position and for the driver)
STURAA - Surface Transportation and Uniform Relocation Assistance Act
TD - test driver
TECH - test technician
TM - track manager
TP - test personnel
Page 7 of 107
TEST BUS CHECK-IN I. OBJECTIVE
The objective of this task is to log in the test bus, assign a bus number, complete the vehicle data form, and perform a safety check. II. TEST DESCRIPTION
The test consists of assigning a bus test number to the bus, cleaning the bus, completing the vehicle data form, obtaining any special information and tools from the manufacturer, determining a testing schedule, performing an initial safety check, and performing the manufacturer's recommended preventive maintenance. The bus manufacturer must certify that the bus meets all Federal regulations. III. DISCUSSION
The check-in procedure is used to identify in detail the major components and configuration of the bus.
The test bus consists of a Trans Tech, model Student Safety Transporter (SST). The bus has an OEM driver’s door and passenger entrance rear of the front axle. Power is provided by a gasoline-fueled, GMC 6.0 L engine coupled to a GMC Hydra-Matic 6L90 transmission.
The measured curb weight is 3,380 lbs for the front axle and 4,650 lbs for the rear axle. These combined weights provide a total measured curb weight of 8,030 lbs. There are 15 seats including the driver. (This test bus is not designed to accommodate standing passengers). Gross load is 150 lbs x 15 = 2,250 lbs. At full capacity, the measured gross vehicle weight is 10,260 lbs.
Effective January 1, 2010 the Federal Transit Administration determined that the total number of simulated passengers used for loading all test vehicles will be based on the full complement of seats and free-floor space available for standing passengers (150 lbs per passenger). The passenger loading used for dynamic testing will not be reduced in order to comply with Gross Axle Weight Ratings (GAWR’s) or the Gross Vehicle Weight Ratings (GVWR’s) declared by the manufacturer. Cases where the loading exceeds the GAWR and/or the GVWR will be noted accordingly. During the testing program, all test vehicles transported or operated over public roadways will be loaded to comply with the GAWR and GVWR specified by the manufacturer.
Page 8 of 107
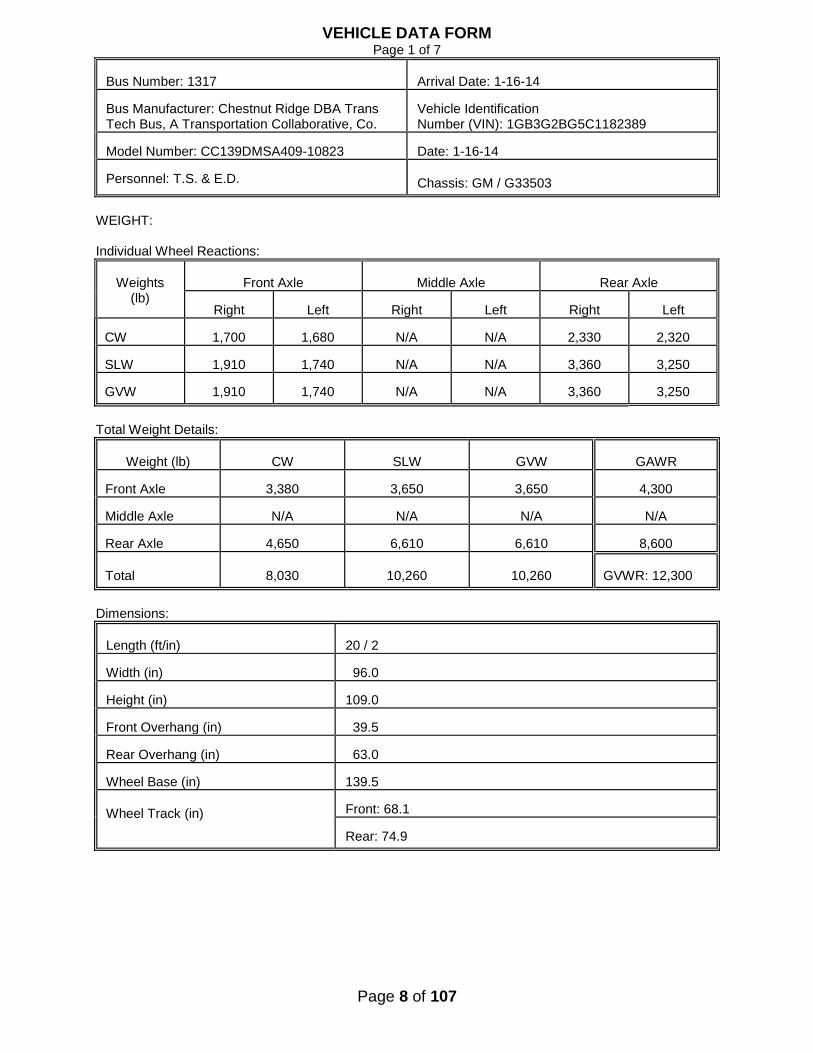
VEHICLE DATA FORM Page 1 of 7
Bus Number: 1317
Arrival Date: 1-16-14
Bus Manufacturer: Chestnut Ridge DBA Trans Tech Bus, A Transportation Collaborative, Co.
Vehicle Identification Number (VIN): 1GB3G2BG5C1182389
Model Number: CC139DMSA409-10823
Date: 1-16-14
Personnel: T.S. & E.D.
Chassis: GM / G33503
WEIGHT: Individual Wheel Reactions:
Weights
(lb)
Front Axle
Middle Axle
Rear Axle
Right
Left
Right
Left
Right
Left
CW
1,700
1,680
N/A
N/A
2,330
2,320
SLW
1,910
1,740
N/A
N/A
3,360
3,250
GVW
1,910
1,740
N/A
N/A
3,360
3,250
Total Weight Details:
Weight (lb)
CW
SLW
GVW
GAWR
Front Axle
3,380
3,650
3,650
4,300
Middle Axle
N/A
N/A
N/A
N/A
Rear Axle
4,650
6,610
6,610
8,600
Total
8,030
10,260
10,260
GVWR: 12,300
Dimensions:
Length (ft/in)
20 / 2
Width (in)
96.0
Height (in)
109.0
Front Overhang (in)
39.5
Rear Overhang (in)
63.0
Wheel Base (in)
139.5
Wheel Track (in)
Front: 68.1 Rear: 74.9
Page 9 of 107
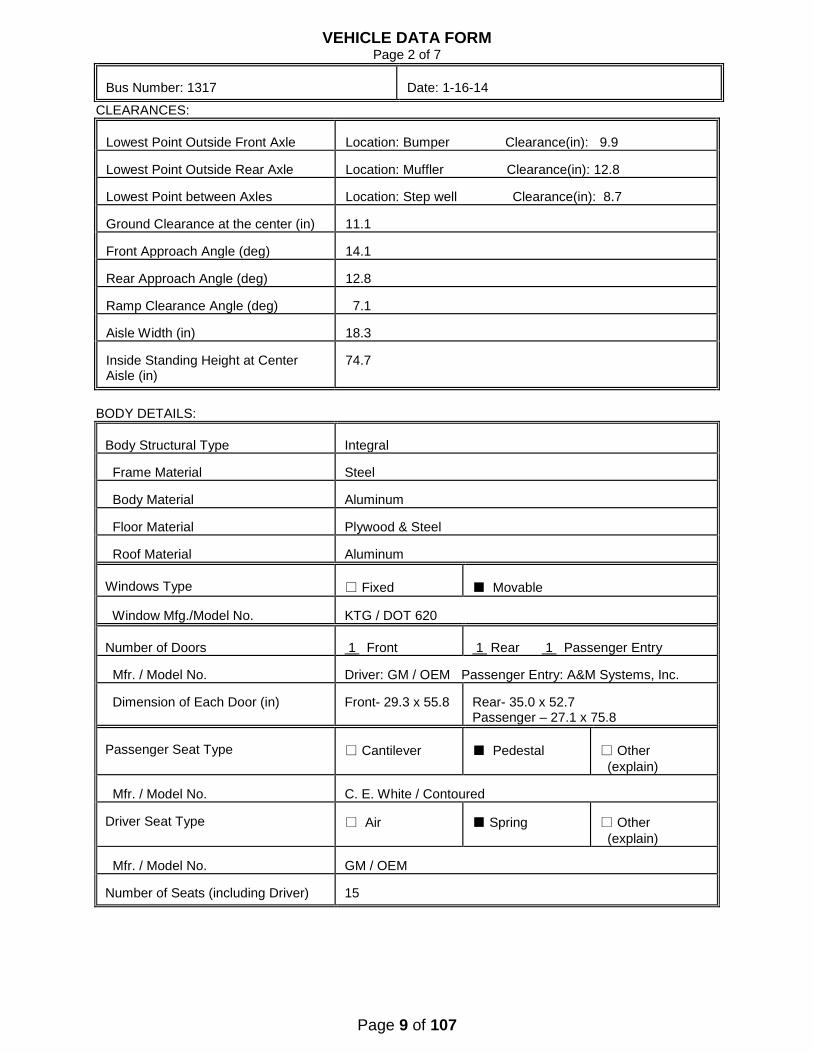
VEHICLE DATA FORM Page 2 of 7
CLEARANCES:
Lowest Point Outside Front Axle
Location: Bumper Clearance(in): 9.9
Lowest Point Outside Rear Axle
Location: Muffler Clearance(in): 12.8
Lowest Point between Axles
Location: Step well Clearance(in): 8.7
Ground Clearance at the center (in)
11.1
Front Approach Angle (deg)
14.1
Rear Approach Angle (deg)
12.8
Ramp Clearance Angle (deg)
7.1
Aisle Width (in)
18.3
Inside Standing Height at Center Aisle (in)
74.7
BODY DETAILS:
Body Structural Type
Integral
Frame Material
Steel
Body Material
Aluminum
Floor Material
Plywood & Steel
Roof Material
Aluminum
Windows Type
□ Fixed
■ Movable Window Mfg./Model No.
KTG / DOT 620
Number of Doors
1 Front
1 Rear 1 Passenger Entry
Mfr. / Model No.
Driver: GM / OEM Passenger Entry: A&M Systems, Inc.
Dimension of Each Door (in)
Front- 29.3 x 55.8
Rear- 35.0 x 52.7 Passenger – 27.1 x 75.8
Passenger Seat Type
□ Cantilever
■ Pedestal
□ Other
(explain) Mfr. / Model No.
C. E. White / Contoured
Driver Seat Type
□ Air
■ Spring
□ Other
(explain) Mfr. / Model No.
GM / OEM
Number of Seats (including Driver)
15
Bus Number: 1317
Date: 1-16-14
Page 10 of 107
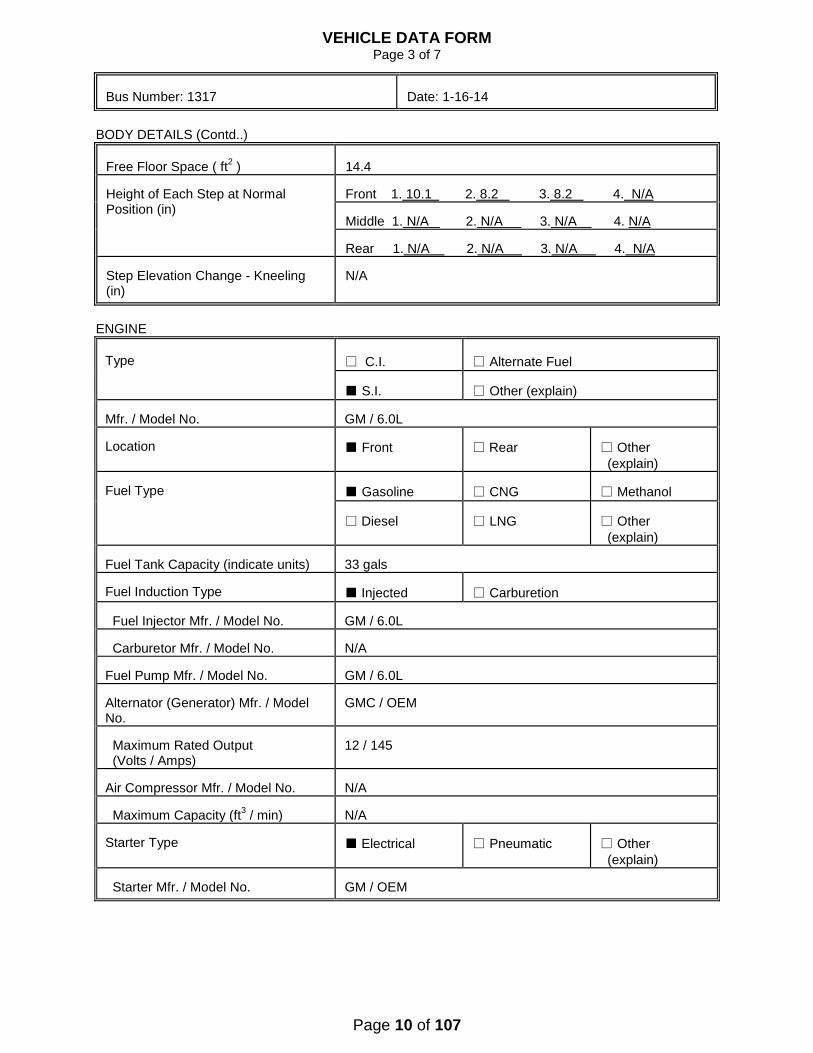
VEHICLE DATA FORM Page 3 of 7
BODY DETAILS (Contd..)
Free Floor Space ( ft
2 )
14.4
Height of Each Step at Normal Position (in)
Front 1. 10.1 2. 8.2 3. 8.2 4. N/A Middle 1. N/A 2. N/A 3. N/A 4. N/A Rear 1. N/A 2. N/A 3. N/A 4. N/A
Step Elevation Change - Kneeling (in)
N/A
ENGINE
Type
□ C.I.
□ Alternate Fuel
■ S.I.
□ Other (explain) Mfr. / Model No.
GM / 6.0L
Location
■ Front
□Rear
□ Other
(explain) Fuel Type
■ Gasoline
□ CNG
□ Methanol
□Diesel
□ LNG
□ Other
(explain) Fuel Tank Capacity (indicate units)
33 gals
Fuel Induction Type
■Injected
□ Carburetion Fuel Injector Mfr. / Model No.
GM / 6.0L
Carburetor Mfr. / Model No.
N/A
Fuel Pump Mfr. / Model No.
GM / 6.0L
Alternator (Generator) Mfr. / Model No.
GMC / OEM
Maximum Rated Output (Volts / Amps)
12 / 145
Air Compressor Mfr. / Model No.
N/A
Maximum Capacity (ft
3 / min)
N/A
Starter Type
■Electrical
□ Pneumatic
□ Other
(explain) Starter Mfr. / Model No.
GM / OEM
Bus Number: 1317
Date: 1-16-14

Page 11 of 107
VEHICLE DATA FORM Page 4 of 7
TRANSMISSION
Transmission Type
□ Manual
■Automatic Mfr. / Model No.
GMC / Hydra-Matic 6L90
Control Type
■ Mechanical
□Electrical
□ Other
Torque Converter Mfr. / Model No.
GMC / Hydra-Matic 6L90
Integral Retarder Mfr. / Model No.
N/A
SUSPENSION
Number of Axles
2
Front Axle Type
■ Independent
□Beam Axle Mfr. / Model No.
GMC / 4,300 lbs.
Axle Ratio (if driven)
N/A
Suspension Type
□Air
■ Spring
□ Other
(explain) No. of Shock Absorbers
2
Mfr. / Model No.
AAFX / 20956374
Middle Axle Type
□ Independent
□ Beam Axle Mfr. / Model No.
N/A
Axle Ratio (if driven)
N/A
Suspension Type
□ Air
□ Spring
□ Other
(explain) No. of Shock Absorbers
N/A
Mfr. / Model No.
N/A
Rear Axle Type
□ Independent
■Beam Axle Mfr. / Model No.
GMC / 6,084 lbs.
Axle Ratio (if driven)
3:73
Suspension Type
□Air
■ Spring
□ Other
(explain) No. of Shock Absorbers
2
Mfr. / Model No.
AASP / 20956379
Bus Number: 1317
Date: 1-16-14
Page 12 of 107
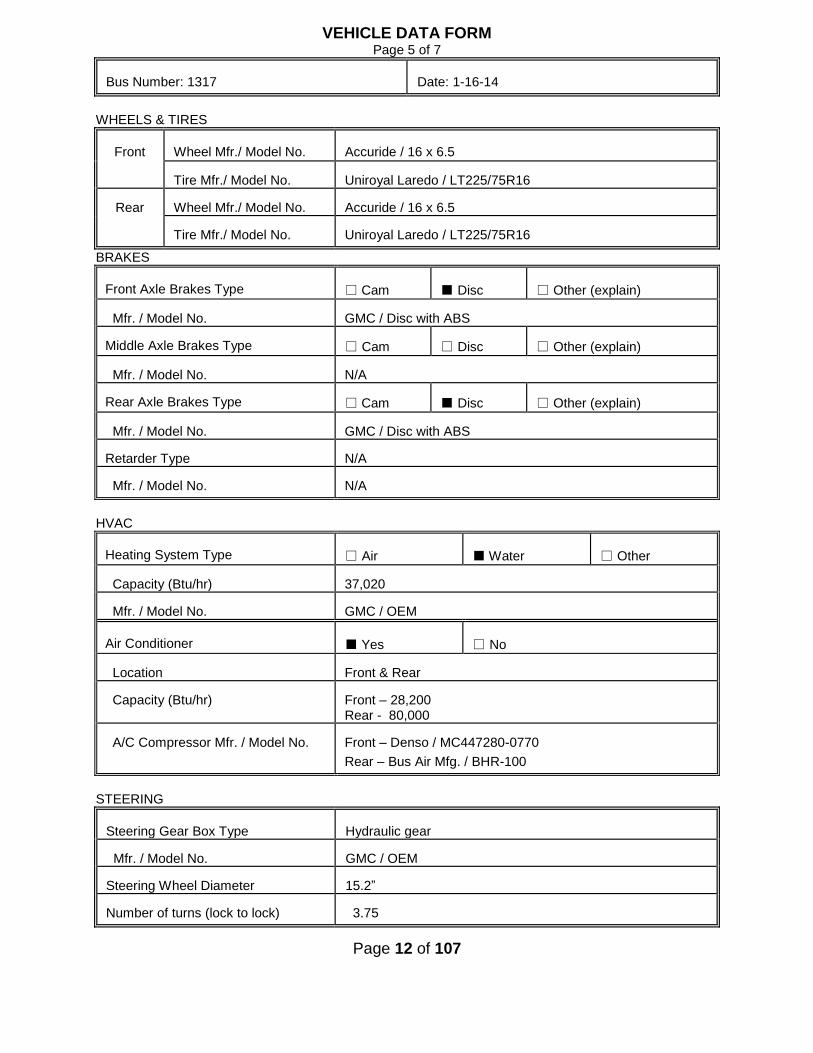
VEHICLE DATA FORM Page 5 of 7
Bus Number: 1317
Date: 1-16-14
WHEELS & TIRES
Front
Wheel Mfr./ Model No.
Accuride / 16 x 6.5
Tire Mfr./ Model No.
Uniroyal Laredo / LT225/75R16
Rear
Wheel Mfr./ Model No.
Accuride / 16 x 6.5
Tire Mfr./ Model No.
Uniroyal Laredo / LT225/75R16
BRAKES
Front Axle Brakes Type
□Cam
■ Disc
□ Other (explain) Mfr. / Model No.
GMC / Disc with ABS
Middle Axle Brakes Type
□ Cam
□ Disc
□ Other (explain) Mfr. / Model No.
N/A
Rear Axle Brakes Type
□Cam
■ Disc
□ Other (explain)
Mfr. / Model No.
GMC / Disc with ABS
Retarder Type
N/A
Mfr. / Model No.
N/A
HVAC
Heating System Type
□ Air
■Water
□ Other Capacity (Btu/hr)
37,020
Mfr. / Model No.
GMC / OEM
Air Conditioner
■Yes
□ No Location
Front & Rear
Capacity (Btu/hr)
Front – 28,200 Rear - 80,000
A/C Compressor Mfr. / Model No.
Front – Denso / MC447280-0770
Rear – Bus Air Mfg. / BHR-100
STEERING
Steering Gear Box Type
Hydraulic gear
Mfr. / Model No.
GMC / OEM
Steering Wheel Diameter
15.2”
Number of turns (lock to lock)
3.75
Page 13 of 107
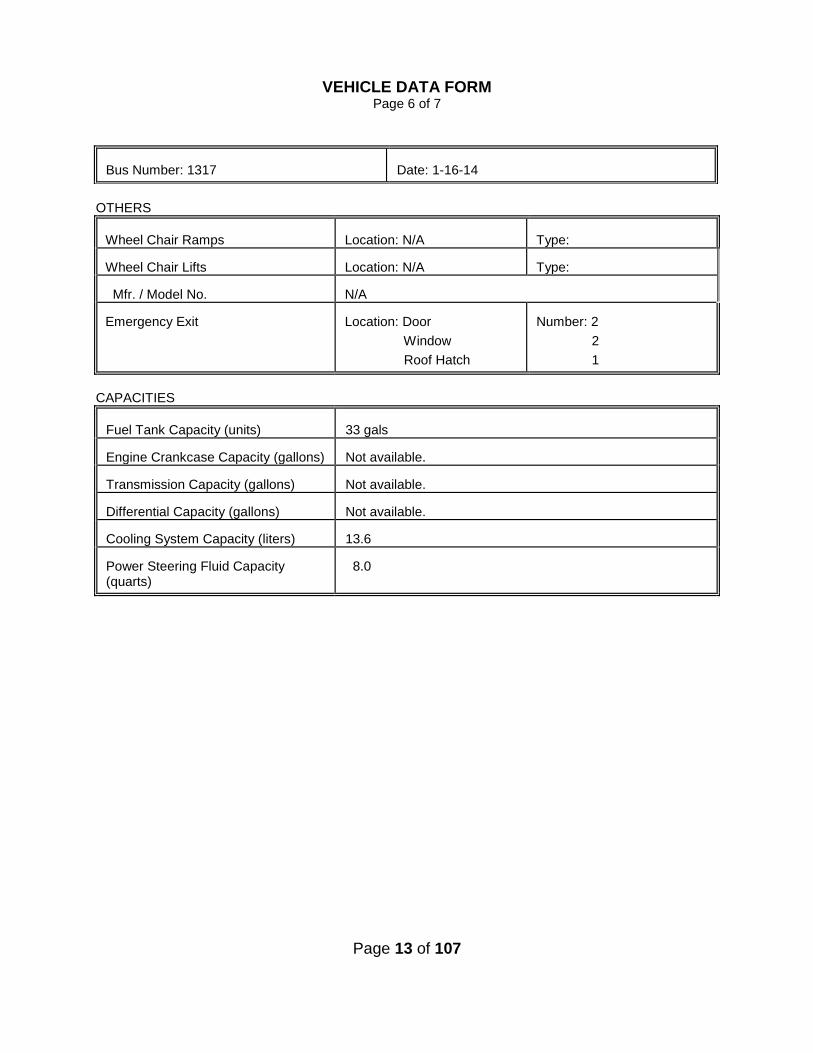
VEHICLE DATA FORM Page 6 of 7
OTHERS
Wheel Chair Ramps
Location: N/A
Type:
Wheel Chair Lifts
Location: N/A
Type:
Mfr. / Model No.
N/A
Emergency Exit
Location: Door
Window
Roof Hatch
Number: 2
2
1
CAPACITIES
Fuel Tank Capacity (units)
33 gals
Engine Crankcase Capacity (gallons)
Not available.
Transmission Capacity (gallons)
Not available.
Differential Capacity (gallons)
Not available.
Cooling System Capacity (liters)
13.6
Power Steering Fluid Capacity (quarts)
8.0
Bus Number: 1317
Date: 1-16-14

Page 14 of 107
VEHICLE DATA FORM
Page 7 of 7
Bus Number: 1317
Date: 1-16-14
List all spare parts, tools and manuals delivered with the bus.
Part Number
Description
Qty.
None noted
Page 15 of 107
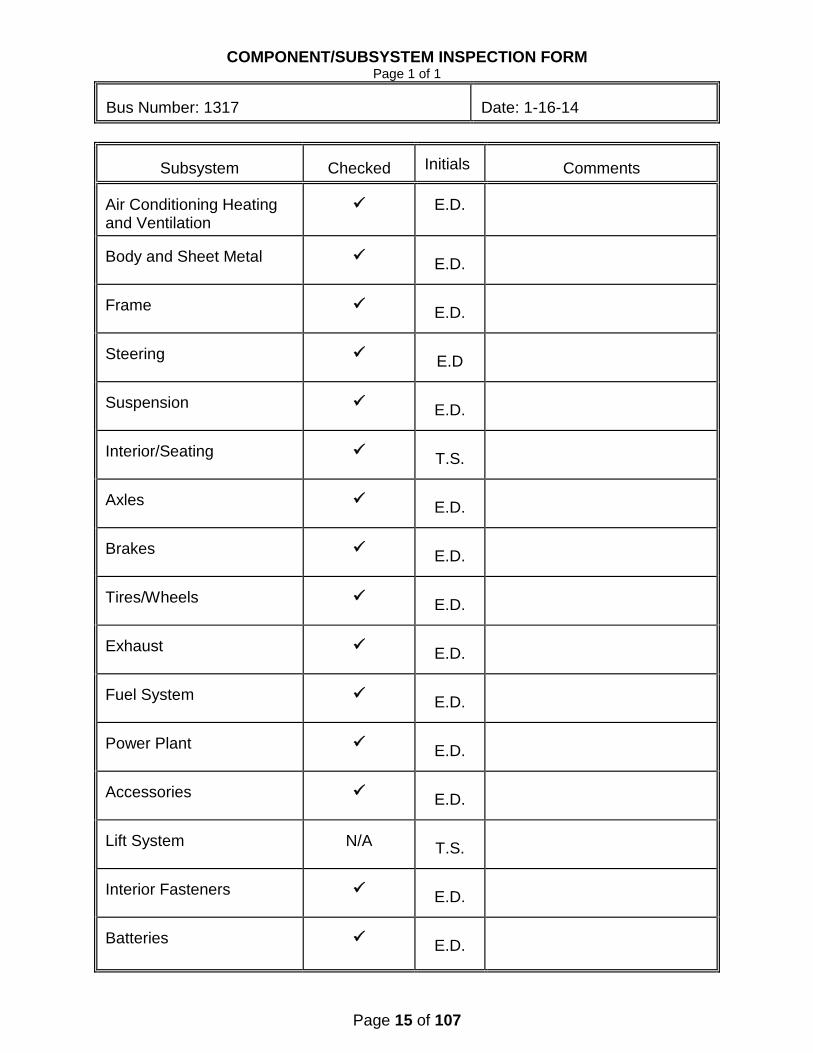
COMPONENT/SUBSYSTEM INSPECTION FORM Page 1 of 1
Bus Number: 1317
Date: 1-16-14
Subsystem
Checked
Initials
Comments
Air Conditioning Heating and Ventilation
E.D.
Body and Sheet Metal
E.D.
Frame
E.D.
Steering
E.D
Suspension
E.D.
Interior/Seating
T.S.
Axles
E.D.
Brakes
E.D.
Tires/Wheels
E.D.
Exhaust
E.D.
Fuel System
E.D.
Power Plant
E.D.
Accessories
E.D.
Lift System
N/A
T.S.
Interior Fasteners
E.D.
Batteries
E.D.
Page 16 of 107
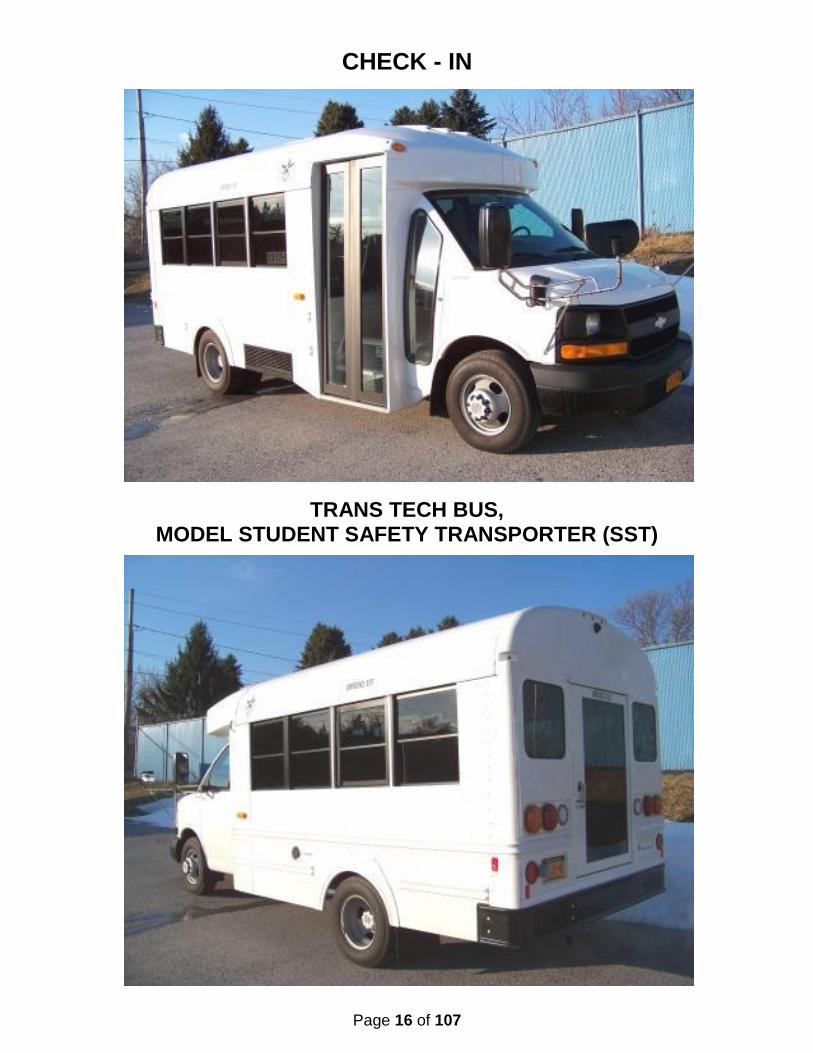
CHECK - IN
TRANS TECH BUS, MODEL STUDENT SAFETY TRANSPORTER (SST)
Page 17 of 107
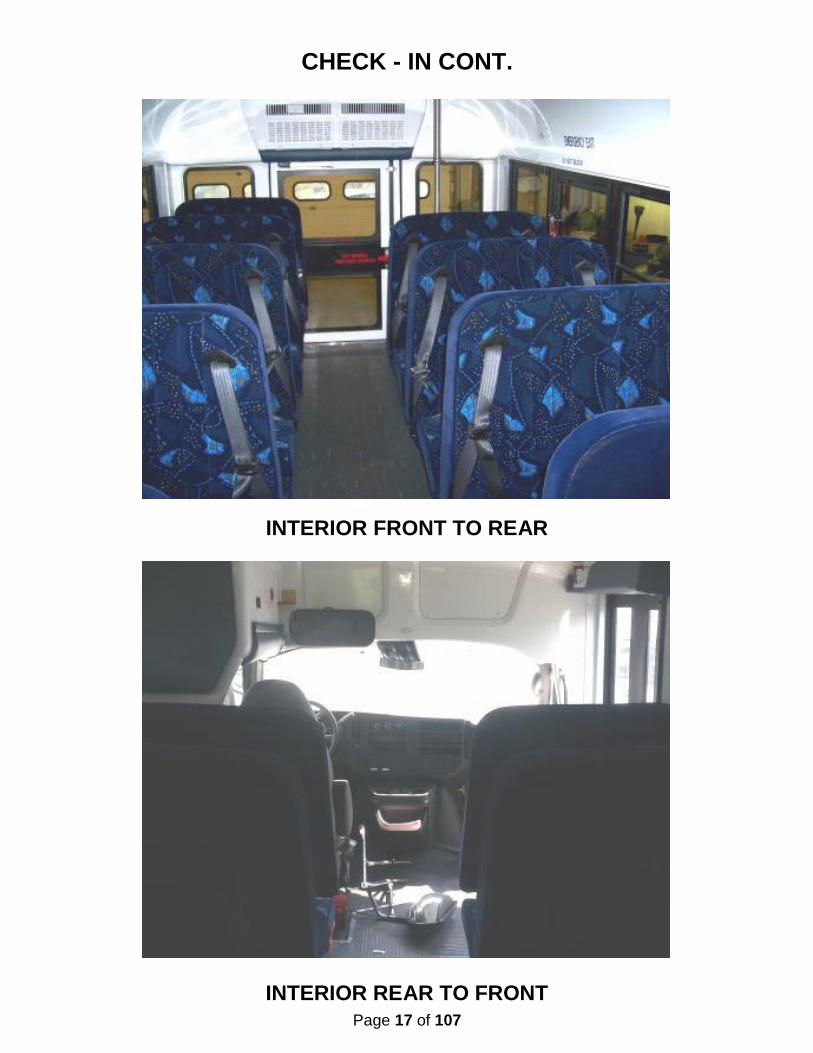
CHECK - IN CONT.
INTERIOR FRONT TO REAR
INTERIOR REAR TO FRONT

Page 18 of 107
CHECK - IN CONT.
OPERATOR’S AREA
VIN TAG

Page 19 of 107
CHECK - IN CONT.
ENGINE COMPARTMENT
ENGINE UNDERCARRIAGE
Page 20 of 107
1. MAINTAINABILITY 1.1 ACCESSIBILITY OF COMPONENTS AND SUBSYSTEMS 1.1-I. TEST OBJECTIVE
The objective of this test is to check the accessibility of components and subsystems. 1.1-II. TEST DESCRIPTION
Accessibility of components and subsystems is checked, and where accessibility is restricted the subsystem is noted along with the reason for the restriction. 1.1-III. DISCUSSION
Accessibility, in general, was adequate. Components covered in Section 1.3 (repair and/or replacement of selected subsystems), along with all other components encountered during testing, were found to be readily accessible and no restrictions were noted.
Page 21 of 107
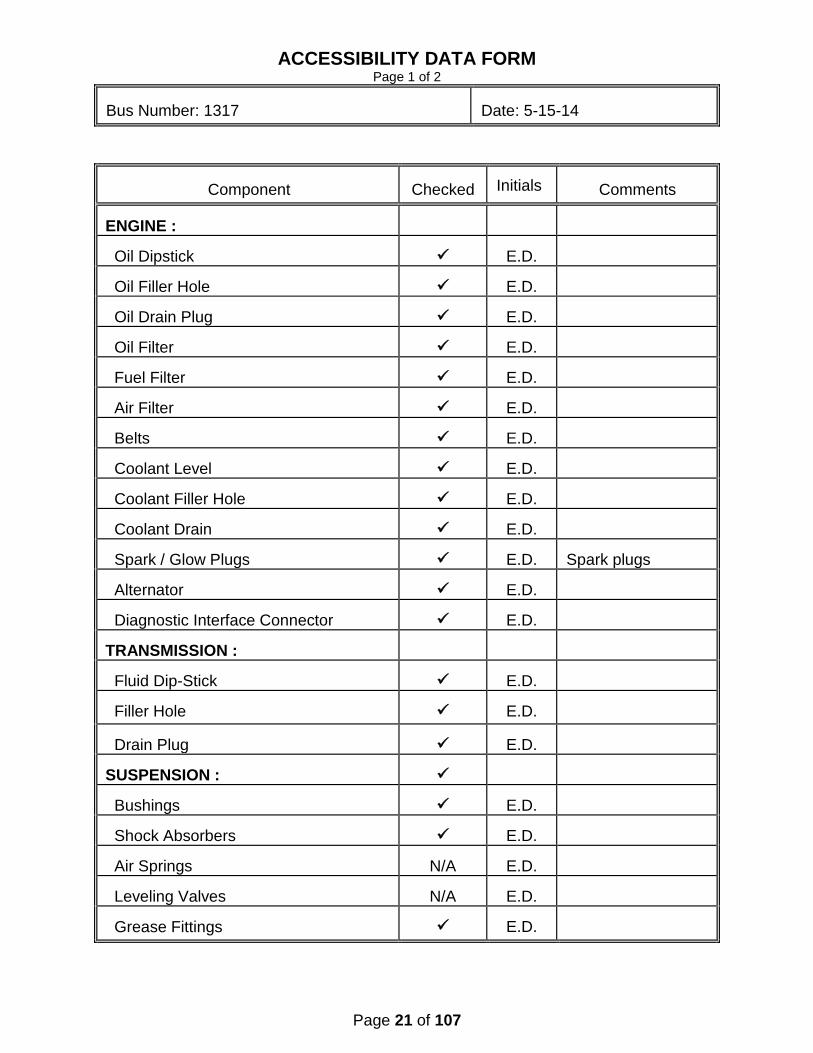
ACCESSIBILITY DATA FORM Page 1 of 2
Bus Number: 1317
Date: 5-15-14
Component
Checked
Initials
Comments
ENGINE :
Oil Dipstick
E.D.
Oil Filler Hole
E.D.
Oil Drain Plug
E.D.
Oil Filter
E.D.
Fuel Filter
E.D.
Air Filter
E.D.
Belts
E.D.
Coolant Level
E.D.
Coolant Filler Hole
E.D.
Coolant Drain
E.D.
Spark / Glow Plugs
E.D.
Spark plugs
Alternator
E.D.
Diagnostic Interface Connector
E.D.
TRANSMISSION :
Fluid Dip-Stick
E.D.
Filler Hole
E.D.
Drain Plug
E.D.
SUSPENSION :
Bushings
E.D.
Shock Absorbers
E.D.
Air Springs
N/A
E.D.
Leveling Valves
N/A
E.D.
Grease Fittings
E.D.
Page 22 of 107
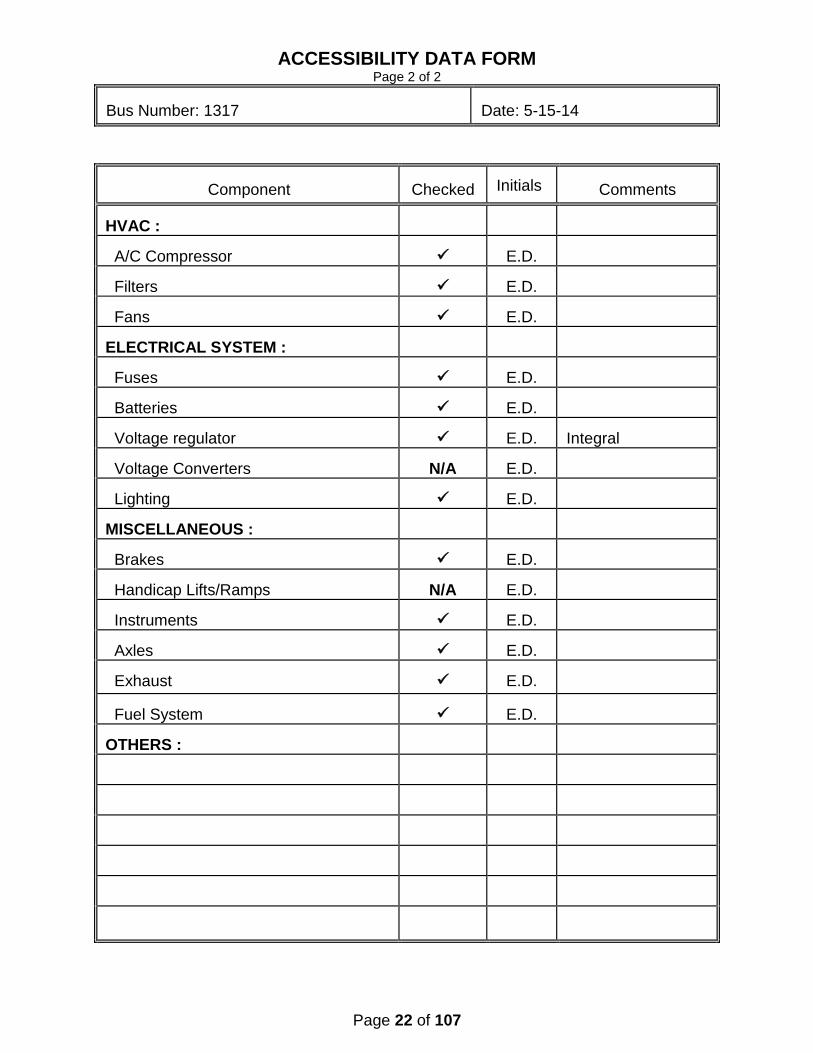
ACCESSIBILITY DATA FORM Page 2 of 2
Bus Number: 1317
Date: 5-15-14
Component
Checked
Initials
Comments
HVAC :
A/C Compressor
E.D.
Filters
E.D.
Fans
E.D.
ELECTRICAL SYSTEM :
Fuses
E.D.
Batteries
E.D.
Voltage regulator
E.D.
Integral
Voltage Converters
N/A
E.D.
Lighting
E.D.
MISCELLANEOUS :
Brakes
E.D.
Handicap Lifts/Ramps
N/A
E.D.
Instruments
E.D.
Axles
E.D.
Exhaust
E.D.
Fuel System
E.D.
OTHERS :

Page 23 of 107
1.2 SERVICING, PREVENTIVE MAINTENANCE, AND REPAIR AND MAINTENANCE DURING TESTING 1.2-I. TEST OBJECTIVE
The objective of this test is to collect maintenance data about the servicing, preventive maintenance, and repair. 1.2.-II. TEST DESCRIPTION
The test will be conducted by operating the NBM and collecting the following data on work order forms and a driver log.
1. Unscheduled Maintenance a. Bus number b. Date c. Mileage d. Description of malfunction e. Location of malfunction (e.g., in service or undergoing inspection) f. Repair action and parts used g. Man-hours required
2. Scheduled Maintenance
a. Bus number b. Date c. Mileage d. Engine running time (if available) e. Results of scheduled inspections f. Description of malfunction (if any) g. Repair action and parts used (if any) h. Man-hours required
The buses will be operated in accelerated durability service. While typical items
are given below, the specific service schedule will be that specified by the manufacturer.
A. Service 1. Fueling 2. Consumable checks 3. Interior cleaning
B. Preventive Maintenance
4. Brake adjustments 5. Lubrication 6. 3,000 mi (or equivalent) inspection
Page 24 of 107
7. Oil and filter change inspection 8. Major inspection 9. Tune-up
C. Periodic Repairs
1. Brake reline 2. Transmission change 3. Engine change 4. Windshield wiper motor change 5. Stoplight bulb change 6. Towing operations 7. Hoisting operations
1.2-III. DISCUSSION
Servicing and preventive maintenance were performed at manufacturer-specified intervals. The following Scheduled Maintenance Form lists the mileage, items serviced, the service interval, and amount of time required to perform the maintenance. Table 1 is a list of the lubricating products used in servicing. Finally, the Unscheduled Maintenance List along with Unscheduled Maintenance-related photographs is included in Section 5.7, Structural Durability. This list supplies information related to failures that occurred during the durability portion of testing. The Unscheduled Maintenance List includes the date and mileage at which the malfunction occurred, a description of the malfunction and repair, and the time required to perform the repair. This test bus encountered no failures.

Page 25 of 107

Page 26 of 107
1.3 REPLACEMENT AND/OR REPAIR OF SELECTED SUBSYSTEMS 1.3-I. TEST OBJECTIVE
The objective of this test is to establish the time required to replace and/or repair selected subsystems. 1.3-II. TEST DESCRIPTION
The test will involve components that may be expected to fail or require replacement during the service life of the bus. In addition, any component that fails during the NBM testing is added to this list. Components to be included are:
1. Transmission 2. Alternator 3. Starter 4. Batteries 5. Windshield wiper motor
1.3-III. DISCUSSION
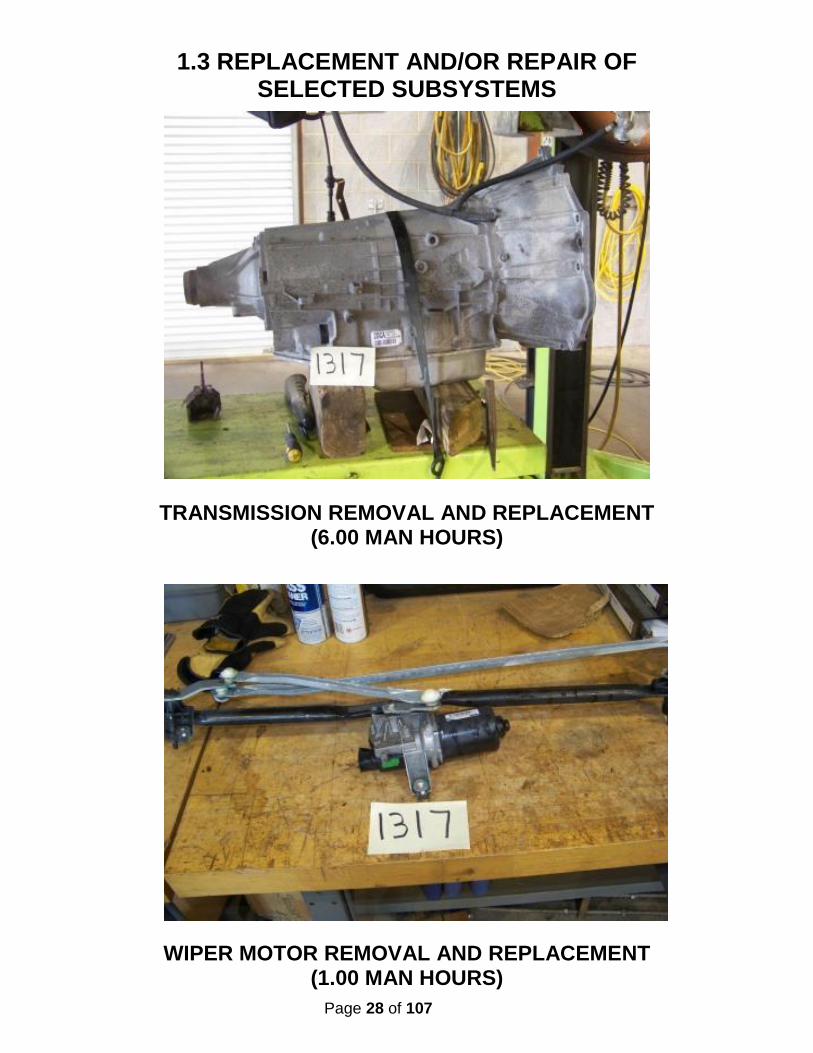
At the end of the test, the remaining items on the list were removed and replaced. The transmission assembly took 6.00 man-hours (two men 3.00 hrs.) to remove and replace. The time required for repair/replacement of the four remaining components is given on the following Repair and/or Replacement Form.

Page 27 of 107
REPLACEMENT AND/OR REPAIR FORM Page 1 of 1
Subsystem
Replacement Time
Transmission
6.00 man hours
Wiper Motor
1.00 man hours
Starter
1.00 man hours
Alternator
2.00 man hours
Batteries
0.50man hours
Page 28 of 107
1.3 REPLACEMENT AND/OR REPAIR OF
SELECTED SUBSYSTEMS
TRANSMISSION REMOVAL AND REPLACEMENT (6.00 MAN HOURS)
WIPER MOTOR REMOVAL AND REPLACEMENT (1.00 MAN HOURS)
Page 29 of 107
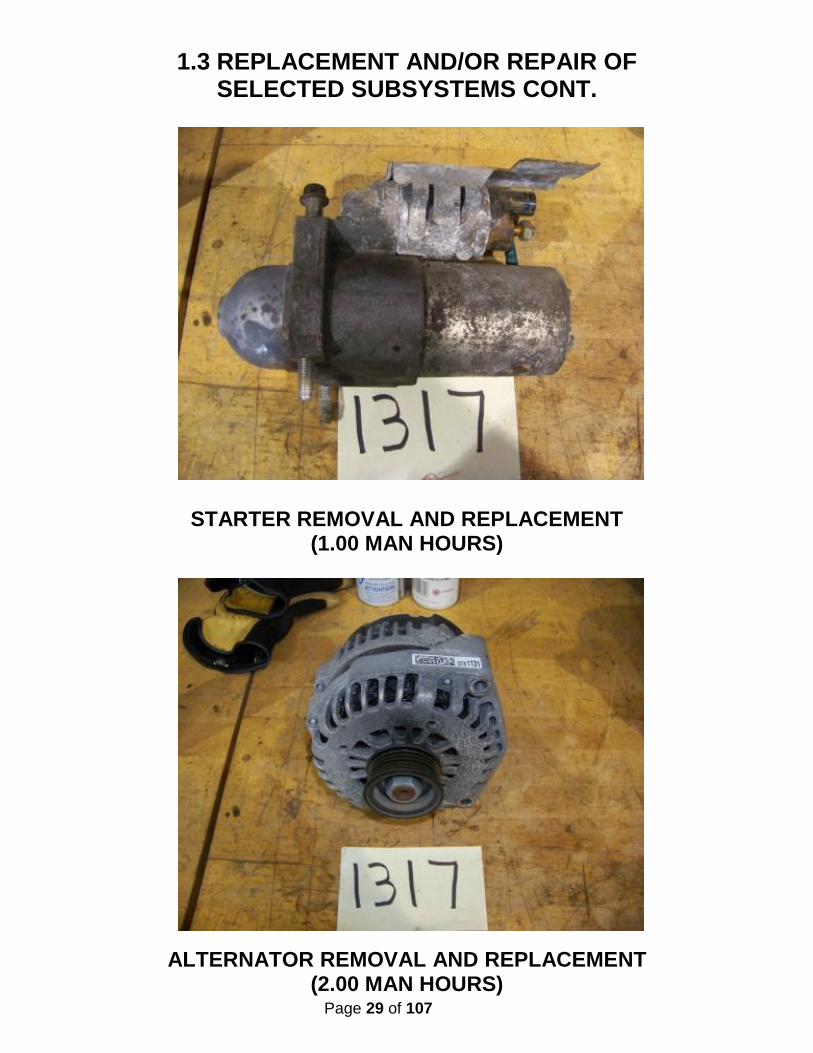
1.3 REPLACEMENT AND/OR REPAIR OF
SELECTED SUBSYSTEMS CONT.
STARTER REMOVAL AND REPLACEMENT (1.00 MAN HOURS) ALTERNATOR REMOVAL AND REPLACEMENT (2.00 MAN HOURS)

Page 30 of 107
2. RELIABILITY - DOCUMENTATION OF BREAKDOWN AND REPAIR TIMES DURING TESTING 2-I. TEST OBJECTIVE
The objective of this test is to document unscheduled breakdowns, repairs, down time, and repair time that occur during testing. 2-II. TEST DESCRIPTION
Using the driver log and unscheduled work order forms, all significant breakdowns, repairs, man-hours to repair, and hours out of service are recorded on the Reliability Data Form. CLASS OF FAILURES
Classes of failures are described below: (a) Class 1: Physical Safety. A failure that could lead directly to passenger or driver injury and represents a severe crash situation. (b) Class 2: Road Call. A failure resulting in an en route interruption of revenue service. Service is discontinued until the bus is replaced or repaired at the point of failure. (c) Class 3: Bus Change. A failure that requires removal of the bus from service during its assignments. The bus is operable to a rendezvous point with a replacement bus. (d) Class 4: Bad Order. A failure that does not require removal of the bus from service during its assignments but does degrade coach operation. The failure shall be reported by driver, inspector, or hostler. 2-III. DISCUSSION
A listing of breakdowns and unscheduled repairs is accumulated during the Structural Durability Test. A Reliability Data Form lists all unscheduled repairs under classes as defined above. These classifications are somewhat subjective as the test is performed on a test track with careful inspections every two hours. However, even on the road, there is considerable latitude on deciding how to handle many failures.
The classification of repairs according to subsystem is intended to emphasize those systems which had persistent minor or more serious problems. There were no failures recorded during the Structural Durability Test.
Page 31 of 107
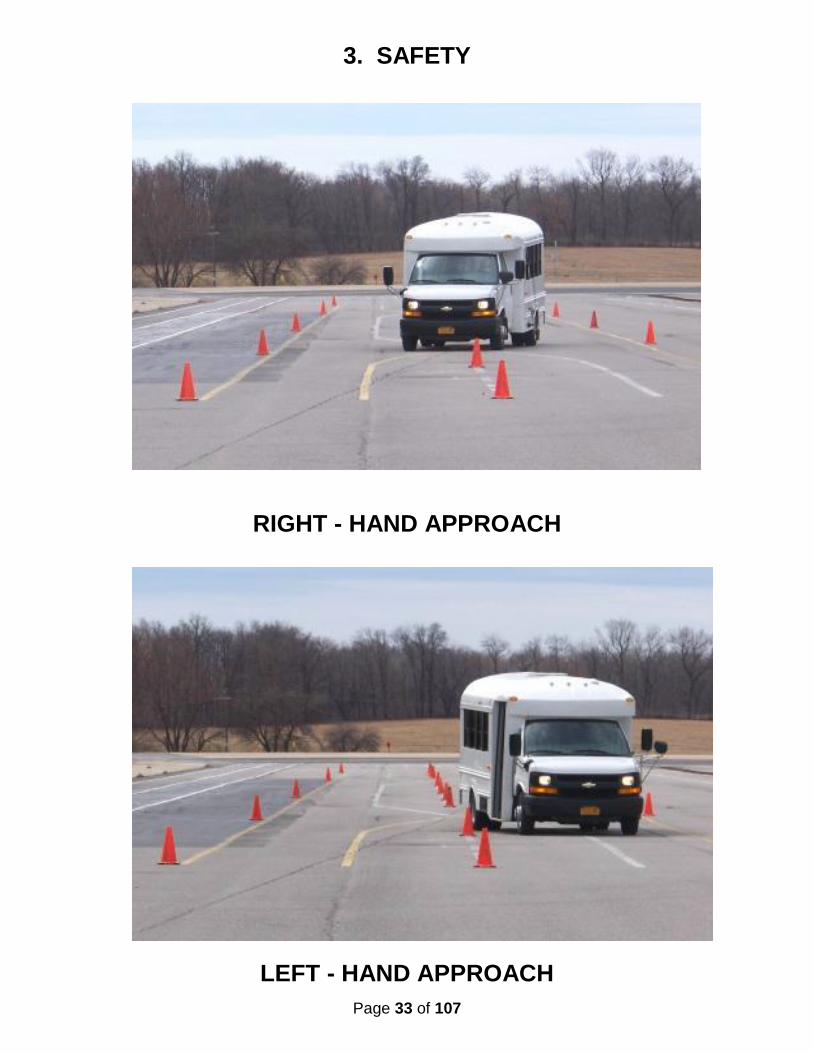
3. SAFETY - A DOUBLE-LANE CHANGE (OBSTACLE AVOIDANCE) 3-I. TEST OBJECTIVE
The objective of this test is to determine handling and stability of the bus by measuring speed through a double lane change test. 3-II. TEST DESCRIPTION
The Safety Test is a vehicle handling and stability test. The bus will be operated at SLW on a smooth and level test track. The bus will be driven through a double lane change course at increasing speed until the test is considered unsafe or a speed of 45 mph is reached. The lane change course will be set up using pylons to mark off two 12 foot center to center lanes with two 100 foot lane change areas 100 feet apart. The bus will begin in one lane, change to the other lane in a 100 foot span, travel 100 feet, and return to the original lane in another 100 foot span. This procedure will be repeated, starting first in the right-hand and then in the left-hand lane. 3-III. DISCUSSION
The double-lane change was performed in both right-hand and left-hand directions. The bus was able to safely negotiate the test course in both the right-hand and left-hand directions up to the maximum test speed of 45 mph.

Page 32 of 107
SAFETY DATA FORM
Page 1 of 1
Bus Number: 1317
Date: 4-1-14
Personnel: T.S., S.R. & M.H.
Temperature (°F): 54
Humidity (%): 29
Wind Direction: SW
Wind Speed (mph): 8
Barometric Pressure (in.Hg): 30.05
SAFETY TEST: DOUBLE LANE CHANGE
Maximum safe speed tested for double-lane change to left
45 mph
Maximum safe speed tested for double-lane change to right
45 mph
Comments of the position of the bus during the lane change: The bus maintained its position in the lanes through all portions of testing. Comments of the tire/ground contact patch: The tires maintained ground contact through all portions of testing.
Page 33 of 107
3. SAFETY
RIGHT - HAND APPROACH
LEFT - HAND APPROACH
Page 34 of 107
4.1 PERFORMANCE - AN ACCELERATION, GRADEABILITY, AND TOP SPEED TEST 4-I. TEST OBJECTIVE
The objective of this test is to determine the acceleration, gradeability, and top speed capabilities of the bus. 4-II. TEST DESCRIPTION
In this test, the bus will be operated at SLW on the skid pad at the PSBRTF. The bus will be accelerated at full throttle from a standstill to a maximum "geared" or "safe" speed as determined by the test driver. The vehicle speed is measured using a Correvit non-contacting speed sensor. The times to reach speed between ten mile per hour increments are measured and recorded using a stopwatch with a lap timer. The time to speed data will be recorded on the Performance Data Form and later used to generate a speed vs. time plot and gradeability calculations. 4-III. DISCUSSION
This test consists of three runs in both the clockwise and counterclockwise directions on the Test Track. Velocity versus time data is obtained for each run and results are averaged together to minimize any test variability which might be introduced by wind or other external factors. The test was performed up to a maximum speed of 50 mph. The fitted curve of velocity vs. time is attached, followed by the calculated gradeability results. The average time to obtain 50 mph was 10.14 seconds. Top speed obtained on the dynamometer was 80 mph.

Page 35 of 107
PERFORMANCE DATA FORM Page 1 of 1
Bus Number: 1317
Date: 4-2-14
Personnel: T.S., S.R. & M.Z.
Temperature (°F): 50
Humidity (%): 43
Wind Direction: SW
Wind Speed (mph): 5
Barometric Pressure (in.Hg): 30.08
INITIALS:
Air Conditioning compressor-OFF
Checked
T.S.
Ventilation fans-ON HIGH
Checked
T.S. Heater pump motor-Off
Checked
T.S. Defroster-OFF
Checked
T.S. Exterior and interior lights-ON
Checked
T.S. Windows and doors-CLOSED
Checked
T.S.
ACCELERATION, GRADEABILITY, TOP SPEED
Counter Clockwise Recorded Interval Times
Speed
Run 1
Run 2
Run 3
10 mph
1.82
1.89
1.83
20 mph
3.37
3.63
3.60
30 mph
5.37
5.45
5.07
40 mph
7.23
7.75
7.47
Top Test Speed(mph) 50
10.35
10.44
10.22
Clockwise Recorded Interval Times
Speed
Run 1
Run 2
Run 3
10 mph
1.68
1.81
1.75
20 mph
3.34
3.51
3.53
30 mph
5.17
5.22
5.02
40 mph
7.62
7.49
7.52
Top Test Speed(mph) 50
9.94
9.98
9.91

Page 36 of 107

Page 37 of 107
Page 38 of 107
4.0 PERFORMANCE
4.2 Performance - Bus Braking
4.2 I. TEST OBJECTIVE
The objective of this test is to provide, for comparison purposes, braking performance data on transit buses produced by different manufacturers.
4.2 II. TEST DESCRIPTION
The testing will be conducted at the PTI Test Track skid pad area. Brake tests will be conducted after completion of the GVW portion of the vehicle durability test. At this point in testing the brakes have been subjected to a large number of braking snubs and will be considered well burnished. Testing will be performed when the bus is fully loaded at its GVW. All tires on each bus must be representative of the tires on the production model vehicle The brake testing procedure comprises three phases:
1. Stopping distance tests
i. Dry surface (high-friction, Skid Number within the range of 70-76) ii. Wet surface (low-friction, Skid Number within the range of 30-36)
2. Stability tests 3. Parking brake test
Stopping Distance Tests
The stopping distance phase will evaluate service brake stops. All stopping distance tests on dry surface will be performed in a straight line and at the speeds of 20, 30, 40 and 45 mph. All stopping distance tests on wet surface will be performed in straight line at speed of 20 mph. The tests will be conducted as follows:
1. Uniform High Friction Tests: Four maximum deceleration straight-line brake applications each at 20, 30, 40 and 45 mph, to a full stop on a uniform high-friction surface in a 3.66-m (12-ft) wide lane.
2. Uniform Low Friction Tests: Four maximum deceleration straight-line
brake applications from 20 mph on a uniform low friction surface in a 3.66-m (12-ft) wide lane.
When performing service brake stops for both cases, the test vehicle is
accelerated on the bus test lane to the speed specified in the test procedure and this speed is maintained into the skid pad area. Upon entry of the appropriate lane of the skid pad area, the vehicle's service brake is applied to stop the vehicle as quickly as possible. The stopping distance is measured and recorded for both cases on the test
Page 39 of 107
data form. Stopping distance results on dry and wet surfaces will be recorded and the average of the four measured stopping distances will be considered as the measured stopping distance. Any deviation from the test lane will be recorded. Stability Tests
This test will be conducted in both directions on the test track. The test consists of four maximum deceleration, straight-line brake applications on a surface with split coefficients of friction (i.e., the wheels on one side run on high-friction SN 70-76 or more and the other side on low-friction [where the lower coefficient of friction should be less than half of the high one] at initial speed of 30 mph).
(I) The performance of the vehicle will be evaluated to determine if it is possible to keep the vehicle within a 3.66m (12 ft) wide lane, with the dividing line between the two surfaces in the lane’s center. The steering wheel input angle required to keep the vehicle in the lane during the maneuver will be reported.
Parking Brake Test
The parking brake phase utilizes the brake slope, which has a 20% grade. The test vehicle, at its GVW, is driven onto the brake slope and stopped. With the transmission in neutral, the parking brake is applied and the service brake is released. The test vehicle is required to remain stationary for five minutes. The parking brake test is performed with the vehicle facing uphill and downhill.
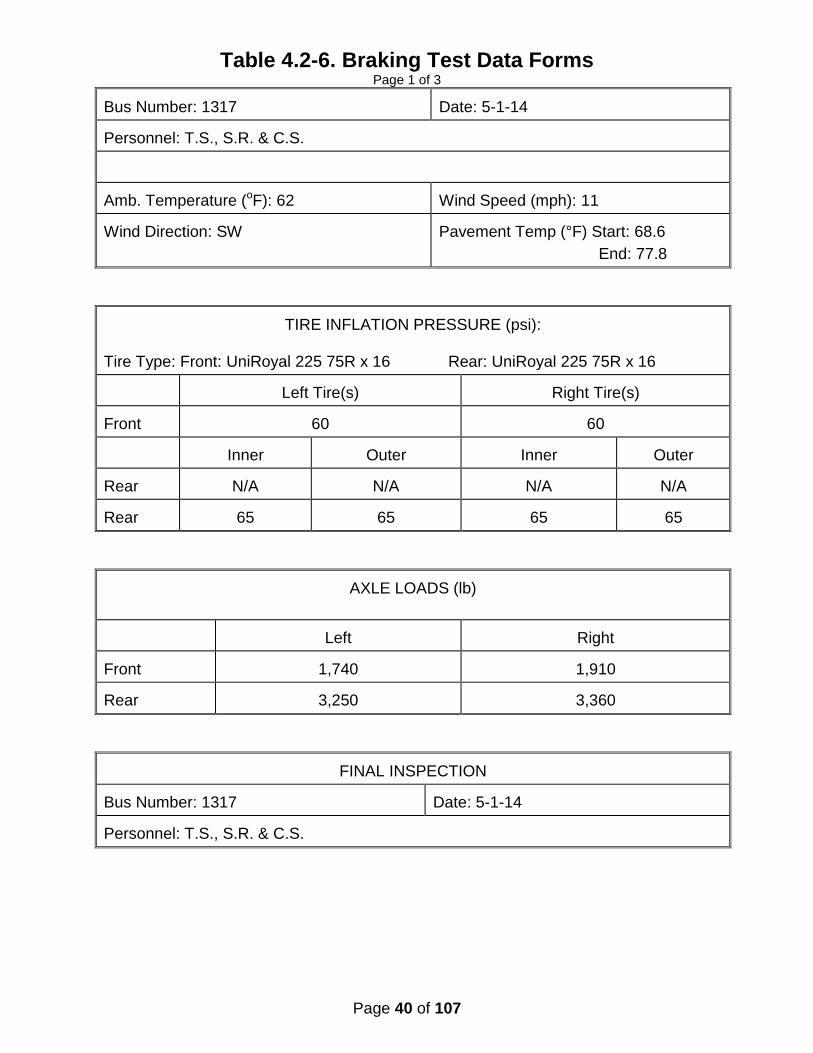
4.2-III. DISCUSSION The Stopping Distance phase of the Brake Test was completed with the following results; for the Uniform High Friction Test average stopping distances were 21.15’ at 20 mph, 42.62’ at 30 mph, 71.08’ at 40 mph and 88.50’ at 45 mph. The average stopping distance for the Uniform Low Friction Test was 22.80’ There was no deviation from the test lane during the performance of the Stopping Distance phase. During the Stability phase of Brake Testing the test bus experienced no deviation from the test lane but did experience pull to the left during both approaches to the Split Friction Road surface. The Parking Brake phase was completed with the test bus maintaining the parked position for the full five minute period with no slip or roll observed in both the uphill and downhill positions.
Page 40 of 107
Table 4.2-6. Braking Test Data Forms Page 1 of 3
Bus Number: 1317
Date: 5-1-14
Personnel: T.S., S.R. & C.S. Amb. Temperature (oF): 62
Wind Speed (mph): 11
Wind Direction: SW
Pavement Temp (°F) Start: 68.6
End: 77.8
TIRE INFLATION PRESSURE (psi):
Tire Type: Front: UniRoyal 225 75R x 16 Rear: UniRoyal 225 75R x 16
Left Tire(s)
Right Tire(s)
Front
60
60
Inner
Outer
Inner
Outer
Rear
N/A
N/A
N/A
N/A
Rear
65
65
65
65
AXLE LOADS (lb)
Left
Right
Front
1,740
1,910
Rear
3,250
3,360
FINAL INSPECTION
Bus Number: 1317
Date: 5-1-14
Personnel: T.S., S.R. & C.S.
Page 41 of 107
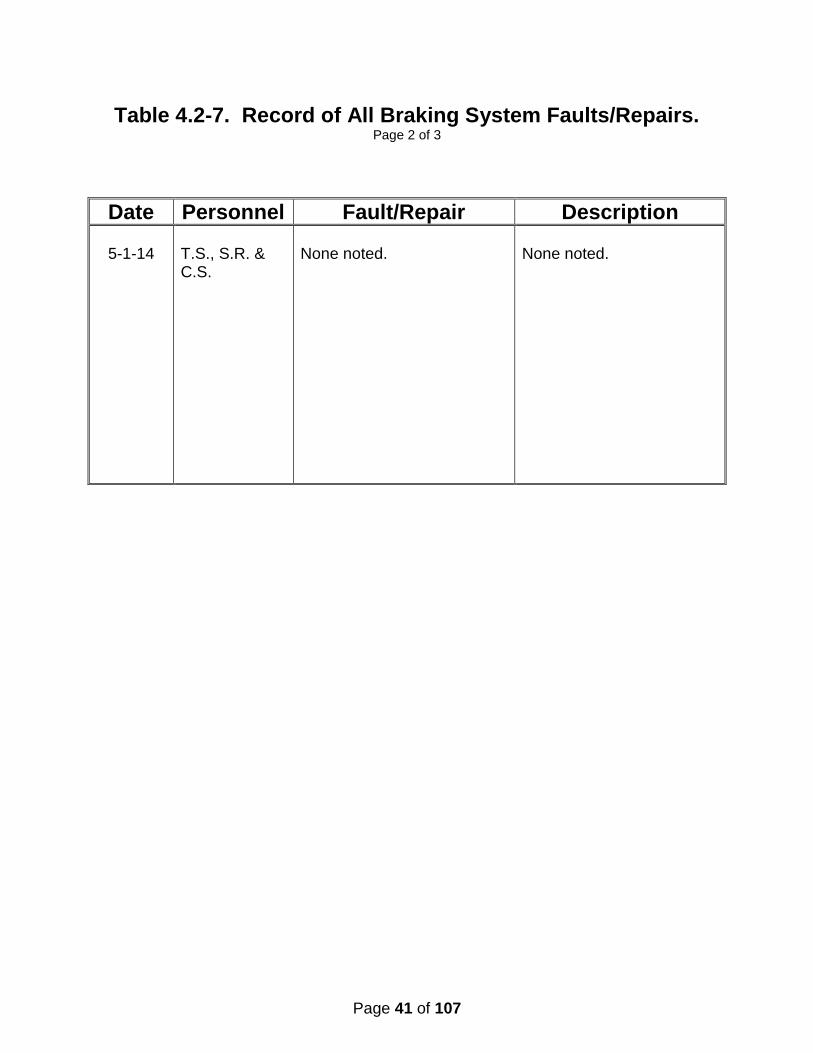
Table 4.2-7. Record of All Braking System Faults/Repairs. Page 2 of 3
Date Personnel Fault/Repair Description
5-1-14
T.S., S.R. & C.S.
None noted.
None noted.

Page 42 of 107
Table 4.2-8.1. Stopping Distance Test Results Form Page 3 or 3
Stopping Distance (ft)
Vehicle Direction
CW
CCW
CW
CCW
Speed (mph) Stop 1 Stop 2 Stop 3 Stop 4 Average
20 (dry)
23.93
20.24
21.66
18.77
21.15
30 (dry)
42.65
45.47
42.23
40.11
42.62
40 (dry)
68.06
70.70
76.00
69.55
71.08
45 (dry)
84.91
94.34
86.49
88.28
88.50
20 (wet)
24.75
23.45
21.76
21.24
22.80
Table 4.2-8.2. Stability Test Results Form
Stability Test Results (Split Friction Road surface)
Vehicle
Direction
Attempt
Did test bus stay in 12’ lane? (Yes/No)
CW
1
Yes
2
Yes
CCW
1
Yes
2
Yes
Table 4.2-8.3. Parking Brake Test Form PARKING BRAKE (Fully Loaded) – GRADE HOLDING
Vehicle
Direction
Attempt
Hold
Time (min)
Slide (in)
Roll (in)
Did
Hold
No
Hold
Front up
1
5:00
X
2
3
Front down
1
5:00
X
2
3
Page 43 of 107
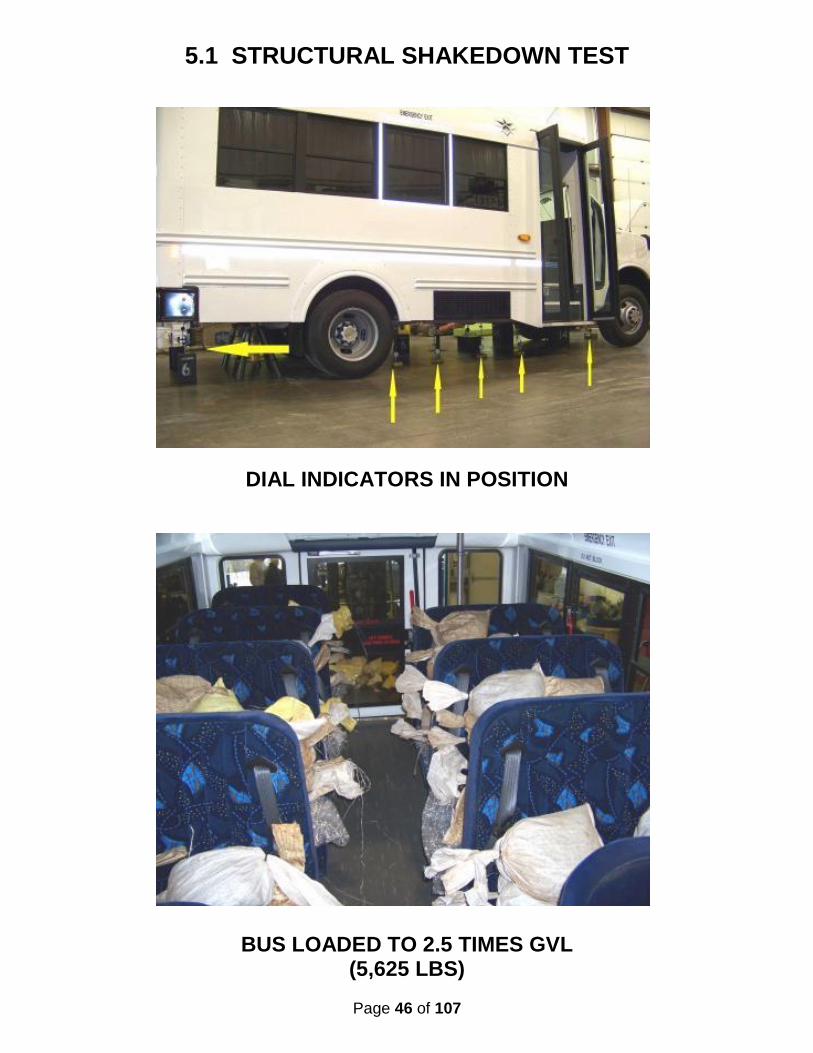
5.1 STRUCTURAL INTEGRITY 5.1 STRUCTURAL STRENGTH AND DISTORTION TESTS – STRUCTURAL SHAKEDOWN TEST 5.1-I. DISCUSSION
The objective of this test is to determine certain static characteristics (e.g., bus floor deflection, permanent structural deformation, etc.) under static loading conditions. 5.1-II. TEST DESCRIPTION
In this test, the bus will be isolated from the suspension by blocking the vehicle under the suspension points. The bus will then be loaded and unloaded up to a maximum of three times with a distributed load equal to 2.5 times gross load. Gross load is 150 lb for every designed passenger seating position, for the driver, and for each 1.5 sq ft of free floor space. For a distributed load equal to 2.5 times gross load, place a 375-lb load on each seat and on every 1.5 sq ft of free floor space. The first loading and unloading sequence will “settle” the structure. Bus deflection will be measured at several locations during the loading sequences. 5.1-III. DISCUSSION
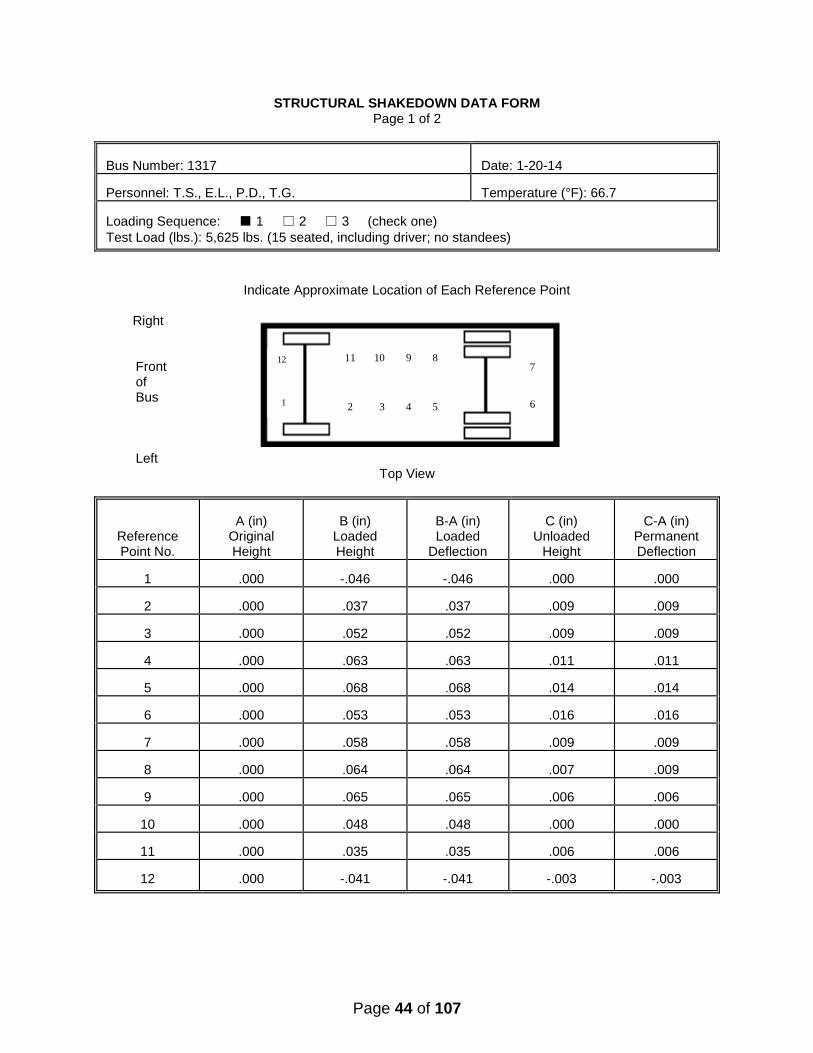
This test was performed based on a maximum passenger capacity of 15 people including the driver. The resulting test load is (15 X 375 lbs.) = 5,625 lbs. The load is distributed evenly over the passenger space. Deflection data before and after each loading and unloading sequence is provided on the Structural Shakedown Data Form.
The unloaded height after each test becomes the original height for the next test. Some initial settling is expected due to undercoat compression, etc. After each loading cycle, the deflection of each reference point is determined. The bus is then unloaded and the residual (permanent) deflection is recorded. On the final test, the maximum loaded deflection was 0.056 Inches at reference point 9. The maximum permanent deflection after the final loading sequence ranged from -0.002 Inches at reference point 8 to 0.003 Inches at reference point 6.
Page 44 of 107
STRUCTURAL SHAKEDOWN DATA FORM Page 1 of 2
Bus Number: 1317
Date: 1-20-14
Personnel: T.S., E.L., P.D., T.G.
Temperature (°F): 66.7
Loading Sequence: ■ 1 □ 2 □ 3 (check one)
Test Load (lbs.): 5,625 lbs. (15 seated, including driver; no standees)
Indicate Approximate Location of Each Reference Point Right
Front of Bus
Left Top View
Reference Point No.
A (in)
Original Height
B (in)
Loaded Height
B-A (in) Loaded
Deflection
C (in)
Unloaded Height
C-A (in)
Permanent Deflection
1
.000
-.046
-.046
.000
.000
2
.000
.037
.037
.009
.009
3
.000
.052
.052
.009
.009
4
.000
.063
.063
.011
.011
5
.000
.068
.068
.014
.014
6
.000
.053
.053
.016
.016
7
.000
.058
.058
.009
.009
8
.000
.064
.064
.007
.009
9
.000
.065
.065
.006
.006
10
.000
.048
.048
.000
.000
11
.000
.035
.035
.006
.006
12
.000
-.041
-.041
-.003
-.003
11 10 9 8
2 3 4 5
7
6
12
1

Page 45 of 107
STRUCTURAL SHAKEDOWN DATA FORM Page 2 of 2
Bus Number: 1317
Date: 1-20-14
Personnel: T.S., E.L., J.P. & T.G.
Temperature (°F): 66.7
Loading Sequence: □ 1 ■ 2 □ 3 (check one)
Test Load (lbs.): 5,625 lbs. (15 seated, including driver; no standees)
Indicate Approximate Location of Each Reference Point Right
Front of Bus
Left Top View
Reference Point No.
A (in)
Original Height
B (in)
Loaded Height
B-A (in) Loaded
Deflection
C (in)
Unloaded Height
C-A (in)
Permanent Deflection
1
.000
-.033
-.033
.000
.000
2
.009
.037
.028
.010
.001
3
.009
.051
.042
.010
.001
4
.011
.064
.053
.012
.001
5
.014
.069
.055
.016
.002
6
.016
.059
.043
.019
.003
7
.009
.060
.051
.011
.002
8
.009
.063
.054
.007
-.002
9
.006
.062
.056
.007
.001
10
.000
.046
.046
.000
.000
11
.006
.034
.028
.006
.000
12
-.003
-.037
-.034
-.003
.000
11 10 9 8
2 3 4 5
7
6
12
1
Page 46 of 107
5.1 STRUCTURAL SHAKEDOWN TEST
DIAL INDICATORS IN POSITION BUS LOADED TO 2.5 TIMES GVL (5,625 LBS)

Page 47 of 107
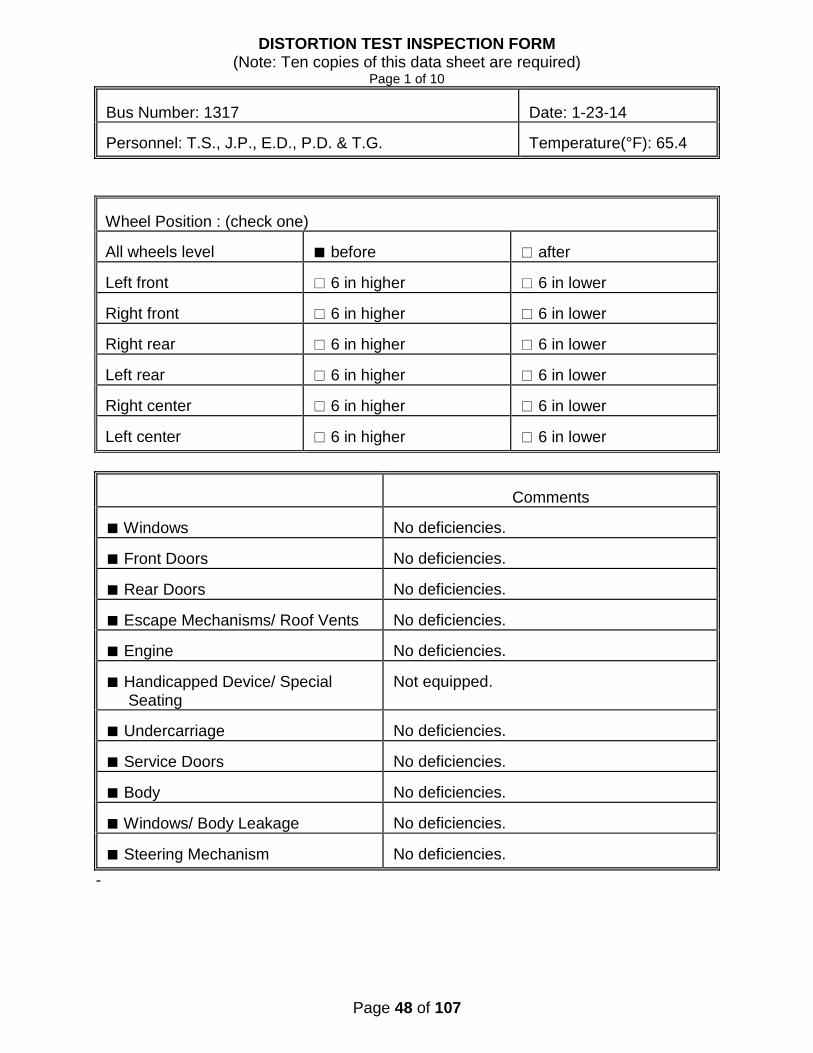
5.2 STRUCTURAL STRENGTH AND DISTORTION
TESTS - STRUCTURAL DISTORTION 5.2-I. TEST OBJECTIVE
The objective of this test is to observe the operation of the bus subsystems when the bus is placed in a longitudinal twist simulating operation over a curb or through a pothole. 5.2-II. TEST DESCRIPTION
With the bus loaded to GVWR, each wheel of the bus will be raised (one at a time) to simulate operation over a curb and the following will be inspected:
1. Body 2. Windows 3. Doors 4. Roof vents 5. Special seating 6. Undercarriage 7. Engine 8. Service doors 9. Escape hatches
10. Steering mechanism Each wheel will then be lowered (one at a time) to simulate operation through a pothole and the same items inspected. 5.2-III. DISCUSSION
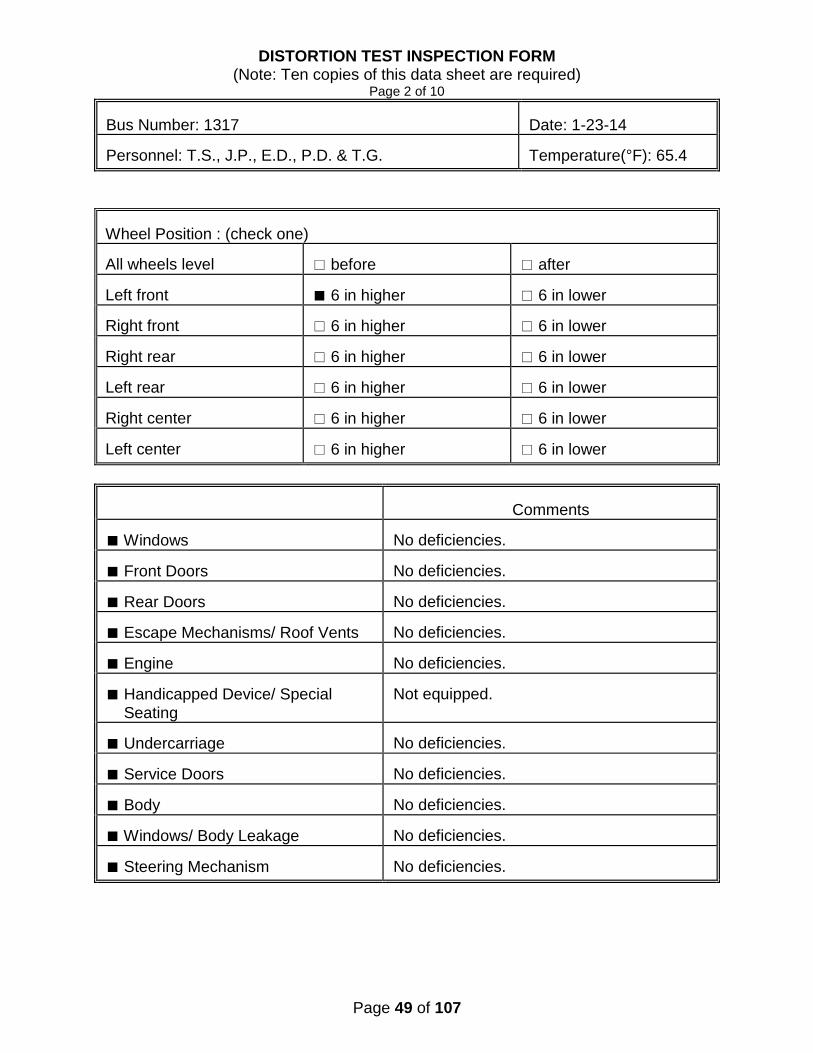
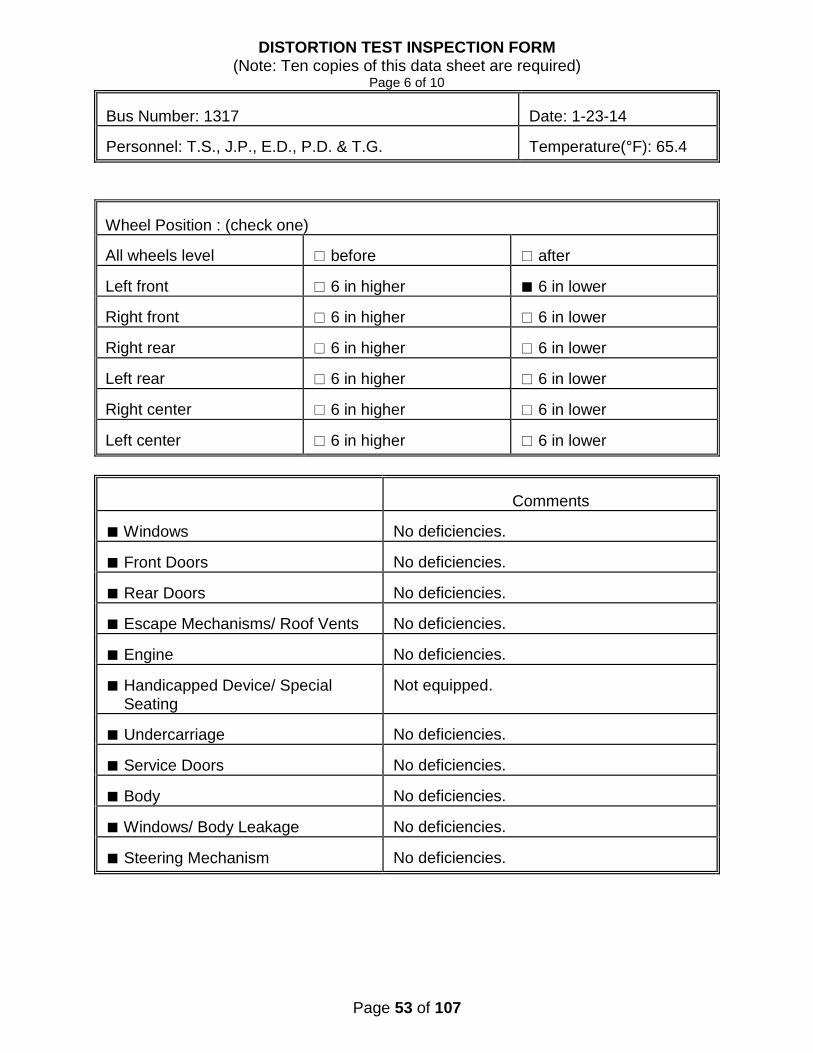
The test sequence was repeated ten times. The first and last test is with all wheels level. The other eight tests are with each wheel 6 inches higher and 6 inches lower than the other three wheels.
All doors, windows, escape mechanisms, engine, steering operated normally throughout the test. The undercarriage and body indicated no deficiencies. No water leakage was observed during the test. The results of this test are indicated on the following data forms.
Page 48 of 107
DISTORTION TEST INSPECTION FORM
(Note: Ten copies of this data sheet are required) Page 1 of 10
Bus Number: 1317
Date: 1-23-14
Personnel: T.S., J.P., E.D., P.D. & T.G.
Temperature(°F): 65.4
Wheel Position : (check one) All wheels level
■ before
□ after
Left front
□ 6 in higher
□ 6 in lower
Right front
□ 6 in higher
□ 6 in lower
Right rear
□ 6 in higher
□ 6 in lower
Left rear
□ 6 in higher
□ 6 in lower
Right center
□ 6 in higher
□ 6 in lower
Left center
□ 6 in higher
□ 6 in lower
Comments
■ Windows
No deficiencies.
■ Front Doors
No deficiencies.
■ Rear Doors
No deficiencies.
■ Escape Mechanisms/ Roof Vents
No deficiencies.
■ Engine
No deficiencies.
■ Handicapped Device/ Special Seating
Not equipped.
■ Undercarriage
No deficiencies.
■ Service Doors
No deficiencies.
■ Body
No deficiencies.
■ Windows/ Body Leakage
No deficiencies.
■ Steering Mechanism
No deficiencies.
-
Page 49 of 107
DISTORTION TEST INSPECTION FORM
(Note: Ten copies of this data sheet are required) Page 2 of 10
Bus Number: 1317
Date: 1-23-14
Personnel: T.S., J.P., E.D., P.D. & T.G.
Temperature(°F): 65.4
Wheel Position : (check one) All wheels level
□ before
□ after
Left front
■ 6 in higher
□ 6 in lower
Right front
□ 6 in higher
□ 6 in lower
Right rear
□ 6 in higher
□ 6 in lower
Left rear
□ 6 in higher
□ 6 in lower
Right center
□ 6 in higher
□ 6 in lower
Left center
□ 6 in higher
□ 6 in lower
Comments
■ Windows
No deficiencies.
■ Front Doors
No deficiencies.
■ Rear Doors
No deficiencies.
■ Escape Mechanisms/ Roof Vents
No deficiencies.
■ Engine
No deficiencies.
■ Handicapped Device/ Special Seating
Not equipped.
■ Undercarriage
No deficiencies.
■ Service Doors
No deficiencies.
■ Body
No deficiencies.
■ Windows/ Body Leakage
No deficiencies.
■ Steering Mechanism
No deficiencies.

Page 50 of 107
DISTORTION TEST INSPECTION FORM (Note: Ten copies of this data sheet are required)
Page 3 of 10
Bus Number: 1317
Date: 1-23-14
Personnel: T.S., J.P., E.D., P.D. & T.G.
Temperature(°F): 65.4
Wheel Position : (check one) All wheels level
□ before
□ after
Left front
□ 6 in higher
□ 6 in lower
Right front
■ 6 in higher
□ 6 in lower
Right rear
□ 6 in higher
□ 6 in lower
Left rear
□ 6 in higher
□ 6 in lower
Right center
□ 6 in higher
□ 6 in lower
Left center
□ 6 in higher
□ 6 in lower
Comments
■ Windows
No deficiencies.
■ Front Doors
No deficiencies.
■ Rear Doors
No deficiencies.
■ Escape Mechanisms/ Roof Vents
No deficiencies.
■ Engine
No deficiencies.
■ Handicapped Device/ Special Seating
Not equipped.
■ Undercarriage
No deficiencies.
■ Service Doors
No deficiencies.
■ Body
No deficiencies.
■ Windows/ Body Leakage
No deficiencies.
■ Steering Mechanism
No deficiencies.

Page 51 of 107
DISTORTION TEST INSPECTION FORM (Note: Ten copies of this data sheet are required)
Page 4 of 10
Bus Number: 1317
Date: 1-23-14
Personnel: T.S., J.P., E.D., P.D. & T.G.
Temperature(°F): 65.4
Wheel Position : (check one) All wheels level
□ before
□ after
Left front
□ 6 in higher
□ 6 in lower
Right front
□ 6 in higher
□ 6 in lower
Right rear
■ 6 in higher
□ 6 in lower
Left rear
□ 6 in higher
□ 6 in lower
Right center
□ 6 in higher
□ 6 in lower
Left center
□ 6 in higher
□ 6 in lower
Comments
■ Windows
No deficiencies.
■ Front Doors
No deficiencies.
■ Rear Doors
No deficiencies.
■ Escape Mechanisms/ Roof Vents
No deficiencies.
■ Engine
No deficiencies.
■ Handicapped Device/ Special Seating
Not equipped.
■ Undercarriage
No deficiencies.
■ Service Doors
No deficiencies.
■ Body
No deficiencies.
■ Windows/ Body Leakage
No deficiencies.
■ Steering Mechanism
No deficiencies.

Page 52 of 107
DISTORTION TEST INSPECTION FORM (Note: Ten copies of this data sheet are required)
Page 5 of 10
Bus Number: 1317
Date: 1-23-14
Personnel: T.S., J.P., E.D., P.D. & T.G.
Temperature(°F): 65.4
Wheel Position : (check one) All wheels level
□ before
□ after
Left front
□ 6 in higher
□ 6 in lower
Right front
□ 6 in higher
□ 6 in lower
Right rear
□ 6 in higher
□ 6 in lower
Left rear
■ 6 in higher
□ 6 in lower
Right center
□ 6 in higher
□ 6 in lower
Left center
□ 6 in higher
□ 6 in lower
Comments
■ Windows
No deficiencies.
■ Front Doors
No deficiencies.
■ Rear Doors
No deficiencies.
■ Escape Mechanisms/ Roof Vents
No deficiencies.
■ Engine
No deficiencies.
■ Handicapped Device/ Special Seating
Not equipped.
■ Undercarriage
No deficiencies.
■ Service Doors
No deficiencies.
■ Body
No deficiencies.
■ Windows/ Body Leakage
No deficiencies.
■ Steering Mechanism
No deficiencies.
Page 53 of 107
DISTORTION TEST INSPECTION FORM (Note: Ten copies of this data sheet are required)
Page 6 of 10
Bus Number: 1317
Date: 1-23-14
Personnel: T.S., J.P., E.D., P.D. & T.G.
Temperature(°F): 65.4
Wheel Position : (check one) All wheels level
□ before
□ after
Left front
□ 6 in higher
■ 6 in lower
Right front
□ 6 in higher
□ 6 in lower
Right rear
□ 6 in higher
□ 6 in lower
Left rear
□ 6 in higher
□ 6 in lower
Right center
□ 6 in higher
□ 6 in lower
Left center
□ 6 in higher
□ 6 in lower
Comments
■ Windows
No deficiencies.
■ Front Doors
No deficiencies.
■ Rear Doors
No deficiencies.
■ Escape Mechanisms/ Roof Vents
No deficiencies.
■ Engine
No deficiencies.
■ Handicapped Device/ Special Seating
Not equipped.
■ Undercarriage
No deficiencies.
■ Service Doors
No deficiencies.
■ Body
No deficiencies.
■ Windows/ Body Leakage
No deficiencies.
■ Steering Mechanism
No deficiencies.

Page 54 of 107
DISTORTION TEST INSPECTION FORM (Note: Ten copies of this data sheet are required)
Page 7 of 10
Bus Number: 1317
Date: 1-23-14
Personnel: T.S., J.P., E.D., P.S. & T.G.
Temperature(°F): 65.4
Wheel Position : (check one) All wheels level
□ before
□ after
Left front
□ 6 in higher
□ 6 in lower
Right front
□ 6 in higher
■ 6 in lower
Right rear
□ 6 in higher
□ 6 in lower
Left rear
□ 6 in higher
□ 6 in lower
Right center
□ 6 in higher
□ 6 in lower
Left center
□ 6 in higher
□ 6 in lower
Comments
■ Windows
No deficiencies.
■ Front Doors
No deficiencies.
■ Rear Doors
No deficiencies.
■ Escape Mechanisms/ Roof Vents
No deficiencies.
■ Engine
No deficiencies.
■ Handicapped Device/ Special Seating
Not equipped.
■ Undercarriage
No deficiencies.
■ Service Doors
No deficiencies.
■ Body
No deficiencies.
■ Windows/ Body Leakage
No deficiencies.
■ Steering Mechanism
No deficiencies.

Page 55 of 107
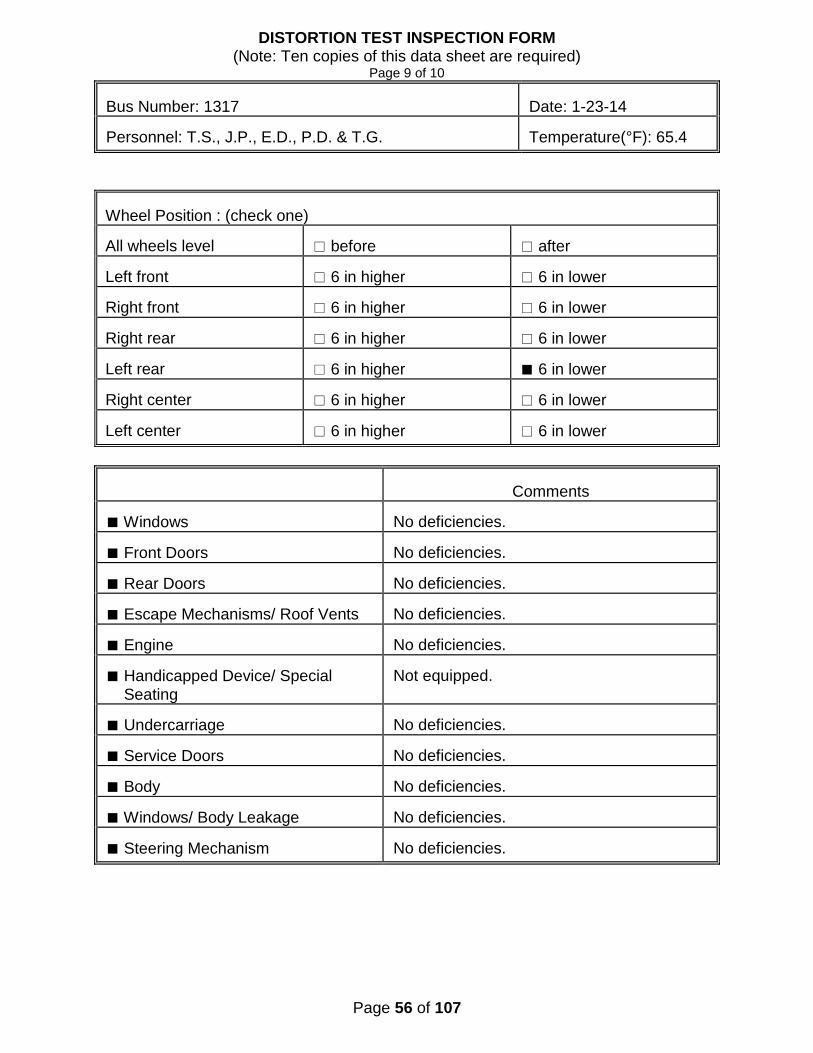
DISTORTION TEST INSPECTION FORM (Note: Ten copies of this data sheet are required)
Page 8 of 10
Bus Number: 1317
Date: 1-23-14
Personnel: T.S., J.P., E.D., P.D. & T.G.
Temperature(°F): 65.4
Wheel Position : (check one) All wheels level
□ before
□ after
Left front
□ 6 in higher
□ 6 in lower
Right front
□ 6 in higher
□ 6 in lower
Right rear
□ 6 in higher
■ 6 in lower
Left rear
□ 6 in higher
□ 6 in lower
Right center
□ 6 in higher
□ 6 in lower
Left center
□ 6 in higher
□ 6 in lower
Comments
■ Windows
No deficiencies.
■ Front Doors
No deficiencies.
■ Rear Doors
No deficiencies.
■ Escape Mechanisms/ Roof Vents
No deficiencies.
■ Engine
No deficiencies.
■ Handicapped Device/ Special Seating
Not equipped.
■ Undercarriage
No deficiencies.
■ Service Doors
No deficiencies.
■ Body
No deficiencies.
■ Windows/ Body Leakage
No deficiencies.
■ Steering Mechanism
No deficiencies.
Page 56 of 107
DISTORTION TEST INSPECTION FORM (Note: Ten copies of this data sheet are required)
Page 9 of 10
Bus Number: 1317
Date: 1-23-14
Personnel: T.S., J.P., E.D., P.D. & T.G.
Temperature(°F): 65.4
Wheel Position : (check one) All wheels level
□ before
□ after
Left front
□ 6 in higher
□ 6 in lower
Right front
□ 6 in higher
□ 6 in lower
Right rear
□ 6 in higher
□ 6 in lower
Left rear
□ 6 in higher
■ 6 in lower
Right center
□ 6 in higher
□ 6 in lower
Left center
□ 6 in higher
□ 6 in lower
Comments
■ Windows
No deficiencies.
■ Front Doors
No deficiencies.
■ Rear Doors
No deficiencies.
■ Escape Mechanisms/ Roof Vents
No deficiencies.
■ Engine
No deficiencies.
■ Handicapped Device/ Special Seating
Not equipped.
■ Undercarriage
No deficiencies.
■ Service Doors
No deficiencies.
■ Body
No deficiencies.
■ Windows/ Body Leakage
No deficiencies.
■ Steering Mechanism
No deficiencies.

Page 57 of 107
DISTORTION TEST INSPECTION FORM (Note: Ten copies of this data sheet are required)
Page 10 of 10
Bus Number: 1317
Date: 1-23-14
Personnel: T.S., J.P., E.D., P.D. & T.G.
Temperature(°F): 65.4
Wheel Position : (check one) All wheels level
□ before
■ after
Left front
□ 6 in higher
□ 6 in lower
Right front
□ 6 in higher
□ 6 in lower
Right rear
□ 6 in higher
□ 6 in lower
Left rear
□ 6 in higher
□ 6 in lower
Right center
□ 6 in higher
□ 6 in lower
Left center
□ 6 in higher
□ 6 in lower
Comments
■ Windows
No deficiencies.
■ Front Doors
No deficiencies.
■ Rear Doors
No deficiencies.
■ Escape Mechanisms/ Roof Vents
No deficiencies.
■ Engine
No deficiencies.
■ Handicapped Device/ Special Seating
Not equipped.
■ Undercarriage
No deficiencies
■ Service Doors
No deficiencies.
■ Body
No deficiencies.
■ Windows/ Body Leakage
No deficiencies.
■ Steering Mechanism
No deficiencies.

Page 58 of 107
5.2 STRUCTURAL DISTORTION TEST
LEFT FRONT WHEEL SIX INCHES HIGHER RIGHT FRONT WHEEL SIX INCHES LOWER

Page 59 of 107
5.3 STRUCTURAL STRENGTH AND DISTORTION TESTS - STATIC TOWING TEST 5.3-I. TEST OBJECTIVE
The objective of this test is to determine the characteristics of the bus towing mechanisms under static loading conditions. 5.3-II. TEST DESCRIPTION
Utilizing a load-distributing yoke, a hydraulic cylinder is used to apply a static tension load equal to 1.2 times the bus curb weight. The load will be applied to both the front and rear, if applicable, towing fixtures at an angle of 20 degrees with the longitudinal axis of the bus, first to one side then the other in the horizontal plane, and then upward and downward in the vertical plane. Any permanent deformation or damage to the tow eyes or adjoining structure will be recorded. 5.3-III. DISCUSSION
The load-distributing yoke was incorporated as the interface between the Static Tow apparatus and the test bus tow hook/eyes. The bus submitted for testing was not equipped with any type of tow eyes or tow hooks; therefore, the Static Towing Test was not performed.
Page 60 of 107
5.4 STRUCTURAL STRENGTH AND DISTORTION TESTS - DYNAMIC TOWING TEST 5.4-I. TEST OBJECTIVE
The objective of this test is to verify the integrity of the towing fixtures and determine the feasibility of towing the bus under manufacturer specified procedures. 5.4-II. TEST DESCRIPTION
This test requires the bus be towed at curb weight using the specified equipment and instructions provided by the manufacturer and a heavy-duty wrecker. The bus will be towed for 5 miles at a speed of 20 mph for each recommended towing configuration. After releasing the bus from the wrecker, the bus will be visually inspected for any structural damage or permanent deformation. All doors, windows and passenger escape mechanisms will be inspected for proper operation. 5.4-III. DISCUSSION
The bus was towed using a heavy-duty wrecker. The towing interface was accomplished by incorporating a hydraulic under lift. A front lift tow was performed. Rear towing is not recommended. No problems, deformation, or damage was noted during testing.
Page 61 of 107
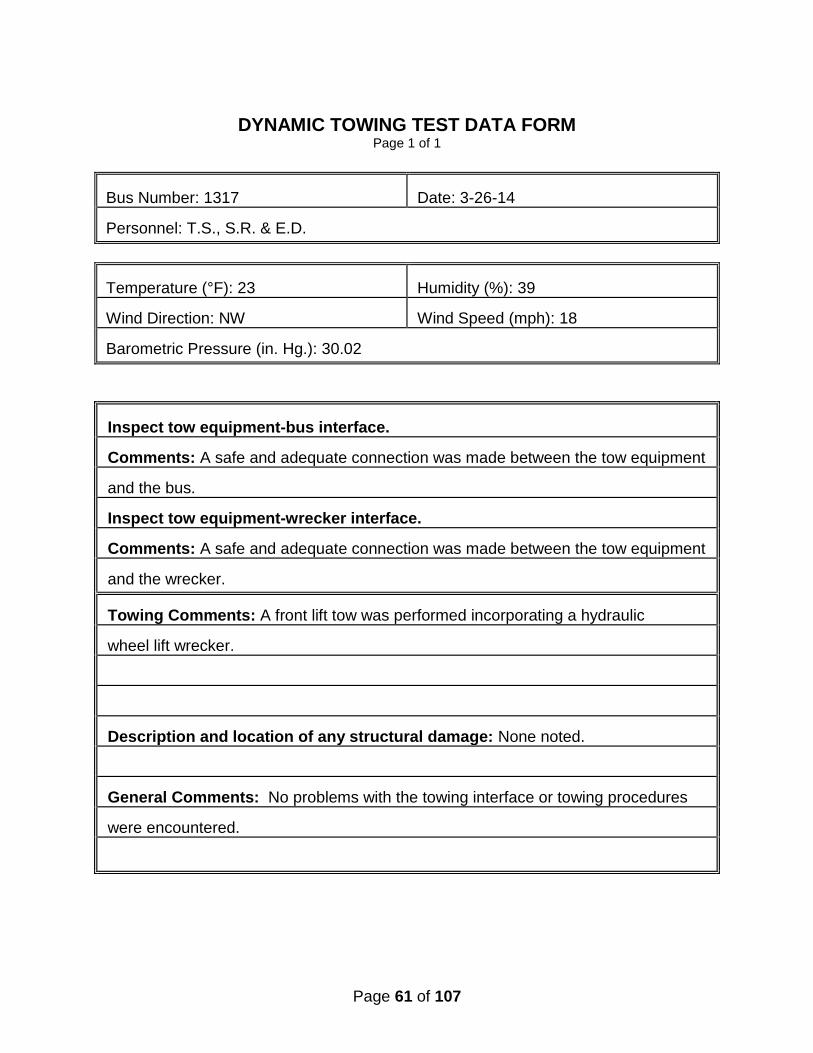
DYNAMIC TOWING TEST DATA FORM Page 1 of 1
Bus Number: 1317
Date: 3-26-14
Personnel: T.S., S.R. & E.D.
Temperature (°F): 23
Humidity (%): 39
Wind Direction: NW
Wind Speed (mph): 18
Barometric Pressure (in. Hg.): 30.02
Inspect tow equipment-bus interface. Comments: A safe and adequate connection was made between the tow equipment and the bus. Inspect tow equipment-wrecker interface. Comments: A safe and adequate connection was made between the tow equipment and the wrecker.
Towing Comments: A front lift tow was performed incorporating a hydraulic wheel lift wrecker. Description and location of any structural damage: None noted. General Comments: No problems with the towing interface or towing procedures were encountered.
Page 62 of 107
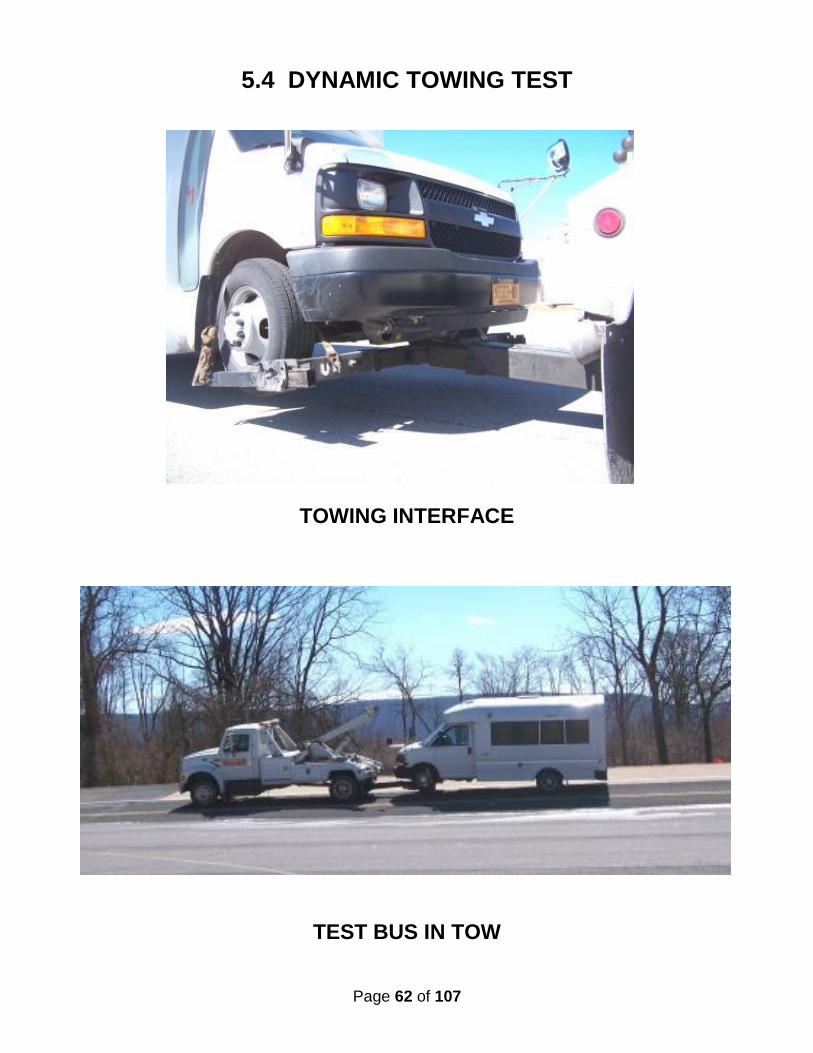
5.4 DYNAMIC TOWING TEST
TOWING INTERFACE
TEST BUS IN TOW

Page 63 of 107
5.5 STRUCTURAL STRENGTH AND DISTORTION
TESTS – JACKING TEST
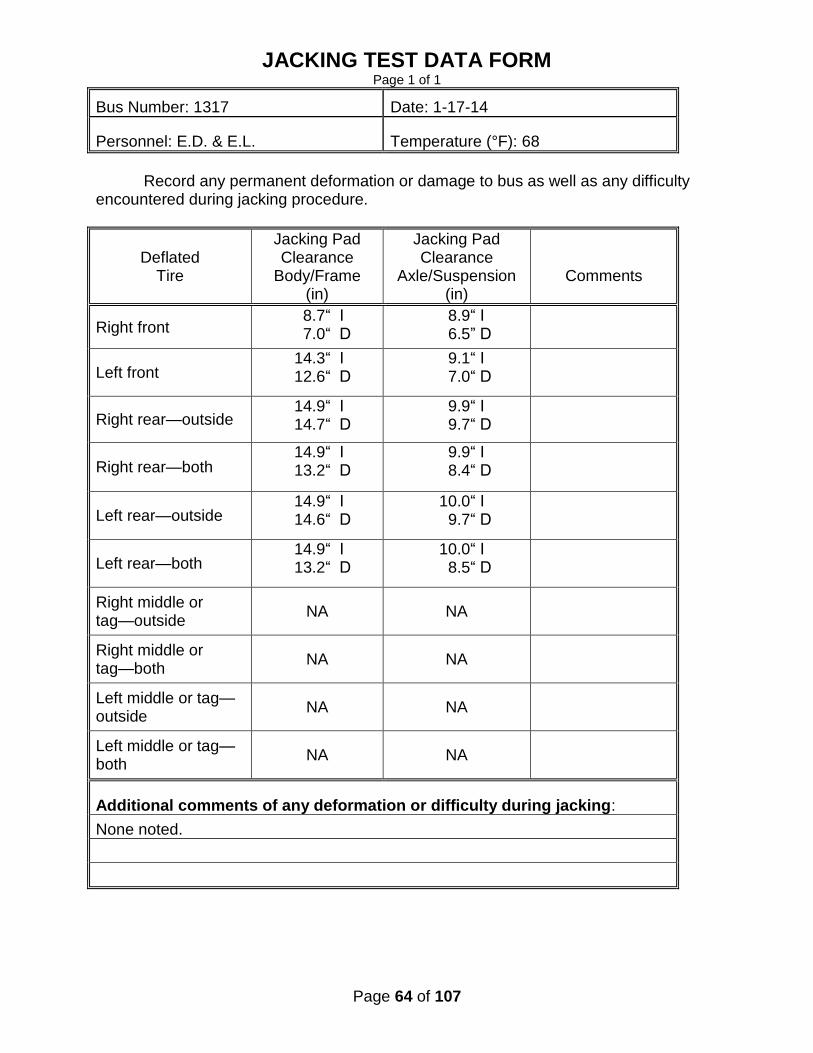
5.5-I. TEST OBJECTIVE The objective of this test is to inspect for damage due to the deflated tire, and determine the feasibility of jacking the bus with a portable hydraulic jack to a height sufficient to replace a deflated tire.
5.5-II. TEST DESCRIPTION
With the bus at curb weight, the tire(s) at one corner of the bus are replaced with deflated tire(s) of the appropriate type. A portable hydraulic floor jack is then positioned in a manner and location specified by the manufacturer and used to raise the bus to a height sufficient to provide 3-in clearance between the floor and an inflated tire. The deflated tire(s) are replaced with the original tire(s) and the jack is lowered. Any structural damage or permanent deformation is recorded on the test data sheet. This procedure is repeated for each corner of the bus.
5.5-III. DISCUSSION
The jack used for this test has a minimum height of 8.75 inches. During the deflated portion of the test, the jacking point clearances ranged from 6.5 inches to 14.7 inches. No deformation or damage was observed during testing. A complete listing of jacking point clearances is provided in the Jacking Test Data Form.
JACKING CLEARANCE SUMMARY
Condition
Frame Point Clearance
Front axle – one tire flat
7.0”
Rear axle – one tire flat
14.6”
Rear axle – two tires flat
13.2”
Page 64 of 107
JACKING TEST DATA FORM Page 1 of 1
Bus Number: 1317 Date: 1-17-14
Personnel: E.D. & E.L. Temperature (°F): 68
Record any permanent deformation or damage to bus as well as any difficulty encountered during jacking procedure.
Deflated
Tire
Jacking Pad Clearance
Body/Frame (in)
Jacking Pad Clearance
Axle/Suspension (in)
Comments
Right front 8.7“ I 7.0“ D
8.9“ I 6.5” D
Left front 14.3“ I 12.6“ D
9.1“ I 7.0“ D
Right rear—outside 14.9“ I 14.7“ D
9.9“ I 9.7“ D
Right rear—both 14.9“ I 13.2“ D
9.9“ I 8.4“ D
Left rear—outside 14.9“ I 14.6“ D
10.0“ I 9.7“ D
Left rear—both 14.9“ I 13.2“ D
10.0“ I 8.5“ D
Right middle or tag—outside
NA NA
Right middle or tag—both
NA NA
Left middle or tag—outside
NA NA
Left middle or tag—both
NA NA
Additional comments of any deformation or difficulty during jacking:
None noted.
Page 65 of 107
5.6 STRUCTURAL STRENGTH AND DISTORTION
TESTS - HOISTING TEST 5.6-I. TEST OBJECTIVE
The objective of this test is to determine possible damage or deformation caused by the jack/stands. 5.6-II. TEST DESCRIPTION
With the bus at curb weight, the front end of the bus is raised to a height sufficient to allow manufacturer-specified placement of jack stands under the axles or jacking pads independent of the hoist system. The bus will be checked for stability on the jack stands and for any damage to the jacking pads or bulkheads. The procedure is repeated for the rear end of the bus. The procedure is then repeated for the front and rear simultaneously. 5.6-III. DISCUSSION
The test was conducted using four posts of a six-post electric lift and standard 19 inch jack stands. The bus was hoisted from the front wheel, rear wheel, and then the front and rear wheels simultaneously and placed on jack stands.
The bus easily accommodated the placement of the vehicle lifts and jack stands and the procedure was performed without any instability noted.
Page 66 of 107
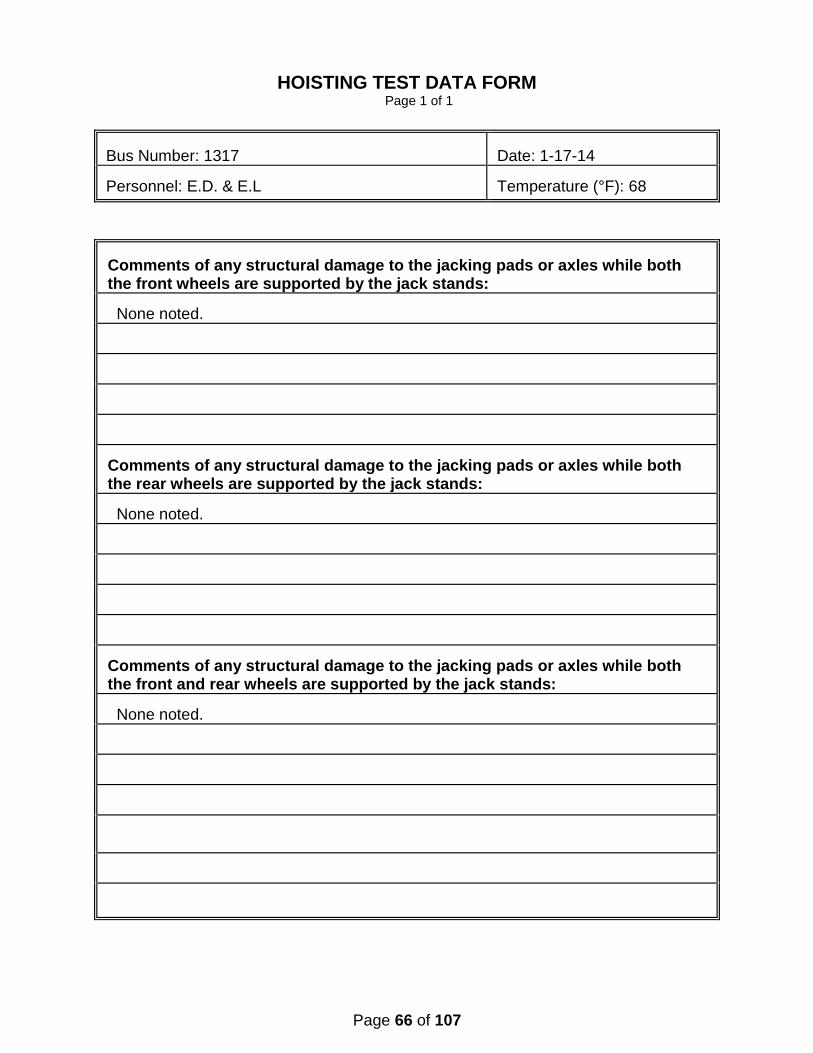
HOISTING TEST DATA FORM Page 1 of 1
Bus Number: 1317
Date: 1-17-14
Personnel: E.D. & E.L
Temperature (°F): 68
Comments of any structural damage to the jacking pads or axles while both the front wheels are supported by the jack stands: None noted. Comments of any structural damage to the jacking pads or axles while both the rear wheels are supported by the jack stands: None noted. Comments of any structural damage to the jacking pads or axles while both the front and rear wheels are supported by the jack stands: None noted.
Page 67 of 107
5.7 STRUCTURAL DURABILITY TEST 5.7-I. TEST OBJECTIVE
The objective of this test is to perform an accelerated durability test that approximates up to 25 percent of the service life of the vehicle. 5.7-II. TEST DESCRIPTION
The test vehicle is driven a total of 5,050 miles; approximately 3,750 miles on the PSBRTF Durability Test Track and approximately 1,300 miscellaneous other miles. The test will be conducted with the bus operated under three different loading conditions. The first segment will consist of approximately 2,125 miles with the bus operated at GVW. The second segment will consist of approximately 800 miles with the bus operated at SLW. The remainder of the test, approximately 2,125 miles, will be conducted with the bus loaded to CW. If GVW exceeds the axle design weights, then the load will be adjusted to the axle design weights and the change will be recorded. All subsystems are run during these tests in their normal operating modes. All recommended manufacturers servicing is to be followed and noted on the vehicle maintainability log. Servicing items accelerated by the durability tests will be compressed by 10:1; all others will be done on a 1:1 mi/mi basis. Unscheduled breakdowns and repairs are recorded on the same log as are any unusual occurrences as noted by the driver. Once a week the test vehicle shall be washed down and thoroughly inspected for any signs of failure. 5.7-III. DISCUSSION
The Structural Durability Test was started on January 24, 2014 and was conducted until April 2, 2014. The first 2,125 miles were performed at a GVW of 10,260 lbs. and completed on March 3, 2014. The next 800 mile SLW segment was performed at the same 10,260 lbs and completed on March 7, 2014 and the final 2,125 mile segment was performed at a CW of 8,030 lbs. and completed on April 2, 2014.
The following mileage summary presents the accumulation of miles during the
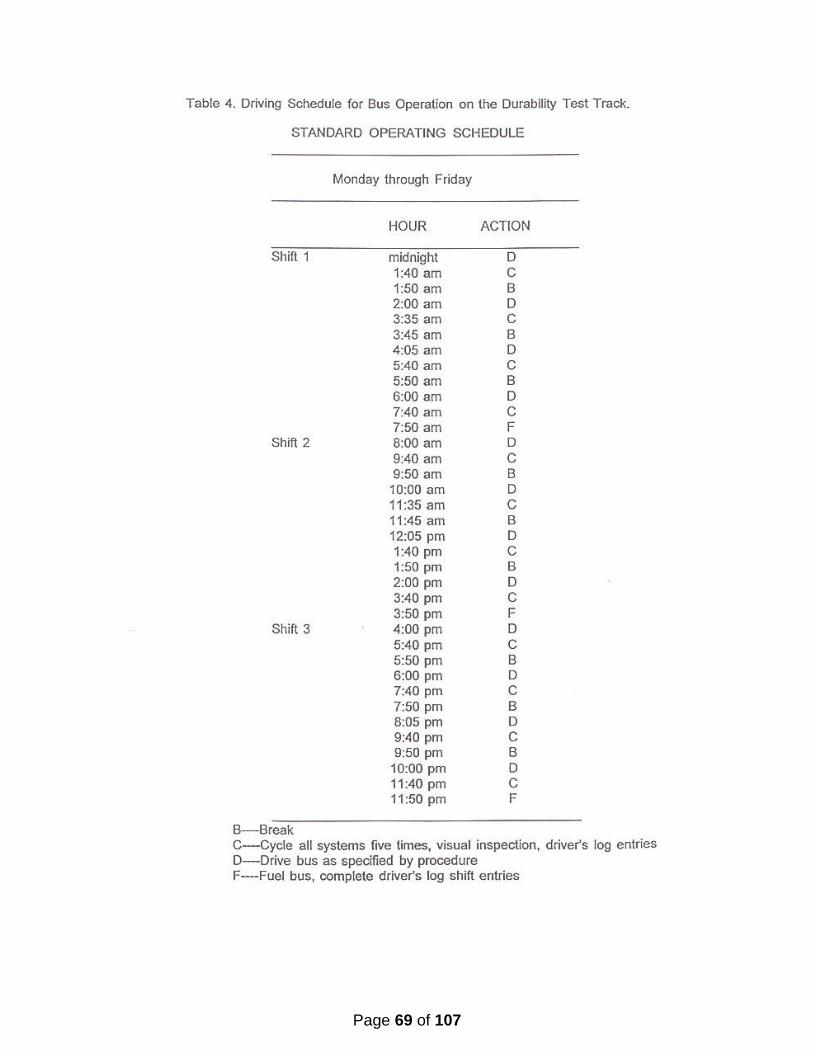
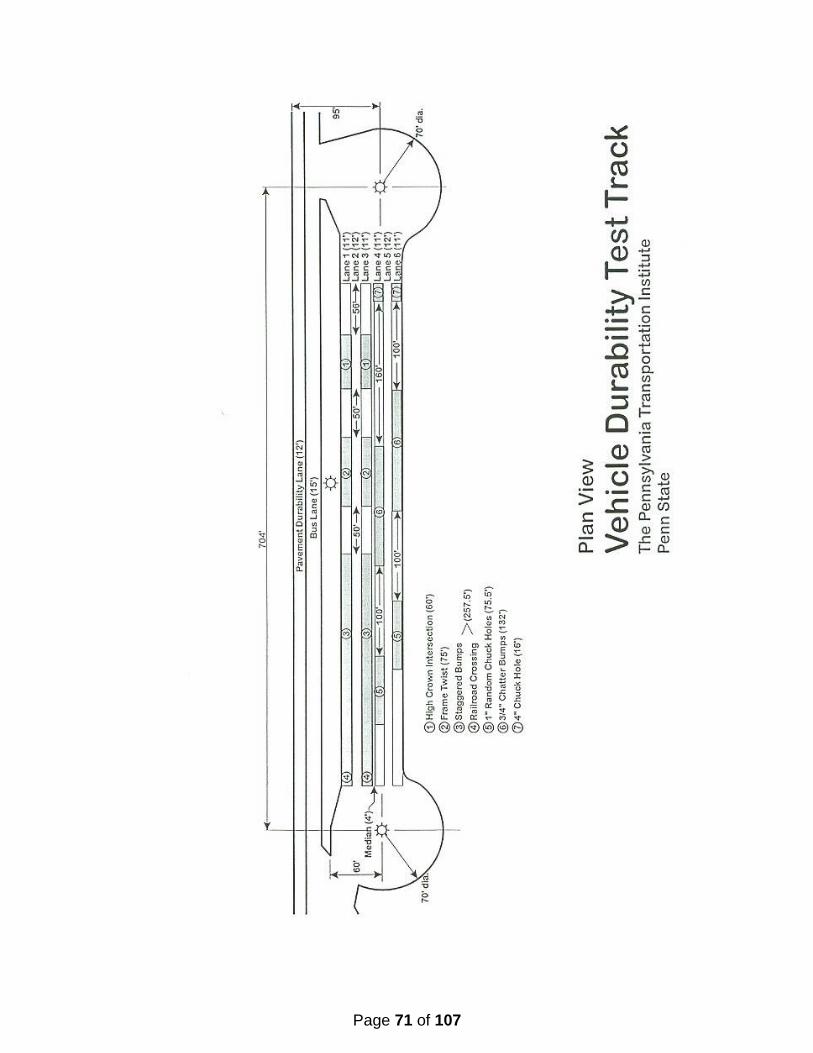
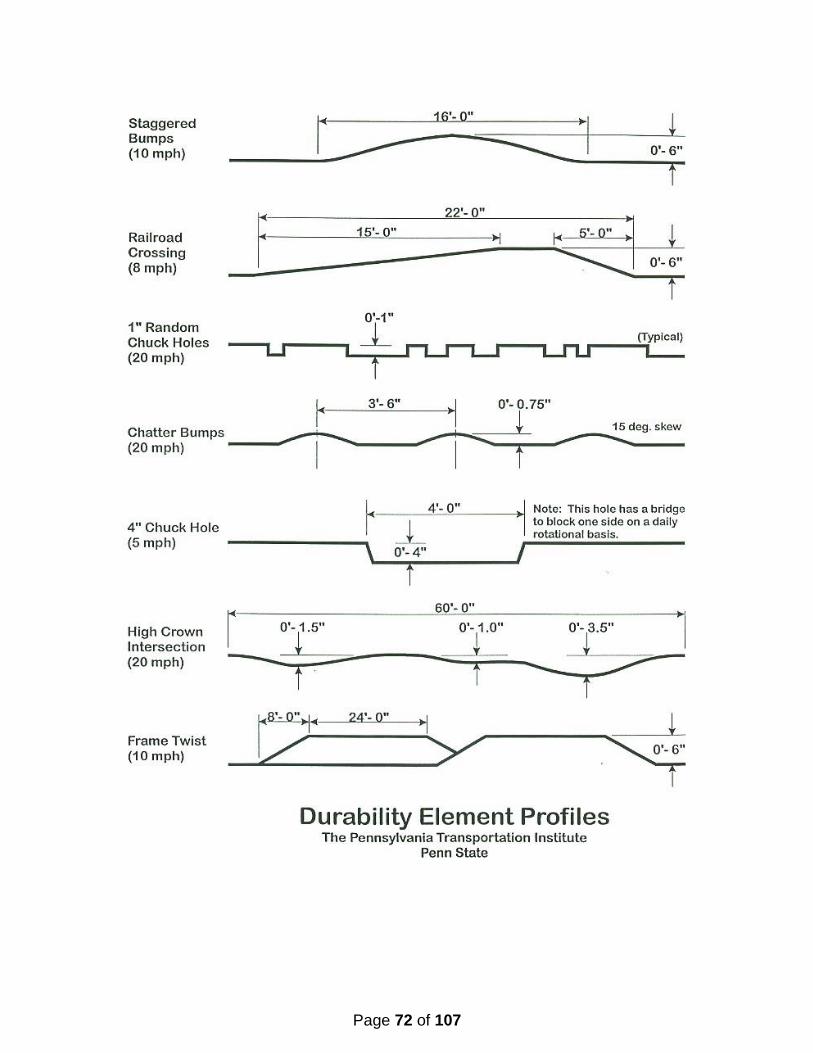
Structural Durability Test. The driving schedule is included, showing the operating duty cycle. A detailed plan view of the Test Track Facility and Durability Test Track are attached for reference. Also, a durability element profile detail shows all the measurements of the different conditions. Finally, photographs illustrating some of the failures that were encountered during the Structural Durability Test are included. Note: this test bus encountered no failures during the Structural Durability Test.
Effective January 1, 2010 the Federal Transit Administration determined that the total number of simulated passengers used for loading all test vehicles will be based on the full complement of seats and free-floor space available for standing passengers (150 lbs per passenger). The passenger loading used for dynamic testing will not be reduced in order to comply with Gross Axle Weight Ratings (GAWR’s) or the Gross Vehicle Weight Ratings (GVWR’s) declared by the manufacturer. Cases where the loading exceeds the GAWR and/or the GVWR will be noted accordingly. During the testing program, all test vehicles transported or operated over public roadways will be loaded to comply with the GAWR and GVWR specified by the manufacturer.

Page 68 of 107
Trans Tech # 1317
MILEAGE DRIVEN/RECORDED FROM DRIVER'S LOGS
TOTAL
TOTAL
OTHER
DATE MILES TOTAL
1/20/2014 TO
45.00 50.00 95.00 01/26/14
01/27/2014 TO
308.00 14.00 322.00 02/02/14
02/03/2014 TO
331.00 15.00 346.00 02/09/14
02/10/2014 TO
744.00 131.00 875.00 02/16/14
02/17/2014 TO
76.00 51.00 127.00 02/23/14
02/24/2014 TO
0.00 0.00 0.00 03/02/14
03/03/2014 TO
774.00 81.00 855.00 03/09/14
03/10/2014 TO
1152.00 49.00 1201.00 03/16/14
03/17/2014 TO
320.00 812.00 1132.00 03/23/14
03/24/2014 TO
0.00 7.00 7.00 03/30/14
03/31/2014 TO
0.00 91.00 91.00 4/6/2014
3750.00 1301.00 5051.00 TOTALS
Page 69 of 107

Page 70 of 107
Page 71 of 107
Page 72 of 107

Page 73 of 107
6. FUEL ECONOMY TEST - A FUEL CONSUMPTION TEST USING AN APPROPRIATE OPERATING CYCLE 6-I. TEST OBJECTIVE
The objective of this test is to provide accurate comparable fuel consumption data on transit buses produced by different manufacturers. This fuel economy test bears no relation to the calculations done by the Environmental Protection Agency (EPA) to determine levels for the Corporate Average Fuel Economy Program. EPA's calculations are based on tests conducted under laboratory conditions intended to simulate city and highway driving. This fuel economy test, as designated here, is a measurement of the fuel expended by a vehicle traveling a specified test loop under specified operating conditions. The results of this test will not represent actual mileage but will provide data that can be used by recipients to compare buses tested by this procedure. 6-II. TEST DESCRIPTION
This test requires operation of the bus over a course based on the Transit Coach Operating Duty Cycle (ADB Cycle) at seated load weight using a procedure based on the Fuel Economy Measurement Test (Engineering Type) For Trucks and Buses: SAE 1376 July 82. The procedure has been modified by elimination of the control vehicle and by modifications as described below. The inherent uncertainty and expense of utilizing a control vehicle over the operating life of the facility is impractical.
The fuel economy test will be performed as soon as possible (weather permitting) after the completion of the GVW portion of the structural durability test. It will be conducted on the bus test lane at the Penn State Test Facility. Signs are erected at carefully measured points which delineate the test course. A test run will comprise 3 CBD phases, 2 Arterial phases, and 1 Commuter phase. An electronic fuel measuring system will indicate the amount of fuel consumed during each phase of the test. The test runs will be repeated until there are at least two runs in both the clockwise and counterclockwise directions in which the fuel consumed for each run is within ± 4 percent of the average total fuel used over the 4 runs. A 20-minute idle consumption test is performed just prior to and immediately after the driven portion of the fuel economy test. The amount of fuel consumed while operating at normal/low idle is recorded on the Fuel Economy Data Form. This set of four valid runs along with idle consumption data comprise a valid test.
Page 74 of 107
The test procedure is the ADB cycle with the following four modifications:
1. The ADB cycle is structured as a set number of miles in a fixed time in the
following order: CBD, Arterial, CBD, Arterial, CBD, and Commuter. A separate idle fuel consumption measurement is performed at the beginning and end of the fuel economy test. This phase sequence permits the reporting of fuel consumption for each of these phases separately, making the data more useful to bus manufacturers and transit properties.
2. The operating profile for testing purposes shall consist of simulated transit
type service at seated load weight. The three test phases (figure 6-1) are: a central business district (CBD) phase of 2 miles with 7 stops per mile and a top speed of 20 mph; an arterial phase of 2 miles with 2 stops per mile and a top speed of 40 mph; and a commuter phase of 4 miles with 1 stop and a maximum speed of 40 mph. At each designated stop the bus will remain stationary for seven seconds. During this time, the passenger doors shall be opened and closed.
3. The individual ADB phases remain unaltered with the exception that 1 mile
has been changed to 1 lap on the Penn State Test Track. One lap is equal to 5,042 feet. This change is accommodated by adjusting the cruise distance and time.
4. The acceleration profile, for practical purposes and to achieve better
repeatability, has been changed to "full throttle acceleration to cruise speed".
Several changes were made to the Fuel Economy Measurement Test (Engineering Type) For Trucks and Buses: SAE 1376 July 82:
1. Sections 1.1, and 1.2 only apply to diesel, gasoline, methanol, and any other fuel in the liquid state (excluding cryogenic fuels).
1.1 SAE 1376 July 82 requires the use of at least a 16-gal fuel tank. Such a fuel tank when full would weigh approximately 160 lb. It is judged that a 12-gal tank weighing approximately 120 lb will be sufficient for this test and much easier for the technician and test personnel to handle.

Page 75 of 107
1.2 SAE 1376 July 82 mentions the use of a mechanical scale or a flow meter system. This test procedure uses a load cell readout combination that provides an accuracy of 0.5 percent in weight and permits on-board weighing of the gravimetric tanks at the end of each phase. This modification permits the determination of a fuel economy value for each phase as well as the overall cycle.
2. Section 2.1 applies to compressed natural gas (CNG), liquefied natural gas (LNG), cryogenic fuels, and other fuels in the vapor state.
2.1 A laminar type flow meter will be used to determine the fuel consumption. The pressure and temperature across the flow element will be monitored by the flow computer. The flow computer will use this data to calculate the gas flow rate. The flow computer will also display the flow rate (scfm) as well as the total fuel used (scf). The total fuel used (scf) for each phase will be recorded on the Fuel Economy Data Form.
3. Use both Sections 1 and 2 for dual fuel systems. FUEL ECONOMY CALCULATION PROCEDURE A. For diesel, gasoline, methanol and fuels in the liquid state.
The reported fuel economy is based on the following: measured test quantities--distance traveled (miles) and fuel consumed (pounds); standard reference values--
density of water at 60°F (8.3373 lbs/gal) and volumetric heating value of standard fuel;
and test fuel specific gravity (unitless) and volumetric heating value (BTU/gal). These combine to give a fuel economy in miles per gallon (mpg) which is corrected to a
standard gallon of fuel referenced to water at 60°F. This eliminates fluctuations in fuel
economy due to fluctuations in fuel quality. This calculation has been programmed into a computer and the data processing is performed automatically.
The fuel economy correction consists of three steps:
1.) Divide the number of miles of the phase by the number of pounds of fuel consumed
total miles phase miles per phase per run CBD 1.9097 5.7291 ART 1.9097 3.8193 COM 3.8193 3.8193
FEomi/lb = Observed fuel economy = miles
lb of fuel
Page 76 of 107
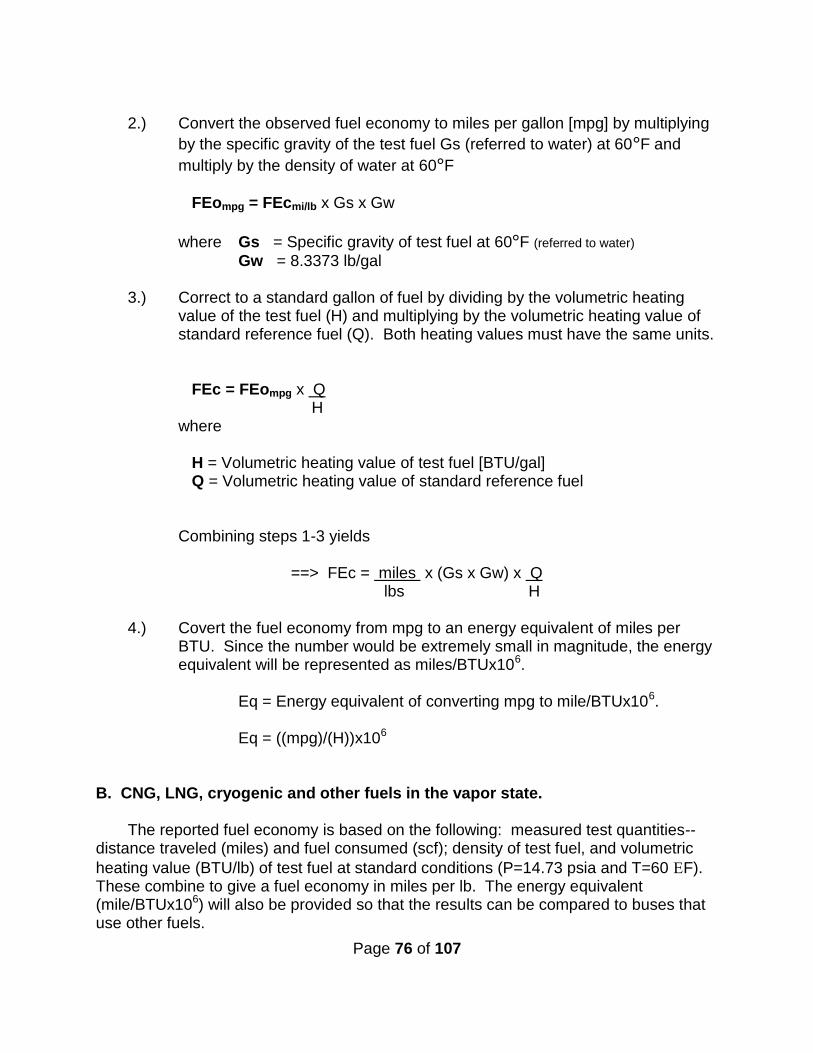
2.) Convert the observed fuel economy to miles per gallon [mpg] by multiplying
by the specific gravity of the test fuel Gs (referred to water) at 60°F and
multiply by the density of water at 60°F
FEompg = FEcmi/lb x Gs x Gw
where Gs = Specific gravity of test fuel at 60°F (referred to water)
Gw = 8.3373 lb/gal
3.) Correct to a standard gallon of fuel by dividing by the volumetric heating value of the test fuel (H) and multiplying by the volumetric heating value of standard reference fuel (Q). Both heating values must have the same units.
FEc = FEompg x Q H where
H = Volumetric heating value of test fuel [BTU/gal] Q = Volumetric heating value of standard reference fuel
Combining steps 1-3 yields
==> FEc = miles x (Gs x Gw) x Q lbs H
4.) Covert the fuel economy from mpg to an energy equivalent of miles per
BTU. Since the number would be extremely small in magnitude, the energy equivalent will be represented as miles/BTUx106.
Eq = Energy equivalent of converting mpg to mile/BTUx106.
Eq = ((mpg)/(H))x106
B. CNG, LNG, cryogenic and other fuels in the vapor state.
The reported fuel economy is based on the following: measured test quantities--
distance traveled (miles) and fuel consumed (scf); density of test fuel, and volumetric
heating value (BTU/lb) of test fuel at standard conditions (P=14.73 psia and T=60 F). These combine to give a fuel economy in miles per lb. The energy equivalent (mile/BTUx106) will also be provided so that the results can be compared to buses that use other fuels.

Page 77 of 107
1.) Divide the number of miles of the phase by the number of standard cubic feet (scf) of fuel consumed.
total miles phase miles per phase per run CBD 1.9097 5.7291 ART 1.9097 3.8193 COM 3.8193 3.8193
FEomi/scf = Observed fuel economy = miles
scf of fuel
2.) Convert the observed fuel economy to miles per lb by dividing FEo by the density of the test fuel at standard conditions (Lb/ft3).
Note: The density of test fuel must be determined at standard conditions as described above. If the density is not defined at the above standard conditions, then a correction will be needed before the fuel economy can be calculated.
FEomi/lb = FEo / Gm
where Gm = Density of test fuel at standard conditions
3.) Convert the observed fuel economy (FEomi/lb) to an energy equivalent of
(miles/BTUx106) by dividing the observed fuel economy (FEomi/lb) by the heating value of the test fuel at standard conditions.
Eq = ((FEomi/lb)/H)x106
where
Eq = Energy equivalent of miles/lb to mile/BTUx106 H = Volumetric heating value of test fuel at standard conditions

Page 78 of 107
6-III. DISCUSSION
This is a comparative test of fuel economy using gasoline fuel with a heating value of 19,368 btu/lb. The driving cycle consists of Central Business District (CBD), Arterial (ART), and Commuter (COM) phases as described in 6-II. The fuel consumption for each driving cycle and for idle is measured separately. The results are corrected to a reference fuel with a volumetric heating value of 126,700.0 btu/gal. An extensive pretest maintenance check is made including the replacement of all lubrication fluids. The details of the pretest maintenance are given in the first three Pretest Maintenance Forms. The fourth sheet shows the Pretest Inspection. The next sheet shows the correction calculation for the test fuel. The next four Fuel Economy Forms provide the data from the four test runs. Finally, the summary sheet provides the average fuel consumption. The overall average is based on total fuel and total mileage for each phase. The overall average fuel consumption values were; CBD – 8.14 mpg, ART – 9.10 mpg, and COM – 14.24 mpg. Average fuel consumption at idle was 0.40 gal/hr.
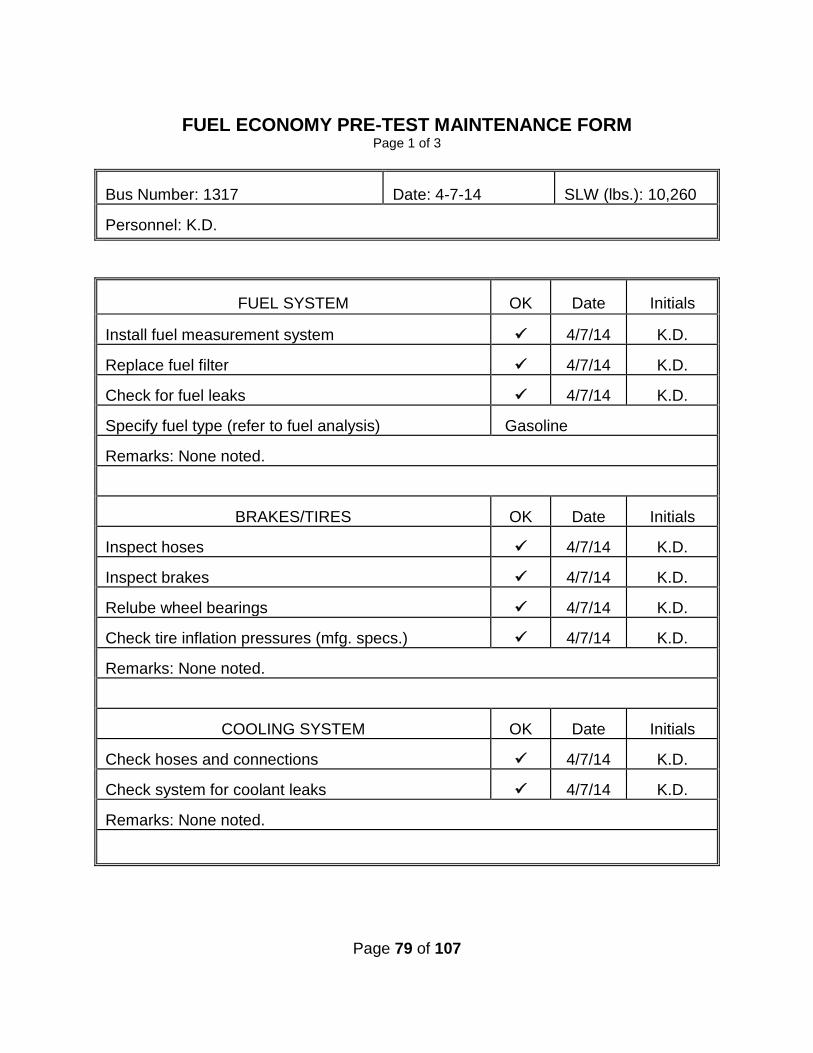
Page 79 of 107
FUEL ECONOMY PRE-TEST MAINTENANCE FORM Page 1 of 3
Bus Number: 1317
Date: 4-7-14
SLW (lbs.): 10,260
Personnel: K.D.
FUEL SYSTEM
OK
Date
Initials
Install fuel measurement system
4/7/14
K.D.
Replace fuel filter
4/7/14
K.D.
Check for fuel leaks
4/7/14
K.D.
Specify fuel type (refer to fuel analysis)
Gasoline
Remarks: None noted.
BRAKES/TIRES OK
Date
Initials
Inspect hoses
4/7/14
K.D.
Inspect brakes
4/7/14
K.D.
Relube wheel bearings
4/7/14
K.D.
Check tire inflation pressures (mfg. specs.)
4/7/14
K.D.
Remarks: None noted.
COOLING SYSTEM OK
Date
Initials
Check hoses and connections
4/7/14
K.D.
Check system for coolant leaks
4/7/14
K.D.
Remarks: None noted.
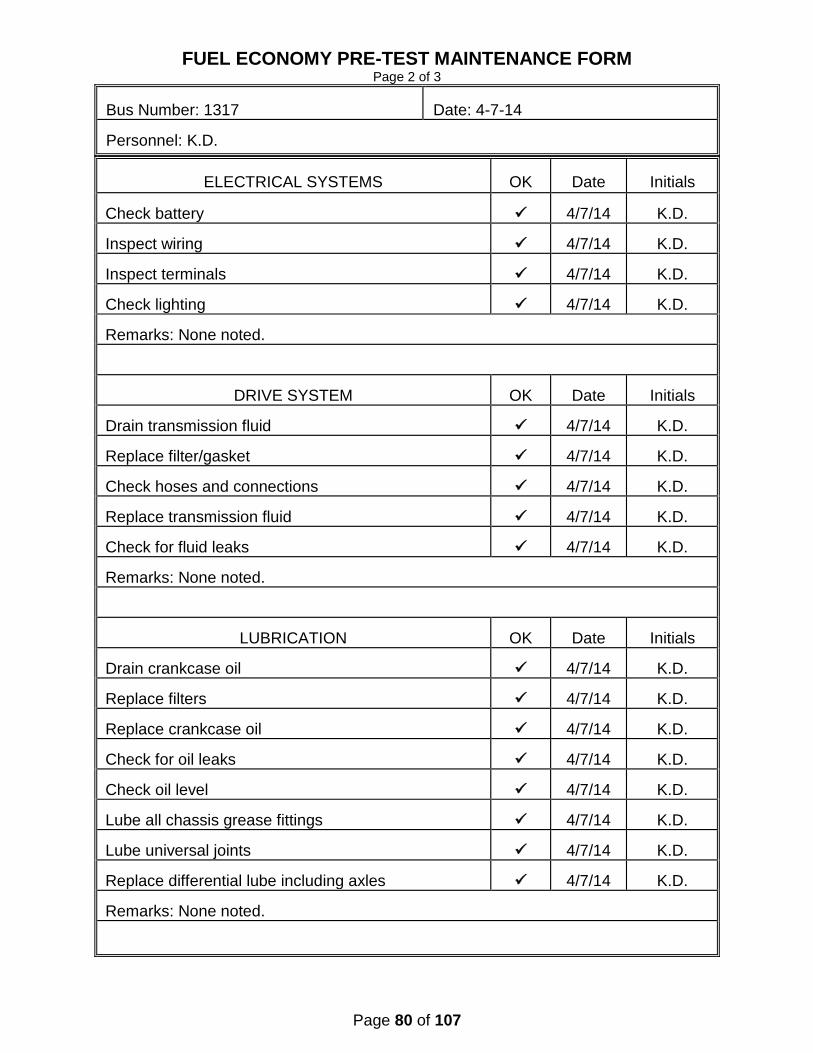
Page 80 of 107
FUEL ECONOMY PRE-TEST MAINTENANCE FORM Page 2 of 3
Bus Number: 1317
Date: 4-7-14
Personnel: K.D.
ELECTRICAL SYSTEMS
OK
Date
Initials
Check battery
4/7/14
K.D.
Inspect wiring
4/7/14
K.D.
Inspect terminals
4/7/14
K.D.
Check lighting
4/7/14
K.D.
Remarks: None noted.
DRIVE SYSTEM OK
Date
Initials
Drain transmission fluid
4/7/14
K.D.
Replace filter/gasket
4/7/14
K.D.
Check hoses and connections
4/7/14
K.D.
Replace transmission fluid
4/7/14
K.D.
Check for fluid leaks
4/7/14
K.D.
Remarks: None noted.
LUBRICATION OK
Date
Initials
Drain crankcase oil
4/7/14
K.D.
Replace filters
4/7/14
K.D.
Replace crankcase oil
4/7/14
K.D.
Check for oil leaks
4/7/14
K.D.
Check oil level
4/7/14
K.D.
Lube all chassis grease fittings
4/7/14
K.D.
Lube universal joints
4/7/14
K.D.
Replace differential lube including axles
4/7/14
K.D.
Remarks: None noted.

Page 81 of 107
FUEL ECONOMY PRE-TEST MAINTENANCE FORM Page 3 of 3
Bus Number: 1317
Date: 3-7-14
Personnel: K.D.
EXHAUST/EMISSION SYSTEM
OK
Date
Initials
Check for exhaust leaks
4/7/14
K.D.
Remarks: None noted.
ENGINE OK
Date
Initials
Replace air filter
4/7/14
K.D.
Inspect air compressor and air system
4/7/14
K.D.
Inspect vacuum system, if applicable
4/7/14
K.D.
Check and adjust all drive belts
4/7/14
K.D.
Check cold start assist, if applicable
4/7/14
K.D.
Remarks: None noted.
STEERING SYSTEM OK
Date
Initials
Check power steering hoses and connectors
4/7/14
K.D.
Service fluid level
4/7/14
K.D.
Check power steering operation
4/7/14
K.D.
Remarks: None noted.
OK
Date
Initials
Ballast bus to seated load weight
4/7/14
K.D.
TEST DRIVE
OK
Date
Initials
Check brake operation
4/7/14
K.D.
Check transmission operation
4/7/14
K.D.
Remarks: None noted.

Page 82 of 107
FUEL ECONOMY PRE-TEST INSPECTION FORM
Page 1 of 1
Bus Number: 1317
Date: 4-21-14
Personnel: T.S., S.R. & M.R.
PRE WARM-UP
If OK, Initial
Fuel Economy Pre-Test Maintenance Form is complete
K.D.
Cold tire pressure (psi): Front 60 Middle N/A Rear 60
M.R.
Tire wear:
S.R.
Engine oil level
S.R.
Engine coolant level
S.R.
Interior and exterior lights on, evaporator fan on
S.R.
Fuel economy instrumentation installed and working properly.
S.R.
Fuel line -- no leaks or kinks
S.R.
Speed measuring system installed on bus. Speed indicator installed in front of bus and accessible to TECH and Driver.
S.R.
Bus is loaded to SLW
S.R.
WARM-UP
If OK, Initial
Bus driven for at least one hour warm-up
S.R.
No extensive or black smoke from exhaust
S.R.
POST WARM-UP
If OK, Initial
Warm tire pressure (psi): Front 70 Middle N/A Rear 70
S.R.
Environmental conditions Average wind speed <12 mph and maximum gusts <15 mph Ambient temperature between 30°(-1°) and 90°F(32°C) Track surface is dry Track is free of extraneous material and clear of interfering traffic
S.R.
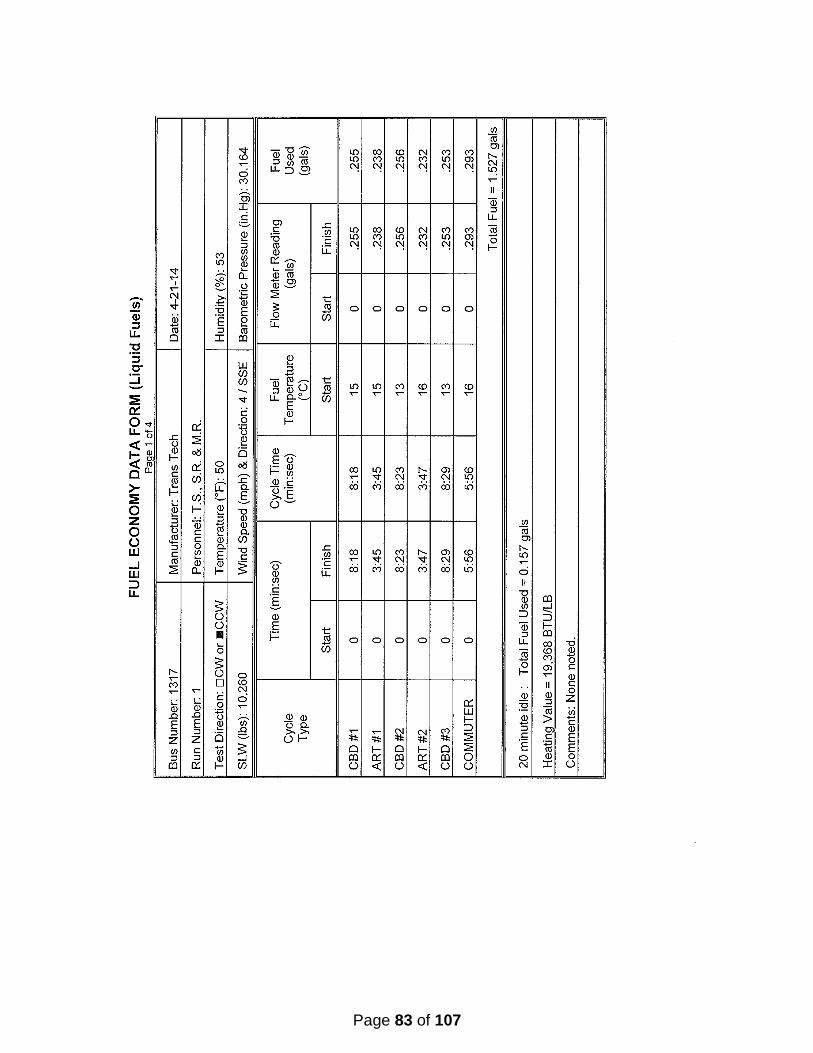
Page 83 of 107

Page 84 of 107

Page 85 of 107

Page 86 of 107
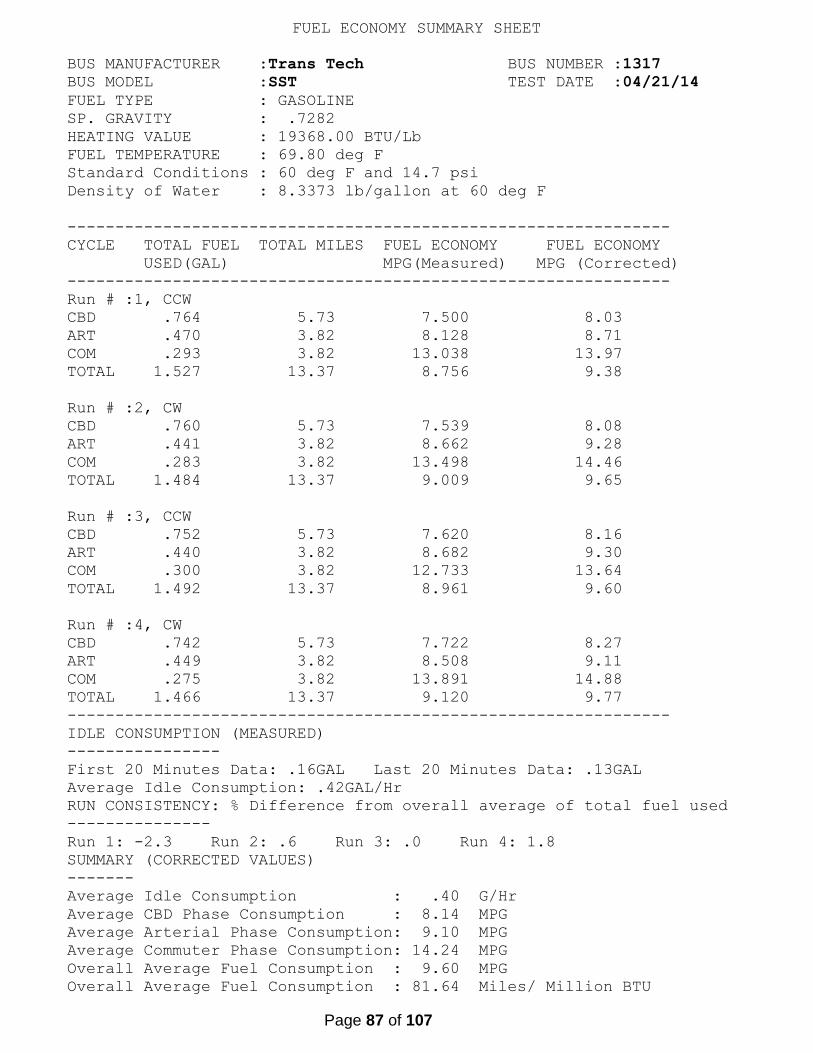
Page 87 of 107
FUEL ECONOMY SUMMARY SHEET
BUS MANUFACTURER :Trans Tech BUS NUMBER :1317
BUS MODEL :SST TEST DATE :04/21/14
FUEL TYPE : GASOLINE
SP. GRAVITY : .7282
HEATING VALUE : 19368.00 BTU/Lb
FUEL TEMPERATURE : 69.80 deg F
Standard Conditions : 60 deg F and 14.7 psi
Density of Water : 8.3373 lb/gallon at 60 deg F
---------------------------------------------------------------
CYCLE TOTAL FUEL TOTAL MILES FUEL ECONOMY FUEL ECONOMY
USED(GAL) MPG(Measured) MPG (Corrected)
---------------------------------------------------------------
Run # :1, CCW
CBD .764 5.73 7.500 8.03
ART .470 3.82 8.128 8.71
COM .293 3.82 13.038 13.97
TOTAL 1.527 13.37 8.756 9.38
Run # :2, CW
CBD .760 5.73 7.539 8.08
ART .441 3.82 8.662 9.28
COM .283 3.82 13.498 14.46
TOTAL 1.484 13.37 9.009 9.65
Run # :3, CCW
CBD .752 5.73 7.620 8.16
ART .440 3.82 8.682 9.30
COM .300 3.82 12.733 13.64
TOTAL 1.492 13.37 8.961 9.60
Run # :4, CW
CBD .742 5.73 7.722 8.27
ART .449 3.82 8.508 9.11
COM .275 3.82 13.891 14.88
TOTAL 1.466 13.37 9.120 9.77
---------------------------------------------------------------
IDLE CONSUMPTION (MEASURED)
----------------
First 20 Minutes Data: .16GAL Last 20 Minutes Data: .13GAL
Average Idle Consumption: .42GAL/Hr
RUN CONSISTENCY: % Difference from overall average of total fuel used
---------------
Run 1: -2.3 Run 2: .6 Run 3: .0 Run 4: 1.8
SUMMARY (CORRECTED VALUES)
-------
Average Idle Consumption : .40 G/Hr
Average CBD Phase Consumption : 8.14 MPG
Average Arterial Phase Consumption: 9.10 MPG
Average Commuter Phase Consumption: 14.24 MPG
Overall Average Fuel Consumption : 9.60 MPG
Overall Average Fuel Consumption : 81.64 Miles/ Million BTU

Page 88 of 107
7. NOISE
7.1 INTERIOR NOISE AND VIBRATION TESTS 7.1-I. TEST OBJECTIVE
The objective of these tests is to measure and record interior noise levels and check for audible vibration under various operating conditions. 7.1-II. TEST DESCRIPTION
During this series of tests, the interior noise level will be measured at several locations with the bus operating under the following three conditions:
1. With the bus stationary, a white noise generating system shall provide a uniform sound pressure level equal to 80 dB(A) on the left, exterior side of the bus. The engine and all accessories will be switched off and all openings including doors and windows will be closed. This test will be performed at the ABTC.
2. The bus accelerating at full throttle from a standing start to 35 mph on a level
pavement. All openings will be closed and all accessories will be operating during the test. This test will be performed on the track at the Test Track Facility.
3. The bus will be operated at various speeds from 0 to 55 mph with and without the
air conditioning and accessories on. Any audible vibration or rattles will be noted. This test will be performed on the test segment between the Test Track and the Bus Testing Center.
All tests will be performed in an area free from extraneous sound-making sources
or reflecting surfaces. The ambient sound level as well as the surrounding weather conditions will be recorded in the test data. 7.1-III. DISCUSSION
This test is performed in three parts. The first part exposes the exterior of the vehicle to 80.0 dB(A) on the left side of the bus and the noise transmitted to the interior is measured. The overall average of the six measurements was 44.2 dB(A); ranging from 42.3 dB(A) at the rear passenger seats to 47.5 dB(A) in line with the rear speaker. The interior ambient noise level for this test was < 30.0 dB(A).
The second test measures interior noise during acceleration from 0 to 35 mph. This noise level ranged from 68.3 dB(A) at the middle passenger seats 71.3 dB(A) at the driver’s seat. The overall average was 69.5 dB(A). The interior ambient noise level for this test was < 30.0 dB(A).
The third part of the test is to listen for resonant vibrations, rattles, and other noise
sources while operating over the road. No vibrations or rattles were noted.
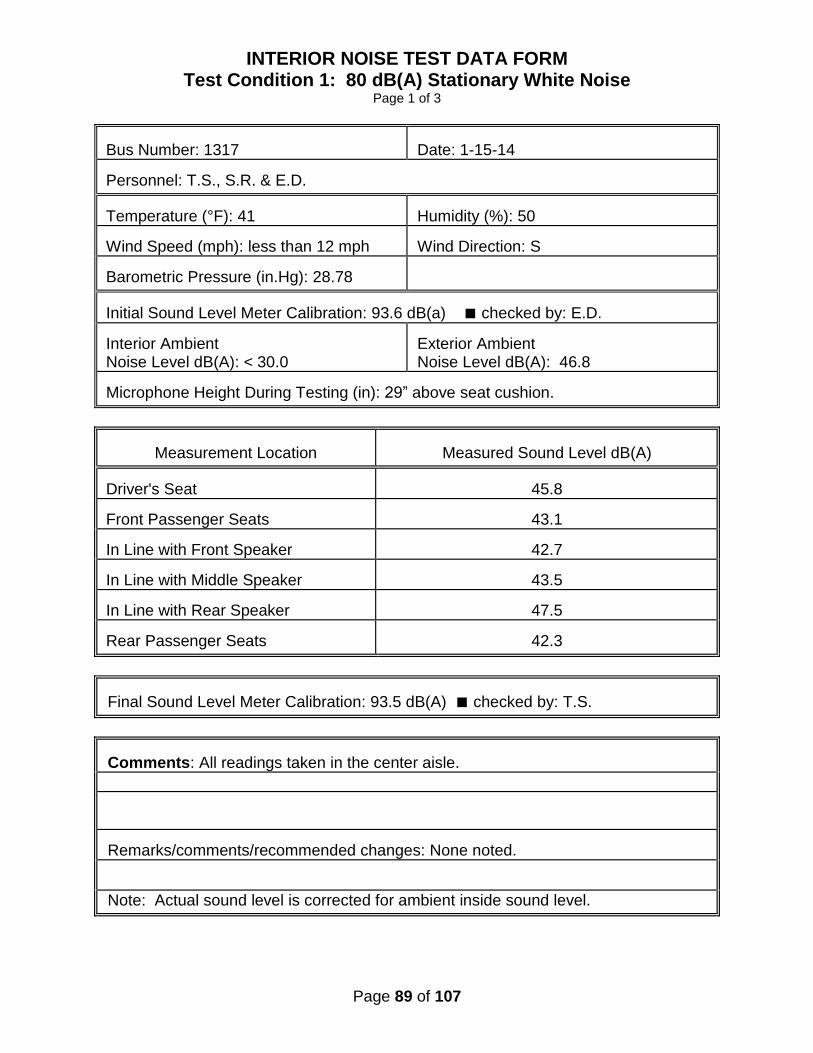
Page 89 of 107
INTERIOR NOISE TEST DATA FORM Test Condition 1: 80 dB(A) Stationary White Noise
Page 1 of 3
Bus Number: 1317
Date: 1-15-14
Personnel: T.S., S.R. & E.D.
Temperature (°F): 41
Humidity (%): 50
Wind Speed (mph): less than 12 mph
Wind Direction: S
Barometric Pressure (in.Hg): 28.78
Initial Sound Level Meter Calibration: 93.6 dB(a) ■ checked by: E.D. Interior Ambient Noise Level dB(A): < 30.0
Exterior Ambient Noise Level dB(A): 46.8
Microphone Height During Testing (in): 29” above seat cushion.
Measurement Location
Measured Sound Level dB(A)
Driver's Seat
45.8
Front Passenger Seats
43.1
In Line with Front Speaker
42.7
In Line with Middle Speaker
43.5
In Line with Rear Speaker
47.5
Rear Passenger Seats
42.3
Final Sound Level Meter Calibration: 93.5 dB(A) ■ checked by: T.S.
Comments: All readings taken in the center aisle.
Remarks/comments/recommended changes: None noted.
Note: Actual sound level is corrected for ambient inside sound level.
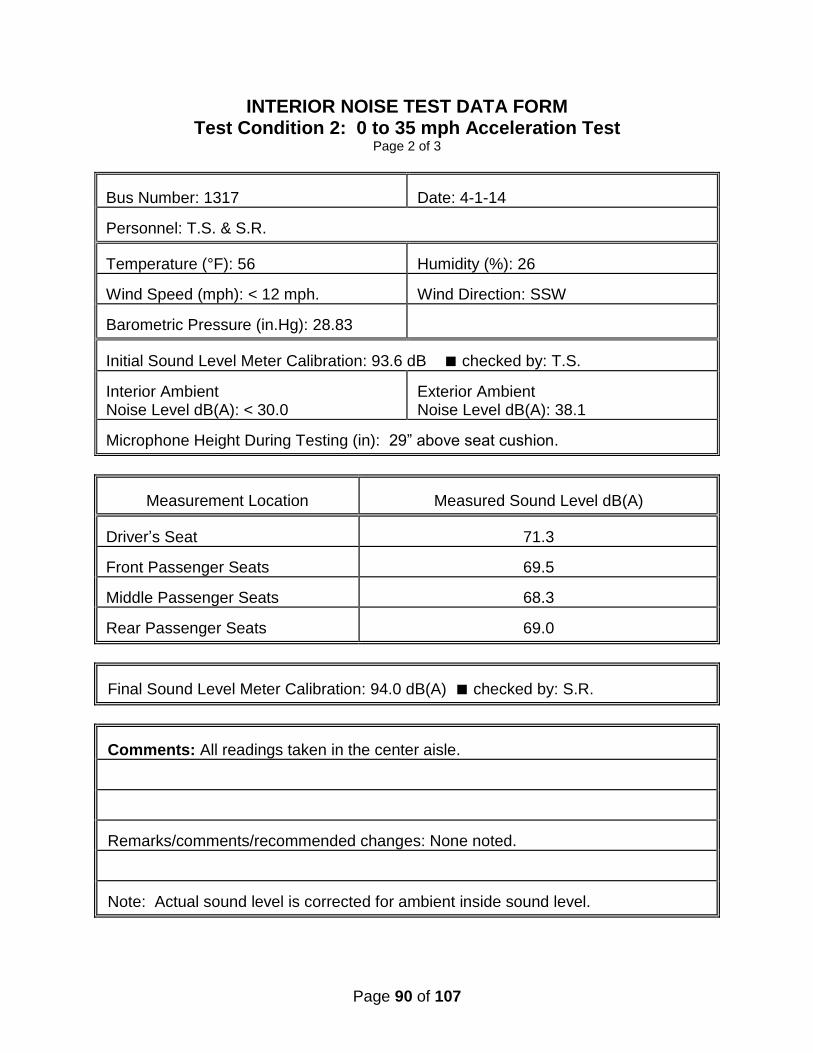
Page 90 of 107
INTERIOR NOISE TEST DATA FORM Test Condition 2: 0 to 35 mph Acceleration Test
Page 2 of 3
Bus Number: 1317
Date: 4-1-14
Personnel: T.S. & S.R.
Temperature (°F): 56
Humidity (%): 26
Wind Speed (mph): < 12 mph.
Wind Direction: SSW
Barometric Pressure (in.Hg): 28.83
Initial Sound Level Meter Calibration: 93.6 dB ■ checked by: T.S. Interior Ambient Noise Level dB(A): < 30.0
Exterior Ambient Noise Level dB(A): 38.1
Microphone Height During Testing (in): 29” above seat cushion.
Measurement Location
Measured Sound Level dB(A)
Driver’s Seat
71.3
Front Passenger Seats
69.5
Middle Passenger Seats
68.3
Rear Passenger Seats
69.0
Final Sound Level Meter Calibration: 94.0 dB(A) ■ checked by: S.R.
Comments: All readings taken in the center aisle. Remarks/comments/recommended changes: None noted. Note: Actual sound level is corrected for ambient inside sound level.
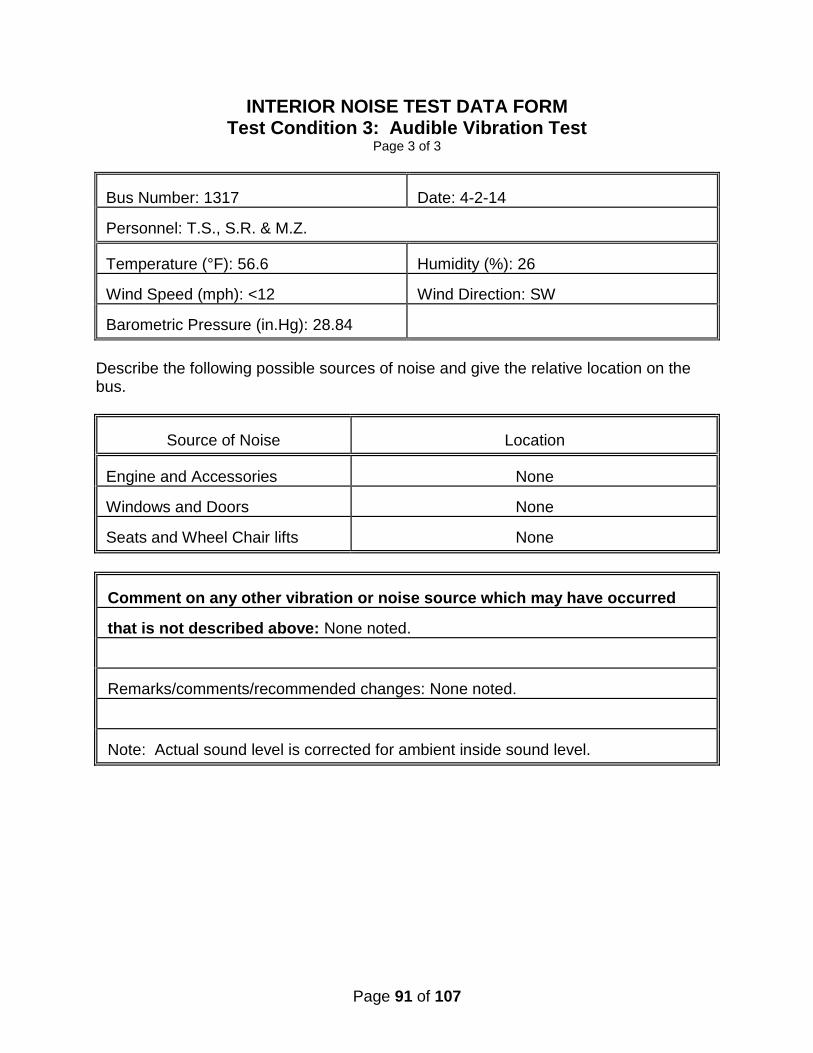
Page 91 of 107
INTERIOR NOISE TEST DATA FORM Test Condition 3: Audible Vibration Test
Page 3 of 3
Bus Number: 1317
Date: 4-2-14
Personnel: T.S., S.R. & M.Z.
Temperature (°F): 56.6
Humidity (%): 26
Wind Speed (mph): <12
Wind Direction: SW
Barometric Pressure (in.Hg): 28.84
Describe the following possible sources of noise and give the relative location on the bus.
Source of Noise
Location
Engine and Accessories
None
Windows and Doors
None
Seats and Wheel Chair lifts
None
Comment on any other vibration or noise source which may have occurred that is not described above: None noted. Remarks/comments/recommended changes: None noted. Note: Actual sound level is corrected for ambient inside sound level.
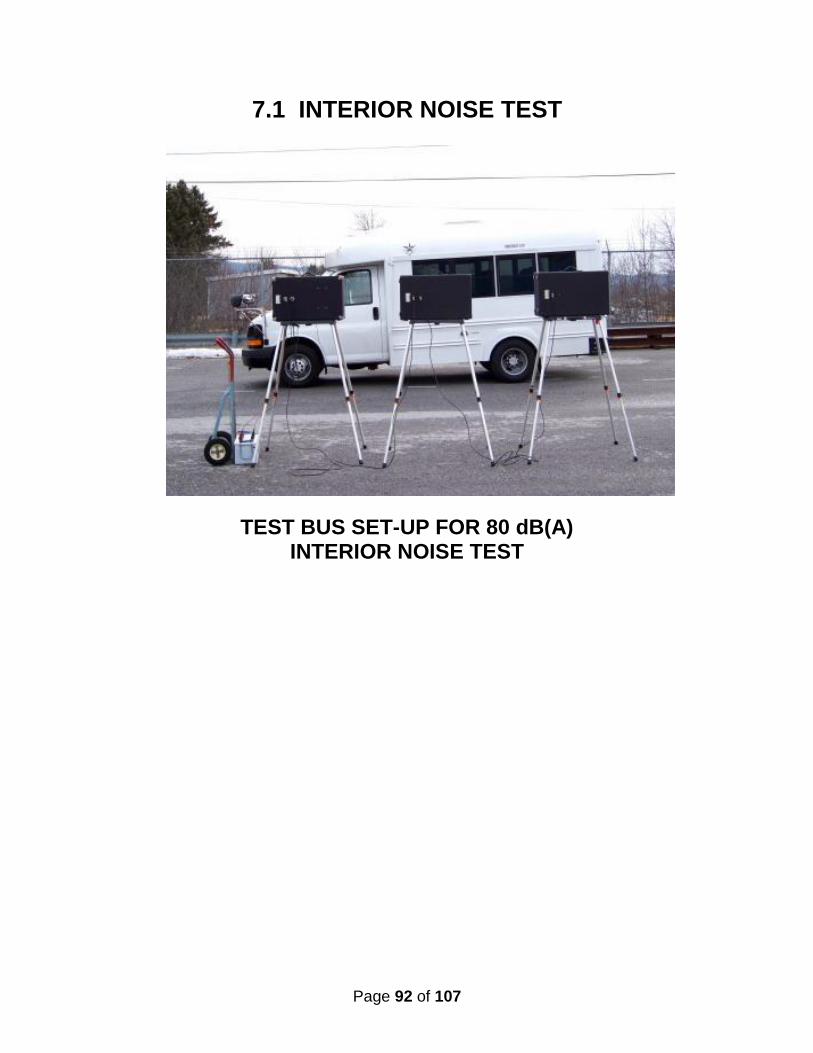
Page 92 of 107
7.1 INTERIOR NOISE TEST
TEST BUS SET-UP FOR 80 dB(A) INTERIOR NOISE TEST

Page 93 of 107
7.2 EXTERIOR NOISE TESTS 7.2-I. TEST OBJECTIVE
The objective of this test is to record exterior noise levels when a bus is operated under various conditions. 7.2-II. TEST DESCRIPTION
In the exterior noise tests, the bus will be operated at a SLW in three different conditions using a smooth, straight and level roadway:
1. Accelerating at full throttle from a constant speed at or below 35 mph and just prior to transmission upshift.
2. Accelerating at full throttle from standstill. 3. Stationary, with the engine at low idle, high idle, and wide open throttle.
In addition, the buses will be tested with and without the air conditioning and all
accessories operating. The exterior noise levels will be recorded.
The test site is at the PSBRTF and the test procedures will be in accordance with SAE Standards SAE J366b, Exterior Sound Level for Heavy Trucks and Buses. The test site is an open space free of large reflecting surfaces. A noise meter placed at a specified location outside the bus will measure the noise level.
During the test, special attention should be paid to:
1. The test site characteristics regarding parked vehicles, signboards, buildings, or other sound-reflecting surfaces
2. Proper usage of all test equipment including set-up and calibration 3. The ambient sound level
7.2-III. DISCUSSION
The Exterior Noise Test determines the noise level generated by the vehicle under different driving conditions and at stationary low and high idle, with and without air conditioning and accessories operating. The test site is a large, level, bituminous paved area with no reflecting surfaces nearby. With an exterior ambient noise level of 39.5 dB(A), the average test result obtained while accelerating from a constant speed was 72.9 dB(A) on the right side and 73.7 dB(A) on the left side.
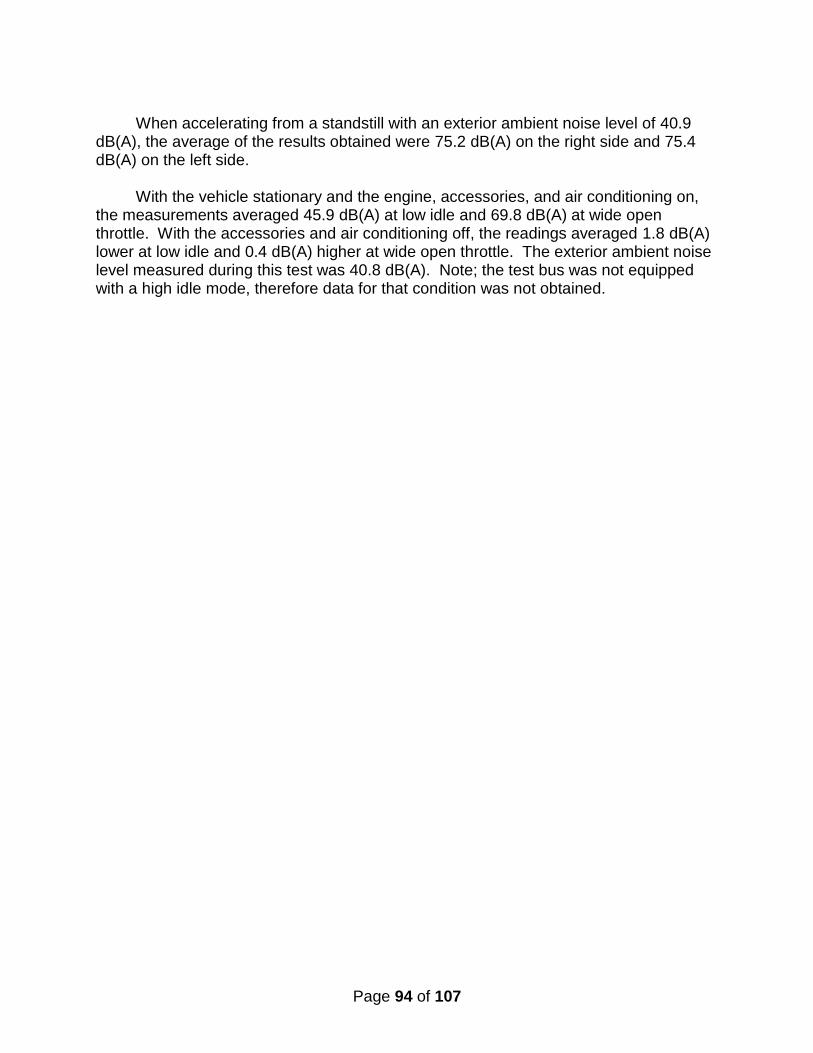
Page 94 of 107
When accelerating from a standstill with an exterior ambient noise level of 40.9
dB(A), the average of the results obtained were 75.2 dB(A) on the right side and 75.4 dB(A) on the left side.
With the vehicle stationary and the engine, accessories, and air conditioning on, the measurements averaged 45.9 dB(A) at low idle and 69.8 dB(A) at wide open throttle. With the accessories and air conditioning off, the readings averaged 1.8 dB(A) lower at low idle and 0.4 dB(A) higher at wide open throttle. The exterior ambient noise level measured during this test was 40.8 dB(A). Note; the test bus was not equipped with a high idle mode, therefore data for that condition was not obtained.

Page 95 of 107
EXTERIOR NOISE TEST DATA FORM Accelerating from Constant Speed
Page 1 of 3
Bus Number: 1317
Date: 4-1-14
Personnel: T.S., S.R. & M.H.
Temperature (°F): 52
Humidity (%): 30
Wind Speed (mph): <12
Wind Direction: S
Barometric Pressure (in.Hg): 28.72
Verify that microphone height is 4 feet, wind speed is less than 12 mph and ambient temperature is between 30°F and 90°F: ■ checked by: S.R. Initial Sound Level Meter Calibration: 93.6 dB(A) ■ checked by: T.S. Exterior Ambient Noise Level dB(A): 39.5
Accelerating from Constant Speed Curb (Right) Side
Accelerating from Constant Speed
Street (Left) Side
Run #
Measured Noise Level dB(A)
Run #
Measured Noise Level
dB(A)
1
72.8
1
73.3
2
72.9
2
73.0
3
72.8
3
73.8
4
72.3
4
73.6
5
5
Average of two highest actual noise levels = 72.9 dB(A)
Average of two highest actual noise levels = 73.7 dB(A)
Final Sound Level Meter Calibration Check: 93.6 dB(A) ■ checked by: T.S.
Remarks/comments/recommended changes: None noted.
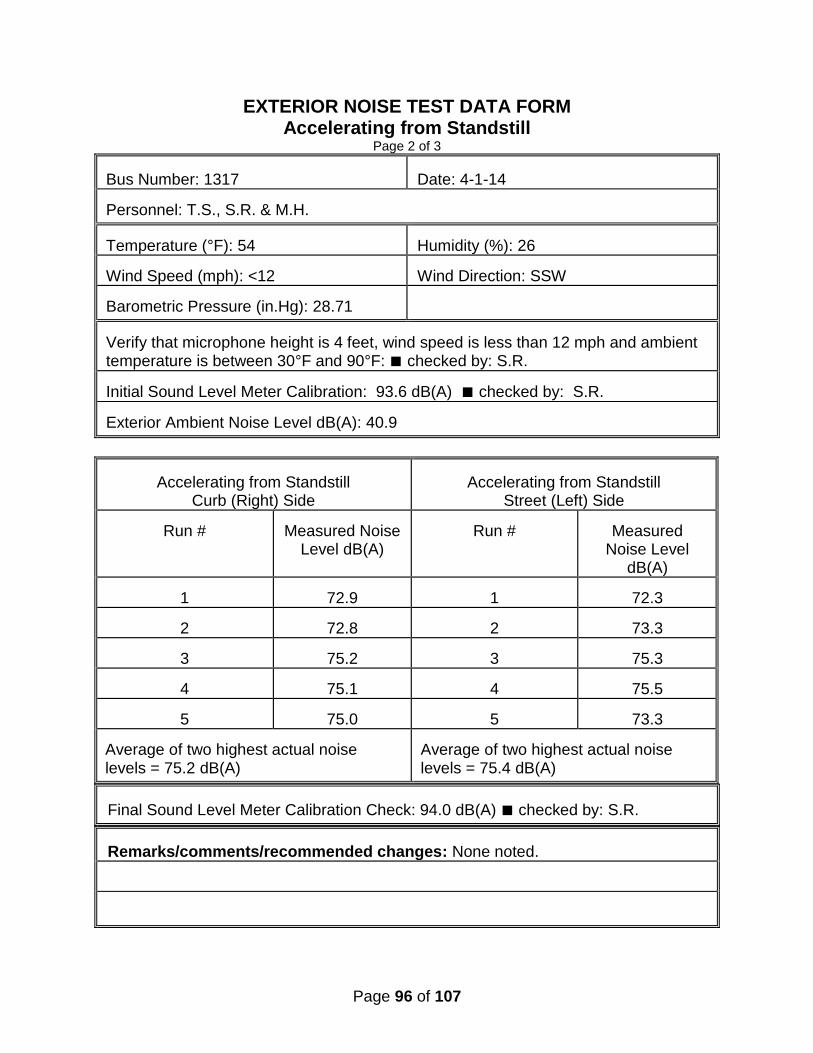
Page 96 of 107
EXTERIOR NOISE TEST DATA FORM Accelerating from Standstill
Page 2 of 3
Bus Number: 1317
Date: 4-1-14
Personnel: T.S., S.R. & M.H.
Temperature (°F): 54
Humidity (%): 26
Wind Speed (mph): <12
Wind Direction: SSW
Barometric Pressure (in.Hg): 28.71
Verify that microphone height is 4 feet, wind speed is less than 12 mph and ambient temperature is between 30°F and 90°F: ■ checked by: S.R. Initial Sound Level Meter Calibration: 93.6 dB(A) ■ checked by: S.R. Exterior Ambient Noise Level dB(A): 40.9
Accelerating from Standstill Curb (Right) Side
Accelerating from Standstill
Street (Left) Side
Run # Measured Noise
Level dB(A)
Run #
Measured
Noise Level dB(A)
1
72.9
1
72.3
2
72.8
2
73.3
3
75.2
3
75.3
4
75.1
4
75.5
5
75.0
5
73.3
Average of two highest actual noise levels = 75.2 dB(A)
Average of two highest actual noise levels = 75.4 dB(A)
Final Sound Level Meter Calibration Check: 94.0 dB(A) ■ checked by: S.R.
Remarks/comments/recommended changes: None noted.
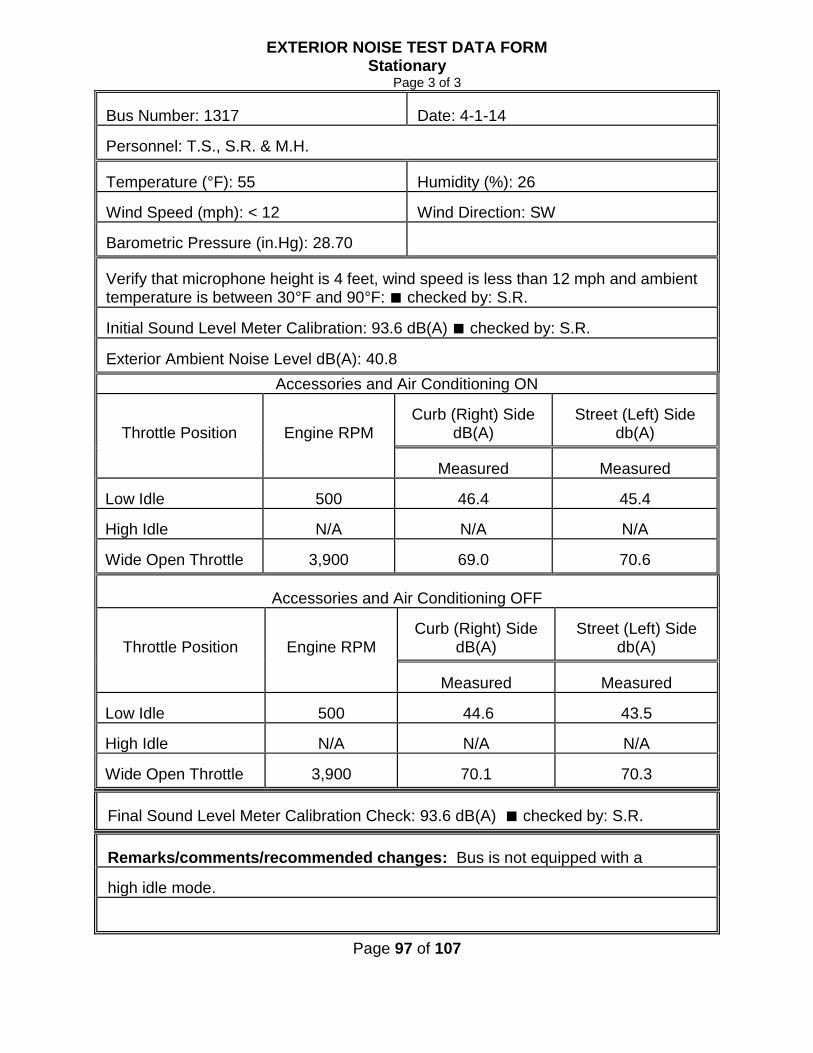
Page 97 of 107
EXTERIOR NOISE TEST DATA FORM Stationary
Page 3 of 3
Bus Number: 1317
Date: 4-1-14
Personnel: T.S., S.R. & M.H.
Temperature (°F): 55
Humidity (%): 26
Wind Speed (mph): < 12
Wind Direction: SW
Barometric Pressure (in.Hg): 28.70
Verify that microphone height is 4 feet, wind speed is less than 12 mph and ambient temperature is between 30°F and 90°F: ■ checked by: S.R. Initial Sound Level Meter Calibration: 93.6 dB(A) ■ checked by: S.R. Exterior Ambient Noise Level dB(A): 40.8
Accessories and Air Conditioning ON
Throttle Position
Engine RPM
Curb (Right) Side
dB(A)
Street (Left) Side
db(A)
Measured
Measured
Low Idle
500
46.4
45.4
High Idle
N/A
N/A
N/A
Wide Open Throttle
3,900
69.0
70.6
Accessories and Air Conditioning OFF
Throttle Position
Engine RPM
Curb (Right) Side
dB(A)
Street (Left) Side
db(A)
Measured
Measured
Low Idle
500
44.6
43.5
High Idle
N/A
N/A
N/A
Wide Open Throttle
3,900
70.1
70.3
Final Sound Level Meter Calibration Check: 93.6 dB(A) ■ checked by: S.R.
Remarks/comments/recommended changes: Bus is not equipped with a high idle mode.
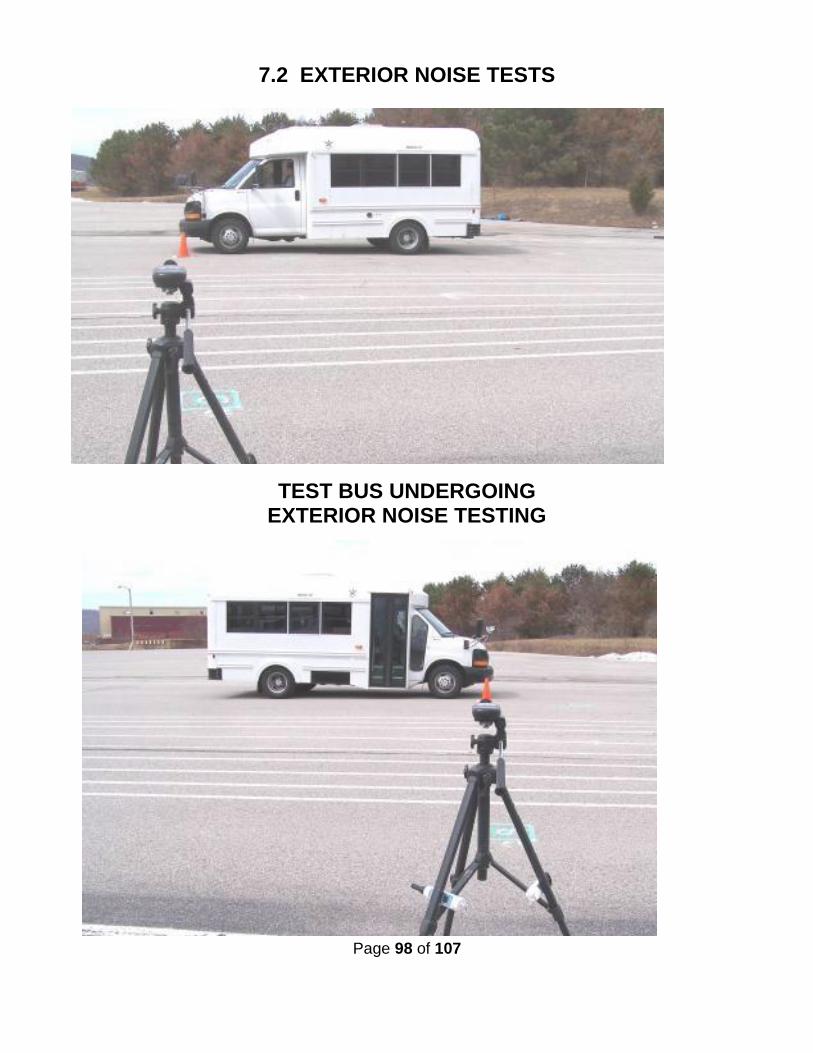
Page 98 of 107
7.2 EXTERIOR NOISE TESTS
TEST BUS UNDERGOING EXTERIOR NOISE TESTING
Page 99 of 107
8. EMISSIONS TEST – DYNAMOMETER-BASED EMISSIONS TEST USING TRANSIT DRIVING CYCLES
8-I. TEST OBJECTIVE
The objective of this test is to provide comparable emissions data on transit buses
produced by different manufacturers. This chassis-based emissions test bears no
relation to engine certification testing performed for compliance with the Environmental
Protection Agency (EPA) regulation. EPA's certification tests are performed using an
engine dynamometer operating under the Federal Test Protocol. This emissions test is
a measurement of the gaseous engine emissions CO, CO2, NOx, HC and particulates
(diesel vehicles) produced by a vehicle operating on a large-roll chassis dynamometer.
The test is performed for three differed driving cycles intended to simulate a range of
transit operating environments. The cycles consist of Manhattan Cycle, the Orange
County Bus driving cycle, and the Urban Dynamometer Driving Cycle (UDDS). The test
is performed under laboratory conditions in compliance with EPA 1065 and SAE J2711.
The results of this test may not represent actual in-service vehicle emissions but will
provide data that can be used by recipients to compare buses tested under different
operating conditions.
8-II. TEST DESCRIPTION
This test is performed in the emissions bay of the LTI Vehicle Testing Laboratory.
The Laboratory is equipped with a Schenk Pegasus 300 HP, large-roll (72 inch
diameter) chassis dynamometer suitable for heavy-vehicle emissions testing. The
dynamometer is located in the end test bay and is adjacent to the control room and
emissions analysis area. The emissions laboratory provides capability for testing heavy-
duty diesel and alternative-fueled buses for a variety of tailpipe emissions including
particulate matter, oxides of nitrogen, carbon monoxide, carbon dioxide, and
hydrocarbons. It is equipped with a Horiba full-scale CVS dilution tunnel and emissions
sampling system. The system includes Horiba Mexa 7400 Series gas analyzers and a
Horiba HF47 Particulate Sampling System. Test operation is automated using Horiba
CDTCS software. The computer controlled dynamometer is capable of simulating over-
the-road operation for a variety of vehicles and driving cycles.
The emissions test will be performed as soon as permissible after the completion
of the GVW portion of the structural durability test. The driving cycles are the Manhattan
cycle, a low average speed, highly transient urban cycle (Figure 1), the Orange County
Bus Cycle which consists of urban and highway driving segments (Figure 2), and the
EPA UDDS Cycle (Figure 3). An emissions test will comprise of two runs for the three

Page 100 of 107
different driving cycles, and the average value will be reported. Test results reported will
include the average grams per mile value for each of the gaseous emissions for
gasoline buses, for all the three driving cycles. In addition, the particulate matter
emissions are included for diesel buses, and non-methane hydrocarbon emissions
(NMHC) are included for CNG buses. Testing is performed in accordance with EPA
CFR49, Part 1065 and SAE J2711 as practically determined by the FTA Emissions
Testing Protocol developed by West Virginia University and Penn State University.
Figure 1. Manhattan Driving Cycle (duration 1089 sec, Maximum speed 25.4mph,
average speed 6.8mph)

Page 101 of 107
Figure 2. Orange County Bus Cycle (Duration 1909 Sec, Maximum Speed 41mph,
Average Speed 12mph)
Figure 3. HD-UDDS Cycle (duration 1060seconds, Maximum Speed 58mph, Average
Speed 18.86mph)
8-III. TEST ARTICLE
The test article is a Trans Tech model Student Safety Transporter (SST) transit
bus equipped with GMC 6.0 L gasoline fueled engine. The bus was tested on April 15,
2014.
8-IV. TEST EQUIPMENT
Testing is performed in the LTI Vehicle Testing Laboratory emissions testing bay.
The test bay is equipped with a Schenk Pegasus 72-inch, large-roll chassis
dynamometer. The dynamometer is electronically controlled to account for vehicle
road-load characteristics and for simulating the inertia characteristics of the vehicle.
Power to the roller is supplied and absorbed through an electronically controlled 3-
phase ac motor. Absorbed power is dumped back onto the electrical grid.
Vehicle exhaust is collected by a Horiba CVS, full-flow dilution tunnel. The system
has separate tunnels for diesel and gasoline/natural gas fueled vehicles. In the case of
diesel vehicles, particulate emissions are measured gravimetrically using 47mm Teflon
Page 102 of 107
filters. These filters are housed in a Horiba HF47 particulate sampler, per EPA 1065
test procedures. Heated gaseous emissions of hydrocarbons and NOx are sampled by
Horiba heated oven analyzers. Gaseous
emissions for CO, CO2 and cold NOx are measured using a Horiba Mexa 7400 series
gas analyzer. System operation, including the operation of the chassis dynamometer,
and all calculations are controlled by a Dell workstation running Horiba CDCTS test
control software. Particulate Filters are weighed in a glove box using a Sartorius
microbalance accurate to 1 microgram.
8-V. TEST PREPARATION AND PROCEDURES
All vehicles are prepared for emissions testing in accordance with the Fuel
Economy Pre-Test Maintenance Form. (In the event that fuel economy test was
performed immediately prior to emissions testing this step does not have to be
repeated) This is done to ensure that the bus is tested in optimum operating condition.
The manufacturer-specified preventive maintenance shall be performed before this test.
The ABS system and when applicable, the regenerative braking system are disabled for
operation on the chassis dynamometer. Any manufacturer-recommended changes to
the pre-test maintenance procedure must be noted on the revision sheet. The Fuel
Economy Pre-Test Inspection Form will also be completed before performing. Both the
Fuel Economy Pre-Test Maintenance Form and the Fuel Economy Pre-Test Inspection
Form are found on the following pages.
Prior to performing the emissions test, each bus is evaluated to determine its
road-load characteristics using coast-down techniques in accordance with SAE J1263.
This data is used to program the chassis dynamometer to accurately simulate over-the-
road operation of the bus.
Warm-up consists of driving the bus for 20 minutes at approximately 40 mph on
the chassis dynamometer. The test driver follows the prescribed driving cycle watching
the speed trace and instructions on the Horiba Drivers-Aid monitor which is placed in
front of the windshield. The CDCTS computer monitors driver performance and reports
any errors that could potentially invalidate the test.
All buses are tested at half seated load weight. The base line emissions data are
obtained at the following conditions:
1. Air conditioning off
2. Evaporator fan or ventilation fan on
3. One Half Seated load weight
4. Appropriate test fuel with energy content (BTU/LB) noted in CDTCS software
5. Exterior and interior lights on
6. Heater Pump Motor off

Page 103 of 107
7. Defroster off
8. Windows and Doors closed
The test tanks or the bus fuel tank(s) will be filled prior to the fuel economy test
with the appropriate grade of test fuel.
8-VI DISCUSSION
The following Table 1 provides the emissions testing results on a grams per mile
basis for each of the exhaust constituents measured and for each driving cycle
performed.
TABLE 1 Emissions Test Results
Test Completed at Half SLW: _9,240 lbs________
Driving Cycle Manhattan Orange County Bus
UDDS
CO2, gm/mi 1,569 1,042 765
CO, gm/mi 6.25 20.3 13.2
THC, gm/mi 0.40 0.60 0.45
NMHC, gm/mi 0.20 0.35 0.28
NOx, gm/mi 0.11 0 0.08
Particulates. gm/mi
N/A N/A N/A
Fuel consumption
mpg
5.47 7.95 11.94

Page 104 of 107
FUEL ECONOMY/EMISSIONS PRE-TEST MAINTENANCE FORM Page 1 of 3
Bus Number: 1317
Date: 4-7-14
SLW (lbs): 10,260
Personnel: K.D.
FUEL SYSTEM
OK
Date
Initials
Install fuel measurement system
4/7/14
K.D.
Replace fuel filter
4/7/14
K.D.
Check for fuel leaks
4/7/14
K.D.
Specify fuel type (refer to fuel analysis)
Gasoline
Remarks: None noted.
BRAKES/TIRES OK
Date
Initials
Inspect hoses
4/7/14
K.D.
Inspect brakes
4/7/14
K.D.
Relube wheel bearings
4/7/14
K.D.
Check tire inflation pressures (mfg. specs.)
4/7/14
K.D.
Remarks: None noted.
COOLING SYSTEM OK
Date
Initials
Check hoses and connections
4/7/14
K.D.
Check system for coolant leaks
4/7/14
K.D.
Remarks: None noted.
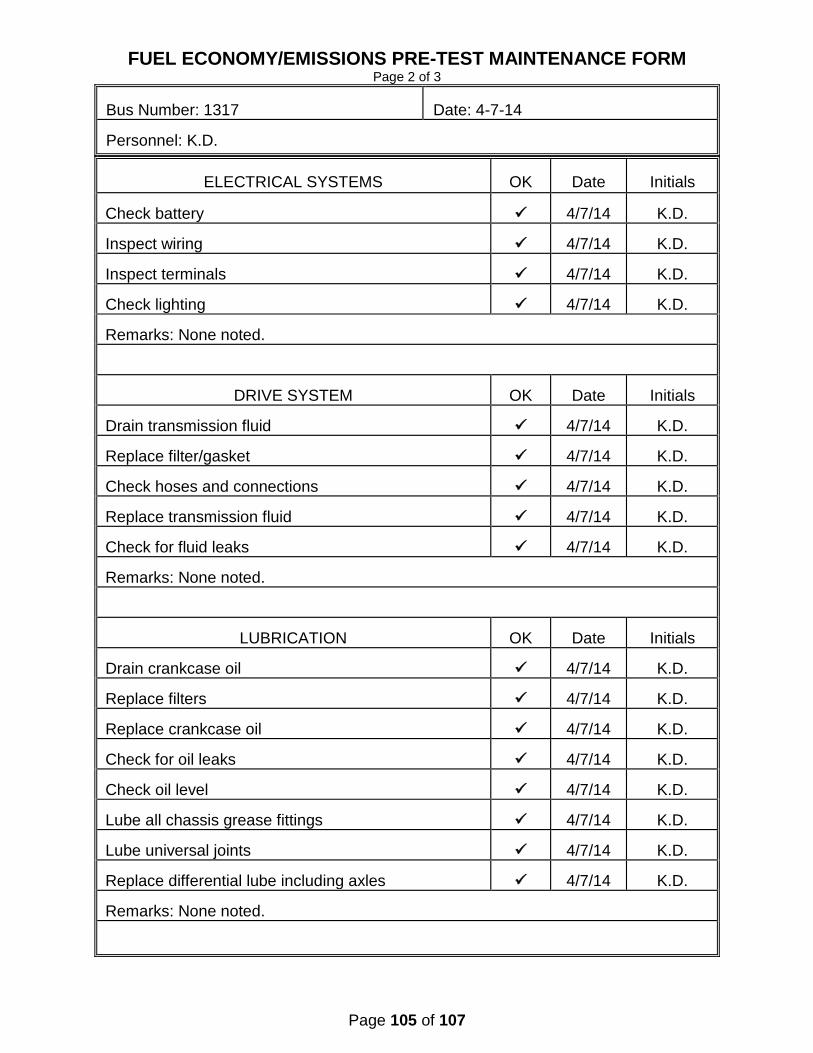
Page 105 of 107
FUEL ECONOMY/EMISSIONS PRE-TEST MAINTENANCE FORM Page 2 of 3
Bus Number: 1317
Date: 4-7-14
Personnel: K.D.
ELECTRICAL SYSTEMS
OK
Date
Initials
Check battery
4/7/14
K.D.
Inspect wiring
4/7/14
K.D.
Inspect terminals
4/7/14
K.D.
Check lighting
4/7/14
K.D.
Remarks: None noted.
DRIVE SYSTEM OK
Date
Initials
Drain transmission fluid
4/7/14
K.D.
Replace filter/gasket
4/7/14
K.D.
Check hoses and connections
4/7/14
K.D.
Replace transmission fluid
4/7/14
K.D.
Check for fluid leaks
4/7/14
K.D.
Remarks: None noted.
LUBRICATION OK
Date
Initials
Drain crankcase oil
4/7/14
K.D.
Replace filters
4/7/14
K.D.
Replace crankcase oil
4/7/14
K.D.
Check for oil leaks
4/7/14
K.D.
Check oil level
4/7/14
K.D.
Lube all chassis grease fittings
4/7/14
K.D.
Lube universal joints
4/7/14
K.D.
Replace differential lube including axles
4/7/14
K.D.
Remarks: None noted.

Page 106 of 107
FUEL ECONOMY/EMISSIONS PRE-TEST MAINTENANCE FORM Page 3 of 3
Bus Number: 1317
Date: 3-7-14
Personnel: K.D.
EXHAUST/EMISSION SYSTEM
OK
Date
Initials
Check for exhaust leaks
4/7/14
K.D.
Remarks: None noted.
ENGINE OK
Date
Initials
Replace air filter
4/7/14
K.D.
Inspect air compressor and air system
4/7/14
K.D.
Inspect vacuum system, if applicable
4/7/14
K.D.
Check and adjust all drive belts
4/7/14
K.D.
Check cold start assist, if applicable
4/7/14
K.D.
Remarks: None noted.
STEERING SYSTEM OK
Date
Initials
Check power steering hoses and connectors
4/7/14
K.D.
Service fluid level
4/7/14
K.D.
Check power steering operation
4/7/14
K.D.
Remarks: None noted.
OK
Date
Initials
Ballast bus to seated load weight
4/7/14
K.D.
TEST DRIVE
OK
Date
Initials
Check brake operation
4/7/14
K.D.
Check transmission operation
4/7/14
K.D.
Remarks: None noted.
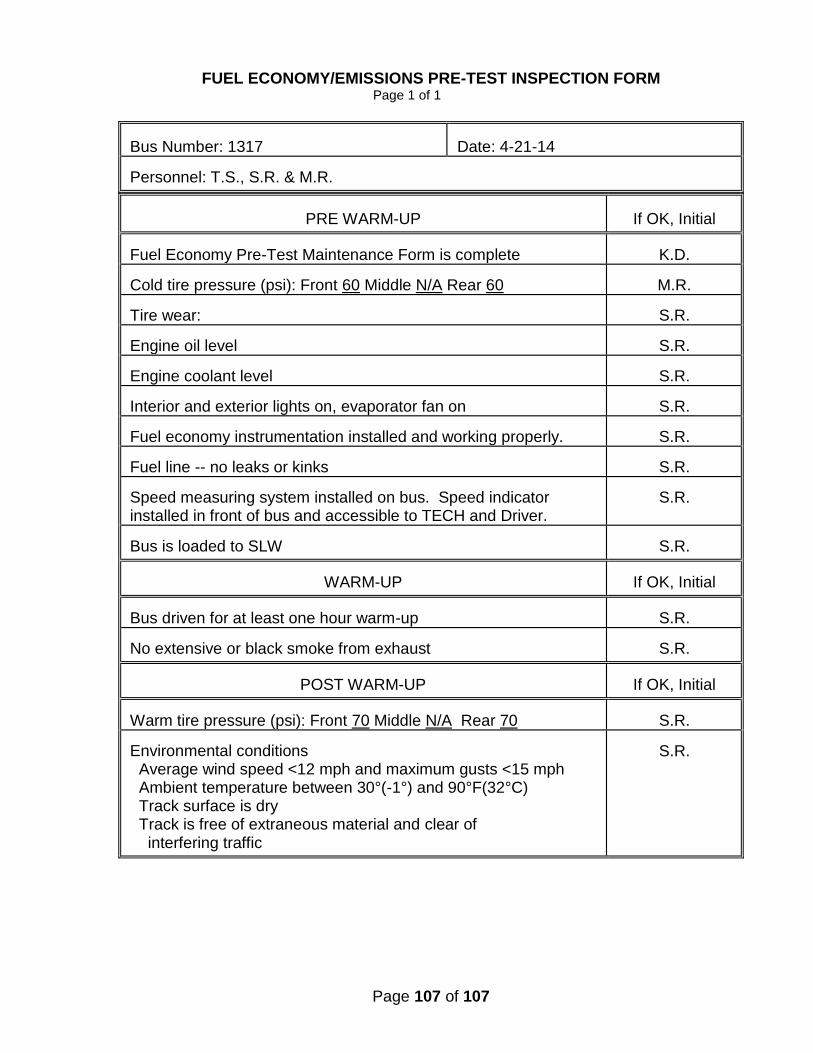
Page 107 of 107
FUEL ECONOMY/EMISSIONS PRE-TEST INSPECTION FORM
Page 1 of 1
Bus Number: 1317
Date: 4-21-14
Personnel: T.S., S.R. & M.R.
PRE WARM-UP
If OK, Initial
Fuel Economy Pre-Test Maintenance Form is complete
K.D.
Cold tire pressure (psi): Front 60 Middle N/A Rear 60
M.R.
Tire wear:
S.R.
Engine oil level
S.R.
Engine coolant level
S.R.
Interior and exterior lights on, evaporator fan on
S.R.
Fuel economy instrumentation installed and working properly.
S.R.
Fuel line -- no leaks or kinks
S.R.
Speed measuring system installed on bus. Speed indicator installed in front of bus and accessible to TECH and Driver.
S.R.
Bus is loaded to SLW
S.R.
WARM-UP
If OK, Initial
Bus driven for at least one hour warm-up
S.R.
No extensive or black smoke from exhaust
S.R.
POST WARM-UP
If OK, Initial
Warm tire pressure (psi): Front 70 Middle N/A Rear 70
S.R.
Environmental conditions Average wind speed <12 mph and maximum gusts <15 mph Ambient temperature between 30°(-1°) and 90°F(32°C) Track surface is dry Track is free of extraneous material and clear of interfering traffic
S.R.