Federal Reserve Bank of New York Staff Reports · How and Why Do Small Firms Manage Interest Rate...
50
Federal Reserve Bank of New York Staff Reports How and Why Do Small Firms Manage Interest Rate Risk? Evidence from Commercial Loans James Vickery Staff Report no. 215 August 2005 Revised September 2006 This paper presents preliminary findings and is being distributed to economists and other interested readers solely to stimulate discussion and elicit comments. The views expressed in the paper are those of the author and are not necessarily reflective of views at the Federal Reserve Bank of New York or the Federal Reserve System. Any errors or omissions are the responsibility of the author.
Transcript of Federal Reserve Bank of New York Staff Reports · How and Why Do Small Firms Manage Interest Rate...

Federal Reserve Bank of New York
Staff Reports
How and Why Do Small Firms Manage Interest Rate Risk?
Evidence from Commercial Loans
James Vickery
Staff Report no. 215
August 2005
Revised September 2006
This paper presents preliminary findings and is being distributed to economists
and other interested readers solely to stimulate discussion and elicit comments.
The views expressed in the paper are those of the author and are not necessarily
reflective of views at the Federal Reserve Bank of New York or the Federal
Reserve System. Any errors or omissions are the responsibility of the author.
How and Why Do Small Firms Manage Interest Rate Risk?
Evidence from Commercial Loans
James Vickery
Federal Reserve Bank of New York Staff Reports, no. 215
August 2005; revised September 2006
JEL classification: G21, G30
Although small firms are particularly sensitive to interest rates and other external shocks,
empirical work on corporate risk management has focused instead on large public
companies. This paper studies fixed-rate and adjustable-rate loans to see how small firms
manage their exposure to interest rate risk. Credit-constrained firms are found to match
significantly more often with fixed-rate loans, consistent with prior research showing that
the supply of internal and external finance shrinks during periods of rising interest rates.
Banks originate a higher share of adjustable-rate loans than other lender types, ameliorating
maturity mismatch and exposure to the lending channel of monetary policy. Time-series
patterns in the share of fixed-rate commercial loans are consistent with recent evidence on
“debt market timing.”
Key words: fixed-rate loan, adjustable-rate loan, corporate risk management,
interest rate risk
Vickery: Federal Reserve Bank of New York (e-mail: james.vickery@ ny.frb.org). This paper is a revised
version of part of the author’s doctoral thesis at the Massachusetts Institute of Technology. The author
thanks his thesis advisers, Ricardo Caballero, David Scharfstein, and Robert Townsend, for their generous
guidance, as well as Allen Berger, Olivier Blanchard, Bengt Holmstrom, Don Morgan, Jeremy Stein,
David Smith, John Wolken, and seminar participants at the Massachusetts Institute of Technology, the
London Business School, the University of Notre Dame Mendoza College of Business, Columbia
Business School, the University of Chicago Graduate School of Business, Yale School of Management,
Harvard Business School, the Federal Reserve Bank of New York, the Board of Governors of the Federal
Reserve System, New York University Stern School of Business, and the Federal Reserve Bank of
Richmond for their insightful comments. The views expressed in this paper are those of the author and do
not necessarily reflect the position of the Federal Reserve Bank of New York or the Federal Reserve
System.
1
1. Introduction
Empirical research on corporate risk management has generally focused on large public companies,
most often studying firms’ use of financial derivatives.1 This paper instead examines fixed-rate and
adjustable-rate commercial loan contracts to study how small firms adjust their exposure to interest
rate risk. Small and medium-sized firms are important to the US economy; firms with less than 500
employees generate half of non-farm private GDP2. Small firms are often financially constrained,
considered a key theoretical rationale why firms engage in risk management (eg. Froot, Scharfstein
and Stein, 1993). Moreover, work on the ‘credit channel’ of monetary policy shows directly that
small firms are sensitive to interest rate shocks (eg. Gertler and Gilchrist, 1994; Ehrmann 2000).
Although small and medium sized firms make little use of derivatives, they do borrow
extensively from financial institutions. In some cases the interest rate on these loans is fixed, while in
other cases it adjusts with market interest rates. I study this variation in ‘fixed-versus-adjustable’
outcomes as a window into how small firms adjust their exposure to interest rate risk.
I firstly examine the relationship between ‘fixed-versus-adjustable’ outcomes and firm
financial constraints. Theoretically, Froot, Scharfstein and Stein (1993, hereafter FSS) shows that
optimal risk management policy should aim to generate cash in states of nature where an additional
dollar of internal funds is most valuable. Empirically, research on the ‘credit channel’ of monetary
policy finds that the availability of finance to bank dependent firms becomes scarcer relative to
1 Cross-industry studies of the determinants of firms’ use of derivatives include Covitz and Sharpe (2005), Purnandanam (2004), Lin and Smith (2003), Rogers (2002), Graham and Rogers (2002), Géczy, Minton and Schrand (1997), Mian (1996) and Fenn, Post and Sharpe (1996). Some studies focus on particular types of derivatives eg. Géczy et al focus on foreign currency derivatives, while Covitz and Sharpe study interest rate contracts. Allayanis and Weston (1998) study the relationship between derivatives use and firm value. Guay (1999) examines how derivatives hedging affects firm risk. Guay and Kothari (2003) examine the quantitative relevance of firms’ derivatives holdings. Other papers take an industry-specific approach; Faulkender (2005) studies chemicals firms, Haushalter (2001) focuses on oil and gas, and Tufano (1996) studies gold mining firms. The literature is also broadening to consider other dimensions of risk management. For example, Bartram, Brown and Minton (2006) and Pantzalis, Simkins and Laux (2001) present evidence that firms use operational hedging (eg. matching foreign sales to foreign production) to manage exchange rate risk. Petersen and Thiagarajan (2000) study two gold mining firms who achieve a similar reduction in exposure to gold price risk, one using derivatives, the other using a combination of operating, financial and accounting decisions. 2 Source: SBA. See http://www.sba.gov/advo/research/rs211tot.pdf.
2
investment opportunities during periods of rising interest rates, causing lower investment and output
amongst credit-constrained firms (section 2 reviews this literature in detail). Correspondingly, I test
the hypothesis that credit constrained firms match with fixed rate debt, thereby maximizing net
cashflows during periods of rising interest rates when the shadow value of internal funds is high.3
A related implication of FSS is that risk management outcomes should reflect variation
across firms in the correlation between interest rates and pre-interest firm cash flows. In sectors
where industry output or cashflows covarys positively with interest rates, firms have a partial or
complete ‘natural hedge’ against interest rate risk, and thus fixed rate debt is less likely to be
optimal. I test the hypothesis that the share of adjustable rate loans is higher in such industries, using
an estimated index of industry ‘interest rate procyclicality’.
Although plausible, there are several reasons why these two FSS ‘hedging’ hypotheses might
fail to hold empirically. One alternative hypothesis is that ‘fixed-versus-adjustable’ outcomes are set
by the firm’s banks (eg. perhaps the firm’s relationship lender only originates fixed-rate loans or
only adjustable-rate loans, so the firm does not have a choice). Another possibility is that small firms
prefer to amplify volatility in the shadow value of internal funds; Adam, Dasgupta and Titman
(2006) presents a model where such behavior may be optimal in an imperfectly competitive industry
setting. A third possibility is that small firms are financially unsophisticated or the ‘fixed-versus-
adjustable’ margin is unimportant, so that there are no systematic correlations in the data.
Using data from the Federal Reserve Board’s Survey of Small Business Finance (SBF) I do
in fact find evidence consistent with the two FSS ‘hedging’ hypotheses outlined above. First, as
predicted, matching with a fixed rate loan is positively correlated with several different proxies for
financial constraints. Fixed rate debt is most popular amongst smaller firms, younger firms, firms
switching from their primary lender, and firms with low cashflows (measured by current profits) or
3 In the FSS framework, a non-credit-constrained firm would be simply indifferent between fixed and adjustable rate loans, in line with the Modigliani-Miller theorem. However, I argue in the body of the paper that when lenders are also exposed to interest rate risk (consistent with a large body of empirical evidence) unconstrained firms may strictly prefer adjustable-rate debt.
3
high investment opportunities (measured by sales growth). These results are economically as well as
statistically significant; for example young, small firms in the SBF are about twice as likely to match
with fixed rate debt as old, large firms (69 per cent compared to 38 per cent). Second, fixed rate debt
is less prevalent in 2-digit SIC sectors where industry output comoves most positively with interest
rates, and thus where firms have a partial natural hedge against interest rate risk.
Next, I study how lender characteristics influence ‘fixed-versus-adjustable’ outcomes.
Several theoretical papers on loan contract design and bank risk management suggest that the share
of interest rate risk in a loan borne by the borrower should depend in part on the lender’s interest rate
risk profile (Arvan and Brueckner, 1986; Edelstein and Urosevic, 2003; Froot and Stein, 1998).
These models predict that lenders who are exposed ex-ante to rising interest rates will optimally
originate a smaller share of fixed-rate loans, since the present value of such loans declines by
comparison to adjustable-rate loans when interest rates rise.
I test this prediction by comparing bank loans to loans from non-bank institutions. Banks are
exposed to rising interest rates in two ways that are specifically tied to their reliance on deposit
finance. First, banks are affected by the ‘lending channel’ of monetary policy (Stein, 1998, Kashyap
and Stein, 2000, Ashcraft, 2004), in which tight monetary policy reduces the insured deposit base,
raising banks’ cost of funds. Second, banks are subject to maturity mismatch, where demand deposits
and short-term time deposits fund long-duration assets such as mortgages.
Correspondingly, I test the hypothesis that bank loans are more likely to involve an
adjustable interest rate than loans from other lender types. This ‘lender risk management’ hypothesis
receives strong support in the data; I find that a loan from a commercial or savings bank is 14
percentage points more likely to involve an adjustable interest rate compared to a loan from a non-
bank financial institution.
Since many small bank-dependent enterprises are closely held and owner-managed, it also
seems plausible that owner characteristics play a significant role in ‘fixed-versus-adjustable’

4
outcomes. Somewhat surprisingly, I find that variables like the owner’s age and the concentration of
ownership are nearly uncorrelated with the loan type chosen. I do find some evidence that adjustable
rate loans are more commom amongst firms with wealthier owners, consistent with the view that risk
aversion is declining in wealth.
The last part of the paper studies time-series patterns in the aggregate share of fixed-rate
loans. Using data from the Survey of Terms of Business Lending, I construct and study a 28-year
quarterly time-series of the fixed rate share for business loans originated by commercial banks. I find
that high real interest rates and a steep yield curve are correlated with a lower proportion of fixed
rate loans, consistent with previous work on ‘debt market timing’ by Faulkender (2005) and Baker,
Greenwood and Wurgler (2003). To my knowledge, this paper is the first to show these results also
extend to small, bank dependent firms. Implications of these findings for theoretical explanations of
‘market timing’ patterns are discussed.
The rest of this paper proceeds as follows. Section 2 reviews existing literature on the
sensitivity of small firms to interest rate shocks. Section 3 describes the Survey of Small Business
Finance, and discusses the measures of financial constraints I use. Section 4 presents cross-sectional
empirical evidence from the SBF. Section 5 presents time-series evidence on the share of fixed rate
commercial loans. Section 6 presents cross-sectional evidence from the STBL. Section 7 concludes.
2. Small firms and interest rate shocks
Research on the ‘credit channel’ of monetary policy argues that higher interest rates lead to a decline
in the availability of internal and external finance relative to investment opportunities, resulting in
lower investment and output amongst credit-constrained firms. This channel is considered to be most
important for small, informationally opaque, bank dependent firms, who are most likely to be
constrained in their access to finance. Consistent with this view, Gertler and Gilchrist (1994) show
that small US manufacturing firms are disproportionately affected during periods of rising interest
rates. Small firms reduce external borrowing, shed inventories and experience sharp falls in sales

5
growth. Larger firms maintain debt levels, increase inventories, and experience a substantially
smaller decline in sales growth. Ehrmann (2000) finds similar evidence using data on German firms.
The broad credit channel can be further decomposed into ‘balance sheet’ and ‘lending’
effects. The ‘balance sheet’ channel is that higher interest rates weaken firm balance sheets, partially
by reducing expected future profits, and partially because small firms have long-lived physical assets
but mainly short term or adjustable rate liabilities (bank loans, credit lines etc.). This maturity
mismatch implies that net current cashflows decline when interest rates increase, and also that the
present value of assets declines relative to the present value of liabilities. The latter makes the firm
less creditworthy, reducing its ability to raise external finance.
Consistent with the balance sheet channel, Bernanke and Gertler (1995) show that firms’
balance sheet strength, proxied by interest coverage, declines during periods of high interest rates.
Greenwood (2003) finds firm investment is most sensitive to interest rates when maturity mismatch
is high, and that this relationship is most pronounced for financially constrained firms. Ashcraft and
Campello (2006) find commercial lending is more sensitive to monetary policy in geographic regions
where firm balance sheets are weak.
The ‘lending’ channel is that contractionary monetary policy reduces the ability of banks to
lend by shrinking the supply of bank deposits. Stein (1998) presents a formal model of the lending
channel. Kashyap, Stein and Wilcox (1993) show the bank lending as a share of total debt finance
falls during periods of contractionary monetary policy. Kashyap and Stein (1995, 2000) present
further empirical evidence on the lending channel for the US.
For the purposes of this paper, the key implication of both the ‘lending’ and ‘balance sheet’
channels is that for the average small firm, the supply of internal finance plus external finance
declines relative to investment opportunities during periods of rising interest rates. This fall in credit
availability will have no real effects if credit constraints are not binding. For firms that are credit
constrained, such a shrinkage in the availability of finance induced by rising interest rates will reduce
6
investment and output and raise the shadow value of internal funds. Correspondingly, I test the
hypothesis that credit constrained firms match with fixed rate loans rather than adjustable rate loans,
maximizing cash flows during periods of rising interest rates, when internal funds are most valuable.
What about financially unconstrained firms? In FSS, such firms would be indifferent
between the two loan types, in line with the Modigliani-Miller theorem. However, a substantial
amount of evidence suggests lenders too are exposed to interest rate risk, via the ‘bank lending’
channel as well as maturity mismatch (Sierra and Yaeger, 2004). In such an environment, the
optimal contract will generally involve a financially unconstrained firm bearing the interest rate risk
of the loan (Arvan and Brueckner, 1986, Edelstein and Urosevic, 2003, Froot and Stein, 1998). In
Section 4.2 I present direct evidence that lender types exposed to rising interest rates originate a
higher fraction of adjustable-rate loans, consistent with this view. Alternatively, unconstrained firms
may match with adjustable rate debt to signal firm quality, in line with the model of Guedes and
Thompson (1995). Even without these effects, it will still hold that unconstrained firms have no
explicit incentive to protect cashflows against rising interest rates, unlike constrained firms.
3. Data: Survey of Small Business Finance (SBF)
The SBF is a cross-sectional survey conducted approximately every five years by the Federal
Reserve Board, containing detailed microeconomic information on firm characteristics and financing
behavior for a representative sample of US small and medium sized enterprises, defined as firms
with less than 500 employees at the end of the reference year4. The SBF provides particularly
detailed information on the firm’s most recent loan, including the size of the loan, interest rate and
fees paid, category of loan (eg. line of credit, business mortgage etc.), maturity, and collateral posted
against the loan. Most importantly for this paper, the SBF also records whether the most recent loan
was issued at a fixed or variable interest rate. 4 For the 1987 survey, the relevant population is US firms with less than 500 full time equivalent employees. For the 1993 and 1998 survey the population is firms with less than 500 full-time plus part-time employees. Other things equal, this implies firms in 1993 and 1998 are smaller on average than those in the 1987 survey.
7
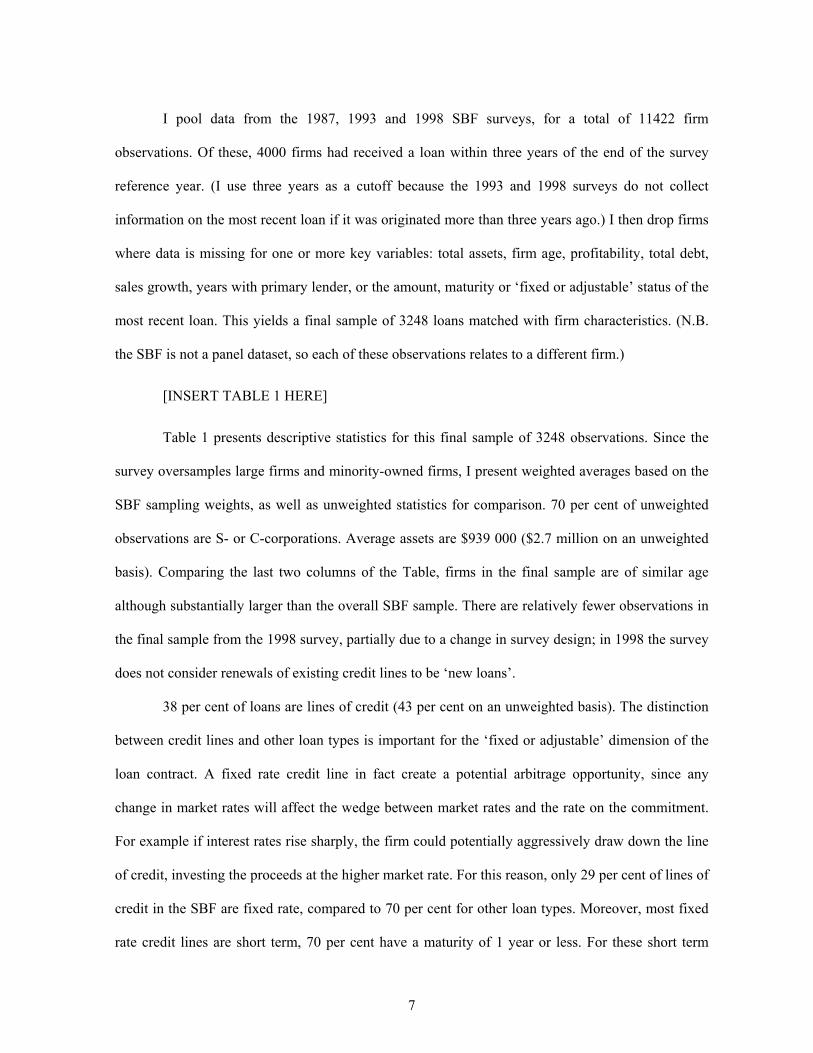
I pool data from the 1987, 1993 and 1998 SBF surveys, for a total of 11422 firm
observations. Of these, 4000 firms had received a loan within three years of the end of the survey
reference year. (I use three years as a cutoff because the 1993 and 1998 surveys do not collect
information on the most recent loan if it was originated more than three years ago.) I then drop firms
where data is missing for one or more key variables: total assets, firm age, profitability, total debt,
sales growth, years with primary lender, or the amount, maturity or ‘fixed or adjustable’ status of the
most recent loan. This yields a final sample of 3248 loans matched with firm characteristics. (N.B.
the SBF is not a panel dataset, so each of these observations relates to a different firm.)
[INSERT TABLE 1 HERE]
Table 1 presents descriptive statistics for this final sample of 3248 observations. Since the
survey oversamples large firms and minority-owned firms, I present weighted averages based on the
SBF sampling weights, as well as unweighted statistics for comparison. 70 per cent of unweighted
observations are S- or C-corporations. Average assets are $939 000 ($2.7 million on an unweighted
basis). Comparing the last two columns of the Table, firms in the final sample are of similar age
although substantially larger than the overall SBF sample. There are relatively fewer observations in
the final sample from the 1998 survey, partially due to a change in survey design; in 1998 the survey
does not consider renewals of existing credit lines to be ‘new loans’.
38 per cent of loans are lines of credit (43 per cent on an unweighted basis). The distinction
between credit lines and other loan types is important for the ‘fixed or adjustable’ dimension of the
loan contract. A fixed rate credit line in fact create a potential arbitrage opportunity, since any
change in market rates will affect the wedge between market rates and the rate on the commitment.
For example if interest rates rise sharply, the firm could potentially aggressively draw down the line
of credit, investing the proceeds at the higher market rate. For this reason, only 29 per cent of lines of
credit in the SBF are fixed rate, compared to 70 per cent for other loan types. Moreover, most fixed
rate credit lines are short term, 70 per cent have a maturity of 1 year or less. For these short term

8
commitments, interest rates are unlikely to shift enough before the credit line is renegotiated for the
arbitrage opportunity described above to be profitable after transaction costs. A second point of
difference is that the interest rate risk of an adjustable-rate credit line is ‘contingent’, since the firm
only faces risk to the extent that it actually draws down the line in the future. Given these
differences, but also taking into consideration the moderate sample size, I always present two sets of
empirical estimates, one based on the full sample, the other on a subsample excluding credit lines.
Loans in the sample have an average maturity of 4 years, and the average weighted loan size
is $324 thousand (around one-third of average firm assets). Most importantly, there is substantial
variation in firms’ choices between fixed and adjustable rate loans. 52 per cent of loan observations
in the sample were drawn at a fixed rate (59 per cent on a weighted basis), the rest at an adjustable
rate. 92 per cent of variable rate loans are indexed to a commercial prime lending rate.
[INSERT TABLE 2 HERE]
Table 2 breaks down the fixed rate share by type and source of loan. Importantly since loan
type dummies are included in most regressions, there is a significant share of both fixed- and
adjustable-rate contracts within each loan type. At the extremes, credit lines have the lowest fixed
rate share (29 per cent), while capital leases and vehicle mortgages are most likely to be fixed (89 per
cent and 88 per cent respectively).5 Bank loans are less likely to involve a fixed rate (46 per cent
compared to 78 per cent for non-bank loans).
3.1 Measuring financial constraints
The SBF contains several potential measures of financial constraints. Below I discuss the measures I
use, and briefly review the evidence associated with each of them.
5 Beyond the earlier discussion of credit lines, this paper does not provide a full explanation for why the fixed rate share varies across loan types. Differences in securitization rates provide a potential explanation, however. For example, a vehicle mortgage, backed by a standardized, easy-to-value asset, may be easier to securitize than a business mortgage secured by assets that are difficult for outsiders to value and monitor. (There is an active secondary market for auto loans in the US, consistent with this argument.) This may in turn explain the high share of fixed-rate vehicle mortgages, analogous to the argument that securitization underpins the popularity of the US fixed rate household mortgage (Green and Wachter, 2005).
9
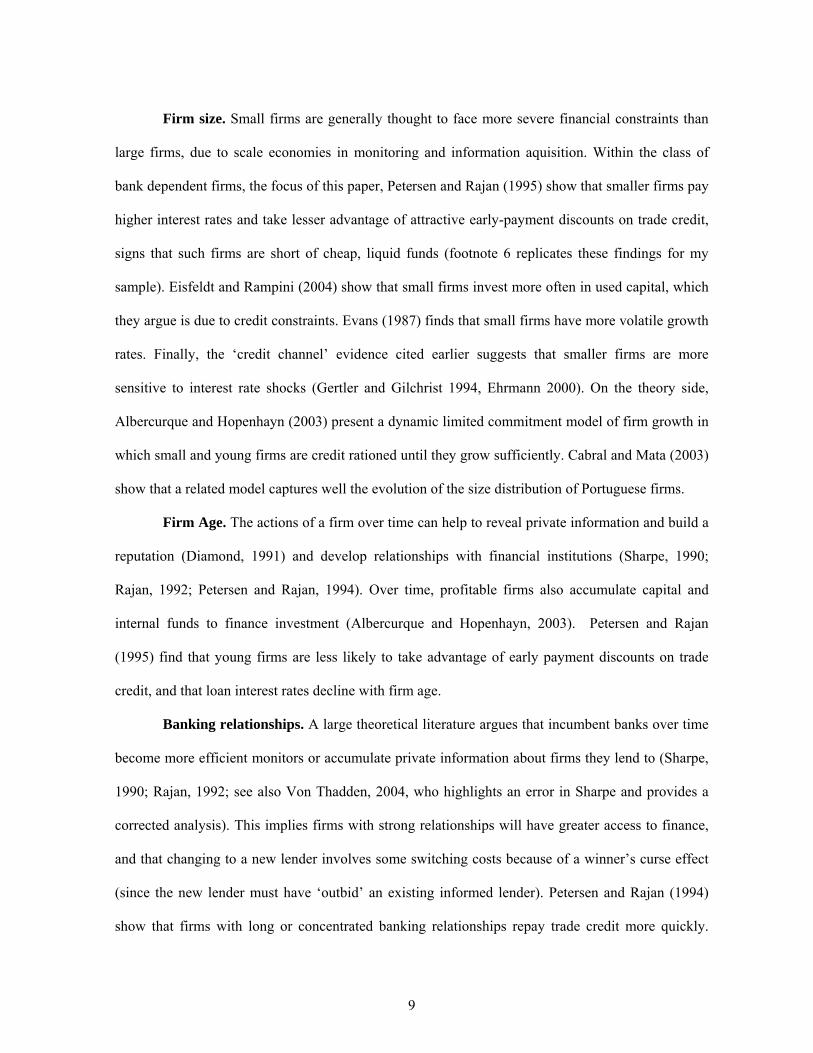
Firm size. Small firms are generally thought to face more severe financial constraints than
large firms, due to scale economies in monitoring and information aquisition. Within the class of
bank dependent firms, the focus of this paper, Petersen and Rajan (1995) show that smaller firms pay
higher interest rates and take lesser advantage of attractive early-payment discounts on trade credit,
signs that such firms are short of cheap, liquid funds (footnote 6 replicates these findings for my
sample). Eisfeldt and Rampini (2004) show that small firms invest more often in used capital, which
they argue is due to credit constraints. Evans (1987) finds that small firms have more volatile growth
rates. Finally, the ‘credit channel’ evidence cited earlier suggests that smaller firms are more
sensitive to interest rate shocks (Gertler and Gilchrist 1994, Ehrmann 2000). On the theory side,
Albercurque and Hopenhayn (2003) present a dynamic limited commitment model of firm growth in
which small and young firms are credit rationed until they grow sufficiently. Cabral and Mata (2003)
show that a related model captures well the evolution of the size distribution of Portuguese firms.
Firm Age. The actions of a firm over time can help to reveal private information and build a
reputation (Diamond, 1991) and develop relationships with financial institutions (Sharpe, 1990;
Rajan, 1992; Petersen and Rajan, 1994). Over time, profitable firms also accumulate capital and
internal funds to finance investment (Albercurque and Hopenhayn, 2003). Petersen and Rajan
(1995) find that young firms are less likely to take advantage of early payment discounts on trade
credit, and that loan interest rates decline with firm age.
Banking relationships. A large theoretical literature argues that incumbent banks over time
become more efficient monitors or accumulate private information about firms they lend to (Sharpe,
1990; Rajan, 1992; see also Von Thadden, 2004, who highlights an error in Sharpe and provides a
corrected analysis). This implies firms with strong relationships will have greater access to finance,
and that changing to a new lender involves some switching costs because of a winner’s curse effect
(since the new lender must have ‘outbid’ an existing informed lender). Petersen and Rajan (1994)
show that firms with long or concentrated banking relationships repay trade credit more quickly.

10
Consistent with the winner’s curse effect discussed above, Degryse and Van Cayseele (2000) show
that firms who switch lenders pay higher interest rates after switching.
Cash flows relative to investment opportunities. Financial constraints will be less binding
if internal cashflows are high or investment opportunities are low. I use profits scaled by firm size as
a measure of current cashflows, and sales growth as a proxy for investment opportunities. Although
widely used, these variables are imperfect; for example profits likely contain information about
investment opportunities as well as current cashflows, as argued by Kaplan and Zingales (1997). But
as some supporting evidence, Petersen and Rajan (1995) find that more profitable firms take greater
advantage of early-payment discounts on trade credit, consistent with the view that such firms are
less credit rationed (I replicate this result in footnote 6).
4. Evidence from the Survey of Small Business Finance
I begin by estimating a simple probit regression to study the cross-sectional determinants of firms’
matching to fixed-rate or adjustable-rate loans. The probit takes the form:
P(fixed) = Φ(a0 + a1 . fin.constraints + a2 . lender type + a3 . lender controls +
+ a4 loan controls + a5 other firm controls + a5 . year dummies + e) [1]
The dependent variable is equal to 1 for a fixed-rate loan, and 0 for an adjustable-rate loan.
‘Fin.constraints’ includes the measures of financial constraints discussed in Section 3: firm size (log
(1+assets)), firm age (log(1+age in years)), return on assets (profits / assets), annual sales growth,
and three measures of the strength of lending relationships: the number of financial institutions the
firm uses, the log of the length (in years) of the firm’s relationship with its primary lender, and a
dummy for whether the most recent loan was not from the firm’s primary lender. This dummy
variable (positive for 23 per cent of the sample) captures the ‘switching’ mechanism discussed in
Section 3 that switching lenders conveys negative private information about the firm.

11
‘Lender type’ consists of 2 dummy variables, respectively equal to 1 if the loan provider was
a bank (either a commercial or savings bank), or a non-financial-institution. The omitted category is
non-bank financial institution, which includes finance companies, leasing firms, insurance
companies, credit unions and so on. ‘Lender controls’ includes other controls relating to the provider
of the most recent loan: the log(distance) between this lender and the firm, and two dummy variables
reflecting the main type of interaction between the firm and this lender (face to face, telephone, or
other). Distance and the form of interaction are widely used to measure the importance of localized
‘soft’ information about the firm for lending decisions (Liberti and Mian, 2006; Degryse and
Ongena, 2005; Berger, Miller, Petersen, Rajan and Stein, 2005; Petersen and Rajan, 2002; Stein,
2002). ‘Loan controls’ includes the maturity of the loan, loan size scaled by firm assets, 5 dummy
variables for the loan type (e.g. line of credit, business mortgage, vehicle loan etc.), and 7 dummies
for types of collateral pledged.
Controls in the ‘lender type’, ‘lender controls’ and ‘loan controls’ categories all reflect
different characteristics of the most recent loan. Endogeneity is thus a potential concern, since these
features are jointly determined with the ‘fixed or adjustable’ component of the loan contract.
Although no convincing instruments are available, as a robustness check I always present empirical
results estimated two different ways. The first specification excludes nearly all these potentially
endogenous loan characteristics (I control only for the loan type); while the second specification
includes all the controls. Although some coefficients are estimated less precisely when these
potentially endogenous loan characteristics are included, the main results are quite robust.
‘Other firm controls’ consists of firm leverage (book debt / book assets), a dummy equal to 1
if the local bank Herfindahl index (HHI) is > 1800, industry dummies at the 2-digit SIC level, a
dummy for whether the firm had recently been solicited by financial institutions, 2 dummies for
whether the firm is an S-corp or C-corp (unincorporated is the omitted category), and 3 dummy
12
variables for the geographic region of the firm. I also include a year dummy for each year a loan is
observed in the SBF sample.
As argued earlier, it is important to check that the results are robust to excluding credit lines
(because the properties of these loans are quite different), and robust to including or excluding
endogenous loan controls like maturity, loan size and lender type. Thus, I estimate four
specifications reflecting each combination along these two dimensions. Results are presented in
Table 3. Estimates are based on a weighted probit using the SBF sampling weights. Coefficients are
normalized to reflect marginal effects, and Huber-White robust standard errors are used.
[INSERT TABLE 3 HERE]
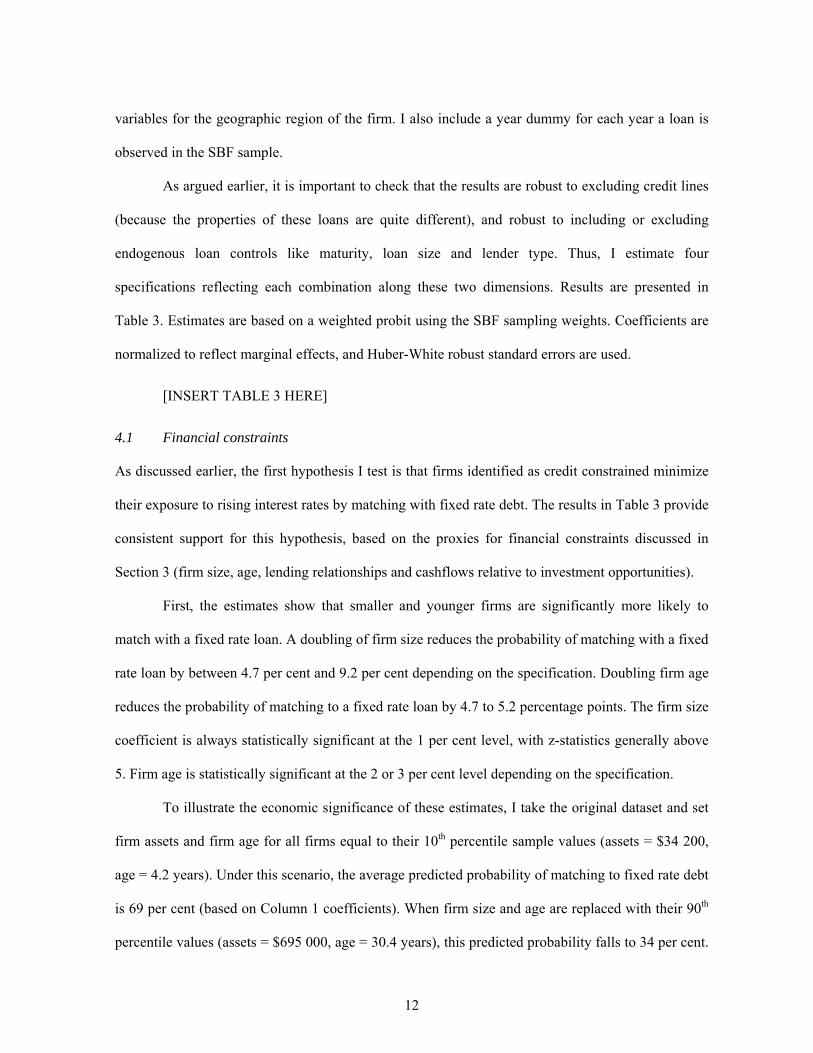
4.1 Financial constraints
As discussed earlier, the first hypothesis I test is that firms identified as credit constrained minimize
their exposure to rising interest rates by matching with fixed rate debt. The results in Table 3 provide
consistent support for this hypothesis, based on the proxies for financial constraints discussed in
Section 3 (firm size, age, lending relationships and cashflows relative to investment opportunities).
First, the estimates show that smaller and younger firms are significantly more likely to
match with a fixed rate loan. A doubling of firm size reduces the probability of matching with a fixed
rate loan by between 4.7 per cent and 9.2 per cent depending on the specification. Doubling firm age
reduces the probability of matching to a fixed rate loan by 4.7 to 5.2 percentage points. The firm size
coefficient is always statistically significant at the 1 per cent level, with z-statistics generally above
5. Firm age is statistically significant at the 2 or 3 per cent level depending on the specification.
To illustrate the economic significance of these estimates, I take the original dataset and set
firm assets and firm age for all firms equal to their 10th percentile sample values (assets = $34 200,
age = 4.2 years). Under this scenario, the average predicted probability of matching to fixed rate debt
is 69 per cent (based on Column 1 coefficients). When firm size and age are replaced with their 90th
percentile values (assets = $695 000, age = 30.4 years), this predicted probability falls to 34 per cent.
13
In other words, holding other characteristics fixed, small, young firms in the SBF match more than
twice as often to fixed rate loans as large, mature firms.
Examining results for the lending relationship variables, ‘number of financial institutions’
and ‘years with primary lender’ are statistically uncorrelated with matching to a fixed or adjustable-
rate loan. However, the ‘switch’ dummy, equal to 1 if the loan is not from the firm’s primary lender,
is positive and significant at the 1 per cent level in columns 1 and 2. Firms switching from their
primary lender appear more likely to use fixed rate debt, consistent with the hypothesis modelled in
Sharpe (1990) and Thakor (2004) and confirmed empirically in Degryse and Van Cayseele (2000)
that switching signals negative private information about firm quality and creditworthiness.
Turning to the accounting variables, firms with lower cashflows (measured by profits /
assets) or more growth opportunities (measured by sales growth) are more likely to be financially
constrained; I find such firms also match more frequently with fixed rate loan contracts, consistent
with previous results. The coefficient on profits is negative and significant at the 5 per cent level in
Columns 1 and 2, and close to significant (p-value between 10 and 15 per cent) in Columns 3 and 4.
The sales growth coefficient is always positive although significant at the 10 per cent level in
Column 1 only.
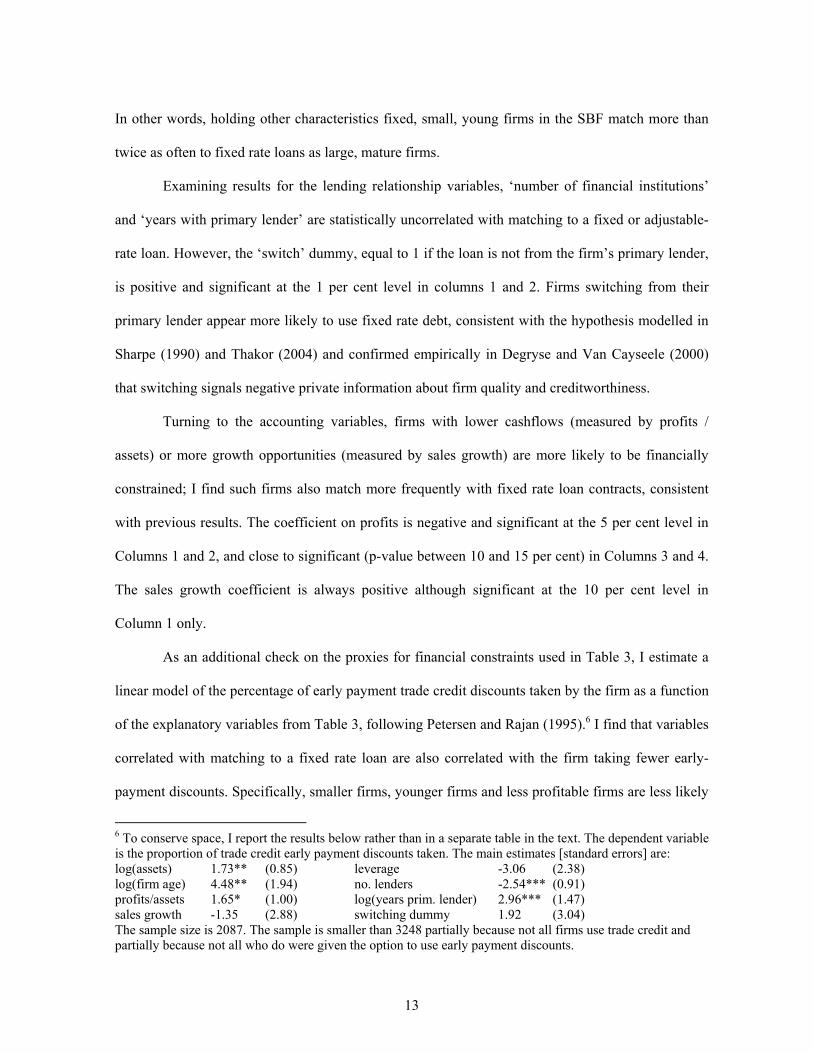
As an additional check on the proxies for financial constraints used in Table 3, I estimate a
linear model of the percentage of early payment trade credit discounts taken by the firm as a function
of the explanatory variables from Table 3, following Petersen and Rajan (1995).6 I find that variables
correlated with matching to a fixed rate loan are also correlated with the firm taking fewer early-
payment discounts. Specifically, smaller firms, younger firms and less profitable firms are less likely
6 To conserve space, I report the results below rather than in a separate table in the text. The dependent variable is the proportion of trade credit early payment discounts taken. The main estimates [standard errors] are: log(assets) 1.73** (0.85) leverage -3.06 (2.38) log(firm age) 4.48** (1.94) no. lenders -2.54*** (0.91) profits/assets 1.65* (1.00) log(years prim. lender) 2.96*** (1.47) sales growth -1.35 (2.88) switching dummy 1.92 (3.04) The sample size is 2087. The sample is smaller than 3248 partially because not all firms use trade credit and partially because not all who do were given the option to use early payment discounts.
14
to take trade credit discounts, significant at the 5 per cent level for size and age, and the 10 per cent
level for profits/assets. Sales growth is correctly signed although not statistically significant. The
main difference is the relative impact of different bank relationship variables. Firms with many
lenders or a short primary relationship length take fewer trade credit discounts, but the switching
dummy (ie. most recent lender is not primary lender) is not statisically significant. In contrast, in
Table 3 the switching variable is significant but the other two relationship variables are not. The act
of the firm switching from its primary lender appears particularly relevant for ‘fixed-versus-
adjustable’ outcomes, perhaps because switching provides a direct signal to the lender setting the
contract terms on the new loan.
Table 3 also presents estimates for two measures of firm indebtedness: leverage (book debt /
assets) and loan size (most recent loan size / assets). High firm leverage is correlated with a lower
probability of matching with fixed rate debt. Columns 3 and 4 show this result reflects variation in
the size of the most recent loan, rather than the stock of previous debt. In other words, larger loans
are more likely to be adjustable rate, holding all else equal. These measures are not considered
amongst the proxies for financial constraints, since it is unclear whether low debt firms are less
constrained (because they have a higher reserve of debt capacity) or more constrained (because their
smaller loans reflect difficulty in obtaining credit at an acceptable interest rate). Small and young
firms in the sample are less indebted on average, consistent with the latter hypothesis, although
leverage is not correlated in either direction with trade credit repayment patterns (see footnote 6).
4.2 Lender characteristics
An interesting feature of the risk management setting considered in this paper is that both lenders
and borrowers are potentially exposed to interest rate fluctuations. It therefore seems plausible that
the allocation of risk in the loan contract depends in part on the lender’s interest rate risk profile. In
this section, I test the hypothesis that lenders with a greater ex-ante exposure to rising interest rates
originate a lower share of fixed-rate loans, ameliorating their ex-ante sensitivity to interest rate

15
shocks. Arvan and Brueckner (1986) and Edelstein and Urosevic (2003) make exactly this prediction
in the context of models of optimal mortgage contract design. This hypothesis is also consistent with
Froot and Stein (1998), who show that optimal investment by financial institutions should depend on
how returns on the investment covary with the institution’s existing portfolio risks.
Specifically, I test this hypothesis by comparing bank loans to loans from non-bank financial
institutions. Banks are exposed to rising interest rates through two distinct mechanisms that stem
directly from their reliance on deposit finance.7 First, the ‘lending channel’ literature discussed
earlier finds that when interest rates rise, deposits flow out of the banking system; these outflows
cannot be costlessly replaced by other sources of finance (Stein, 1998; Kashyap and Stein, 2000;
Ashcraft, 2004). Second, banks face ‘maturity mismatch’ where long-term assets such as household
mortgages are funded by short-term demand deposits. Sierra and Yaeger (2004) presents direct
evidence that commercial banks are ‘liability sensitive’ (i.e. the duration of assets exceeds the
duration of liabilities). Savings banks face more significant maturity mismatch than commercial
banks, because of their focus on residential mortgage lending (Wright and Houpt, 1996).
Thus, I test the hypothesis that bank loans are more likely to involve an adjustable interest
rate than loans from non-bank financial institutions. This prediction receives strong support in the
data. Columns 3 and 4 includes two lender dummies, for whether the lender is a bank or non-
financial institution. Relative to non-bank financial institutions, the omitted category, bank loans are
13.7 percentage points more likely to involve an adjustable interest rate based on Column 3, and 12.2
percentage points based on Column 4, both statistically significant at the 1 per cent level.
Also consistent with the hypothesis, the stylized fact that deposit-taking institutions originate
a higher share of adjustable-rate debt does not just hold for small business loans. The table below
7 Non-bank commercial finance companies are not FDIC members and cannot raise insured deposits. Instead, these firms rely on a combination of commercial paper, medium- and long-term notes and shareholder equity to fund operations, and securitize business loans where possible. A representative example is the balance sheet of CIT, the world’s largest publicly held commercial lending firm (balance sheet available online at www.cit.com/main/InvestorRelations/AnnualReports.htm).

16
compares estimates in Table 3 to Faulkender (2005), who studies debt fundings by a sample of
Compustat firms, and Vickery (2006), who analyzes residential mortgages. In both these papers,
some debt fundings are originated by banks, while others are funded by an alternative source (the
corporate bond market in Faulkender’s sample, and mortgage companies in Vickery’s sample).
Table 3 of this paper Faulkender (2005) Vickery (2006) Sample Loans to small and
medium sized firms Debt fundings by public firms
Residential mortgage originations
Type of banks Commercial and savings banks
Commercial banks Commercial and savings banks
Comparison source of finance
Loan is from non-bank financial institution
Funding is a corporate bond
Loan is from a mortgage company
-0.137 (0.042)***
-0.828 (n/a)
-0.114 (0.037)***
(commercial bank dummy)
Effect of ‘funds provided by bank’ on probability of fixed rate loan
-0.293 (0.020)***
(savings bank dummy)
Coefficients in the table represent the probability that the debt contract involves a fixed interest rate if funds are provided by a bank, relative to the comparison source of finance listed. Estimate in column 2 is from Table 1 of Faulkender (2005). Since this is a table of summary statistics, no standard error is available. Estimates in column 3 are from Table 2 of Vickery (2006).
The negative coefficients in each cell show that in each case, the debt funding is more likely
to involve an adjustable interest rate if the provider of funds is a bank, rather than the comparison
non-depository source of finance listed. The difference is particularly stark for Faulkender’s sample;
the coefficient of -0.828 essentially summarizes the fact that public corporate debt fundings are
nearly all fixed rate, while the largest commercial bank loans are nearly all adjustable rate. These
results support the view that originating adjustable rate debt provides a mechanism for depository
institutions to minimize their ex-ante exposure to rising interest rates.
A potential alternative interpretation is that these results reflect endogenous matching
between banks and firms. Perhaps bank borrowers are less financially constrained, which explains
why banks originate a higher share of adjustable rate loans? One piece of evidence that speaks
against this view, however, is that the source of finance is not correlated with observable measures

17
of credit constraints. I estimate a simple probit regression of the ‘lender=bank’ dummy on the right-
hand-side variables from Table 3; apart from ‘primary relationship length’, none of the other proxies
for credit constraints (size, age, profits, sales growth, number of lenders, or the ‘switch’ dummy) is
statistically significant even at the 10 per cent level (results available on request). This suggests bank
loans do not flow to significantly more creditworthy firms on average.
4.3 The ‘natural hedge’ hypothesis
The credit channel evidence reviewed in Section 2 suggests that on average, bank-dependent firms
become more credit constrained during periods of rising interest rates. However, exposure to interest
rate risk also likely varies a great deal across firms. For example, in industries where output or
cashflows covary positively with interest rates, higher internal cashflows will at least partially offset
the effects of interest rates on the supply of credit. In these industries, firms have a ‘natural hedge’
against rising interest rates, and fixed rate debt is less likely to be optimal. In this section I test the
hypothesis that the share of adjustable rate loans is higher in such industries.
This test involves two steps. Firstly, I estimate the correlation between industry output and
interest rates using 2-digit SIC industry data for the period 1960-2000. For each industry, log
industry output is regressed on the 12-month nominal riskless interest rate rt (contemporaneous and
lagged one period), as well as a constant, time trend and log time trend8:
ln(yit) = α0 + Σk=0,1 βik rt-k + α1 t + α2 ln(t) + eit [2]
Σβik provides an empirical estimate of the excess correlation of industry i to interest rates. (If output
in all industries moved proportionately with interest rates, then Σβik would always equal zero). In the
second step, I re-estimate the ‘fixed-versus-adjustable’ regression [1] after replacing the SIC
dummies with the estimated Σβik. A negative coefficient on this industry correlation variable would
be consistent with the ‘natural hedge’ hypothesis.
8 Results are robust to using ln(yit / yt) instead of log output as the dependent variable in this regression.

18
The first step estimates are quite precise: of 52 2-digit industries for which industry output
data is available, the β’s are jointly significant at the 1 per cent level in 26 cases, and at the 5 per cent
level in 33 cases. Coal mining, petroleum refining and oil and gas extraction have high β’s, reflecting
high interest rates during the energy crisis of the 1970s. Industries with negative β’s include non-
deposit financial institutions, motor vehicles and personal services.9
[INSERT TABLE 4 HERE]
Results from the second step probit are presented in Table 4. Industry interest rate sensitivity
has a negative coefficient as predicted, significant at the 5 per cent level in Columns 1, 2 and 4, and
the 10 per cent level in Column 3.10 The estimated coefficient is around 1.2-1.5, implying that a firm
in an industry whose share of output increases by 1 per cent when interest rates increase by 1
percentage point (i.e. Σβik = 0.01) is 1.2-1.5 percentage points less likely to match with a fixed rate
loan compared to an industry whose share of output is uncorrelated with interest rates. Since most
industries have Σβik between –0.02 and 0.02, the estimated cross-industry ‘natural hedge’ effect is
fairly weak. This estimated coefficient is probably attenuated however, since Σβik is likely subject to
substantial measurement error.
Finally, in Column 5, I test whether the natural hedge effect is more pronounced amongst
financially constrained firms. I re-estimate the baseline specification from Column 1 of Table 3
including an additional variable Σβik * ln(firm size). Cross-industry variation in the fixed rate share is
absorbed by the 2-digit SIC industry dummies, while the interaction term coefficient just captures the
9 The five largest and five smallest Σk=0,1 βik estimates are: SIC Industry Σk=0,1 βik SIC Industry Σk=0,1 βik 61 Non-depository institutions -0.102 10 Metal mining 0.040 37 Motor vehicles -0.030 29 Petroleum refining 0.065 72 Personal services -0.030 12 Coal mining 0.103 82 Education services -0.029 13 Oil and gas extraction 0.187 45 Transportation by air -0.029 67 Holding and other investment offices 0.232
10 The interest sensitivity variable is a generated regressor in the sense of Pagan (1984). The hypothesis test that the interest coefficient is equal to zero is still consistent even without adjusting the standard error to reflect this, however (see Pagan, 1984, p.226).
19
extent to which the ‘natural hedge’ mechanism is more pronounced for small firms. Although
correctly (positively) signed, the coefficient is not statistically significant.
4.4 Owner characteristics
Since firms in the SBF are generally closely held, it seems likely that the personal characteristics of
the firm’s owner or managers should influence loan contract outcomes. It is also possible that failing
to control for owner variables may bias other estimates. For example, my result that small firms
match with fixed rate debt may in fact simply reflect the fact that large firms have wealthier owners,
who are perhaps less risk averse or less likely to face personal borrowing constraints.
Fortunately the SBF contains a substantial amount of owner and manager data to test this
possibility. First, I re-estimate each specification from Table 3 including five owner characteristics
available in the 1993 and 1998 SBF surveys: a dummy for whether the owner is also the firm’s
primary manager/CEO, the owner’s age and years of business experience, the primary owner’s
ownership share, and a dummy for whether the firm is majority-owned by a single family.11 In fact, I
find these owner characteristics have surprisingly little explanatory power. Of 20 coefficients (five
variables x four specifications) none are significant at the 5 per cent level, and an f-test of joint
significance fails to reject the null in all four specifications. (Given this lack of significance, I do not
report these results in a separate table. Results are available on request, however.)
I next include a direct measure of owner wealth, available in the 1998 SBF only. For this
survey year, I construct a measure of total wealth by summing the firm owner’s personal equity, non-
housing personal wealth, and equity stake in the firm (net book equity x the primary owner’s
ownership share). If ‘fixed-versus-adjustable’ outcomes covary with firm size only because it is
correlated with owner wealth, then if both are included as explanatory variables only the wealth
variable should be statistically significant. I estimate three different specifications; in each case
11 The sample size for these regressions is 2033. It is smaller because the complete set of owner variables is only available for the 1993 and 1998 surveys, and also because not all survey respondents answered the owner questions. This smaller sample is the reason why the owner variables are excluded from the initial regressions.

20
estimates are presented from a baseline regression that excludes owner wealth, then an otherwise
identical model where the natural logarithm of owner wealth is added as a regressor. Results are
presented in Table 5.
[INSERT TABLE 5 HERE]
Inferences are somewhat imprecise due to the small 1998 SBF sample. However, the results
suggest the conclusion that small firms match with fixed rate loans is quite robust to controlling for
owner wealth. The coefficient on log assets drops by about one-fifth when owner wealth is included,
but it is still negatively signed and statistically significant at either the 5 per cent or 10 per cent level.
The coefficient on log wealth is negative as predicted, and statistically significant at the 10 per cent
level in the parsimonious third specification. This constitutes some weak evidence that wealthier
owners are in fact less concerned about interest rate volatility, consistent with the model of
household interest rate risk management developed by Campbell and Cocco (2003) to study
household mortgage choice.
4.6 Robustness checks
‘Fixed-versus-adjustable’ outcomes are jointly determined with other loan characteristics such as the
loan term, size, lender and so on. This raises an important question: do firms actively adjust the
‘fixed-versus-adjustable’ component of the loan, or is the interest rate exposure just determined
passively as a function of other parts of the loan package? For example, perhaps firms actively
choose a lender and type of loan, but are then just presented with a standardized ‘boilerplate’ loan
contract by the lender, leaving the firm with no effective decision regarding the interest rate exposure
of the loan.
The results presented so far already include several specification checks to help address
these concerns. As previously shown, the results are robust to the inclusion or exclusion of an
exhaustive set of loan characteristics: loan type dummies, lender type dummies, maturity, loan size,
collateral dummies, distance between lender and firm, and dummies for the primary form of lender-

21
firm interaction. Thus, the results still hold even when we only compare firms of different sizes or
ages who all have the same type of loan (eg. a business mortgage), all used the same lender type (eg.
a commercial bank), and so on. Estimates are also robust to excluding credit lines from the sample.
This section presents some additional robustness checks to help rule out alternative
explanations for the empirical results. As a first simple test of the hypothesis that the choice of lender
or loan type dictates the ‘fixed-versus-adjustable’ component of the loan, I visit the small business
websites of 10 major US commercial banks, and study online documentation for two types of loans,
unsecured term loans and commercial mortgages. In each case I record whether the bank offers firms
a choice between a fixed and adjustable loan contract. I find that firms are indeed offered this choice
in 12 of 15 cases where this information could be determined from the website. (In the other 3 cases,
only a fixed rate contract is offered.)12 This speaks against the view that firms are shoehorned into a
given interest rate exposure once the lender or loan type has been determined.
Further supporting evidence is presented in Section 6, which estimates cross-sectional
‘fixed-versus-adjustable’ regressions using data from the Survey of Terms of Business Lending
(STBL). Unlike the SBF, the STBL uniquely identifies the provider of each loan. I find that loan
size, a close proxy for firm size, is significantly negatively correlated with matching to a fixed
interest rate, even after controlling for bank fixed effects. This result confirms that individual banks
do offer both types of loans, and also demonstrates that small firms match with fixed rate loans even
just by comparison to larger firms who borrow from the same bank.
A final set of robustness checks are presented in Table 6. The first of these considers the
hypothesis that the lender dictates the interest rate exposure of the loan. One implication of this
hypothesis is that we would expect results to look different for ‘captive’ firms, who have no viable
choice between lenders, and non-captive firms, who can easily switch if the terms of the loan are not
12 I collect data for the commercial banking arm of the 10 largest US bank holding companies by deposits: Bank of America, Citigroup, JP Morgan Chase, Wachovia, Wells Fargo, HSBC, US Bancorp, SunTrust, Citizens Financial and National City. The three cases where firms are not offered an adjustable rate option are Bank of America (term loan), Bank of America (commercial mortgage), and Wells Fargo (term loan).

22
as desired. I consider three different proxies for firm captivity: (i) the firm has not recently been
solicited by financial institutions (ii) the firm has only a single lending relationship (iii) the firm is
located in a concentrated local banking market (HHI > 1800). I then re-estimate the baseline model
from Column 1 of Table 3, interacting each ‘captivity’ proxy in turn with the measures of credit
constraints used earlier. I then test the significance of each of the interaction terms. Results from this
exercise are presented in the first three columns of Table 6.
[INSERT TABLE 6 HERE]
As the Table shows, the interaction terms are almost never statistically significant; in 21 hypothesis
tests, the interaction term is significant at the 5 per cent level only twice. Thus, credit constraints are
correlated with use of fixed rate debt for both captive and non-captive firms, suggesting previous
results are not simply driven by lenders ‘forcing’ firms to use a particular contract type.
In similar vein, the fourth column of Table 6 adds to the baseline model interactions between
each measure of financial constraints and two lender type dummies (14 interaction terms in all). I
then test the joint significance of each set of lender type interaction terms. Column 5 repeats the
same exercise except the financial constraints variables are instead interacted with five loan type
dummies. Results presented in Columns 4 and 5 show that none of the sets of interaction terms are
statistically significant at the 5 per cent level. Thus, even though lender type and loan type dummies
are themselves statistically significant, the relationship between firm credit constraints and the
matching to fixed or adjustable rate debt is independent of loan type or lender type. In other words,
the results are broadly based, rather than being driven by a single loan category or lender type.
4.7 Comparison to existing literature
How do these results compare to existing research on large, public firms? Chava and Purnandanam
(2006) study the floating-to-fixed ratio of the debt of around 1800 public companies. They find firms
close to financial distress use a higher share of fixed rate debt, consistent with the results from this
paper that credit-constrained firms match with fixed rate loans. A notable point of difference,

23
however, is that Chava and Purnandanam find managerial and corporate governance variables,
particularly the incentives facing the firm’s CFO, to be key determinants of a firm’s floating-to-fixed
ratio. Related research finds that managerial characteristics also play an important role in the
decision to hedge using derivatives (eg. Rogers 2002, Tufano 1996). In contrast, this paper finds that
owner and manager variables are relatively unimportant in determining the interest rate exposures of
small firms. A plausible reconciliation of these differences is that small firms have simple
organizational structures, where the incentives of owners and managers (often the same person or
family) are well-aligned. Thus, managerial agency problems are are likely to be relatively less
important for risk management outcomes. In contrast, credit constraints are likely to be more
important, since financial frictions are most likely to bind for small, bank-dependent firms.
Also closely related is Faulkender (2005), who studies incremental fixed-versus-adjustable
outcomes for debt fundings by a panel of publicly traded firms from the chemicals industry. Unlike
this paper, Faulkender finds quite weak evidence for ‘hedging’ theories of risk management,
consistent with the notion that hedging motivations are most important for small, private firms.
Faulkender’s main result is that firms engage in ‘market timing’, they switch between fixed and
adjustable rate debt exposures depending on the shape of the yield curve. In the next section, I show
that these patterns also extend to small firms, by analyzing a long (26-year) time-series of the share
of fixed-rate business loans.
Regarding the source of capital, Faulkender and Chava and Purnandanam both note that
bank loans are significantly more likely to involve an adjustable interest rate than public debt
fundings.13 Neither paper suggests an explanation for this stylized fact, however. This paper presents
evidence that bank loans are more likely involve an adjustable rate even compared to other, private
sources of finance; it also proposes a unified explanation for these facts, arguing that depository
13 Chava and Purnandanam find that firms with a public debt rating (a proxy for greater reliance on public debt rather than bank loans) have a 36 per cent higher fixed rate share. Faulkender finds a positive relationship between firm size and fixed rate exposures, which he argues reflects the fact that large firms originate more of their debt in public markets.

24
institutions originate a higher share of adjustable rate debt as a way of ameliorating exposure to
maturity mismatch and the ‘bank lending channel’ of monetary policy.
A final question: how important quantitatively is the ‘fixed-versus-adjustable’ decision as a
margin for risk management? Appendix A presents simple calculations of how much ‘fixed-versus-
adjustable’ outcomes affect small firms’ cashflow sensitivity to interest rate movements. I then
compare these to corresponding calculations for the use of interest rate derivatives by large firms,
given that derivatives are the margin of risk management most often studied in the literature. (These
derivatives calcuations are based on data from Guay and Kothari, 2003.) Scaled by firm size, I find
the ‘fixed-versus-adjustable’ margin has a significantly greater effect on firm interest rate sensitivity
than the use of derivatives, often larger by an order of magnitude or more depending on assumptions.
This finding is consistent with other recent papers that emphasize the importance of operational
hedging and other non-derivatives decisions for firm risk management outcomes (eg. Bartram,
Brown and Minton, 2006; Chava and Purnandanam, 2006; Petersen and Thiagarajan, 2000).
5. Time-series Patterns in Fixed and Adjustable Rate Lending
Recent work by Baker, Greenwood and Wurgler (2003) and Faulkender (2005) shows that the
interest rate exposure of firms’ new debt fundings fluctuates over time in response to changes in debt
market conditions like the level of interest rates and the shape of the yield curve, a phenomenon they
dub ‘debt market timing’. For example, both these papers find firms are more likely to borrow short
term or at a floating interest rate when the yield curve is steep. Baker et al study time-series variation
in aggregate debt maturity, while Faulkender examines the ‘final’ interest rate exposure of debt
fundings by a sample of Compustat firms; this exposure takes into account whether the funding was
initially fixed or floating plus whether an interest rate swap was used.
In this section, I extend previous research by testing whether these time-series patterns also
apply to the share of fixed-rate commercial loans. I use two data sources, the SBF data employed

25
earlier, and the Survey of Terms of Business Lending, a quarterly survey of banks conducted by the
Federal Reserve Board. To preview the results, I find similar time-series patterns to previous
research, even when restricting the sample to loans to small firms or loans made only by commercial
banks. I discuss implications of these findings for theories of ‘debt market timing’.
5.1 Evidence from the Survey of Terms of Business Lending (STBL)
The STBL is a quarterly survey of around 200 US commercial banks, who report on all business
loans greater than $1000 extended during a given reference week. Banks report information on the
loan size, maturity, interest rate, fees charged, commitment status, whether or not collateral was
posted against the loan, and where available the bank’s internal credit rating of the borrower.
From the initial STBL sample, I drop loans with maturity under one year (or with no stated
maturity), since the distinction between fixed and adjustable rates is negligible for very short-term
debt. I also exclude loans made under commitment, because of the issues associated with fixed rate
lines of credit discussed in Section 3.14 Using the remaining term loans, I construct value and
volume-weighted quarterly time-series of the proportion of fixed-rate loans for the period 1977–
2004. These are presented in Figure 1 below.
[INSERT FIGURE 1 HERE]
The thick line in the upper panel of the Figure is the volume of fixed rate loans as a fraction
of the total sample. The thin line is the dollar value of fixed rate loans as a proportion of the value of
all loans. In both time-series, the proportion of fixed rate loans fluctuates substantially over time. For
example the volume-weighted share falls from 0.8 in 1977 to around 0.3 by 1985, then drifts
upwards on average over the rest of the sample. The lower panel shows how the federal funds rate
and 10-1 year yield spread evolved over the same period.
I now estimate how the aggregate share of fixed rate loans is correlated with three measures
of debt market conditions, using a similar approach to Baker et al (2003). Namely, I regress the fixed 14 Commitments are also reported differently in the STBL than in the SBF. The STBL does not report commitments made, only amounts drawn down on the credit line.

26
rate loan share on the real interest rate, quarterly inflation rate, the 10-1 year Treasury yield spread,
as well as a time trend and the average log real loan size and log maturity of loans extended in the
quarter. I also include a lagged dependent variable to soak up any residual autocorrelation in the
fixed rate share. Results are presented in Table 7. The estimates in the Table reflect the long-run
effect of changes in the right hand side variables on the fixed rate share (this differs from the short-
run coefficients due to the presence of a lagged dependent variable).
[INSERT TABLE 7 ABOUT HERE]
Baker et al (2003) find the share of long term debt relative to short term debt is lower when inflation,
the real interest rate or the slope of the yield curve are high. Table 7 demonstrates that these variables
also in general predict a lower share of fixed rate loans, consistent with Baker et al’s findings.
Results in Column 1 are based on the proportion of fixed rate loans, while Column 2 uses the
value-weighted series. In Column 1, a one percentage point increase in the real interest rate is
estimated to reduce the fixed rate share by 4.8 percentage points, while a one percentage point
increase in the 10 year – 1 year interest rate spread reduces the fixed rate share by 7.4 percentage
points. Both estimates are significant at the 1 per cent level. The inflation rate coefficient is close to
zero and not statistically significant. In Column 2, the yield spread variable is somewhat smaller and
now significant only at the 10 per cent level.15 However, the inflation coefficient becomes negative
and statistically significant at the 10 per cent level, consistent with its sign in Baker et al (2003).
Columns 3 and 4 use the same specifications, except that the two time-series are constructed
only from smaller loans (a cutoff of $250 000 in terms of year 2000 dollars is used). The results are
similar.16 The results in these two columns suggest that debt-market timing is prevalent amongst
small firms, who make up a disproportionate share of small loans studied in Columns 3 and 4.
15 The overall R2 also drops substantially, from 0.84 to 0.23. The value-weighted series is noisier probably because it can be easily skewed by a few very large loans in any given quarter. 16 As a sensitivity check of whether the results are driven by the large decline in the fixed rate share in the early part of the sample, I generate a dummy equal to 1 in the second half of the sample, and re-estimate all four

27
5.2 Evidence from the SBF
As additional evidence specifically relating to small firms, I re-estimate the four baseline SBF
regressions from Table 3 after replacing the year dummies with the three debt market variables used
above (i.e. the real Federal Funds rate, 10-1 year yield spread and inflation rate). Although it is a
cross-sectional survey, the SBF does contain a substantial time-series dimension, because I consider
data from three survey vintages, where loans in each survey are originated in a window between the
survey date (normally 6-12 months after the end of the survey reference year) and three years prior to
the end of the survey reference year. The SBF reports the year and month on which the loan was
originated, so each loan is then matched against debt market conditions at the time of origination.
[INSERT TABLE 8]
Estimates for the three debt market variables are presented in Table 8 (other coefficient
estimates are very similar to Table 3). Similar to the STBL results, the Table shows that SBF firms,
which by definition are all small and medium sized enterprises, match more often with fixed rate
debt when the yield curve is flat or real interest rates are low. The yield curve coefficient is
significant at the 1 per cent level in three of four specifications, and at the 5 per cent level in the
other. The real federal funds rate coefficient is less precisely estimated, but is significant at the 10
per cent level in two of the four specifications. Finally, in unreported regressions, I interact the debt
market conditions variables with firm size, to see whether market timing patterns are more or less
pronounced amongst the smallest, potentially most credit constrained firms. These interaction terms
are not statistically significant (results available on request).
specifications including the dummy as well as its interaction with the variables of interest (yield spread, inflation rate and real interest rate). Out of twelve cases (three interaction terms x four regressions) the interaction term is significant at the 5 percent level twice, the inflation coefficient in Columns 1 and 3. In both cases the interaction term is negatively signed, suggesting in fact a stronger relationship in the second half of the sample.

28
5.3 Discussion
The two sets of estimates presented above provide a consistent picture: firms are more likely to
borrow at an adjustable interest rate when the yield curve is steep or the real federal funds rate is
high. These results still apply even if we consider a sample of only small firms or small loans, or an
alternative sample of loans originated only by commercial banks.
What do we learn from these findings? Firstly, we have learned that that previous results on
‘debt market timing’ patterns are not simply an artifact of firms substituting between public and
private debt over the business cycle. Most directly, the results hold even using STBL data which
reflects only a single source of finance, term loans from commercial banks. This is significant,
because Baker et al and Faulkender’s samples include a mix of different types of debt, and, as shown
earlier, the source of finance is highly correlated with the debt contract’s final interest rate exposure.
Secondly, the results show that ‘debt market timing’ patterns extend to small, privately-held
firms. This is to my knowledge a new result, and is not obviously implied by previous research. For
example, Baker et al. (2003) find that within the Compustat universe, debt market timing patterns are
most pronounced amongst the largest, most mature firms. The fact that these patterns extend to small
firms sheds some light on the underlying economic explanations for ‘market timing’ patterns. In a
recent paper Chernenko, Faulkender and Milbourn (2006) argue that Faulkender’s (2005) result that
firms use adjustable rate debt when the yield curve is steep is driven by firms’ attempts to meet
consensus earnings forecasts, and by the compensation structure of the firm’s management,
especially the CFO. The results presented above suggest this cannot be a complete explanation, since
these patterns are also prevalent amongst small firms, where owner and manager incentives are
generally well-aligned.
Baker et al. (2003) present a different interpretation of their results. They suggest firms are
successfully ‘timing’ the debt market by issuing short-term debt during periods when excess bond
returns are high. Although it seems unlikely that the small firms in the SBF are financially

29
sophisticated enough to be able to successfully forecast future bond returns, it is perhaps possible
that firms follow ‘rules of thumb’, such as borrowing short-term whenever short rates are
significantly below long rates, that historically have been associated with systematic excess returns.
To summarize, understanding the sources of ‘market timing’ patterns remains an active area
of research. Although not the main focus of this paper, the results presented here suggest that any
unified explanation of ‘debt market timing’ patterns must be able to rationalize why such patterns are
prevalent among both large, public companies as well as small closely-held firms.
6. Cross-sectional evidence from the STBL
As a final robustness exercise, I use the STBL microdata to analyze cross-sectional patterns in
‘fixed-versus-adjustable’ outcomes. An attractive feature of the STBL is that it identifies the
commercial bank which provided each loan, enabling controls for bank characteristics or bank fixed
effects. Hence, I am able to check whether previous results are robust to the inclusion of these
additional lender controls, which are not available in the SBF. Since the STBL does not report any of
the proxies for firm credit constraints used earlier (size, age, bank relationships etc.), I focus on the
coefficient on loan size, viewing loan size as a proxy for firm assets. In the SBF, the correlation
between loan size and firm assets is ρ=0.75, suggesting the proxy is quite good.
The regression sample period is Q1:1997 to Q3:2004. (STBL data on loan risk ratings begin
only in 1997). The total sample size is 40658. 45 per cent of these loans are fixed rate, and about 80
per cent are collateralized. The average loan size is $764 thousand, larger than the SBF, which only
samples small firms. Average loan maturity is 4 years. The data includes banks’ internal risk rating
of the loan, which are classified on a 1-5 scale (1 is the safest, 5 refers to a workout loan). 77 per cent
of sample loans are assigned a risk rating, and 94 per cent of rated loans are assigned a middle rating
of 2, 3 or 4. Analogous to the SBF regressions, I estimate the following linear probability model:
P(fixed) = Φ(a0 + a1 . log(loan size) + a2 . loan controls + a3 . loan risk rating +

30
+ a4 bank controls + a5 . time-series controls + e) [3]
‘Loan controls’ includes log(loan maturity) and a dummy for whether the loan is collateralized.
‘Loan risk rating’ includes dummies for each value of the rating, a dummy for whether the bank
branch uses risk ratings, and a dummy equal to one if the branch uses ratings for some loans but not
the loan in question. Column 1 includes bank fixed effects (533 institutions in total). In Column 2
these fixed effects are replaced by two bank characteristics: bank size (the log of bank assets) and
liquidity (liquid assets / total assets, where liquid assets is the sum of cash and Treasury securities as
in Kashyap and Stein, 2000). Standard errors in both columns are clustered by bank.
[INSERT TABLE 9 HERE]
Results are presented in Table 9. Column 1 includes bank fixed effects, while in Column 2,
these fixed effects are replaced with two bank characteristics drawn from bank Call Reports data:
log(bank assets) and (liquid assets / total assets).17
The first row of results shows that small loans are significantly more likely to involve a
fixed interest rate. The coefficient on log(loansize) is –0.034 and –0.055 in Columns 1 and 2
respectively, significant at the 1 per cent level. Interpreting loan size as a proxy for firm size, this
result therefore is consistent with previous findings from the SBF that small firms match with fixed
rate debt. Since we obtain this result even after controlling for bank fixed effects (i.e. comparing
loans of different sizes all originated by the same bank), this suggests the earlier result is not
somehow an artifact of failing to control adequately for lender characteristics. Estimated coefficients
are somewhat smaller than the log assets coefficient from the SBF regressions in Table 3; this likely
in part reflects attenuation bias, given that loan size is a noisy proxy for firm size.
17 The coefficient on bank size is negative and significant at the 1 per cent level. Given the lack of firm controls, this likely reflects the fact that small banks disproportionately lend to small firms, who are also more likely to take out fixed rate debt. The liquid assets variable is not statistically significant.

31
Results for two measures of loan default risk, collateral and loan risk rating, are somewhat
inconsistent. On one hand, collateralized loans are estimated to be 6.0 and 10.2 percentage points
more likely to involve a fixed interest rate. Berger and Udell (1990) show that loan collateral is
associated with riskier borrowers (those more likely to default), as well as riskier loans, so this
positive coefficient is evidence that high-risk firms match with fixed rate debt. However, the risk
rating estimates suggest if anything an opposite result. In both columns, the middle three risk rating
categories are not distinguishable statistically, since the coefficients on risk=2 and risk=4 are not
significant. However, in Column 1 firms in the lowest risk bucket are found to be more likely to
match with fixed rate loans (significant at the 5 per cent level), while loans in the ‘workout loan’ risk
bucket are less likely to be fixed rate (significant at the 10 per cent level).18
It is difficult to clearly disentangle these findings given the lack of detailed firm controls.
The risk-rating results apply only in the tails, which make up only a small percentage of loans
(risk=5 loans are 3.8 per cent of rated loans, and risk=1 loans 2.2 per cent). Interpretations should
also be tempered by the fact that STBL internal risk ratings have been found to be essentially
uncorrelated with ex-post measures of performance such as charge-offs or delinquency (Ashcraft and
Morgan 2003, English and Nelson 1998).
To summarize, cross-sectional evidence from the STBL shows that small loans are
significantly more likely to involve a fixed interest rate, even after controlling for bank fixed effects
or bank characteristics. Since loan size and firm size are closely correlated, this provides further
evidence that small firms match with fixed rate debt.
18 Also, STBL risk ratings reflect the rating of the loan itself, rather than an ex-ante assessment of the firm’s creditworthiness (English and Nelson, 1998). Thus, reverse causality may be an issue; if banks view adjustable rate loans as riskier, they will apply less favorable risk ratings to such loans, leading to a positive correlation between adjustable rates and risk ex post, even if loans and firms are randomly assigned ex-ante.

32
7. Conclusions
This paper finds evidence that small, bank-dependent firms use loan contracts to systematically
adjust their exposure to interest rate risk. Credit constrained firms are more likely to match with
fixed rate debt, consistent with evidence on the ‘credit channel’ of monetary policy that suggests
such firms are most sensitive to rising interest rates. Fixed rate debt is also less prevalent in sectors
where industry output moves procyclically with interest rates, consistent with the idea that firms in
these industries have a partial ‘natural hedge’ against rising interest rates. Both these results match
with a credit-constraints model of risk management like Froot, Scharfstein and Stein (1993).
In the time-series, correlations previously identified in the ‘debt market timing’ literature
amongst large public companies are shown to also apply to bank loans extended to small firms;
namely, fixed rates are most popular when the yield curve is flat or real interest rates are high. These
findings suggest ‘market-timing’ patterns are not just due to earnings management or managerial
agency problems, since these concerns are likely much less important for small firms, where the
incentives of owners and managers (often the same person) are generally well-aligned.
Finally, this paper finds evidence that suggests loan contracts reflect the interest rate risk
exposures of lenders as well as borrowers. Savings banks and commercial banks, who are sensitive
to rising interest rates due to their reliance on deposit finance, originate a significantly higher
proportion of adjustable rate loans, ameliorating their own ex-ante exposure to interest rate risk.
This last finding has potentially interesting implications for the evolution of the credit
channel of monetary policy. Monetary shocks affect firm balance sheets (the ‘balance sheet
channel’) as well as the ability of banks to lend (the ‘lending channel’); Cecchetti (1995) notes [in
discussing these two channels] that ‘with the introduction of interstate banking and the development
of more sophisticated pools of loans, it is only the balance sheet effects that will remain’. The results
in this paper, however, suggest that interest rate exposure decisions of firms and lenders are linked.
Thus, improved risk management by lenders may also weaken the balance sheet channel, as banks

33
smooth risk once borne by firms or households. The recent proliferation of flexible ‘exotic’
household mortgages and business loans is perhaps evidence of this ‘risk sharing’ effect in action.

34
References
Adam, Tim, Sudipto Dasgupta and Sheridan Titman, 2006, Financial Constraints, Competition and Hedging in Industry Equilibrium, SSRN Working Paper.
Alburcurque, Rui and Hugo Hopenhayn, 2004, Optimal Lending Contracts and Firm Dynamics, Review of Economic Studies, 71, 285-315.
Allayannis, George, and James P. Weston, 1998, The Use of Foreign Currency Derivatives and Firm Market Value, Review of Financial Studies, 14, 243-276.
Arvan, Larry and Jan Brueckner, 1986, Efficient Contracts in Credit Markets Subject to Interest Rate Risk: An Application of Raviv's Insurance Model, American Economic Review, 76, 259-63.
Ashcraft, Adam, 2004, New Evidence on the Lending Channel, Journal of Money, Credit, and Banking, forthcoming.
Ashcraft, Adam and Murillo Campello, 2006, Firm Balance Sheets and Monetary Policy Transmission, Journal of Monetary Economics, forthcoming.
Ashcraft, Adam and Don Morgan, 2003, Using Loan Rates to Measure and Regulate Bank Risk: Findings and an Immodest Proposal, Journal of Financial Services Research, 24, 181-200.
Baker, Malcolm, Robin Greenwood and Jeffrey Wurgler, 2003, The Maturity of Debt Issues and Predictable Variation in Bond Returns, Journal of Financial Economics, 70, 261-291. Bartram, Söhnke M., Gregory W. Brown and Bernadette A. Minton, 2006, Resolving the Exposure Puzzle: The Many Facets of Exchange Rate Exposure, Working Paper. Berger, Allen and Greg Udell, 1990, Collateral, Loan Quality and Bank Risk, Journal of Monetary Economics, 25, 21-42. Berger, Allen, Nathan Miller, Mitchell Petersen, Raghuram Rajan and Jeremy Stein, 2005, Does Function Follow Organizational Form? Evidence From the Lending Practices of Large and Small Banks, Journal of Financial Economics, 76, 237-269. Bernanke, Ben and Mark Gertler, 1995, Inside the Black Box: the Credit Channel of Monetary Policy Transmission, Journal of Economic Perspectives, vol 9, no 4.
Bewley, Ronald, 1979, The Direct Estimation of the Equilibrium Response in a Linear Dynamic Model, Economics Letters, 3, 357-361.
Cabral, Luis and Jose Mata, 2003, On the Evolution of the Firm Size Distribution: Facts and Theory, American Economic Review, 93, 1075-1090.
Campbell, John and Joao Cocco, 2003, Household Risk Management and Optimal Mortgage Choice, Quarterly Journal of Economics, 118, 1449-1494.

35
Cecchetti, Stephen G., 1995, Distinguishing Theories of the Monetary Transmission Mechanism, Federal Reserve Bank of St. Louis Review, 77, 83-97.
Chava, Sudheer and Amiyatosh Purnandanam, 2006, Determinants of the Floating to Fixed Rate Debt Structure of Firms, SSRN Working Paper. Chernenko, Sergey, Michael Faulkender and Todd Milbourn, 2006, Why are Firms Using Interest Rate Swaps to Time the Yield Curve? SSRN Working Paper.
Covitz, Daniel and Steven Sharpe, 2005, Do Non-Financial Firms Use Interest Rate Derivatives to Hedge? Federal Reserve Board Finance and Economics Discussion Series, 2005-39.
DeGryse, Hans and Patrick Van Cayseele, 2000, Relationship Lending within a Bank Based System: Evidence from European Small Business Data, Journal of Financial Intermediation, 9, 90-109. DeGryse, Hans and Steven Ongena, Distance, Lending Relationships and Competition, Journal of Finance, 60, 231-266.
Diamond, Douglas W., 1991, Monitoring and Reputation: The Choice between Bank Loans and Directly Placed Debt, Journal of Political Economy, 689-721. Edelstein, Robert and Branko Urosevic, 2003, Optimal Loan Interest Rate Contract Design, Journal of Real Estate Finance and Economics, 26 (2/3), 127-156.
Ehrmann, Michael, 2000, Firm Size and Monetary Policy Transmission, Evidence from German Business Survey Data, ECB Working Paper No. 21.
Eisfeldt, Andrea, and Adriano Rampini, 2004, New or Used? Investment and Credit Constraints, Working Paper, Northwestern University Kellogg School of Management.
English, William and William Nelson, 1998, Bank Risk Rating of Business Loans, Finance and Economics Discussion Series 98-51, Board of Governors of the Federal Reserve System.
Evans, David, 1987, The Relationship between Firm Growth, Size and Age: Estimates for 100 Manufacturing Industries, Journal of Industrial Economics, 35, 567-81.
Faulkender, Michael, 2005, Hedging or Market Timing? Selecting the Interest Rate Exposure of Corporate Debt, Journal of Finance, 60, 931-62.
Fenn, George W., Mitch Post and Steven A. Sharpe, 1996, Debt Maturity and the use of Interest Rate Derivatives by Non-Financial Firms, Finance and Economics Discussion Series 96-36, Board of Governors of the Federal Reserve System.
Froot, Kenneth, David Scharfstein, and Jeremy Stein, 1993, Risk Management: Coordinating Corporate Investment and Financing Policies, Journal of Finance, 48, 1629-1657.
Froot, Kenneth and Jeremy Stein, 1998, Risk management, capital budgeting, and capital structure policy for financial institutions: an integrated approach, Journal of Financial Economics, 47, 55-82.

36
Géczy, Christopher, Bernadette A. Minton, Catherine Schrand, 1997, Why Firms Use Currency Derivatives, Journal of Finance, 52, 1323-1354.
Gertler, Mark and Simon Gilchrist, 1994, Monetary Policy, Business Cycles and the Behavior of Small Manufacturing Firms, Quarterly Journal of Economics, 109, 309-40.
Green, Richard and Susan Wachter, 2005, The American Mortgage in Historical and International Context, Journal of Economic Perspectives, 19(4), 93-114.
Greenwood, Robin, 2003, Evidence for a Debt Financing Channel in Corporate Investment, Working Paper.
Graham, John R. and Daniel A. Rogers, 2002, Do Firms Hedge in Response to Tax Incentives?, Journal of Finance, 57, 815-839.
Guay, Wayne, 1999, The Impact of Derivatives on Firm Risk: An Empirical Examination of New Derivative Users, Journal of Accounting and Economics, 26, 319-351.
Guay, Wayne and Kothari, S.P., 2003, How Much do Firms Hedge Using Derivatives?, Journal of Financial Economics, 70, 423-461.
Guedes, Jose and Rex Thompson, 1995, Tests of a Signalling Hypothesis: The Choice Between Fixed- and Adjustable-Rate Debt, Review of Financial Studies, 8, 605-636.
Haushalter, G. David, 2000, Financing Policy, Basis Risk, and Corporate Hedging: Evidence from Oil and Gas Producers, Journal of Finance, 55, 107-152.
Kaplan, Steven and Luigi Zingales, 1997, Are Investment-Cashflow Sensitivities Useful Measures of Financing Constraints? Quarterly Journal of Economics, 112, 169-215.
Kashyap, Anil K. and Jeremy C. Stein, 1995, The Impact of Monetary Policy on Bank Balance Sheets, Carnegie-Rochester Conference Series on Public Policy, 42, 151-95.
Kashyap, Anil K. and Jeremy C. Stein, 2000, What Do a Million Observations on Banks Say About the Transmission of Monetary Policy? American Economic Review, 90, 407-428.
Kashyap, Anil, Jeremy Stein and David Wilcox, Monetary Policy and Credit Conditions: Evidence from the Composition of External Finance, American Economic Review, 83, 78-98.
Liberti, Jose and Atif Mian, 2006, Estimating the Effect of Hierarchies on Information Use, Working Paper, University of Chicago.
Lin, Chen-Miao and Stephen Smith, 2003, Hedging, Financing and Investment Decisions: A Theory and Empirical Tests, Working Paper.
Mian, Shehzad L., 1996, Evidence on Corporate Hedging Policy, Journal of Financial and Quantitative Analysis, 31, 419-439.
Pagan, Adrian, 1984, Econometric Issues in the Analysis of Regressions with Generated Regressors, International Economic Review, 25, 221-247.

37
Pantzalis, Christos, Betty Simkins and Paul Laux, 2001, Operational Hedges and the Foreign Exchange Exposure of US Multinational Corporations, Journal of International Business Studies, 32, 4, 793-812.
Petersen, Mitchell and Raghuram Rajan, 1994, The Benefits of Lending Relationships: Evidence from Small Business Data, Journal of Finance, 49, 3-37.
Petersen, Mitchell and Raghuram Rajan, 1995, The Effect of Credit Market Competition on Firm-Creditor Relationships, Quarterly Journal of Economics, 110, 407-443.
Petersen, Mitchell and Raghuram Rajan, 2002, Does Distance Still Matter? The Information Revolution in Small Business Lending, Journal of Finance, 57, 2533-2570. Petersen, Mitchell and S. Ramu Thiagarajan, 2000, Risk Measurement and Hedging: With and Without Derivatives, Financial Management, 29(4), 5-30.
Purnanandam, Amiyatosh, 2004, Financial Distress and Corporate Risk Management: Theory and Evidence, Working Paper, University of Michigan. Rogers, Daniel, 2002, Does executive portfolio structure affect risk management? CEO risk-taking incentives and corporate derivatives usage, Journal of Banking and Finance, 26, 271-95.
Sharpe, Steven, 1990, Asymmetric Information, Bank Lending and Implicit Contracts: A Stylized Model of Customer Relationships, Journal of Finance, 45, 1069-1087.
Sierra, Gregory and Tim Yeager, 2004, What Does the Federal Reserve’s Economic Value Model Tell Us About Interest Rate Risk at U.S. Community Banks? Federal Reserve Bank of St. Louis Review, November/December, 86(6), 45-60.
Stein, Jeremy, 1998, An Adverse Selection Model of Bank Asset and Liability Management with Implications for the Bank Lending Channel of Monetary Policy, RAND Journal of Economics, 29, 466-486. Stein, Jeremy, 2002, Information production and capital allocation: Decentralized versus hierarchical firms, Journal of Finance, 57, 1891–1922.
Tufano, Peter, 1996, Who Manages Risk? An Empirical Examination of Risk Management Practices in the Gold Mining Industry, Journal of Finance, 51, 1097-1137. Vickery, James, 2006, Interest Rates and Consumer Choice in the Residential Mortgage Market, Working Paper, Federal Reserve Bank of New York.
Von Thadden, Ernst-Ludwig, 2004, Asymmetric Information, Bank Lending and Implicit Contracts: The Winner’s Curse, Finance Research Letters, 1, 11-23. Wright, David and James Houpt, 1996, An Analysis of Commercial Bank Exposure to Interest Rate Risk, Federal Reserve Bulletin, February, 115-128.
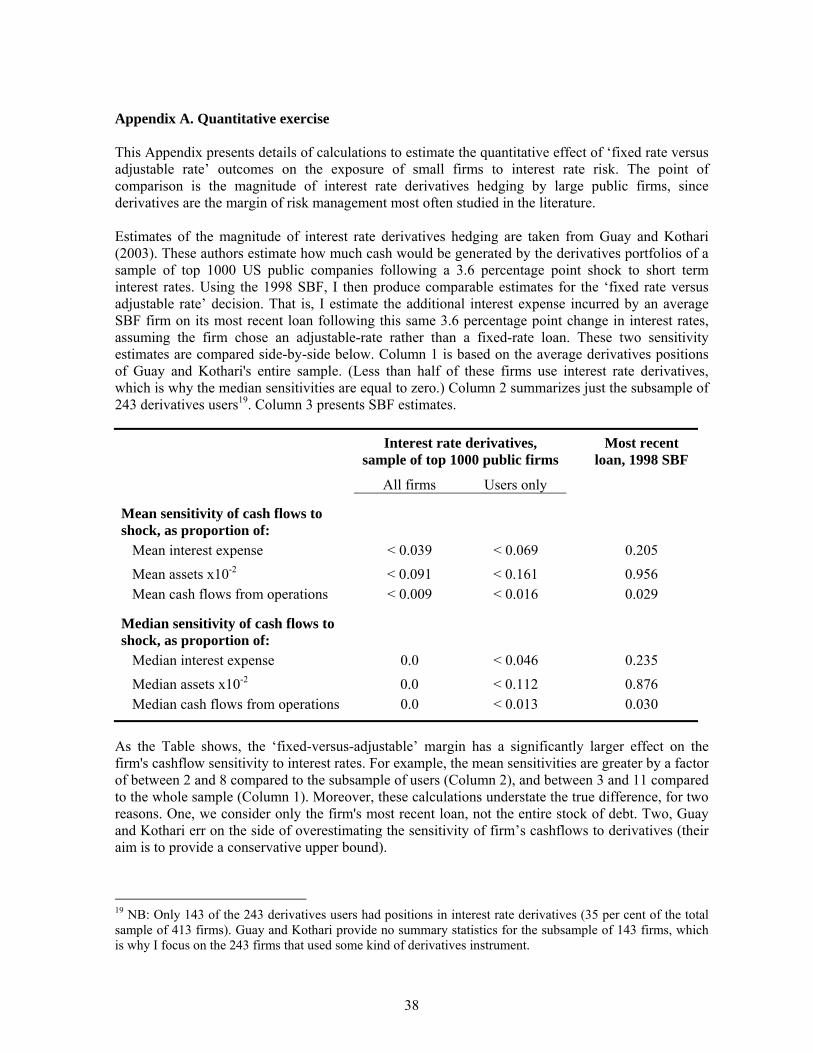
38
Appendix A. Quantitative exercise This Appendix presents details of calculations to estimate the quantitative effect of ‘fixed rate versus adjustable rate’ outcomes on the exposure of small firms to interest rate risk. The point of comparison is the magnitude of interest rate derivatives hedging by large public firms, since derivatives are the margin of risk management most often studied in the literature. Estimates of the magnitude of interest rate derivatives hedging are taken from Guay and Kothari (2003). These authors estimate how much cash would be generated by the derivatives portfolios of a sample of top 1000 US public companies following a 3.6 percentage point shock to short term interest rates. Using the 1998 SBF, I then produce comparable estimates for the ‘fixed rate versus adjustable rate’ decision. That is, I estimate the additional interest expense incurred by an average SBF firm on its most recent loan following this same 3.6 percentage point change in interest rates, assuming the firm chose an adjustable-rate rather than a fixed-rate loan. These two sensitivity estimates are compared side-by-side below. Column 1 is based on the average derivatives positions of Guay and Kothari's entire sample. (Less than half of these firms use interest rate derivatives, which is why the median sensitivities are equal to zero.) Column 2 summarizes just the subsample of 243 derivatives users19. Column 3 presents SBF estimates.
Interest rate derivatives,
sample of top 1000 public firms Most recent
loan, 1998 SBF
All firms Users only
Mean sensitivity of cash flows to shock, as proportion of: Mean interest expense < 0.039 < 0.069 0.205 Mean assets x10-2 < 0.091 < 0.161 0.956 Mean cash flows from operations < 0.009 < 0.016 0.029
Median sensitivity of cash flows to shock, as proportion of: Median interest expense 0.0 < 0.046 0.235 Median assets x10-2 0.0 < 0.112 0.876 Median cash flows from operations 0.0 < 0.013 0.030
As the Table shows, the ‘fixed-versus-adjustable’ margin has a significantly larger effect on the firm's cashflow sensitivity to interest rates. For example, the mean sensitivities are greater by a factor of between 2 and 8 compared to the subsample of users (Column 2), and between 3 and 11 compared to the whole sample (Column 1). Moreover, these calculations understate the true difference, for two reasons. One, we consider only the firm's most recent loan, not the entire stock of debt. Two, Guay and Kothari err on the side of overestimating the sensitivity of firm’s cashflows to derivatives (their aim is to provide a conservative upper bound).
19 NB: Only 143 of the 243 derivatives users had positions in interest rate derivatives (35 per cent of the total sample of 413 firms). Guay and Kothari provide no summary statistics for the subsample of 143 firms, which is why I focus on the 243 firms that used some kind of derivatives instrument.
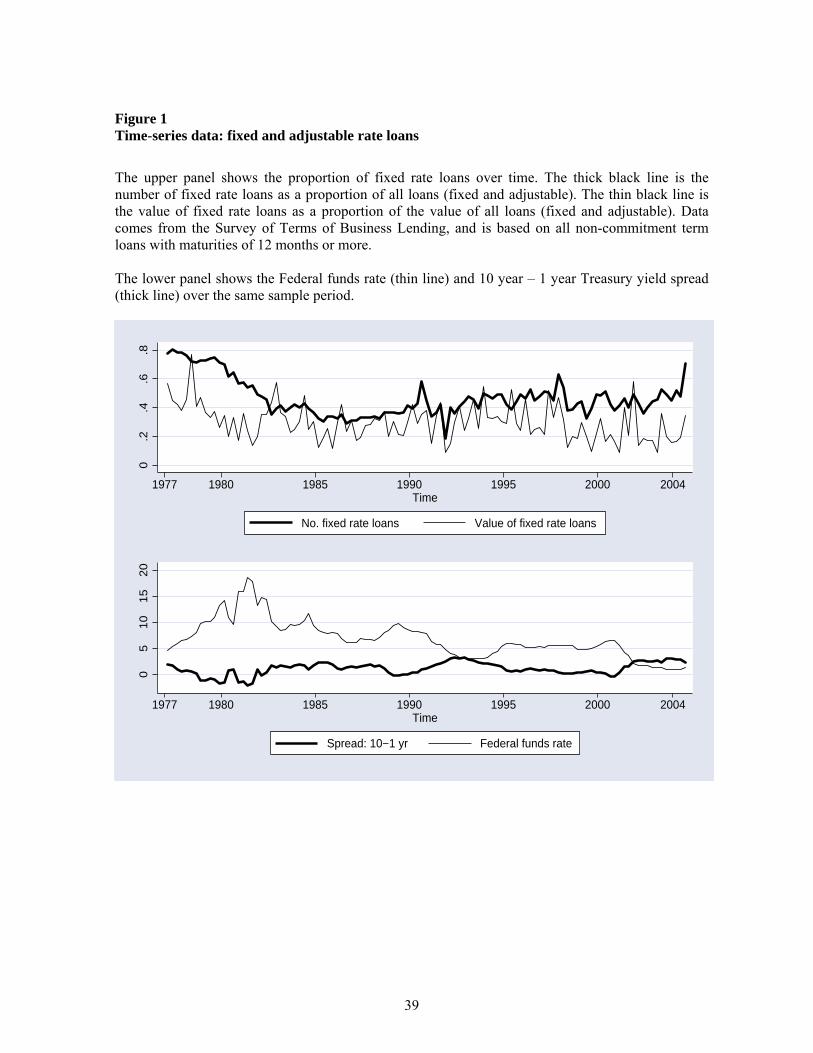
39
Figure 1 Time-series data: fixed and adjustable rate loans
The upper panel shows the proportion of fixed rate loans over time. The thick black line is the number of fixed rate loans as a proportion of all loans (fixed and adjustable). The thin black line is the value of fixed rate loans as a proportion of the value of all loans (fixed and adjustable). Data comes from the Survey of Terms of Business Lending, and is based on all non-commitment term loans with maturities of 12 months or more. The lower panel shows the Federal funds rate (thin line) and 10 year – 1 year Treasury yield spread (thick line) over the same sample period.
0.2
.4.6
.8
1977 1980 1985 1990 1995 2000 2004Time
No. fixed rate loans Value of fixed rate loans
05
10
15
20
1977 1980 1985 1990 1995 2000 2004Time
Spread: 10−1 yr Federal funds rate
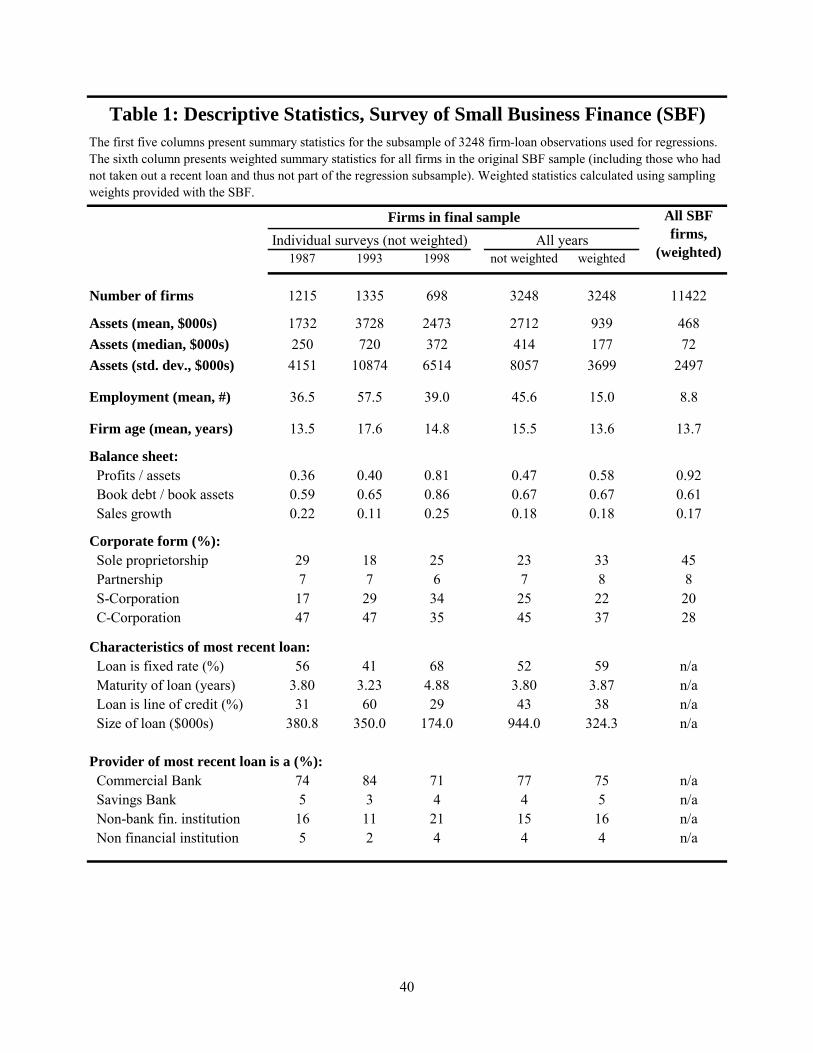
40
1987 1993 1998 not weighted weighted
Number of firms 1215 1335 698 3248 3248 11422
Assets (mean, $000s) 1732 3728 2473 2712 939 468Assets (median, $000s) 250 720 372 414 177 72Assets (std. dev., $000s) 4151 10874 6514 8057 3699 2497
Employment (mean, #) 36.5 57.5 39.0 45.6 15.0 8.8
Firm age (mean, years) 13.5 17.6 14.8 15.5 13.6 13.7
Balance sheet: Profits / assets 0.36 0.40 0.81 0.47 0.58 0.92 Book debt / book assets 0.59 0.65 0.86 0.67 0.67 0.61 Sales growth 0.22 0.11 0.25 0.18 0.18 0.17
Corporate form (%): Sole proprietorship 29 18 25 23 33 45 Partnership 7 7 6 7 8 8 S-Corporation 17 29 34 25 22 20 C-Corporation 47 47 35 45 37 28
Characteristics of most recent loan: Loan is fixed rate (%) 56 41 68 52 59 n/a Maturity of loan (years) 3.80 3.23 4.88 3.80 3.87 n/a Loan is line of credit (%) 31 60 29 43 38 n/a Size of loan ($000s) 380.8 350.0 174.0 944.0 324.3 n/a
Provider of most recent loan is a (%): Commercial Bank 74 84 71 77 75 n/a Savings Bank 5 3 4 4 5 n/a Non-bank fin. institution 16 11 21 15 16 n/a Non financial institution 5 2 4 4 4 n/a
Table 1: Descriptive Statistics, Survey of Small Business Finance (SBF)The first five columns present summary statistics for the subsample of 3248 firm-loan observations used for regressions. The sixth column presents weighted summary statistics for all firms in the original SBF sample (including those who had not taken out a recent loan and thus not part of the regression subsample). Weighted statistics calculated using sampling weights provided with the SBF.
Individual surveys (not weighted) All yearsFirms in final sample All SBF
firms, (weighted)
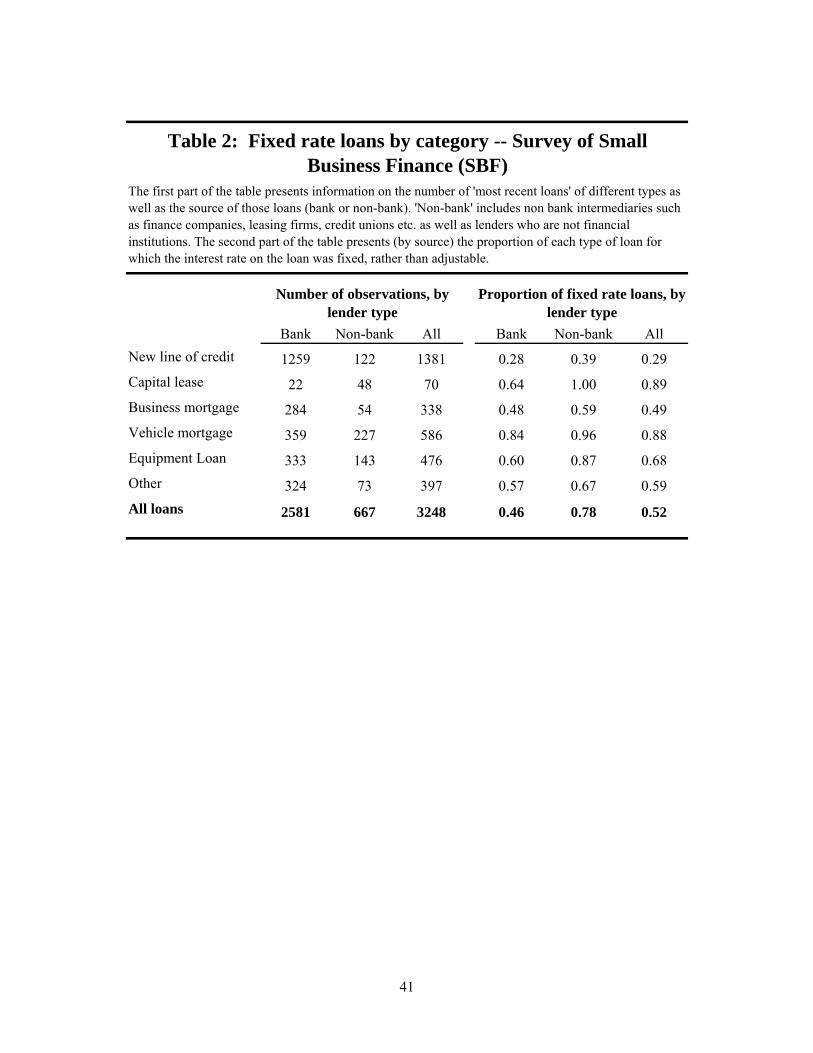
41
Bank Non-bank All Bank Non-bank AllNew line of credit 1259 122 1381 0.28 0.39 0.29Capital lease 22 48 70 0.64 1.00 0.89Business mortgage 284 54 338 0.48 0.59 0.49Vehicle mortgage 359 227 586 0.84 0.96 0.88Equipment Loan 333 143 476 0.60 0.87 0.68Other 324 73 397 0.57 0.67 0.59All loans 2581 667 3248 0.46 0.78 0.52
Table 2: Fixed rate loans by category -- Survey of Small Business Finance (SBF)
The first part of the table presents information on the number of 'most recent loans' of different types as well as the source of those loans (bank or non-bank). 'Non-bank' includes non bank intermediaries such as finance companies, leasing firms, credit unions etc. as well as lenders who are not financial institutions. The second part of the table presents (by source) the proportion of each type of loan for which the interest rate on the loan was fixed, rather than adjustable.
Number of observations, by lender type
Proportion of fixed rate loans, by lender type

42
(1) (2) (3) (4)Sample All loans No commitments All loans No commitments
Firm size and age variablesLog(assets) -0.065 -0.047 -0.092 -0.064
(0.009)*** (0.010)*** (0.010)*** (0.011)***Log(firm age + 1) -0.051 -0.047 -0.052 -0.046
(0.021)** (0.021)** (0.021)** (0.020)**
Cash flows relative to investment opportunitiesProfits/assets -0.024 -0.021 -0.015 -0.015
(0.010)** (0.009)** (0.010) (0.010)Sales growth 0.057 0.021 0.042 0.011
(0.030)* (0.030) (0.030) (0.030)
Lending relationship variablesSwitch 0.105 0.100 0.046 0.029
(0.032)*** (0.029)*** (0.037) (0.036)Log(years prim. lender + 1) 0.020 -0.002 0.021 0.001
(0.016) (0.017) (0.016) (0.017)No. fin.institutions 0.003 0.002 -0.005 -0.006
(0.010) (0.010) (0.010) (0.010)
Provider of loan (baseline: lender is non-bank financial institution)Lender is a bank -0.137 -0.122
(0.042)*** (0.037)***Lender not financial institution -0.010 -0.104
(0.096) (0.097)DebtLoan size / total assets -0.168 -0.111
(0.027)*** (0.029)***Book debt / Book assets -0.076 -0.063 -0.029 -0.036
(0.022)*** (0.023)*** (0.025) (0.026)
Other controlsEndogenous loan characteristics? no no yes yesOther lender controls? no no yes yesOther controls? yes yes yes yesYear dummies? yes yes yes yes
pseudo R2 0.25 0.20 0.28 0.25No. observations 3248 1867 3248 1867***, ** and * represents significance at 1%, 5% and 10% levels respectively.
Table 3: Which firms match to fixed rate loans?Dependent variable = 1 if firm's most recent loan is fixed rate loan, = 0 if adjustable rate loan. Weighted probit;coefficients normalized to display marginal effects. Standard errors in parentheses are adjusted for heteroskedasticity.Amongst controls not listed, "Endogenous loan characteristics" includes maturity of the loan and 7 collateral dummies."Other lender controls" for most recent lender includes log(distance between lender and firm) and 2 dummies for maintype of lender-firm interaction (ie. face to face, telephone or other). "Other controls" includes: 5 dummies for purpose ofloan (ie. credit line, capital lease, business mortgage, vehicle mortgage, equipment loan or other), 3 dummies for location ofthe firm, industry dummies at 2-digit SIC level, 2 incorporation dummies (ie. C-corp, S-corp or unincorporated), dummy forwhether local bank HHI > 1800, and dummy for whether firm solicited by financial institutions.
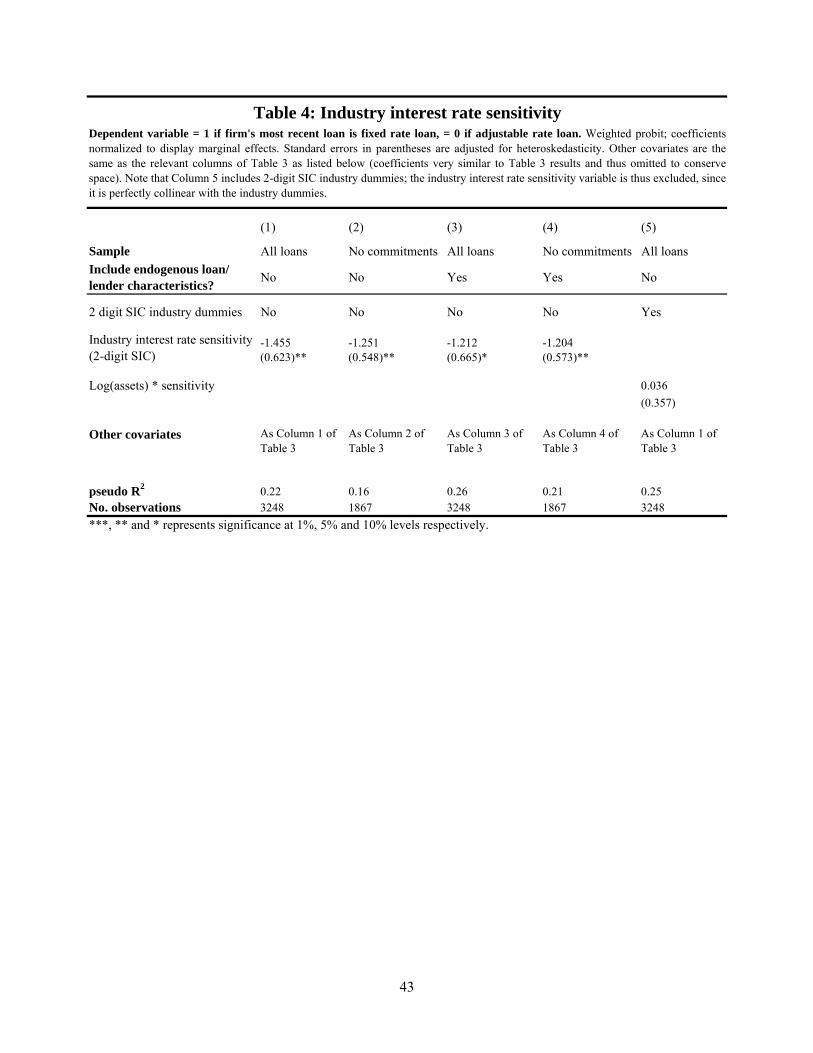
43
(1) (2) (3) (4) (5)
Sample All loans No commitments All loans No commitments All loansInclude endogenous loan/ lender characteristics? No No Yes Yes No
2 digit SIC industry dummies No No No No Yes
-1.455 -1.251 -1.212 -1.204(0.623)** (0.548)** (0.665)* (0.573)**
Log(assets) * sensitivity 0.036(0.357)
Other covariates
pseudo R2 0.22 0.16 0.26 0.21 0.25No. observations 3248 1867 3248 1867 3248***, ** and * represents significance at 1%, 5% and 10% levels respectively.
As Column 1 of Table 3
Table 4: Industry interest rate sensitivityDependent variable = 1 if firm's most recent loan is fixed rate loan, = 0 if adjustable rate loan. Weighted probit; coefficientsnormalized to display marginal effects. Standard errors in parentheses are adjusted for heteroskedasticity. Other covariates are thesame as the relevant columns of Table 3 as listed below (coefficients very similar to Table 3 results and thus omitted to conservespace). Note that Column 5 includes 2-digit SIC industry dummies; the industry interest rate sensitivity variable is thus excluded, sinceit is perfectly collinear with the industry dummies.
As Column 1 of Table 3
As Column 2 of Table 3
As Column 3 of Table 3
As Column 4 of Table 3
Industry interest rate sensitivity (2-digit SIC)
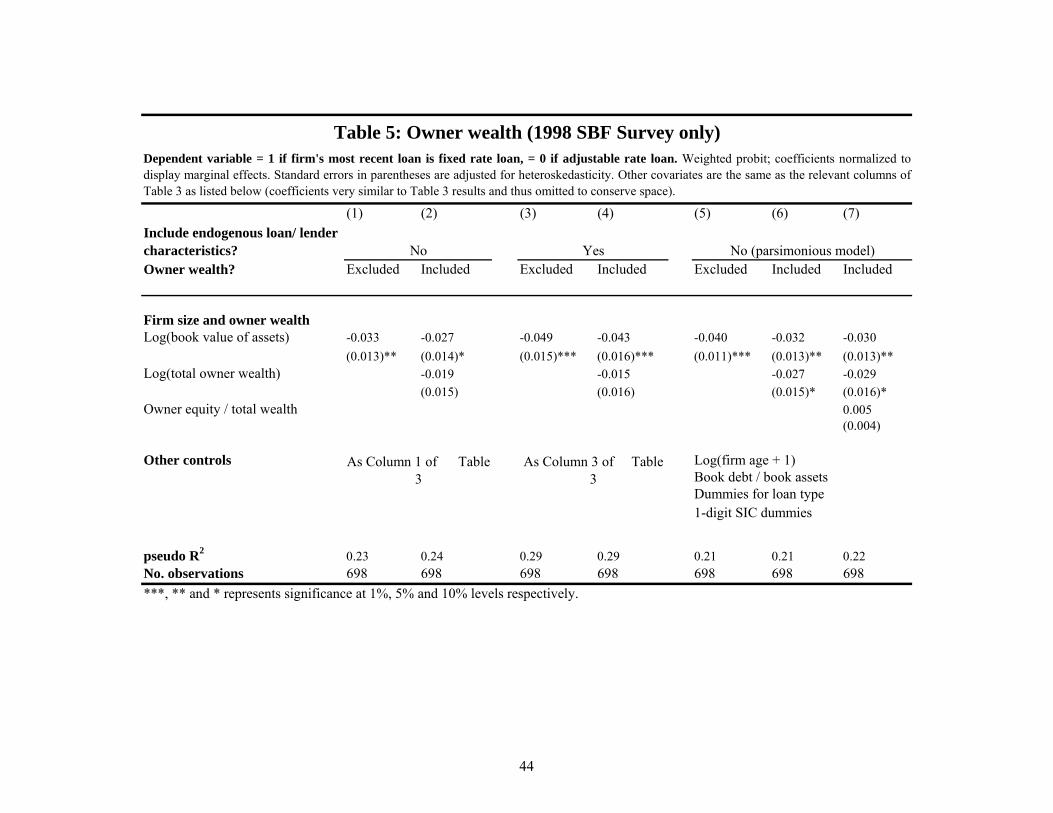
44
(1) (2) (3) (4) (5) (6) (7)Include endogenous loan/ lender characteristics?Owner wealth? Excluded Included Excluded Included Excluded Included Included
Firm size and owner wealthLog(book value of assets) -0.033 -0.027 -0.049 -0.043 -0.040 -0.032 -0.030
(0.013)** (0.014)* (0.015)*** (0.016)*** (0.011)*** (0.013)** (0.013)**Log(total owner wealth) -0.019 -0.015 -0.027 -0.029
(0.015) (0.016) (0.015)* (0.016)*Owner equity / total wealth 0.005
(0.004)
Other controls
Dummies for loan type1-digit SIC dummies
pseudo R2 0.23 0.24 0.29 0.29 0.21 0.21 0.22No. observations 698 698 698 698 698 698 698***, ** and * represents significance at 1%, 5% and 10% levels respectively.
Log(firm age + 1)Book debt / book assets
No
As Column 1 of Table 3
As Column 3 of Table 3
Yes No (parsimonious model)
Table 5: Owner wealth (1998 SBF Survey only)Dependent variable = 1 if firm's most recent loan is fixed rate loan, = 0 if adjustable rate loan. Weighted probit; coefficients normalized todisplay marginal effects. Standard errors in parentheses are adjusted for heteroskedasticity. Other covariates are the same as the relevant columns ofTable 3 as listed below (coefficients very similar to Table 3 results and thus omitted to conserve space).
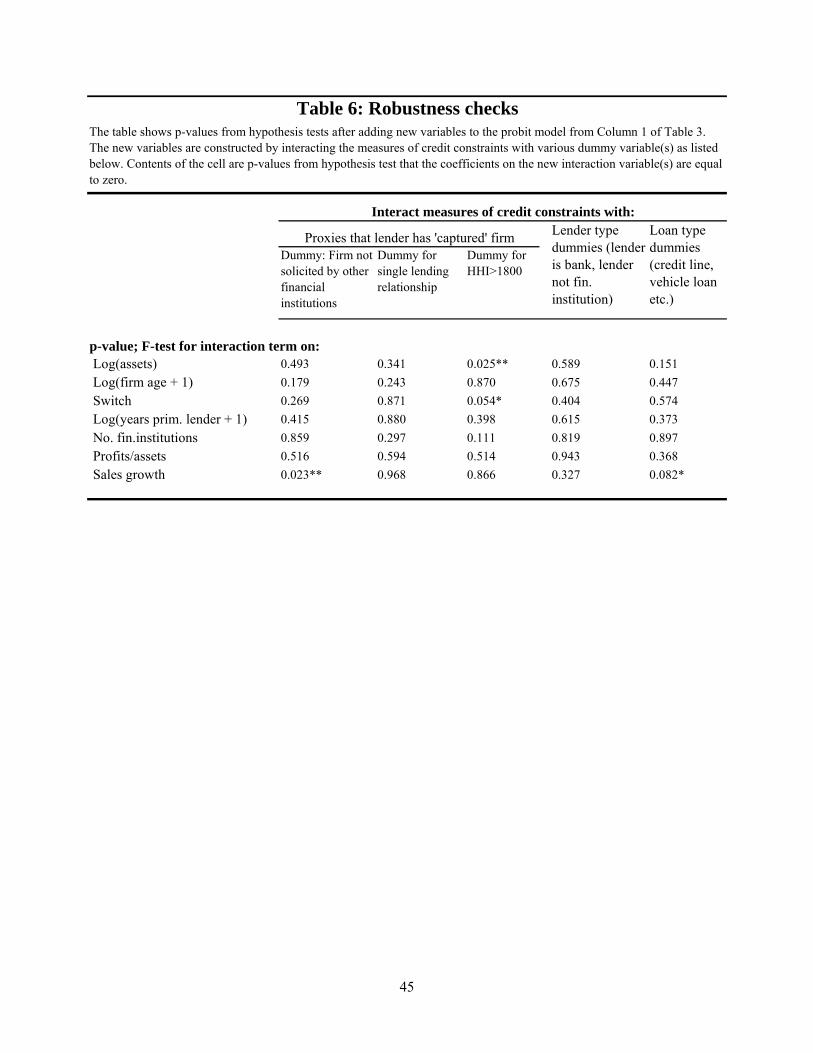
45
Dummy: Firm not solicited by other financial institutions
Dummy for single lending relationship
Dummy for HHI>1800
Log(assets) 0.493 0.341 0.025** 0.589 0.151 Log(firm age + 1) 0.179 0.243 0.870 0.675 0.447 Switch 0.269 0.871 0.054* 0.404 0.574 Log(years prim. lender + 1) 0.415 0.880 0.398 0.615 0.373 No. fin.institutions 0.859 0.297 0.111 0.819 0.897 Profits/assets 0.516 0.594 0.514 0.943 0.368 Sales growth 0.023** 0.968 0.866 0.327 0.082*
Table 6: Robustness checks
Proxies that lender has 'captured' firm Loan type dummies (credit line, vehicle loan etc.)
p-value; F-test for interaction term on:
Lender type dummies (lender is bank, lender not fin. institution)
Interact measures of credit constraints with:
The table shows p-values from hypothesis tests after adding new variables to the probit model from Column 1 of Table 3. The new variables are constructed by interacting the measures of credit constraints with various dummy variable(s) as listed below. Contents of the cell are p-values from hypothesis test that the coefficients on the new interaction variable(s) are equal to zero.
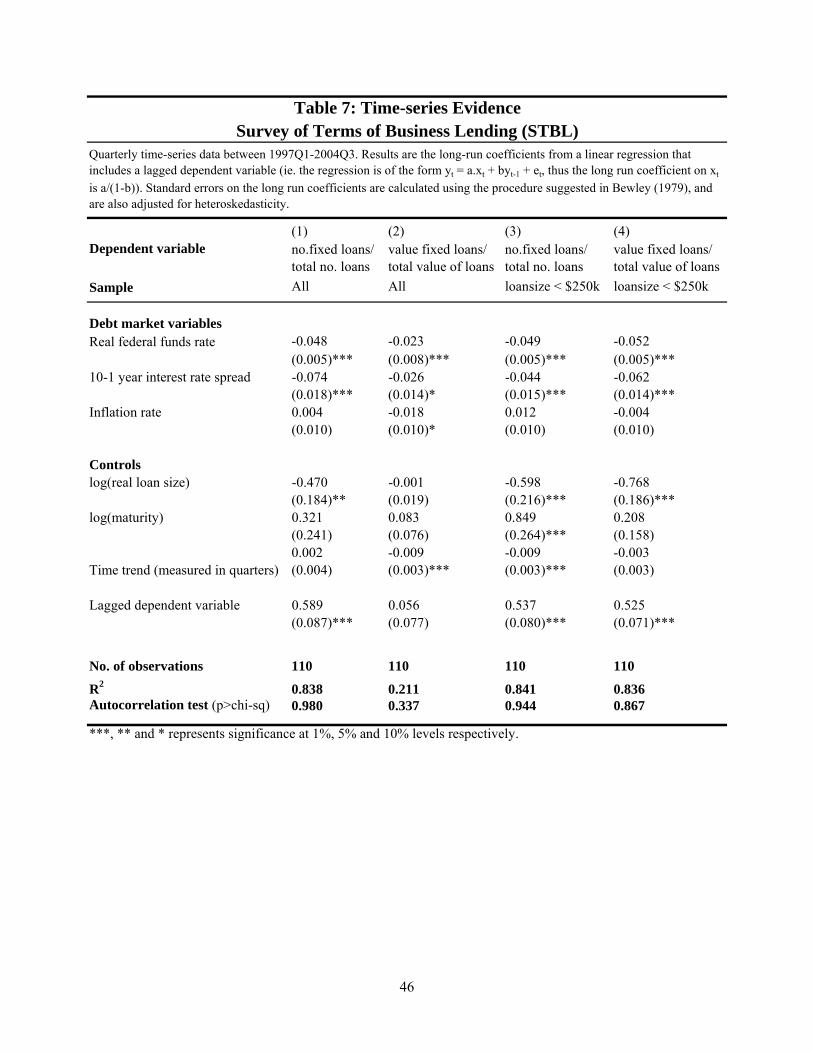
46
(1) (2) (3) (4)Dependent variable
Sample All All loansize < $250k loansize < $250k
Debt market variablesReal federal funds rate -0.048 -0.023 -0.049 -0.052
(0.005)*** (0.008)*** (0.005)*** (0.005)***10-1 year interest rate spread -0.074 -0.026 -0.044 -0.062
(0.018)*** (0.014)* (0.015)*** (0.014)***Inflation rate 0.004 -0.018 0.012 -0.004
(0.010) (0.010)* (0.010) (0.010)
Controlslog(real loan size) -0.470 -0.001 -0.598 -0.768
(0.184)** (0.019) (0.216)*** (0.186)***log(maturity) 0.321 0.083 0.849 0.208
(0.241) (0.076) (0.264)*** (0.158)0.002 -0.009 -0.009 -0.003(0.004) (0.003)*** (0.003)*** (0.003)
Lagged dependent variable 0.589 0.056 0.537 0.525(0.087)*** (0.077) (0.080)*** (0.071)***
No. of observations 110 110 110 110
R2 0.838 0.211 0.841 0.836Autocorrelation test (p>chi-sq) 0.980 0.337 0.944 0.867
***, ** and * represents significance at 1%, 5% and 10% levels respectively.
Table 7: Time-series Evidence
Time trend (measured in quarters)
no.fixed loans/ total no. loans
value fixed loans/ total value of loans
Survey of Terms of Business Lending (STBL)Quarterly time-series data between 1997Q1-2004Q3. Results are the long-run coefficients from a linear regression that includes a lagged dependent variable (ie. the regression is of the form yt = a.xt + byt-1 + et, thus the long run coefficient on xt
is a/(1-b)). Standard errors on the long run coefficients are calculated using the procedure suggested in Bewley (1979), and are also adjusted for heteroskedasticity.
no.fixed loans/ total no. loans
value fixed loans/ total value of loans

47
(1) (2) (3) (4)
Sample All loans No commitments All loans No commitmentsInclude endogenous loan/ lender characteristics? No No Yes Yes
Real federal funds rate -0.023 -0.016 -0.022 -0.014(0.012)** (0.012) (0.012)* (0.014)
10-1 year yield spread -0.049 -0.061 -0.046 -0.059(0.018)*** (0.019)*** (0.019)** (0.019)***
Inflation rate -0.011 0.017 -0.007 0.020(0.016) (0.016) (0.017) (0.017)
Other variables As Column 1 of Table 3
As Column 2 of Table 3
As Column 3 of Table 3
As Column 4 of Table 3
pseudo R2 0.24 0.18 0.27 0.22No. observations 3248 1867 3248 1867
Table 8: Time-series EvidenceSurvey of Small Business Finance (SBF)
Dependent variable = 1 if firm's most recent loan has fixed interest rate, = 0 if adjustable rate loan. Weighted probit; coefficients normalized to display marginal effects. Standard errors in parentheses are adjusted for heteroskedasticity. The four columns of the table are based on the four specifications of Table 3, after replacing year dummies with the three debt market variables listed.

48
(1) (2)Dependent variable
Bank fixed effects yes nolog(1 + loansize) -0.034 -0.055
(0.007)*** (0.012)***Loan collateralized (1-yes, 0-no) 0.060 0.102
(0.023)** (0.041)**Maturity 0.047 0.049
(0.021)** (0.039)Risk rating - relative to rating = 3 (average risk): =1 (lowest risk) 0.100 0.093
(0.043)** (0.065) =2 (low risk) 0.007 -0.012
(0.020) (0.062) =4 (high risk) -0.011 -0.090
(0.020) (0.069) =5 (highest risk) -0.049 -0.110
(0.026)* (0.069) Borrower not classified 0.058 0.144
(0.044) (0.052)*** Branch doesn't use risk ratings 0.078 -0.010
(0.042)* (0.091)Bank controls log(1+bank assets) -0.037
(0.014)*** Liquid assets / total bank assets 0.343
(0.328)
No. of observations 40658 40657R2 : Within 0.031R2 : Between 0.125R2 : Overall 0.096 0.156'Within' error std. dev. 0.33'Between' error std. dev 0.37
***, ** and * represents significance at 1%, 5% and 10% levels respectively.
Dummy =1 if loan does not reprice
Table 9: Panel Data Results, STBLDependent variable = 1 if firm's most recent loan is fixed rate loan, = 0 if adjustable rate loan.Linear probability model, results estimated by least squares. Standard errors in parentheses. Bank fixedeffects are included in column 1. Standard errors for both columns of results are clustered at the banklevel, and adjusted for heteroskedasticity. Regressions also include 28 dummy variables for each calendarquarter during the period 1997-2003.
Dummy =1 if loan does not reprice