FEDERAL RESERVE BANK OF CHICAGO - AgEcon...
4
June 15, 1979 Number 1501 1 FEDERAL RESERVE BANK OF CHICAGO ISSN 0002 - 1512 FARM TRACTOR AND EQUIPMENT PURCHASES continued at a strong pace in the first quarter. According to the Farm and Industrial Equipment Institute (FIE1), retail sales of farm tractors increased to 34.5 thousand units in the January-March period, 12 percent above the year-earlier level. This rise follows substantial year-to- year gains in tractor sales in each of the three preceding quarters. First-quarter increases were also reported for most other major farm equipment items, with the excep- tion of forage harvesters. The strength in machinery and equipment sales in recent months reflects the high level of farm earnings over the past few quarters. Most trade sources expect unit sales of farm equipment in coming months will remain strong, but gains probably will not • match the pace reported in the first quarter. District states trailed the nationwide uptrend in farm machinery and equipment sales in the first quarter Unit retail sales (January-March) District states United States Number Percent change2 Number Percent cl - ge2 Tractors' 7,802 7.4 34,547 12.0 Combines 1,152 7.7 3,248 17.2 Cornheads 927 -10.3 1,809 2.3 Balers 519 63.7 2,368 48.4 Forage harvesters 339 - 8.1 834 - 5.0 Mower conditioners 847 20.3 3,073 27.5 Manure spreaders 2,769 2.4 6,343 2.7 'Units with 40 or more horsepower. 'From previous year. SOURCE: Farm and Industrial Equipment Institute. The increases in unit sales of most items of machinery and equipment in Seventh District states trailed those for the entire United States in the January- March period. Farmers in district states purchased 7,800 • tractors in the first quarter, up 7 percent from a year before. The number of tractors bought in Iowa and Wisconsin increased 22 and 16 percent, which offset the declines in unit sales that occurred in Indiana and Michigan. Illinois farmers bought only 2 percent more tractors. Unit sales of combines were up 8 percent for the five-state area, due entirely to increases of 39 and 13 per- cent in Iowa and Indiana. Farmers in Wisconsin, Illinois, and Michigan purchased 24, 14, and 13 percent fewer combines, respectively. The surge in unit sales of hay balers reported in district states was due largely to a 76 percent increase in purchases by Wisconsin farmers. Wisconsin is traditionally the nation's largest state market for balers, accounting for nearly as many baler sales as the other four district states combined. Large tractors paced first-quarter sales Two-wheel drive (by horsepower rating) Units sold Jan.-Mar. 1979 Ending March inventories Inventory- to-sales' ratio Number Change' Number Change, (thou.) (percent) (thou.) (percent) (percent) 40-59 6.4 - 2.6 16.4 - 9.5 55 60-79 5.2 12.4 11.5 -25,6 54 80-99 3.5 10.3 5.8 -26.7 38 100-119 4.0 14.5 7.1 - 7.7 43 120-139 7.5 15.8 11.0 -11.3 39 140-159 3.2 7.7 5.1 -24.1 38 160 plus 2.6 45.6 4.6 -14.4 48 Total 32.5 11.3 61.6 -16.5 46 Four-wheel drive 2.0 23.8 4.9 -15.7 54 All farm tractors 34.5 12.0 66.5 -16.5 46 'Sales during the April 1978 through March 1979 period. 'From previous year. SOURCE: Farm and Industrial Equipment Institute. The trend in recent years of purchasing machinery and equipment with larger capacities continued un- abated in the January-March period. Purchases of farm tractors were strongest proportionately for those in the highest horsepower categories. FIEI figures show that unit retail sales of four-wheel drive tractors numbered nearly a fourth above the sluggish performance of a year before. Sales of two-wheel drive tractors with 100 horsepower or more were up roughly 17 percent. In con- trast, purchases of smaller two-wheel drive tractors- those from 40 to 99 horsepower-were up only 5 percent. Inventories at the end of March ranged from 15 to 33 percent below year-earlier levels for most major items of
-
Upload
vuongnguyet -
Category
Documents
-
view
215 -
download
0
Transcript of FEDERAL RESERVE BANK OF CHICAGO - AgEcon...
June 15, 1979
Number 1501 1
FEDERAL RESERVE BANK OF CHICAGO
ISSN 0002 - 1512
FARM TRACTOR AND EQUIPMENT PURCHASES continued at a strong pace in the first quarter. According to the Farm and Industrial Equipment Institute (FIE1), retail sales of farm tractors increased to 34.5 thousand units in the January-March period, 12 percent above the year-earlier level. This rise follows substantial year-to-year gains in tractor sales in each of the three preceding quarters. First-quarter increases were also reported for most other major farm equipment items, with the excep-tion of forage harvesters. The strength in machinery and equipment sales in recent months reflects the high level of farm earnings over the past few quarters. Most trade sources expect unit sales of farm equipment in coming months will remain strong, but gains probably will not • match the pace reported in the first quarter.
District states trailed the nationwide uptrend in farm machinery and equipment
sales in the first quarter
Unit retail sales (January-March)
District states United States
Number Percent change2 Number
Percent cl- ge2
Tractors' 7,802 7.4 34,547 12.0 Combines 1,152 7.7 3,248 17.2 Cornheads 927 -10.3 1,809 2.3
Balers 519 63.7 2,368 48.4 Forage harvesters 339 - 8.1 834 - 5.0 Mower conditioners 847 20.3 3,073 27.5 Manure spreaders 2,769 2.4 6,343 2.7
'Units with 40 or more horsepower.
'From previous year.
SOURCE: Farm and Industrial Equipment Institute.
The increases in unit sales of most items of machinery and equipment in Seventh District states trailed those for the entire United States in the January-March period. Farmers in district states purchased 7,800 • tractors in the first quarter, up 7 percent from a year before. The number of tractors bought in Iowa and Wisconsin increased 22 and 16 percent, which offset the declines in unit sales that occurred in Indiana and Michigan. Illinois farmers bought only 2 percent more
tractors. Unit sales of combines were up 8 percent for the five-state area, due entirely to increases of 39 and 13 per-cent in Iowa and Indiana. Farmers in Wisconsin, Illinois, and Michigan purchased 24, 14, and 13 percent fewer combines, respectively. The surge in unit sales of hay balers reported in district states was due largely to a 76 percent increase in purchases by Wisconsin farmers. Wisconsin is traditionally the nation's largest state market for balers, accounting for nearly as many baler sales as the other four district states combined.
Large tractors paced first-quarter sales
Two-wheel drive (by horsepower rating)
Units sold Jan.-Mar. 1979
Ending March inventories
Inventory- to-sales'
ratio Number Change' Number Change,
(thou.) (percent) (thou.) (percent) (percent)
40-59 6.4 - 2.6 16.4 - 9.5 55 60-79 5.2 12.4 11.5 -25,6 54 80-99 3.5 10.3 5.8 -26.7 38 100-119 4.0 14.5 7.1 - 7.7 43 120-139 7.5 15.8 11.0 -11.3 39 140-159 3.2 7.7 5.1 -24.1 38 160 plus 2.6 45.6 4.6 -14.4 48
Total 32.5 11.3 61.6 -16.5 46 Four-wheel drive 2.0 23.8 4.9 -15.7 54
All farm tractors 34.5 12.0 66.5 -16.5 46
'Sales during the April 1978 through March 1979 period.
'From previous year.
SOURCE: Farm and Industrial Equipment Institute.
The trend in recent years of purchasing machinery and equipment with larger capacities continued un-abated in the January-March period. Purchases of farm tractors were strongest proportionately for those in the highest horsepower categories. FIEI figures show that unit retail sales of four-wheel drive tractors numbered nearly a fourth above the sluggish performance of a year before. Sales of two-wheel drive tractors with 100 horsepower or more were up roughly 17 percent. In con-trast, purchases of smaller two-wheel drive tractors-those from 40 to 99 horsepower-were up only 5
percent.
Inventories at the end of March ranged from 15 to 33 percent below year-earlier levels for most major items of
1973 1974 1975 1976 1978 1979 977
2
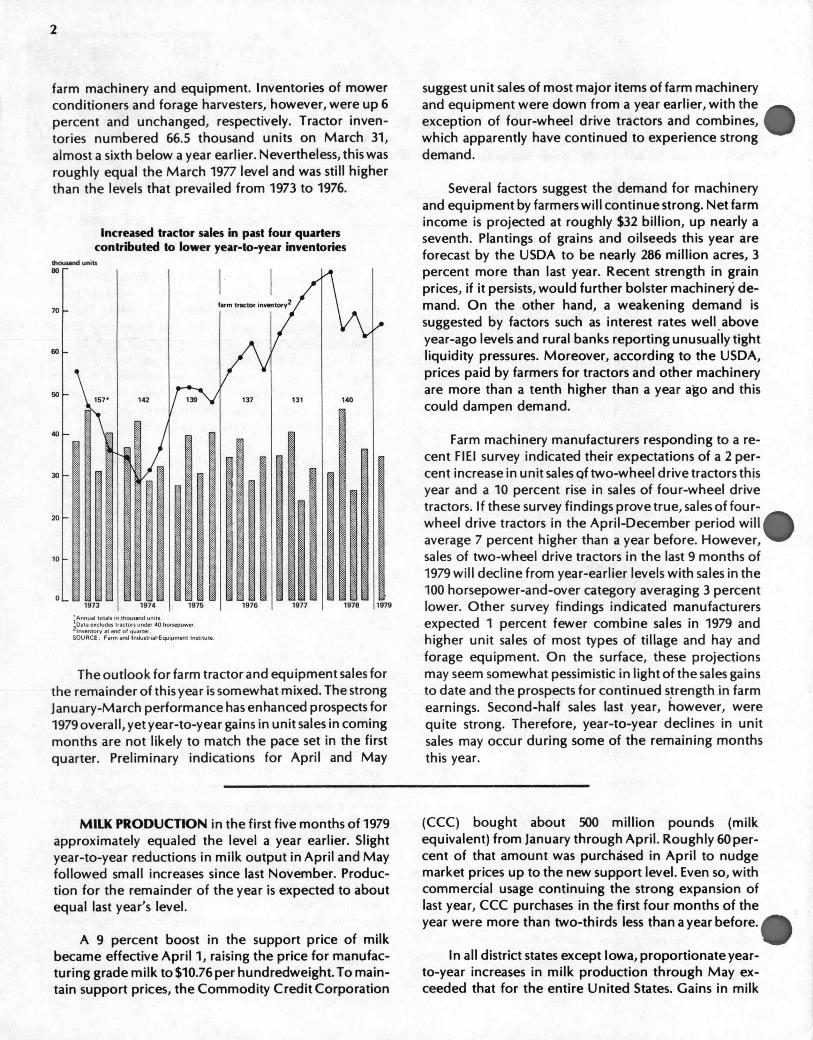
farm machinery and equipment. Inventories of mower conditioners and forage harvesters, however, were up 6 percent and unchanged, respectively. Tractor inven-tories numbered 66.5 thousand units on March 31, almost a sixth below a year earlier. Nevertheless, this was roughly equal the March 1977 level and was still higher than the levels that prevailed from 1973 to 1976.
Increased tractor sales in past four quarters contributed to lower year-to-year inventories
thousand units 80 —
70
so
so
40
30
20
10
0
'Annual totals in thousand uni s. 1Data excludes t actors under 40 horsepower. , 'Inventory at end of quarter. SOURCE: Faun and Industrial.Equipment Institute.
The outlook for farm tractor and equipment sales for the remainder of this year is somewhat mixed. The strong January-March performance has enhanced prospects for 1979 overall, yet year-to-year gains in unit sales in coming months are not likely to match the pace set in the first quarter. Preliminary indications for April and May
suggest unit sales of most major items of farm machinery and equipment were down from a year earlier, with the exception of four-wheel drive tractors and combines, which apparently have continued to experience strong demand.
Several factors suggest the demand for machinery and equipment by farmers will continue strong. Net farm income is projected at roughly $32 billion, up nearly a seventh. Plantings of grains and oilseeds this year are forecast by the USDA to be nearly 286 million acres, 3 percent more than last year. Recent strength in grain prices, if it persists, would further bolster machinery de-mand. On the other hand, a weakening demand is suggested by factors such as interest rates well above year-ago levels and rural banks reporting unusually tight liquidity pressures. Moreover, according to the USDA, prices paid by farmers for tractors and other machinery are more than a tenth higher than a year ago and this could dampen demand.
Farm machinery manufacturers responding to a re-cent Fl El survey indicated their expectations of a 2 per-cent increase in unit sales of two-wheel drive tractors this year and a 10 percent rise in sales of four-wheel drive tractors. If these survey findings prove true, sales of four-wheel drive tractors in the April-December period will average 7 percent higher than a year before. However, sales of two-wheel drive tractors in the last 9 months of 1979 will decline from year-earlier levels with sales in the 100 horsepower-and-over category averaging 3 percent lower. Other survey findings indicated manufacturers expected 1 percent fewer combine sales in 1979 and higher unit sales of most types of tillage and hay and forage equipment. On the surface, these projections may seem somewhat pessimistic in light of the sales gains to date and the prospects for continued strength in farm earnings. Second-half sales last year, however, were quite strong. Therefore, year-to-year declines in unit sales may occur during some of the remaining months this year.
MILK PRODUCTION in the first five months of 1979 approximately equaled the level a year earlier. Slight year-to-year reductions in milk output in April and May followed small increases since last November. Produc-tion for the remainder of the year is expected to about equal last year's level.
A 9 percent boost in the support price of milk became effective April 1, raising the price for manufac-turing grade milk to $10.76 per hundredweight. To main-tain support prices, the Commodity Credit Corporation
(CCC) bought about 500 million pounds (milk equivalent) from January through April. Roughly 60 per-cent of that amount was purchased in April to nudge market prices up to the new support level. Even so, with commercial usage continuing the strong expansion of last year, CCC purchases in the first four months of the year were more than two-thirds less than a year before.
In all district states except Iowa, proportionate year-to-year increases in milk production through May ex-ceeded that for the entire United States. Gains in milk

butter 50
1- 111111 11 ill Ili 1111 1960 '62 '64 '66 '68 '70 '72 74 '76 '78**
cheese
index, 1960 = 100
225
200
175
150
125
10
75
------ ---------
fluid products*
ice cream -----
dollars per cwt.
1 prices received by farmers
11 all milk
manufacturing grade
support price
--------- -- .1.. 1975 1976 1977
I ----- .1.11.11 1978 1979
3
C
C
output in the period ranged from 0.9 percent in Michigan to 2.3 percent in Illinois. District states ac-counted for 29 percent of the nation's production.
Milk production in 1979 expected to rise slightly
May
Change
January-May
Change 1978 1979 1978 1979
(mil. pounds) (percent) (mil. pounds) (percent)
Illinois 212 217 2.4 993 1,016 2.3
Indiana 196 199 1.5 909 920 1.2
Iowa 368 357 -3.0 1,684 1,655 -1.7
Michigan 417 414 -0.7 1,975 1,992 0.9
Wisconsin 2,020 2,031 0.5 9,154 9,294 1.5
District states 3,213 3,218 0.2 14,715 14,877 1.1
United States 11,178 11,175 -0.1 51,613 51,753 0.3
Commercial disappearance of milk last year exceed-ed 119 billion pounds (milk equivalent), up 3 percent from the year before. Similarly, disappearance in the first quarter of 1979 was nearly 3 percent higher than a year earlier. Per capita civilian consumption of milk and dairy products this year is expected to about equal the 558 pounds (milk equivalent) of last year. Each American consumed an average of 20.5 pounds of milkfat last year—the most since 1972. The rise was due largely to the expanded consumption of butter and cheese, up 2 and 5
percent, respectively.
Per capita consumption of cheese continued upward trend in 1978
'Milk equivalent (fat solids basis) of whole milk, cream items,
and skim milk.
• 'Preliminary.
The outlook for dairy farmers continues to appear favorable. Prices received by farmers for all milk sold to plants in the first five months of 1979 averaged 15 percent higher than a year before. And because the rise in feed prices has been proportionately less, the milk-feed price ratios continue favorable. May marked the 23rd con-secutive month that the ratio exceeded its year-earlier
level.
Milk support prices were raised again in April
Cash receipts from dairying increased 8 percent last year and in the first four months this year averaged a sixth higher than a year before. For all of 1979, cash receipts to dairying are forecast at about $14.5 billion, 14 percent
higher than in 1977.
The Food and Agriculture Act of 1977 requires that semiannual adjustments in the support price of milk be made through March 31, 1981, to reflect estimated changes in the parity index. A separate provision of the act that expired with the April 1 increase in the support price required that these adjustments reflect at least 80 percent of parity. In the absence of new legislation, ex-isting statutes permit the support price to be set between 75 and 90 percent of parity, beginning with the new dairy marketing year that begins October 1. A bill was ap-proved by the House Agriculture Committee last week extending the minimum of 80 percent of parity through September 30, 1981. Most observers feel the bill has enough support for enactment with perhaps only minor
changes.
Don A. Langford Agricultural Economist

FIRST-CLASS MAIL U.S. POSTAGE
PAID Chicago, II.
Permit No. 1942
AG R C irn
Selected agricultural economic developments
4
Latest period Value
May 246 May 220 May 269
May 247 May 247
May 212 May 227 May 221 May 210 May 227
April 212 April 232
May 2.34 May 6.95 May 3.22 May 3.60 May 1.29 May 75.40 May 43.60 May 11.50 May 29.0 May 56.7
1st Quarter 125 1st Quarter 34
April 1,814
Percent change from
Prior period Year ago
+ 0.8 +14 + 3.8 + 4 - 1.1 +24
+ 0.4 +13 + 0.4 +14
+ 0.6 +10 - 0.4 +10 - 0.1 +10 + 0.1 + 3 + 0.8 + 8
+ 1.1 +10 + 0.8 +2
+ 3.1 +2 - 1.6 + 3 + 7.0 +14 + 0.6 - 2
0 + 4 - 1.3 +40 - 1.6 - 9 - 0.9 +14 + 2.8 + 4 - 5.8 +15
+ 6.5 +20 + 5.7 +30 + 0.3 +11
Subject
Unit
Index of prices received by farmers Crops Livestock
Index of prices paid by farmers Production items
Producer price index* (finished goods) Foods Processed foods and feeds Agricultural chemicals Agricultural machinery and equipment
Consumer price index•• (all items) Food at home
Cash prices received by farmers Corn Soybeans Wheat Sorghum Oats Steers and heifers Hogs Milk, all sold to plants Broilers Eggs
Income (seasonally adjusted annual rate) Cash receipts from farm marketings Net realized farm income Nonagricultural personal income
1967=100 1967=100 1967=100
1967=100 1967=100
1967=100 1967=100 1967=100 1967=100 1967=100
1967=100 1967=100
dol. per bu. dol. per bu. dol. per bu. dol. per cwt. dol. per bu. dol. per cwt. dol. per cwt. dol. per cwt. cents per lb.
cents per doz.
bil. dol. bil. dol. bil. dol.
•Formerly called wholesale price index.
••For all urban consumers.
FEDERAL RESERVE BANK OF CHICAGO
Public Information Center P. 0. Box 834 Chicago, Illinois 60690
Tel. no. (312) 322-5112
MR.O.B.JESNT3SSAGL-IL IN OF AGR:CjIi:J UNIVERSITY OF MINN. ST.PAUL,MN 55103