Federal Home Loan Bank of Boston 2016 Annual Stress Test ... · Federal Home Loan Bank of Boston...
13
Federal Home Loan Bank of Boston 2016 Annual Stress Test Disclosure Results of the Federal Housing Finance Agency Supervisory Severely Adverse Scenario November 17, 2016 As Required by the Dodd-Frank Wall Street Reform and Consumer Protection Act
Transcript of Federal Home Loan Bank of Boston 2016 Annual Stress Test ... · Federal Home Loan Bank of Boston...
Federal Home Loan Bank of Boston 2016 Annual Stress Test Disclosure
Results of the Federal Housing Finance Agency Supervisory Severely Adverse Scenario
November 17, 2016
As Required by the Dodd-Frank Wall Street Reform and Consumer Protection Act
1
Safe Harbor Statement Under the Private Securities Litigation Reform Act of 1995
This disclosure of the results of the Federal Home Loan Bank of Boston’s 2016 Annual Stress Testing uses forward-looking statements within the meaning of the "safe harbor" provisions of the Private Securities Litigation Reform Act of 1995 and are based on the Bank's expectations as of the date hereof. For example, the scenario, its results, and inputs into the scenario, including statements about possible future Bank actions, including declarations of dividends and future excess stock repurchases, and projections for advances balances and investments, among others, are forward-looking statements. The results, as disclosed here or elsewhere, should not be viewed as forecasts of expected or likely outcomes of future results or Bank actions. Accordingly, the Bank cautions that actual results could differ materially from those expressed or implied in these forward-looking statements or could impact the extent to which a particular projection, estimate or prediction is realized. You should not place undue reliance on such statements. The Bank does not undertake to update any forward-looking statement herein or that may be made from time to time on behalf of the Bank.

2
Executive Summary
The Dodd-Frank Wall Street Reform and Consumer Protection Act (Dodd-Frank Act) requires certain financial companies with total consolidated assets of more than $10 billion, and which are regulated by a primary Federal financial regulatory agency, to conduct annual stress tests to determine whether the companies have the capital necessary to absorb losses as a result of adverse economic conditions.
In September 2013, the Federal Housing Finance Agency (FHFA), regulator of the Federal Home Loan Banks (FHLBanks), implemented annual stress testing rules for the FHLBanks as required by the Dodd-Frank Act. These rules were amended in November 2015.
In accordance with these rules, and the FHFA Order received in March 2016, the Federal Home Loan Bank of Boston (the Bank) filed the results of its stress test with the FHFA by August 31, 2016, and is publicly disclosing the summary results of the severely adverse scenario in this document.
The FHFA provided inputs and key assumptions for the severely adverse scenario. New in 2016, the assumptions included a negative interest rate environment and an expanded list of counterparties to consider for counterparty defaults.
The stress tests are based on portfolios as of December 31, 2015. The time horizon for the stress test is nine-quarters starting with the first quarter of 2016, and extending through the first quarter of 2018.
The stress test results under the FHFA severely adverse scenario, as disclosed in this document or otherwise, are not forecasts of expected or likely outcomes of future results. Rather, these modeled simulations are based solely on the FHFA’s severely adverse scenario and other specific required assumptions.
Stress Test Background
Stress Test Requirements

3
Executive Summary (cont.)
Our historical financial information, prepared under accounting principles generally accepted in the United States of America (GAAP), is available in reports filed with the Securities and Exchange Commission, including our Annual Report on Form 10-K for the year ended December 31, 2015.
Our stress test results demonstrate capital adequacy under the FHFA’s severely adverse economic conditions as of March 31, 2018, and we remain in compliance with all regulatory capital requirements under the severely adverse scenario throughout all nine quarters covered by the stress test.
Our regulatory capital ratio (which is permanent capital divided by total assets) at March 31, 2018, is 5.99 percent, exceeding the minimum regulatory requirement of 4.00 percent.
Our regulatory leverage capital ratio (which is permanent capital multiplied by 1.5 divided by total assets) at March 31, 2018, is 8.98 percent, exceeding the minimum regulatory requirement of 5.00 percent.
Total GAAP capital at March 31, 2018, is $1.8 billion.
The severely adverse scenario results assume we declare dividends and repurchase excess capital stock during the nine-quarter period, consistent with our current business plan. However, any distribution of dividends or repurchases of excess capital stock remain subject to the approval of our board of directors.
Stress testing has evolved as an important analytical tool for evaluating capital adequacy under severely adverse economic conditions. We regularly use such stress tests, including those annual stress tests required by the Dodd-Frank Act, in our capital planning to measure our exposure to material risks and evaluate the adequacy of capital resources available to absorb potential losses arising from those risks.
We take the stress test results into account when making changes to our capital structure; when assessing our exposures, concentrations, and risk positions; and when evaluating our overall risk profile.
The overall stress test process and these results have been reviewed with our board of directors.
Stress Test Results
Stress Test Use/Governance

4
Severely Adverse Scenario Key Assumptions Provided by FHFA
Macroeconomic Variables
Residential House Prices (Peak-to-trough decline with no recovery during the 9-quarter time horizon) 1 -24%
Commercial Real Estate Prices (Peak-to-trough decline with no recovery during the 9-quarter time horizon) -30%
Real Gross Domestic Product (Annual GDP growth rate) -5.7% (2016), +0.6% (2017)
Unemployment Rate (Peak) 10.0% (Q3-2017)
Interest-Rate Variables
30-year Mortgage Rate (Lowest / Average during the 9-quarter time horizon) 3.2% / 3.9%
10-year Treasury Rate (Lowest / Average during the 9-quarter time horizon) 0.2% / 0.7%
3-month Treasury Rate (Lowest / Average during the 9-quarter time horizon) -0.5% / -0.4%
Global Market Shock
Instantaneous price shocks on non-agency securities -40.5% to -91.5%
Instantaneous OAS shocks on:
Agency debentures and pass-throughs MBS OAS +170 bps
Agency security CMOs CMO OAS +200 bps
Agency security CMBS and DUS bonds CMBS OAS +200 bps
1 For modeling other-than-temporary impairment losses, residential house prices decrease for three years, start recovering in year four, and reach a long-term average growth rate of 4.3 percent per year starting in year five.

5
Stress Test Components
Net Interest Income
+ Other Non-interest Income,
net
Net interest income (expense), operating expenses, and other non-interest income (expense).
Provision for Credit Losses on Mortgage
Loans
Provision for credit losses related to mortgage loans held for portfolio.
OTTI Credit Losses
Other-than-temporary impairment (OTTI) credit losses for investment securities.
Mark-to-Market
Gains (Losses)
Mark-to-market gains (losses) related to changes in fair value of derivatives and trading securities.
Global Market Shocks
Instantaneous global shocks of interest rates, volatility, and agency mortgage-backed securities (MBS) option-adjusted spreads (OAS), and non-agency MBS prices applied to trading securities, available-for-sale securities, and held-to-maturity securities that are deemed to have OTTI losses in the stress test scenario. Global shocks applied to available-for-sale and held-to-maturity securities are included in other comprehensive income (loss).
Counterparty Default Losses
Instantaneous and unexpected default of largest counterparty across secured and unsecured lending, repurchase/reverse repurchase agreements, derivative exposures, single-family mortgage insurance providers and multifamily credit enhancements, but excludes advances and overnight positions.

6
Severely Adverse Scenario Results
Cumulative Projected Financial Metrics
Over the nine-quarter period from Q1 2016 to Q1 2018
($ amounts in millions)
1 Net interest income plus other non-interest income, net $163.5
2 Provision for credit losses on mortgage loans (4.5)
3 OTTI credit losses on held-to-maturity securities (70.5)
4 Mark-to-market gains (losses) 4.6
5 Global market shock impact on trading securities (12.3)
6 Counterparty default losses (270.0)
7 AHP Assessments (6.4)
8 Net income (loss) $(195.6)
9 Other comprehensive income (loss) (745.3)
10 Total comprehensive income (loss) $(940.9)
11 Total GAAP Capital – starting (12/31/2015) $3,022.9
12 Total GAAP Capital – ending (3/31/2018) $1,767.4
13 Regulatory capital ratio – starting (12/31/2015) 6.04%
14 Regulatory capital ratio – ending (3/31/2018) 5.99%
Note: these simulations represent hypothetical internal estimates based on applying rules and conditions set forth in the FHFA’s severely adverse scenario. These estimates are not forecasts of the Bank’s expected results and any distribution of dividends or repurchase of capital stock remain subject to approval by the Bank’s board of directors.

7
Severely Adverse Results – Regulatory Capital Analysis
Regulatory capital, which is defined as the sum of capital stock, retained earnings, and mandatorily redeemable capital stock,
decreases from $3.5 billion at December 31, 2015, to $3.0 billion at March 31, 2018.
All results shown below are modeled simulations, except for actual regulatory capital at December 31, 2015.
$3,507.5
3,508 3,666 3,596 3,601 3,588 3,318 3,312
$2,997.3
$163.5
$(4.5) $(70.5)
$4.6
$(12.3)
$(270.0) $(6.4)
$(314.6)
-
500
1,000
1,500
2,000
2,500
3,000
3,500
4,000
ActualRegulatoryCapital at
12/31/2015
Net interestincome + other
non-interestincome
Provision forcredit losses onmortgage loans
OTTI CreditLosses
Mark-to-Market Gains
(Losses)
Global MarketShock impact
on tradingsecurities
Counterpartydefault Losses
AHPAssessments
Dividends andExcess Capital
StockRepurchases
ProjectedRegulatoryCapital at3/31/2018
($ in millions)
Note: these simulations represent hypothetical internal estimates based on applying rules and conditions set forth in the FHFA’s severely adverse scenario. These estimates are not forecasts of the Bank’s expected results and any distribution of dividends or repurchase of capital stock remain subject to approval by the Bank’s board of directors.

8
Severely Adverse Results – Total GAAP Capital Analysis
Total GAAP capital, which is defined as the sum of capital stock, retained earnings, and accumulated other comprehensive income (loss), decreases from $3.0 billion at December 31, 2015, to $1.8 billion at March 31, 2018.
All results shown below are modeled simulations, except for actual Total Actual GAAP Capital at December 31, 2015.
$3,022.9
3,023 3,182 3,111 3,116 3,104
2,834 2,827
1,767
$1,767.4
$163.5
$(4.5) $(70.5)
$4.6
$(12.3)
$(270.0) $(6.4)
$(745.3)
$(314.6)
-
500
1,000
1,500
2,000
2,500
3,000
3,500
Actual GAAPCapital at
12/31/2015
Net interestincome + other
non-interestincome
Provision forcredit losses onmortgage loans
OTTI CreditLosses
Mark-to-MarketGains (Losses)
Global MarketShock impact on
tradingsecurities
Counterpartydefault Losses
AHPAssessments
Othercomprehensiveincome (loss)
Dividends andExcess Capital
StockRepurchases
Projected GAAPCapital at3/31/2018
($ in millions)
Note: these simulations represent hypothetical internal estimates based on applying rules and conditions set forth in the FHFA’s severely adverse scenario. These estimates are not forecasts of the Bank’s expected results and any distribution of dividends or repurchase of capital stock remain subject to approval by the Bank’s board of directors.

9
Component Methodologies
Net Interest Income plus Other Non-interest Income and Expense
Description
Reflects projections of net interest income (expense), operating expenses, and other non-interest income (expense) over the nine-quarter time horizon.
Material risks covered include interest-rate risk, operational risk, and business risk.
Methodologies
Estimates net interest income by projecting portfolio balances, funding mix, and spreads using the macroeconomic variables provided by the FHFA and management assumptions.
Non-interest income and expense estimated by management.
Estimates operational risk losses informed by the Bank’s historical operational loss experience and relevant external data consistent with supervisory expectations.
Balance sheet volumes and outstanding balances were generally based on the assumptions used in our 2016 Strategic Business Plan, with the exception of the following:
The growth rate of advances balances is tied to the growth rate in real Gross Domestic Product. New volume and rollover was generally short term. Projected outstanding balances decreased over the horizon; and
MBS and mortgage loan assets were allowed to run off with no new asset purchases.
(Provision) Benefit for Credit Losses on Mortgage Loans
Description Reflects credit loss provision related to estimated losses on mortgage loans held for portfolio.
Captures mortgage credit risk.
Methodologies
Loan loss reserves forecasted by projecting the population of loans 90+ days delinquent or in foreclosure, and corresponding loss severity over the nine-quarter time horizon. Specifically:
Forecasts the amortized balances for the affected population under the FHFA-provided macroeconomic scenario.
Forecasts loss severity based on the stressed HPI curves.
Combines the projected amortized balances and loss severities to compute projected losses.
10
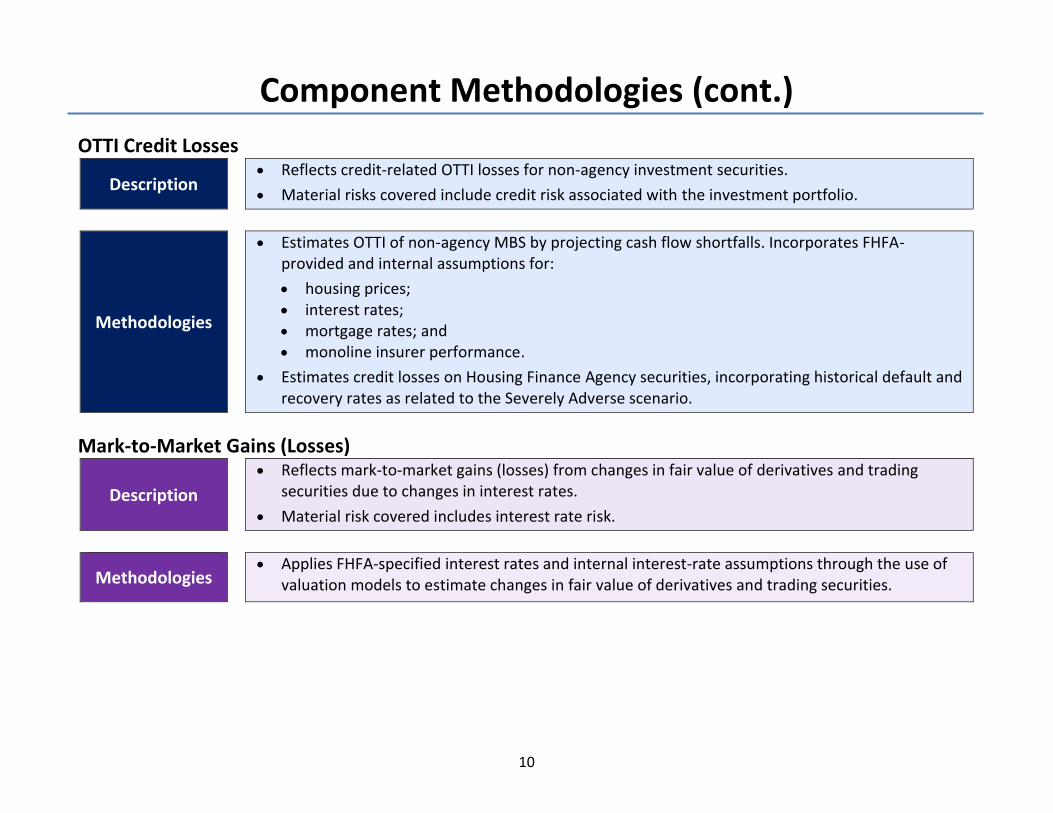
Component Methodologies (cont.)
OTTI Credit Losses
Description
Reflects credit-related OTTI losses for non-agency investment securities.
Material risks covered include credit risk associated with the investment portfolio.
Methodologies
Estimates OTTI of non-agency MBS by projecting cash flow shortfalls. Incorporates FHFA-provided and internal assumptions for:
housing prices; interest rates; mortgage rates; and monoline insurer performance.
Estimates credit losses on Housing Finance Agency securities, incorporating historical default and recovery rates as related to the Severely Adverse scenario.
Mark-to-Market Gains (Losses)
Description
Reflects mark-to-market gains (losses) from changes in fair value of derivatives and trading securities due to changes in interest rates.
Material risk covered includes interest rate risk.
Methodologies
Applies FHFA-specified interest rates and internal interest-rate assumptions through the use of valuation models to estimate changes in fair value of derivatives and trading securities.
11
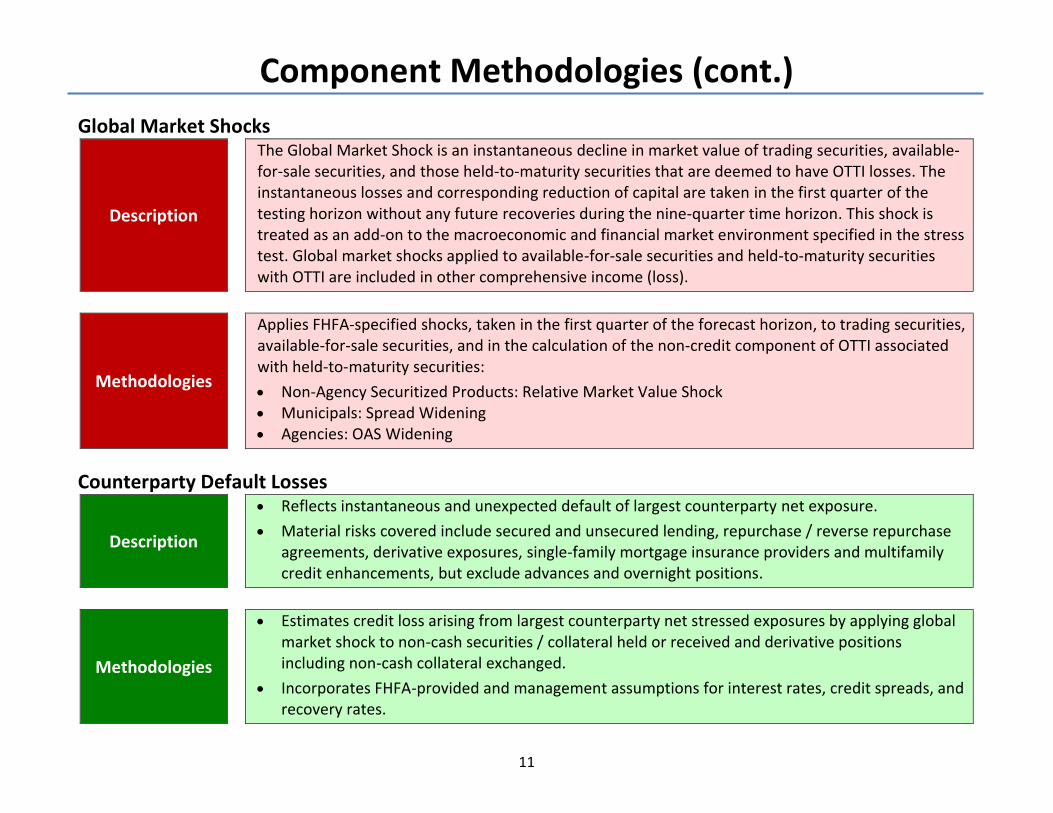
Component Methodologies (cont.)
Global Market Shocks
Description
The Global Market Shock is an instantaneous decline in market value of trading securities, available-for-sale securities, and those held-to-maturity securities that are deemed to have OTTI losses. The instantaneous losses and corresponding reduction of capital are taken in the first quarter of the testing horizon without any future recoveries during the nine-quarter time horizon. This shock is treated as an add-on to the macroeconomic and financial market environment specified in the stress test. Global market shocks applied to available-for-sale securities and held-to-maturity securities with OTTI are included in other comprehensive income (loss).
Methodologies
Applies FHFA-specified shocks, taken in the first quarter of the forecast horizon, to trading securities, available-for-sale securities, and in the calculation of the non-credit component of OTTI associated with held-to-maturity securities:
Non-Agency Securitized Products: Relative Market Value Shock Municipals: Spread Widening Agencies: OAS Widening
Counterparty Default Losses
Description
Reflects instantaneous and unexpected default of largest counterparty net exposure.
Material risks covered include secured and unsecured lending, repurchase / reverse repurchase agreements, derivative exposures, single-family mortgage insurance providers and multifamily credit enhancements, but exclude advances and overnight positions.
Methodologies
Estimates credit loss arising from largest counterparty net stressed exposures by applying global market shock to non-cash securities / collateral held or received and derivative positions including non-cash collateral exchanged.
Incorporates FHFA-provided and management assumptions for interest rates, credit spreads, and recovery rates.
12
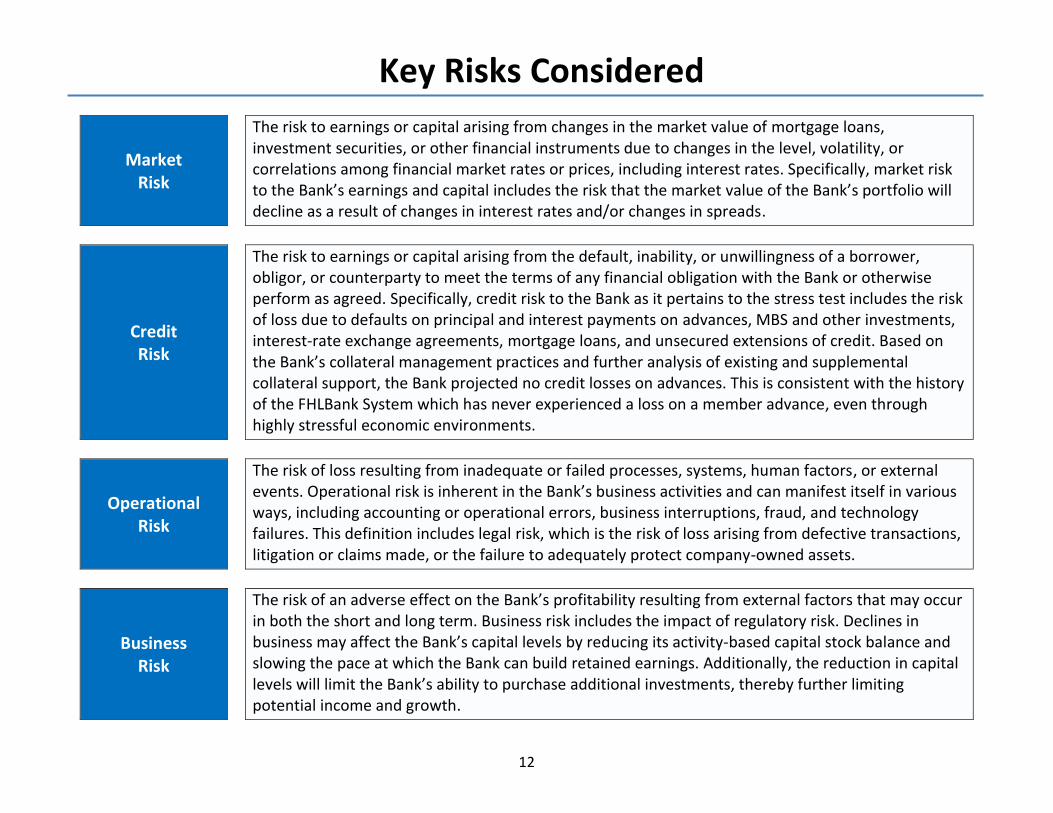
Key Risks Considered
Market Risk
The risk to earnings or capital arising from changes in the market value of mortgage loans, investment securities, or other financial instruments due to changes in the level, volatility, or correlations among financial market rates or prices, including interest rates. Specifically, market risk to the Bank’s earnings and capital includes the risk that the market value of the Bank’s portfolio will decline as a result of changes in interest rates and/or changes in spreads.
Credit Risk
The risk to earnings or capital arising from the default, inability, or unwillingness of a borrower, obligor, or counterparty to meet the terms of any financial obligation with the Bank or otherwise perform as agreed. Specifically, credit risk to the Bank as it pertains to the stress test includes the risk of loss due to defaults on principal and interest payments on advances, MBS and other investments, interest-rate exchange agreements, mortgage loans, and unsecured extensions of credit. Based on the Bank’s collateral management practices and further analysis of existing and supplemental collateral support, the Bank projected no credit losses on advances. This is consistent with the history of the FHLBank System which has never experienced a loss on a member advance, even through highly stressful economic environments.
Operational Risk
The risk of loss resulting from inadequate or failed processes, systems, human factors, or external events. Operational risk is inherent in the Bank’s business activities and can manifest itself in various ways, including accounting or operational errors, business interruptions, fraud, and technology failures. This definition includes legal risk, which is the risk of loss arising from defective transactions, litigation or claims made, or the failure to adequately protect company-owned assets.
Business Risk
The risk of an adverse effect on the Bank’s profitability resulting from external factors that may occur in both the short and long term. Business risk includes the impact of regulatory risk. Declines in business may affect the Bank’s capital levels by reducing its activity-based capital stock balance and slowing the pace at which the Bank can build retained earnings. Additionally, the reduction in capital levels will limit the Bank’s ability to purchase additional investments, thereby further limiting potential income and growth.