Federal Debt and Interest Costs - Congressional …CONGRESS OF THE UNITED STATES CONGRESSIONAL...
49
CONGRESS OF THE UNITED STATES CONGRESSIONAL BUDGET OFFICE CBO Federal Debt and Interest Costs DECEMBER 2010 70 30 60 50 20 10 80 40 0 0 1 3 2 4 Percentage of GDP Percentage of GDP Actual Actual Projected Projected 1980 2000 1990 1970 2010 2020 Debt Held by the Public Net Interest 1970 2010 1990 1980 2020 2000
Transcript of Federal Debt and Interest Costs - Congressional …CONGRESS OF THE UNITED STATES CONGRESSIONAL...

CONGRESS OF THE UNITED STATESCONGRESSIONAL BUDGET OFFICE
CBO
Federal Debt and Interest Costs
DECEMBER 2010
70
30
60
50
20
10
80
40
0
0
1
3
2
4
Percentage of GDP
Percentage of GDP
Actual
Actual
Projected
Projected
1980 200019901970 2010 2020
Debt Held by the Public
Net Interest
1970 201019901980 20202000

Pub. No. 4184
A
S T U D Y
CBO
Federal Debt and Interest Costs
December 2010
The Congress of the United States O Congressional Budget Office
CBO
Notes
Unless otherwise indicated, the years referred to in this report are federal fiscal years (which run from October 1 to September 30).
Numbers in the text and tables may not add up to totals because of rounding.
Budget projections reported in this study come from Congressional Budget Office, The Budget and Economic Outlook: An Update (August 2010), but may differ slightly because they incorporate actual results for fiscal year 2010.

Preface
Recently, the federal government has been recording the largest budget deficits, as a share of gross domestic product (GDP), since the end of World War II. As a result of those deficits, the amount of federal debt held by the public has soared—surpassing $9 trillion at the end of fiscal year 2010 and equal to 62 percent of GDP. The interest the government pays on that debt is currently low by historical standards as a percentage of GDP but is expected to grow rapidly over the next several years as interest rates rise. In response to a request from the Chairman and Ranking Member of the Senate Budget Committee, this study provides back-ground material on federal debt and interest costs.
Jared Brewster and Amber Marcellino of the Congressional Budget Office’s (CBO’s) Budget Analysis Division wrote the study under the supervision of Theresa Gullo and Jeffrey Holland. Jared Brewster wrote the Summary and Chapters 1 and 2; Amber Marcellino and Jared Brewster wrote Chapter 3. Jonathan Huntley and Avi Lerner of CBO also contrib-uted to the study. Staff of the Office of Management and Budget provided valuable assistance. (The assistance of external participants implies no responsibility for the final product, which rests solely with the authors and CBO.)
Sherry Snyder edited the manuscript, Kate Kelly proofread it, Jeanine Rees prepared the study for publication, and Maureen Costantino designed the cover. Monte Ruffin oversaw the printing of the study, Linda Schimmel handled the print distribution, and Simone Thomas prepared the electronic version for CBO’s Web site (www.cbo.gov).
Douglas W. ElmendorfDirector
December 2010
CBO
jeaniner
Doug Elmendorf


Contents
CBO
Summary vii
1 Debt Held by the Public 1
Trends in Debt Held by the Public 1Types and Amounts of Treasury Debt Held by the Public 3Reasons for Borrowing Other Than Budget Deficits 10Ownership of Federal Debt Held by the Public 13U.S. Debt Compared with That of Other Countries 14
2 Other Measures of Federal Debt 17
Debt Held by the Public Net of Financial Assets 18Gross Federal Debt 20Debt Subject to Limit 21
3 Interest Payments and Receipts 25
Historical and Projected Net Interest Outlays 25Gross Interest on Treasury Debt Securities 27Interest Received by Trust Funds 27Other Interest 28Other Investment Income 33
Appendix: Public Debt Outstanding at the End of the Fiscal Year 35

VI FEDERAL DEBT AND INTEREST COSTS
CBO
Tables
1-1. Schedule of Treasury Auctions of Marketable Debt 7
1-2. Deficits and Means of Financing, 2000 to 2010 11
1-3. Holders of Public Debt at the End of Fiscal Years 2005 and 2010 13
2-1. CBO’s Projections of Debt Held by the Public Net of Financial Assets, 2010 to 2020 19
2-2. CBO’s Projections of Federal Debt, 2010 to 2020 21
2-3. CBO’s Projections of Trust Fund Balances, 2010 to 2020 22
3-1. CBO’s Baseline Projections of Federal Interest Outlays, 2010 to 2020 28
3-2. Alternative Scenarios for Net Interest Outlays, 2011 to 2020 29
3-3. Other Interest, 2006 to 2010 30
A-1. Marketable Public Debt Outstanding at the End of the Fiscal Year, 1990 to 2010 36
A-2. Nonmarketable Public Debt Outstanding at the End of the Fiscal Year, 1990 to 2010 37
Figures
S-1. Debt Held by the Public, 1940 to 2020 viii
S-2. Net Interest Outlays, 1940 to 2020 x
1-1. Debt Held by the Public, 1790 to 2020 4
1-2. Components of Debt Held by the Public at the End of Fiscal Year 2010 5
1-3. Percentage of Marketable Debt Outstanding, by Type of Security, 1990 to 2010 6
1-4. Average Remaining Maturity of Marketable Public Debt, 2000 to 2010 8
1-5. Quarterly Change in Outstanding Treasury Securities, 2005 to 2010 9
1-6. Debt of Selected Countries at the End of Calendar Year 2009 15
3-1. Net Interest, 1970 to 2020 26
3-2. Interest Rates on Three-Month Treasury Bills and Ten-Year Treasury Notes, 1970 to 2020 27
Box
1-1. Accounting for Debt and Guarantees Issued by Fannie Mae and Freddie Mac 2

Summary
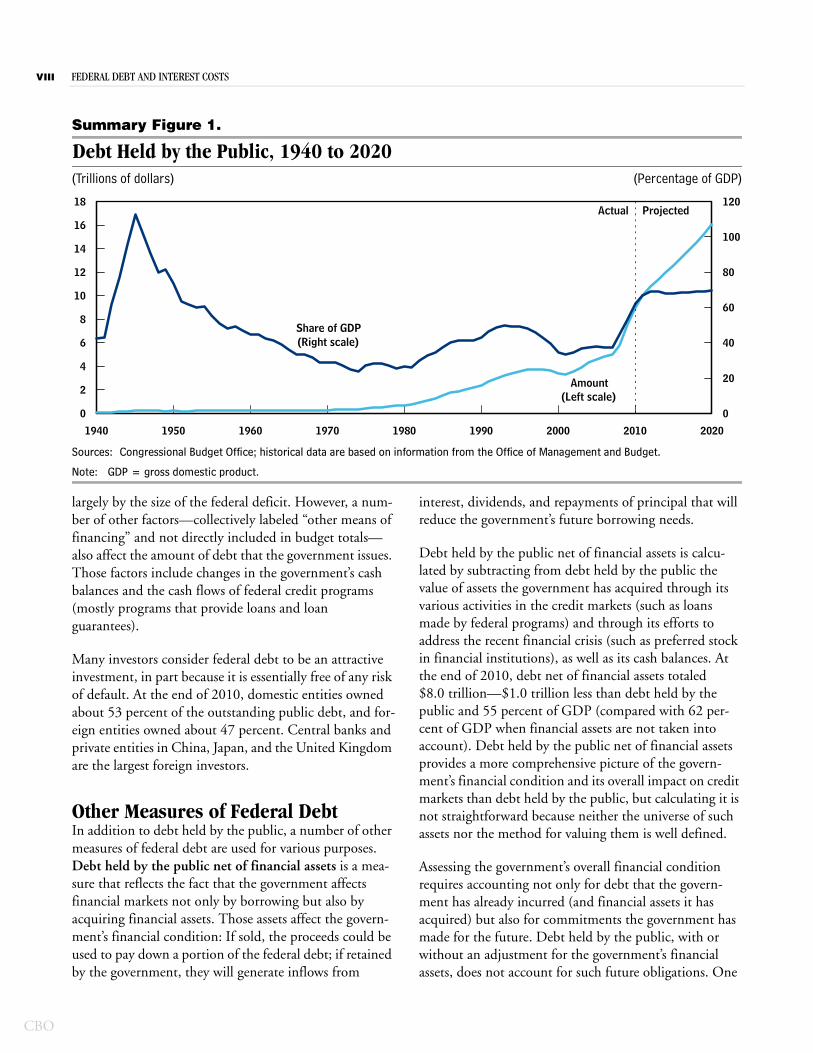
The past few years have seen a sharp rise in the debt of the federal government. At the end of fiscal year 2008, debt held by the public amounted to $5.8 trillion—equal to 40 percent of the nation’s annual economic output (gross domestic product, or GDP), a little above the 40-year average of 35 percent.1 Since then, debt held by the public has shot upward, surpassing $9 trillion by the end of fiscal year 2010—equal to 62 percent of GDP, the highest percentage since shortly after World War II (see Summary Figure 1). The surge in debt stems partly from lower tax revenues and higher federal spending related to the recent severe recession and turmoil in financial markets. However, the growing debt also reflects an imbalance between spending and revenues that predated those economic developments.
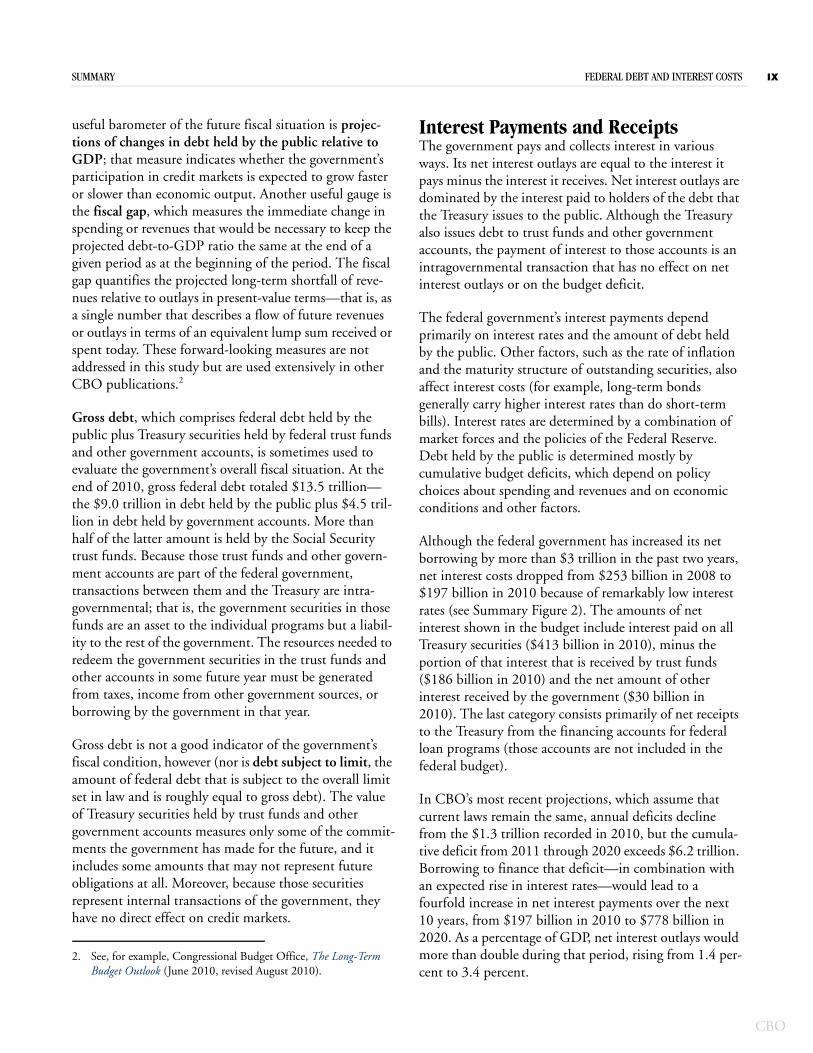
At the same time, a sharp drop in interest rates has held down the amount of interest that the government pays on that debt. In 2010, net interest outlays totaled $197 bil-lion, or 1.4 percent of GDP—a smaller share of GDP than they accounted for during most of the past decade.
The Congressional Budget Office (CBO) projects that, under current law, debt held by the public will exceed $16 trillion by 2020, reaching nearly 70 percent of GDP. CBO also projects that interest rates will go up. The combination of rising debt and rising interest rates is projected to cause net interest payments to balloon to nearly $800 billion, or 3.4 percent of GDP, by 2020.
Many other outcomes are possible, however. If, for exam-ple, the tax reductions enacted earlier in the decade were continued, the alternative minimum tax was indexed for inflation, and future annual appropriations remained the same share of GDP that they were in 2010, debt held by
1. Debt held by the public consists mostly of securities that the Department of the Treasury issues to raise cash to fund the activi-ties of the government, including the securities sold to pay off maturing securities; it also includes a small amount of securities issued by other agencies, mainly the Tennessee Valley Authority.
the public would total nearly 100 percent of GDP by 2020. Interest costs would be correspondingly higher.
This CBO study describes historical trends in borrowing by the federal government and the interest the govern-ment pays on that borrowing. The study takes an in-depth look at the most commonly used measure of the government’s debt—debt held by the public—and also discusses several other measures of the debt, such as debt held by the public net of financial assets, gross federal debt, and debt subject to limit. In addition, the study examines the government’s net interest costs and the types of transactions that generate interest payments and collections.
Debt Held by the PublicTo finance the government’s activities, the Treasury issues numerous types of securities that vary in their maturity, how they are sold, and how their payments are struc-tured. Marketable securities—bills, notes, bonds, and inflation-protected securities—are auctioned at regular intervals during the year and accounted for nearly 95 per-cent of outstanding debt held by the public at the end of 2010. Nearly two-thirds of that marketable debt was in Treasury notes, which have an original maturity of 2 to 10 years.
A small percentage of debt held by the public is in the form of nonmarketable securities, which cannot be resold by the original purchasers. Those securities include savings bonds, securities issued to state and local governments, and securities used for investments of the government’s Thrift Savings Plan (a retirement savings program for civil service employees and members of the uniformed services).
The government’s net borrowing for each year (that is, the new cash it must raise, over and above the amount required to pay off maturing securities) is determined
CBO
VIII FEDERAL DEBT AND INTEREST COSTS
CBO
Summary Figure 1.
Debt Held by the Public, 1940 to 2020(Trillions of dollars) (Percentage of GDP)
Sources: Congressional Budget Office; historical data are based on information from the Office of Management and Budget.
Note: GDP = gross domestic product.
1940 1950 1960 1970 1980 1990 2000 2010 2020
0
2
4
6
8
10
12
14
16
18
0
20
40
60
80
100
120
Amount(Left scale)
Share of GDP(Right scale)
Actual Projected
largely by the size of the federal deficit. However, a num-ber of other factors—collectively labeled “other means of financing” and not directly included in budget totals—also affect the amount of debt that the government issues. Those factors include changes in the government’s cash balances and the cash flows of federal credit programs (mostly programs that provide loans and loan guarantees).
Many investors consider federal debt to be an attractive investment, in part because it is essentially free of any risk of default. At the end of 2010, domestic entities owned about 53 percent of the outstanding public debt, and for-eign entities owned about 47 percent. Central banks and private entities in China, Japan, and the United Kingdom are the largest foreign investors.
Other Measures of Federal DebtIn addition to debt held by the public, a number of other measures of federal debt are used for various purposes. Debt held by the public net of financial assets is a mea-sure that reflects the fact that the government affects financial markets not only by borrowing but also by acquiring financial assets. Those assets affect the govern-ment’s financial condition: If sold, the proceeds could be used to pay down a portion of the federal debt; if retained by the government, they will generate inflows from
interest, dividends, and repayments of principal that will reduce the government’s future borrowing needs.
Debt held by the public net of financial assets is calcu-lated by subtracting from debt held by the public the value of assets the government has acquired through its various activities in the credit markets (such as loans made by federal programs) and through its efforts to address the recent financial crisis (such as preferred stock in financial institutions), as well as its cash balances. At the end of 2010, debt net of financial assets totaled $8.0 trillion—$1.0 trillion less than debt held by the public and 55 percent of GDP (compared with 62 per-cent of GDP when financial assets are not taken into account). Debt held by the public net of financial assets provides a more comprehensive picture of the govern-ment’s financial condition and its overall impact on credit markets than debt held by the public, but calculating it is not straightforward because neither the universe of such assets nor the method for valuing them is well defined.
Assessing the government’s overall financial condition requires accounting not only for debt that the govern-ment has already incurred (and financial assets it has acquired) but also for commitments the government has made for the future. Debt held by the public, with or without an adjustment for the government’s financial assets, does not account for such future obligations. One
SUMMARY FEDERAL DEBT AND INTEREST COSTS IX
useful barometer of the future fiscal situation is projec-tions of changes in debt held by the public relative to GDP; that measure indicates whether the government’s participation in credit markets is expected to grow faster or slower than economic output. Another useful gauge is the fiscal gap, which measures the immediate change in spending or revenues that would be necessary to keep the projected debt-to-GDP ratio the same at the end of a given period as at the beginning of the period. The fiscal gap quantifies the projected long-term shortfall of reve-nues relative to outlays in present-value terms—that is, as a single number that describes a flow of future revenues or outlays in terms of an equivalent lump sum received or spent today. These forward-looking measures are not addressed in this study but are used extensively in other CBO publications.2
Gross debt, which comprises federal debt held by the public plus Treasury securities held by federal trust funds and other government accounts, is sometimes used to evaluate the government’s overall fiscal situation. At the end of 2010, gross federal debt totaled $13.5 trillion—the $9.0 trillion in debt held by the public plus $4.5 tril-lion in debt held by government accounts. More than half of the latter amount is held by the Social Security trust funds. Because those trust funds and other govern-ment accounts are part of the federal government, transactions between them and the Treasury are intra-governmental; that is, the government securities in those funds are an asset to the individual programs but a liabil-ity to the rest of the government. The resources needed to redeem the government securities in the trust funds and other accounts in some future year must be generated from taxes, income from other government sources, or borrowing by the government in that year.
Gross debt is not a good indicator of the government’s fiscal condition, however (nor is debt subject to limit, the amount of federal debt that is subject to the overall limit set in law and is roughly equal to gross debt). The value of Treasury securities held by trust funds and other government accounts measures only some of the commit-ments the government has made for the future, and it includes some amounts that may not represent future obligations at all. Moreover, because those securities represent internal transactions of the government, they have no direct effect on credit markets.
2. See, for example, Congressional Budget Office, The Long-Term Budget Outlook (June 2010, revised August 2010).
Interest Payments and ReceiptsThe government pays and collects interest in various ways. Its net interest outlays are equal to the interest it pays minus the interest it receives. Net interest outlays are dominated by the interest paid to holders of the debt that the Treasury issues to the public. Although the Treasury also issues debt to trust funds and other government accounts, the payment of interest to those accounts is an intragovernmental transaction that has no effect on net interest outlays or on the budget deficit.
The federal government’s interest payments depend primarily on interest rates and the amount of debt held by the public. Other factors, such as the rate of inflation and the maturity structure of outstanding securities, also affect interest costs (for example, long-term bonds generally carry higher interest rates than do short-term bills). Interest rates are determined by a combination of market forces and the policies of the Federal Reserve. Debt held by the public is determined mostly by cumulative budget deficits, which depend on policy choices about spending and revenues and on economic conditions and other factors.
Although the federal government has increased its net borrowing by more than $3 trillion in the past two years, net interest costs dropped from $253 billion in 2008 to $197 billion in 2010 because of remarkably low interest rates (see Summary Figure 2). The amounts of net interest shown in the budget include interest paid on all Treasury securities ($413 billion in 2010), minus the portion of that interest that is received by trust funds ($186 billion in 2010) and the net amount of other interest received by the government ($30 billion in 2010). The last category consists primarily of net receipts to the Treasury from the financing accounts for federal loan programs (those accounts are not included in the federal budget).
In CBO’s most recent projections, which assume that current laws remain the same, annual deficits decline from the $1.3 trillion recorded in 2010, but the cumula-tive deficit from 2011 through 2020 exceeds $6.2 trillion. Borrowing to finance that deficit—in combination with an expected rise in interest rates—would lead to a fourfold increase in net interest payments over the next 10 years, from $197 billion in 2010 to $778 billion in 2020. As a percentage of GDP, net interest outlays would more than double during that period, rising from 1.4 per-cent to 3.4 percent.
CBO

X FEDERAL DEBT AND INTEREST COSTS
CBO
Summary Figure 2.
Net Interest Outlays, 1940 to 2020(Billions of dollars) (Percentage of GDP)
Sources: Congressional Budget Office; historical data are based on information from the Office of Management and Budget.
Note: GDP = gross domestic product.
1940 1950 1960 1970 1980 1990 2000 2010 2020
0
100
200
300
400
500
600
700
800
900
0
0.5
1.0
1.5
2.0
2.5
3.0
3.5
Amount(Left scale)
Share of GDP(Right scale)
Actual Projected

CH A P T E R
1Debt Held by the Public
When the federal government’s spending exceeds its revenues, which has been the case in all but 4 of the past 40 years, the Department of the Treasury must raise cash to finance the resulting budget deficit. It does so by selling securities in the capital markets. Debt held by the public consists almost entirely of those securities, includ-ing those sold to pay off securities as they mature.
Recently, the federal government has been recording the largest budget deficits, as a share of the economy, since the end of World War II. As a result of those deficits, the amount of federal debt held by the public has surged. At the end of 2008, that debt amounted to $5.8 trillion—equal to 40 percent of the nation’s annual economic out-put (as measured by gross domestic product, or GDP), above the average over the previous 40 years of 35 per-cent. Since then, large budget deficits and increased bor-rowing to fund programs that address the recent financial crisis have caused debt held by the public to shoot upward, surpassing $9 trillion by the end of fiscal year 2010—equal to 62 percent of GDP, the highest percent-age since shortly after World War II (see Figure 1-1 on page 4). The sharp rise in debt stems partly from lower tax revenues and higher federal spending related to the recent severe recession and turmoil in financial markets. However, the growing debt also reflects an imbalance between spending and revenues that predated those economic developments.
To finance the government’s activities, the Treasury issues numerous types of securities that vary in their maturity, how they are sold, and how their interest payments are structured. Those differences directly affect the interest rates on those securities, which are a key determinant of the amount of interest the government pays on its out-standing debt.
The size of the federal deficit largely determines the government’s net borrowing for each year (that is, the new cash it must raise, above the amount required to pay off maturing securities). However, several other factors—collectively labeled “other means of financing” and not directly included in budget totals—also affect the amount of debt that the government issues each year. Those fac-tors include changes in the government’s cash balances and the cash flows of federal credit programs, mostly programs that provide loans and loan guarantees. Also, a small amount of debt held by the public (less than 1 per-cent) is issued by agencies other than the Treasury (such as the Tennessee Valley Authority). Debt issued by Fannie Mae and Freddie Mac—the two government-sponsored enterprises now under federal conservatorship—is not included in debt held by the public (see Box 1-1).
Publicly issued Treasury securities are held by various buyers in the United States, including the Federal Reserve, private investors, and state and local governments. Those securities also are acquired by foreign investors, including foreign central banks and individuals.
Compared with a similar measure of debt held by the public, the amount of debt in the United States is sub-stantially lower than that in Japan and Italy and close to that in Hungary and Portugal.
Trends in Debt Held by the PublicDuring World War II, the federal government borrowed heavily to finance the war effort and, as a result, debt reached 109 percent of GDP in 1946. For the next quar-ter century, however, debt hardly grew—inching up, by an average of about $2 billion a year, from $242 billion in 1946 to $283 billion in 1970. During that period, on balance, the government neither paid off the debt
CBO
2 FEDERAL DEBT AND INTEREST COSTS
CBO
Continued
Box 1-1.
Accounting for Debt and Guarantees Issued by Fannie Mae and Freddie Mac
In September 2008, the Director of the Federal Housing Finance Agency placed into conservatorship two large government-sponsored enterprises, Fannie Mae and Freddie Mac.1 At the same time, the Secre-tary of the Treasury took a major ownership interest in both entities in the form of preferred stock. In the judgment of the Congressional Budget Office (CBO), those actions make Fannie Mae and Freddie Mac part of the government and imply that their operations should be reflected in the federal budget.2
Fannie Mae and Freddie Mac were chartered by the Congress four decades ago as private companies with a public mission to provide liquidity and stability to the secondary market for residential mortgages (the market in which those mortgages are bought and sold). In carrying out their charters, the two entities
purchase mortgage loans made by lenders and pack-age them into mortgage-backed securities (MBSs) that carry guarantees that principal and interest on the underlying mortgages will be paid in full; those securities are then sold to investors. The two entities also invest directly in mortgages and MBSs, which they hold in their portfolios. To fund those holdings, they issue debt and sell it in the international capital markets. As of September 2010, Fannie Mae and Freddie Mac held or guaranteed about $4.4 trillion in MBSs; they also had issued $1.6 trillion in debt.
Despite having a unique legal status and a long his-tory linking them closely to the federal government, Fannie Mae and Freddie Mac had been considered private firms owned by their shareholders. Now, how-ever, the federal government controls both entities and is operating them to fulfill the public purpose of supporting the housing and mortgage markets.31. Conservatorship is the legal process by which an entity (in
this case, the government) establishes control and oversight of a company to put it in a sound and solvent condition.
2. See Congressional Budget Office, CBO’s Budgetary Treatment of Fannie Mae and Freddie Mac, Background Paper (January 2010).
3. For more information about the various ways in which the federal government helps the housing market, see Congres-sional Budget Office, An Overview of Federal Support for Housing, Issue Brief (November 2009).
incurred from the war nor added much to it. With the economy growing, debt dropped steadily as a share of GDP, reaching 28 percent in 1970 (see Figure 1-1).
The era of slow growth of debt ended in the 1970s. Federal budgets were unbalanced for the entire decade, and debt held by the public more than doubled in dollar terms between 1970 and 1980. But rapid inflation swelled GDP, and the debt as a percentage of GDP actually decreased somewhat during the decade, falling to 26 percent by 1980.
Between 1980 and 1993, debt held by the public expanded more rapidly than the economy, rising from 26 percent of GDP to 49 percent. However, policies adopted during the 1990s to tackle budget deficits, and
the surge in tax revenues associated with robust economic growth seen throughout most of the decade, led to bud-get surpluses between 1998 and 2001. Those surpluses decreased debt held by the public by more than $450 bil-lion between the end of 1997 and the end of 2001 and lowered debt as a share of GDP to 33 percent by the end of 2001, a level not seen since the early 1980s. Those surpluses were short-lived, though, as budget deficits between 2002 and 2007 boosted debt held by the public by more than $1.7 trillion, but economic growth kept debt as a percentage of GDP fairly steady in that period, around 37 percent.
In 2008, the United States experienced the most severe financial crisis since the Great Depression. The following year, revenues dropped sharply and outlays increased

CHAPTER ONE FEDERAL DEBT AND INTEREST COSTS 3
Box 1-1. Continued
Accounting for Debt and Guarantees Issued by Fannie Mae and Freddie Mac
Moreover, both entities rely on federal backing to maintain their low-cost access to financial markets. Although they are not legally government agencies and their employees are not civil servants, CBO believes it is appropriate and useful to policymakers to include Fannie Mae’s and Freddie Mac’s financial transactions with other federal activities in the budget.4
That budgetary treatment raises the question of how the conservatorship of Fannie Mae and Freddie Mac should be reflected in measures of the government’s financial position. Neither CBO nor the Administra-tion currently incorporates debt or MBSs issued by Fannie Mae and Freddie Mac in estimates of federal
debt held by the public, nor does CBO currently include the value of the preferred shares held by the Department of the Treasury in its estimate of the value of financial assets owned by the government.
In taking over Fannie Mae and Freddie Mac, the gov-ernment obtained both assets and liabilities. The assets consist mostly of the mortgages and MBSs held in the entities’ portfolios and the claim to the revenue stream generated by guarantee fees. The liabilities consist mostly of debt issued by Fannie Mae and Freddie Mac and the obligation to honor their guar-antees. In CBO’s judgment, the liabilities are larger, on balance, than the assets because of elevated losses from defaults. Consequently, the two entities do not represent a net asset to the government but a net lia-bility—that is, their impact on the government’s financial position is a negative one. CBO estimated the amount of that negative impact when the entities were taken into conservatorship, but it has not updated that estimate nor included such an amount in debt held by the public or any other measures of debt referenced in this study.
4. The Administration’s Office of Management and Budget (OMB) makes the ultimate decision about whether the activ-ities of Fannie Mae and Freddie Mac will be included in the federal budget. Although OMB’s budget documents have not included those activities in the budget totals, they have pro-vided financial information about the two entities for several years; see, for example, Budget of the United States Govern-ment, Fiscal Year 2011: Appendix, pp. 1373–1375.
substantially, pushing the deficit to $1.4 trillion, equal to 10 percent of GDP (the highest level since 1945). The budget deficit in 2010 reached nearly $1.3 trillion (or 9 percent of GDP) because of continued low revenues and elevated spending. Overall, in the three years between 2008 and 2010, the Treasury added nearly $4 trillion to its borrowing, increasing debt held by the public as a percentage of GDP from 36 percent at the end of 2007 to 40 percent at the end of 2008 and to 62 per-cent at the end of 2010.
Types and Amounts of Treasury Debt Held by the PublicThe Treasury issues two broad types of securities to the public: marketable and nonmarketable. Marketable issues—bills, notes, bonds, and inflation-protected secu-
rities—are auctioned at regular intervals during the year and can be resold on the secondary market (where previ-ously issued Treasury securities can be bought and resold). Such securities accounted for $8.5 trillion, or 94 percent, of debt held by the public at the end of 2010. Nonmarketable issues, such as savings bonds, are not sold at auction and cannot be traded in the secondary market. Those issues accounted for $526 billion, or 6 percent, of debt held by the public at the end of 2010 (see Figure 1-2).
Marketable Securities Marketable securities comprise bills (original maturity of 1 year or less), notes (original maturity of 2 to 10 years), bonds (original maturity of longer than 10 years), and Treasury inflation-protected securities, or TIPS (original maturity of 5, 10, or 30 years). Bills are offered on a
CBO

4 FEDERAL DEBT AND INTEREST COSTS
CBO
Figure 1-1.
Debt Held by the Public, 1790 to 2020(Percentage of gross domestic product)
Sources: Congressional Budget Office based on data on federal debt from the Department of the Treasury and the Board of Governors of the Federal Reserve System. Estimates of gross domestic product come from the U.S. Census Bureau; Thomas Berry, Revised Annual Estimates of American Gross National Product (Richmond, Va.: Bostwick Press, 1978); Robert E. Gallman, “Economic Growth and Structural Change in the Long Nineteenth Century,” in Gallman and Stanley L. Engerman, eds., The Cambridge Economic History of the United States, vol. 2, The Long Nineteenth Century (Cambridge, England: Cambridge University Press, 2000), pp. 1–55; Nathan S. Balke and Robert J. Gordon, “The Estimation of Prewar Gross National Product: Methodology and New Evidence,” Journal of Political Economy, vol. 97, no. 1 (February 1989), pp. 38–92; and the Department of Commerce, Bureau of Economic Analysis.
1790 1810 1830 1850 1870 1890 1910 1930 1950 1970 1990 2010
0
20
40
60
80
100
120Proj.Actual
discount basis—that is, the purchaser generally pays less than the face value for a security and receives the face value at maturity; the difference between the purchase price and the value at maturity is the amount of interest earned on the security. In contrast, notes and bonds are referred to as “coupon” securities; the purchaser receives semiannual interest payments (the coupon) based on a fixed rate and receives the principal at maturity. TIPS provide purchasers with an inflation adjustment to the principal and a semiannual interest payment.1 The inter-est rate on TIPS is a fixed rate determined at auction, but the interest payments vary because the rate is applied to the inflation-adjusted principal. TIPS mitigate the risk to investors that inflation will turn out to be higher than expected and tend to attract a somewhat different type of investor than those interested in other types of Treasury securities.
1. The inflation adjustment to principal is based on the non-seasonally adjusted consumer price index for all urban consumers (CPI-U). The adjustment to the value of outstanding TIPS is made on a daily basis but is not paid until maturity. For more information, see Treasury Direct, “TIPS: Rates and Terms,” www.treasurydirect.gov/indiv/research/indepth/tips/res_tips_rates.htm.
Over the past two decades, Treasury notes have generally accounted for the majority of outstanding marketable securities; the current share of 62 percent is the highest since 1997 (see Figure 1-3; also see Table A-1 in the appendix for amounts outstanding for each type of security for the past 20 years). Bills have generally accounted for between 20 percent and 30 percent of mar-ketable debt; the current share is at the lower end of that range. Bonds now account for 10 percent of outstanding marketable debt, about half of their share in the 1990s and early 2000s. The share in the form of TIPS increased over the 10 years from their inception to 2007; that share peaked at 10 percent of outstanding marketable securities but has fallen over the past three years.
In choosing the mix of maturities to offer, the Treasury must weigh several considerations. Short-term securities generally have lower interest costs, but they also incur the cost of more frequent refinancing, and they expose the government to the risk of having to pay higher interest rates when it refinances those issues. Conversely, long-term securities involve higher rates, on average, but provide more certainty about future costs of interest pay-ments and reduce the frequency of refinancing. The

CHAPTER ONE FEDERAL DEBT AND INTEREST COSTS 5
Figure 1-2.
Components of Debt Held by the Public at the End of Fiscal Year 2010
Source: Congressional Budget Office based on data from the Department of the Treasury.
Note: TIPS = Treasury inflation-protected securities.
a. The $9,018 billion includes $24 billion in debt issued by agencies other than the Treasury, such as the Tennessee Valley Authority, which is not shown separately in this figure.
b. The current value of marketable securities reflects an adjustment for premiums and discounts that CBO has included in the total for Treasury bills.
c. Other nonmarketable securities include foreign and domestic series zero-coupon bonds (current value), foreign series bills, claims funds and asset forfeitures funds, tax and loss bonds issued by the Mortgage Guaranty Insurance Corporation, U.S. notes and silver certificates, and various other small securities.
Debt Held by the Publica
($9,018 billion)
Nonmarketable($526 billion)
State and LocalGovernment
Series($193 billion)
SavingsBonds
($189 billion)
Thrift Savings
Plan($124 billion)
Otherc
($20 billion)
Marketableb
($8,468 billion)
Notes($5,253 billion)
Bonds($846 billion)
Bills($1,776 billion)
TIPS($594 billion)
preferences of investors are a further consideration in set-ting the maturity structure; offerings that best meet the needs of investors will lower the Treasury’s overall cost of borrowing.
Auctions. The Treasury sells securities on a regular basis through “single-price” auctions, in which successful bidders buy securities at the highest accepted discount rate (for bills) or yield (for notes and bonds). Bidding can be either competitive or noncompetitive. Most competi-tive bidding is done by large financial institutions for their own accounts or on behalf of customers in the secondary (resale) market. Investors make a competitive bid by specifying the price they are willing to pay for a particular security at auction, but such bids are not guaranteed to be accepted.
Noncompetitive bids are made by investors through the Treasury or through certain banks, brokers, or dealers. Noncompetitive buyers specify an amount to purchase
before an auction but are not allowed to specify a yield; instead, their bid is guaranteed to be fulfilled at the high-est accepted yield. Those buyers are assured of receiving the full amount of their order up to the current maxi-mum of $5 million.
Borrowing Schedule. Treasury securities are issued on a regular schedule, and the amount to be auctioned is determined by the federal government’s borrowing needs. The auction schedule and the mix of maturities are also designed to enhance the liquidity of Treasury issues so that investors can buy or sell them quickly and in large amounts without affecting the price of the securities. Treasury issues that are relatively liquid are more valuable to most investors, who are therefore willing to pay more for them.
With the rapid increase in the deficit over the past few years, the auction schedule has been expanded. In partic-ular, the Treasury has increased the number of auctions,
CBO

6 FEDERAL DEBT AND INTEREST COSTS
CBO
Figure 1-3.
Percentage of Marketable Debt Outstanding, by Type of Security, 1990 to 2010(Percent)
Source: Congressional Budget Office based on data from the Department of the Treasury.
a. Treasury inflation-protected securities (TIPS) were first issued in 1997.
1990 1992 1994 1996 1998 2000 2002 2004 2006 2008 2010
0
10
20
30
40
50
60
70
TIPSaBonds
Bills
Notes
raised the dollar amount of individual issuances, and reintroduced a variety of previously retired maturities (see Table 1-1 for the Treasury’s recent auction schedule). Most of the recent borrowing has been done in securities with a maturity of greater than a year, which has allowed the Treasury to lock in historically low rates on those securities.
Bills. The Treasury offers bills in 1-month, 3-month, and 6-month maturities on a weekly basis. It also offers a 1-year bill every four weeks; that issue, which had not been offered since 2001, was reintroduced in 2008. The Treasury also offers cash management bills (CMBs) to fund the government’s short-term cash needs; CMBs have no uniform maturity date and are offered as needed. At the end of fiscal year 2010, the outstanding face value of Treasury bills totaled roughly $1.8 trillion, represent-ing about 21 percent of all marketable Treasury debt.
Notes. The Treasury’s portfolio of notes has changed sig-nificantly over the past decade. At the beginning of 2000, following a string of annual surpluses, notes were offered only in maturities of 2, 5, and 10 years. In 2003, after two years of deficits, the 3-year note was reintroduced; in 2008, with debt continuing to grow, the Treasury rein-troduced the 7-year note. Notes are currently offered monthly in maturities of 2, 3, 5, and 7 years, and quar-
terly in a maturity of 10 years. In the months between the quarterly auctions, the 10-year notes are sold in a “reopening.”2 At the end of 2010, the outstanding value of notes was roughly $5.3 trillion, accounting for about 62 percent of all marketable debt.
Bonds. The Treasury temporarily stopped issuing bonds in 2001 in light of the improvement in the budget balance over the previous few years. That hiatus was short-lived, however, and in 2006 the Treasury announced that it would again offer 30-year bonds. Such bonds are now issued quarterly, with interim reopenings on a monthly basis. At the end of 2010, $846 billion in bonds was outstanding, representing about 10 percent of all marketable debt.
Treasury Inflation-Protected Securities. In 1997, the Trea-sury added TIPS to its auction schedule, beginning with-maturities of 10 and 30 years. It discontinued issuing 30-year TIPS in 2001, began issuing TIPS with maturi-ties of 5 and 20 years in 2004, but reverted to issuing 30-year TIPS in lieu of the 20-year security in 2010.
2. In a reopening, the Treasury issues an additional amount of a previously issued security. The reopened security has the same maturity date and interest rate as the original security but has a different issue date and, usually, a different purchase price.

CHAPTER ONE FEDERAL DEBT AND INTEREST COSTS 7
Table 1-1.
Schedule of Treasury Auctions of Marketable Debt
Source: Congressional Budget Office based on data from the Department of the Treasury.
Note: In a reopening, the Treasury issues an additional amount of a previously issued security. The reopened security has the same maturity date and interest rate as the original security but has a different issue date and, usually, a different purchase price.
a. The average amount issued in September 2010.
b. Interim reopenings were $21 billion each.
c. Interim reopenings were $13 billion each.
d. Interim reopening was $10 billion.
e. Interim reopenings were $10 billion each.
f. Interim reopening was $7 billion.
Timing of Auctions
One month (28 days) 52 Weekly 34 a
Three months (91 days) 52 Weekly 29 a
Six months (182 days) 52 Weekly 29 a
One year (364 days) 13 Every four weeks 25Cash management Variable As needed Variable
Two years 12 Monthly 37Three years 12 Monthly 33Five years 12 Monthly 36Seven years 12 Monthly 30Ten years 12 Quarterly, with interim reopenings 25 b
12 Quarterly, with interim reopenings 17 c
Treasury Inflation-Protected
Five years 2 Annually, with an interim reopening 11 d
Ten years 6 Semiannually, with interim reopenings 12 e
Thirty years 2 Annually, with an interim reopening 8 f
Type of Issue and Maturity
Bills
Notes
Bonds (Thirty years)
Securities
(Billions of dollars)Size of Recent Auctions
Issues per Year
Outstanding TIPS totaled $594 billion at the end of 2010, or about 7 percent of all marketable debt.
Maturity. The average remaining maturity of outstanding marketable securities has fluctuated over the past decade, from a high of almost 6 years at the end of 2000 to a low of close to 4 years in 2008 (Figure 1-4). Increased borrowing in notes and bonds raised the average maturity of outstanding debt to nearly 5 years at the end of 2010.
Seasonality. Federal borrowing has a pronounced seasonal pattern and is typically highest in the second quarter of the fiscal year (January through March) and lowest in the third quarter (April through June), coincid-
ing with the April deadline for filing individual income tax returns. That pattern is sometimes obscured by changes in fiscal policy and fluctuations in economic conditions; it can also be affected if the Congress fails to approve a higher debt ceiling sufficiently in advance to avoid disrupting Treasury auctions. (The debt ceiling is described in Chapter 2.)
Seasonal fluctuations in borrowing are more pronounced for Treasury bills than they are for notes and bonds (see Figure 1-5). Because bills are issued more frequently and have shorter maturities, the Treasury can quickly adjust the size of such auctions in response to fluctuations in the government’s funding requirements. Net issuance of bills
CBO

8 FEDERAL DEBT AND INTEREST COSTS
CBO
Figure 1-4.
Average Remaining Maturity of Marketable Public Debt, 2000 to 2010(Years)
Source: Congressional Budget Office based on data from the Department of the Treasury.
2000 2001 2002 2003 2004 2005 2006 2007 2008 2009 2010
0
4.0
4.5
5.0
5.5
6.0
(the amount of new issuances minus the amount of maturing bills) varies greatly from quarter to quarter. Including cash management bills, the net quarterly issu-ance of bills during the past five years has ranged from a net paydown of almost $200 billion to a net issuance of roughly $430 billion.
Nonmarketable Securities Nonmarketable securities are nontransferable debt instru-ments that are not traded in secondary markets. Savings bonds and securities issued to the federal government’s Thrift Savings Plan (TSP) and to state and local govern-ments account for most of the outstanding nonmarket-able securities; foreign and domestic zero-coupon bonds and other issues account for a much smaller portion.3 Unlike the issuance of marketable securities, which is directly tied to the size of the federal deficit, the issuance of nonmarketable securities depends on the demand for them by investors. From 2000 to 2001, for example, the government experienced a budget surplus, yet non-marketable debt grew from $374 billion to $386 billion. Outstanding nonmarketable debt totaled $526 billion at the end of 2010 (see Figure 1-2 on page 5; also see Table A-2 in the appendix for amounts outstanding for each type of security for the past 20 years).
3. Zero-coupon bonds do not provide coupon payments over the life of the security. Instead, they are sold at a discount to face value, and the full face value is paid at maturity.
Savings Bonds. Savings bonds originated in 1935 but became popular during World War II as a means of helping to finance the war effort. Formerly purchased out of a sense of patriotism, savings bonds are now generally purchased as gifts or through payroll deductions by indi-vidual investors; they come in several series with varying characteristics.4 The amount of outstanding savings bonds totaled almost $190 billion at the end of 2010.
EE/E Bonds. EE bonds are currently offered as coupon securities (if purchased electronically) and on a discount basis (if a paper version is purchased). Bonds sold as a coupon security accumulate interest in monthly install-ments and can earn interest for up to 30 years. Those sold as a discount security are purchased at half of their face value and are paid in full at maturity. The face value of outstanding EE bonds (and E bonds, their predecessors) totaled about $122 billion at the end of 2010.
Other Types of Savings Bonds. The Treasury also issues inflation-indexed savings bonds, known as the I series; about $41 billion in I bonds was outstanding at the end of 2010. The HH/H series, which was discontinued in 2004, makes coupon payments to bond holders every six months; the face value of outstanding HH/H bonds
4. For additional details on savings bonds, see Treasury Direct, “Products in Depth,” http://treasurydirect.gov/indiv/research/indepth/indepth.htm.

CHAPTER ONE FEDERAL DEBT AND INTEREST COSTS 9
Figure 1-5.
Quarterly Change in Outstanding Treasury Securities, 2005 to 2010(Billions of dollars)
Source: Congressional Budget Office based on data from the Department of the Treasury.
-300
-200
-100
0
100
200
300
400
500
-300
-200
-100
0
100
200
300
400
500Bills
-300
-200
-100
0
100
200
300
400
500
Notes and Bonds
Treasury Inflation-Protected Securities
2005 2006 2007 2008 2009 2010
2005 2006 2007 2008 2009 2010
2005 2006 2007 2008 2009 2010
CBO

10 FEDERAL DEBT AND INTEREST COSTS
CBO
totaled $9 billion at the end of 2010. Individual investors also hold savings bonds that have matured but have not been redeemed; those securities do not accrue any addi-tional interest. The outstanding amount of such bonds was about $16 billion at the end of 2010 (savings bonds that have matured are not included in the amounts listed for the various types of savings bonds).
State and Local Government Series. The Treasury offers state and local government series (SLGS) securities as part of its regulation of the tax-exemption privilege accorded to such governments. States and municipalities may issue tax-exempt bonds, which typically carry interest rates below those of taxable instruments, such as marketable Treasury securities or corporate bonds. In the absence of rules to the contrary, issuers of those tax-exempt bonds would have an incentive to borrow at tax-exempt rates and reinvest the funds at higher, taxable rates, thereby making a profit. To bar that practice, known as tax arbi-trage, federal law allows state and local governments to borrow only for legitimate public purposes (to build infrastructure, for example). However, funds that are bor-rowed for such purposes might sit idle for some time (before construction of infrastructure begins, say), so issuers are allowed to invest the funds in SLGS securities for that period without violating the ban on arbitrage. SLGS securities carry an interest rate of one basis point (one one-hundredth of a percentage point) below a Trea-sury security with a similar maturity. The Treasury also offers state and local governments the opportunity to place their funds in demand deposit accounts with the Treasury; interest accrues on those deposits each day, with the rate keyed to the yield in the most recent auction of the 3-month Treasury bill.5
Because of increased financial strain at the state and local level in recent years, demand for SLGS securities has declined substantially. In 2007, the face value of out-standing SLGS securities reached a peak of nearly $300 billion. By the end of 2010, their value had fallen to just over $190 billion, a 35 percent decrease since 2007.
Thrift Savings Plan. The TSP is a retirement savings program for civil service employees and members of the uniformed services. The TSP is designed to be similar to 401(k) plans found in the private sector by providing federal employees with opportunities to invest in funds that track different sorts of financial assets, including
5. Demand deposits may be withdrawn at any time without advance notice.
domestic and foreign equities, fixed-income securities, and U.S. government securities. Those government securities are nonmarketable Treasury securities issued specifically to the TSP. They have short maturities but earn a long-term interest rate equal to the weighted aver-age market yield on outstanding marketable Treasury securities with 4 or more years to maturity. In total, the value of those securities was $124 billion at the end of 2010.
Zero-Coupon Bonds and Other Nonmarketable Securities. The government issued zero-coupon bonds with a face value of $30 billion to the Resolution Fund-ing Corporation, a government-sponsored enterprise, as part of a plan to resolve the savings and loan crisis of the 1980s. The outstanding value of that issuance at the end of 2010 was $11 billion. The government also issued $14 billion in zero-coupon bonds to Argentina and Vene-zuela in the late 1980s to help ease their debt burden; less than $2 billion remained outstanding at the end of 2010. (The Treasury issued more than $30 billion in such bonds to Mexico; those bonds have already been paid off.) In addition, the federal government has numerous other small accounts with nonmarketable securities that totaled $7 billion in 2010. The total value of zero-coupon bonds and other nonmarketable securities was $20 billion at the end of 2010.
Reasons for Borrowing Other Than Budget DeficitsThe amount the Treasury borrows or redeems is deter-mined primarily by the budget deficit or surplus in a given year. However, other factors, collectively referred to as “other means of financing,” also affect the govern-ment’s need to borrow from the public. Before the recent financial crisis, those other factors had a relatively small effect on total borrowing—ranging, between 2000 and 2007, from a reduction of about $40 billion to an increase of roughly $60 billion. The effects on borrowing arose mostly from changes in the Treasury’s cash balances and from the differences between the cash flows associ-ated with federal credit programs and the costs of those programs on a present-value basis, which is how they are recorded in the budget.6 However, borrowing for reasons other than budget deficits rose sharply in 2008 and 2009
6. Present value is defined as a single number that expresses a flow of current and future income (or payments) in terms of an equivalent lump sum received (or paid) today.

CHAPTER ONE FEDERAL DEBT AND INTEREST COSTS 11
Table 1-2.
Deficits and Means of Financing, 2000 to 2010(Billions of dollars)
Source: Congressional Budget Office based on data from the Department of the Treasury and the Office of Management and Budget.
a. Negative numbers represent increases in cash balances.
b. Includes primarily cash flows for student loan programs, the Troubled Asset Relief Program, and purchases of mortgage-backed securities.
c. Negative numbers represent additional borrowing.
2000 2001 2002 2003 2004 2005 2006 2007 2008 2009 2010
Surplus or Deficit (-) 236 128 -158 -378 -413 -318 -248 -161 -459 -1,413 -1,294
4 8 -17 26 -1 1 -16 -23 -296 96 -35
-17 -46 -46 -21 32 21 28 -22 -13 -425 -145___ ___ ___ ___ ___ ___ ___ ___ ___ ____ ____Subtotal -14 -38 -63 5 31 22 11 -45 -309 -329 -180
223 90 -221 -373 -382 -297 -237 -206 -768 -1,742 -1,474from the Publicc
Other means of financing
Changes to the Treasury'scash balancea
Otherb
Net Treasury Borrowing
as a result of policies enacted during the financial crisis; specifically, additional borrowing by the Treasury totaled more than $300 billion each year for programs such as the Troubled Asset Relief Program (TARP) and the Supplementary Financing Program (SFP), which are discussed below. In 2010, the amount of borrowing for reasons other than the budget deficit totaled $180 billion, mainly to fund lending to students (see Table 1-2).
Credit Programs. The federal budget does not record the cash flows of federal credit programs; instead, it recognizes the net subsidy costs associated with such activities.7 Subsidy costs are the expected lifetime cost to the government of a loan, loan guarantee, or asset pur-chase and are recorded in the budget when the trans-action occurs. That treatment results in a disconnect between the budget and the Treasury’s borrowing, because the Treasury’s borrowing needs are determined by the cash flows of the transactions. For loans made directly by the government, for example, the amount the government must borrow is generally greater than the cost recorded in the budget; for a loan program with a 10 percent subsidy rate, the government might disburse $1,000 in cash for a loan and then receive cash repay-ments later, but the budget would record a $100 cost in the year of disbursement and nothing in future years
7. In this study, the term “credit programs” generally refers to direct loans and loan guarantees and to some purchases of financial assets (such as the acquisition of preferred stock by the TARP).
(unless the estimated subsidy rate turned out to be incorrect).
To reconcile those transactions, the government uses “credit financing accounts,” which are not part of the budget. Those accounts are credited with the program’s subsidy payments (that is, the subsidy amounts shown in the budget) and record all the cash flows associated with the program. If the financing accounts need up-front cash (for example, to cover disbursements on direct loans), those funds are borrowed from the Treasury, which in turn borrows them from the public.
Before the recent financial crisis, net cash flows through the financing accounts were relatively small and driven mainly by student loan programs. In 2009, net cash disbursements from the financing accounts increased substantially, exceeding $400 billion, mainly because of the TARP and the Treasury’s purchases of mortgage-backed securities (MBSs).8 Net cash disbursements in 2010 dropped to just over $150 billion, mostly for student loans (partially offset by repayments and dividends from recipients of TARP funds).
As of November 2010, three programs accounted for the vast majority of the outstanding debt used to finance
8. Mortgage-backed securities are issued by financial institutions to investors. The payments of interest and principal on the MBSs are backed by the payments on a package of mortgages.
CBO
12 FEDERAL DEBT AND INTEREST COSTS
CBO
government credit programs: student loans, the TARP, and purchases of MBSs by the Treasury.
Student Loans. The student loan program is the largest direct loan program administered by the federal govern-ment. Until recently, the Department of Education provided direct loans to students and also guaranteed loans made to students by lenders in the private sector. In March 2010, the Health Care and Education Reconcilia-tion Act of 2010 (Public Law 111-152) eliminated the program that provided federal guarantees for student loans, replacing future guarantees with direct loans made by the federal government.
The Treasury’s net borrowing needs for student loans are driven by the up-front disbursements and periodic repayments that are recorded in the financing accounts. The Congressional Budget Office (CBO) estimates that in 2011—the first full year in which direct loans are the only type being made—the Treasury’s net disbursements (total disbursements minus collections from existing loans) will exceed the subsidy cost recorded in the budget by $112 billion. More broadly, the shift to direct loans will increase the Treasury’s borrowing needs in the next several years as the loans are disbursed, but it will decrease net borrowing in later years as borrowers repay the inter-est and principal. Part of the additional borrowing also stems from defaults on outstanding guaranteed loans. CBO estimates that those guarantees will cost roughly $10 billion annually over the next 10 years.
Troubled Asset Relief Program. The Emergency Eco-nomic Stabilization Act of 2008 (Division A of P.L. 110-343) created a program, known as the TARP, to promote stability in financial markets by purchasing or guaranteeing up to $700 billion in “troubled assets.”9 The Treasury made large cash outlays to fund investments in financial institutions and certain other firms, and the estimated subsidy costs of those transactions were recorded in the budget. Therefore, the Treasury’s net bor-rowing needs at the outset of the program were signifi-cantly greater than the costs recorded in the budget. As of
9. The Dodd-Frank Wall Street Reform Act of 2010 (P.L. 111-203) reduced the Treasury’s authority under the TARP to $475 billion. For more information on the TARP, see Congressional Budget Office, Report on the Troubled Asset Relief Program—November 2010 (November 2010).
November 18, 2010, the Treasury had disbursed $389 billion to TARP participants, and $166 billion of that funding remained outstanding. Future dividend and interest payments to the Treasury and the proceeds from the sale of its investments in preferred stock are expected to reduce the Treasury’s borrowing needs over the next several years. (CBO now estimates that the net cost of the program will be about $25 billion.)
Purchases of Mortgage-Backed Securities. In September 2008, the Treasury announced that it would purchase MBSs from private holders to promote stability in the mortgage market and lessen upward pressure on mort-gage rates. The Treasury needed to borrow to finance the initial purchases of such securities, and it will receive cash payments of interest and principal while holding those securities; at the time of the purchase, however, the bud-get reflected only the estimated net earnings (which were subsequently updated and now total about $14 billion on a present-value basis) over the life of the program. In 2008 and 2009, the Treasury made net disbursements of $5 billion and $171 billion, respectively, for the MBS program. In 2010, net inflows related to MBS purchases yielded more than $3 billion in cash to the Treasury. CBO projects annual cash inflows of about $9 billion per year through 2020.
Supplementary Financing Program The SFP was established in September 2008 to help the Federal Reserve conduct monetary policy and stabilize the financial system during the financial crisis.10 The Treasury auctioned CMBs as part of its normal opera-tions and placed the cash raised into an account at the Federal Reserve. That account held more than $550 bil-lion in cash at its peak in November 2008, but the bal-ance had dropped to about $200 billion by the end of 2010. The deposits that built up the SFP account added to the Treasury’s borrowing requirements at the time, but the decline in the balance has reduced those requirements more recently; none of those cash flows affected the bud-get deficit. CBO anticipates that the SFP will be phased out in 2011.
10. For more information, see Federal Reserve Bank of New York, “Statement Regarding Supplementary Financing Program,” www.ny.frb.org/markets/statement_091708.html.

CHAPTER ONE FEDERAL DEBT AND INTEREST COSTS 13
Table 1-3.
Holders of Public Debt at the End of Fiscal Years 2005 and 2010
Source: Congressional Budget Office based on Board of Governors of the Federal Reserve System, Flow of Funds Accounts of the United States: Flows and Outstandings, December 9, 2010 (for domestic holders and total foreign holders), and Treasury International Capital Survey, November 16, 2010 (for individual foreign countries).
a. Data for foreign countries include holdings by individuals, businesses, and government entities. Data for individual foreign countries were estimated by the Federal Reserve on the basis of its survey of holdings.
b. Includes Algeria, Bahrain, Ecuador, Gabon, Indonesia, Iran, Iraq, Kuwait, Libya, Nigeria, Oman, Qatar, Saudi Arabia, the United Arab Emirates, and Venezuela.
Individuals 501 10.9 1,083 12.0Federal Reserve 736 16.0 812 9.0
311 6.8 775 8.6Mutual funds 238 5.2 603 6.7
448 9.8 509 5.6Other 367 8.0 977 10.8_____ ____ _____ ____
2,602 56.7 4,759 52.8
Foreign Holdersa
China 306 6.7 884 9.8Japan 673 14.7 865 9.6United Kingdom 96 2.1 459 5.1
66 1.4 231 2.6Brazil 28 0.6 165 1.8Other 822 17.9 1,656 18.4_____ ____ _____ ____
1,990 43.3 4,259 47.2
Total 4,592 100.0 9,018 100.0
Domestic Holders
State and local governments
Subtotal
Subtotal
2005
Pension and retirement funds
Oil exportersb
Percentageof Total
Billions of Dollars
Percentageof Total
Billions of Dollars
2010
Other Factors Affecting the Treasury’s BorrowingA few government agencies other than the Treasury issue their own debt; the Tennessee Valley Authority accounts for almost all of the $24 billion in non-Treasury debt included in debt held by the public at the end of 2010.11 Agencies’ borrowing affects the Treasury’s borrowing needs; all other things being equal, if agencies can borrow on their own behalf, then the Treasury does not need to do so. Other factors that the Treasury weighs when decid-ing how much to borrow include reductions (or increases) in its cash balances, changes in the amount of checks outstanding, and changes in accrued interest costs
11. Fannie Mae and Freddie Mac, both of which are in federal conser-vatorship, also are permitted to issue debt independently of the Treasury.
that are included in budget outlays but have not yet been paid.12
Ownership of Federal Debt Held by the Public Investors consider federal debt to be an attractive invest-ment because they view it as being essentially free of any risk of default. Treasury securities also are valued for their liquidity—they can be bought and sold quickly and in large quantities without affecting their price. Domestic investors owned about $4.8 trillion of debt held by the public outstanding at the end of 2010, and foreign investors owned about $4.3 trillion (see Table 1-3).
12. Unlike most other costs in the budget, interest costs are recorded as outlays when they accrue, not when they are paid.
CBO

14 FEDERAL DEBT AND INTEREST COSTS
CBO
Domestic Ownership. Domestic holdings of U.S. public debt have increased substantially in the past five years, from about $2.6 trillion in 2005 to $4.8 trillion in 2010. Individuals, including personal trusts and estates, own almost $1.1 trillion in Treasury securities, about 12 per-cent of the total.
A significant amount of federal debt is held by the Federal Reserve—the nation’s central bank and an inde-pendent entity within the government that is responsible for conducting monetary policy, among other activities. The Federal Reserve typically has implemented monetary policy by buying and selling securities issued by the Trea-sury in the open market (or by borrowing or lending with such securities as collateral).13 When the Federal Reserve wants to lower interest rates, it purchases Treasury securi-ties (or lends funds with Treasury securities as collateral), which raises the amount of funds available to banks for lending. Conversely, when the Federal Reserve wants to raise interest rates, it sells some of its holdings of securi-ties (or borrows funds with such securities as collateral). At the end of 2010, the Federal Reserve held $812 billion in outstanding Treasury securities, accounting for about 9 percent of debt held by the public. In 2005, it held $736 billion—a slightly smaller amount than in 2010 but a substantially higher percentage of the total (16 percent).
Other major holders of debt include pension and retirement funds, mutual funds, and state and local gov-ernments. Mutual funds’ holdings have grown the most rapidly of that group over the past five years, more than doubling from $238 billion in 2005 to $603 billion in 2010. Pension funds also boosted their holdings of Trea-sury securities, from $311 billion to $775 billion over the same period. State and local governments increased their holdings from $448 billion to $509 billion.
Foreign Ownership. Foreign holdings of U.S. debt also have increased substantially in the past five years, from about $2.0 trillion in 2005 to $4.3 trillion in 2010. As a percentage of debt held by the public, foreign holdings have edged up, from about 43 percent to about 47 per-cent, during that period. Overall, the central banks and private entities in China, Japan, and the United Kingdom
13. For information on other duties of the Federal Reserve, see Box 1 in Congressional Budget Office, The Budgetary Impact and Subsidy Costs of the Federal Reserve’s Actions During the Financial Crisis (May 2010). That study also discusses the other methods the Fed-eral Reserve has used to conduct monetary policy during the recent financial crisis and severe recession.
are the largest foreign investors, holding more than $2.2 trillion in Treasury securities, or nearly 25 percent of outstanding debt held by the public. Investors in China now hold significantly more debt than in earlier years, and the share of debt held by entities in Japan has declined noticeably. (Information about foreign holders of Treasury debt should be viewed as approximate. In many cases, it is impossible to accurately determine the home country of a foreign holder of U.S. securities because intermediaries may be involved in the custody, management, purchase, or sale of the securities.)
U.S. Debt Compared with That of Other CountriesCurrently, no measure of debt for other countries com-pletely mirrors U.S. debt held by the public. However, a calculation by the Organisation for Economic Co-operation and Development (OECD) of general govern-ment debt net of financial liabilities, although not a perfect equivalent to U.S. debt held by the public, histor-ically has been similar to that measure.14 Among the 33 OECD member countries, the 10 countries with the largest debt as a percentage of GDP had debt at the end of calendar year 2009 that ranged from about 40 percent of GDP for Iceland to more than 100 percent for Japan (see Figure 1-6). By comparison, the U.S. debt, as reported by the OECD, was 60 percent of GDP at the end of calendar year 2009—similar to that found in Hungary and Portugal.15
At the end of 2000, the U.S. debt—as calculated by the OECD—was equal to 35 percent of GDP, about 25 percentage points lower than in 2009. The increase in U.S. debt relative to GDP between 2000 and 2009 is larger than the growth seen in the United Kingdom (17 percentage points of GDP), France (16 percentage points), or Germany (14 percentage points) but smaller than increases in Japan (48 percentage points) and Portu-gal (30 percentage points).
14. For more information on general government debt net of financial liabilities, see Organisation for Economic Co-operation and Development, “EO Sources—Notes to statistical annex tables 25–33: Fiscal balances and public indebtedness,” Annex Table 33, www.oecd.org/document/25/0,3343,en_2649_34109_33702745_1_1_1_1,00.html.
15. U.S. debt held by the public was 53 percent of GDP at the end of fiscal year 2009. Using the OECD’s measure of debt—general government debt net of financial liabilities—that share was 60 percent at the end of calendar year 2009.

CHAPTER ONE FEDERAL DEBT AND INTEREST COSTS 15
Figure 1-6.
Debt of Selected Countries at the End of Calendar Year 2009(Percentage of gross domestic product)
Source: Congressional Budget Office based on data from the Organisation for Economic Co-operation and Development.
Iceland
United Kingdom
Germany
France
Portugal
Hungary
United States
Belgium
Greece
Italy
Japan
0 20 40 60 80 100 120
CBO

CH A P T E R
2Other Measures of Federal Debt
A number of other measures of federal debt are used for various purposes. Two important purposes are to assess the impact of borrowing by the federal government on financial markets and to assess the government’s over-all financial condition.
Regarding the first purpose, assessing the impact of the government’s borrowing on financial markets is necessary for determining how the government is affecting the availability of funds for other borrowers. One measure of federal borrowing—debt held by the public—provides a straightforward assessment of that borrowing and cap-tures most of the impact on the availability of funds for other borrowers; it is roughly equivalent to the sum of all previous annual budget deficits minus surpluses (see Chapter 1). All else being equal, an increase in the gov-ernment’s borrowing reduces the funds available for others, putting upward pressure on interest rates and reducing private investment.
Another measure—debt held by the public net of finan-cial assets—is a more complicated measure; it reflects the fact that when the government lends money or acquires financial assets, such as debt and equity securities issued by private firms, those funds flow into investment activi-ties. Therefore, that measure subtracts from debt held by the public the value of assets the government has acquired through its various lending activities and through efforts to address the recent financial crisis. Debt held by the public net of financial assets provides a more comprehen-sive picture of the government’s financial condition and its overall impact on credit markets than does debt held by the public. Calculating that measure is not straight-forward, however, because neither the universe of such assets nor the method for valuing them is well defined.
Another important purpose for which measures of debt are helpful is to assess the government’s overall financial condition, taking into account not only debt that the
government has already incurred (and the assets it has purchased) but also commitments the government has made for the future. Debt held by the public, with or without an adjustment for the government’s financial assets, does not account for future obligations. Assessing the government’s future financial status requires addi-tional information. Measures that have been used for that purpose include gross federal debt and debt subject to limit; however, two other measures—projected changes in debt held by the public as a share of gross domestic product and the fiscal gap—provide a clearer picture of the government’s future obligations.
Gross debt equals federal debt held by the public plus Treasury securities held by federal trust funds and other government accounts. That measure is not a good indica-tor of the government’s future obligations because the value of Treasury securities held by trust funds and other government accounts measures only some of the commit-ments the government has made for the future, and it includes some amounts that may not represent future commitments at all. Moreover, those securities represent internal transactions of the government and thus have no direct effect on credit markets.
Debt subject to limit is the amount of gross federal debt subject to the ceiling on the issuance of debt established by law. It differs in only small ways from gross federal debt. It too includes internal transactions of the govern-ment that have no direct effect on credit markets and is not a meaningful measure of the government’s future commitments.
Measures that explicitly account for the government’s future fiscal condition are better indicators of that condi-tion than are either gross debt or debt subject to limit. One useful barometer is projections of changes in debt held by the public relative to gross domestic product; such projections indicate whether the government’s
CBO

18 FEDERAL DEBT AND INTEREST COSTS
CBO
participation in credit markets is expected to grow faster or slower than economic output. Another useful gauge is the fiscal gap, which measures the immediate change in spending or revenues that would be necessary to make the projected debt-to-GDP ratio the same at the end of a given period as at the beginning of the period. The fiscal gap quantifies the projected long-term shortfall of reve-nues relative to outlays in present-value terms—that is, as a single number that describes a set of future flows in terms of an equivalent lump sum received or spent today. Those two measures are not addressed in this report but are used extensively in other Congressional Budget Office publications.1
Debt Held by the Public Net of Financial Assets Until a few years ago, financial assets held by the government were relatively small and largely composed of the Treasury’s cash balances, loans made by various federal credit programs, and private equities owned by the National Railroad Retirement Investment Trust. Dur-ing the past five years, however, the volume of direct loans made to students—which represent an asset to the government in the form of future payments of principal and interest—has more than doubled, and it is projected to expand greatly in the next decade. In addition, the government’s holdings of financial assets grew substan-tially during the recent financial crisis.
The assets the government has acquired affect its financial position, and the effect can be viewed in several ways. If those assets are sold, the proceeds can be used to pay down a portion of the federal debt. If, instead, the gov-ernment retains those assets, they will generate inflows from interest, dividends, and repayments of principal that will reduce the government’s future need to borrow.
Because federal asset holdings have increased relative to debt held by the public, debt held by the public net of financial assets has taken on increased importance as a measure of the government’s financial position. In total, at the end of 2010, the government held financial assets with an estimated value of more than $1 trillion.2 Sub-tracting that amount from the $9.0 trillion in debt held by the public results in debt held by the public net of
1. See, for example, Congressional Budget Office, The Long-Term Budget Outlook (June 2010, revised August 2010).
financial assets of about $8.0 trillion. Debt held by the public is currently equal to about 62 percent of GDP, and debt net of financial assets amounts to about 55 percent of GDP. A difference of 5 to 8 percentage points between the two measures persists through 2020 in CBO’s most recent baseline projections (see Table 2-1).
CashOne of the largest financial assets that the Treasury currently holds is cash. The Treasury’s cash flows fluctu-ate during the year according to the timing of tax collec-tions and spending; as a result, the Treasury maintains deposits of varying amounts at the Federal Reserve and in banks throughout the country. Between 2000 and 2007, the Treasury ended the fiscal year with an average balance of about $50 billion. However, balances have been much higher over the past three years because, since September 2008, the Treasury has deposited additional funds with the Federal Reserve to help it conduct monetary policy and stabilize the financial system. The balance for the Treasury’s deposits through that program—known as the Supplementary Financing Program—reached a high of more than $550 billion in November 2008. As of the end of 2010, the SFP had a balance of $200 billion and the Treasury’s total operating cash balance was $310 billion. CBO expects that the SFP will be eliminated by the end of 2011.
Credit Programs The value of loans, guarantees, and asset purchases of federal credit programs at the end of 2010 totaled $712 billion. That amount represents the present value of the expected future cash flows from those assets and obli-gations. For loan guarantees—such as those made by the Federal Housing Administration—the present value is based on expected income from fees to be received net of payouts to cover losses from defaults. The value of direct loans and asset purchases totaled $745 billion at the end of 2010; that amount was partially offset by net liabilities of $32 billion from guaranteed loan programs.
2. That total does not include assets held by the Federal Reserve. Because of its need for flexibility and independence in setting monetary policy, the Federal Reserve is not part of the executive branch but is considered an independent entity within the govern-ment; its receipts and expenditures are not included directly in the federal budget, although it remits its excess earnings to the Treasury.

CHAPTER TWO FEDERAL DEBT AND INTEREST COSTS 19
Table 2-1.
CBO’s Projections of Debt Held by the Public Net of Financial Assets, 2010 to 2020
Sources: Congressional Budget Office; Department of the Treasury.
a. Includes other cash and monetary assets (mostly related to transactions with the International Monetary Fund) offset by liabilities such as interest accrued but not yet paid to the public.
Actual2010 2011 2012 2013 2014 2015 2016 2017 2018 2019 2020
Debt Held by the Public 9,018 9,958 10,742 11,373 11,902 12,495 13,165 13,837 14,497 15,232 16,024
Financial Assets (Net of liabilities)Treasury's operating cash balance 310 40 40 40 40 40 40 40 40 40 40Credit programs
Department of Education programs 341 453 564 670 769 868 964 1,060 1,159 1,263 1,374Mortgage-backed securities 173 164 156 148 141 134 127 121 115 109 103Troubled Asset Relief Program 122 97 82 67 52 37 22 7 0 0 0Other 77 95 118 134 144 153 156 160 168 177 185___ ___ ___ ____ ____ ____ ____ ____ ____ ____ ____
Subtotal, credit programs 712 809 921 1,019 1,106 1,192 1,269 1,347 1,442 1,549 1,663
National Railroad Retirement Investment Trust 21 19 18 17 15 14 13 12 10 9 8
Othera -29 -29 -29 -29 -29 -29 -29 -29 -29 -29 -29_____ _____ _____ _____ _____ _____ _____ _____ _____ _____ _____Total 1,014 840 950 1,046 1,132 1,217 1,293 1,370 1,463 1,569 1,681
Debt Held by the Public Net of Financial Assets 8,003 9,119 9,793 10,327 10,770 11,279 11,873 12,467 13,034 13,663 14,343
Debt Held by the Public 62.2 65.7 68.1 68.1 67.0 67.1 67.5 67.8 68.1 68.6 69.2Debt Held by the Public Net of Financial Assets 55.2 60.2 62.1 61.8 60.6 60.5 60.9 61.1 61.2 61.5 61.9
In Billions of Dollars
As a Percentage of Gross Domestic Product
Most of the government’s direct loans are made by the Department of Education to students pursuing post-secondary education. At the end of 2010, based on data reported by the Department of the Treasury, the esti-mated value of student loans outstanding was $341 bil-lion. CBO projects that, with the recent expansion of that program in the Health Care and Education Recon-ciliation Act of 2010 (P.L. 111-152), those assets will grow to nearly $1.4 trillion by the end of 2020.
To help promote stability in the mortgage market and lessen upward pressure on mortgage rates, from Septem-ber 2008 to December 2009 the Treasury purchased mortgage-backed securities issued by Fannie Mae and Freddie Mac in the open market. Those securities, which have various maturity dates, generate payments of interest and principal. CBO assumes that the Treasury will hold those securities until they mature. Overall, the Treasury purchased more than $200 billion in such securities; the
present value of the remaining holdings was $173 billion at the end of 2010.
As part of its activities related to the recent financial crisis, the Treasury also acquired numerous assets through the Troubled Asset Relief Program. Such assets were valued by the Treasury (using a present-value calculation that includes an adjustment for market risk) at $122 bil-lion at the end of 2010. The assets were obtained through three kinds of transactions:
Capital purchases and other support for financial institutions;
Financial assistance to automakers and related businesses; and
Investment partnerships designed to increase liquidity in the securitization markets.
CBO

20 FEDERAL DEBT AND INTEREST COSTS
CBO
The three largest sets of assets outstanding are preferred stock and warrants obtained in the Capital Purchase Program, securities of the American International Group, and securities of the automotive industry.3 The Treasury expects that a large share of those assets will eventually be repurchased by the issuers or sold to other market participants.
The outstanding value of assets related to other credit activities is projected to increase from $77 billion in 2010 to $185 billion in 2020. Those totals include other direct loan programs (such as those for rural areas and small businesses) and guaranteed loan programs (such as those for housing).
Gross Federal DebtIn addition to selling securities to the public, the Treasury issues securities to various accounts of the federal govern-ment. Gross federal debt consists of the debt held by the public plus debt issued to such government accounts.
Trust funds hold about 90 percent of the debt issued to government accounts. Although trust funds are desig-nated as such by law, there is no substantive difference between them and other types of funds. Those other types include special funds (such as the fund the Depart-ment of Defense uses to finance its health care program for military retirees), revolving funds (such as the Federal Employees’ Group Life Insurance fund), and public enterprise funds (such as the Postal Service fund). All of the major trust funds in the budget and many other gov-ernment funds invest in special, nonmarketable Treasury securities known as the government account series.
At the end of 2010, gross federal debt totaled $13.5 trillion—about $9.0 trillion in debt held by the public and $4.5 trillion in debt held by government accounts. CBO projects that, under current law, gross federal debt will increase in every year of the 2011–2020 period, reaching $23.1 trillion in 2020 (see Table 2-2). That increase stems primarily from the projected growth in debt held by the public, which is projected to exceed $15.2 trillion by the end of that year.
3. For more information on the TARP, see Chapter 1 of this report and Congressional Budget Office, Report on the Troubled Asset Relief Program—November 2010 (November 2010).
The largest balances among the government accounts are in the two Social Security trust funds—the Old-Age and Survivors Insurance and Disability Insurance trust funds. By the end of 2010, those trust funds had accrued close to $2.6 trillion; in CBO’s projections, that combined balance rises to $3.8 trillion by the end of 2020 (see Table 2-3). In addition, the retirement funds for federal civilian and military employees held a combined $1.1 trillion in government account securities at the end of 2010; those balances will increase to slightly more than $2 trillion over the next 10 years, CBO projects. By the end of 2020, the total balance of all trust funds will climb to more than $6 trillion, and the total held by all govern-ment accounts will reach $7 trillion.
Because the trust funds are part of the federal govern-ment, transactions between them and the Treasury are intragovernmental and have no net effect on federal bor-rowing from the public or on the total budget. Different sorts of transactions occur: Any surplus cash flow during the year from the activities of a program with a trust fund is retained by the Treasury, and the trust fund is credited with a corresponding amount of nonmarketable Treasury securities. The Treasury then uses the cash to finance the government’s ongoing activities. When a trust fund’s expenses exceed its cash income, the agency administer-ing the trust fund redeems its Treasury securities for cash as needed; the Treasury must obtain that cash from tax revenues or other sources of income or by borrowing from the public. In addition, most securities in the gov-ernment account series earn interest at rates similar to those on publicly issued debt, and the Treasury issues additional debt to the trust funds in the amount of the interest payments. However, the issuance of the securities, the payments of interest, and any other transactions between the Treasury and the trust funds have no net effect on the budget.
Federal trust funds, then, are essentially an accounting mechanism. The balances in the trust funds (in the form of government securities) are assets to the individual pro-grams (such as Social Security) but liabilities to the rest of the government. The resources to redeem government securities in the trust funds and thereby pay for benefits or other spending in some future year must be generated from taxes, income from other government sources, or borrowing from the public in that year. Trust funds have an important legal meaning in that their balances are a measure of the amounts that the government has the legal authority to spend for certain purposes under current

CHAPTER TWO FEDERAL DEBT AND INTEREST COSTS 21
Table 2-2.
CBO’s Projections of Federal Debt, 2010 to 2020(Billions of dollars)
Source: Congressional Budget Office.
a. Differs from gross federal debt primarily because most debt issued by agencies other than the Treasury and the Federal Financing Bank is excluded from the debt limit. The current limit is $14,294 billion.
Actual2010 2011 2012 2013 2014 2015 2016 2017 2018 2019 2020
Debt Held by the Public at the Beginning of the Fiscal Year 7,545 9,018 9,958 10,742 11,373 11,902 12,495 13,165 13,837 14,497 15,232
Changes to Debt Held by the PublicDeficit 1,294 1,066 665 525 438 507 585 579 562 634 685
179 -126 118 107 90 86 86 93 99 101 107____ ____ ___ ___ ___ ___ ___ ___ ___ ___ ___
Debt Held by the Public at theEnd of the Fiscal Year 9,018 9,958 10,742 11,373 11,902 12,495 13,165 13,837 14,497 15,232 16,024
Debt Held by Government Accounts 4,509 4,638 4,803 5,002 5,236 5,510 5,796 6,095 6,413 6,740 7,062____ ____ ____ ____ ____ ____ ____ ____ ____ ____ _____
Gross Federal Debt 13,527 14,596 15,545 16,376 17,138 18,005 18,961 19,932 20,911 21,972 23,086
Debt Subject to Limita 13,511 14,581 15,530 16,361 17,123 17,992 18,948 19,919 20,898 21,960 23,073
Memorandum:Debt Held by the Public as a Percentage of Gross Domestic Product 62.2 65.7 68.1 68.1 67.0 67.1 67.5 67.8 68.1 68.6 69.2
Other means of financing
law, but they have little relevance in an economic or budgetary sense.
More than 200 trust funds exist in the federal budget, but the bulk of holdings of government securities is concen-trated in just a few funds. Most of the difference between gross federal debt and debt held by the public is that the former includes balances held by the Social Security trust funds. Those balances reflect a decision by policymakers to set the payroll tax dedicated to Social Security over the past few decades such that the program’s revenues would be greater than the program’s outlays in anticipation of rising benefit costs as the baby-boom generation retires. The debt held by those trust funds measures the amount by which Social Security revenues have exceeded outlays in the past, but it does not measure the program’s future financial burden. Even with the securities held by the trust funds and with a dedicated future stream of reve-nues, by 2039 those resources will be insufficient to pay the full benefits that will accrue under current law, CBO projects. At the same time, the balances in the Social Security trust funds have significant legal implications: By law, total Social Security benefits cannot exceed
amounts available in the trust funds, and the benefits projected to be paid will be smaller in 2039 and beyond than the benefits specified in law.4
Beyond Social Security, the amount of government debt held by trust funds and other government accounts bears even less of a relationship to the government’s future financial burdens: For example, the Medicare program holds little government debt relative to its expected future costs.
Debt Subject to LimitThe Congress has traditionally placed a limit on the amount of debt the Treasury can issue. Before World War I, the Congress generally had to approve each sepa-rate debt issue. Since the passage of the Second Liberty Bond Act in 1917, the limit has gradually evolved into an overall dollar ceiling on debt. The modern concept of debt subject to limit was created in 1941, when the
4. See Congressional Budget Office, Social Security Policy Options (July 2010).
CBO
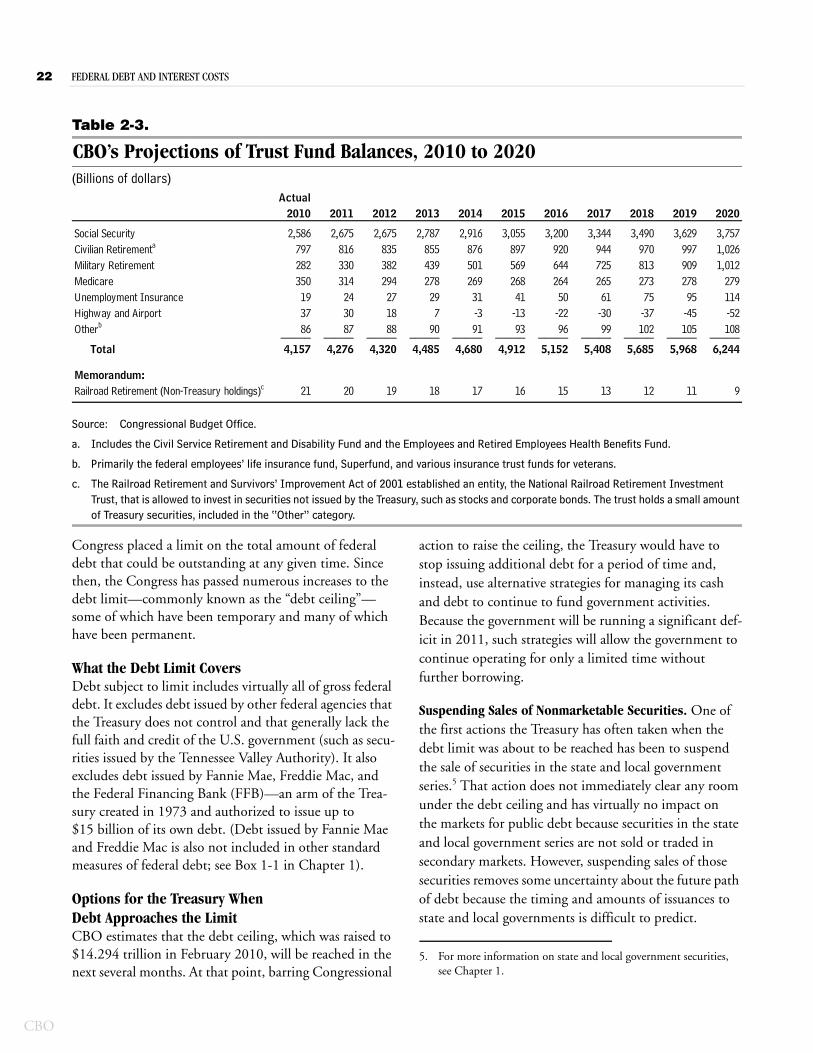
22 FEDERAL DEBT AND INTEREST COSTS
CBO
Table 2-3.
CBO’s Projections of Trust Fund Balances, 2010 to 2020(Billions of dollars)
Source: Congressional Budget Office.
a. Includes the Civil Service Retirement and Disability Fund and the Employees and Retired Employees Health Benefits Fund.
b. Primarily the federal employees’ life insurance fund, Superfund, and various insurance trust funds for veterans.
c. The Railroad Retirement and Survivors’ Improvement Act of 2001 established an entity, the National Railroad Retirement Investment Trust, that is allowed to invest in securities not issued by the Treasury, such as stocks and corporate bonds. The trust holds a small amount of Treasury securities, included in the “Other” category.
Actual2010 2011 2012 2013 2014 2015 2016 2017 2018 2019 2020
Social Security 2,586 2,675 2,675 2,787 2,916 3,055 3,200 3,344 3,490 3,629 3,757Civilian Retirementa 797 816 835 855 876 897 920 944 970 997 1,026Military Retirement 282 330 382 439 501 569 644 725 813 909 1,012Medicare 350 314 294 278 269 268 264 265 273 278 279Unemployment Insurance 19 24 27 29 31 41 50 61 75 95 114Highway and Airport 37 30 18 7 -3 -13 -22 -30 -37 -45 -52Otherb 86 87 88 90 91 93 96 99 102 105 108_____ _____ _____ _____ _____ _____ _____ _____ _____ _____ _____
Total 4,157 4,276 4,320 4,485 4,680 4,912 5,152 5,408 5,685 5,968 6,244
Memorandum:Railroad Retirement (Non-Treasury holdings)c 21 20 19 18 17 16 15 13 12 11 9
Congress placed a limit on the total amount of federal debt that could be outstanding at any given time. Since then, the Congress has passed numerous increases to the debt limit—commonly known as the “debt ceiling”—some of which have been temporary and many of which have been permanent.
What the Debt Limit CoversDebt subject to limit includes virtually all of gross federal debt. It excludes debt issued by other federal agencies that the Treasury does not control and that generally lack the full faith and credit of the U.S. government (such as secu-rities issued by the Tennessee Valley Authority). It also excludes debt issued by Fannie Mae, Freddie Mac, and the Federal Financing Bank (FFB)—an arm of the Trea-sury created in 1973 and authorized to issue up to $15 billion of its own debt. (Debt issued by Fannie Mae and Freddie Mac is also not included in other standard measures of federal debt; see Box 1-1 in Chapter 1).
Options for the Treasury When Debt Approaches the LimitCBO estimates that the debt ceiling, which was raised to $14.294 trillion in February 2010, will be reached in the next several months. At that point, barring Congressional
action to raise the ceiling, the Treasury would have to stop issuing additional debt for a period of time and, instead, use alternative strategies for managing its cash and debt to continue to fund government activities. Because the government will be running a significant def-icit in 2011, such strategies will allow the government to continue operating for only a limited time without further borrowing.
Suspending Sales of Nonmarketable Securities. One of the first actions the Treasury has often taken when the debt limit was about to be reached has been to suspend the sale of securities in the state and local government series.5 That action does not immediately clear any room under the debt ceiling and has virtually no impact on the markets for public debt because securities in the state and local government series are not sold or traded in secondary markets. However, suspending sales of those securities removes some uncertainty about the future path of debt because the timing and amounts of issuances to state and local governments is difficult to predict.
5. For more information on state and local government securities, see Chapter 1.

CHAPTER TWO FEDERAL DEBT AND INTEREST COSTS 23
Trimming or Delaying Auctions of Marketable Securities. In the weeks leading up to a point at which the debt would reach the limit, the Treasury may pare back auc-tion amounts for marketable securities or postpone one or more auctions. Although the delay of a small number of auctions in the past has not led to significant increases in the cost of borrowing, continuous delays could adversely affect the willingness of credit markets to absorb the issuance of debt.
Suspending Issuance of Maturing Cash Management Bills in the Supplementary Financing Program. The Trea-sury currently has $200 billion outstanding in cash man-agement bills allocated to the SFP. If total borrowing approached the debt limit, the Treasury could decide not to refinance those bills when they mature. That option would give the Treasury up to an additional $200 billion in borrowing room.
Suspending Flows and Redeeming Securities in Government Accounts. When the debt limit is close to being reached, the Treasury has the option to delay the addition of deposits to certain accounts and to redeem securities in three funds: the Thrift Savings Plan’s G Fund, the Civil Service Retirement and Disability Fund (CSRDF), and the Exchange Stabilization Fund (ESF).6 Because the G Fund is invested in 1-day securi-ties, the Secretary of the Treasury is able, at any time, to disinvest up to the full balance of the fund (that is, to withdraw or reduce the balance); that balance was $124 billion at the end of 2010. The CSRDF has special rules regarding balances and how they can be disinvested;
6. The TSP is a retirement program for federal employees similar to a private-sector 401(k) plan; the G Fund is one component of the TSP and is solely invested in Treasury securities. The CSRDF is the trust fund for federal employees’ retirement plans. The ESF is a fund controlled by the Treasury for the purpose of stabilizing exchange rates.
the amount that can be redeemed early cannot exceed the amount of benefit payments expected during the period until a new debt ceiling is enacted. The Treasury also can suspend investment of all additional receipts to the fund if they will cause a breach of the debt limit. The ESF currently holds $20 billion in Treasury securities, which the Treasury can decide not to reinvest when they mature. After the debt limit has been raised, the Treasury must restore any losses of interest (as well as principal) to the G Fund and CSRDF but has no such obligation to the ESF.
Swapping Debt with the Federal Financing Bank. Debt issued by the FFB, which cannot exceed $15 billion, is not subject to the debt limit.7 The Treasury can swap securities that are counted toward the debt limit for secu-rities issued by the FFB, thus decreasing the debt subject to limit, and has used that option in the past. About $10 billion in outstanding FFB securities are currently held by the CSRDF; issuing an additional $5 billion in FFB securities to that fund in exchange for Treasury secu-rities would currently give the Treasury about $5 billion of additional room for borrowing from the public.
Consequences of Having a Limit on DebtBy itself, setting a limit on the debt is an ineffective means of controlling deficits because the decisions that necessitate borrowing are made through other legislative actions. By the time an increase in the debt ceiling comes up for approval, it is too late to avoid paying the govern-ment’s pending bills without incurring serious negative consequences. However, because increases in the debt limit have been essential, the process of considering such increases tends to bring debt levels to the forefront of policy debate.
7. For more information on the Federal Financing Bank, see Chapter 3.
CBO


CH A P T E R
3Interest Payments and Receipts
The government pays and collects interest in various ways; its net interest outlays are equal to interest paid minus interest received. Net interest outlays are domi-nated by the interest paid to holders of the debt that the Department of the Treasury issues to the public. The Treasury also issues debt to trust funds and other federal government accounts, but the payment of interest to those accounts is an intragovernmental transaction that has no effect on net interest and no effect on the budget deficit. Other federal accounts also pay and receive interest for a variety of reasons.
Historical and Projected Net Interest OutlaysThe federal government’s net interest payments depend primarily on interest rates and the amount of debt held by the public. Other factors, such as the rate of inflation and the maturity structure of outstanding securities, also affect interest costs (for example, long-term bonds gener-ally carry higher interest rates than do short-term bills). Interest rates are determined by a combination of market forces and the policies of the Federal Reserve. Debt held by the public is mostly determined by cumulative budget deficits, which reflect policy choices about spending and revenues, economic conditions, and other factors. The maturity structure of the debt is determined by the bor-rowing policy implemented by the Treasury, which issues a variety of short- and long-term debt securities (as described in Chapter 1).
Historical Trends in Net Interest OutlaysNet interest outlays as a percentage of gross domestic product have fluctuated over the past 40 years, from a low of 1.3 percent to a high of 3.3 percent (see Figure 3-1). Through most of the 1970s, net interest totaled no more than 1.5 percent of GDP. At the end of that decade, how-ever, the growing amount of debt relative to the size of the economy and higher real (inflation-adjusted) interest
rates began to boost interest costs; by 1985, net interest outlays as a percentage of GDP were twice as large as they had been in the mid-1970s. For the following decade, net interest payments remained at about 3 percent of GDP, but narrower budget deficits (and then surpluses) and lower interest rates for many securities pushed that figure down in the late 1990s. Net interest outlays continued to decline as a percentage of GDP in the early 2000s, returning to a level similar to that in the early 1970s.
Although debt held by the public has surged in the past few years to its highest level relative to GDP since the early 1950s, net interest outlays have remained low rela-tive to GDP because interest rates on Treasury securities have fallen to remarkably low levels (see Figure 3-2). Rates on 3-month Treasury bills plummeted from an average of almost 5 percent in 2007 to an average of just over 0.1 percent in 2010. Similarly, rates on 10-year Treasury notes and 30-year bonds have dropped from an average of close to 5 percent in 2007 to an average of about 3 percent and 4 percent, respectively, in 2010. As a result, despite the dramatic increase in debt held by the public—from 36 percent of GDP at the end of 2007 to 62 percent at the end of 2010—net interest outlays as a percentage of GDP fell from 1.7 percent in 2007 to 1.3 percent in 2009 and rose only marginally, to 1.4 percent, in 2010.
CBO’s Baseline ProjectionsUnder the Congressional Budget Office’s August 2010 baseline budget projections, which reflect the assumption that current laws and policies affecting the budget will remain unchanged, growing debt and rising interest rates are projected to substantially boost the cost of interest on the government’s debt.1 In those projections, debt held by
1. See Congressional Budget Office, The Budget and Economic Outlook: An Update (August 2010).
CBO

26 FEDERAL DEBT AND INTEREST COSTS
CBO
Figure 3-1.
Net Interest, 1970 to 2020(Percentage of gross domestic product)
Source: Congressional Budget Office; historical data are based on information from the Office of Management and Budget.
1970 1975 1980 1985 1990 1995 2000 2005 2010 2015 2020
0
0.5
1.0
1.5
2.0
2.5
3.0
3.5Actual Projected
Average Net Interest, 1970–2009
the public increases to almost 70 percent in 2020. More-over, interest rates climb from their current levels to levels similar to those in the late 1990s. The rate on 3-month Treasury bills is forecast to increase from an average of about 0.2 percent in 2010 to 5.0 percent in 2016 and then to stay at that rate through 2020. The rate on 10-year Treasury notes is projected to rise from an average of 3.4 percent in 2010 to 5.9 percent in 2016 and to remain there through the end of the decade.
Given those projections, spending on net interest would rise from $197 billion in 2010 to $778 billion in 2020 (see Table 3-1). Relative to GDP, net interest outlays would increase to 3.4 percent in 2020, more than double the percentage in 2010 and the highest percentage since 1991 (see Figure 3-1).
Alternative ScenariosFuture interest rates and deficits are uncertain and will be affected by legislative actions, economic developments, and other factors. To illustrate how changes in those vari-ables would affect interest costs, CBO has estimated those costs under different assumptions regarding interest rates and future deficits.2
Higher Interest Rates. Interest rates on government secu-rities that were higher than CBO projects would raise interest outlays on new borrowing and on debt that must be refinanced. If interest rates for all newly issued
Treasury securities were 1 percentage point higher in each year than the rates in the August baseline, net interest payments would be higher in each year of the projection period, CBO estimates, by amounts rising from $13 bil-lion in 2011 to $185 billion in 2020. From 2011 through 2020, interest costs would be higher by more than $1 tril-lion (see Table 3-2). (Lower interest rates would have the opposite effect.)
That increase in interest payments would stem from two sources: the cost of applying higher rates to the debt pro-jected in the baseline (the direct effect) and the interest paid on the additional sums borrowed to pay those higher rates. The $13 billion in additional outlays in 2011 would stem mostly from the direct effect on rates. Of that amount, more than $8 billion would be attributable to short-term securities and $4 billion to medium- and long-term securities (including savings bonds and state and local government securities).3 In later years, the
2. The alternative scenarios do not take into account any changes in GDP, inflation, or other economic factors; as a result, revenues and noninterest outlays are unchanged. The interest-rate scenario also does not reflect the effect of higher interest rates on interest-sensitive programs, such as student loans.
3. Changes in interest rates have the greatest impact on shorter-term securities in the first year because those securities will be refi-nanced much more often in that year than will medium- and long-term securities. Within a given year, all bills outstanding will have to be refinanced at least once.

CHAPTER THREE FEDERAL DEBT AND INTEREST COSTS 27
Figure 3-2.
Interest Rates on Three-Month Treasury Bills and Ten-Year Treasury Notes, 1970 to 2020(Percent)
Source: Congressional Budget Office; historical data are based on information from the Federal Reserve.
1970 1975 1980 1985 1990 1995 2000 2005 2010 2015 2020
0
2
4
6
8
10
12
14
16Actual Projected
Three-Month Treasury Bills
Ten-Year Treasury Notes
effect of a change in rates would become much more pro-nounced for medium- and long-term securities. Added interest for those securities would amount to $605 billion over the period, compared with $220 billion for short-term securities. The larger deficits generated by the higher interest payments would require the Treasury to borrow additional funds. That extra borrowing would result in further increases in the annual cost of servicing the debt, which would grow to $50 billion in 2020 and would total $185 billion over the 10-year period.
Additional Borrowing. If budget deficits were higher than CBO projects, net interest payments also would be higher. (Lower deficits would have the opposite effect.) To illustrate the effect of higher deficits (and therefore higher debt) on interest costs, CBO estimated the impact of two different increases in the government’s borrowing.
First, CBO examined a $100 billion increase in borrow-ing in 2011. That borrowing also would boost interest outlays in the same year by $1 billion, excluding any potential effects on interest rates. The effect of that addi-tional borrowing would increase interest outlays by a cumulative total of $43 billion from 2011 through 2020. (Costs in later years would stem from the compounding effect of increasing the debt in 2011.)
Second, the agency calculated the effect on interest payments of borrowing that was $100 billion greater in each year of the projection period (excluding additional interest costs). That borrowing would lead to additional interest outlays of $272 billion over the 10-year period, if interest rates were not affected.
Gross Interest on Treasury Debt SecuritiesIn 2010, interest paid by the Treasury on all of its debt issuances totaled $413 billion (see Table 3-1). Nearly half of that total represents payments to other entities (such as trust funds) within the federal government; the remainder is paid to owners of Treasury debt issued to the public. CBO projects that, under current law, gross interest will exceed $1.1 trillion by 2020; the majority of that growth stems from increased interest paid on debt held by the public, which is projected to almost quadru-ple under current law during the coming decade.
Interest Received by Trust FundsFederal trust funds and other government accounts hold about $4.5 trillion in Treasury securities; more than 90 percent of that total is held by trust funds. Similar in composition to debt held by the public, the securities held by trust funds and other government accounts
CBO

28 FEDERAL DEBT AND INTEREST COSTS
CBO
Table 3-1.
CBO’s Baseline Projections of Federal Interest Outlays, 2010 to 2020(Billions of dollars)
Source: Congressional Budget Office.
Note: * = between -$500 million and zero.
a. Gross interest is the total interest paid by the Treasury; it does not include interest costs on debt issued by agencies other than the Treasury (primarily the Tennessee Valley Authority).
b. Mainly the Civil Service Retirement, Military Retirement, Medicare, and Unemployment Insurance trust funds.
c. Primarily interest from the financing accounts for federal credit programs.
d. Earnings on private investments by the National Railroad Retirement Investment Trust.
Actual 2011- 2011-2010 2011 2012 2013 2014 2015 2016 2017 2018 2019 2020 2015 2020
413 438 463 543 637 739 835 915 995 1,070 1,149 2,820 7,783
-119 -116 -114 -116 -122 -130 -140 -152 -163 -175 -186 -598 -1,415-67 -67 -55 -59 -52 -54 -55 -55 -61 -65 -70 -287 -593___ ___ ___ ___ ___ ___ ___ ___ ___ ___ ___ ___ _____
-186 -183 -169 -174 -174 -184 -195 -206 -224 -240 -256 -884 -2,007
-28 -30 -35 -42 -52 -63 -74 -85 -95 -104 -114 -221 -693
-2 * * * -1 -1 -1 -1 -1 * * -2 -5___ ___ ___ ___ ___ ___ ___ ___ ___ ___ ___ _____ _____Total, Net Interest 197 225 259 326 410 492 564 623 676 726 778 1,712 5,079
Total
Other Investment Incomed
Gross Interest on Treasury Debt Securitiesa
Interest Received by Trust FundsSocial SecurityOther trust fundsb
Subtotal
Other Interestc
consist of bills, notes, bonds, inflation-protected securi-ties, and zero-coupon bonds. However, the interest paid on those securities has no net budgetary impact because it is credited to accounts elsewhere in the budget.
In 2010, trust funds were credited with $186 billion of such intragovernmental interest, CBO estimates, mostly for the Social Security trust funds and the Civil Service Retirement and Disability Fund (see Table 3-1). Over the 2011–2020 projection period, CBO estimates, the trust funds’ interest receipts will total about $2 trillion.
Other Interest Although federal net interest outlays are dominated by interest on the Treasury’s borrowing from the public, the government also pays and receives interest from other transactions. The federal budget includes about 50 accounts that reflect those interest payments and collections. Collections of interest are shown in the budget as negative outlays—that is, as offsets to spend-ing. Some of those 50 accounts have no net effect on the budget because they are intragovernmental and reflect payments or receipts from other federal budget accounts.
Overall, the government receives more interest in the category of “other interest” than it pays out, primarily because of interest received from nonbudgetary financing accounts, which track the cash flows of credit programs. Net receipts to accounts in that category have risen from more than $7 billion in 2006 to $15 billion in 2009 and to more than $28 billion in 2010 (see Table 3-3). CBO projects that those receipts will continue to climb, sur-passing $100 billion by 2019. Most of the projected increase stems from larger payments of interest from credit financing accounts, particularly payments from the financing accounts for the federal student loan program.
Interest Paid to and Collected from the Credit Financing AccountsUnder the Federal Credit Reform Act of 1990, the bud-get shows the subsidy costs of the government’s direct loans and loan guarantees rather than the cash flows associated with those activities. The subsidy is the dis-counted present value of all future cash flows: generally, disbursements and repayments net of default losses in the case of direct loans; and fees, payments for defaults, and recoveries in the case of loan guarantees.

CHAPTER THREE FEDERAL DEBT AND INTEREST COSTS 29
Table 3-2.
Alternative Scenarios for Net Interest Outlays, 2011 to 2020(Billions of dollars)
Source: Congressional Budget Office.
Note: * = between zero and $500 million.
a. Costs on the amount of new borrowing and refinancing of maturing securities.
b. Includes savings bonds and securities issued to state and local governments.
c. Additional borrowing needed to cover additional interest costs.
Total,2011-
2011 2012 2013 2014 2015 2016 2017 2018 2019 2020 2020
August 2010 Baseline (Net interest) 225 259 326 410 492 564 623 676 726 778 5,079
Direct Effect of an Increase of 1 Percentage
Short-term securities 8 17 18 19 21 23 25 27 30 33 220Medium- and long-term securitiesb 4 23 40 52 61 71 79 86 91 98 605Treasury inflation-protected securities * 1 1 2 2 3 3 3 4 4 24__ __ __ __ __ __ ___ ___ ___ ___ ___
12 40 59 73 84 96 107 116 125 135 849
* 1 2 6 11 17 24 32 40 50 184___ ___ ___ ___ ___ ____ ____ ____ ____ ____ _____Total 13 41 62 79 95 113 131 149 165 185 1,033
One-Time Increase in Borrowing 1 2 2 4 4 5 6 6 7 7 43
Annual Increase in Borrowing of $100 Billion 1 3 7 13 21 29 37 45 54 63 272
of $100 Billion in 2011
Effect of Higher Interest Rates
Effect of Additional Borrowing
Debt Servicec
Subtotal
Point in Interest Ratesa
To track those cash flows and reconcile them with subsidy costs that are recorded in the budget, the Treasury created credit financing accounts (see Chapter 1). Although the cash flows for those accounts are not included in the bud-get totals, they influence the Treasury’s borrowing requirements.
How the Accounts Work. For a direct loan made by the government, a financing account receives a subsidy pay-ment from the budget account for that loan program (recorded in the budget as an outlay) and borrows from the Treasury the rest of the funds needed to make the loan. Some or all of that borrowing by the financing account is repaid to the Treasury over time as the direct loan made by the government is repaid. Meanwhile, the financing account pays interest to the Treasury on any outstanding balance. Those interest receipts are recorded in the budget as negative outlays.
Therefore, direct loans result in three interest flows:
Borrowers pay interest on their loans, which is credited to the financing account;
The financing account, in turn, pays interest to the Treasury on the money it borrowed to make the loans; and
The Treasury pays interest on the public debt that it issued to provide the necessary resources for the financing account.
Loan guarantees operate differently from direct loans. With a guarantee, the government agrees to repay, in the event of default, loans made by nongovernmental institu-tions. Financing accounts for guaranteed loan programs usually receive cash inflows when a loan is made; the inflows often include guarantee fees from lenders and subsidy payments from the budget account for that
CBO

30 FEDERAL DEBT AND INTEREST COSTS
CBO
Table 3-3.
Other Interest, 2006 to 2010(Billions of dollars)
Source: Congressional Budget Office based on data from the Office of Management and Budget.
Notes: Negative numbers represent the government’s interest income; positive numbers represent its interest expenses.
* = between -$500 million and $500 million.
MERCHF = Medicare-Eligible Retiree Health Care Fund; USPS = U.S. Postal Service.
2006 2007 2008 2009 2010
Interest Paid to and Collected from -5.4 -5.0 -5.7 -13.4 -22.8
Interest ReceiptsInterest earned on deposits in tax and loan accounts -0.9 -1.2 -0.6 * *Interest from unemployment loans to states * * * 0 0
-0.8 -1.0 -0.8 -0.5 -0.4
Interest ExpensesInterest paid on tax refunds 4.2 3.3 4.5 2.4 2.2Interest paid to Resolution Funding Corporation 2.0 2.0 1.4 2.1 2.3
0.2 * * * *
Intragovernmental InterestInterest from the Federal Financing Bank -0.4 -0.7 -0.8 -0.6 -1.0Earnings on MERHCF investments -3.8 -4.0 -7.8 -1.1 -5.1Earnings on USPS Retiree Health Care Fund 0 * -1.2 -1.4 -1.5Interest from the Nuclear Waste Fund -0.5 -0.8 * -1.1 -1.2Other -1.8 -2.6 -1.8 -1.4 -0.9____ _____ _____ _____ _____
Total -7.3 -10.1 -12.9 -15.0 -28.5
Credit Financing Accounts
Other
Other
guarantee program. Any defaults on loans that would require a payment from the account typically occur later. As a result, a financing account for a guarantee program generally runs a surplus with the Treasury, which credits the financing account with interest on that sum, generat-ing positive outlays in the budget.
Amounts of Interest Received from the Financing Accounts. In 2010, the interest transactions between the Treasury and the financing accounts yielded net receipts to the Treasury of almost $23 billion, up from about $13 billion in 2009. (Interest flows between the Treasury and credit financing accounts, like other intragovern-mental transfers, have no effect on borrowing by the Treasury.) The student loan program currently represents the bulk of the balances in financing accounts and, there-fore, the largest volume of interest flowing to the Treasury (a net receipt to the Treasury of $11 billion for 2010).
The flows of interest payments to the Treasury related to direct student loans will steadily increase in coming years
because the Health Care and Education Reconciliation Act of 2010 (Public Law 111-152) terminated the Federal Family Education Loan program, which guaran-teed loans to student borrowers made through private lenders such as banks, credit unions, and some post-secondary institutions. As new activity occurs entirely through direct loans rather than guaranteed loans, the additional borrowing that the financing account requires to fund the additional loans will result in higher interest payments from that account to the Treasury.
Two other financing accounts that make sizable interest payments to the Treasury are those for the Troubled Asset Relief Program and for the Treasury’s purchase of mortgage-backed securities. Both programs were created in the fall of 2008 in response to the financial crisis, and in each case the budget recorded only the estimated sub-sidy provided to the program. To carry out their missions, however, both programs required funding that was not directly recorded in the budget. The TARP was estab-lished to purchase or insure troubled assets to promote

CHAPTER THREE FEDERAL DEBT AND INTEREST COSTS 31
stability in financial markets. Funding from the Treasury was used to purchase preferred stock from financial institutions; to provide assistance to American Interna-tional Group, General Motors, and Chrysler; and for a number of other purposes.4 The MBS purchase program sought to increase liquidity in the secondary mortgage market by increasing the demand for those securities. In terms of the federal budget, both programs operate like direct loan programs: The Treasury provided funds to their respective financing accounts for disbursement, and the financing accounts now pay interest to the Treasury on that borrowing. The budget recorded net receipts of $10 billion in interest from the financing accounts for the TARP and MBS purchases in 2010.
Other credit financing accounts include those for the Rural Utilities Service, for several housing programs under the Department of Housing and Urban Develop-ment, and for many other, smaller credit programs.
Other Interest ReceiptsMost other accounts in the category of “other interest” record inflows to the government from interest payments or earnings on investments; such collections are recorded as negative outlays in the budget. Historically, the largest collection accounts have been those that record interest earnings on deposits in so-called tax and loan accounts at banks. Interest on loans to states’ unemployment funds are another source of such receipts.
Interest Earned on Deposits in Tax and Loan Accounts. The federal government, like individuals and businesses, maintains a working balance of cash to cover current expenditures. Because the timing and amount of receipts never precisely match disbursements, the amount of funds at the Treasury’s disposal varies widely over short periods, especially around quarterly tax dates and pay-ment dates for Social Security, Medicare, and veterans’ benefits.
The Treasury generally holds its cash balances in two types of accounts—demand deposits (similar to non-interest-bearing checking accounts) at Federal Reserve Banks and tax and loan accounts at commercial banks located throughout the country. Those commercial banks qualify as special depositories to maintain tax and loan
4. For more information on the TARP, see Congressional Budget Office, Report on the Troubled Asset Relief Program—November 2010 (November 2010).
accounts for the Treasury; businesses can use the accounts to deposit taxes withheld from employees’ paychecks, corporate income taxes, and other recurring payments. In exchange for the short-term use of those funds, the par-ticipating banks pay interest to the Treasury at the greater of zero and the federal funds rate minus one-quarter of one percentage point.5
Balances in the tax and loan accounts are highly volatile. During 2010, overall daily closing balances ranged from a low of $62 million to a high of roughly $3 billion and averaged just under $2 billion. Interest received from the tax and loan accounts has declined significantly in the past two years: The total interest received in 2010 was close to zero, down from about $40 million in 2009 and about $600 million in 2008—the result of a significantly lower federal funds rate (which declined from 2.9 percent in 2008 to 0.3 percent in 2009 and to 0.2 percent in 2010) and the Treasury’s decision in 2008 to limit the balances being held in the tax and loan depositories to $2 billion.
Interest from Unemployment Loans to States. When states have insufficient funds in their Unemployment Trust Fund accounts, they may receive advances from the federal government to pay unemployment benefits. States pay no interest on those advances if they repay them within a fiscal year, but after that they generally are charged interest. However, provisions of the American Recovery and Reinvestment Act (P.L. 111-5) made bor-rowing interest-free through December 2010. As of October 2010, balances on the unemployment loans to states exceeded $40 billion, and CBO projects that inter-est payments on such balances will total $1 billion to $2 billion per year beginning in 2011 if interest forgive-ness is not extended beyond 2010.
Other Interest ExpensesA few accounts in the category of “other interest” track interest payments to individuals or organizations outside the federal budget. The largest of such accounts include interest payments on certain tax refunds and the interest paid on bonds sold in the 1980s and 1990s to help resolve the savings and loan crisis.
Interest Paid on Tax Refunds. The Treasury pays interest on individual, corporate, and excise tax refunds that are
5. The federal funds rate is the interest rate that financial institutions charge each other for overnight loans of their monetary reserves.
CBO

32 FEDERAL DEBT AND INTEREST COSTS
CBO
paid more than 45 days after the filing date. Interest on such refunds is generally dominated by interest on income tax returns that have been amended or audited. Corporate and individual taxpayers can file an amended return for a previous year; if a refund is due, the Internal Revenue Service calculates interest from the initial filing date. Over the 2011–2020 period, CBO estimates, such payments will total between $2 billion and $4 billion a year.
Interest Paid to the Resolution Funding Corporation. REFCORP is a government-sponsored enterprise created in 1989 to provide initial funding for the Resolution Trust Corporation (RTC). REFCORP issued $31.2 bil-lion in bonds to finance the RTC’s efforts to resolve the savings and loan crisis in the late 1980s and early 1990s. The interest owed on those obligations totals $2.6 billion annually and is paid quarterly by several entities. The Federal Home Loan Banks (FHLBanks) are currently required by statute to contribute 20 percent of their annual net earnings (about $500 million to $700 million per year) toward REFCORP’s interest payment. The Treasury pays the remainder of the interest due, roughly $2.1 billion annually, or about 80 percent of the total. The Federal Deposit Insurance Corporation has also made periodic contributions to REFCORP’s interest pay-ments, but the amount and frequency of such payments are not statutorily mandated.
CBO currently projects that the FHLBanks will complete their required interest payments on REFCORP bonds in 2011 and, as a result, that the Treasury will begin to make the full annual interest payment of $2.6 billion in 2012. The REFCORP bonds begin to mature in 2019, and all will have matured by April 2030, at which point interest payments will cease.
Intragovernmental InterestSome accounts in the “other interest” category have no net effect on the budget because they are intragovern-mental and reflect receipts from other federal budget accounts. Such accounts include the Federal Financing Bank (FFB), the retiree health care funds for certain members of the military and employees of the U.S. Postal Service (USPS), the Nuclear Waste Fund, and some other federal entities.
Interest from the Federal Financing Bank. The FFB is an arm of the Treasury Department that acts as a financial intermediary for a few federal agencies, government cor-
porations, and government-sponsored enterprises; it was created in 1973 to reduce federal borrowing costs and improve debt management by assisting with borrowing by those entities. The FFB borrows directly from the Treasury and charges the agencies its own cost of borrow-ing plus one-eighth of one percentage point. Payments of interest from the FFB to the Treasury have been less than $1 billion annually in recent years but are projected to increase (to as much as $6 billion) because of higher loan activity (particularly by the Department of Energy’s Advanced Technology Vehicles Manufacturing program and the Rural Utilities Service). Those interest payments have no net effect on the budget; they appear as outlays in the FFB’s budget account and as offsetting receipts in “other interest.” As of September 30, 2010, the FFB port-folio totaled $60 billion.
Medicare-Eligible Retiree Health Care Fund. MERCHF was established by the National Defense Authorization Act for 2001 and began operation in 2003. The fund pays for the health care costs of retirees of the uniformed services and their dependents and survivors, once those individuals are eligible for Medicare. The Treasury makes payments into the fund to cover future benefits and also pays interest on the balance in the fund. Those balances are therefore increasing rapidly. In 2009, payments to the fund (excluding interest) totaled $21.3 billion, and out-lays to cover health care expenses totaled $8.4 billion. Through 2020, CBO projects, payments to the fund will continue to be significantly higher than outlays. In 2020, those payments into the fund (other than interest) will be about $34 billion, compared with $16 billion in outlays. As a result, the interest credited to the fund will also grow dramatically, from $5 billion in 2010 to almost $22 bil-lion by 2020, CBO projects.
U.S. Postal Service Retiree Health Benefits Fund. This fund was established in 2006 as a way of financing the health benefits of USPS retirees beginning in 2017. (The costs of health benefits for USPS retirees are currently paid from the annual operating funds of the Postal Ser-vice.) The USPS is required to make annual payments of between $5 billion and $6 billion to the fund through 2016, and those payments are used to purchase Treasury securities. As of September 30, 2010, the fund had a balance of nearly $42 billion, and its interest earnings in 2010 totaled $1.5 billion. CBO projects that interest earnings over the 2011–2020 period will total about $42 billion.

CHAPTER THREE FEDERAL DEBT AND INTEREST COSTS 33
Nuclear Waste Fund. This fund pays for activities related to the permanent disposal of high-level nuclear waste from commercial and defense-related sources. The income it receives from fees paid by commercial producers of nuclear power is invested in long-term Treasury securities. The fund’s portfolio consists primar-ily of zero-coupon Treasury bonds; the interest credited to the fund totaled about $1 billion in 2010 and, CBO projects, will average about $2 billion per year over the 2011–2020 period.
Other Intragovernmental Interest Receipts. The Con-gress allows certain government corporations and federal entities to borrow from the Treasury to finance part of the costs of their programs. That borrowing authority is con-ferred through either permanent authorizing language or annual appropriations. The Treasury and the individual agencies decide on the terms of the loan, depending on the needs of the program being financed. The agencies’ borrowing includes long- and short-term debt, and inter-est rates vary by program.
Both the payment and the receipt of those intragovern-mental interest transactions are accounted for in the fed-eral budget, but because those amounts are offsetting, they do not affect the budget deficit. In particular, the interest payment is booked as an outlay for the participat-ing agency, and the receipt of that payment is recorded as an offsetting receipt in the Treasury’s intragovernmental interest account. Interest on loans to the Bonneville Power Administration, the National Flood Insurance Fund, and the Helium Fund accounted for nearly
two-thirds of the other $915 million in intra-governmental interest paid to the Treasury in 2010.
Other Investment IncomeThe National Railroad Retirement Investment Trust (NRRIT), a tax-exempt entity that is independent of the federal government, is charged with managing and investing the assets of the Railroad Retirement program. However, because the functions of the NRRIT are con-sidered to be federal in nature, the earnings and losses of the program are accounted for in the budget in the general category of net interest.
The NRRIT is authorized to invest the assets of the Railroad Retirement fund in a diversified investment portfolio, like the portfolios of private-sector retirement plans. About 95 percent of the current portfolio is invested in private holdings that are actively managed by the NRRIT; the remaining 5 percent is invested in nonmarketable Treasury securities. The trust’s average earnings for 2004 through 2007 totaled about $3 billion a year, but market declines in recent years have produced losses from the NRRIT’s investments. In 2008 and 2009, the trust had losses of $6 billion and $350 million, respectively. At the end of 2009, the balance in the Railroad Retirement fund was about $23 billion, down from a high of nearly $33 billion in 2007. To project the NRRIT’s future earnings, CBO assumes a rate of return equal to the average projected rate on new Treasury issues; under that assumption, CBO projects that earn-ings will average about $500 million per year through 2020 (see Table 3-1 on page 28).
CBO


Appendix: Public Debt Outstanding at the
End of the Fiscal Year
The Department of the Treasury issues two broad types of securities to the public: marketable and non-marketable. Marketable securities—bills, notes, bonds, and Treasury inflation-protected securities—are auc-tioned at regular intervals during the year and can be
resold. Nonmarketable securities, such as savings bonds, are not sold at auction and cannot be resold. Tables A-1 and A-2 show the outstanding value of each type of debt at the end of fiscal years 1990 through 2010.
CBO

36 FEDERAL DEBT AND INTEREST COSTS
CBO
Table A-1.
Marketable Public Debt Outstanding at the End of the Fiscal Year, 1990 to 2010
Source: Congressional Budget Office based on data from the Department of the Treasury.
Note: n.a. = not applicable.
a. Reported at face value.
b. Inflation-adjusted amount.
TotalFiscal (BillionsYear of dollars)
1990 482 23 1,218 59 377 18 n.a. n.a. 2,0781991 565 24 1,388 58 423 18 n.a. n.a. 2,3761992 634 24 1,566 59 462 17 n.a. n.a. 2,6471993 658 23 1,734 60 497 17 n.a. n.a. 2,8401994 697 23 1,868 61 512 17 n.a. n.a. 3,0771995 742 23 1,980 61 523 16 n.a. n.a. 3,2451996 761 22 2,099 62 543 16 n.a. n.a. 3,4031997 702 20 2,122 62 576 17 24 1 3,4251998 638 19 2,009 61 610 18 59 2 3,3161999 653 20 1,829 57 644 20 92 3 3,2182000 616 21 1,611 54 635 21 115 4 2,9782001 735 25 1,433 49 613 21 135 5 2,9152002 868 28 1,522 49 593 19 139 4 3,1212003 918 27 1,799 52 577 17 166 5 3,4602004 961 25 2,109 55 552 14 223 6 3,8462005 910 22 2,328 57 521 13 307 8 4,0662006 908 21 2,445 57 534 12 396 9 4,2842007 955 22 2,456 55 561 13 457 10 4,4282008 1,484 28 2,623 50 579 11 524 10 5,2102009 1,986 28 3,773 54 677 10 551 8 6,9882010 1,784 21 5,253 62 846 10 594 7 8,476c c
of TotalBillions
of DollarsPercentage
of Total
Treasury Inflation-Billsa Notes Bonds Protected Securitiesb
Billionsof Dollars
Percentageof Total
Billions of Dollars
Percentage of Total
Billions ofDollars
Percentage

APPENDIX FEDERAL DEBT AND INTEREST COSTS 37
Table A-2.
Nonmarketable Public Debt Outstanding at the End of the Fiscal Year, 1990 to 2010(Billions of dollars)
Source: Congressional Budget Office based on data from the Department of the Treasury.
Note: * = between zero and $500 million.
a. CBO’s estimate of current economic value.
b. Includes mostly claims funds and asset forfeiture funds (starting in 2001), foreign series bills, tax and loss bonds issued by the Mortgage Guaranty Insurance Corporation, U.S. notes and silver certificates, and, in 2003, depository compensation securities.
Fiscal SavingsYear Bonds Foreign Domestic Otherb Total
1990 122 161 7 4 2 3 2991991 134 158 9 5 3 3 3111992 148 158 12 4 4 * 3261993 167 149 15 6 3 1 3411994 176 137 18 6 3 1 3421995 181 113 21 7 4 1 3271996 184 96 23 6 4 3 3161997 183 112 25 6 4 1 3311998 181 164 26 8 5 1 3861999 180 168 29 6 5 1 3902000 178 153 32 5 5 1 3742001 186 146 37 4 6 6 3862002 193 144 45 3 6 7 3982003 202 148 51 4 7 22 4342004 204 158 56 3 7 7 4362005 204 225 64 3 8 10 5132006 204 239 72 2 8 10 5352007 197 297 81 2 9 12 5982008 194 260 101 2 10 10 5782009 192 216 113 2 11 7 5422010 189 193 124 2 11 7 526
Zero-Coupon Bondsa
Government SeriesState and Local Thrift
Savings Plan
CBO