FEDERAL CROP INSURANCE PROGRAMcropinsuranceinamerica.org/wp-content/uploads/Grant... · ·...
33
FEDERAL CROP INSURANCE PROGRAM PROFITABILITY AND EFFECTIVENESS ANALYSIS 2013 UPDATE Prepared on behalf of National Crop Insurance Services, Inc. By Grant Thornton LLP June 2014
Transcript of FEDERAL CROP INSURANCE PROGRAMcropinsuranceinamerica.org/wp-content/uploads/Grant... · ·...

FEDERAL CROP INSURANCE PROGRAM
PROFITABILITY AND EFFECTIVENESS ANALYSIS
2013 UPDATE
Prepared on behalf of National Crop Insurance Services, Inc.By Grant Thornton LLP
June 2014

Federal Crop Insurance ProgramProfitability and Effectiveness Analysis
Grant Thornton LLPPrepared on behalf of National Crop Insurance Services, Inc.
TABLE OF CONTENTS
INTRODUCTION 1
KEY FINDINGS 3
METHODOLOGY FOR BENCHMARK COMPARISONS 5
PROFITABILITY ANALYSIS 7
EFFECTIVENESS ANALYSIS 12
A&O REIMBURSEMENT SHORTFALL 14
EFFECT OF THE 2008 FARM BILL 14
THE 2011 STANDARD REINSURANCE AGREEMENT 15
SUMMARY AND CONCLUSIONS 15
EXHIBIT 1: PROFITABILITY OF THE MPCI PROGRAM
EXHIBIT 2: PROFITABILITY OF THE PROPERTY & CASUALTY INSURANCEINDUSTRY
EXHIBIT 3: COMPARISON OF PRETAX NET INCOME
EXHIBIT 3.1: COMPARISON OF PRETAX NET INCOME AS A PERCENTAGE OFPREMIUM
EXHIBIT 4: TOTAL EXPENSE TO PREMIUM RATIOS
EXHIBIT 5: EXPENSE TO PREMIUM RATIOS
EXHIBIT 6: COMMISSION EXPENSE TO PREMIUM RATIOS
EXHIBIT 7: COMPARISON OF EXPENSE RATIOS
EXHIBIT 8: COMPARISON OF A&O REIMBURSEMENT TO TOTAL EXPENSE

Federal Crop Insurance ProgramProfitability and Effectiveness Analysis
Grant Thornton LLPPrepared on behalf of National Crop Insurance Services, Inc. 1
INTRODUCTIONGrant Thornton LLP was engaged by National Crop Insurance Services, Inc. (“NCIS”) toupdate the “Federal Crop Insurance Program Profitability and Effectiveness Analysis 2012Update” with 2012 results. 1 The analysis benchmarks the Multi-Peril Crop Insurance(“MPCI”) program against the Property & Casualty (“P&C”) insurance industry.2 The 2012results are based on an aggregation of the data contained in surveys returned by 15 MPCIcompanies participating in the program in reinsurance year 2012.3
The Federal Crop Insurance program, commonly known as MPCI, has been offered to U.S.farmers since the 1930s. Originally available only through the Federal government, theprogram has operated since 1981 as a public-private partnership between members of NCIS,as direct insurers or their managing general agents, and the Federal Crop InsuranceCorporation (“FCIC”), as their principal reinsurer. The basic terms of this relationship are setforth in a Standard Reinsurance Agreement (“SRA”) signed by FCIC and each individualdirect insurer. FCIC, a federally owned corporation, delegates the responsibility of managingthe program to the Risk Management Agency (“RMA”) of the U.S. Department of Agriculture(“USDA”). In crop year 2012, the MPCI program: provided coverage on 283 million acres ofeligible acreage of major U.S. crops, insured liability of $117.1 billion, generated totalpremiums of $11.1 billion (of which $7.0 billion were premium subsidies), and distributed$17.4 billion in indemnity payments.4
As a Congressionally authorized insurance program subsidized by the U.S. Treasury, FCIC andRMA are responsible for ensuring that the profitability of the MPCI program is reasonable inrelation to the financial risk retained by the participating insurers. In addition, the governmenthas a duty to taxpayers to ensure that the program insures farmers in a cost effective manner.
1 This report was prepared for NCIS to be used by its members solely in evaluating aggregated, historical datausing the general methodology from previous Grant Thornton reports at the request of NCIS. Our services wereprovided in accordance with the Statement on Standards for Consulting Services promulgated by the AmericanInstitute of Certified Public Accountants and, accordingly, do not constitute the compilation, review or audit ofany information. The report does not express a view with regard to the results for any individual member ofNCIS. This update primarily addresses the MPCI and P&C information for 2012. However, previous years’ datawas amended if more current information for any year was available from Best’s Aggregates & Averages Property& Casualty (“Best’s A&A”) or RMA. We reserve the right to further update this analysis as we obtain additionalinformation.2 This report uses aggregate historical data on both the MPCI program and the P&C industry. MPCI data used inthis report were taken from a survey by NCIS of its member companies and from public sources (USDA/RMA).Responses were received from all 15 of the MPCI companies surveyed in the form of financial data for the 2012reinsurance year. Gross Premium, Retained Premium and Net Gain/(Loss) reported by RMA as of November2013, http://www3.rma.usda.gov/apps/reins_public/, were within 0.01%, .02% and .03%, respectively, ofamounts submitted by the survey respondents, demonstrating the consistency of our surveys with that of RMA.Data on the P&C industry were obtained from Best’s A&A. Data utilized from previous versions of Best’s A&Ahave been updated with data from the 2013 edition where possible. Data were also obtained from the 2004analysis prepared by Deloitte and from the 1997 and 1999 analyses prepared by PwC.3 Fifteen companies participated in the program in 2012. We received survey responses from all marketparticipants.4 http://www3.rma.usda.gov/apps/sob/current_week/sobrpt2011-2014.pdf viewed on December 2, 2013.

Federal Crop Insurance ProgramProfitability and Effectiveness Analysis
Grant Thornton LLPPrepared on behalf of National Crop Insurance Services, Inc. 2
The purpose of this report is to analyze how effectively the program and the private sectordelivery system perform in meeting these objectives. This analysis consists of a benchmarkcomparison of the MPCI program to similar private sector industries.
MPCI companies write policies that are a specific class of Property and Casualty (“P&C”)insurance. As such, P&C industry-wide results or specific segments of the P&C industryprovides informative benchmarks for evaluating the profitability and expenses of the cropinsurance industry. However, any comparison of crop insurance and P&C insurance, ingeneral, must consider the different operational and financial characteristics of the MPCIprogram, including the unique way in which crop insurers recover their delivery costs. Thesedifferences are described in the following table.5
P&C Insurance MPCI Program
Premium Expense loaded – meaningadministrative expenses areincluded in the premiumcharged.
Not expense loaded -administrativeand overhead expenses are partiallyreimbursed to companies throughA&O Reimbursements.
Premium Rates Set by company, approvedby State regulators. Rateswill differ by company dueto risk and administrativeloads.
Set by RMA - the same rates applyto all companies.
Premium Payments Upfront at time of sale.Held by company togenerate investmentincome.
Mid-season, with companiesturning over funds to RMA within30 days. Minimal to no investmentincome. Credit risk to company ofnonpayment by policyholders.
Underwriting Ability to underwrite risks.Can choose whether or notto accept risks and tomodify rates and coverageto amend participant riskprofile.
No ability to underwrite risks. Musttake all eligible participantsregardless of risk profile.
Reinsurance Private Mixture of private and federal
5 Adapted from Crop Insurance Testimony by Ron Brichler to General Farm Commodities and RiskManagement Subcommittee; House Committee on Agriculture, June 7, 2007, updated to conform to the 2008Farm Bill.

Federal Crop Insurance ProgramProfitability and Effectiveness Analysis
Grant Thornton LLPPrepared on behalf of National Crop Insurance Services, Inc. 3
P&C Insurance MPCI Program
Administrative Expenses Set by company andapproved by Stateregulators as part of thePremium rate.
A&O Reimbursement set bystatute or contractually by FCICand may not cover actual expensesincurred.6
Given these differences, a comparison of the P&C industry to the MPCI program is only validas long as the major differences between the latter specific line of coverage and the moregeneral former lines of coverage are recognized, understood, and adjusted for appropriately.Our analysis takes the appropriate adjustments into consideration to the extent possible fromthe information sources utilized.
KEY FINDINGSThe key findings of our analysis can be summarized as follows:7
The MPCI program is not as profitable as the P&C industry and writing MPCIcoverage entails greater risk.
o The profitability of the program can be evaluated on the basis of eithera simple or weighted average of historical experience. On a simpleaverage basis, MPCI’s ratio of Pretax Net Income as a percentage ofAdjusted Retained Premium averaged 11.6% for the period 1992-2012.In comparison, P&C’s ratio of Pretax Net Income as a percentage ofAdjusted Net Earned Premium averaged 16.5% over the same period.Furthermore, the volatility of MPCI’s historical earnings was 13.7%compared to only 9.2% for the P&C industry. Measured on this basis,the MPCI industry was significantly less profitable than the P&Cindustry while simultaneously being riskier. (Please refer to theProfitability Analysis section of this report.)
o Evaluating the historical performance of the two programs on aweighted average basis also shows that the MPCI industry wassignificantly less profitable than the P&C industry whilesimultaneously being riskier.8 This has only a modest effect on theP&C industry results noted above, with the income measure rising to
6 The Food, Conservation, and Energy Act of 2008 (“2008 Farm Bill”) reduces the amount of A&OReimbursement paid in 2009. Please refer to the “Effect of the 2008 Farm Bill” section of this report for furtherdiscussion. Further reductions were introduced by the 2011 SRA. Please refer to the “The 2011 StandardReinsurance Agreement” section of this report for further discussion.7 Profitability ratios for the MPCI program for the 2007-2012 updates include an adjustment to retained premiumfor Quota Share for the years 2005-2012.8 As the MPCI and P&C industries have grown over time (e.g., see Column 5 of Exhibit 1 and Column 5 ofExhibit 2, respectively), measuring profitability on a weighted average basis places greater importance on theindustries’ experiences in recent years when they were larger.

Federal Crop Insurance ProgramProfitability and Effectiveness Analysis
Grant Thornton LLPPrepared on behalf of National Crop Insurance Services, Inc. 4
17.0% while the variability measure is 9.2%. For MPCI, the incomemeasure is unchanged at 11.6%, while the variability measure increasesto 14.7%. Measured on this basis, MPCI again provides a lower returnto investors than the P&C industry despite having a higher degree ofrisk.
MPCI Expense-Premium ratios are significantly below those of the P&C industry.o The cost effectiveness of the MPCI industry, measured by the ratio of
MPCI Total Expenses to Gross Premium, was only 26.3% for theperiod 1992-2012, compared to P&C’s average ratio of TotalExpenses to Adjusted Direct Premiums of 60.6% for the sameperiod. Unlike P&C’s ratios that have generally been stable orincreasing in recent years, expenses for the MPCI industry have fallenfrom 33.8% in 1992 to 16.5% in 2012. (Please refer to theEffectiveness Analysis section of this report.)
o In recent years, the MPCI Industry continued to deliver the programin a highly cost effective manner. The expense to premium ratio of16.5% was up slightly from 16.2% in 2011, but still well below the24.9% level in 2010. (Please refer to the Effectiveness AnalysisSection of this report).
Under the current SRA, A&O Reimbursements continue to be below actual MPCIexpenses incurred by private insurers. The shortfall is absorbed by MPCI insurersas a reduction in their pre-tax net income.
o For 2011, MPCI companies incurred Total Expenses equal to 16.2%of Gross Premiums while A&O Reimbursements only totaled 11.5%of Gross Premiums, resulting in an approximate 4.7% ($561.9 million)shortfall. (Please refer to the A&O Reimbursement Shortfall section ofthis report.)
o For 2012, MPCI companies incurred Total Expenses equal to 16.5%of Gross Premiums while A&O Reimbursements only totaled 12.6%of Gross Premiums, resulting in an approximate 3.9% ($430.6 million)shortfall. (Please refer to the A&O Reimbursement Shortfall section ofthis report.)
These findings are consistent with findings contained in prior years’ studies. All studiesconsistently show that the MPCI program is less profitable than the P&C industry as a wholein the area of profitability and more efficient than the P&C industry in the area of expensemanagement. The remainder of this report provides a detailed discussion of the analysissupporting each of these key findings.

Federal Crop Insurance ProgramProfitability and Effectiveness Analysis
Grant Thornton LLPPrepared on behalf of National Crop Insurance Services, Inc. 5
METHODOLOGY FOR BENCHMARK COMPARISONSIn this report, we measure the costs and profitability of the MPCI and P&C industries relativeto its revenue, rather than its equity. An important advantage of this approach is that all of theinformation required for an analysis of the insurance industry is publicly available andassumptions are minimized.
Expense Metric
The standard metric utilized within the P&C insurance industry for evaluating costeffectiveness is the ratio of expense to direct premium. Direct premium represents the grossrevenue generated from sales activity and excludes reinsurance adjustments. Thecorresponding term for the MPCI industry is gross premium. However, the two premiummeasures differ in that MPCI gross premiums represent just the expected benefits payable topolicyholders, whereas P&C direct premiums also include a large loading to cover the insurer’sexpenses. In addition, P&C expense loadings differ widely for different lines of insurance.
In order to provide a valid comparison of cost effectiveness across the two industries, thepremiums need to be restated on a common basis. One solution would be to combine theA&O reimbursements of the crop insurance industry with the MPCI gross premiums.However, this adjustment would not fully eliminate the distortion in the comparison of thetwo industries in that the A&O reimbursements are significantly less than the P&C industry’sexpenses in relation to premium. A better solution is to compare expenses to the expectedbenefits delivered to policyholders. For the P&C industry, this means removing the expenseloading from the P&C premiums. In this context, the expected benefits can be considered tobe to the wholesale cost of the insurance product. Expected benefits can also be considered tobe the true measure of the value provided to society by the programs.
The following table illustrates how the P&C industry’s adjusted gross expense ratios used inthis analysis were prepared. Historical expense ratios and premiums were obtained from datacompiled by A.M. Best. The table below shows the calculations for the last five years. Thefinal four columns of the table develop the adjusted gross expense ratios reported in Exhibit5.2. A similar approach is used to develop the adjusted gross expense ratios for Homeownersand Private Passenger Auto Physical Damage shown in Exhibit 7 as well as total net expensesshown in Exhibit 2.

Federal Crop Insurance ProgramProfitability and Effectiveness Analysis
Grant Thornton LLPPrepared on behalf of National Crop Insurance Services, Inc. 6
Expenses Ratio Restatement ProcessIllustration of how the Adjusted Expense Ratios are developed
P&C Industry Totals
Amounts in Millions of Dollars Ratios to Adjusted Direct Premiums Written
Year
Gross LossAdjustmentExpense as a% of DirectPremiumsEarned [a]
GrossCommissions& BrokerageFees Incurredas a % ofDirectPremiumsWritten [a]
Gross OtherUnderwritingExpensesIncurred as a% of DirectPremiumsWritten [a]
DirectPremiumsWritten [a]
DirectPremiumsEarned [a]
AdjustedDirectPremiumsWritten [b]
Gross LossAdjustmentExpense
GrossCommissions& BrokerageFees Incurred
Gross OtherUnderwritingExpenses
Total GrossExpenses
Formula (1) (2) (3) (4) (5) (6)(7) =(1) *(5)/ (6)
(8) =(2) *(4) / (6)
(9) =(3) *(4) / (6)
(10) =(7) +(8) + (9)
2008 11.5% 11.4% 15.3% $490,861 $493,385 $303,062 18.7% 18.5% 24.8% 62.0%
2009 12.4% 11.4% 15.0% $474,082 $476,812 $289,800 20.4% 18.6% 24.5% 63.5%
2010 11.9% 11.4% 15.4% $476,240 $474,290 $292,167 19.3% 18.6% 25.1% 63.0%
2011 11.8% 11.2% 15.1% $495,271 $490,373 $307,151 18.8% 18.1% 24.3% 61.2%
2012 11.6% 11.3% 15.2% $512,290 $503,595 $318,116 18.4% 18.2% 24.5% 61.1%
Notes:[a] 2008-2012: Best's Aggregates & Averages 2013, Cumulative By Line Underwriting Experience[b] = (4) - { (1) * (5) + (2) * (4) + (3) * (4) }

Federal Crop Insurance ProgramProfitability and Effectiveness Analysis
Grant Thornton LLPPrepared on behalf of National Crop Insurance Services, Inc. 7
Profitability MetricIn the expense analysis section above, cost effectiveness of the MPCI and P&C industries isevaluated based on the amount of revenue received from sales. Gross revenue for the MPCIprogram is simply gross premium, while gross revenue for the P&C industry is obtained byremoving expenses from direct premium. The exclusion of expenses is essential to ensurethat both sets of expense ratios are measured on a consistent basis. By excluding expenses,the expense ratios for the two industries are evaluated in terms of the expected benefitsdelivered to policyholders.
A similar rationale also applies to the profitability analysis. For this purpose, revenue needsto be further modified to account for the effects of reinsurance. Net revenue is obtained byoffsetting the revenue received from sales by the amount of revenue ceded to reinsurers. Onthis basis, the profitability metric is defined as the ratio of net income to net revenue, bothmeasured after the effects of reinsurance. Net income for the MPCI industry recognizes theeffect of the shortfall in A&O reimbursements to fully compensate the industry for itsexpenses. Similarly, net income for the P&C industry is reported net of any differencebetween the industry’s actual expenses and the expenses recouped through the expenseprovision included in the premium charged to policyholders.
Due to differences in terminology and financial arrangements, net revenue for the twoprograms must be measured in different ways. For the MPCI program, net revenuecorresponds to retained premium, the amount of premium remaining after applying thereinsurance and quota share provisions of the SRA. To ensure consistency withRMA-published information, reinsurance not required under the SRA is excluded fromconsideration in this study.
For the P&C industry, net revenue is obtained by removing net expenses from net premium.This adjustment is essential to ensure the consistency of the profitability metric between thetwo programs. It also ensures that profits are measured in relation to the revenueresponsible for generating those profits. Although an insurer’s premium includes both a riskcomponent as well as an expense component, only the risk component is considered relevantin terms of generating profits for the insurer. This is consistent with economic theory, whichsuggests that profits are the result of taking risk. This justifies the decision to exclude theinsurer’s expenses from the premium in evaluating the profitability of the program.
PROFITABILITY ANALYSISProfitability is measured as a function of Pretax Net Income for both the P&C industry andthe MPCI program. For the P&C industry, we measured Pretax Net Income as the sum ofNet Underwriting Income (Loss), Net Investment Income and Realized Capital Gain (Loss).For the MPCI program, we measured Pretax Net Income as the sum of Net UnderwritingGain (Loss) and Net Expense Gain (Loss). Underwriting Gains are defined in the SRA as“the amount by which the Company’s share of retained net book premium exceeds its

Federal Crop Insurance ProgramProfitability and Effectiveness Analysis
Grant Thornton LLPPrepared on behalf of National Crop Insurance Services, Inc. 8
retained ultimate net losses.”9 However, Underwriting Gains do not represent pure profit tothe MPCI companies. As stated by former RMA Administrator Eldon Gould, It would be amistake to consider them [Underwriting Gains (Losses)] pure profit or absolute loss for the reinsuredcompanies. Underwriting Gains serve a number of functions - they cover partial delivery expenses for somecompanies, they are used to build reserves to meet the required policyholder surplus and they provide a returnon equity.”10 Therefore, the Net Expense Gain (Loss) must be included in the calculation ofMPCI Pretax Net Income to arrive at a profitability measure.
Furthermore, the function that Underwriting Gains serve in building required policyholdersurplus in the MPCI program is substantial. As part of RMA’s financial integrityrequirements, the insurance companies must maintain, at a minimum, adequate policyholdersurplus to pay losses resulting from two consecutive years of a 500 percent loss ratio (lossesequal to 500% of premiums).11
The policyholder surplus requirements are generally more stringent than those of stateregulators for the P&C industry. As the MPCI program’s premiums increase, the requiredpolicyholder surplus increases. The policyholder surplus requirement has implications forthe amount of underwriting gains that would need to be retained in order to build thereserves to the required minimum level. It could also affect the amount of commercialreinsurance that MPCI insurers would need to purchase to maintain the requiredcapitalization standard. In either case, this would reduce the available income that wouldotherwise be paid out to shareholders and reduce the financial incentive for new participantsto enter the program. As Mr. Gould testified in June 2007, “To put this requirement in perspective,the highest loss ratio the program has experienced was 2.39(239%) in 1988. The recent underwriting gainsprovide the surplus needed to cushion and plan for catastrophic weather events and years like 1988 and 1993.This is important as the companies today retain risk on almost 80 percent of the premiums written, with muchof the retained premium in the riskiest Commercial Fund.”12
Exhibit 1 provides the data required to calculate Pretax Net Income for the MPCI programwhile Exhibit 2 provides data required to calculate Pretax Net Income for the P&C industryas a whole. Exhibits 3 and 3.1 compare the MPCI and P&C Pretax Net Income figures ona value and percentage basis, respectively.
These Exhibits show that while the MPCI industry lost money in 2012 as compared to beingprofitable for the prior decade, the P&C industry’s profitability almost doubled between2011 and 2012.
While MPCI premiums fell slightly between 2011 and 2012, the 2012 drought generated largeunderwriting losses. For example, the MPCI industry generated approximately $1.3 billionin underwriting losses in 2012 as compared to a $1.7 billion underwriting gain in 2011.
9 SRA definition of Underwriting Gains from www.rma.usda.gov/pubs/ra/#09SRA10 Statement by RMA Administrator Eldon Gould before the House Agriculture Subcommittee on GeneralFarm Commodities and Risk Management, June 7, 2007.11 Ibid.12 Ibid.

Federal Crop Insurance ProgramProfitability and Effectiveness Analysis
Grant Thornton LLPPrepared on behalf of National Crop Insurance Services, Inc. 9
On the other hand, the P&C industry had record claims in 2011 due to catastrophes in thatyear. The reduction in the number of claims in 2012 caused the P&C industry’s 2012underwriting loss to be one-third of its 2011 loss. As a result, the P&C industry’s Pretax NetIncome almost doubled from $23.7 billion to $44.5 billion between 2011 and 2012, while itsprofit margin increased from 9.2% to 16.7%.
In addition to the comparison of MPCI and P&C Pretax Net Income, we also analyzedMPCI and P&C returns and the risk associated with those returns in the form of their annualstandard deviation.13 To measure returns for the MPCI program, we divided aggregateannual Pretax Net Income by aggregate annual Retained Premiums.14 To measure P&Creturns, we divided aggregate annual Pretax Net Income by aggregate annual Net EarnedPremiums15 minus aggregate annual Total Net Expenses to obtain Adjusted Net EarnedPremiums (“Adj. NEP”). As discussed in the methodology section above, premium data forMPCI and P&C lines are not stated on the same basis. P&C premiums are expense loaded,while MPCI premiums are not. Expenses for MPCI policies are intended to be reimbursedthrough the A&O Reimbursement. The removal of the expense loading from the P&Cpremiums ensures that comparisons of P&C and MPCI returns are developed on consistentbases, with denominators of each ratio representing the expected indemnities under eachprogram.
Risk is typically measured as the standard deviation of values. If investors are risk averse,then they will require higher expected returns (or profits) when risks are greater. This is thetypical “risk versus reward” analysis referred to in investing literature. In general, one wouldexpect a higher return when taking on more risk.
Exhibits 1 and 2 provide both simple and weighted average returns and the standarddeviation of those returns for the MPCI program and the P&C industry, respectively.16
The MPCI program has a lower weighted average return of 11.6% compared to 17.0% forthe P&C industry. Risk as measured by the weighted standard deviation was 14.7% for theMPCI program compared to 9.2% for the P&C industry. The MPCI program also has a
13 Standard deviation is a standard statistical measure of spread in a distribution of values. Previous versions ofthis report calculated the unweighted or simple standard deviation of the returns. This report calculates theweighted standard deviation as well. In this report, the weights equal Retained Premiums (or Adjusted NetEarned Premiums) in a given year divided by the total Retained Premiums (or Adjusted Net Earned Premiums)observed between 1992 and 2012, inclusive, for the MPCI industry (or the P&C industry). The weightedstandard deviation is computed by taking the square root of the sum of the square of the difference betweenactual returns and expected returns multiplied by the appropriate weight.14 2005-2012 adjusted for Quota Share.15 We chose to differ from Deloitte’s methodology by using Adj. NEP in the denominator of the return ratiorather than Adjusted Direct Earned Premiums (“Adj. DEP”). We made this change as Net Earned Premium forthe P&C industry is after reinsurance ceded as is Retained Premiums after Federal Reinsurance for the MPCIindustry.16 Milliman presents simple averages in their reports. A comparison of the simple averages for the MPCIprogram and the P&C industry from Exhibits 1 and 2 in this report, respectively, generates even strongersupport for the conclusion that is described in the next paragraph.

Federal Crop Insurance ProgramProfitability and Effectiveness Analysis
Grant Thornton LLPPrepared on behalf of National Crop Insurance Services, Inc. 10
lower simple average return of 11.6% as compared to 16.5% for the P&C industry. Thesimple standard deviation for the MPCI industry was 13.7% compared to 9.2% for the P&Cindustry.
A review of the MPCI industry’s profitability over time shows that while it generates profitsin many years, significant drought years like 1993, 2002 and 2012 demonstrate that theindustry is susceptible to large losses as well. The threat of such losses is demonstrated bynot only the MPCI industry’s lower average profits, but also its greater riskiness.
Financial theory tells us that in general, investors require higher expected returns when risksare greater. Therefore, when allocating their capital between the investment alternatives ofthe MPCI business or the P&C industry, a rational investor would be expected to choose toinvest in the P&C industry, as over the long-term it has provided greater profits or returnswith less variability or risk than the MPCI program.
The greater risk of the MPCI program is inherent in its structure. As previously detailed, theP&C industry has greater control over its ratemaking and underwriting activities.17 Insurerscan respond to underwriting losses by increasing their rates in subsequent years and/orlimiting coverage. In comparison, MPCI companies must adhere to ratemaking decisions ofand policy provisions established by FCIC/RMA, regardless of underwriting lossexperience.
The overall findings are consistent with the general findings of the previous years’ studies.Historically, the MPCI industry is at an overall economic disadvantage as compared to theP&C industry. The results of the current and previous studies are presented on the followingpage. Please note that the Grant Thornton, Deloitte, and PwC numerical results are notdirectly comparable due to differences in methodologies used and the time periods covered.The focus is on the overall results of the various studies.18
17 Please refer to chart on page 3 of this Report.18 This table updates the standard deviation to be weighted standard deviations for all Grant Thornton reports.All Grant Thornton calculations for MPCI are adjusted for Quota Share. Whereas PwC utilized Surplus as thedenominator in the MPCI calculations, Deloitte and Grant Thornton used Retained Premium in thedenominator. PwC arrived at its Surplus estimate by assuming that it equaled 130% of Retained Premium. PwCmade such an assumption due to the difficulty in assigning Surplus to an individual insurance line like MPCI.On the other hand, Deloitte and Grant Thornton chose to use a publicly available figure such as RetainedPremium in their calculations.

Federal Crop Insurance ProgramProfitability and Effectiveness Analysis
Grant Thornton LLP 11Prepared on behalf of National Crop Insurance Services, Inc. 11
Profitability P&C Industry MPCI Industry
Report Period Metric Wtd.Avg.
Std.Dev. Metric Wtd.
Avg.Std.Dev
GrantThornton2013Update
1992-2012
Pretax NetIncome/Adj.NEP
17.0% 9.2%
Pretax NetIncome/RetainedPremium19
11.6% 14.7%
GrantThornton2012Update
1992-2011
Pretax NetIncome/Adj.NEP
17.0% 9.3%
Pretax NetIncome/RetainedPremium20
16.0% 9.3%
GrantThornton2011Update
1992-2010
Pretax NetIncome/Adj.NEP
17.5% 9.5%
Pretax NetIncome/RetainedPremium21
16.8% 9.9%
GrantThornton2010Update
1992-2009
Pretax NetIncome/Adj.NEP
17.3% 9.9%
Pretax NetIncome/RetainedPremium22
16.0% 10.2%
GrantThornton2009Update
1992-2008
Pretax NetIncome/Adj.NEP
17.5% 10.2%
Pretax NetIncome/RetainedPremium23
14.2% 10.0%
GrantThornton2008Update
1992-2007
Pretax NetIncome/Adj.NEP
18.6% 9.9%
Pretax NetIncome/RetainedPremium24
14.7% 11.1%
GrantThornton2007Update
1992-2006
Pretax NetIncome /Adj.NEP25
17.4% 9.4%
Pretax NetIncome/RetainedPremium26
12.5% 10.5%
Deloitte2004
1992-2002
Pretax NetIncome/Adj.DEP
12.7% 8.9%
Pretax NetIncome/RetainedPremium
7.9% 12.9%
PwC 1999 1988-1997/8
Pretax NetIncome/Surplus 16.6% 7.6%
Pretax NetIncome/Surplus27
15.8% 10.1%
PwC 1997 1988-1995
Pretax NetIncome/Surplus 14.1% 7.3%
Pretax NetIncome/Surplus25
11.7% 10.4%

Federal Crop Insurance ProgramProfitability and Effectiveness Analysis
Grant Thornton LLP 12Prepared on behalf of National Crop Insurance Services, Inc. 12
As detailed in the above table, the P&C industry has consistently reported higherprofitability, usually with less variability in results. In general, this indicates that theparticipants in the overall P&C industry have the ability to generate greater returns with lessrisk, and therefore hold a competitive advantage over the MPCI program.
EFFECTIVENESS ANALYSISA second basis for comparison between the MPCI program and the P&C industry is theirexpense ratios. Although there are similarities in the types of expenses incurred by bothbusinesses, expenses incurred by MPCI companies are unique in the insurance industry andinvolve some costs not usually incurred in other insurance lines, such as loss adjustmenttraining for a wide variety of crops.
We have defined the MPCI Expense ratio as Total Expenses divided by Gross Premiums,while the P&C Expense ratio is defined as Total Expenses divided by Direct PremiumsWritten net of Expenses (“Adjusted DPW”).19 As previously stated, expenses are removedfrom P&C premiums in order to restate those premiums on a consistent basis with MPCIpremiums, which are not expense loaded. Total Expenses include Loss Adjustment Expense,Commissions and Other Expenses incurred while selling and servicing business.20
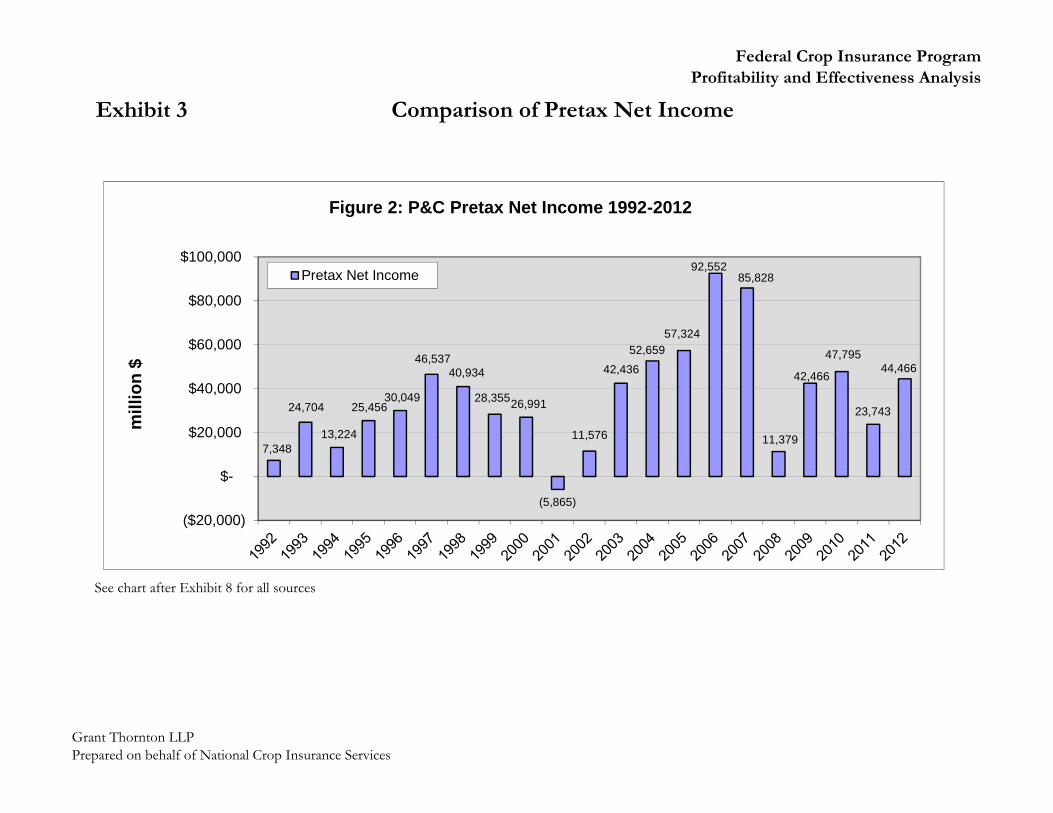
Exhibit 4 shows the Total Expense to Gross Premium ratio for the MPCI program hasdeclined significantly over time. Since 1993, MPCI Total Expense ratios have never beenabove 34.2%, and since 2004, they have not exceeded 25.1%. Exhibit 4 also shows that theTotal Expense ratio for the MPCI program is well below the Total Expense ratio observedfor the P&C industry. The wide gap between the two programs is due to the fact that P&Cindustry expenses average close to a third of the total premium. After removing expensesfrom the premium, the P&C expense ratio rises to roughly 60% on average of the expectedbenefits delivered to policyholders. The major categories of expense used in our analysis areCommissions, Loss Adjustment Expense, and Other Expenses, which include salaries ofcompany employees, IT support and overhead expenses. Exhibit 5 provides a breakdownof the components of the Total Expense ratio; the three additional ratios presented are LossAdjustment Expense/Premium, Commission/Premium and Other Expense/Premium.Overall, the MPCI program has lower expense ratios in all three categories.
19 As previously noted, in order to compare the P&C expense ratios to those of the MPCI program, we need toaccount for the fact that the MPCI premium is not expected to cover expenses. In contrast, P&C industrypremiums are expected to cover both losses and expenses. To ensure that ratios were comparable, we reducedthe P&C Direct Written Premiums by the associated expenses. Expense ratios for the P&C industry werecalculated from those adjusted figures. MPCI expense ratios were calculated based on Gross Premiums.20 Commission expense is the part of an insurance premium paid by the insurer to an agent or broker for hisservices in procuring and servicing insurance. Loss adjustment expenses are expenses incurred to investigateand compute losses. Because Direct Earned Premiums are used in this Section, Gross Expenses are deductedrather than the Net Expenses that were deducted in the prior Section.

Federal Crop Insurance ProgramProfitability and Effectiveness Analysis
Grant Thornton LLP 13Prepared on behalf of National Crop Insurance Services, Inc. 13
The decline in MPCI Expense-Premium ratios presented in Exhibits 4 and 5 is consistentwith improved cost effectiveness of the industry as program participation has grown.21 Thisdecline has occurred even under stringent governmental requirements for insurers toprovide service to all eligible producers regardless of the cost. Because of this requirement,private companies are precluded from taking many actions that other types of insurers use tocontain costs and enhance economic viability. As a result, MPCI companies are required tooffer coverage to growers with poor insurance experience, small acreage or othercharacteristics that may make them impossible or difficult to serve profitably. While thisrequirement may significantly increase overall program costs, it does support the social goalof making crop insurance available to all eligible farmers.
Exhibit 6 focuses on commission payments to agents and brokers, which constitute morethan one-half of Total Expenses for the MPCI program. It indicates that Commission toPremium ratios for the MPCI program have never exceeded those for the P&C industry as awhole.
Exhibits 4 - 6 show that Expense to Premium ratios and A&O Reimbursement toPremium ratios increased slightly from 2011 to 2012 for the MPCI industry. The dollarvalue of the expenses incurred by and the dollar value of the reimbursements to the MPCIindustry were relatively flat between 2011 and 2012 as a result of requirements imposed bythe 2011 SRA.
Exhibit 7 compares 5-year averages (2008 - 2012) of Loss Adjustment Expense,Commission Expense and Other Expense ratios for MPCI to selected P&C lines, as well asTotal P&C industry. This is intended to address the concern that the comparison ofexpenses to the total P&C industry might not be appropriate due to the inclusion ofinsurance products intended for commercial customers. The two P&C lines, HomeownersMultiple Peril and Private Passenger Automobile Physical Damage coverage, representinsurance coverages sold to individuals rather than to businesses. An additional criterionwas to select coverages with low levels of litigation activity to ensure that the MPCI programwas compared to P&C coverages that use a similar approach for adjusting claims. The exhibitindicates that Loss Adjustment and Other expense ratios for MPCI are less than either of theselected P&C lines as well as Total P&C industry. While the Commission expense ratio forthe Private Passenger Auto Physical Damage line was slightly less than MPCI, the MPCICommission expense ratio was below that for Homeowners Multiple Peril as well as theP&C industry as a whole.
21 Program participation rates (defined as the ratio of net insured acres to total eligible acres) have increaseddramatically in the past two decades. In 1980, the participation rate was less than 10%. By 1990, participationrates had increased to around 40%, where they hovered in the early 1990s. In 1995, participation rates jumpedto over 80%. The jump in participation rates from 1994 to 1995 is coincident with the Federal Crop InsuranceReform Act of 1994, which made enrollment in the crop insurance program a precondition for participating inmany of USDA’s benefit support programs. Though participation rates decreased some after 1995, they were77% in 2006, 85% in 2007, 84% in 2008, 83% in 2009, 81% in 2010, 84% in 2011 and 86% in 2012. Percentagesupdated per National Agricultural Statistics Service data as of November 2013.

Federal Crop Insurance ProgramProfitability and Effectiveness Analysis
Grant Thornton LLP 14Prepared on behalf of National Crop Insurance Services, Inc. 14
A&O REIMBURSEMENT SHORTFALLAs shown in Exhibit 1, column (1), the crop insurance industry’s Net Expense Gain (Loss)from the listed sources indicate that the amount of the MPCI expenses has exceeded A&OReimbursements every year since 1997. Renegotiations of the SRA and the passage of theAgricultural Research, Extension and Education Reform Act of 1998 have significantlyreduced A&O Reimbursements over time. Since 1998, the A&O Reimbursements havefallen short of MPCI incurred expenses by more than $100 million annually. In 2002, 2006and 2007 the unreimbursed amounts exceeded $200 million, and in 2009, 2010, 2011 and2012 the unreimbursed amount exceeded $430 million. The large deficits in 2009 andfollowing years are due in part to the reduction in A&O reimbursements arising from the2008 Farm Bill. (Discussed in the Section below) In general, A&O in recent years has beensufficient to cover agent compensation and very little else. See Exhibit 5. The 2011 SRAintroduced caps on agent compensation while simultaneously capping A&Oreimbursements. (Discussed in the 2011 Standard Reinsurance Agreement section of thisreport) The most recent annual deficit decreased to $430.6 million from $561.9 million inthe previous year. This decrease is the result of the SRA requirement that companies paycontingent commissions out of their countrywide Net Underwriting gains. Most companieswere unable to pay contingent commissions in 2012 due to losses from the drought.
Exhibit 8 compares the historical level of expenses incurred in delivering crop insurance bythe MPCI companies to the historical level of A&O Reimbursements. It indicates thatalthough the MPCI companies have reduced expenses over time through efficiencies, theA&O Reimbursements have regularly fallen short of covering the expenses incurred. Theinadequacy of the A&O Reimbursements is absorbed by the MPCI companies through areduction in their pre-tax net income.
EFFECT OF THE 2008 FARM BILLThe Food, Conservation, and Energy Act of 2008 (“2008 Farm Bill”) introduced changesstarting with the 2009 reinsurance year which affected the profitability of MPCI companiesby reducing the amount of A&O Reimbursement and delaying payment by FCIC of bothA&O Reimbursement and Underwriting Gains as noted below:
7 U.S.C. § 1508 (b) (11) CAT Loss Adjustment Expense Reimbursement:o Reduced the maximum rate of reimbursement for “expenses incurred by
the approved insurance provider or agent for loss adjustment” from 7.0%22 to6.0% of “the premium for catastrophic risk protection that is used to defineloss ratio.”
7 U.S.C. § 1508 (k) (4) Reinsurance A&O Reimbursement:o Effective beginning with the 2012 reinsurance year, delays the reimbursement
of allowable A&O costs to October of the following reinsurance year.Reimbursements covering the 2012 reinsurance year ending June 30, 2012
22 The 2008 Farm Bill states the reduction is from 8% to 6%; however, the 2005 SRA had previously reduced theactual reimbursement rate from 8% to 7%.

Federal Crop Insurance ProgramProfitability and Effectiveness Analysis
Grant Thornton LLP 15Prepared on behalf of National Crop Insurance Services, Inc. 15
will not be paid until October 2012.o For the 2009 and 2010 reinsurance year, reduced the rate of reimbursement of
allowable A&O costs for additional (buy-up) coverage (originally 24.2%) by2.3 percentage points. Only half of the reduction will apply “to the totalpremium written in a State in which the State loss ratio is greater than 1.2.”
o Effective beginning with the 2009 reinsurance year, reduced thereimbursement rate for area policies and plans of insurance to 12.0% of thegross (net book) premium.
7 U.S.C. § 1508 (k) (9) Due Date for Payment of Underwriting Gains:o Effective beginning with the 2011 reinsurance year, delays the payment of
underwriting gains to October 1st of the following calendar year. Paymentsfor underwriting gains covering the 2011 reinsurance year ending June 30,2011 would not be paid until October 1, 2012.
THE 2011 STANDARD REINSURANCE AGREEMENT
RMA and the crop insurance industry renegotiated the terms of the Standard ReinsuranceAgreement during late 2009 and the first half of 2010. These changes became effective onJuly 1, 2010, the start of the 2011 reinsurance year. The major changes included a sharpreduction in underwriting gain potential in certain states, modest changes in gain and losspotential in other states, and the introduction of an upper limit on the amount of A&Oreimbursements to be paid to the companies participating in the program. The followinghighlight these major changes and their effect on the year in review.
A&O reimbursements were previously paid as a fixed percentage of net book premiums.Under the new agreement, total reimbursements for 2011 were set at a fixed levelcomparable to 2010, despite the significant increase in gross premiums. A&O in subsequentyears would include a small increase for expected inflation. Exhibit 5 shows that thisresulted in a smaller ratio of A&O reimbursements to gross premiums (12.6 % in 2012 and11.5% in 2011 compared to 18.0% in 2010).
SUMMARY AND CONCLUSIONS
This report analyzes the profitability and effectiveness of the MPCI program based onavailable data. Specifically, it presents Pretax Net Income, risk and return profiles for theMPCI industry to the broader P&C industry. It also compares expense ratios for the twoindustries. It further examines MPCI’s historical subsidies for A&O Reimbursements andtheir shortfall when compared to actual expenses incurred by the MPCI companies.
The results of this analysis continue to indicate that the MPCI program is at a risk-returndisadvantage relative to the P&C industry. The P&C industry experienced an annual net lossin only one year in its history, 2001, largely due to the extraordinary losses related to theSeptember 11 attack on the World Trade Center and Pentagon. In contrast, the MPCIprogram as a whole lost money in three years between 1992 and 2012 alone (1993, 2002 and

Federal Crop Insurance ProgramProfitability and Effectiveness Analysis
Grant Thornton LLP 16Prepared on behalf of National Crop Insurance Services, Inc. 16
2012). The delivery cost of the MPCI program as measured by the ratio of expenses topremium continues to be substantially better than the corresponding ratio for the P&Cindustry. In addition, total A&O Reimbursements have fallen short of MPCI companies’total expenses for all years since 1997. The results of this analysis may be updated andaugmented as additional data and information become available.

Federal Crop Insurance ProgramProfitability and Effectiveness Analysis
Exhibit 1
CalendarYear
Net ExpenseGain/(Loss) [a]
Net UnderwritingGain/(Loss) [b]
Net Book QuotaShare Gains for
State Group 3 [c] Pretax Net IncomeRetained Premium
[d]Pretax Net Income /Retained Premium
Formula (1) (2) (3) (4) = (1)+(2)+(3) (5) (6) = (4)/(5)1992 5.4$ 21.8$ -$ 27.2$ 465.6$ 5.8%1993 2.6 (83.3) - (80.7) 434.5 -18.6%1994 (4.1) 103.3 - 99.2 534.5 18.6%1995 20.3 131.7 - 152.0 768.5 19.8%1996 1.3 247.5 - 248.8 1,155.1 21.5%1997 (60.5) 352.1 - 291.6 1,263.1 23.1%1998 (109.7) 279.2 - 169.5 1,591.7 10.6%1999 (113.5) 271.8 - 158.3 1,836.9 8.6%2000 (140.1) 281.8 - 141.7 1,894.2 7.5%2001 (179.9) 345.9 - 166.0 2,373.0 7.0%2002 (200.3) (47.4) - (247.7) 2,295.0 -10.8%2003 (164.8) 378.4 - 213.6 2,607.1 8.2%2004 (134.0) 692.0 - 558.0 3,145.2 17.7%2005 (160.9) 916.4 - 755.5 2,892.9 26.1%2006 (201.2) 842.4 - 641.2 3,501.9 18.3%2007 (233.5) 1,597.4 - 1,363.9 4,898.7 27.8%2008 (160.8) 1,105.1 - 944.3 7,743.8 12.2%2009 (476.1) 2,226.4 - 1,750.3 6,626.6 26.4%2010 (525.3) 1,914.3 - 1,389.0 6,052.6 22.9%2011 (561.9) 1,666.9 26.6 1,131.6 9,531.4 11.9%2012 (430.6) (1,316.2) - (1,746.8) 8,639.8 -20.2%
Totals (3,827.6)$ 11,927.5$ 26.6$ 8,126.5$ 70,252.1$
1992-2012 Simple Average 11.6%Simple Standard Deviation 13.7%
Weighted Average 11.6%Weighted Standard Deviation 14.7%
See chart after Exhibit 8 for all sources
Profitability of the MPCI Program(in millions)
Grant Thornton LLPPrepared on behalf of National Crop Insurance Services

Federal Crop Insurance ProgramProfitability and Effectiveness Analysis
Exhibit 2
CalendarYear
Net UnderwritingGain/(Loss) [a]
Net InvestmentIncome [a]
Realized CapitalGain/(Loss) [b]
Pretax NetIncome
Net EarnedPremium [c]
Total NetExpenses [d]
Adjusted NetEarned
Premium
Pretax NetIncome /
Adjusted NEPFormula (1) (2) (3) (4) = (1)+(2)+(3) (5) (6) (7) = (5) - (6) (8) = (4) / (7)
1992 (36,260)$ 33,734$ 9,874$ 7,348 225,778$ 92,288$ 133,490$ 5.5%1993 (18,094) 32,645 10,153 24,704 235,514 94,910 140,604 17.6%1994 (22,083) 33,687 1,620 13,224 244,230 98,557 145,673 9.1%1995 (17,375) 36,834 5,997 25,456 254,048 104,074 149,974 17.0%1996 (17,162) 37,962 9,249 30,049 266,552 106,147 160,405 18.7%1997 (6,030) 41,499 11,068 46,537 275,801 110,275 165,526 28.1%1998 (17,669) 41,097 17,506 40,934 280,335 115,450 164,885 24.8%1999 (24,750) 40,071 13,034 28,355 285,501 118,804 166,697 17.0%2000 (32,143) 42,650 16,484 26,991 298,233 121,790 176,443 15.3%2001 (52,692) 39,849 6,978 (5,865) 317,596 129,303 188,293 -3.1%2002 (32,347) 41,099 2,824 11,576 358,554 142,043 216,511 5.3%2003 (5,230) 41,147 6,519 42,436 399,126 153,895 245,231 17.3%2004 1,692 41,776 9,191 52,659 423,662 162,830 260,832 20.2%2005 (6,676) 51,879 12,121 57,324 428,763 167,916 260,847 22.0%2006 34,141 54,826 3,585 92,552 445,527 172,735 272,792 33.9%2007 18,779 58,054 8,995 85,828 447,953 175,719 272,234 31.5%2008 (21,819) 54,421 (21,223) 11,379 446,301 174,477 271,824 4.2%2009 (198) 50,918 (8,254) 42,466 426,195 172,416 253,779 16.7%2010 (10,362) 49,861 8,296 47,795 425,137 174,853 250,284 19.1%2011 (35,207) 51,370 7,580 23,743 438,584 179,125 259,459 9.2%2012 (13,806) 49,237 9,035 44,466 450,391 184,193 266,198 16.7%
Totals (315,291)$ 924,616$ 140,632$ 749,957$ 7,373,781$ 2,951,800$ 4,421,981$
1992-2012 Simple Average 16.5%Simple Standard Deviation 9.2%
Weighted Average 17.0%Weighted Standard Deviation 9.2%
See chart after Exhibit 8 for all sources
Profitability of the Property & Casualty Insurance Industry(in millions)
Grant Thornton LLPPrepared on behalf of National Crop Insurance Services

Federal Crop Insurance ProgramProfitability and Effectiveness Analysis
Exhibit 3 Comparison of Pretax Net Income
27.2
(80.7)
99.2 152.0248.8
291.6169.5
158.3141.7
166.0
(247.7)
213.6
558.0755.5
641.2
1,363.9944.3
1,750.31,389.0
1,131.6
(1,746.8) $(2,000)
$(1,500)
$(1,000)
$(500)
$-
$500
$1,000
$1,500
$2,000
mill
ion
$
Figure 1: MPCI Pretax Net Income 1992-2012
Pretax Net Income
Grant Thornton LLPPrepared on behalf of National Crop Insurance Services
Federal Crop Insurance ProgramProfitability and Effectiveness Analysis
Exhibit 3 Comparison of Pretax Net Income
See chart after Exhibit 8 for all sources
7,348
24,704
13,224
25,45630,049
46,53740,934
28,35526,991
(5,865)
11,576
42,436
52,65957,324
92,55285,828
11,379
42,466
47,795
23,743
44,466
($20,000)
$-
$20,000
$40,000
$60,000
$80,000
$100,000
mill
ion
$
Figure 2: P&C Pretax Net Income 1992-2012
Pretax Net Income
Grant Thornton LLPPrepared on behalf of National Crop Insurance Services

Federal Crop Insurance ProgramProfitability and Effectiveness Analysis
Exhibit 3.1 Comparison of Pretax Net Income as a Percentage of Premium
5.8%
-18.6%
18.6%19.8% 21.5%23.1%
10.6% 8.6%
7.5% 7.0%
-10.8%
8.2%
17.7%
26.1%
18.3%
27.8%
12.2%
26.4%22.9%
11.9%
-20.2%
-30%
-20%
-10%
0%
10%
20%
30%
40%
perc
enta
ge %
Figure 1: MPCI Pretax Net Income % of Retained Premium 1992-2012
Pretax Net Income / Retained Premium Weighted Average
Grant Thornton LLPPrepared on behalf of National Crop Insurance Services

Federal Crop Insurance ProgramProfitability and Effectiveness Analysis
Exhibit 3.1 Comparison of Pretax Net Income as a Percentage of Premium
See chart after Exhibit 8 for all sources
5.5%
17.6%
9.1%
17.0%18.7%
28.1%
24.8%
17.0%15.3%
-3.1%
5.3%
17.3%
20.2%22.0%
33.9%31.5%
4.2%
16.7%19.1%
9.2%
16.7%
-10%
0%
10%
20%
30%
40%
perc
enta
ge %
Figure 2: P&C Pretax Net Income % of Adj Net Earned Premium 1992-2012
Pretax Net Income / Adjusted NEP Weighted Average
Grant Thornton LLPPrepared on behalf of National Crop Insurance Services

Federal Crop Insurance ProgramProfitability and Effectiveness Analysis
Exhibit 4 Total Expense to Premium RatiosMPCI vs. Property & Casualty
See chart after Exhibit 8 for all sources
0.0%
10.0%
20.0%
30.0%
40.0%
50.0%
60.0%
70.0%
MPCI
Total P&C Industry
Grant Thornton LLPPrepared on behalf of National Crop Insurance Services

Federal Crop Insurance ProgramProfitability and Effectiveness Analysis
Exhibit 5
5.1: MPCI
YearLoss Adjustment Expense
/ Gross PremiumCommission /Gross Premium
Other Expense /Gross Premium
Total Expense /Gross Premium
A&O Reimbursement /Gross Premium
A&O ReimbursementExcess / (Shortfall)
1992 4.2% 16.0% 13.6% 33.8% 34.6% 0.8%1993 5.4% 16.8% 12.0% 34.2% 34.6% 0.4%1994 3.9% 17.0% 10.3% 31.1% 30.7% -0.4%1995 3.9% 14.9% 9.8% 28.6% 30.2% 1.6%1996 3.6% 15.9% 9.4% 28.9% 29.0% 0.1%1997 3.4% 15.6% 10.6% 29.7% 26.1% -3.6%1998 3.7% 16.6% 9.2% 29.5% 23.7% -5.8%1999 3.1% 15.5% 8.0% 26.6% 21.6% -4.9%2000 3.5% 15.9% 7.9% 27.3% 21.8% -5.5%2001 3.7% 15.7% 8.1% 27.4% 21.4% -6.0%2002 4.2% 15.8% 8.4% 28.4% 21.5% -6.9%2003 3.3% 15.9% 6.9% 26.2% 21.4% -4.8%2004 2.8% 15.6% 6.0% 24.4% 21.2% -3.2%2005 3.3% 15.2% 6.6% 25.1% 21.0% -4.1%2006 2.9% 15.6% 6.2% 24.6% 20.3% -4.3%2007 2.3% 17.0% 4.6% 23.9% 20.4% -3.6%2008 1.8% 16.8% 3.0% 22.1% 20.4% -1.6%2009 2.5% 17.0% 4.1% 23.8% 18.3% -5.5%2010 2.8% 16.7% 5.2% 24.9% 18.0% -6.9%2011 2.2% 10.7% 3.4% 16.2% 11.5% -4.7%2012 2.7% 9.8% 4.0% 16.5% 12.6% -3.9%
Simple Averages1992-2012 3.3% 15.5% 7.5% 26.3% 22.9% -3.5%
Expense to Premium Ratios
Grant Thornton LLPPrepared on behalf of National Crop Insurance Services
Federal Crop Insurance ProgramProfitability and Effectiveness Analysis
Exhibit 5 Expense to Premium Ratios
5.2: Total P&C Industry
YearGross Loss Adjustment
Expense / Adjusted DPW [a]Gross Commission /
Adjusted DPW [a]Gross Other Expense /
Adjusted DPW [a]Total Gross Expense/ Adjusted DPW [a]
1992 21.7% 18.1% 22.8% 62.6%1993 20.0% 17.1% 22.7% 59.9%1994 20.1% 17.3% 22.3% 59.6%1995 20.8% 17.6% 23.1% 61.6%1996 20.1% 18.2% 22.7% 60.9%1997 19.5% 18.8% 23.5% 61.8%1998 21.2% 19.1% 24.6% 64.9%1999 20.9% 19.4% 25.3% 65.7%2000 19.3% 18.6% 23.6% 61.5%2001 19.7% 18.2% 21.7% 59.6%2002 18.6% 17.4% 20.5% 56.4%2003 18.0% 17.2% 20.0% 55.3%2004 18.8% 17.8% 19.9% 56.5%2005 22.8% 18.1% 21.1% 62.0%2006 17.8% 17.5% 21.3% 56.7%2007 17.4% 17.8% 22.2% 57.3%2008 18.7% 18.5% 24.8% 62.0%2009 20.4% 18.6% 24.5% 63.5%2010 19.3% 18.6% 25.1% 63.0%2011 18.8% 18.1% 24.3% 61.2%2012 18.4% 18.2% 24.5% 61.1%
Simple Averages1992-2012 19.6% 18.1% 22.9% 60.6%
[a] Adjusted DPW equals Direct Premium Written less Total Expenses
See chart after Exhibit 8 for all sources
Grant Thornton LLPPrepared on behalf of National Crop Insurance Services

Federal Crop Insurance ProgramProfitability and Effectiveness Analysis
Exhibit 6 Commission Expense to Premium RatiosMPCI vs. Property & Casualty
See chart after Exhibit 8 for all sources
0.0%
5.0%
10.0%
15.0%
20.0%
25.0%
MPCITotal P&C Industry
Grant Thornton LLPPrepared on behalf of National Crop Insurance Services

Federal Crop Insurance ProgramProfitability and Effectiveness Analysis
Exhibit 7
See chart after Exhibit 8 for all sources
5-yr Average of Loss Adjustment, Commission and Other Expenses to Premium RatiosMPCI to Various Property & Casualty Insurance Lines
Comparison of Expense Ratios
2.4%
14.7% 15.5%19.1%
0.0%
10.0%
20.0%
30.0%
5-Year Average (2008-2012) Loss Adjustment Exp % of ADWPMPCI
Private Passenger Auto PhysicalDamageHomeowners Multiple Peril
Total P&C
13.7% 14.2%18.4%
21.3%
0.0%
10.0%
20.0%
30.0%
5-Year Average (2008-2012) Commission Exp % of ADWPPrivate Passenger Auto PhysicalDamageMPCI
Total P&C
Homeowners Multiple Peril
3.9%
23.3% 23.6% 24.6%
0.0%
10.0%
20.0%
30.0%
5-Year Average (2008-2012) Other Exp % of ADWPMPCI
Homeowners Multiple Peril
Private Passenger Auto PhysicalDamageTotal P&C
Grant Thornton LLPPrepared on behalf of National Crop Insurance Services

Federal Crop Insurance ProgramProfitability and Effectiveness Analysis
Exhibit 8
See chart after Exhibit 8 for all sources
Comparison of A&O Reimbursement to Total ExpenseRatio of A&O Reimbusement to Gross Premium and Total Expense to Gross Premium
0.0%
5.0%
10.0%
15.0%
20.0%
25.0%
30.0%
35.0%
40.0%
MPCI Expense Ratio
A&O Reimbursement Ratio
Grant Thornton LLPPrepared on behalf of National Crop Insurance Services

Federal Crop Insurance ProgramProfitability and Effectiveness Analysis
[a] Expenses:1992-1998: PwC 1999 Update Exhibit 4 and Deloitte 2004 Report Exhibit 5.11999-2012: Surveys of NCIS member companiesA&O Reimbursement:1992-2006: MPCI data from RMA charts, August 14, 2007 as provided by NCIS2007-2012: Surveys of NCIS member companies
[b] 1992-1994: MPCI data from RMA charts, August 14, 2007 as provided by NCIS1995-2006: Net Underwriting Gain/Loss data from RMA, excludes CAT business written by FSA2007-2012: Surveys of NCIS member companies
[c] 2011-2012: Surveys of NCIS member companies.Current year estimated at time of survey, prior year amount was adjusted based on amounts reported in currentyear survey
[d] 1992-2006: From Net Underwriting Gain/(Loss) data per RMA adjusted to remove CAT business written byFSA2007: RMA Reinsurance runs as of October 20082008-2012: Surveys of NCIS member companies
[a] 1992-2002: Best's Aggregates & Averages 2007, Industry Operating Results, p. 407, includes State Funds2003-2012: Best's Aggregates & Averages 2013, Industry Operating Results, p. 367, includes State Funds
[b] 1992-1996: PriceWaterhouseCoopers 1999 Update, Exhibit 1 (used in Deloitte 2004 report Exhibit 2)1997-2000: Best's Aggregates & Averages 2002, QAR p. 1062001: Best's Aggregates & Averages 2006, QAR, p. 892002-2004: Best's Aggregates & Averages 2007, QAR, p. 912005: Best's Aggregates & Averages 2010, QAR, p. 812006: Best's Aggregates & Averages 2011, QAR, p. 812007: Best's Aggregates & Averages 2012, QAR, p. 812008-2012: Best's Aggregates & Averages 2013, QAR, p. 81
Sources to Exhibits
Exhibit 1
Exhibit 2
Grant Thornton LLPPrepared on behalf of National Crop Insurance Services

Federal Crop Insurance ProgramProfitability and Effectiveness Analysis
Sources to Exhibits
[c] 1992-1995: Best's Aggregates & Averages 2002, Cumulative By Line Underwriting Experience, Net Premiums, p.2781996: Best's Aggregates & Averages 2006, Cumulative By Line Underwriting Experience, Net Premiums, p. 4071997 & 2000: Best's Aggregates & Averages 2007, Cumulative By Line Underwriting Experience, Net Premiums,p. 4171998-1999 & 2001-2002: Best's Aggregates & Averages 2008, Cumulative By Line Underwriting Experience, NetPremiums, p. 4172003-2012: Best's Aggregates & Averages 2013, Cumulative By Line Underwriting Experience, Net Premiums, p.377
[d] 1992-1995: PriceWaterhouseCoopers 1999 Update, Exhibit 1 (used in Deloitte 2004 report Exhibit 2)1996: calculated from ratios in Best's Aggregates & Averages 2006, Cumulative By Line Underwriting Experience,Net Premiums, p. 4071997 & 2000-2001: calculated from ratios in Best's Aggregates & Averages 2007, Cumulative By LineUnderwriting Experience, Net Premiums, p. 4171998-1999 & 2002-2003: calculated from ratios in Best's Aggregates & Averages 2008, Cumulative By LineUnderwriting Experience, Net Premiums, p. 4172004-2012: calculated from ratios in Best's Aggregates & Averages 2013, Cumulative By Line UnderwritingExperience, Net Premiums, p. 377The values derived from ratios in Best’s Aggregates and Averages could differ from actuals due to rounding.
Exhibit 3 Exhibits 1 and 2Exhibit 3.1 Exhibits 1 and 2Exhibit 4 Exhibits 5.1 and 5.2
Expenses:1992-1998: PwC 1999 Update Exhibit 4 and Deloitte 2004 Report Exhibit 5.11999-2012: Surveys of NCIS member companiesA&O Reimbursement:1992-2006: MPCI data from RMA charts, August 14, 2007 as provided by NCIS2007-2012: Surveys of NCIS member companies
Exhibit 5.1
Exhibit 2
Grant Thornton LLPPrepared on behalf of National Crop Insurance Services

Federal Crop Insurance ProgramProfitability and Effectiveness Analysis
Sources to Exhibits
1992-1995: PwC 1999 Update Exhibit 4 and Deloitte 2004 Report Exhibit 5.21996: A.M. Best's Aggregates & Averages 2006, expense ratios converted to adjusted Direct Premiums Written1997 & 2000: A.M. Best's Aggregates & Averages 2007, expense ratios converted to adjusted Direct PremiumsWritten1998-1999 & 2001-2003: A.M. Best's Aggregates & Averages 2008, expense ratios converted to adjusted DirectPremiums Written2004-2012: A.M. Best's Aggregates & Averages 2013, expense ratios converted to adjusted Direct PremiumsWritten
Exhibit 6 Exhibits 5.1 and 5.2Homeowners Multiple Peril, Private Passenger Auto Physical Damage, and Total P&C (Total AllLines):2008-2012: A.M. Best's Aggregates & Averages 2013 pgs 380, 383, 385.MPCI2008-2012: Surveys of NCIS member companies
Exhibit 8 Exhibit 5.1
Exhibit 5.2
Exhibit 7
Grant Thornton LLPPrepared on behalf of National Crop Insurance Services