Fed: Hike Until It Breaks – July 2017 - … Hike Until It Breaks PCM Report July 2017 Volume 8,...
7
Copyright 2017 © Peak Capital Management, LLC, All Rights Reserved 1 Fed: Hike Until It Breaks PCM Report July 2017 Volume 8, Issue 7 Fed Chair Yellen constantly reinforces to the markets that Fed policy initiatives are going to be “data dependent” but increasingly that promise looks hollow. Lacy Hunt, at the recently concluded Strategic Investment Conference (SIC) hosted by John Mauldin, overwhelmed the audience with data points that suggests the Fed has no business raising interest rates. Since we are all predominately looking at the same da- ta, there are limited explanations for divergent policy paths. Let’s analyze the three most likely scenarios: the need to nor- malize interest rates, reloading the monetary policy gun for the next recession, and the nefarious motivation that the Fed is being political. 1. The need to normalize interest along the lines of the Phillips curve is the most compelling rationale for hiking rates but it does make some question the timing. The Fed has never acknowledged that massive quantitative easing and ZIRP (zero-interest-rate-policy) failed to achieve its policy targets even though that seems obvious to most observers. The Fed had ample opportunity as early as 2013 to hike rates when the market was actually pricing in rate hikes and they waited. There are now clear signs we are entering the tail end of the current expansionary cycle, so many question the need to normal- ize now. 2. Reloading the monetary policy gun, i.e. giving the Fed bullets to cut rates when the next recession comes, is a popular view regarding the Fed’s motivation. The signs that suggest a recession could be closer on the horizon could be the impedance for rate hikes as the Fed will want room to cut rates when the economy does contract. If this is the Fed’s motivation, it is strange that they seem willing to potentially throw the economy into a recession by raising rates only to have ammunition to fight the recession they caused. 3. There is more nefarious speculation that the Fed’s action is actually politically driven and the Fed is hoping a recession is blamed on the Trump administration. Ac- knowledging there is a bit of a conspiracy theory behind this suggestion, it is not unthinkable by any means. The Fed did not hike during the Obama administration even though many of the economic data points were stronger then compared to today. Trump made it clear he does not intend to re-nominate Ms. Yellen and with three of the seven Federal Open Market Committee (FOMC) seats vacant and Yellen and Vice-Chair Fischer both gone by June 2018, it is likely the Fed will look much different next year. Fed Presidents Kashkari and Dudley both gave speeches recently acknowledging the Fed’s recent head scratching. They are depending upon models that suggest when the labor market is tight, certainly the case today, that wages will move higher and companies will protect their margins by passing along the higher costs to consumers leading to inflation. Belief in this model is the rationale for hiking rates even though virtually every data point suggests that wage pressure is low and falling and you cannot find signs of inflation with a microscope. Productivity gains have been virtually non-existent for nearly a decade and it is speculated that the Fed’s trusted models may have lost relevance. The drag on productivity has been largely caused by the massive increase in the regulatory burden on businesses. The economy today is influenced by companies like Amazon that are changing labor dynamics. McDonalds just announced they will be replacing cashiers with automated kiosks and a huge percentage of new jobs are either part-time or are in low-paying service sector jobs. Most telling may be the latest readings on the Citi Economic Surprise Index. This index, which historically is positively correlated with the S&P 500, is a widely followed indicator of how actual economic data matches expectations. While confidence and sentiment have remained high, the economy has consistently disappointed and the Surprise index is currently at depths not seen since August 2011 when the U.S. stood on the precipice of defaulting on its debt. To rely on a model of what is supposed to happen instead of responding to actual data seems to be a leap of faith that the Fed is taking and no one can know for certain what their motivation is. Are they secretly acknowledging Quantitative Easing (QE) was a failure or could they be preparing a parting shot at the new administration? Maybe Janet Yellen can take a cue from professional athletes and key note speakers and start press conferences with her own theme song. My suggestion? Don’t Stop Believing. The Fed increasingly looks like they operate more out of faith than relying on data.
Transcript of Fed: Hike Until It Breaks – July 2017 - … Hike Until It Breaks PCM Report July 2017 Volume 8,...
Copyright 2017 © Peak Capital Management, LLC, All Rights Reserved 1
Fed: Hike Until It Breaks PCM Report July 2017 Volume 8, Issue 7
Fed Chair Yellen constantly reinforces to the markets that Fed policy initiatives are going to be “data dependent” but increasingly that promise looks hollow. Lacy Hunt, at the recently concluded Strategic Investment Conference (SIC) hosted by John Mauldin, overwhelmed the audience with data points that suggests the Fed has no business raising interest rates. Since we are all predominately looking at the same da-ta, there are limited explanations for divergent policy paths. Let’s analyze the three most likely scenarios: the need to nor-malize interest rates, reloading the monetary policy gun for the next recession, and the nefarious motivation that the Fed is being political. 1. The need to normalize interest along the lines of the
Phillips curve is the most compelling rationale for hiking rates but it does make some question the timing. The Fed has never acknowledged that massive quantitative easing and ZIRP (zero-interest-rate-policy) failed to achieve its policy targets even though that seems obvious to most observers. The Fed had ample opportunity as early as 2013 to hike rates when the market was actually pricing in rate hikes and they waited. There are now clear signs we are entering the tail end of the current expansionary cycle, so many question the need to normal-ize now.
2. Reloading the monetary policy gun, i.e. giving the Fed bullets to cut rates when the next recession comes, is a popular view regarding the Fed’s motivation. The signs that suggest a recession could be closer on the horizon could be the impedance for rate hikes as the Fed will want room to cut rates when the economy does contract. If this is the Fed’s motivation, it is strange that they seem willing to potentially throw the economy into a recession by raising rates only to have ammunition to fight the recession they caused.
3. There is more nefarious speculation that the Fed’s action is actually politically driven and the Fed is hoping a recession is blamed on the Trump administration. Ac-knowledging there is a bit of a conspiracy theory behind this suggestion, it is not unthinkable by any means. The Fed did not hike during the Obama administration even though many of the economic data points were stronger then compared to today. Trump made it clear he does not intend to re-nominate Ms. Yellen and with three of the seven Federal Open Market Committee (FOMC) seats vacant and Yellen and Vice-Chair Fischer both gone by
June 2018, it is likely the Fed will look much different next year.
Fed Presidents Kashkari and Dudley both gave speeches recently acknowledging the Fed’s recent head scratching. They are depending upon models that suggest when the labor market is tight, certainly the case today, that wages will move higher and companies will protect their margins by passing along the higher costs to consumers leading to inflation. Belief in this model is the rationale for hiking rates even though virtually every data point suggests that wage pressure is low and falling and you cannot find signs of inflation with a microscope.
Productivity gains have been virtually non-existent for nearly a decade and it is speculated that the Fed’s trusted models may
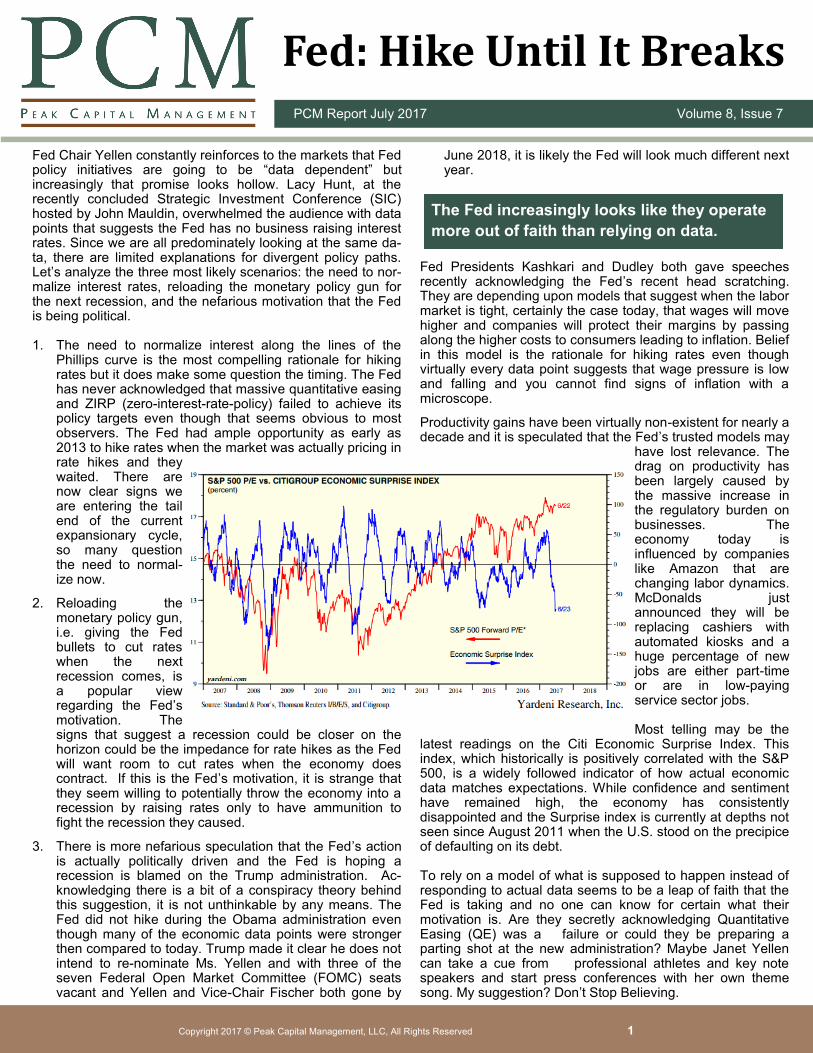
have lost relevance. The drag on productivity has been largely caused by the massive increase in the regulatory burden on businesses. The economy today is influenced by companies like Amazon that are changing labor dynamics. McDonalds just announced they will be replacing cashiers with automated kiosks and a huge percentage of new jobs are either part-time or are in low-paying service sector jobs. Most telling may be the
latest readings on the Citi Economic Surprise Index. This index, which historically is positively correlated with the S&P 500, is a widely followed indicator of how actual economic data matches expectations. While confidence and sentiment have remained high, the economy has consistently disappointed and the Surprise index is currently at depths not seen since August 2011 when the U.S. stood on the precipice of defaulting on its debt. To rely on a model of what is supposed to happen instead of responding to actual data seems to be a leap of faith that the Fed is taking and no one can know for certain what their motivation is. Are they secretly acknowledging Quantitative Easing (QE) was a failure or could they be preparing a parting shot at the new administration? Maybe Janet Yellen can take a cue from professional athletes and key note speakers and start press conferences with her own theme song. My suggestion? Don’t Stop Believing.
The Fed increasingly looks like they operate
more out of faith than relying on data.

Copyright 2017 © Peak Capital Management, LLC, All Rights Reserved 2
PCM Report July 2017 | Volume 8, Issue 7 Moving the Markets
Passive By a Landslide
Stress Free for Banks
Negative Sovereign Yields on the Rise
S&P Dow Jones has released their SPIVA Report, documenting the percent of active managers that have outperformed their passive benchmark. The data has now crossed over 15 years, and the most recent results have added insult to injury for active manag-ers. The ICI Chart seen to the left shows the consequences of underper-formance. Since 2007, there has been consistent and trending outflows of assets and decreased issuance of actively managed domestic equity funds. On the contrary, there have been significant inflows of assets in to index based domestic equity ETFs and mutual funds. The argument between active and passive is becoming less relevant though as there is now a shift to active management of passive prod-ucts, namely a dynamic hedging pro-cess of passive indexed investments.
According to a report from Fitch rating service, the amount of negative yielding sovereign (government-issued) debt jumped by $9.5 trillion in May, which represents a 10.5% increase from April. After peaking last year, the amount of negative yielding sovereign debt is back on the rise. A negative yield essentially means that investors are willing to lose money (i.e. purchasing power) for holding a government issued bond until maturity. Since peaking in November 2016 with aggressive bond buying by central banks around the world, the amount of negative yielding debt dropped to roughly $8.6 trillion in March, but is now on the rise. Even as the Fed tightens short-term rates, the longer end of the yield curve has generally edged lower.
• Over 15 years, 92.15 % of large cap managers underperformed the passive benchmark, 95.4% of mid cap managers, and 93.21% of small cap managers trailed the passive benchmark
• According to SPIVA, over 15 years, more than 58% of domestic equity funds were either merged or liquidated, 52% for global or international equity, and 49% of fixed income funds.
• Of 631 domestic equity funds that were in the top quartile as of September of 2014, 2.65% of managers stayed in the top quartile at the end of September 2016.
• Approximately $400 billion of the total rise in negative yielding debt was due to global exchange rates, particularly a stronger U.S. dollar. Since earlier this year, the USD has declined by about 5%. Furthermore, yields have declined since November of last year due to delays in the implementation of the Trump agenda. The simulative effects of tax cuts and infrastructure spending have yet to materialize.
• Central banks are the primary holders of negative yielding debt. If they begin to unwind their holdings, longer-term rates could rise materi-ally. However, this would make Trump’s deficit spending programs more expensive. At the very least, an interesting political battle between the Fed and the White House could ensue.
The 34 largest recently completed their annual DFAST (Dodd Frank Act Stress Test) and all passed with apparent ease. Not only will this likely result in the Federal Reserve approving their capital distribution plans but could provide a much needed boost for the stocks of financials after recent weakness. The stress test is designed to see how a severe recession or crisis would impact the banks reserves and ability to continue lending to consumers and businesses. Based on recommenda-tions from a Treasury Dept. report released in June, the test are likely to get easier for the banks going forward. First, the tests are likely to switch to every other year and would no longer use qualitative factors to determine whether or not banks’ capital plans are approved.
• Goldman Sachs, CIT Group and Regions Financial were seen as benefitting the most from the results with the strongest potential top tier capital ratio post-crisis while Morgan Stanley registered the lowest ratio.
• The stress test is a two-part exam with the second part being a determination by the Fed to approve or not the plans submitted by each bank with respect to returning capital to shareholders through buybacks and dividends.
• In aggregate, banks would currently maintain a tier 1 capital ratio of 9.2% post-recession, more than double the Fed requirement of 4.5% and roughly 10% higher than last year’s average of 8.4%.

Copyright 2017 © Peak Capital Management, LLC, All Rights Reserved 3
Analyst Corner PCM Report July 2017 | Volume 8, Issue 7
According to Factset, the estimated 2017 Q2 earnings growth rate for the S&P is 6.5%. Energy is projected to report the highest earnings growth of all 11 sectors at 401%. The sector is anticipated to be the largest contributor to the S&P 500 earnings. The Factset chart below shows anticipated earnings ex energy. For the quarter, ex energy earnings growth is anticipated at 3.6%. 2017 earnings growth for 2017 is 9.9% while ex energy is 7.0%. Energy is anticipating earnings of $9.6bb for Q2 2017 versus $1.9bb in Q2 2016. Despite falling oil prices, analysts continue to project appreciation in oil. Even if prices do not appreciate according to projections, earnings projections may be reduced. 2016 earnings set a very low bar, providing substantial growth projections. According to Thompson Reuters, energy profits are up 683% from last year.
Macro View – High Octane Energy Estimates
Some interesting data has recently been reported giving further explanation to the headwinds active managers face in their war against passive investing and indexes. There are simply dramatically less publicly traded companies to choose from that years past. According to the Center for Research in Security Prices at the University of Chicago Booth School of Business, there were 7355 US stocks in November 1997 versus less than 3600 today. 2500 of the companies were small caps in 1997 versus less than 1200 today. These small cap names provided the greatest opportunity for alpha for active managers. The Wall Street Journal chart below demonstrates how dramatic the shift has been over time. Public listings peaked just before 2000, topping over 7000 companies, the majority of which were micro caps. Much of the attribution for the shift lies in greater emphasis on venture capital and private equity in capitalizing companies.
Taking Stock – Slim Pickings for Managers
Sometimes the search for value can take you to unexpected places as an investor. For example, when valuations get stretched as they are today many investors will flock to value stocks because of the expectation they have less down side risk if the market were to correct. Because you are not overpaying for these stocks, risk should be mitigated when stocks fall out of favor. Few people at the beginning of 2017, knowing the Fed was committed to hiking interest rates, thought that long-dated U.S. Treasuries would be a place to find value but that is exactly what has transpired through the first half of the year. The S&P Value index is up just 3.27% YTD while the iShares 20+ year U.S. Treasury Index has surged 7.26% YTD. As is often the case, value can sometimes be found in the strangest places.
Low volatility is typically a good indication that stocks will outperform other assets but you have to wonder if it is possible to have too much of a good thing? According to JP Morgan research, over the last 20 years there have been only 11 days when the VIX has closed at a level below 10 and 7 of those have occurred since May 15th. We have North Korea threatening a nuclear attack, a special prosecutor investigating the White House, and the Fed hiking rates; not an environment you expect volatility to be at record lows. Many algorithmic trading models today emphasize the rate of change of volatility more so than the relative level of volatility. At current levels, volatility could rise by 50% and while still being low on a relative basis it could trigger broad selling by computerized programs. Beware.
Fixed Income – Searching for Value Technical – Volatile Trend

Copyright 2017 © Peak Capital Management, LLC, All Rights Reserved 4
PCM Report Month Year | Volume #, Issue #
In the Spotlight PCM Report July 2017 | Volume 8, Issue 7
Understanding the Quality Factor We continue our series on factor investing this month by focusing on the characteristics of high quality stocks. As one of the five factors present in the equity markets, quality stocks are typically defined as companies that exhibit strong balance sheets and income statements, and as a consequence, are generally considered more defensive in nature. Quality stocks tend to have a positive economic footprint. That is, they are profitable and oftentimes pay a steady dividend. Perhaps it’s best to draw from the wisdom of the legendary investor Ben Graham and his criteria for stock selection to describe the characteristics of quality stocks. While Graham is often known as the father of value investing (another equity factor), many of his criteria for stock selection pertained to quality factors, or what he referred to as “margin of safety”. To Graham, quality stocks were not speculative, but represented enterprises that exhibited attractive, long-term investments. Graham looked for companies with attractive credit ratings, or enterprises that could be reasonably service their debts and meet their liabilities. This screen tends to filter companies that are not considered creditworthy, or companies that have an unacceptably high risk of defaulting on their debts. These companies are viewed favorably by credit rating agencies, such as Standard and Poor’s. Graham also looked at an enterprise’s total debt to current assets. Here, current assets are liquid assets that can be sold quickly to cover any debt obligation. If this ratio is less than 1, then companies can reasonably cover their debt obligations if lending standards deteriorate by selling assets. For example, if lending standards tighten heading into a recession, companies with low debt to current asset ratios should be able to weather any storm by liquidating assets to raise cash. Furthermore, Graham considered the ratio of current assets to current liabilities. Unlike debt, which is usually financed over several years, if not decades, current liabilities must be met over a very short-term horizon. A company must have current assets that can be converted into cash to cover its short-term liabilities, or risk quick financial ruin if business conditions deteriorate. Graham typically looked for ratios of current assets to current liabilities greater than 1.5. Graham also looked for companies that have positive earnings per share (EPS) over the past five years. Furthermore, Graham would look for enterprises that grew their EPS over five years. The idea was that if a company could not only create real economic value (i.e. earnings), but also increase their economic footprint through productivity and effective management, then that company could weather changes in the business environment. Finally, Graham looked for companies that pay a current dividend, which is generally an indication of financial strength. A dividend provides a potentially
stable cash flow and can help mitigate short-term price fluctuations. In summary, quality stocks can provide what Graham called a “margin of safety”. These companies can manage their long-term debts and current liabilities based on their capital structure, and are less susceptible to short-term changes in the business cycle. Quality stocks tend to have a history of profitability, which allows many of them to pay a steady dividend. So, how do quality stocks differ from the other four
equity factors – value, size, momentum and low volatility? Value stocks are screened based on their current market price relative to some metric. While quality stocks are generally screened based on financial ratios, value screens will relate these ratios to price. For example, price-to-earnings ratios tell us how much we pay for the earnings a company generates. Typically, value investors want to determine if a company is trading below its “fair value”. Likewise, the size factor looks at companies that have smaller market capitalization. These enterprises are generally not as mature as quality stocks, and might be in an early stage of development. Smaller sized companies are generally more volatile than high quality stocks. Momentum stocks (which we highlighted last month) are companies that trade above their longer-term moving averages. Shares of momentum stocks are by definition in high demand, which in turn pushes the price higher. Unlike quality stocks, momentum stocks are not necessarily characterized by underlying financial ratios, but by price trends. Similarly, low volatility stocks are not directly linked to any underlying financial ratios, but by changes in market price. Low volatility stocks tend to have less price variability than the market, on average. At the portfolio level, quality stocks have unique characteristics that can complement the other four equity factors. Depending on the economic cycle, quality stocks can provide excess returns over the overall market. However, a word of caution is in order. Over shorter time periods, quality stocks can become highly correlated to the other factors, so it’s important to understand how risk is spread across your portfolio.
Clint Pekrul, CFA
Graham’s Quality Criteria (Margin of Safety)
High Credit Quality Measures risk of defaulting on debts
Low Debt to Current Assets Measures ability to service debt
Low Current Liabilities to Current Assets
Measures ability to cover short-term liabilities
Positive Earnings Growth Measures economic foot-print
Dividends Measures ability to provide steady cash flow

Copyright 2017 © Peak Capital Management, LLC, All Rights Reserved 5
PCM Report Month Year | Volume #, Issue #
Did You Know?
Digital or cryptocurrencies, also known as blockchain, have seen a surge in trading and are beginning to capture the attention of even the most staid investors. Bitcoin was
dismissed as almost a fad when launched in 2013 but has emerged as a legitimate store of value for people all over the world. Its’ price has soared this year jumping nearly 250% to $2,500 USD to 1 bitcoin. New digital currencies like Ethereum have been launched that have seen price increases from below $5 to over $300 this year. The massive level of Central Bank intervention and outward attempts to manipulate and devalue a currency tell me that interest in digital currencies is only going to increase. Because the currencies are intentionally outside the purview of governments (including law enforcement) the security of owning digital currencies is questionable. I would not suggest investing next month’s mortgage payment in a digital currency as the volatility can be breathtaking but for people who really want to speculate on a very unknown future, it may be worth taking a small amount of capital you can afford to lose and speculating.
Yes, if you are looking for a highly speculative investment. I look at cryptocurrencies (i.e. bitcoin) today as more of a “gold rush” of sorts, and less as a medium of exchange. I believe that the IRS treats cryptocurrencies
as property and not currency for tax purposes. Any property that has increased multifold in such a short time period is bound to revert to the mean. I’d look at cryptocurrencies today as a bubble asset, simply because we’re a long way from it being a widely accepted form of exchange. But, it will be interesting to watch developments in the adoption of cryptocurrencies over the coming years, especially if the legitimacy of central banks comes under increasing scrutiny. One aspect of cryptocurrencies is the decentralization of control over a medium of exchange. This structure is the exact opposite of the Federal Reserve system, which, through monetary policy, directly controls the supply of money (i.e. fiat currency). If policy errors abound, then investors might very well turn increasingly to cryptocurrencies (and don’t forget gold).
Notwithstanding the discussion of Central Bank intervention in the prior question, yes, I believe the yield curve is still relevant to investors today. It is well documented that the
most accurate gauge of a recession is an inverted yield curve where short-term rates are higher than long term rates typically measured by the 2 year and 10 year Treasury bonds. Many have speculated today that the Fed’s manipulation of short-term interest rates has made inverting virtually impossible. If we were to apply historical models for pricing Fed Funds using inflation expectations the yield curve would almost undoubtedly be inverted today. Instead of calling the yield curve irrelevant, I would suggest that the risk of a recession without an inverted yield curve is simply much higher than it has been in the past. The most telling aspect of the yield curve should always be the long end of the curve that is set by market forces, not central bankers. Traders who actually have capital at risk price the yield on long duration debt and need to be compensated for future inflation as well as default risk. Today’s yield curve suggest bond traders anticipate very slow economic growth well into the future. I would not bet against them at this point in time.
This is an important question, considering the unprecedented intervention of central banks in the economy since the Great Recession of 2008-2009. Every analysis we have from history does not reflect quantitative easing. I
wonder what the yield curve would look like today if there had not been any quantitative easing. Once central banks began monetizing debt, they can basically shape the yield curve however they want. If the actions of central banks around the globe are more or less coordinated, then they can shift the yield curve into any shape. Aggressive buying/selling of debt will push longer term rates down/up. Likewise, central banks can directly set their discount rates on the short end of the curve.
The absolute level of interest rates certainly matters, but using the yield curve to predict recessions might be problematic going forward. After all, at the first sign of trouble, central banks might just think up another scheme to shape the yield curve. At the end of the day, they want positive net interest margin for the banks so they will lend. But as we have seen, this didn’t quite work as well as they would have hoped.
PCM Report July 2017 | Volume 8, Issue 7
Is the yield curve still relevant today? Q: Q: Should I own any of the cryptocurrencies?

Copyright 2017 © Peak Capital Management, LLC, All Rights Reserved 6
Index Update PCM Report July 2017 | Volume 8, Issue 7
As of 6/26/2017 As of 6/26/2017
As of 6/26/2017 As of 6/26/2017

Copyright 2017 © Peak Capital Management, LLC, All Rights Reserved 7
PCM Report July 2017 | Volume 8, Issue 7
This material is for general information and education purposes. The information contained in this report represents the opinions of Peak Capital
Management, LLC, as of the report date and does not constitute investment advice or an offer to provide investment management services. Before
purchasing any investment, a prospective investor should consult with its own investment, accounting, legal and tax advisers to evaluate independently
the risks, consequences and suitability of any investment.
Past performance is not indicative of future results, loss of principal is possible.
Please consider charges, risks, expenses and investment objectives carefully before investing.
The data and information presented and used in generating this report are believed to be reliable. Peak Capital Management, LLC. does not warrant or
guarantee the accuracy or completeness of such data.
Peak Capital Management, LLC, is a fee-based SEC Registered Investment Advisory firm with its principal place of business in Colorado providing
investment management services. A copy of our current written disclosure statement discussing our advisory services and fees is available for your
review upon request. Advisory services are only offered to clients or prospective clients where our firm and its representatives are properly licensed or
exempt from licensure. No advice may be rendered by Peak Capital Management, LLC unless a client service agreement is in place. Nothing herein
should be construed as a solicitation to purchase or sell securities or an attempt to render personalized investment advice.
A full listing of investment decisions made in the past year and relative performance is available upon request. It should not be assumed that
recommendations made in the future will be profitable or will equal the performance of the securities presented here. Opinions expressed are those of
Peak Capital Management and are subject to change, not guaranteed, and should not be considered recommendations to buy or sell any security.
15455 Gleneagle Dr., Suite 100
Colorado Springs, CO 80921
Phone: 719.203.6926
Fax: 719.465.1386
Email: [email protected]
Website: www.pcmstrategies.com