Fecal Coliform Total Maximum Daily Load, Mangrove … · Benner Bay/Lagoon Marina has been...
42
Fecal Coliform Total Maximum Daily Load, Mangrove Lagoon and Benner Bay, St. Thomas, United States Virgin Islands Final Draft May 24th, 2005 Prepared for: U.S. Environmental Protection Agency, Region 2, and United States Virgin Islands Department of Environmental Protection Prepared by: Tetra Tech, Inc.
Transcript of Fecal Coliform Total Maximum Daily Load, Mangrove … · Benner Bay/Lagoon Marina has been...
Fecal Coliform Total Maximum Daily Load, Mangrove Lagoon and Benner Bay, St. Thomas, United States Virgin
Islands
Final Draft
May 24th, 2005
Prepared for: U.S. Environmental Protection Agency, Region 2,
and United States Virgin Islands Department of
Environmental Protection
Prepared by: Tetra Tech, Inc.

CONTENTS CONTENTS............................................................................................................................ 2 LIST OF FIGURES............................................................................................................... 3 LIST OF TABLES................................................................................................................. 3 1 INTRODUCTION......................................................................................................... 4 2 PROBLEM IDENTIFICATION ................................................................................ 5
2.1 Background.............................................................................................................. 5 2.2 Water Quality Criteria ............................................................................................ 8 2.3 Pollutant Sources..................................................................................................... 9
2.3.1 Point Sources................................................................................................... 9 2.3.2 Non-point Sources ........................................................................................10
2.4 Current Conditions ................................................................................................12 3 DATA ANALYSIS ......................................................................................................13
3.1 Bacteria Monitoring Data .....................................................................................13 3.2 Critical Conditions ................................................................................................16
4 ANALYTICAL APPROACH....................................................................................18 4.1 Loading Model Configuration..............................................................................18
4.1.1 WWTPs .........................................................................................................19 4.1.2 General Land Surface Loading ....................................................................19 4.1.3 Septic System Failure Loading ....................................................................20 4.1.4 Marina Loading.............................................................................................22 4.1.5 Temporal Disaggregation of Load Estimates..............................................23
4.2 Tidal Prism Model ................................................................................................26 4.3 Assumptions and Limitations ...............................................................................27
5 TMDL CALCULATION AND ALLOCATION....................................................29 5.1 Numeric Target for Fecal Coliform Bacteria ......................................................29 5.2 Wasteload Allocations ..........................................................................................30 5.3 Load Allocations ...................................................................................................30 5.4 Margin of Safety ...................................................................................................30 5.5 TMDL....................................................................................................................31
6 MONITORING RECOMMENDATIONS..............................................................33 7 IMPLEMENTATION AND MANAGEMENT PLAN .........................................34 REFERENCES.....................................................................................................................35 Appendix A: Water Quality Data ....................................................................................37 Appendix B: Tidal Prism Model ......................................................................................40

LIST OF FIGURES Figure 2-1. The Mangrove Lagoon/Benner Bay Watershed and Bay and Assessment
Units. ................................................................................................................................ 7 Figure 3-1. Fecal Coliform Criteria for Class B Waters, and All Observed Data from
Stations STT-26, STT-27A, STT-27B and STT-27C in MLBB................................13 Figure 3-2. Fecal Coliform Criteria for Class B Waters, and Observed Data Below 400
counts/100mL from Stations STT-26, STT-27A, STT-27B and STT-27C in MLBB.........................................................................................................................................14
Figure 3-3. Water Quality Monitoring Stations in the MLBB system...........................15 Figure 3-4. Composite Flow-weighted Average FC Concentrations and Flow
Percentiles for Stations in MLBB. ...............................................................................17 Figure 4-1. Landuse Distribution in the MLBB watershed. ...........................................21 Figure 4-2. Streamflow at USGS Gage 50274000, 1/1/1998 - 9/30/2004.....................24 Figure 4-3. Streamflow Accumulation Curve for USGS Gage 50274000, 1/1/1998 -
9/30/2004. ......................................................................................................................25 Figure 4-4. Daily Percentage of Total 1/1/1998 - 9/30/2004 Flow for USGS Gage
50274000........................................................................................................................25 Figure 4-5. Estimated Loading of Total Fecal Coliform Bacteria to MLBB, 1/1/1998-
9/30/2004. ......................................................................................................................26 Figure 4-6. Tidal Prism Model Concept. .........................................................................27 Figure 5-1. TMDL Calculation Methodology based on Tidal Prism Model Reduction
Scenarios........................................................................................................................29
LIST OF TABLES Table 2-1. USVI 303(d) List of Impairments and Impairment Sources in Mangrove
Lagoon and Benner Bay Lagoon/Marina....................................................................... 8 Table 2-2. Pollutant Sources and Estimated Fecal Coliform Bacteria loads to the
MLBB System. ................................................................................................................ 9 Table 3-1. Statistical Summary of Ambient Fecal Coliform Bacteria Data from MLBB
Monitoring Stations.......................................................................................................14 Table 3-2. Composite Flow and FC Concentration statistics in MLBB. .......................16 Table 4-1. Watershed loading from land surface washoff by land use type..................19 Table 4-2. Estimation of Daily Septic System Leakage Contributions based on St.
Thomas Census Data.....................................................................................................22 Table 4-3. Calculation of marina loading of fecal coliform bacteria. ............................23 Table 5-1. Summary of the MLBB TMDL......................................................................32

Fecal Coliform TMDL, Mangrove Lagoon and Benner Bay, St. Thomas May 24th, 2005
4
1 INTRODUCTION Section 303(d) of the Clean Water Act and the U.S. Environmental Protection Agency's (USEPA's) Water Quality Planning and Management Regulations (40 CFR Part 130) require states to develop Total Maximum Daily Loads (TMDLs) for waterbodies that are not meeting their designated uses even though pollutant sources have implemented technology-based controls. A TMDL establishes the allowable load of a pollutant or other quantifiable parameter based on the relationship between pollutant sources and in-stream water quality. A TMDL provides the scientific basis for a state to establish water quality-based controls to reduce pollution from both point and nonpoint sources and restore and maintain the quality of the state's water resources (USEPA, 1991). USEPA Region 2 and the U.S. Virgin Islands Department of Planning and Natural Resources (DPNR) have coordinated a watershed assessment and an analysis of ambient water quality monitoring data to support the calculation of a fecal coliform bacteria TMDL for Mangrove Lagoon and Benner Bay (MLBB), in St. Thomas, U.S. Virgin Islands. Mangrove Lagoon is listed as impaired for fecal coliform bacteria on USVI’s 1998, 2002, and 2004 section 303(d) lists. Benner Bay is listed as impaired on USVI’s 2002 and 2004 303(d) lists. This document presents the results of the TMDL study and provides the technical basis for the calculation of the TMDL.

Fecal Coliform TMDL, Mangrove Lagoon and Benner Bay, St. Thomas May 24th, 2005
5
2 PROBLEM IDENTIFICATION
2.1 Background Mangrove Lagoon and Benner Bay/Lagoon Marina are located adjacent to one another on the southeastern shore of St. Thomas in the United States Virgin Islands (USVI) (see Figure 2-1). These two coastal embayments are linked together by a narrow passageway, called Bovoni Channel, which allows water to flow between Mangrove Lagoon and Benner Bay/Lagoon Marina. Together, these coastal waterbodies form a single hydrologic and biotic system. The watershed surrounding this system is comprised of steep topography with only one significant stream, Turpentine Run, which feeds into the eastern edge of Mangrove Lagoon. A small intermittent stream leads to the northeastern corner of Benner Bay/Lagoon Marina. Due to the steep surroundings and slowly moving protected waters, Benner Bay/Lagoon Marina has been popularly used for moorings and marinas by live-aboard boaters and holiday sailors. The mangrove-lined shores and shallow waters of Mangrove Lagoon have provided a nursery area for fish, protection against shoreline erosion and flooding, and productive habitat for benthic biota (Towle, 1985). The area has seen very significant population growth in the past 40 years, with estimates from approximately 4,000 people in 1960 to 15,000 in 1980 (Towle, 1985). The population and development has continued to date. The estimated 2000 population within the drainage area, based on watershed-specific population projections, was 18,650 people (US EPA, 1984). Mangrove Lagoon is a shallow restricted bay forming the western side of the Mangrove Lagoon/Benner Bay system (Figure 2-1). Two narrow reaches to the south of the lagoon connect the water body to the open ocean. However, shoals built up at the mouths of these inlets restrict the rate of flow that passes through these entrances. The majority of the flow that enters Mangrove Lagoon appears to flow along the north side of Cas Cay and enters between Patricia Cay and Bovoni Cay. A narrow deep channel called Bovoni Channel at the northeastern corner of Mangrove Lagoon connects the lagoon to Benner Bay/Lagoon Marina to the east. Mangroves border the western shores of the lagoon and the inner islands of Bovoni and Patricia Cays, which form the barrier between Mangrove Lagoon and Benner Bay/Lagoon Marina. The average depth of the lagoon is approximately 1.3 meters (4.3 feet) within the lagoon, with more shallow depths in the northwest region, in the vicinity of the lagoon head (Nichols and Towle, 1977). The average tidal range in Mangrove Lagoon is approximately 0.275 meters (0.9 feet) (Nichols and Kuo, 1979). According to previous studies of the Mangrove Lagoon and Benner Bay/Lagoon system conducted by the Island Resources Foundation (Nichols and Towle, 1977; Nichols and Kuo, 1979; Towle, 1985), the circulation in the estuarine system is dominated by four separate driving forces: “(1) a broad clockwise pattern driven by mass wave transport that is directed inward through Cas Cay entrance and outward through Benner Bay; (2) a reversing tidal current; (3) a local wind drift; and (4) a stream runoff flow seaward through both entrances.” The general dominating circulation pattern is the clockwise pattern, in which water flows in through the entrance at the
Fecal Coliform TMDL, Mangrove Lagoon and Benner Bay, St. Thomas May 24th, 2005
6
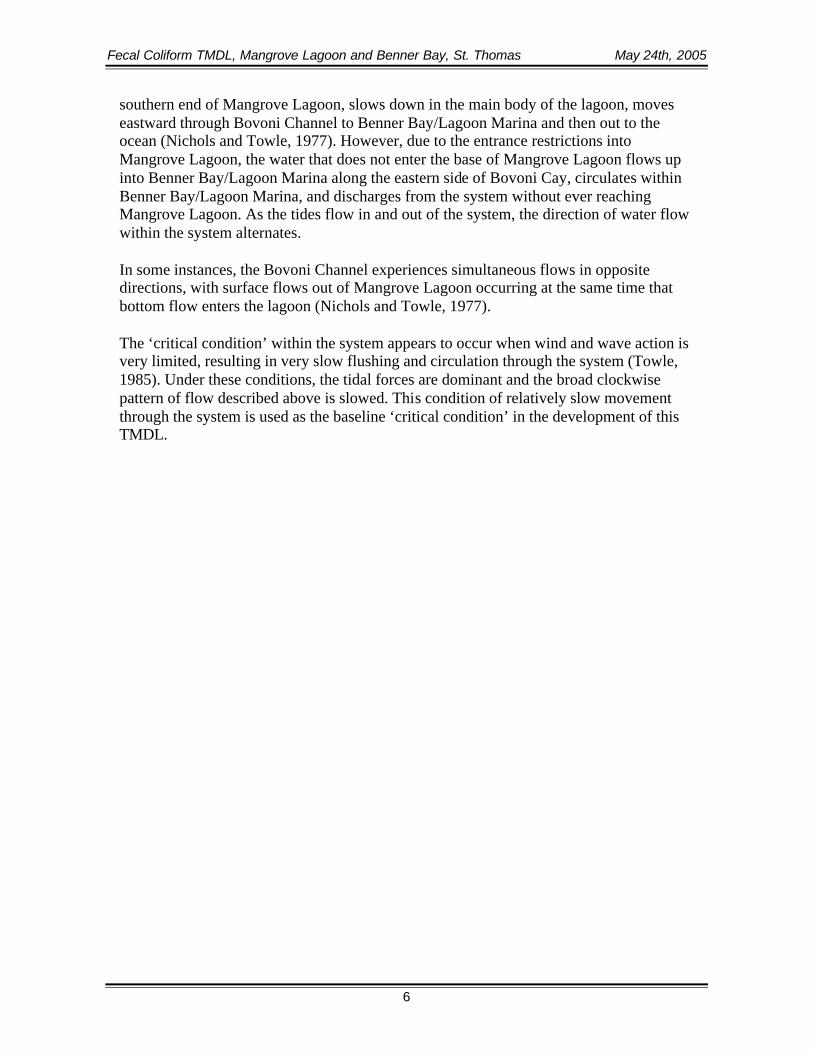
southern end of Mangrove Lagoon, slows down in the main body of the lagoon, moves eastward through Bovoni Channel to Benner Bay/Lagoon Marina and then out to the ocean (Nichols and Towle, 1977). However, due to the entrance restrictions into Mangrove Lagoon, the water that does not enter the base of Mangrove Lagoon flows up into Benner Bay/Lagoon Marina along the eastern side of Bovoni Cay, circulates within Benner Bay/Lagoon Marina, and discharges from the system without ever reaching Mangrove Lagoon. As the tides flow in and out of the system, the direction of water flow within the system alternates. In some instances, the Bovoni Channel experiences simultaneous flows in opposite directions, with surface flows out of Mangrove Lagoon occurring at the same time that bottom flow enters the lagoon (Nichols and Towle, 1977). The ‘critical condition’ within the system appears to occur when wind and wave action is very limited, resulting in very slow flushing and circulation through the system (Towle, 1985). Under these conditions, the tidal forces are dominant and the broad clockwise pattern of flow described above is slowed. This condition of relatively slow movement through the system is used as the baseline ‘critical condition’ in the development of this TMDL.

Fecal Coliform TMDL, Mangrove Lagoon and Benner Bay, St. Thomas May 24th, 2005
7
Figure 2-1. The Mangrove Lagoon/Benner Bay Watershed and Bay and Assessment Units.
Turpentine RunTurpentine Run

Fecal Coliform TMDL, Mangrove Lagoon and Benner Bay, St. Thomas May 24th, 2005
8
Due to the rapid development and associated activities, these coastal embayments no longer meet the applicable Class B water quality standards published in Subchapter 186, the Water Quality Standards for Coastal Waters of the US Virgin Islands. As a result, these waterbodies have been listed on the USVI 2002 Clean Water Act Section 303(d) lists of impaired waterbodies for “Total Fecal Coliform”. The pollutants of concern and pollutant sources for the two waterbodies listed in the 303(d) lists are presented in Table 2-1. Table 2-1. USVI 303(d) List of Impairments and Impairment Sources in Mangrove Lagoon and Benner Bay Lagoon/Marina. Assessment Unit ID
Assessment Unit Name
Class Impairment Source
VI-STT-34 Benner Bay Lagoon Marina
B Total Fecal Coliform
Changes in Tidal Circulation/Flushing Discharges from Municipal Separate Storm Sewer Systems (MS4) Highway/Road/Bridge Runoff (Non-construction Related) Other Marina/Boating On-vessel Discharges Sanitary Sewer Overflows (Collection System Failures)
VI-STT-35 Mangrove Lagoon
B Total Fecal Coliform
Changes in Tidal Circulation/Flushing Discharges from Municipal Separate Storm Sewer Systems (MS4) Highway/Road/Bridge Runoff (Non-construction Related) Other Marina/Boating On-vessel Discharges
2.2 Water Quality Criteria The MLBB system is designated as Class B, that is, surface waters intended for propagation and preservation of desirable species of marine life and for primary and secondary contact recreation. The water quality standards stated in Virgin Islands Rules & Regulations title 12, Chapter 7, section 186-3(b)(1-11) that apply to this classification and to the impairment of MLBB are that fecal coliform bacteria concentrations cannot exceed a geomean (log) concentration of 70 fecal coliforms/100mL by MF or MPN count.
Fecal Coliform TMDL, Mangrove Lagoon and Benner Bay, St. Thomas May 24th, 2005
9
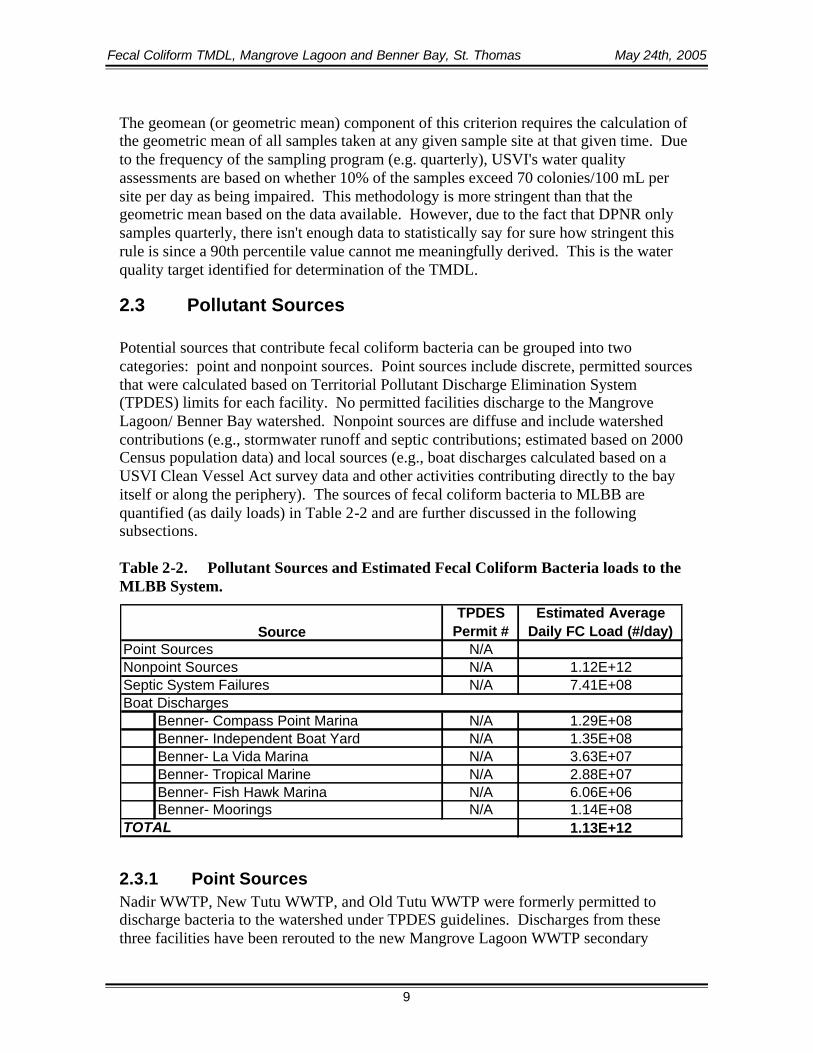
The geomean (or geometric mean) component of this criterion requires the calculation of the geometric mean of all samples taken at any given sample site at that given time. Due to the frequency of the sampling program (e.g. quarterly), USVI's water quality assessments are based on whether 10% of the samples exceed 70 colonies/100 mL per site per day as being impaired. This methodology is more stringent than that the geometric mean based on the data available. However, due to the fact that DPNR only samples quarterly, there isn't enough data to statistically say for sure how stringent this rule is since a 90th percentile value cannot me meaningfully derived. This is the water quality target identified for determination of the TMDL.
2.3 Pollutant Sources Potential sources that contribute fecal coliform bacteria can be grouped into two categories: point and nonpoint sources. Point sources include discrete, permitted sources that were calculated based on Territorial Pollutant Discharge Elimination System (TPDES) limits for each facility. No permitted facilities discharge to the Mangrove Lagoon/ Benner Bay watershed. Nonpoint sources are diffuse and include watershed contributions (e.g., stormwater runoff and septic contributions; estimated based on 2000 Census population data) and local sources (e.g., boat discharges calculated based on a USVI Clean Vessel Act survey data and other activities contributing directly to the bay itself or along the periphery). The sources of fecal coliform bacteria to MLBB are quantified (as daily loads) in Table 2-2 and are further discussed in the following subsections. Table 2-2. Pollutant Sources and Estimated Fecal Coliform Bacteria loads to the MLBB System.
2.3.1 Point Sources Nadir WWTP, New Tutu WWTP, and Old Tutu WWTP were formerly permitted to discharge bacteria to the watershed under TPDES guidelines. Discharges from these three facilities have been rerouted to the new Mangrove Lagoon WWTP secondary
TPDES Permit #
Estimated Average Daily FC Load (#/day)
N/AN/A 1.12E+12N/A 7.41E+08
Benner- Compass Point Marina N/A 1.29E+08Benner- Independent Boat Yard N/A 1.35E+08Benner- La Vida Marina N/A 3.63E+07Benner- Tropical Marine N/A 2.88E+07Benner- Fish Hawk Marina N/A 6.06E+06Benner- Moorings N/A 1.14E+08
1.13E+12
Boat Discharges
TOTAL
SourcePoint SourcesNonpoint SourcesSeptic System Failures
Fecal Coliform TMDL, Mangrove Lagoon and Benner Bay, St. Thomas May 24th, 2005
10
treatment facility. The Mangrove Lagoon WWTP facility is permitted to discharge under TPDES permit #VI0002003, but does not discharge to the Mangrove Lagoon/ Benner Bay system. No permitted facilities or municipal separate storm sewer systems (MS4s) exist within the study area. Therefore, no significant point sources affect the bacteria levels in the Mangrove Lagoon/ Benner Bay study area.
2.3.2 Non-point Sources Nonpoint sources are considered diffuse sources of pollution. They may contribute to a waterbody due to rainfall-runoff processes or diffusely during dry conditions. Direct, diffuse discharges directly to MLBB are also considered nonpoint sources for the purpose of this study. A lack of previous research exists regarding identification and quantification of specific fecal coliform bacteria sources within the MLBB watershed. Information identifying relationships between sources and in-stream water quality for MLBB are not available either. The following subsections describe potential sources of fecal coliform bacteria to waters of St. Thomas and identify likely contributors to MLBB. These sources are ultimately used as the basis for load estimation and TMDL determination.
2.3.2.1 Agriculture Agricultural land, which typically consists of cropland, pastureland, and refined animal management, represents a relatively low percentage of the total watershed acreage. 65 Acres are classified as agricultural land, based on land use data circa 1999 obtained from the University of Virgin Islands Eastern Caribbean Center Conservation Center Land Use Inventory. This acreage represents 1.8% of the watershed, and may or may not have a significant impact on fecal coliform bacteria levels downstream.
2.3.2.2 Urban Runoff Urban areas are generally characterized by higher percentages of impervious land due to cover of the land surface by pavement, concrete, and buildings. Higher percentages of impervious area, if not properly managed, result in higher surface runoff potential due to the reduced ability of water to infiltrate into the ground during rainfall events. As water runs the land and paved surfaces, debris and pollutants such as fecal coliform bacteria are entrained and subsequently flow into storm drains and ditches which lead to local coastal water bodies. Harmful bacteria and viruses from pet wastes carried by urban runoff to a waterbody, can contribute to shellfish contamination, harm other aquatic life and threaten human health. Studies have shown that fecal coliform bacteria levels are typically high in urban runoff (USEPA, 2001), and thus may be a significant source of pollution to MLBB. As identified above, no permitted MS4s exist in the study area.
2.3.2.3 Wastewater Disposal There are many potential opportunities for contribution of fecal coliform bacteria from human waste to waters of the MLBB watershed. These mechanisms of transport include the following:

Fecal Coliform TMDL, Mangrove Lagoon and Benner Bay, St. Thomas May 24th, 2005
11
• Unsolicited discharges of untreated wastewater to a waterbody (i.e patrons of marina facilities, septic tank leakage). • Leaking of sewage mains and resulting discharge either directly into a waterbody, or indirectly through groundwater transport. • Groundwater transport of leachate to a waterbody from failed septic systems adjacent to the waterbody. All of these processes are more common in areas with higher populations, for instance, in residential or commercial zones. Local sources include marinas and moored boats (described in Section 2.4.2.3), and native bird or mammal populations residing in the bay. These sources may be transient and may not pose a constant threat to water quality. For example, marina use and a subsequent short-term increase in bacteria loading may occur during fishing tournaments. Similarly, flocks of native or migrating birds may land in the bay for a short time, and contribute to the bacteria load before departing. Illicit discharges from five known marinas and a mooring area are a concern based on the estimate that 50% of live-aboard boats at marinas in the USVI region discharge the contents of their holding tanks directly to surface waters (Mangrove lagoon/Benner Bay BOD TDML, 2003). Based on the sheltered location of the marinas and reduced exposure to freshwater and tidal inflows, fecal coliform bacteria discharged from boats in the vicinity of the marinas may have a significant impact on bacteria levels in the Bay. Marina contributions are estimated in the 4.3.3.1 Pollutant Representation section of this report. Residential septic systems treat human waste using a collection system that discharges liquid waste into the soil through a series of distribution lines that comprise the drain field. Fecal coliform bacteria naturally die-off as the effluent percolates through the soil to the groundwater. These systems effectively remove fecal coliform bacteria when properly installed and maintained. A septic system failure occurs when there is a discharge of waste to the soil surface where it is available for washoff into surface waters. Failing septic systems can deliver high bacteria loads to surface waters, depending on the proximity of the discharge to a stream and the timing of rainfall events. Septic system failures typically occur in older systems that are not adequately maintained with periodic sewage pump-outs. Septic system failure may be a more significant source of fecal coliform bacteria in the MLBB watershed, based on census data for the region. The Draft Environmental Impact Statement for the Proposed Mangrove Lagoon/ Turpentine Run Wastewater Treatment Facilities (USEPA, 1984) estimated the population in the MLBB watershed to be 15,064 in 1983, and projected a population of 18,650 by the year 2000. It has been estimated that approximately 15 percent (2,798) of the population in these two watersheds is serviced by on-site septic systems (Bortman, 1997; USEPA, 1984). To calculate a fecal coliform bacteria load from failing septic systems, a 10% failure rate (a rate used in the Mangrove Lagoon/ Benner Bay BOD TMDL (2003)) was used, as well as an attenuation factor where 10% of the load from failed septics reaches the bay. A

Fecal Coliform TMDL, Mangrove Lagoon and Benner Bay, St. Thomas May 24th, 2005
12
production rate of 70 gallons of septic discharge/person/day (Horsley and Witten, 1996) was used to develop a population-based estimate. Horsley and Witten (1996) estimated that septic system discharge contains a concentration of 10,000 CFU/100mL. Based on these estimates, approximately 7.41E+09 fecal coliforms are discharged into the watershed on an average day, and 7.41E+08 fecal coliforms (10% of the discharged load) reach the bay on a daily basis.
2.3.2.4 Background Conditions Background fecal coliform bacteria loads are from non-human, natural sources. Their contributions can be directly to a waterbody or to the watershed surface where they are ultimately carried to a waterbody. Watershed contributions can be estimated from water quality data collected at headwater stations where the contributing land consists almost entirely of natural landscape with little or no human influence. However, no headwater stations of this type exist for the MLBB study area. Native bird and mammal populations residing in and around the bay may contribute fecal coliform bacteria directly to the bay. Similarly, flocks of native or migrating birds may land in the bay for a short time, and contribute to the bacteria load before departing.
2.4 Current Conditions The TMDLs for MLBB were developed based on conditions that existed from 1998 to 2004. This time frame is concurrent with the majority of the available ambient water quality data. Although data were collected over a significant time frame, the quarterly interval used in the water quality monitoring program does not allow insight to suggest improvement or deterioration over this time period. Section 3 summarizes the available data.
Fecal Coliform TMDL, Mangrove Lagoon and Benner Bay, St. Thomas May 24th, 2005
13
3 DATA ANALYSIS
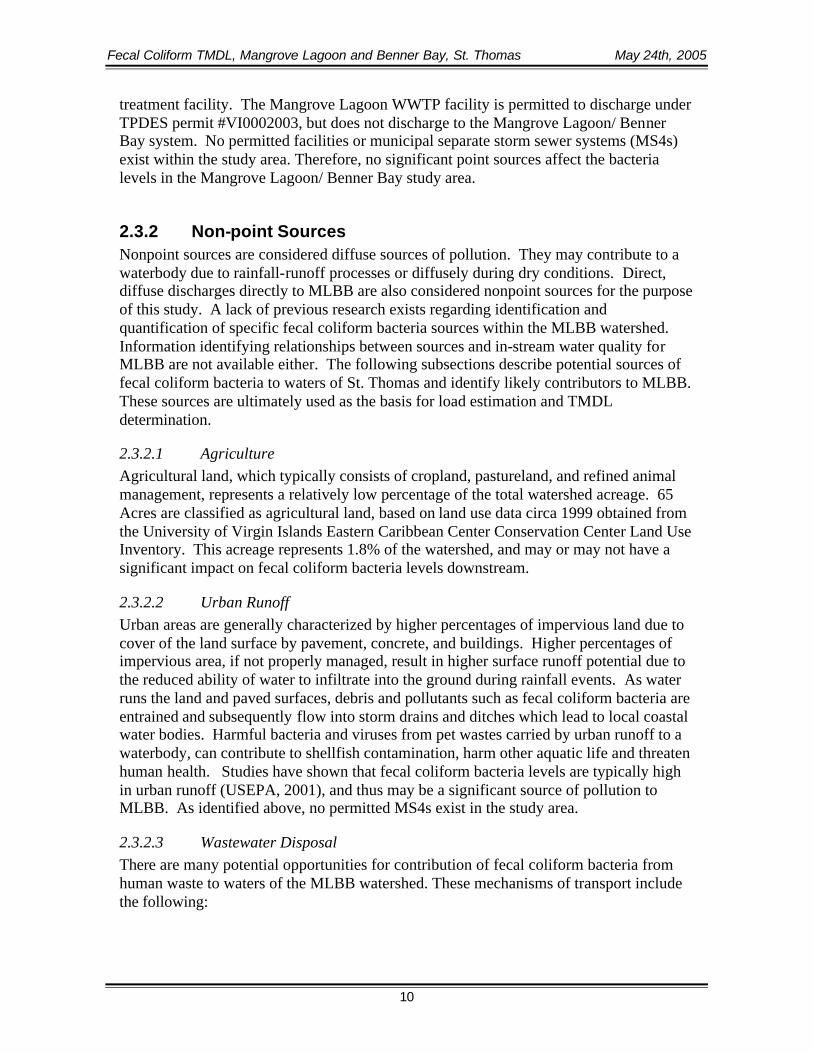
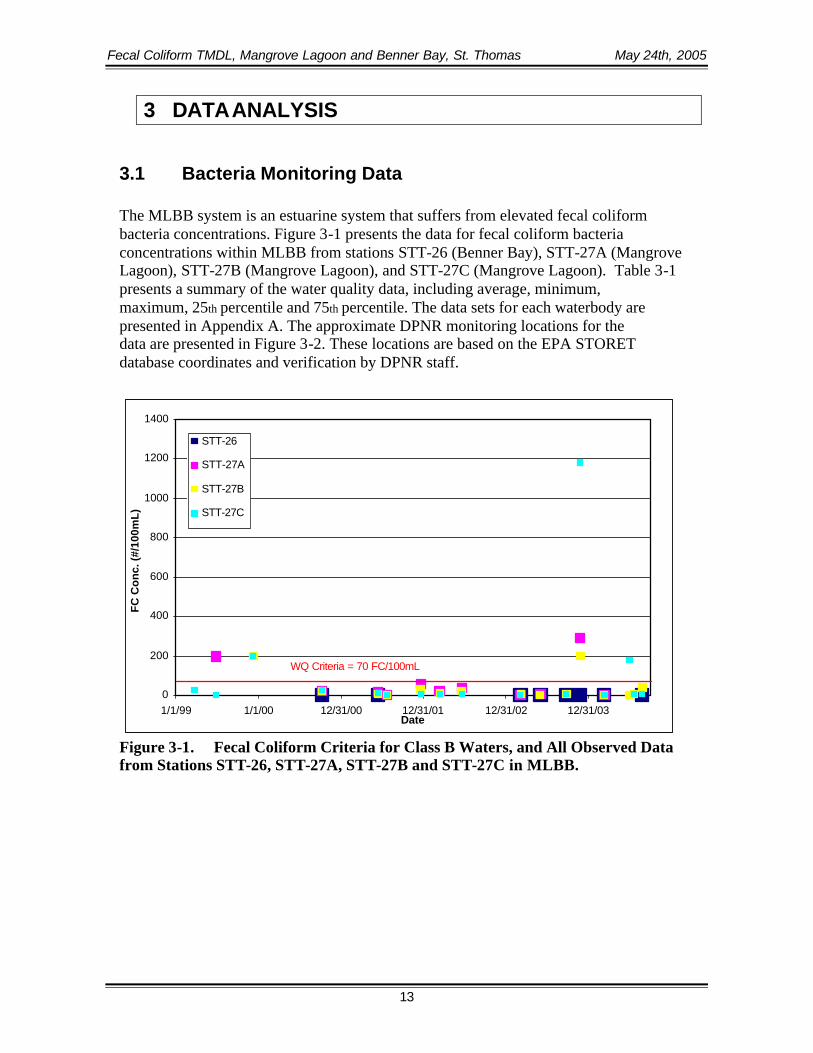
3.1 Bacteria Monitoring Data The MLBB system is an estuarine system that suffers from elevated fecal coliform bacteria concentrations. Figure 3-1 presents the data for fecal coliform bacteria concentrations within MLBB from stations STT-26 (Benner Bay), STT-27A (Mangrove Lagoon), STT-27B (Mangrove Lagoon), and STT-27C (Mangrove Lagoon). Table 3-1 presents a summary of the water quality data, including average, minimum, maximum, 25th percentile and 75th percentile. The data sets for each waterbody are presented in Appendix A. The approximate DPNR monitoring locations for the data are presented in Figure 3-2. These locations are based on the EPA STORET database coordinates and verification by DPNR staff.
Figure 3-1. Fecal Coliform Criteria for Class B Waters, and All Observed Data from Stations STT-26, STT-27A, STT-27B and STT-27C in MLBB.
0
200
400
600
800
1000
1200
1400
1/1/99 1/1/00 12/31/00 12/31/01 12/31/02 12/31/03Date
FC
Co
nc.
(#/1
00m
L)
STT-26
STT-27A
STT-27B
STT-27C
WQ Criteria = 70 FC/100mL

Fecal Coliform TMDL, Mangrove Lagoon and Benner Bay, St. Thomas May 24th, 2005
14
Figure 3-2. Fecal Coliform Criteria for Class B Waters, and Observed Data Below 400 counts/100mL from Stations STT-26, STT-27A, STT-27B and STT-27C in MLBB. Table 3-1. Statistical Summary of Ambient Fecal Coliform Bacteria Data from MLBB Monitoring Stations.
0
50
100
150
200
250
300
350
400
1/1/99 1/1/00 12/31/00 12/31/01 12/31/02 12/31/03Date
FC
Co
nc.
(#/1
00m
L)
STT-26
STT-27A
STT-27B
STT-27C
WQ Criteria = 70 FC/100mL
Sample Size (n)
Minimum Value (mg/L)
Maximum Value (mg/L)
Benner Bay (STT-26) 8 ND 2Mangrove Lagoon (STT-27A) 11 1 288Mangrove Lagoon (STT-27B) 15 ND 200Mangrove Lagoon (STT-27C) 16 ND 1180
Fecal Coliform TMDL, Mangrove Lagoon and Benner Bay, St. Thomas May 24th, 2005
15
Figure 3-3. Water Quality Monitoring Stations in the MLBB system.

Fecal Coliform TMDL, Mangrove Lagoon and Benner Bay, St. Thomas May 24th, 2005
16
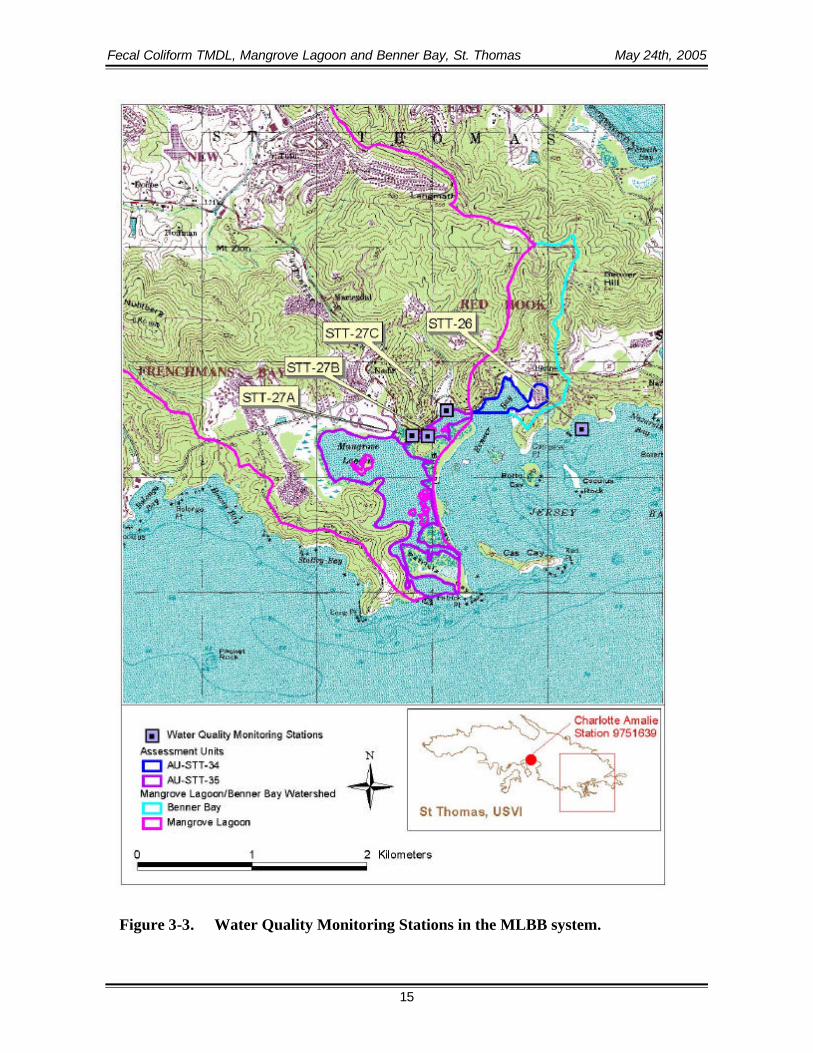
3.2 Critical Conditions The goal of the TMDL is to determine the assimilative capacity of a waterbody based on prescribed water quality standards and to identify potential allocation scenarios that enable the waterbody to achieve the standards. The critical condition is the set of environmental conditions for which controls designed to protect water quality will ensure attainment of objectives for all other conditions. This is typically the period of time in which the impaired water body exhibits the most vulnerability. The U.S. Virgin Islands experiences two seasons, the dry season and the rainy season. The rainy season actually occurs twice a year, with the major rainy season occurring from approximately August to December and a short less significant rainy season occurring around May. Available data for MLBB were evaluated with respect to seasonality to identify possible trends and critical conditions. Flow data can be used to identify whether elevated bacteria levels occur during rainfall events (and are likely watershed-driven) or during dry conditions. Fecal coliform bacteria data collected in MLBB were evaluated with respect to stream flow measured at the Turpentine Run at Mt. Zion gage (USGS 50274000) on St. Thomas. A positive trend was apparent in the correlation suggesting that months with higher rainfall totals exhibit increased fecal coliform bacteria levels in the bay. Table 3-2 and Figure 3-2 illustrate the relationship between higher flows and elevated fecal coliform bacteria concentrations. The data presented is a composite of the 4 stations in the bay to investigate the bay as a whole and to increase the number of data points in the analysis. Fecal Coliform Bacteria concentrations in MLBB have been monitored on a quarterly basis at 4 sampling stations. Unfortunately, the data collection periods for these stations do not provide sufficient insight into discrete meteorological events such as storm events, which could significantly influence bacteria regimes in the short-term and provide additional information regarding influential processes in the Bay. The coarse sampling Table 3-2. Composite Flow and FC Concentration statistics in MLBB.
Location: COMPOSITE MLBBFlow Gage: USGS50274000 (cfs)Pollutant: Fecal Coliform (#/100 mL)Data from: 3/25/1999 to 8/24/2004 (42 Observations)
Flow Range # Obs Concentration (#/100mL)Percentile Count Mean Min Max Mean Min Max
0-10 5 0.1 0.1 0.1 6 2 1410-20 4 0.1 0.1 0.2 9 2 2020-30 4 0.2 0.2 0.2 5 2 1130-40 4 0.2 0.2 0.3 13 0 3840-50 4 0.3 0.3 0.3 18 3 4350-60 4 0.4 0.3 0.6 94 1 20060-70 4 0.7 0.7 0.7 31 20 5770-80 4 0.9 0.7 1.0 15 1 2880-90 4 1.3 1.0 1.6 123 0 200
90-100 4 3.3 2.7 3.8 404 3 1180
Flow (cfs)
Fecal Coliform TMDL, Mangrove Lagoon and Benner Bay, St. Thomas May 24th, 2005
17
Figure 3-4. Composite Flow-weighted Average FC Concentrations and Flow Percentiles for Stations in MLBB. frequency provides limited information about the specific causes of fluctuating bacteria concentrations. Although there may be a relationship between precipitation and bacteria concentrations in the bay, the number of samples (23 total samples; 5 from STT-26, 9 from STT-27A, 10 from STT-27B, and 11 from STT-27C) limits the significance of the relationship. The occurrence of elevated fecal coliform bacteria levels, defined as concentrations greater than 70 fecal coliforms/100mL, occurred in the months of June and December. Although samples are not taken during several of the months identified as wet season months, the months where samples exceed the criteria fall within the general wet season time frame. Therefore, a critical condition directly linked to the high flow period could be established as a baseline for this TMDL.
0.10
0.18 0.200.27 0.27
0.600.74
1.001.60
3.80
0.00
50.00
100.00
150.00
200.00
250.00
300.00
350.00
400.00
450.00
0-10 10-20 20-30 30-40 40-50 50-60 60-70 70-80 80-90 90-100
Percentile Ranges for Associated-Flow Measurements
Flow
-Wei
ghte
d C
onc.
(#/
100m
L)
0.01
0.1
1
10
Flo
w (
cfs)
Fecal Coliform (#/100 mL) USGS50274000 (cfs) (Min, Mean, Max)
Fecal Coliform TMDL, Mangrove Lagoon and Benner Bay, St. Thomas May 24th, 2005
18
4 ANALYTICAL APPROACH In order to support TMDL development objectives and evaluate the linkage between bacteria sources and the bay’s response, an analytical framework combining a tidal prism model of MLBB and a simplified loading model for the watershed and other potential sources was implemented. This approach was selected based on an evaluation of technical, regulatory, and user criteria (Mao, 1992). Technical criteria refer to the model’s capability of simulating the physical system in question, including watershed and/or receiving water characteristics/processes and constituents of interest. Technical criteria used to select an appropriate analytical methodology also included monitoring data availability (water quality and flow data for the watershed and receiving water), the sampling interval of monitoring data, and source identification data. Regulatory criteria make up the constraints imposed by regulations, such as water quality standards or procedural protocol. The evaluation of regulatory criteria was also based on ability to acknowledge EPA’s TMDL support elements. User criteria comprise the operational or economical constraints imposed by the end-user and include factors such as hardware/software compatibility and financial resources.
4.1 Loading Model Configuration In order to evaluate the influence of point and nonpoint bacteria sources on MLBB, a simplified spreadsheet loading model was developed. The model estimates annual bacteria loads to the bay from the watershed and local sources and disaggregates these loads into daily loads for a higher scale of temporal resolution within the bay. As identified in Section 2.3, key sources of fecal coliform bacteria loading to MLBB include urban runoff, wastewater disposal (including other recreational pollution sources, other spill-related impacts, municipal point source impacts from inadequate industrial/commercial pretreatment, and other marina/boating on-vessel discharges as identified in the 2004 303(d) list), and background sources. Although field verification data for these sources are not available, information obtained through personal communication with DPNR staff has been supplemented with watershed information (e.g., population estimates, marina characteristics, etc.) to derive bacteria loading estimates for MLBB. These estimates were derived through the development of a spreadsheet model that quantifies loads from individual sources. The sources were regrouped into the following categories to investigate the relative influence of each source and to conduct allocation scenarios to support the implementation process:
• General land surface loading (including urban runoff and background runoff) • Septic system failure loading • Marina loading

Fecal Coliform TMDL, Mangrove Lagoon and Benner Bay, St. Thomas May 24th, 2005
19
4.1.1 WWTPs Point sources, such as municipal sewage treatment plants, can contribute fecal coliform bacteria loads to surface waters through effluent discharges. These facilities are permitted through the Territorial Pollutant Discharge Elimination System (TPDES) program. Although several WWTPs are located in the watershed (see Section 2.3.1), none of these point source facilities discharge to Mangrove Lagoon or Benner Bay.
4.1.2 General Land Surface Loading The bacteria loading spreadsheet considers fecal coliform bacteria loading estimates from the land surface of the watershed, based on the distribution of land use in that watershed. Land use data is necessary to represent variability in pollutant loading, which is highly correlated to land practices. The basis for this distribution was provided by land use coverage of the MLBB watershed, shown in Figures 4-1. Land use data used to estimate land surface contributions of fecal coliform bacteria were obtained from the University of Virgin Islands (UVI)- Eastern Caribbean Center- Conservation Center Land Use Inventory. Sources of bacteria accumulation on the land surface include pets (e.g., dogs, cats, etc.) and wildlife (e.g., birds, rodents, etc.). Bacteria-containing waste is deposited on the land surface of the watershed and then washed off during rainfall events into adjacent streams and ultimately MLBB. Accumulation rates vary among land use categories based on the sources present. The land surface loading estimates were derived from the Watershed Treatment Model (WTM), which provides annual scale loading estimates of fecal coliform bacteria (Caraco, 2001). The WTM model is a spreadsheet that considers watershed characteristics such as land use distribution, stream network length in the watershed, and annual rainfall. These watershed characteristics were applied to the WTM model, while keeping the default WTM coefficients and concentrations constant based on a lack of site-specific information. Fecal coliform bacteria loading rates to each assessment unit are shown in Table 4-1. Table 4-1. Watershed loading from land surface washoff by land use type.
Watershed
FC Load from
Residential Lands
(annual #/yr)
FC Load from
Commercial Lands
(annual #/yr)
FC Load from
Industrial Lands
(annual #/yr)
FC Load from Rural Lands (annual #/yr)
TOTAL ANNUAL FC LOAD
TOTAL DAILY FC
LOADMangrove Lagoon (STT-35)
1.94E+14 1.47E+14 4.76E+13 2.51E+12 3.91E+14 1.07E+12
Benner Bay (STT-34)
1.20E+13 7.64E+12 0.00E+00 0.00E+00 1.97E+13 5.39E+10
*** Loading rates obtained from the "primary sources" worksheet of the WTM spreadsheet
(Caraco, Deb. March, 2001. The Watershed Treatment Model. Version 3.0. (Prepared for U.S.EPA
Region V, Office of Wetlands, Oceans and Watersheds. Center for Watershed Protection (CWP): Ellicott City, MD.)
Fecal Coliform TMDL, Mangrove Lagoon and Benner Bay, St. Thomas May 24th, 2005
20
4.1.3 Septic System Failure Loading Septic failure contributions of fecal coliform bacteria were also incorporated into the estimate of the watershed load. Table 4-2 tabulates the septic failure calculations used for the MLBB watershed. Area-weighted calculations, based on 2000 census data, estimated the population in the MLBB watershed to be 18,650. It has been estimated, based on the ratio of sewered to unsewered households on St. Thomas, that

Fecal Coliform TMDL, Mangrove Lagoon and Benner Bay, St. Thomas May 24th, 2005
21
Figure 4-1. Landuse Distribution in the MLBB watershed.

Fecal Coliform TMDL, Mangrove Lagoon and Benner Bay, St. Thomas May 24th, 2005
22
approximately 39.6% of the population (2,797) is serviced by on-site septic systems. Based on these estimates, approximately 7.41E+09 fecal coliforms are discharged into the assessment unit watersheds on an average day, and 7.41E+08 fecal coliforms (assuming 10% of the discharged load) reach the assessment unit (bay itself) on a daily basis. This calculation assumes a 10% failure rate (Mangrove Lagoon/ Benner Bay BOD TMDL (2003)). It also assumes 70 gallons of septic discharge/person/day at a concentration of 10,000 CFU/100mL (Horsley and Witten, 1996). Table 4-2. Estimation of Daily Septic System Leakage Contributions based on St. Thomas Census Data.
4.1.4 Marina Loading In addition to watershed-based sources of fecal coliform bacteria, there are bacteria loads associated with direct discharge from boats at marinas in the MLBB system. The bacteria load from inappropriate and illicit wastewater discharge in marinas and mooring locations was estimated based on a 2002 DPNR survey of the number of slips and mooring permits for boats within Benner Bay/Lagoon Marina. A total of 296 slip and mooring permits were recorded for Benner Bay. Mangrove Lagoon is restricted and does not have any marinas or moorings. Illicit discharges from marinas in the MLBB system are a concern based on the estimate that 50% of live-aboard boats at marinas in the USVI region discharge the contents of their holding tanks directly to surface waters (Mangrove lagoon/Benner Bay BOD TDML, 2003). Based on the sheltered location of the marinas and reduced exposure to freshwater and tidal inflows, fecal coliform bacteria discharged from boats within Assessment Unit STT-34 may have a significant impact on bacteria levels. The calculations and assumptions for daily loading estimates are shown in Table 4-3.
Square KM (NOAA, USGS)
Population (2000 Census for St. Croix,
SRW was area-weighted)
Population
on Septic (2000 Census for St. Croix)
Failed Population
on Septic (2000 Census for St. Croix)
Volume production/p
erson/day (Horsley and Witten, 1996)
(gal/day)
Failed Volume
(100mL/day) (Mangrove
Lagoon/ Benner bay TMDL, 2003)
Failed Load from Septic
Systems (Horsely & Whitten,
1996) (#/day)
Daily FC Load to the Bay (#/day)
Mangrove Lagoon (STT-35)
13.13 17,567 2,635 70 2,650 698,220 6.98E+09 6.98E+08
Benner Bay (STT-34)
0.76 1,083 162 70 2,650 43,058 4.31E+08 4.31E+07

Fecal Coliform TMDL, Mangrove Lagoon and Benner Bay, St. Thomas May 24th, 2005
23
Table 4-3. Calculation of marina loading of fecal coliform bacteria.
4.1.5 Temporal Disaggregation of Load Estimates For the purpose of evaluating the influence of sources on time-variable bacteria concentrations within MLBB, a temporal disaggreation of the loading estimates was conducted. This disaggregation was only conducted for the general land surface loading and septic loading categories. Marina loading and WWTP contributions were assumed to be constant. The land surface loads were disaggregated to represent variability due to rainfall events and seasonal trends. During dry periods with no rainfall, no transport vehicle is available to introduce bacteria to surface waters. Instead, bacteria remains on the land surface until rainfall-driven overland flow occurs and transports the load to an adjacent stream. Therefore, the majority of loading from this source occurs during and just following rainfall events. Similarly, loading rates from failing septic systems in the region are dependent on wet conditions for transport to surface waters (Aaron Hutchins, DPNR; Personal Communication 2004). Septic leach fields and failed septic containment systems are exposed to infiltrating precipitation, and they discharge bacteria loads, when moisture levels in vadose and groundwater layers are sufficient for surface or subsurface transport. The majority of loading from this source therefore also occurs during and just following rainfall events. To convert the load estimates described previously to daily-variable loading rates, observed flow regimes on St. Thomas were obtained. The USGS maintains a streamflow station at Turpentine Run at Mt. Zion (USGS 50274000), and this gage monitored flow at that location from October 1st, 1992 to September 30th, 2004. Flow at the Turpentine Run at Mt. Zion gage from 1/1/1998 – 9/30/2004 is shown in Figure 4-2. streamflow data at
Slip permits
50% of boats dump
illegally
Dumped Gallons/week. (1.4 purges of 40 gallon tank)
Dumped gallons/day
(Dumped Gallons/7)
Calculated FC: #/day based on
10,000/100mL
Unit boat 1 0.5 28 4 1.51E+06
Benner- Compass Point Marina 85 42.5 2,380 340 1.29E+08
Benner- Independent Boat Yard 89 44.5 2,492 356 1.35E+08Benner- La Vida Marina 24 12 672 96 3.63E+07Benner- Tropical Marine 19 9.5 532 76 2.88E+07Benner- Fish Hawk Marina 4 2 112 16 6.06E+06Benner- Moorings 75 37.5 2,100 300 1.14E+08Benner- TOTAL 296 148 8,288 1,184 4.48E+08Mangrove Lagoon 0 0 0 0 0.00E+00

Fecal Coliform TMDL, Mangrove Lagoon and Benner Bay, St. Thomas May 24th, 2005
24
this gage was assumed to be representative of streams contributing to MLBB, and thus area-weighting the flow measured at this gage represents the net flow to the bay.
Figure 4-2. Streamflow at USGS Gage 50274000, 1/1/1998 - 9/30/2004. A flow accumulation curve was first developed based on the observed streamflow data (Figure 4-3). The accumulation curve displays the percentage of the total 1/1/1998-9/30/2004 volume discharged versus date. Steep increases in percentage indicate high
0.001
0.01
0.1
1
10
100
1000
1/1/98 1/1/99 1/1/00 12/31/00 12/31/01 12/31/02 12/31/03Date
Ave
rag
e D
aily
Flo
w (c
fs)
0.00%
10.00%
20.00%
30.00%
40.00%
50.00%
60.00%
70.00%
80.00%
90.00%
100.00%
1/1/98 1/1/99 1/1/00 12/31/00 12/31/01 12/31/02 12/31/03Date
To
tal F
low
(%
)

Fecal Coliform TMDL, Mangrove Lagoon and Benner Bay, St. Thomas May 24th, 2005
25
Figure 4-3. Streamflow Accumulation Curve for USGS Gage 50274000, 1/1/1998 - 9/30/2004. flows, while gradual increases in percentage indicate relatively low flows. Figure 4-4 displays the percentage of the total 1/1/1998-9/30/2004 flow discharged on a daily basis. These percentages were subsequently applied to the loading rates from the land surface and septic failure sources described in the previous section.
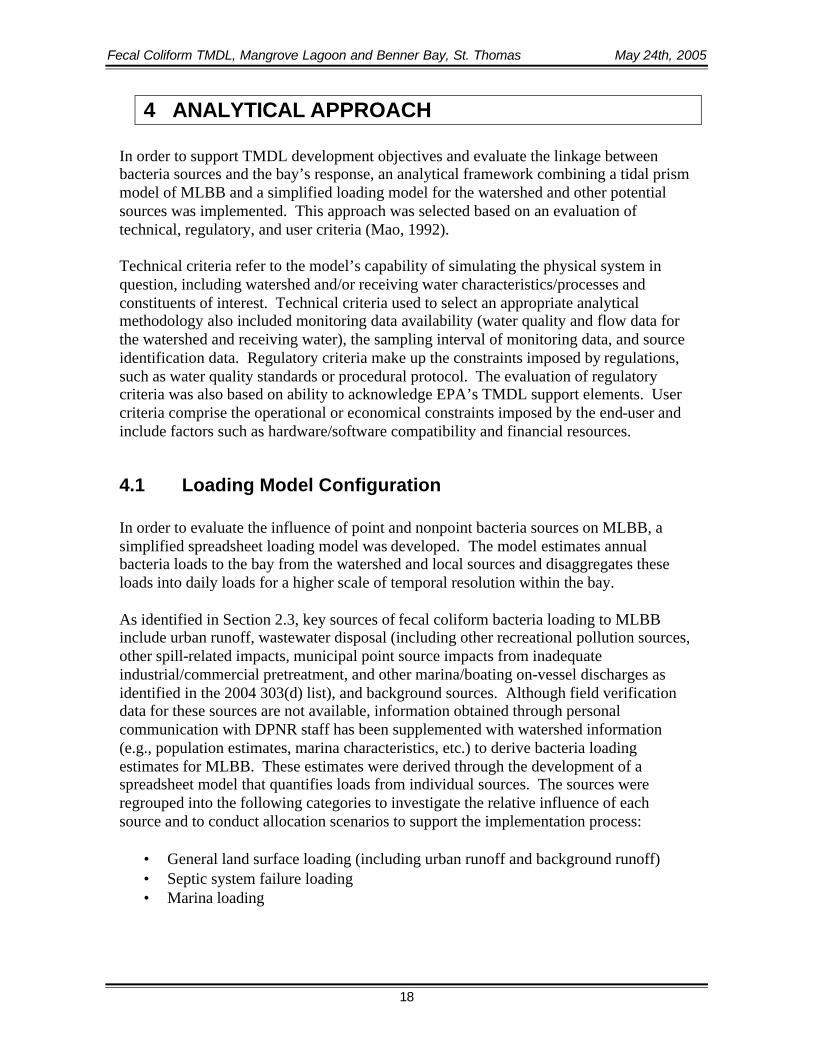
Figure 4-4. Daily Percentage of Total 1/1/1998 - 9/30/2004 Flow for USGS Gage 50274000. The daily loading rates for land surface sources (STT-35: 1.07E+12 fecal coliforms/day, STT-34: 5.39E+10 fecal coliforms/day) and septic leakage sources (STT-35: 6.98E+08 fecal coliforms/day, STT-34: 4.31E+07 fecal coliforms/day) were multiplied by the total number of days from 1/1/1998-9/30/2004 to obtain a total loading rate for that period of time. The daily percentages shown in Figure 4-4 were applied to this total load to obtain variable daily loading estimates. Total daily loading rates from all sources of fecal coliform bacteria are shown in Figure 4-5.
0%
2%
4%
6%
8%
10%
12%
1/1/98 1/1/99 1/1/00 12/31/00 12/31/01 12/31/02 12/31/03Date
Per
cen
tag
e o
f T
ota
l Flo
w f
rom
1/1
/199
8-9/
30/2
004
Fecal Coliform TMDL, Mangrove Lagoon and Benner Bay, St. Thomas May 24th, 2005
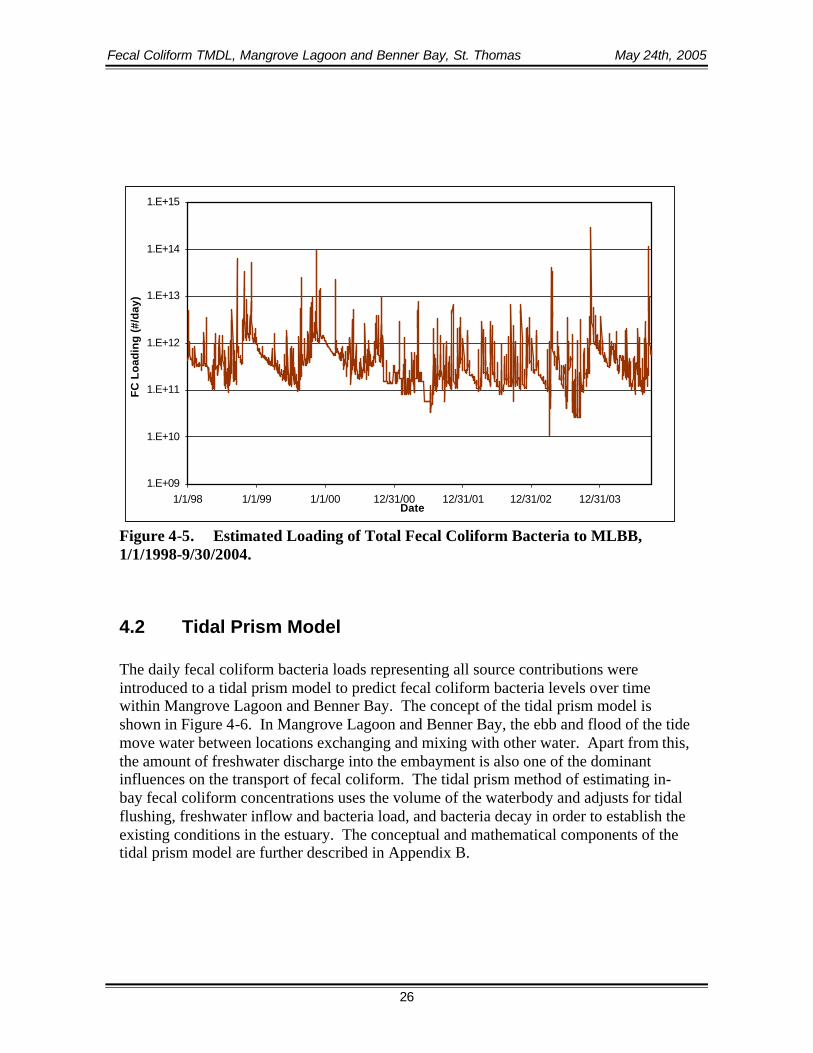
26
Figure 4-5. Estimated Loading of Total Fecal Coliform Bacteria to MLBB, 1/1/1998-9/30/2004.
4.2 Tidal Prism Model The daily fecal coliform bacteria loads representing all source contributions were introduced to a tidal prism model to predict fecal coliform bacteria levels over time within Mangrove Lagoon and Benner Bay. The concept of the tidal prism model is shown in Figure 4-6. In Mangrove Lagoon and Benner Bay, the ebb and flood of the tide move water between locations exchanging and mixing with other water. Apart from this, the amount of freshwater discharge into the embayment is also one of the dominant influences on the transport of fecal coliform. The tidal prism method of estimating in-bay fecal coliform concentrations uses the volume of the waterbody and adjusts for tidal flushing, freshwater inflow and bacteria load, and bacteria decay in order to establish the existing conditions in the estuary. The conceptual and mathematical components of the tidal prism model are further described in Appendix B.
1.E+09
1.E+10
1.E+11
1.E+12
1.E+13
1.E+14
1.E+15
1/1/98 1/1/99 1/1/00 12/31/00 12/31/01 12/31/02 12/31/03Date
FC
Lo
adin
g (
#/d
ay)

Fecal Coliform TMDL, Mangrove Lagoon and Benner Bay, St. Thomas May 24th, 2005
27
Figure 4-6. Tidal Prism Model Concept.
4.3 Assumptions and Limitations Some of the major underlying assumptions for this analysis include the following:
• Observed streamflow data at Turpentine Run at Mt. Zion gage (USGS 50274000) was assumed to be representative of streams contributing to the bay, and area-weighting the flow measured at this gage represents the net flow to the bay.
• The watersheds delineated were based on topographic data and available stream and channel coverages. Data regarding flow diversions to or from other watersheds were not available and therefore not considered in the analysis.
• Regeneration of fecal coliform bacteria in the bay is not a significant source. • The rate of decay for fecal coliform bacteria does not vary seasonally or based on
meteorological conditions. • Bacteria loadings from point sources and marina discharges are time-constant and
equivalent for storms of any size, and thus do not consider antecedent conditions. • Bacteria loadings from the land surface and septic systems, although temporally
disaggregated, may not represent the full range of possible bacteria concentrations. The disaggregation procedure inherently applies equal weighting to low flow and high flow conditions (thus the first-flush phenomenon and antecedent conditions are not considered).
• Bacteria concentrations estimated by the tidal prism model assume the volume is fully-mixed, and that bacteria concentrations are horizontally and vertically-averaged.
Lf
Qf Q0
Qb
k
High Tide
Low Tide
Fecal Coliform TMDL, Mangrove Lagoon and Benner Bay, St. Thomas May 24th, 2005
28
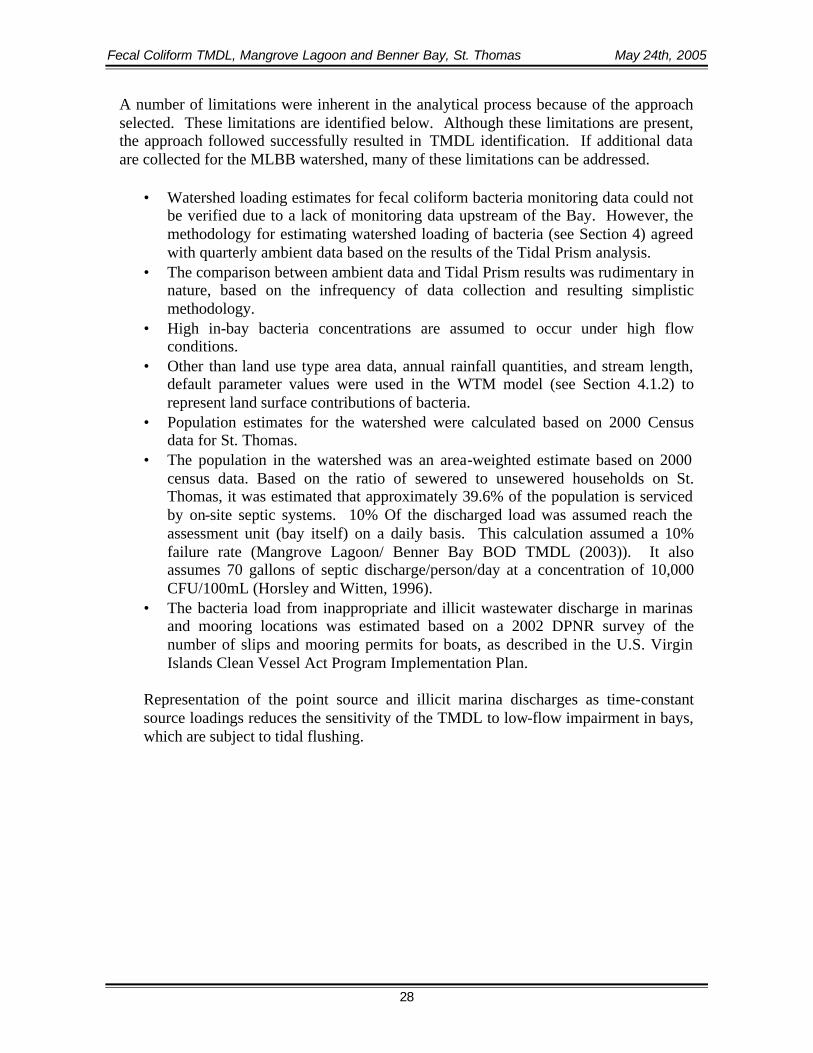
A number of limitations were inherent in the analytical process because of the approach selected. These limitations are identified below. Although these limitations are present, the approach followed successfully resulted in TMDL identification. If additional data are collected for the MLBB watershed, many of these limitations can be addressed.
• Watershed loading estimates for fecal coliform bacteria monitoring data could not be verified due to a lack of monitoring data upstream of the Bay. However, the methodology for estimating watershed loading of bacteria (see Section 4) agreed with quarterly ambient data based on the results of the Tidal Prism analysis.
• The comparison between ambient data and Tidal Prism results was rudimentary in nature, based on the infrequency of data collection and resulting simplistic methodology.
• High in-bay bacteria concentrations are assumed to occur under high flow conditions.
• Other than land use type area data, annual rainfall quantities, and stream length, default parameter values were used in the WTM model (see Section 4.1.2) to represent land surface contributions of bacteria.
• Population estimates for the watershed were calculated based on 2000 Census data for St. Thomas.
• The population in the watershed was an area-weighted estimate based on 2000 census data. Based on the ratio of sewered to unsewered households on St. Thomas, it was estimated that approximately 39.6% of the population is serviced by on-site septic systems. 10% Of the discharged load was assumed reach the assessment unit (bay itself) on a daily basis. This calculation assumed a 10% failure rate (Mangrove Lagoon/ Benner Bay BOD TMDL (2003)). It also assumes 70 gallons of septic discharge/person/day at a concentration of 10,000 CFU/100mL (Horsley and Witten, 1996).
• The bacteria load from inappropriate and illicit wastewater discharge in marinas and mooring locations was estimated based on a 2002 DPNR survey of the number of slips and mooring permits for boats, as described in the U.S. Virgin Islands Clean Vessel Act Program Implementation Plan.
Representation of the point source and illicit marina discharges as time-constant source loadings reduces the sensitivity of the TMDL to low-flow impairment in bays, which are subject to tidal flushing.
Fecal Coliform TMDL, Mangrove Lagoon and Benner Bay, St. Thomas May 24th, 2005
29
5 TMDL CALCULATION AND ALLOCATION A TMDL for a given pollutant and waterbody is comprised of the sum of individual wasteload allocations (WLAs) for point sources and load allocations (LAs) for both nonpoint sources and natural background levels. In addition, the TMDL must include a margin of safety (MOS), either implicitly or explicitly, to account for the uncertainty in the relationship between pollutant loads and the quality of the receiving waterbody. Conceptually, this definition is represented by the equation:
TMDL = ∑ WLAs + ∑ LAs + MOS The TMDL is the total amount of pollutant that can be assimilated by the receiving waterbody while still achieving the TMDL target. In TMDL development, allowable loadings from pollutant sources that cumulatively amount to no more than the TMDL must be established; this provides the basis to establish water quality-based controls. TMDLs can be expressed on a mass loading basis (e.g., pounds of DO per year) or as a concentration in accordance with 40 CFR 130.2(l).
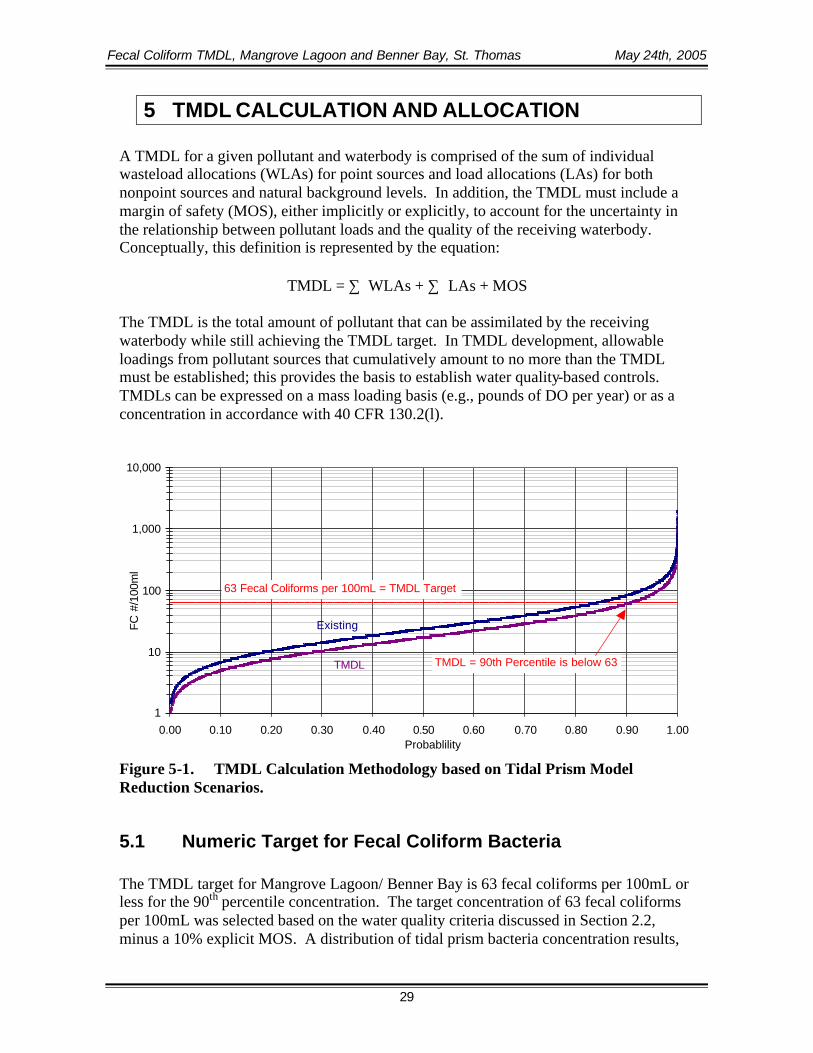
Figure 5-1. TMDL Calculation Methodology based on Tidal Prism Model Reduction Scenarios.
5.1 Numeric Target for Fecal Coliform Bacteria The TMDL target for Mangrove Lagoon/ Benner Bay is 63 fecal coliforms per 100mL or less for the 90th percentile concentration. The target concentration of 63 fecal coliforms per 100mL was selected based on the water quality criteria discussed in Section 2.2, minus a 10% explicit MOS. A distribution of tidal prism bacteria concentration results,
1
10
100
1,000
10,000
0.00 0.10 0.20 0.30 0.40 0.50 0.60 0.70 0.80 0.90 1.00Probablility
FC #
/100
ml
63 Fecal Coliforms per 100mL = TMDL Target
TMDL = 90th Percentile is below 63
Existing
TMDL

Fecal Coliform TMDL, Mangrove Lagoon and Benner Bay, St. Thomas May 24th, 2005
30
based on watershed and in-bay loading (see Section 4.2), was created and is shown in Figure 5-1 for the existing and TMDL scenarios. The lowest 90% (90th percentile) of the population of in-bay concentrations was not allowed to exceed 63 fecal coliforms per 100mL for the TMDL condition. This 90th percentile threshold corresponds to the USVI assessment methodology for Class B waters, which states that waters are supporting beneficial uses if 10% or less of bacteria samples exceed 70 fecal coliforms per 100mL. Therefore, the 90th percentile concentration is the critical condition, as described in Section 3.2. Compliance with the TMDL target was evaluated based on results of the tidal prism model (as shown in Figure 5-1). The results of the TMDL analysis suggest that to meet this TMDL target, a 25% reduction in bacteria loading to Mangrove Lagoon, and a 1% reduction for Benner Bay are required.
5.2 Wasteload Allocations Federal regulations (40 CFR 130.7) require TMDLs to include individual WLAs for each point source. Currently, no permitted point sources discharge to Mangrove Lagoon or Benner Bay.
5.3 Load Allocations Based on the analysis performed, the primary nonpoint source contributions to MLBB are from the land surface and failing septic systems. Therefore, the TMDL requires a 25% reduction in bacteria loading from land surface loads and a 25% reduction from failing septic system loads. Illicit discharges from vessels docked at marinas in Benner Bay (Mangrove Lagoon is restricted and does not have any marinas or moorings), although less significant with respect to bacteria levels, were reduced to zero based on the fact that they are illicit in nature. Source-based reductions were arrived at through an iterative process of examining bacteria reduction possibilities by varying bacteria loads from each source to the bay and ensuring that the TMDL target was being met.
5.4 Margin of Safety There are two methods for incorporating the MOS (USEPA, 1991):
• Implicitly incorporate the MOS using conservative model assumptions to develop allocations.
• Explicitly specify a portion of the total TMDL as the MOS and use the remainder for allocations.
For MLBB, an implicit MOS was incorporated in several ways. Throughout the TMDL development process, conservative assumptions were made to address the implicit component of the MOS. As described in Section 2.4.2.3, The Draft Environmental Impact Statement for the Proposed Mangrove Lagoon/ Turpentine Run Wastewater

Fecal Coliform TMDL, Mangrove Lagoon and Benner Bay, St. Thomas May 24th, 2005
31
Treatment Facilities (USEPA, 1984) estimated the population in the MLBB watershed to be 15,064 in 1983, and projected a population of 18,650 by the year 2000. It has been estimated that approximately 15 percent (2,798) of the population in these two watersheds is serviced by on-site septic systems (Bortman, 1997; USEPA, 1984). However, these estimates were made prior to recent improvements in local sewer networks. The improvement of these systems since 1983 is not known, but the TMDL analysis assumed that 15% of the population was still unsewered and served by potentially failing septic systems. Therefore, septic system contributions of fecal coliform bacteria were overestimated and represent an implicit MOS. A TMDL target of 63 fecal coliforms per 100mL was selected based on the water quality standards discussed previously (70 fecal coliforms per 100mL; Section 2.2), minus a 10% explicit MOS.
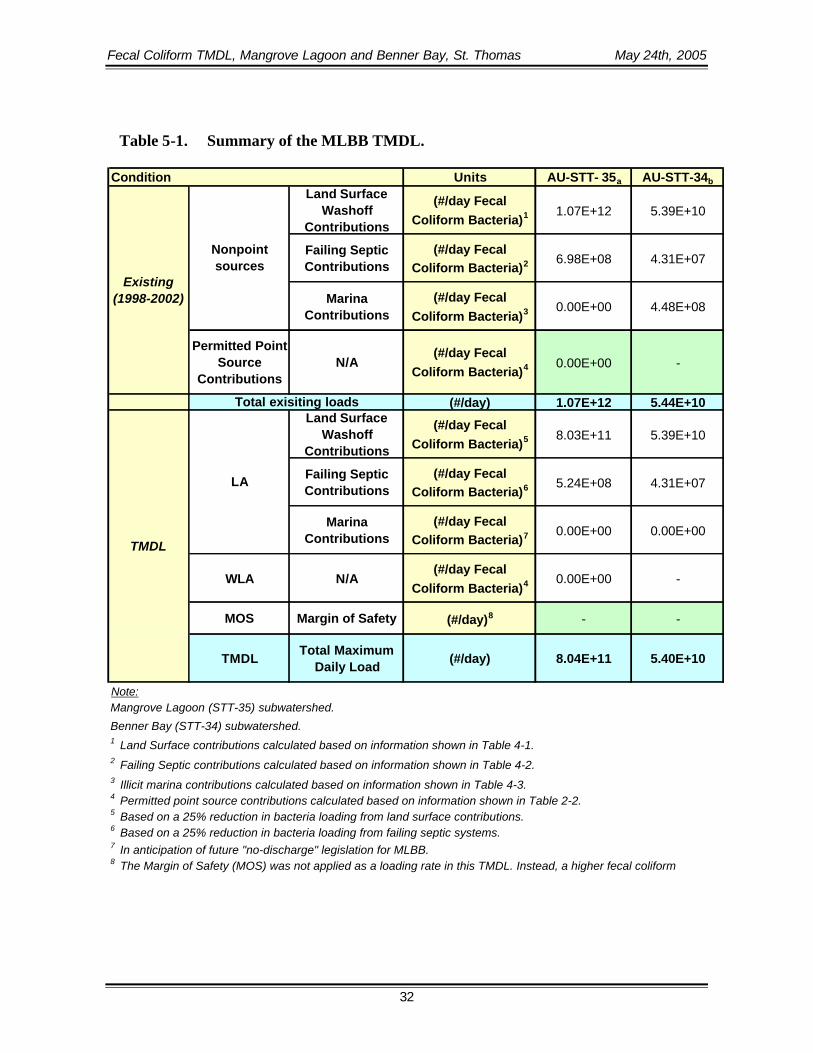
5.5 TMDL The TMDL components are presented by Assessment Unit in Table 5-1. Each source of bacteria (contributing to that Assessment Unit specifically) is identified for both existing and TMDL conditions. The components of existing land surface contributions in Table 5-1 were calculated using the WTM model and are shown in Table 4-1. Failing septic system contribution calculations are shown in Table 4-2, and marina contributions are calculated in Table 4-3. Consideration of seasonality is a requirement for the TMDL and was considered in a number of ways. Streamflow data from an active USGS station was used to estimate time-variable bacteria loading and subsequent in-bay response. Observed streamflow at the gage varies by season as described previously. As supported by the discussion in Section 3-2 and observed data shown in Table 3-2 and Figure 3-4, high in-bay bacteria concentrations are assumed to occur under high flow conditions. Therefore, based on the methodology used to estimate watershed loadings, seasonal loading of bacteria to the bay was considered in the TMDL.
Fecal Coliform TMDL, Mangrove Lagoon and Benner Bay, St. Thomas May 24th, 2005
32
Table 5-1. Summary of the MLBB TMDL.
Units AU-STT- 35a AU-STT-34b
Land Surface Washoff
Contributions
(#/day Fecal Coliform Bacteria)1 1.07E+12 5.39E+10
Failing Septic Contributions
(#/day Fecal Coliform Bacteria)2 6.98E+08 4.31E+07
Marina Contributions
(#/day Fecal Coliform Bacteria)3 0.00E+00 4.48E+08
Permitted Point Source
Contributions N/A
(#/day Fecal Coliform Bacteria)4 0.00E+00 -
(#/day) 1.07E+12 5.44E+10Land Surface
Washoff Contributions
(#/day Fecal Coliform Bacteria)5 8.03E+11 5.39E+10
Failing Septic Contributions
(#/day Fecal Coliform Bacteria)6 5.24E+08 4.31E+07
Marina Contributions
(#/day Fecal Coliform Bacteria)7 0.00E+00 0.00E+00
WLA N/A(#/day Fecal
Coliform Bacteria)4 0.00E+00 -
MOS Margin of Safety (#/day)8 - -
TMDLTotal Maximum
Daily Load (#/day) 8.04E+11 5.40E+10
Existing (1998-2002)
TMDL
Note:
Total exisiting loads
LA
8 The Margin of Safety (MOS) was not applied as a loading rate in this TMDL. Instead, a higher fecal coliform
7 In anticipation of future "no-discharge" legislation for MLBB.
6 Based on a 25% reduction in bacteria loading from failing septic systems.
5 Based on a 25% reduction in bacteria loading from land surface contributions.
3 Illicit marina contributions calculated based on information shown in Table 4-3.
2 Failing Septic contributions calculated based on information shown in Table 4-2.
1 Land Surface contributions calculated based on information shown in Table 4-1.
b
Benner Bay (STT-34) subwatershed.
Mangrove Lagoon (STT-35) subwatershed.
4 Permitted point source contributions calculated based on information shown in Table 2-2.
Nonpoint sources
Condition

Fecal Coliform TMDL, Mangrove Lagoon and Benner Bay, St. Thomas May 24th, 2005
33
6 MONITORING RECOMMENDATIONS Seasonal variations including temperature, precipitation, wind direction and speed, water and air temperature, currents, and seasonal population fluctuations most likely affect the water quality within this system. Sample locations should be predetermined based on several factors, including location relative to critical land uses, stream discharge locations, and marina locations. Additional sample locations should be selected to capture the general ambient water quality and flow conditions within the water bodies. Most importantly, sample locations should be consistently adhered to for all sampling events. If sample locations are too loosely defined, it becomes increasingly difficult to accurately interpret the resulting data and the sampling effectiveness decreases significantly. Ideally, all sampling will be implemented on a monthly basis. This will provide a consistent and comprehensive data set that can be effectively analyzed and utilized in a transient model. To better characterize the impact of rainfall-driven sources, stormwater sampling should also be conducted during storms of varying magnitude. Sampling should be conducted within the bay itself and at locations throughout the watershed. Another recommendation is to monitor pumpout facilities at the marinas in the region. The availability of a pumpout log would allow this significant source of bacteria to be better defined, and provide better information regarding daily, monthly, and seasonal marina usage. In order to meet the goals of the monitoring plan, as discussed at the beginning of this section, the suite of parameters to be sampled is listed below. Following is a recommended list of the parameters to be monitored within MLBB. Ideally, these parameters should be sampled at various locations and multiple depths when applicable, and at a maximum time interval of monthly: • Fecal Coliform Bacteria • Water Temperature • Turbidity These parameters would allow for further identification of bacteria sources and support critical condition assessment. A sampling plan including these parameters should provide a baseline condition to be used in BMP efficiency assessments in the MLBB system.
Fecal Coliform TMDL, Mangrove Lagoon and Benner Bay, St. Thomas May 24th, 2005
34
7 IMPLEMENTATION AND MANAGEMENT PLAN Based on the current knowledge of the MLBB system, fecal coliform bacteria is a significant contributor to its impairment, and reduction of bacteria loading rates would provide the most significant improvement in water quality. Additional measures for decreasing bacteria levels in MLBB include the enhancement of vessel wastewater management. Pumpout facilities must be maintained to eliminate illicit discharges of vessel waste, and logs must be kept to identify usage and quantities pumped. The TMDL can be re-evaluated in several years after the marina discharges have been removed and the bacteria levels reduced. Increased sewered networks would also assist in reducing bacteria contributions from failing septic tanks. New septic tank installation should be limited to those soils deemed suitable for septic installation, if the elimination of new septic tank installation is not feasible. Inspections of existing septic systems should be intensified to identify and replace failed systems.

Fecal Coliform TMDL, Mangrove Lagoon and Benner Bay, St. Thomas May 24th, 2005
35
REFERENCES Bortman, Marci Lynn, Trends in Land Use, Sewage and Stormwater and Their Relationship with Coastal Water Quality in St. Thomas, U. S. Virgin Islands, Ph.D. Dissertation, State University of New York at Stony Brook, New York, 1997. Caraco, D. 2001. The Watershed Treatment Model. Center for Watershed Protection. Ellicott City, MD. Horsley and Witten. 1996. Identification and evaluation of nutrient and bacterial loadings to Maquoit Bay, New Frunswick and Freeport, Maine. Kuo, A., Butt, A., Kim, S. and J. Ling (1998). Application of a tidal prism water quality model to Virginia Small Coastal Basins. SRAMSOE No. 348. Nichols, N. and Kuo, A., 1979. Virgin Islands Bays: Modeling of Water Quality and Pollution Susceptibility, 1979. Contract # DC-CCA-97-77 for the Department of Conservation and Cultural Affairs, Government of the Virgin Islands. Nichols, Maynard, and Edward Towle, with Golbert Cintron, David Grigg, Robert Huggett, David Olsen, William Rainey, Edwin Rosenberg, Gale n Thompson and Richard Trotman. October 1977. Water, Sediments and Ecology of the Mangrove Lagoon and Benner Bay, St. Thomas. Technical Report 1. Island Resources Foundation, St. Thomas, U.S. Virgin Islands. Schottroff, A., E. Towle, R. Waltington, and J. Bacle, 1992. Management plan for the Magens Bay Area of Particular Conern (APC) [DRAFT}, Island Resources Foundation. Schottroff, A., E. Towle, R. Waltington, and J. Bacle, 1992. Management plan for the Vessup Bay/Red Hook Area of Particular Conern (APC) [DRAFT}, Island Resources Foundation. Shen, J., H. Wang, and M. Sisson (2002). Application of an integrated watershed and tidal prism model to the Poquoson Coastal Embayment. Contract report submitted to the Virginia Department of Environmental Quality. Virginia Institute of Marine Science Special Report 380, Gloucester Point, VA. Towle, Edward. 1985. Case Study Report, Virgin Islands Mangrove Lagoon (1967- 1984). Island Resources Foundation Occasional Paper No. 54B. Prepared for Caribbean Conservation Association’s Environmental Impact Assessment (EIA) Workshop, Barbados. Island Resources Foundation, St. Thomas, U.S. Virgin Islands. U.S. Environmental Protection Agency (USEPA). April,1984. Draft Environmental Impact Statement for the Mangrove Lagoon/Turpentine Run Wastewater Facilities Plan, St. Thomas, United States Virgin Islands. Region II. New York,

Fecal Coliform TMDL, Mangrove Lagoon and Benner Bay, St. Thomas May 24th, 2005
36
New York. USEPA (United States Environmental Protection Agency). 1991. Guidance for Water Quality-Based Decisions: The TMDL Process. EPA 440/4-91-001. United States Environmental Protection Agency, Office of Water, Washington, DC. USEPA (United States Environmental Protection Agency). 2003. Total Maximum Daily Loads (TMDLs) for Mangrove Lagoon and Benner Bay/Lagoon Marina. Region II. New York, New York. VIDPNR (Virgin Islands Department of Planning and Natural Resources), 2004. The 2004 Integrated Water Quality Monitoring and Assessment Report for the United States Virgin Islands. June, 2004. VIDPNR (Virgin Islands Department of Planning and Natural Resources), 2004. The 2004 U.S. Virgin Islands 303(d) List. April, 2004. Virginia Department of Environmental Quality (VDEQ) (2005). Urbanna Creek Total Maximum Daily Load (TMDL) Report for Shellfish Condemnation Areas Listed Due to Bacteria Contamination.

Fecal Coliform TMDL, Mangrove Lagoon and Benner Bay, St. Thomas May 24th, 2005
37
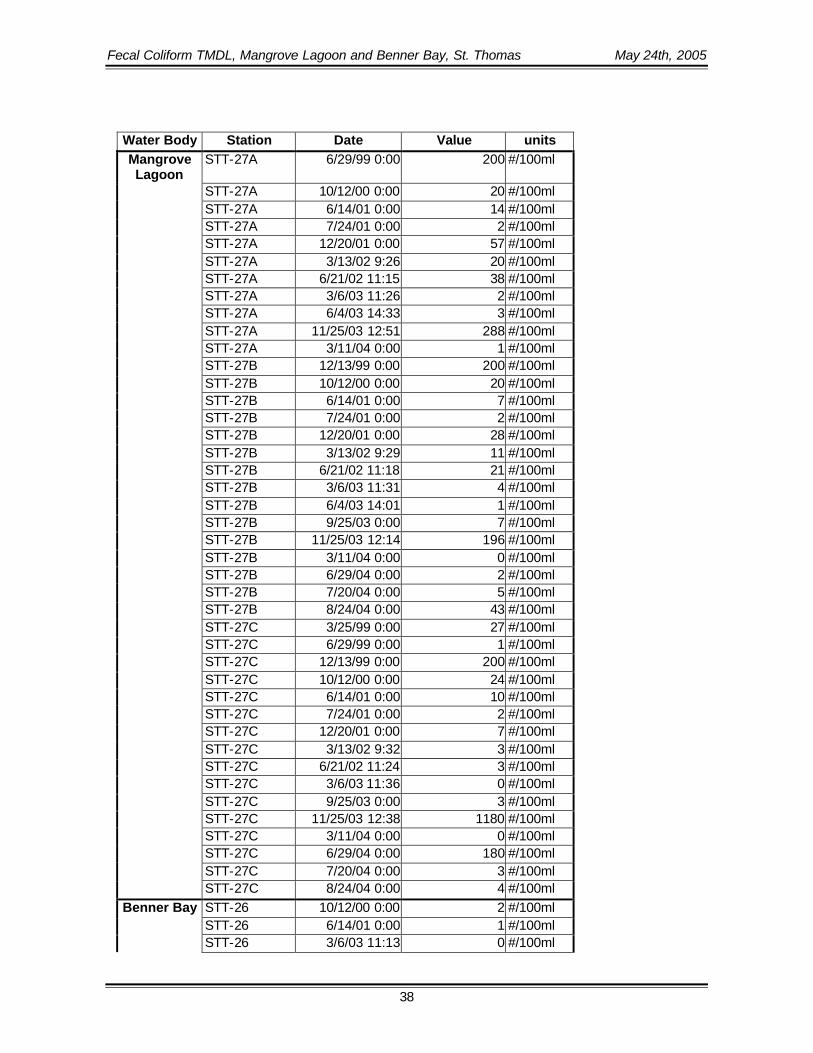
APPENDIX A: WATER QUALITY DATA
Fecal Coliform TMDL, Mangrove Lagoon and Benner Bay, St. Thomas May 24th, 2005
38
Water Body Station Date Value units Mangrove Lagoon
STT-27A 6/29/99 0:00 200 #/100ml
STT-27A 10/12/00 0:00 20 #/100ml STT-27A 6/14/01 0:00 14 #/100ml STT-27A 7/24/01 0:00 2 #/100ml STT-27A 12/20/01 0:00 57 #/100ml STT-27A 3/13/02 9:26 20 #/100ml STT-27A 6/21/02 11:15 38 #/100ml STT-27A 3/6/03 11:26 2 #/100ml STT-27A 6/4/03 14:33 3 #/100ml STT-27A 11/25/03 12:51 288 #/100ml STT-27A 3/11/04 0:00 1 #/100ml STT-27B 12/13/99 0:00 200 #/100ml STT-27B 10/12/00 0:00 20 #/100ml STT-27B 6/14/01 0:00 7 #/100ml STT-27B 7/24/01 0:00 2 #/100ml STT-27B 12/20/01 0:00 28 #/100ml STT-27B 3/13/02 9:29 11 #/100ml STT-27B 6/21/02 11:18 21 #/100ml STT-27B 3/6/03 11:31 4 #/100ml STT-27B 6/4/03 14:01 1 #/100ml STT-27B 9/25/03 0:00 7 #/100ml STT-27B 11/25/03 12:14 196 #/100ml STT-27B 3/11/04 0:00 0 #/100ml STT-27B 6/29/04 0:00 2 #/100ml STT-27B 7/20/04 0:00 5 #/100ml STT-27B 8/24/04 0:00 43 #/100ml STT-27C 3/25/99 0:00 27 #/100ml STT-27C 6/29/99 0:00 1 #/100ml STT-27C 12/13/99 0:00 200 #/100ml STT-27C 10/12/00 0:00 24 #/100ml
STT-27C 6/14/01 0:00 10 #/100ml STT-27C 7/24/01 0:00 2 #/100ml STT-27C 12/20/01 0:00 7 #/100ml STT-27C 3/13/02 9:32 3 #/100ml STT-27C 6/21/02 11:24 3 #/100ml STT-27C 3/6/03 11:36 0 #/100ml STT-27C 9/25/03 0:00 3 #/100ml STT-27C 11/25/03 12:38 1180 #/100ml STT-27C 3/11/04 0:00 0 #/100ml STT-27C 6/29/04 0:00 180 #/100ml STT-27C 7/20/04 0:00 3 #/100ml STT-27C 8/24/04 0:00 4 #/100ml
Benner Bay STT-26 10/12/00 0:00 2 #/100ml STT-26 6/14/01 0:00 1 #/100ml STT-26 3/6/03 11:13 0 #/100ml

Fecal Coliform TMDL, Mangrove Lagoon and Benner Bay, St. Thomas May 24th, 2005
39
STT-26 6/4/03 14:34 0 #/100ml STT-26 9/25/03 0:00 0 #/100ml STT-26 11/25/03 12:19 0 #/100ml STT-26 3/11/04 0:00 0 #/100ml STT-26 8/24/04 0:00 0 #/100ml

Fecal Coliform TMDL, Mangrove Lagoon and Benner Bay, St. Thomas May 24th, 2005
40
APPENDIX B: TIDAL PRISM MODEL
Fecal Coliform TMDL, Mangrove Lagoon and Benner Bay, St. Thomas May 24th, 2005
41
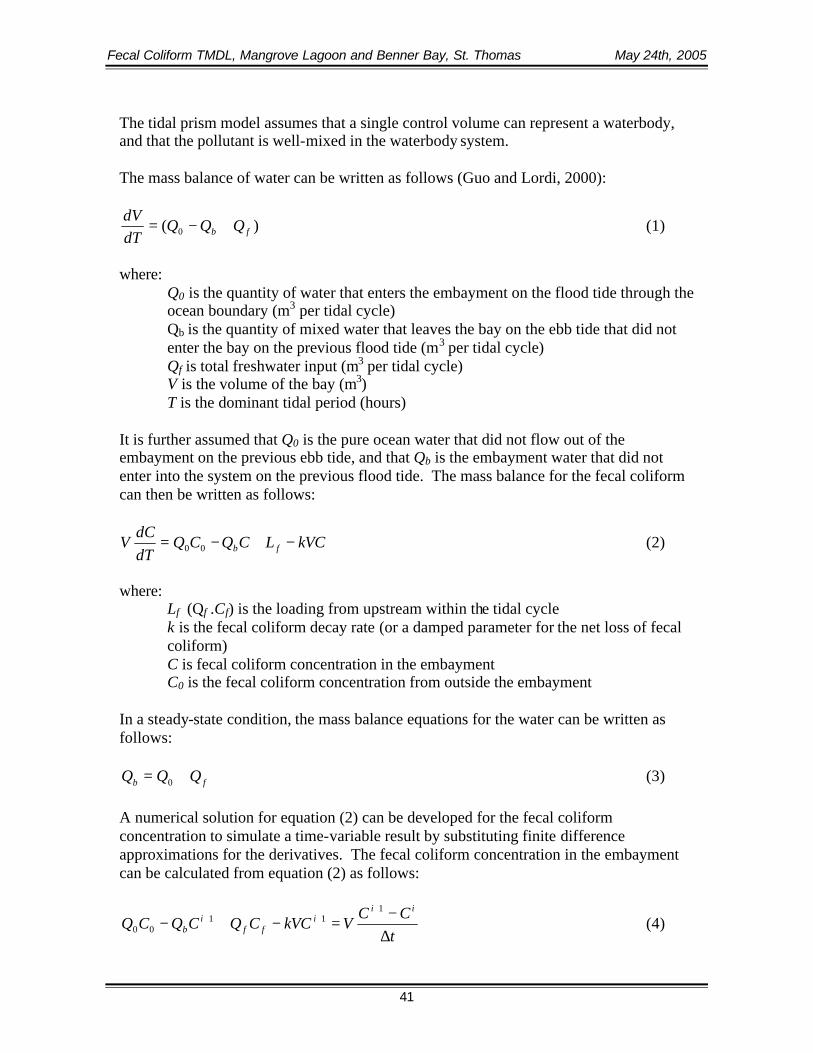
The tidal prism model assumes that a single control volume can represent a waterbody, and that the pollutant is well-mixed in the waterbody system. The mass balance of water can be written as follows (Guo and Lordi, 2000):
)( 0 fb QQQdTdV
+−= (1)
where:
Q0 is the quantity of water that enters the embayment on the flood tide through the ocean boundary (m3 per tidal cycle) Qb is the quantity of mixed water that leaves the bay on the ebb tide that did not enter the bay on the previous flood tide (m3 per tidal cycle) Qf is total freshwater input (m3 per tidal cycle) V is the volume of the bay (m3) T is the dominant tidal period (hours)
It is further assumed that Q0 is the pure ocean water that did not flow out of the embayment on the previous ebb tide, and that Qb is the embayment water that did not enter into the system on the previous flood tide. The mass balance for the fecal coliform can then be written as follows:
kVCLCQCQdTdC
V fb −+−= 00 (2)
where:
Lf (Qf .Cf) is the loading from upstream within the tidal cycle k is the fecal coliform decay rate (or a damped parameter for the net loss of fecal coliform) C is fecal coliform concentration in the embayment C0 is the fecal coliform concentration from outside the embayment
In a steady-state condition, the mass balance equations for the water can be written as follows:
fb QQQ += 0 (3) A numerical solution for equation (2) can be developed for the fecal coliform concentration to simulate a time-variable result by substituting finite difference approximations for the derivatives. The fecal coliform concentration in the embayment can be calculated from equation (2) as follows:
tCC
VkVCCQCQCQii
iff
ib ∆
−=−+−
+++
111
00 (4)

Fecal Coliform TMDL, Mangrove Lagoon and Benner Bay, St. Thomas May 24th, 2005
42
)](1[
])([ 001
kVQVt
CLCQVtC
b
ifi
+∆+
++∆=+ (5)
The daily load can be estimated based on the dominant tidal period in the area. The dominant tidal period was assumed to be approximately 12 hours. If fecal coliform concentration is in MPN/100ml, the daily load (counts day-1) can be estimated as:
100001224
××= TLoadLoad (6)
Since Q0 (the quantity of water that enters the embayment on the flood tide through the ocean boundary) is unknown, it was determined indirectly. Usually Q0 is not known and the only known quantity at the ocean boundary is the tidal range of the tidal embayment. A tidal range time series was computed for the dominant tidal period based on observed hourly data from the Charlotte Amalie, St. Thomas station (NOAA/NOS #9751639)(see Figure 3-3). From that, QT, the total ocean water entering the bay on the flood tide, can be calculated. QT can then be used to calculate Q0, the volume of new ocean water entering the embayment on the flood tide by using the ocean tidal exchange ratio β:
TQQ ⋅= β0 (7) where β is the exchange ratio and QT is the total ocean water entering the bay on the flood tide. The numerical value of β is usually smaller than 1, and it represents the fraction of new ocean water entering the embayment. In general, the exchange ratio values range from 0.3 to 0.7 (VDEQ, 2005, Kuo et al., 1998; Shen et al., 2002). A mean value of 0.5 was used for the exchange ratio in MLBB. Once Q0 is known, then Qb can be calculated from equation (3).