February Cold Weather Event - Nebraska.gov
25
1 February Cold Weather Event
Transcript of February Cold Weather Event - Nebraska.gov
1
February Cold Weather Event

2
Pam Bonrud, Director Government and Regulatory AffairsIntroductions
Brad Wenande, South Division ManagerOperations Overview
Luke Hansen, Manager Gas SupplyGas Supply Overview
Jeff Decker, Regulatory SpecialistCustomer Bill Overview
Questions?
Agenda

3
Thank youPam Bonrud,Director Government and Regulatory Affairs

4
Thank youBrad Wenande,South Division Manager

5
• Recognized the cold-weather event forecasted for several consecutive days in February.
• Began to study system models to identify operational challenges and identify key response measures to implement.
• Greatest challenge maintaining our system identified in the SW part of Grand Island, including our feed to Alda.
• Pulled in SME’s from across different departments to review historical and projected load data, pressure settings, MAOP values and alarm set points.
February Cold Weather Event
6
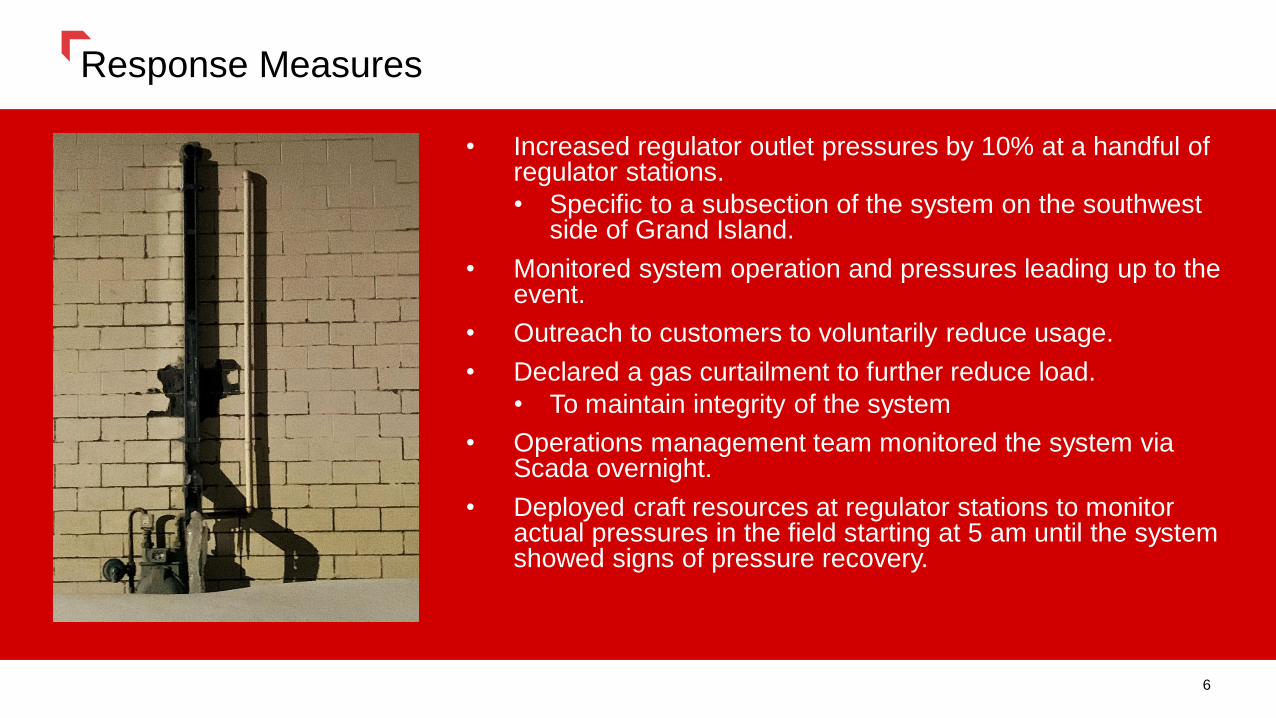
• Increased regulator outlet pressures by 10% at a handful of regulator stations.
• Specific to a subsection of the system on the southwest side of Grand Island.
• Monitored system operation and pressures leading up to the event.
• Outreach to customers to voluntarily reduce usage.
• Declared a gas curtailment to further reduce load.
• To maintain integrity of the system
• Operations management team monitored the system via Scada overnight.
• Deployed craft resources at regulator stations to monitor actual pressures in the field starting at 5 am until the system showed signs of pressure recovery.
Response Measures

7
This is an example of pressure trending visible to us via Scada. We were using this type of chart extensively throughout the event.
Response Measures

8
Tuesday, Feb. 9 –
• Air temperature in Grand Island as low as -17°
• Alda regulator station inlet pressure dropped to 29 psi (system designed for a 60 psi inlet)
• Did not incur any operating issues
Timeline of Events
Friday, Feb. 12 –
• Began outreach to interruptible customers to voluntarily reduce load
• Pulled in Regulatory and Gas Supply teams to discuss parameters of declaring a curtailment should we need to pull that trigger
• Response team met to initiate action plan for the weekend
Saturday, Feb. 13 –
• Continued customer outreach to reduce load voluntarily, in particular with high-use customers
• Declared curtailment February 14 – 16

9
Sunday, Feb. 14 thru Tuesday, Feb. 16 –
• Response team continued to meet
• Finalized plans for the upcoming morning peak loads
• Gleaned all information from the previous day to hone models for accuracy
Timeline of Events
Monday, Feb. 15 –
• Air temperature in Grand Island as low as -20°
• Record flows / demand on system
• Alda regulator station inlet pressure dropped to 29 psi
Tuesday, Feb. 16 –
• Air temperature in Grand Island as low as -18°
• Record flows / demand on system
• Alda regulator station inlet pressure dropped to 30 psi

10
• We did not experience any operating issues or have any no-gas situations during the event.
• Several customers went off-line or delayed start of shift to allow us to get through the morning peak load constraint. We were in contact with those customers regularly throughout the event.
• The pressure correction work completed in 2020 aided us in this situation. Work planned for year 2 of the pressure correction project planned for completion in 2021 should alleviate this issue going forward.
• We plan to bring on more Scada monitoring points to allow for even greater visibility to the system.
Additional Context

11
• System models accurately depicted operation observed.
• Take a more surgical approach to contacting customers to reduce usage.
• Dealing with a system constraint versus a broader supply issue, we could have focused our customer outreach efforts to the southwest area of town rather than contacting all interruptible, industrial and commercial customers.
Lessons Learned

12
Thank youLuke Hansen,Manager Gas Supply

13
NorthWestern Energy proposes to use the dates of February 13-18 for a cost recovery mechanism for the cold weather event. Purchases made on February 18 were made at the end of the cold weather event and were above normal day prices. The indexes that these purchases were made on settled above $20 per dekatherm.
Dates of Impact
14
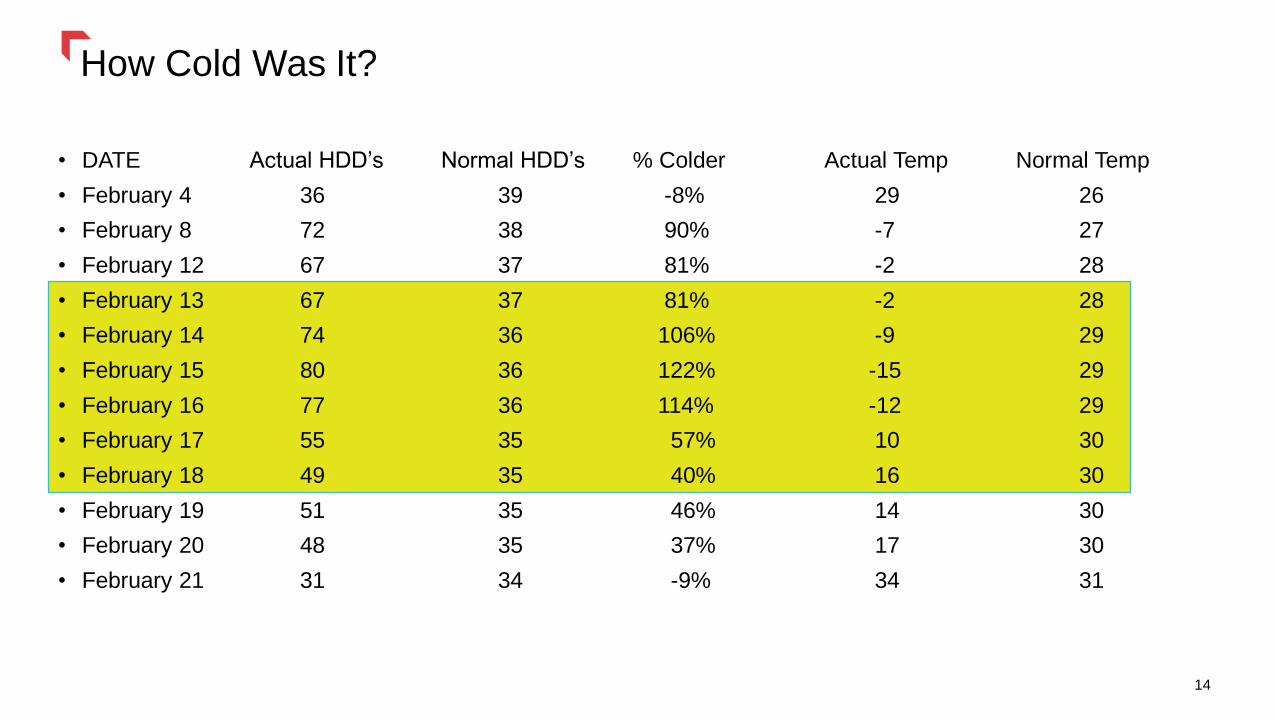
How Cold Was It?
• DATE Actual HDD’s Normal HDD’s % Colder Actual Temp Normal Temp
• February 4 36 39 -8% 29 26
• February 8 72 38 90% -7 27
• February 12 67 37 81% -2 28
• February 13 67 37 81% -2 28
• February 14 74 36 106% -9 29
• February 15 80 36 122% -15 29
• February 16 77 36 114% -12 29
• February 17 55 35 57% 10 30
• February 18 49 35 40% 16 30
• February 19 51 35 46% 14 30
• February 20 48 35 37% 17 30
• February 21 31 34 -9% 34 31

15
Weather Impact on Natural Gas Purchase Volumes
Feb 13 – 18 Baseload Supplies 144,000
Est Feb 13 – 18 Incremental Purchases 149,660
New Peak Day Usage Established
Previous Peak Day Usage 46,000
One day was just below 46,000
Three days were above 47,500
Two days were above 50,000
New Peak was 50,400
February 13-18 presented unprecedented challenges with curtailment notifications, rolling blackouts, and record natural gas prices.

16
Impact on Natural Gas Purchases
DATE COST OF DAY PURCHASES
• February 13 $5,633,225
• February 14 $5,633,225
• February 15 $5,633,225
• February 16 $5,633,225
• February 17 $2,969,407
• February 18 $452,293
0
1,000,000
2,000,000
3,000,000
4,000,000
5,000,000
6,000,000
2/13/2021 2/14/2021 2/15/2021 2/16/2021 2/17/2021 2/18/2021
Cost of Day Purchases
Total purchases = $25,954,600

17
Thank youJeff Decker,Regulatory Specialist

18
February Average Bill Cost
• Customer Class 2005 2010 2015 2021 2021-12 2021-24 2021-36
• Residential $121 $110 $96 $78 $157 $119 $106
• Small Commercial $383 $342 $325 $253 $550 $409 $360
• Large Firm $2,483 $3,092 $2,609 $1,654 $4,305 $3,045 $2,610
• Interruptible $2,203 $2,104 $2,663 $738 $2,446 $1,708 $1,453
• * 2021-12 = 12 month February event gas cost recovery
• * 2021-24 = 24 month recovery
• * 2021-36 = 36 month recovery

19
Percent of Increase Over February Actual Bill Cost
• Bill Increase % Over February 2021 2021-12 2021-24 2021-36
• Residential 101% 53% 37%
• Small Commercial 117% 61% 42%
• Large Firm 160% 84% 58%
• Interruptible 174% 91% 63%
0%
20%
40%
60%
80%
100%
120%
140%
160%
180%
200%
Residential Small Commercial Large Firm Interruptible
Bill Increase % Over February
2021-12 2021-24 2021-36

20
12 Month Bill Increase Residential
$0
$10
$20
$30
$40
$50
$60
$70
$80
$90
March April May June July Aug Sept Oct Nov Dec Jan Feb
Residential
12 Month Recovery 24 Month Recovery 36 Month Recovery
• Residential Mar Apr May Jun Jul Aug Sep Oct Nov Dec Jan Feb Total
• 12 Month Recovery $63 $46 $26 $14 $8 $8 $9 $12 $34 $48 $66 $79 $414
• 24 Month Recovery $33 $24 $14 $7 $4 $4 $5 $6 $18 $25 $35 $41 $217
• 36 Month Recovery $23 $17 $10 $5 $3 $3 $3 $4 $12 $17 $24 $28 $149

21
12 Month Bill Increase Small Commercial
$0
$50
$100
$150
$200
$250
$300
$350
March April May June July Aug Sept Oct Nov Dec Jan Feb
Small Commercial
12 Month Recovery 24 Month Recovery 36 Month Recovery
• Small Commercial Mar Apr May Jun Jul Aug Sep Oct Nov Dec Jan Feb Total
• 12 Month Recovery $233 $161 $90 $41 $29 $32 $32 $39 $112 $164 $251 $296 $1,480
• 24 Month Recovery $122 $85 $47 $21 $15 $17 $17 $21 $59 $86 $131 $155 $776
• 36 Month Recovery $84 $58 $32 $15 $10 $12 $11 $14 $41 $59 $90 $107 $534

22
12 Month Bill Increase Large Firm
$0
$500
$1,000
$1,500
$2,000
$2,500
$3,000
March April May June July Aug Sept Oct Nov Dec Jan Feb
Large Firm
12 Month Recovery 24 Month Recovery 36 Month Recovery
• Large Firm Mar Apr May Jun Jul Aug Sep Oct Nov Dec Jan Feb Total
• 12 Month Recovery $2,230 $1,614 $1,070 $645 $477 $525 $525 $669 $1,301 $1,710 $2,339 $2,651 $15,757
• 24 Month Recovery $1,170 $847 $561 $338 $250 $275 $275 $351 $683 $897 $1,227 $1,391 $8,266
• 36 Month Recovery $804 $582 $386 $233 $172 $189 $189 $241 $469 $617 $843 $956 $5,683
23
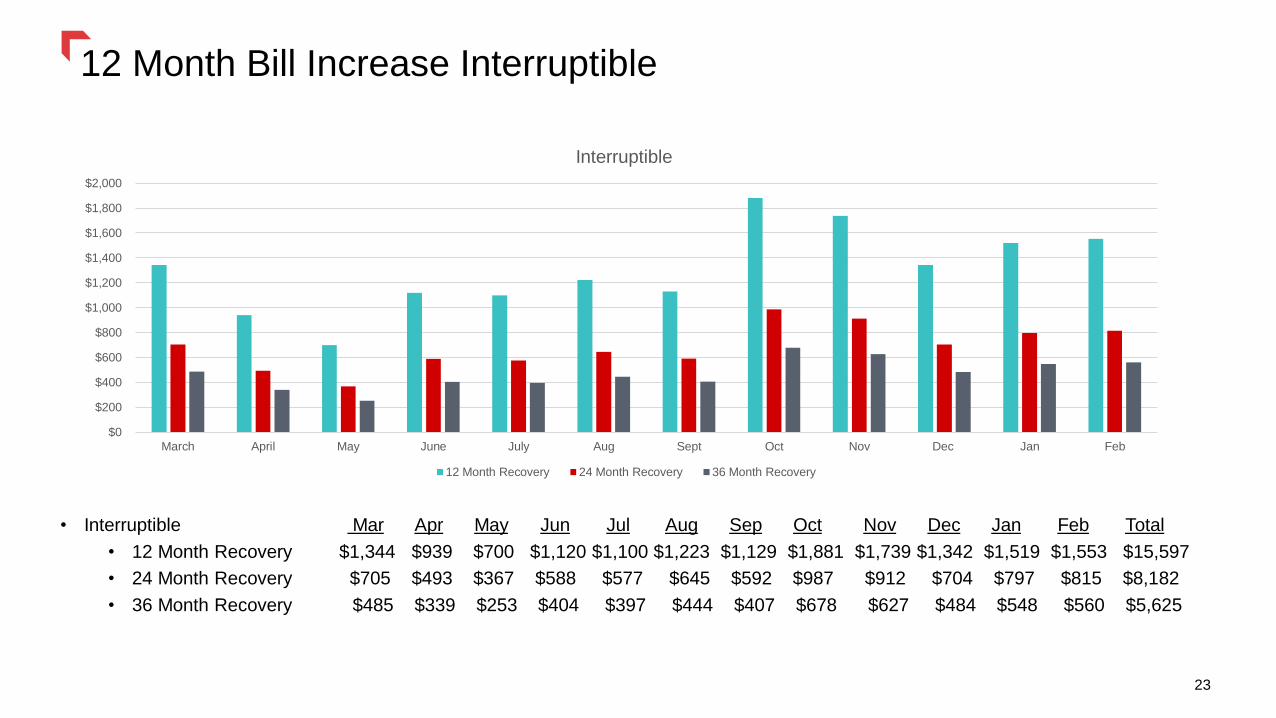
12 Month Bill Increase Interruptible
$0
$200
$400
$600
$800
$1,000
$1,200
$1,400
$1,600
$1,800
$2,000
March April May June July Aug Sept Oct Nov Dec Jan Feb
Interruptible
12 Month Recovery 24 Month Recovery 36 Month Recovery
• Interruptible Mar Apr May Jun Jul Aug Sep Oct Nov Dec Jan Feb Total
• 12 Month Recovery $1,344 $939 $700 $1,120 $1,100 $1,223 $1,129 $1,881 $1,739 $1,342 $1,519 $1,553 $15,597
• 24 Month Recovery $705 $493 $367 $588 $577 $645 $592 $987 $912 $704 $797 $815 $8,182
• 36 Month Recovery $485 $339 $253 $404 $397 $444 $407 $678 $627 $484 $548 $560 $5,625
24
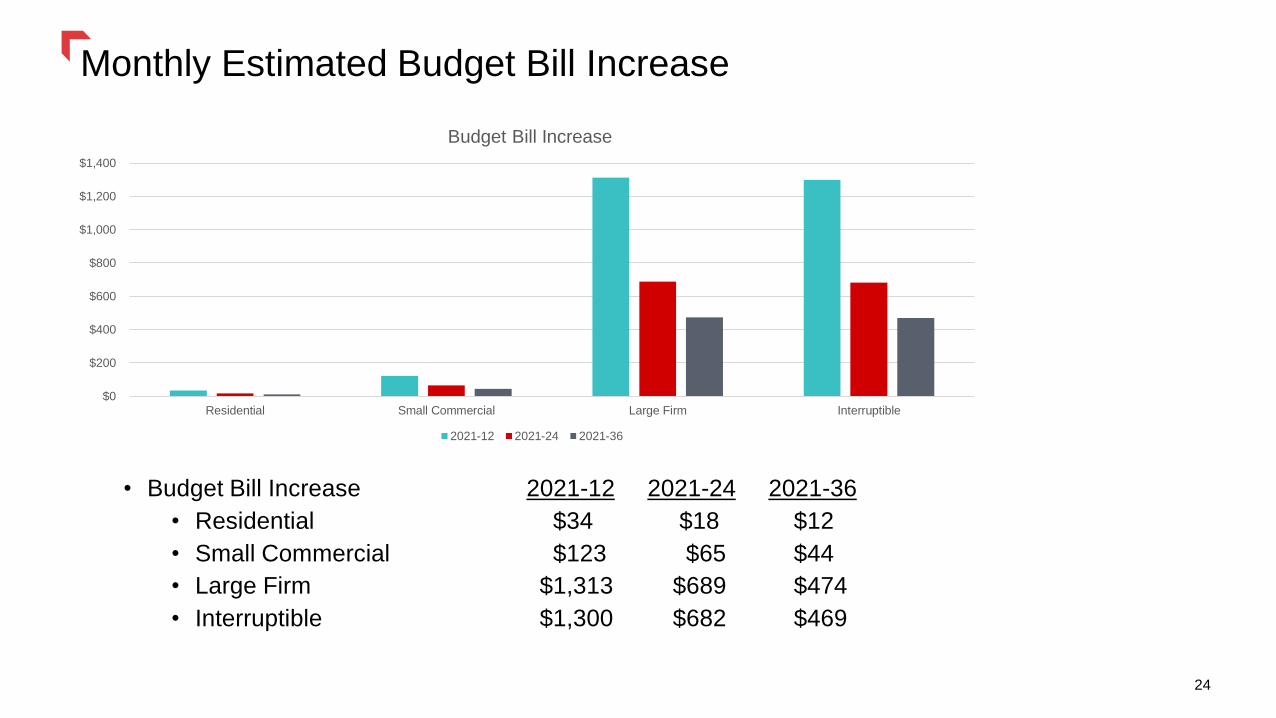
Monthly Estimated Budget Bill Increase
• Budget Bill Increase 2021-12 2021-24 2021-36
• Residential $34 $18 $12
• Small Commercial $123 $65 $44
• Large Firm $1,313 $689 $474
• Interruptible $1,300 $682 $469
$0
$200
$400
$600
$800
$1,000
$1,200
$1,400
Residential Small Commercial Large Firm Interruptible
Budget Bill Increase
2021-12 2021-24 2021-36

25
Questions?Questions?