Feb14-GOI & MOP & CEA Report
44
Government Of India Executive Summary Power Sector February-2014 Ministry of Power Central Electricity Authority New Delhi
-
Upload
yugandhara-chakravarthy-kancherla -
Category
Documents
-
view
16 -
download
5
description
A complete report on the Indian Power Sector
Transcript of Feb14-GOI & MOP & CEA Report

Government Of India
Executive Summary
Power Sector
February-2014
Ministry of Power
Central Electricity Authority
New Delhi

SN Section A - Highlights of Power Sector Page
1 Electricity Generation for February, 2014 & during April '13 to Feb.2014 1
2 Generating Capacity Addition for February, 2014 & during April '13 to Feb.2014 2
3 List of Projects Commissioned in February 2014 3
4 All India Installed Capacity (MW) Region-wise 3
5 All India Installed Capacity (MW) Sector-wise 4
6 Transmission Lines Added during Feb. 2014 and April '13 to Feb.'14 5
7 Transformation Capacity Addition During Feb. 2014 and April '13 to Feb.'14 6
8 Power Supply Position (Demand & Availabilty) in February 2014 7
9 Peak Shortage of Power Supply (MW) in Different Regions 8-9
10 All India PLF Sector-wise for Feb.'14 and for the last One Year 10
11 T & D and AT & C Losses (%)
12 All India Village Electrification & Pumpsets Energisation
13 Average cost of Power & Average Realisation
14 All India per Capita Consumption of Electricity KWh
15 All India Coal consumption for Power Generation
1 Capacity Addition Targets and Achievements in 12th Plan 12
2 Capacity Addition Targets & Achievements in 2013-2014 13-14
3 Capacity Addition Targets & Achievements during Feb.2014 and April 2013 to Feb. 2014 15
4 Capacity Addition Targets / Achievements during the month of February 2014 15
5 Installed Capacity in various Regions including their shares. 16-21
1 Programme and Achievements in Feb. 2014 and during April 2013 to Feb. 2014
2 List of Transmission lines commissioned in Feb.2014
1 Programme and Achievements in Feb. 2013 and during April 2013 to Feb. 2014
2 List of Sub Stations commissioned in Feb. 2014
1 Electricity Generation Targets and Achievements for 2013-14 24
1 Power Supply Position (Provisional) forFeb '14 and for April '13 to Feb'14 25
2 Peak Demand and Peak Met (Provisional) for Feb, '14and for April '13 to Feb '14 26
3 Power Supply Position (Revised) for January, 2014 and for April '13 to Feb '14 27
4 Peak Demand and Peak Met (Revised) for January, 2014 and for April '13 to Feb '14 28
5 Notified Power cuts / Restrictions on Industries during Feb. 2014 29
6 Power Supply to Agricultural Sector during Feb. 2014 30
1 Growth of Installed Capacity since 6th Plan 31
2 Growth of Transmission Sector since 6th Plan 32
3 All India Yearly Coal consumption for Power Generation (Utilities)
4 All India Annual Per Capita Consumption of Electricity since 2005-06
5 Average cost of power supply & Average realisation (Paisa/kwh)
6 Growth of Rural Electrification & Pump Sets Energisation
7 Status of Hydro Schemes Cleared by the CEA during April '13 to Feb '1434
11
22
23
33
Executive Summary for the Month of February- 2014
Section G - Growth of Power Sector
Section C - Transmission Lines
Section B - Capacity Addition
Section F - Power supply position
Section E - Electricity Generation
Section D - Sub Stations
Contents

SN Contents Page
1 Electricity Generation for February 2014 & during April '13 to Feb.2014
2 Generating Capacity Addition for February.2014 & during April '13 to Feb.2014 2
3 List of Projects Commissioned in February. 2014 3
4 All India Installed Capacity (MW) Region-wise 3
5 All India Installed Capacity (MW) Sector-wise 4
6 Transmission Lines Added during Feb '14 and April '13 to Feb.'14 5
7 Transformation Capacity Addition During Feb '14 and April '13 to Feb.'14 6
8 Power Supply Position (Demand & Availabilty) in February. 2014 7
9 Peak Shortage of Power Supply (MW) in Different Regions 8-9
10 All India PLF Sector-wise for Feb '14 and for the last One Year 10
11 T & D and AT & C Losses (%)
12 All India Village Electrification & Pumpsets Energisation
13 Average cost of Power & Average Realisation
14 All India per Capita Consumption of Electricity KWh
15 All India Coal consumption for Power Generation
Section A - Highlights of Power Sector
11
Achievement
Feb.2014
Thermal 65.594 9.05
Hydro 7.394 25.98
Nuclear 2.907 7.67
Bhutan Import 0.053 32.83
All India 75.948 10.45
Type Apr '12 - Feb '13 Apr '13 - Feb '14
Thermal
Hydro
Nuclear
Bhutan Import
All India
0
1
All India Electricity Generation during April '13 to February 2014
1. Electricity Generation for Feb' 2014 (BU)
All India Electricity Generation for February 2014
TypeAchievement
Feb.2013
60.152
5.869
0.0399
2.7 2.812
0.125
77.437
Electricity Generation during April to February 2014 (BU)
68.761
Targets
Feb. 2014
67.634
6.866
881.786
691.874
104.948
30.164
4.737
831.723
719.3997
125.654
31.163
5.569 17.56
6.02
% Change
% Change
w.r.t. 2013
3.98
19.73
3.31
75.948
68.761
64.000
66.000
68.000
70.000
72.000
74.000
76.000
78.000
BU
Feb '13 Feb '14
831.723
881.786
800.000
810.000
820.000
830.000
840.000
850.000
860.000
870.000
880.000
890.000
BU
Apr '12 to Feb'13 Apr '13 to Feb '14

Achievement Targets Achievement
Feb.2013 Feb.2014 Feb. 2014
Thermal 2085 0 2391 15
Hydro 33 198.67 320 870
Nuclear 0 0 0 NA
All India 2118 198.67 2711 28
Apr.'12-Feb.'13 Apr.'13-Feb.'14 % Change
Thermal 13135.8 11817 -10.04
Hydro 459 722 57.30
Nuclear 0 0 NA
All India 13594.8 12539 -7.77
2
2. Generating Capacity Addition for February 2014 (MW)
Generating Capacity Addition during April '13 to February 2014 (MW)
% Change
w.r.t. 2013Type
*Above figs does not include DGEN mega CCPP Module -1(400MW) commissioned in Junuary 2014
& information recived late
2118
2711
0
500
1000
1500
2000
2500
3000
1Feb.'13 Feb.'14
12539
13594.8
12000
12200
12400
12600
12800
13000
13200
13400
13600
13800
1Apr '12 to Feb. 13 Apr '13 to Feb '14

3. List of Projects Commissioned during February 2014
(i) Thermal
Pipava CCPP , BIK-1 (351 MW) in Gujrat commissioned on 05-02-2014 by M/S GSPC Co. Ltd.
Nashik TPP, Ph-1, U#1, (270MW) Maharastra commissioned on 25/02/14by M/s Indiabulls Realtech Ltd.
Simhapuri EnergyLtd, U#3, (150MW) A.P. commissioned on 21/02/14by M/s Simhapuri Energy Ltd.
Amravati TPP, Ph-1, U#2, (270MW) Maharastra commissioned on 17/02/14 by M/s Indiabulls Power Ltd.
DB Power TPP, U#1, (600MW) Chhattigarh commissioned on23/02/14 by M/s DB Power Ltd.
Vallur TPP,Ph-1, U#3, (500MW) in TN commissioned on28/02/14 by M/s NTEC Ltd.
Pragti St-III ,CCGT/ST-2/, (250MW) Delhi commissioned on26/02/14 by M/s PPCL
(ii) Hydro
Uri -II ,HEP,U#4, (60MW) in J&K commissioned on 02/02/14
Prabati -III ,HEP,U#1&2 (260MW) in HP commissioned on 18/02/14 & 27/02/14
(iii) Nuclear
Nill
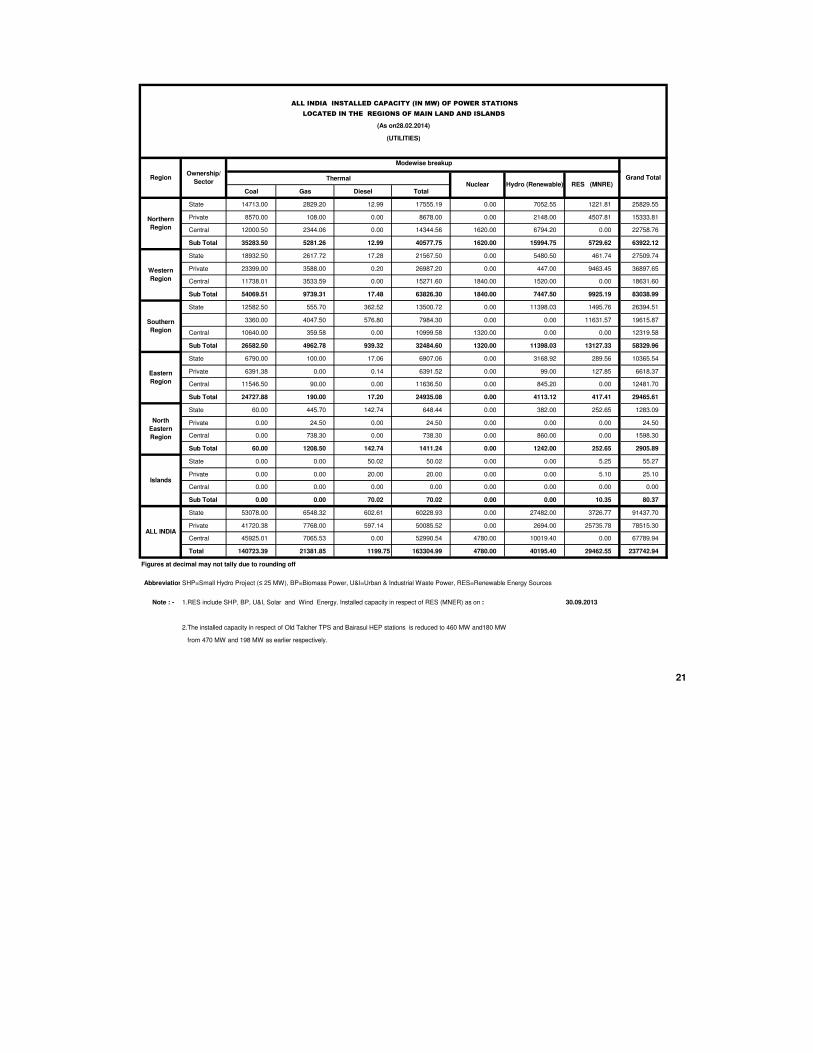
4. All India Installed Capacity (MW) as on 28-2-2014 Region -wise
Region THERMAL Nuclear Hydro RES Grand Total
Coal Gas Diesel Total
Northern 35283.50 5281.26 12.99 40577.75 1620.00 15994.75 5729.62 63922.12
Western 54069.51 9739.31 17.48 63826.30 1840.00 7447.50 9925.19 83038.99
Southern 26582.50 4962.78 939.32 32484.60 1320.00 11398.03 13127.33 58329.96
Eastern 24727.88 190.00 17.20 24935.08 0.00 4113.12 417.41 29465.61
North-East 60.00 1208.50 142.74 1411.24 0.00 1242.00 252.65 2905.89
Islands 0.00 0.00 70.02 70.02 0.00 0.00 10.35 80.37
ALL INDIA 140723.39 21381.85 1199.75 163304.99 4780.00 40195.40 29462.55 237742.94
Note: Captive Genaration is not included in the total figs
3
Thermal Nuclear Hydro RES Total Captive
163304.99 4780 40195.4 29462.6 237742.94 39375.36
Total 237742.94 MW
163304.99
4780
40195.429462.55
237742.94
39375.36
0.00
50000.00
100000.00
150000.00
200000.00
250000.00
Thermal Nuclear Hydro RES Total Captive
Thermal Nuclear Hydro RES Total Captive

Sector THERMAL Nuclear Hydro RES
Coal Gas Diesel Total
Central 45925.01 7065.53 0.00 52990.54 4780.00 10019.40 0.00 67789.94
State 53078.00 6548.32 602.61 60228.93 0.00 27482.00 3726.77 91437.70
Private 41720.38 7768.00 597.14 50085.52 0.00 2694.00 25735.78 78515.30
All India 140723.39 21381.85 1199.75 163304.99 4780.00 40195.40 29462.55 237742.94
Central 67789.94
State 91437.70
Private 78515.30
4
Grand Total
5. All India Installed Capacity (MW) as on 28-2-2014 (Sector-wise)
All India Installed Capacity(MW) as on 28-2-2014(Sector-Wise)
67789.94, 29%
91437.70, 38%
78515.30, 33%
Central
State
Private
Voltage Level
+/- 500 KV HVDC
765 KV
400 KV
220 KV
All India
Voltage Level
+/- 500 KV HVDC
765 KV
400 KV
220 KV
All India
5
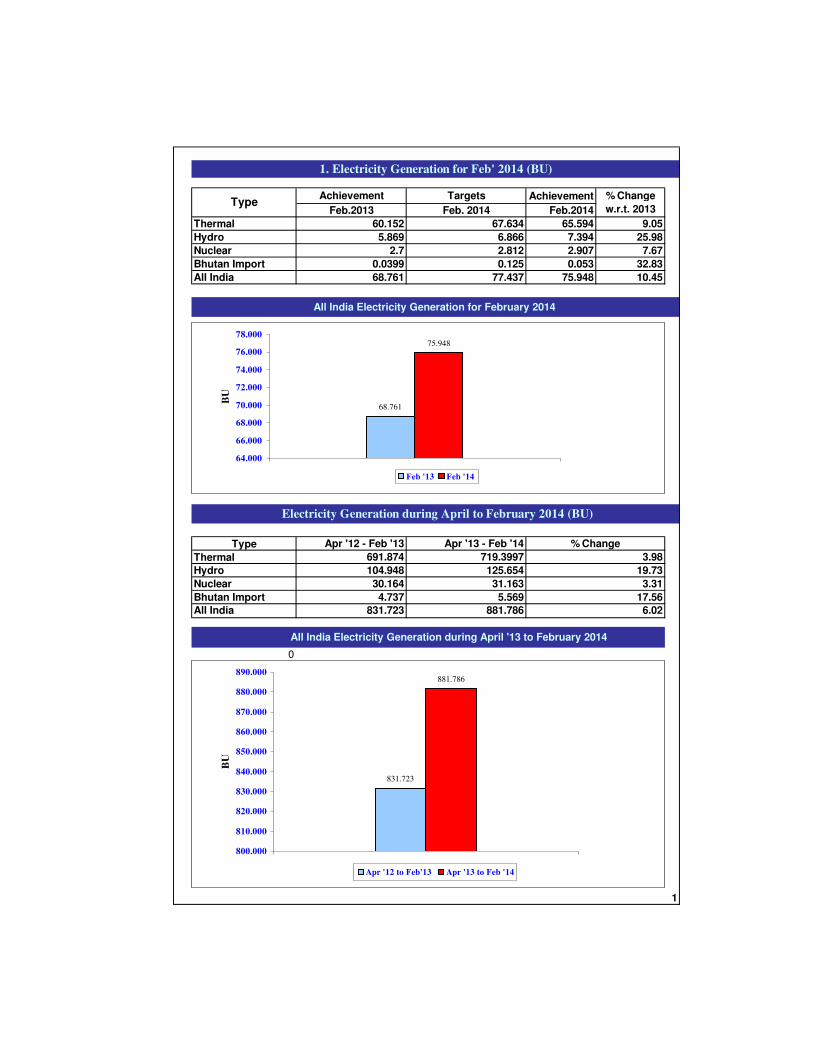
6. Transmission Lines Added during February 2014 (ckms)
Transmission Lines Added during April to February 2014 (ckms)
Feb. 2013
0
698
247
Feb. 2014
0
0
1055
8908
173
1228
April'13- Feb.'14
0
1209
3821
229
1174
13938
0
Apr.'12- Feb.'13
3782
6451
3387
13620
1362013938
0
2000
4000
6000
8000
10000
12000
14000
16000
ckm
s
Apr '12 to Feb '13 Aprl '13 toFeb '14
12281174
0
200
400
600
800
1000
1200
1400
1
ckm
Feb-13 Feb-14

7. Transformation Capacity Addition during February 2014 (MVA)
Voltage Level
+/- 500 KV HVDC
765 KV
400 KV
220 KV
All India
Voltage Level
+/- 500 KV HVDC
765 KV
400 KV
220 KV
All India
6
7850
0
0
1205
890
1250
Feb'13 Feb'14
Apr.'12-Feb.'13 Apr.'13 - Feb.'14
2095
0
6000
1130
720
All India Transformation Capacity Addition during April 2013 to February 2014
45645
0
29500
6725
9420
52030
20000
13390
17390
Transformation Capacity Addition during February 2014
2095
7850
0
2000
4000
6000
8000
10000
MV
A
Feb. '13 Feb. '14
45645
52030
0
10000
20000
30000
40000
50000
60000
1
MV
A
Apr '12 to Feb '13 Apr '13 to Feb '14
Feb'13 Feb'14 Feb'13 Feb'14 Feb'13 Feb'14
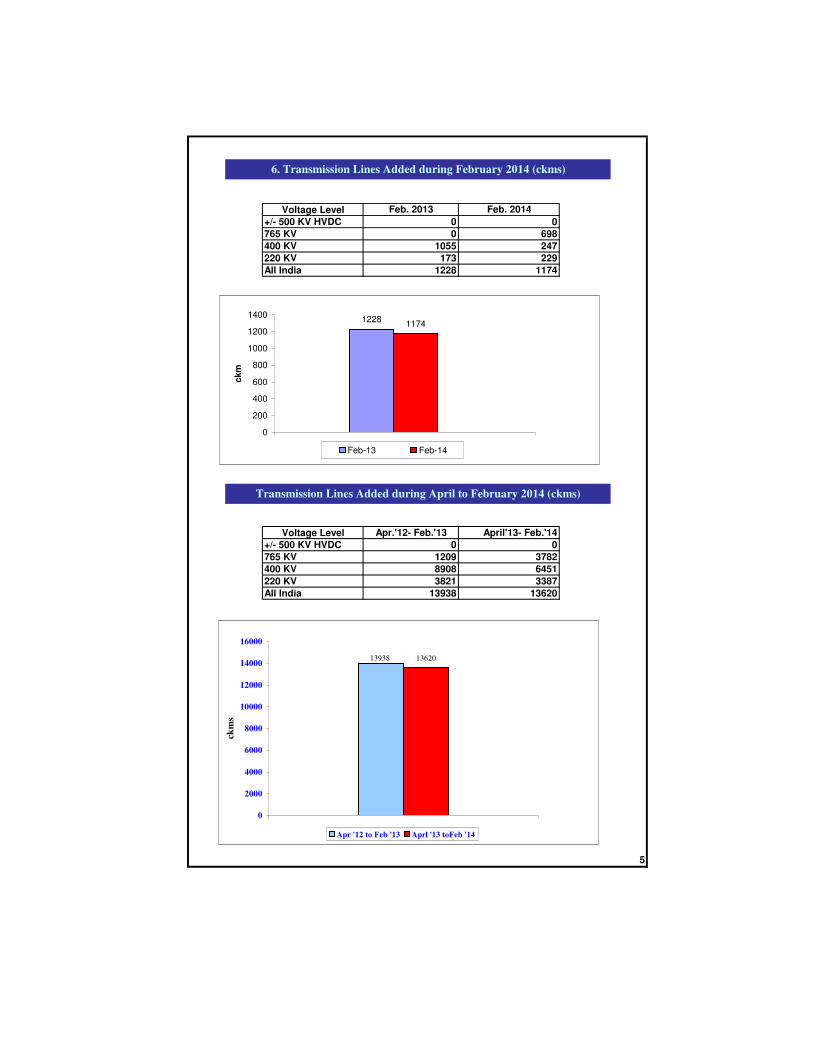
Northern 19967 22396 18368 21168 -8.0 -5.5
Western 21456 23147 21046 22871 -1.9 -1.2
Southern 22544 22960 18823 21623 -16.5 -5.8
Eastern 8133 8763 7756 8672 -4.6 -1.0
North Eastern 877 947 818 883 -6.7 -6.8
All India 72977 78213 66811 75217 -8.4 -3.8
Feb'13 Feb'14 Feb'13 Feb'14 Feb'13 Feb'14
Northern 36923 37895 33494 36780 -9.3 -2.9
Western 37343 41184 36382 40331 -2.6 -2.1
Southern 35901 36427 31189 34544 -13.1 -5.2
Eastern 14338 14976 13585 14499 -5.3 -3.2
North Eastern 1934 2025 1845 1929 -4.6 -4.7
All India 126439 132507 116495 128083 -7.9 -3.3
7
Deficit (%)RegionPower (MW)
PEAK Demand
8. Power Supply Position (Demand & Availability) in February 2014
Peak Demand / Peak Met in February 2014
Peak Met
Demand Availability
Energy (MU)Region Deficit (%)
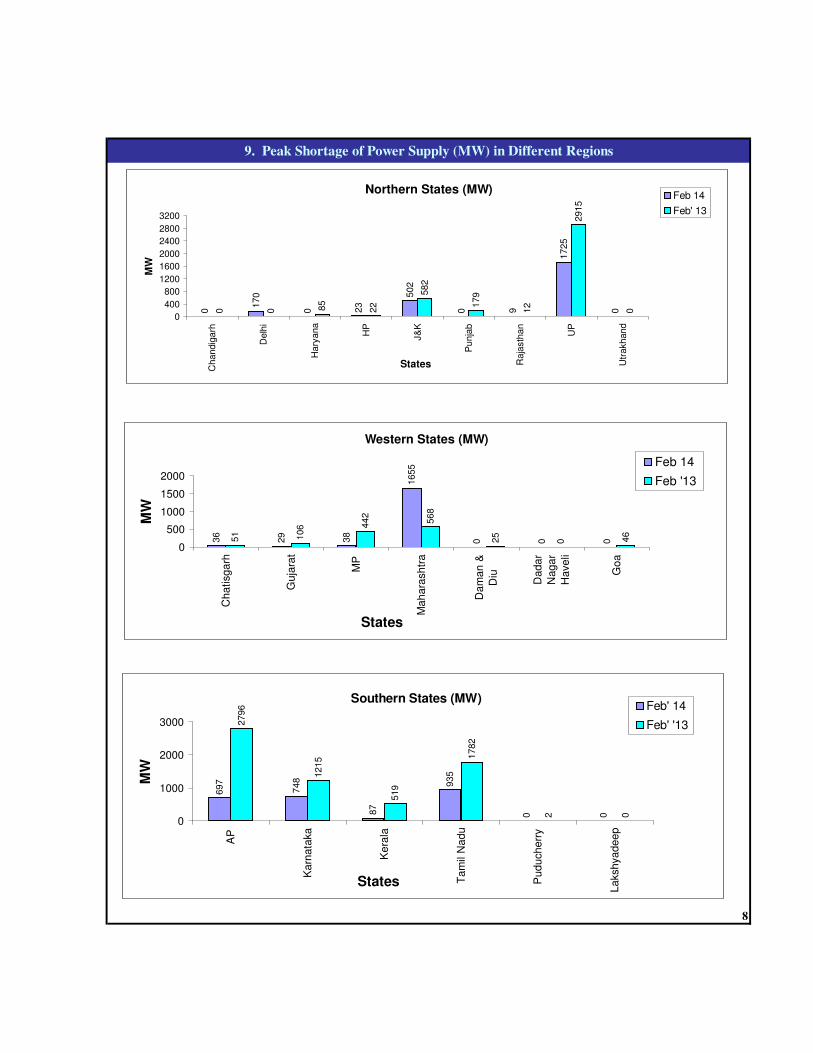
Chandigarh Delhi Haryana HP J&K Punjab Rajasthan UP Utrakhand
Feb 13 0 0 85 22 582 179 12 2915 0
Feb' 14 0 170 0 23 502 0 9 1725 0
Chatisgarh Gujarat MP MaharashtraDaman & DiuDadar Nagar Haveli Goa
Feb 13 51 106 442 568 25 0 46Feb'14 36 29 38 1655 0 0 0
AP Karnataka Kerala Tamil Nadu Puducherry Lakshyadeep
Feb 13 2796 1215 519 1782 2 0
Feb 14 697 748 87 935 0 0
8
9. Peak Shortage of Power Supply (MW) in Different Regions
Northern States (MW)0
170
0 23
502
0 9
1725
00 0 85
22
582
179
12
2915
0
0
400
800
1200
1600
2000
2400
2800
3200C
handig
arh
Delh
i
Hary
ana
HP
J&
K
Punja
b
Raja
sth
an
UP
Utr
akhand
States
MW
Feb 14
Feb' 13
Western States (MW)
36
29
38
1655
0 0 051 106 4
42
568
25
0 46
0
500
1000
1500
2000
Ch
atisg
arh
Gu
jara
t
MP
Ma
ha
rash
tra
Da
ma
n &
Diu
Da
da
r
Na
ga
r
Ha
ve
li
Go
aStates
MW
Feb 14
Feb '13
Southern States (MW)
697
748
87
935
0 0
2796
1215
519
1782
2 0
0
1000
2000
3000
AP
Ka
rna
taka
Ke
rala
Ta
mil
Na
du
Pu
du
ch
err
y
La
ksh
ya
de
ep
States
MW
Feb' 14
Feb' '13
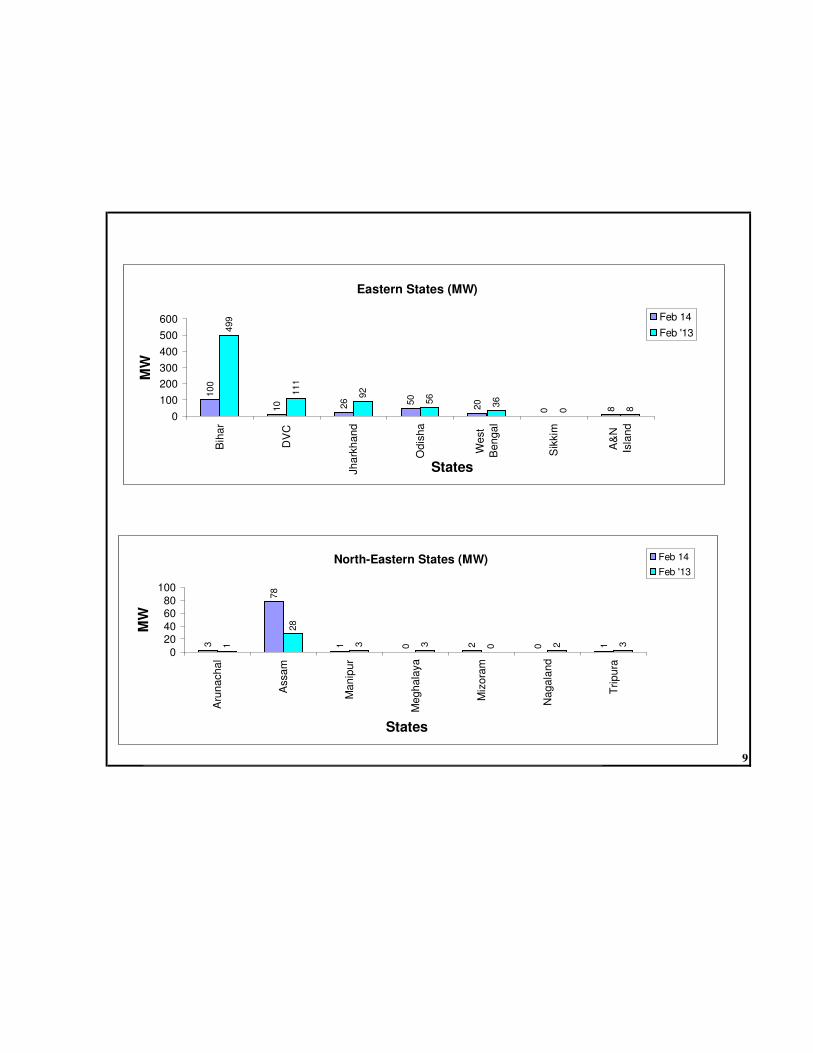
Bihar DVC Jharkhand Odisha West Bengal Sikkim A&N Island
Feb 13 499 111 92 56 36 0 8
Feb 14 100 10 26 50 20 0 8
Arunachal Assam Manipur Meghalaya Mizoram Nagaland Tripura
Feb '13 1 28 3 3 0 2 3
Feb '14 3 78 1 0 2 0 1
9
Eastern States (MW)
100
10 26 50
20
0 8
499
111
92
56
36
0 8
0
100
200
300
400
500
600
Bih
ar
DV
C
Jh
ark
ha
nd
Od
ish
a
We
st
Be
ng
al
Sik
kim
A&
N
Isla
nd
States
MW
Feb 14
Feb '13
North-Eastern States (MW)
3
78
1 0 2 0 11
28
3 3 0 2 3
0
2040
6080
100
Aru
na
ch
al
Assa
m
Ma
nip
ur
Me
gh
ala
ya
Miz
ora
m
Na
ga
lan
d
Tri
pu
ra
States
MW
Feb 14
Feb '13

Sector Feb'13 Feb'14
Central 82.42 83.16
State 66.41 61.66
Private 63.61 61.73
ALL INDIA 71.12 68.44
Month 2012-13 2013-14
April 75.24 69.97
May 74.45 71.55
June 72.24 63.4
July 66.96 60.86
August 61.58 55.94
September 61.41 64.65
October 71.04 61.85
November 71.02 65.44
December 72.41 69.05
February 74.33 69.82
February 70.67 68.44
March 71.99
* For Coal and Lignite based Power Plants 10
%PLF
All India PLF Month-wise
10. All India Plant Load Factor* Sector-wise for February '13 and February '14
Sector-Wise Plant Load Factor for February 2013 and 20148
2.4
2
66
.41
63
.61
71
.12
83
.16
61
.66
61
.73
68
.44
0
50
100
Central State Private ALL INDIA
% P
LF
Feb'13 Feb'14
All India PLF Month-wise
75
.24
74
.45
72
.24
66
.96
61
.58
61
.41
71
.04
71
.02
72
.41
74
.33
70
.67
71
.99
69
.97
71
.55
63
.4
60
.86
55
.94
64
.65
61
.85
65
.44
69
.05
69
.82
68
.44
0
20
40
60
80
Apri
l
May
June
July
August
Septe
mber
Octo
ber
Novem
ber
Decem
ber
Febru
ary
Febru
ary
Marc
h
2012-13 2013-14
2010-11 2011-12
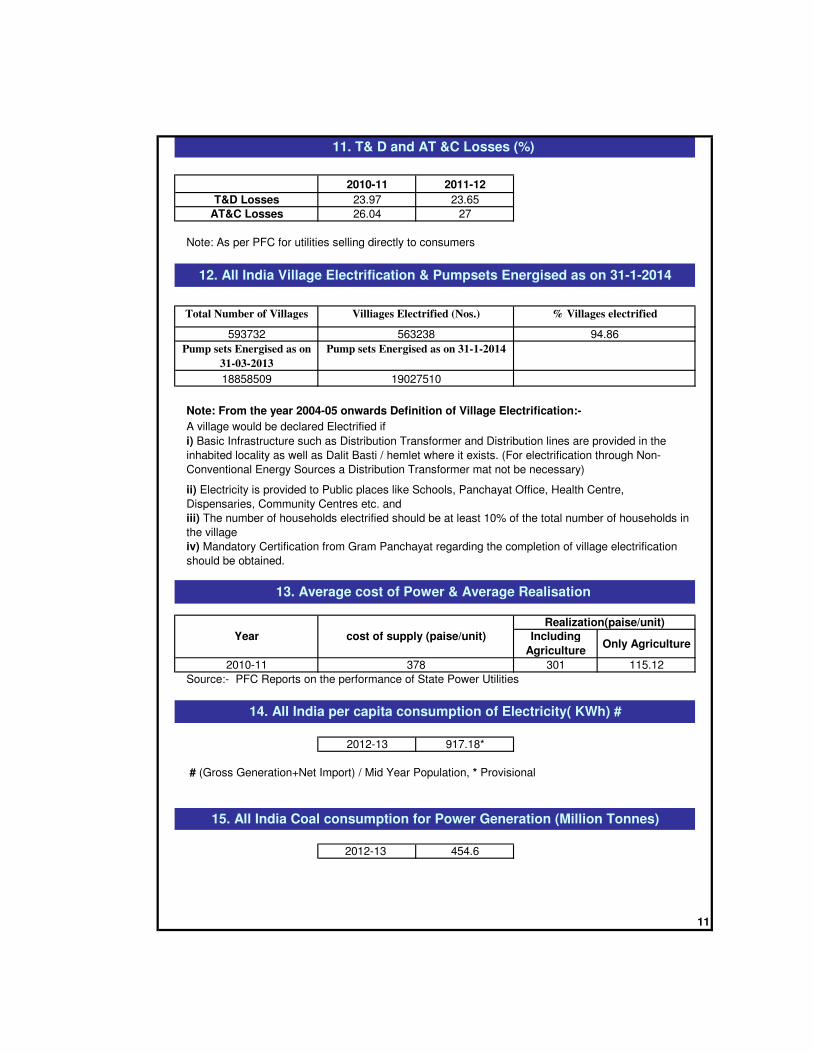
T&D Losses 23.97 23.65
AT&C Losses 26.04 27
Note: As per PFC for utilities selling directly to consumers
Total Number of Villages
593732
Pump sets Energised as on
31-03-2013
18858509
Note: From the year 2004-05 onwards Definition of Village Electrification:-
A village would be declared Electrified if
Including
AgricultureOnly Agriculture
2010-11 301 115.12
Source:- PFC Reports on the performance of State Power Utilities
2012-13 917.18*
# (Gross Generation+Net Import) / Mid Year Population, * Provisional
2012-13 454.6
11
11. T& D and AT &C Losses (%)
13. Average cost of Power & Average Realisation
iv) Mandatory Certification from Gram Panchayat regarding the completion of village electrification
should be obtained.
19027510
12. All India Village Electrification & Pumpsets Energised as on 31-1-2014
563238 94.86
% Villages electrifiedVilliages Electrified (Nos.)
Pump sets Energised as on 31-1-2014
378
Year
iii) The number of households electrified should be at least 10% of the total number of households in
the village
15. All India Coal consumption for Power Generation (Million Tonnes)
14. All India per capita consumption of Electricity( KWh) #
Realization(paise/unit)
cost of supply (paise/unit)
i) Basic Infrastructure such as Distribution Transformer and Distribution lines are provided in the
inhabited locality as well as Dalit Basti / hemlet where it exists. (For electrification through Non-
Conventional Energy Sources a Distribution Transformer mat not be necessary)
ii) Electricity is provided to Public places like Schools, Panchayat Office, Health Centre,
Dispensaries, Community Centres etc. and
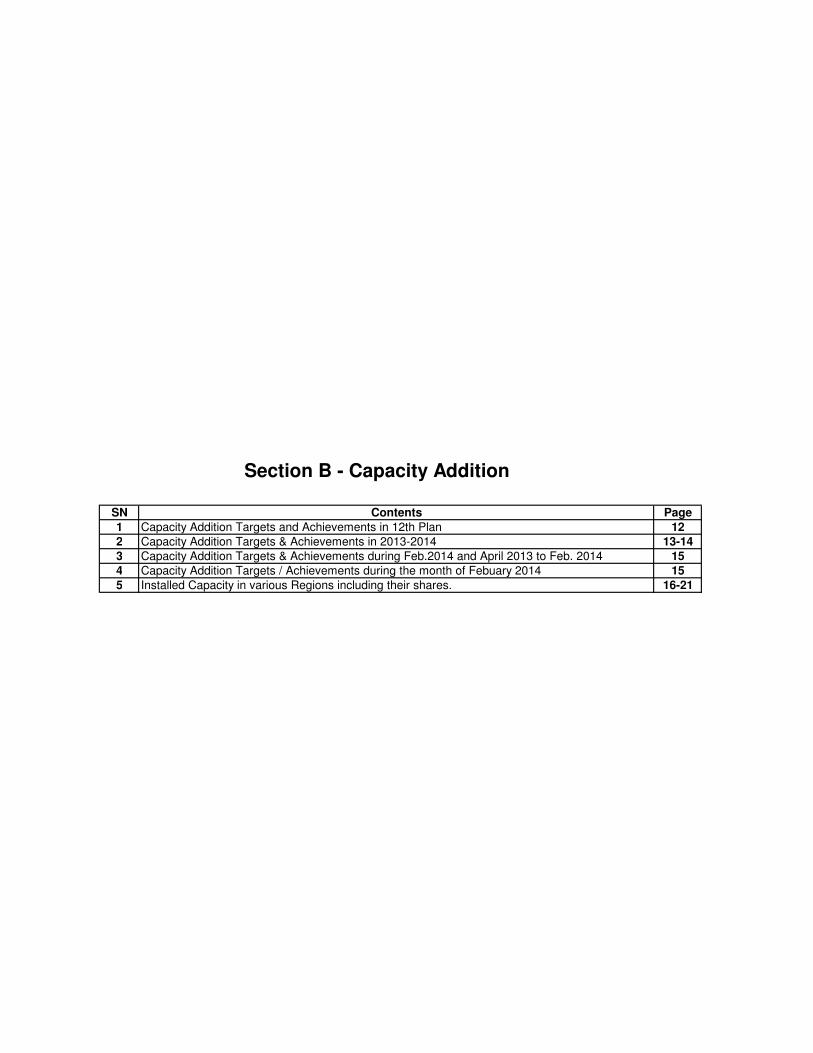
SN Contents Page
1 Capacity Addition Targets and Achievements in 12th Plan 12
2 Capacity Addition Targets & Achievements in 2013-2014 13-14
3 Capacity Addition Targets & Achievements during Feb.2014 and April 2013 to Feb. 2014 15
4 Capacity Addition Targets / Achievements during the month of Febuary 2014 15
5 Installed Capacity in various Regions including their shares. 16-21
Section B - Capacity Addition
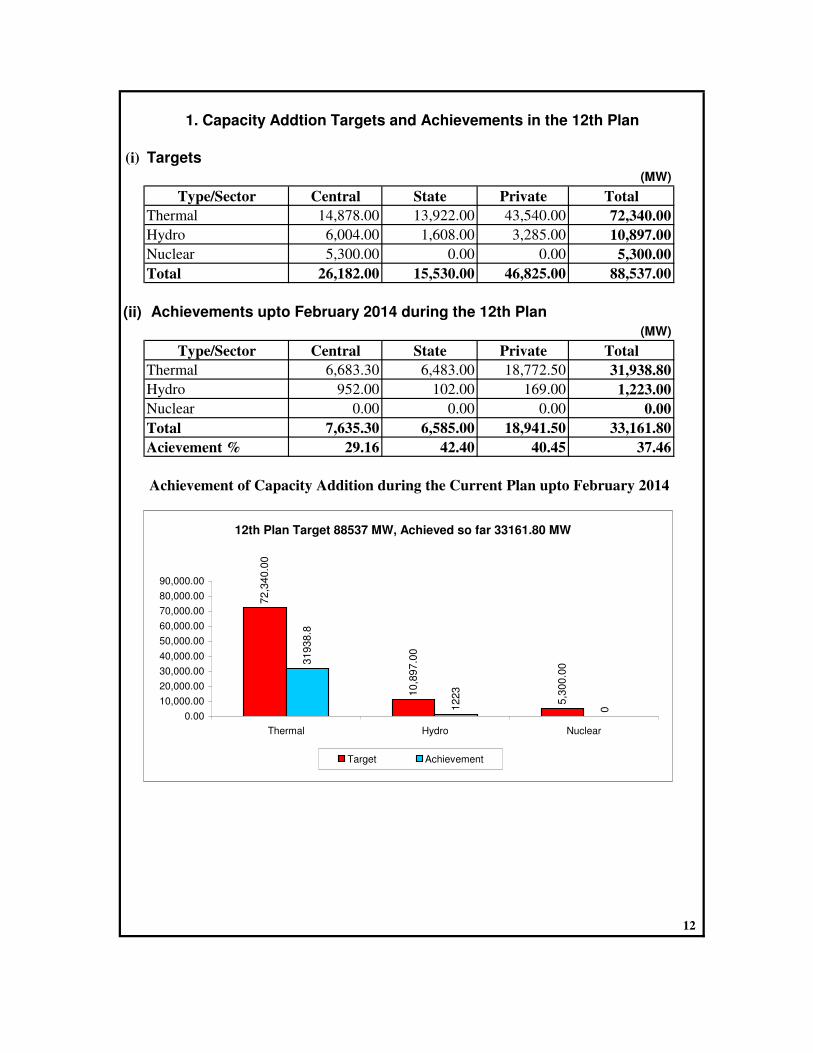
(i) Targets
(MW)
Type/Sector Central State Private Total
Thermal 14,878.00 13,922.00 43,540.00 72,340.00
Hydro 6,004.00 1,608.00 3,285.00 10,897.00
Nuclear 5,300.00 0.00 0.00 5,300.00
Total 26,182.00 15,530.00 46,825.00 88,537.00
(ii) Achievements upto February 2014 during the 12th Plan
(MW)
Type/Sector Central State Private Total
Thermal 6,683.30 6,483.00 18,772.50 31,938.80
Hydro 952.00 102.00 169.00 1,223.00
Nuclear 0.00 0.00 0.00 0.00
Total 7,635.30 6,585.00 18,941.50 33,161.80
Acievement % 29.16 42.40 40.45 37.46
1. Capacity Addtion Targets and Achievements in the 12th Plan
Achievement of Capacity Addition during the Current Plan upto February 2014
12
12th Plan Target 88537 MW, Achieved so far 33161.80 MW
72,3
40.0
0
10,8
97.0
0
5,3
00.0
031938.8
1223
0
0.00
10,000.00
20,000.00
30,000.00
40,000.00
50,000.00
60,000.00
70,000.00
80,000.00
90,000.00
Thermal Hydro Nuclear
Target Achievement
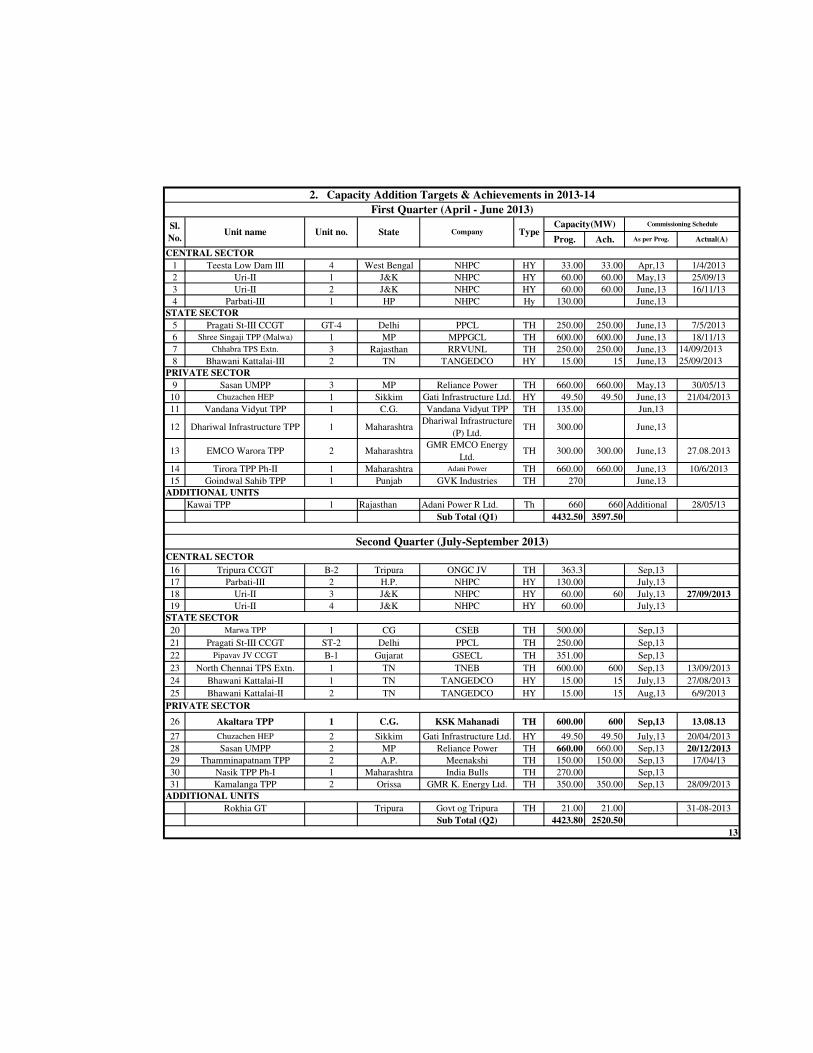
1 Teesta Low Dam III 4 West Bengal NHPC HY 33.00 33.00 Apr,13 1/4/2013
2 Uri-II 1 J&K NHPC HY 60.00 60.00 May,13 25/09/13
3 Uri-II 2 J&K NHPC HY 60.00 60.00 June,13 16/11/13
4 Parbati-III 1 HP NHPC Hy 130.00 June,13
5 Pragati St-III CCGT GT-4 Delhi PPCL TH 250.00 250.00 June,13 7/5/2013
6 Shree Singaji TPP (Malwa) 1 MP MPPGCL TH 600.00 600.00 June,13 18/11/13
7 Chhabra TPS Extn. 3 Rajasthan RRVUNL TH 250.00 250.00 June,13 14/09/2013
8 Bhawani Kattalai-III 2 TN TANGEDCO HY 15.00 15 June,13 25/09/2013
9 Sasan UMPP 3 MP Reliance Power TH 660.00 660.00 May,13 30/05/13
10 Chuzachen HEP 1 Sikkim Gati Infrastructure Ltd. HY 49.50 49.50 June,13 21/04/2013
11 Vandana Vidyut TPP 1 C.G. Vandana Vidyut TPP TH 135.00 Jun,13
12 Dhariwal Infrastructure TPP 1 MaharashtraDhariwal Infrastructure
(P) Ltd.TH 300.00 June,13
13 EMCO Warora TPP 2 MaharashtraGMR EMCO Energy
Ltd.TH 300.00 300.00 June,13 27.08.2013
14 Tirora TPP Ph-II 1 Maharashtra Adani Power TH 660.00 660.00 June,13 10/6/2013
15 Goindwal Sahib TPP 1 Punjab GVK Industries TH 270 June,13
Kawai TPP 1 Rajasthan Adani Power R Ltd. Th 660 660 Additional 28/05/13
Sub Total (Q1) 4432.50 3597.50
CENTRAL SECTOR
16 Tripura CCGT B-2 Tripura ONGC JV TH 363.3 Sep,13
17 Parbati-III 2 H.P. NHPC HY 130.00 July,13
18 Uri-II 3 J&K NHPC HY 60.00 60 July,13 27/09/2013
19 Uri-II 4 J&K NHPC HY 60.00 July,13
20 Marwa TPP 1 CG CSEB TH 500.00 Sep,13
21 Pragati St-III CCGT ST-2 Delhi PPCL TH 250.00 Sep,13
22 Pipavav JV CCGT B-1 Gujarat GSECL TH 351.00 Sep,13
23 North Chennai TPS Extn. 1 TN TNEB TH 600.00 600 Sep,13 13/09/2013
24 Bhawani Kattalai-II 1 TN TANGEDCO HY 15.00 15 July,13 27/08/2013
25 Bhawani Kattalai-II 2 TN TANGEDCO HY 15.00 15 Aug,13 6/9/2013
26 Akaltara TPP 1 C.G. KSK Mahanadi TH 600.00 600 Sep,13 13.08.13
27 Chuzachen HEP 2 Sikkim Gati Infrastructure Ltd. HY 49.50 49.50 July,13 20/04/2013
28 Sasan UMPP 2 MP Reliance Power TH 660.00 660.00 Sep,13 20/12/2013
29 Thamminapatnam TPP 2 A.P. Meenakshi TH 150.00 150.00 Sep,13 17/04/13
30 Nasik TPP Ph-I 1 Maharashtra India Bulls TH 270.00 Sep,13
31 Kamalanga TPP 2 Orissa GMR K. Energy Ltd. TH 350.00 350.00 Sep,13 28/09/2013
Rokhia GT Tripura Govt og Tripura TH 21.00 21.00 31-08-2013
Sub Total (Q2) 4423.80 2520.50
13
2. Capacity Addition Targets & Achievements in 2013-14
First Quarter (April - June 2013)
As per Prog. Actual(A)
Commissioning ScheduleCapacity(MW)
Ach.Prog.State Company Type
PRIVATE SECTOR
STATE SECTOR
Second Quarter (July-September 2013)
ADDITIONAL UNITS
Unit no.Unit nameSl.
No.
CENTRAL SECTOR
ADDITIONAL UNITS
STATE SECTOR
PRIVATE SECTOR

Third Quarter (October - January 2014)
32 Barh STPP St-II 4 Bihar NTPC TH 660.00 660 Dec,13 30/11/13
33 Rihand STPP St-III 6 UP NTPC TH 500.00 500.00 Dec,13 07.10.2013
34 Nimoo Bazgo 1 J&K NHPC HY 15.00 15 Dec, 13 2/11/2013
35 Nimoo Bazgo 2 J&K NHPC HY 15.00 15.00 Nov,13
36 Nimoo Bazgo 3 J&K NHPC HY 15.00 15.00 Nov,13
37 Satpura TPS Extn. 11 MP MPPGCL TH 250.00 250 Oct,13 25/12/2013
38 Chandrapur TPS Extn. 8 Maharashtra MAHAGENCO TH 500 Dec,13
39 Kalisindh TPP 1 Rajasthan RRVUNL TH 600.00 Dec,13
40 Ramgarh CCPP ST Rajasthan RRVUNL TH 50 Dec,13
41 Lower Jurala 1 AP APGENCO HY 40 Dec,13
42 Baradhara TPP 1 C.G. DB Power Ltd. TH 600.00 Dec,13
43 Swastik TPP 1 C.G. ACB TH 25 Dec,13
44 Dhariwal Infrastructure TPP 1 MaharashtraDhariwal Infrastructure
(P) Ltd.TH 300.00 300.00 Dec,13 3/11/2013
45 Darang TPP 1 Orrisa Jindal India Th Power TH 600.00 Dec,13
46 Sorang 1 HP Himachal Sorang P Ltd. HY 50.00 Nov,13
47 Sorang 2 HP Himachal Sorang P Ltd. HY 50.00 Dec,13
Sub Total (Q3) 4270.00 1755.00
48 Vallur TPP Ph-I 3 TN NTPC/NTECL/TNEB JV TH 500 500 Mar,14 28.02.2014 (A)
49 Tuticorin TPP 1 TN NLC/TNEB JV TH 500 500 Mar,14 30/12/2013
50 Raghunathpur TPP Ph-I 2 WB DVC TH 600.00 Mar,14
51 Rampur 1 HP SJVNL Ltd HY 68.67 Jan,14
52 Rampur 2 HP SJVNL Ltd HY 68.67 Feb,14
53 Rampur 6 HP SJVNL Ltd HY 68.67 Mar,14
54 Parbati-III 3 HP NHPC Hy 130.00 Feb,14
55 Chhabra TPS Extn. 4 Rajasthan RRVUNL TH 250.00 Jan,14
56 Vizag TPP 1 AP Hinduja TH 520.00 Mar,14
57 Tamnar TPP 1 C.G. Jindal Power TH 600 Mar,14
58 Talwandi Sahib TPP 1 Punjab Sterlite TH 660.00 Jan,14
Sub Total (Q4) 3966.01 1000
17092.31 8873.00
14
PRIVATE SECTOR
CENTRAL SECTOR
STATE SECTOR
Fourth Quarter (January-March 2014)
31-10-2013
State Company TypeSl.
No.Unit name Unit no.
CENTRAL SECTOR
Grand Total ( 2013-14)
Commissioning Schedule
Prog. Ach. As per Prog. Actual(A)
Capacity(MW)
PRIVATE SECTOR
STATE SECTOR

(MW)
Deviation
Target* Achievement Target* Achievement (+) / (-)
Central 3123.3 0 500 613.3 1660 1046.7
State 4451 0 601 3051 2572 -479
Pvt. 7660 0 1290 3755 7585 3830
Total 15234.3 0 2391 7419.3 11817 4397.7
Central 914 198.67 320 740.34 578 -162.34
State 85 0 0 45 45 0
Pvt. 199 0 0 149 99 -50
Total 1198 198.67 320 934.34 722 -212.34
Nuclear Central 2000 0 0 1000 0 -1000
Central 6037.3 198.67 820 2353.64 2238 -115.64
State 4536 0 601 3096 2617 -479
Pvt. 7859 0 1290 3904 7684 3780
Total 18432.3 198.67 2711 9353.64 12539 3185.36
15
3. Capacity Addition Targets / Achievements during April 2013 to February 2014
4. Capacity Addition Targets/Achievements during the Month of February 2014
14-Feb Apr '13-Feb '14Schemes Sector
Target 2013-
14
400 MW thermal under Pvt. Sector was commissioned in January 2014 but reported in February 2014
Thermal
Hydro
All India
Targets and Achievements during April '13 to Feb. '14
7419.3
934.3
4
1000
9353.6
411817
722
0
12539
0
2000
4000
6000
8000
10000
12000
Thermal Hydro Nuclear Total
MW
Target
Achievement
Targets and Achievement during February, 2014
0
198.6
7
0
198.6
7
2391
320
0
2711
0
500
1000
1500
2000
2500
3000
Thermal Hydro Nuclear Total
MW
Target
Achievement

(As on28.02.2014)
Coal Gas Diesel Total
State 135.00 2050.40 0.00 2185.40 0.00 0.00 0.00 2185.40
Private 0.00 108.00 0.00 108.00 0.00 0.00 16.00 124.00
Central 4421.37 207.61 0.00 4628.98 122.08 729.53 0.00 5480.59
Sub-Total 4556.37 2366.01 0.00 6922.38 122.08 729.53 16.00 7789.99
State 3160.00 25.00 3.92 3188.92 0.00 884.51 70.10 4143.53
Private 1720.00 0.00 0.00 1720.00 0.00 0.00 53.10 1773.10
Central 1202.03 535.29 0.00 1737.32 109.16 500.55 0.00 2347.03
Sub-Total 6082.03 560.29 3.92 6646.24 109.16 1385.06 123.20 8263.66
State 0.00 0.00 0.13 0.13 0.00 393.60 625.91 1019.64
Private 0.00 0.00 0.00 0.00 0.00 1748.00 0.00 1748.00
Central 152.02 61.88 0.00 213.90 34.08 849.72 0.00 1097.70
Sub-Total 152.02 61.88 0.13 214.03 34.08 2991.32 625.91 3865.34
State 0.00 175.00 8.94 183.94 0.00 780.00 147.53 1111.47
Private 0.00 0.00 0.00 0.00 0.00 0.00 0.00 0.00
Central 329.32 129.14 0.00 458.46 77.00 908.17 0.00 1443.63
Sub-Total 329.32 304.14 8.94 642.40 77.00 1688.17 147.53 2555.10
State 2630.00 25.00 0.00 2655.00 0.00 2230.23 154.50 5039.73
Private 1200.00 0.00 0.00 1200.00 0.00 0.00 143.08 1343.08
Central 660.88 263.92 0.00 924.80 208.04 816.25 0.00 1949.09
Sub-Total 4490.88 288.92 0.00 4779.80 208.04 3046.48 297.58 8331.90
State 3865.00 553.80 0.00 4418.80 0.00 987.96 23.85 5430.61
Private 2800.00 0.00 0.00 2800.00 0.00 0.00 3459.20 6259.20
Central 1014.72 221.23 0.00 1235.95 573.00 595.56 0.00 2404.51
Sub-Total 7679.72 775.03 0.00 8454.75 573.00 1583.52 3483.05 14094.32
State 4923.00 0.00 0.00 4923.00 0.00 524.10 25.10 5472.20
Private 2850.00 0.00 0.00 2850.00 0.00 0.00 821.38 3671.38
Central 2909.95 549.97 0.00 3459.92 335.72 1400.39 0.00 5196.03
Sub-Total 10682.95 549.97 0.00 11232.92 335.72 1924.49 846.48 14339.61
State 0.00 0.00 0.00 0.00 0.00 1252.15 174.82 1426.97
Private 0.00 0.00 0.00 0.00 0.00 400.00 15.05 415.05
Central 300.50 69.35 0.00 369.85 22.28 367.16 0.00 759.29
Sub-Total 300.50 69.35 0.00 369.85 22.28 2019.31 189.87 2601.31
State 0.00 0.00 0.00 0.00 0.00 0.00 0.00 0.00
Private 0.00 0.00 0.00 0.00 0.00 0.00 0.00 0.00
Central 32.54 15.32 0.00 47.86 8.84 54.82 0.00 111.52
Sub-Total 32.54 15.32 0.00 47.86 8.84 54.82 0.00 111.52
977.19 290.35 0.00 1267.54 129.80 572.05 0.00 1969.39
State 14713.00 2829.20 12.99 17555.19 0.00 7052.55 1221.81 25829.55
Private 8570.00 108.00 0.00 8678.00 0.00 2148.00 4507.81 15333.81
Central 12000.50 2344.06 0.00 14344.56 1620.00 6794.20 0.00 22758.76
Grand Total 35283.50 5281.26 12.99 40577.75 1620.00 15994.75 5729.62 63922.12
16
Uttar Pradesh
Uttrakhnad
Chandigarh
Central - Unallocated
Total
(Northern
Region)
Grand TotalThermal
Jammu &
Kashmir
Punjab
Rajasthan
Haryana
Himachal Pradesh
INSTALLED CAPACITY (IN MW) OF POWER UTILITIES IN THE STATES/UTS LOCATED IN
NORTHERN REGION
INCLUDING ALLOCATED SHARES IN JOINT & CENTRAL SECTOR UTILITIES
State Ownership/
Sector
Modewise breakup
Nuclear Hydro (Renewable) RES (MNRE)
Delhi
(As on28.02.2014)
Coal Gas Diesel Total
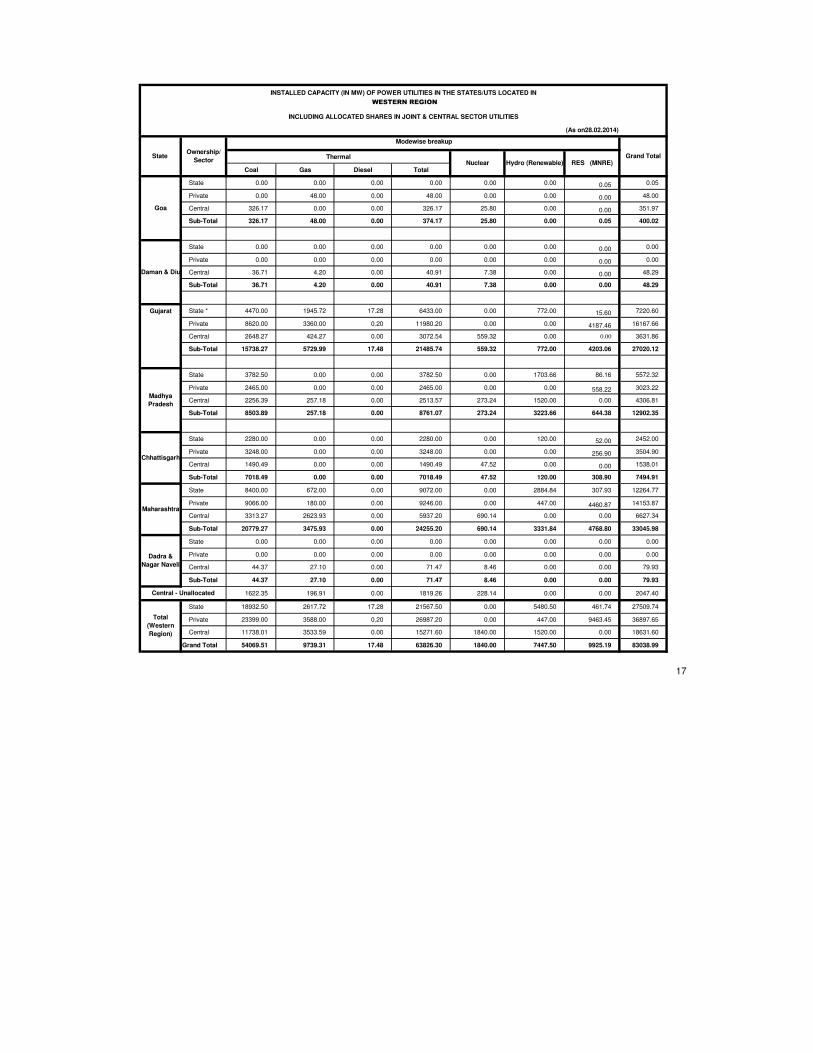
State 0.00 0.00 0.00 0.00 0.00 0.00 0.05 0.05
Private 0.00 48.00 0.00 48.00 0.00 0.00 0.00 48.00
Central 326.17 0.00 0.00 326.17 25.80 0.00 0.00 351.97
Sub-Total 326.17 48.00 0.00 374.17 25.80 0.00 0.05 400.02
State 0.00 0.00 0.00 0.00 0.00 0.00 0.00 0.00
Private 0.00 0.00 0.00 0.00 0.00 0.00 0.00 0.00
Central 36.71 4.20 0.00 40.91 7.38 0.00 0.00 48.29
Sub-Total 36.71 4.20 0.00 40.91 7.38 0.00 0.00 48.29
Gujarat State * 4470.00 1945.72 17.28 6433.00 0.00 772.00 15.60 7220.60
Private 8620.00 3360.00 0.20 11980.20 0.00 0.00 4187.46 16167.66
Central 2648.27 424.27 0.00 3072.54 559.32 0.00 0.00 3631.86
Sub-Total 15738.27 5729.99 17.48 21485.74 559.32 772.00 4203.06 27020.12
State 3782.50 0.00 0.00 3782.50 0.00 1703.66 86.16 5572.32
Private 2465.00 0.00 0.00 2465.00 0.00 0.00 558.22 3023.22
Central 2256.39 257.18 0.00 2513.57 273.24 1520.00 0.00 4306.81
Sub-Total 8503.89 257.18 0.00 8761.07 273.24 3223.66 644.38 12902.35
State 2280.00 0.00 0.00 2280.00 0.00 120.00 52.00 2452.00
Private 3248.00 0.00 0.00 3248.00 0.00 0.00 256.90 3504.90
Central 1490.49 0.00 0.00 1490.49 47.52 0.00 0.00 1538.01
Sub-Total 7018.49 0.00 0.00 7018.49 47.52 120.00 308.90 7494.91
State 8400.00 672.00 0.00 9072.00 0.00 2884.84 307.93 12264.77
Private 9066.00 180.00 0.00 9246.00 0.00 447.00 4460.87 14153.87
Central 3313.27 2623.93 0.00 5937.20 690.14 0.00 0.00 6627.34
Sub-Total 20779.27 3475.93 0.00 24255.20 690.14 3331.84 4768.80 33045.98
State 0.00 0.00 0.00 0.00 0.00 0.00 0.00 0.00
Private 0.00 0.00 0.00 0.00 0.00 0.00 0.00 0.00
Central 44.37 27.10 0.00 71.47 8.46 0.00 0.00 79.93
Sub-Total 44.37 27.10 0.00 71.47 8.46 0.00 0.00 79.93
1622.35 196.91 0.00 1819.26 228.14 0.00 0.00 2047.40
State 18932.50 2617.72 17.28 21567.50 0.00 5480.50 461.74 27509.74
Private 23399.00 3588.00 0.20 26987.20 0.00 447.00 9463.45 36897.65
Central 11738.01 3533.59 0.00 15271.60 1840.00 1520.00 0.00 18631.60
Grand Total 54069.51 9739.31 17.48 63826.30 1840.00 7447.50 9925.19 83038.99
17
Goa
Daman & Diu
Madhya
Pradesh
Chhattisgarh
Maharashtra
Dadra &
Nagar Naveli
Central - Unallocated
Total
(Western
Region)
Ownership/
Sector
Modewise breakup
Grand TotalThermalNuclear Hydro (Renewable) RES (MNRE)
State
INSTALLED CAPACITY (IN MW) OF POWER UTILITIES IN THE STATES/UTS LOCATED IN
WESTERN REGION
INCLUDING ALLOCATED SHARES IN JOINT & CENTRAL SECTOR UTILITIES

(As on28.02.2014)
Coal Gas Diesel Total
State 5092.50 0.00 0.00 5092.50 0.00 3734.53 219.03 9046.06
Private 750.00 3370.40 36.80 4157.20 0.00 0.00 1075.46 5232.66
Central 2940.58 0.00 0.00 2940.58 275.78 0.00 0.00 3216.36
Sub-Total 8783.08 3370.40 36.80 12190.28 275.78 3734.53 1294.49 17495.08
State 2720.00 0.00 127.92 2847.92 0.00 3599.80 995.26 7442.98
Private 2060.00 0.00 106.50 2166.50 0.00 0.00 2697.93 4864.43
Central 1415.56 0.00 0.00 1415.56 254.86 0.00 0.00 1670.42
Sub-Total 6195.56 0.00 234.42 6429.98 254.86 3599.80 3693.19 13977.83
State 0.00 0.00 234.60 234.60 0.00 1881.50 158.42 2274.52
Private 0.00 174.00 21.84 195.84 0.00 0.00 35.10 230.94
Central 931.19 359.58 0.00 1290.77 95.60 0.00 0.00 1386.37
Sub-Total 931.19 533.58 256.44 1721.21 95.60 1881.50 193.52 3891.83
State 4770.00 523.20 0.00 5293.20 0.00 2182.20 123.05 7598.45
Private 550.00 503.10 411.66 1464.76 0.00 0.00 7823.08 9287.84
Central 3653.10 0.00 0.00 3653.10 524.00 0.00 0.00 4177.10
Sub-Total 8973.10 1026.30 411.66 10411.06 524.00 2182.20 7946.13 21063.39
State 0.00 0.00 0.00 0.00 0.00 0.00 0.00 0.00
Private 0.00 0.00 0.00 0.00 0.00 0.00 0.00 0.00
Central 100.17 0.00 0.00 100.17 0.00 0.00 0.00 100.17
Sub-Total 100.17 0.00 0.00 100.17 0.00 0.00 0.00 100.17
State 0.00 32.50 0.00 32.50 0.00 0.00 0.00 32.50
Private 0.00 0.00 0.00 0.00 0.00 0.00 0.00 0.00
Central 232.32 0.00 0.00 232.32 19.28 0.00 0.00 251.60
Sub-Total 232.32 32.50 0.00 264.82 19.28 0.00 0.00 284.10
1367.08 0.00 0.00 1367.08 150.48 0.00 0.00 1517.56
State 12582.50 555.70 362.52 13500.72 0.00 11398.03 1495.76 26394.51
Private 3360.00 4047.50 576.80 7984.30 0.00 0.00 11631.57 19615.87
Central 10640.00 359.58 0.00 10999.58 1320.00 0.00 0.00 12319.58
Grand Total 26582.50 4962.78 939.32 32484.60 1320.00 11398.03 13127.33 58329.96
18
Andhra
Pradesh
Karnataka
Kerala
Tamil Nadu
NLC
Puducherry
Central - Unallocated
Total
(Southern
Region)
INCLUDING ALLOCATED SHARES IN JOINT & CENTRAL SECTOR UTILITIES
State Ownership/
Sector
Modewise breakup
Grand TotalThermalNuclear Hydro (Renewable) RES (MNRE)
INSTALLED CAPACITY (IN MW) OF POWER UTILITIES IN THE STATES/UTS LOCATED IN
SOUTHERN REGION

(As on28.02.2014)
Coal Gas Diesel Total
State 210.00 0.00 0.00 210.00 0.00 0.00 70.70 280.70
Private 0.00 0.00 0.00 0.00 0.00 0.00 43.30 43.30
Central 1744.70 0.00 0.00 1744.70 0.00 129.43 0.00 1874.13
Sub-Total 1954.70 0.00 0.00 1954.70 0.00 129.43 114.00 2198.13
State 1190.00 0.00 0.00 1190.00 0.00 130.00 4.05 1324.05
Private 900.00 0.00 0.00 900.00 0.00 0.00 16.00 916.00
Central 268.88 0.00 0.00 268.88 0.00 70.93 0.00 339.81
Sub-Total 2358.88 0.00 0.00 2358.88 0.00 200.93 20.05 2579.86
State 4970.00 100.00 12.06 5082.06 0.00 977.00 98.40 6157.46
Private 1341.38 0.00 0.14 1341.52 0.00 0.00 33.05 1374.57
Central 905.49 0.00 0.00 905.49 0.00 271.30 0.00 1176.79
Sub-Total 7216.87 100.00 12.20 7329.07 0.00 1248.30 131.45 8708.82
State 0.00 0.00 0.00 0.00 0.00 0.00 0.00 0.00
Private 1050.00 0.00 0.00 1050.00 0.00 0.00 0.00 1050.00
Central 5505.60 90.00 0.00 5595.60 0.00 193.26 0.00 5788.86
Sub-Total 6555.60 90.00 0.00 6645.60 0.00 193.26 0.00 6838.86
State 420.00 0.00 0.00 420.00 0.00 2061.92 64.30 2546.22
Private 3100.00 0.00 0.00 3100.00 0.00 0.00 35.50 3135.50
Central 1585.06 0.00 0.00 1585.06 0.00 105.01 0.00 1690.07
Sub-Total 5105.06 0.00 0.00 5105.06 0.00 2166.93 99.80 7371.79
State 0.00 0.00 5.00 5.00 0.00 0.00 52.11 57.11
Private 0.00 0.00 0.00 0.00 0.00 99.00 0.00 99.00
Central 82.61 0.00 0.00 82.61 0.00 75.27 0.00 157.88
Sub-Total 82.61 0.00 5.00 87.61 0.00 174.27 52.11 313.99
1454.16 0.00 0.00 1454.16 0.00 0.00 0.00 1454.16
State 6790.00 100.00 17.06 6907.06 0.00 3168.92 289.56 10365.54
Private 6391.38 0.00 0.14 6391.52 0.00 99.00 127.85 6618.37
Central 11546.50 90.00 0.00 11636.50 0.00 845.20 0.00 12481.70
Grand Total 24727.88 190.00 17.20 24935.08 0.00 4113.12 417.41 29465.61
19
Total
(Eastern
Region)
Bihar
Jharkhand
West Bengal
DVC
Odisha
Sikkim
Central - Unallocated
INCLUDING ALLOCATED SHARES IN JOINT & CENTRAL SECTOR UTILITIES
State Ownership/
Sector
Modewise breakup
Grand TotalThermalNuclear Hydro (Renewable) RES (MNRE)
INSTALLED CAPACITY (IN MW) OF POWER UTILITIES IN THE STATES/UTS LOCATED IN
EASTERN REGION
(As on28.02.2014)
Coal Gas Diesel Total
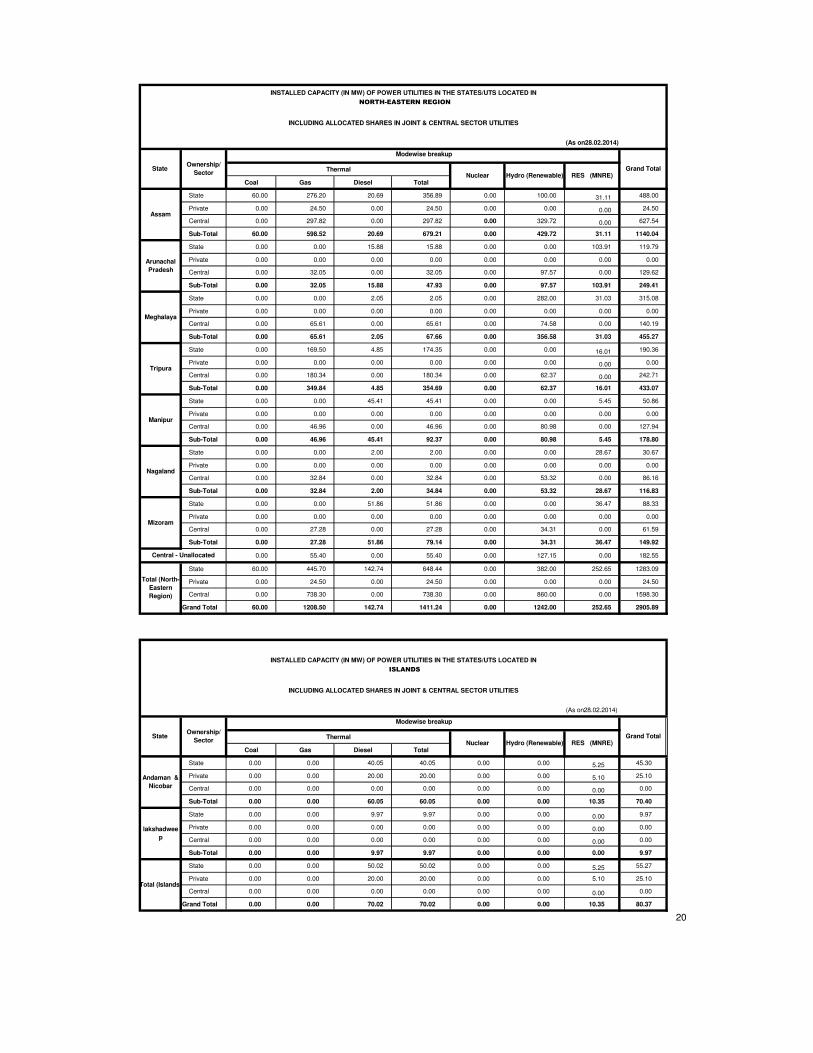
State 60.00 276.20 20.69 356.89 0.00 100.00 31.11 488.00
Private 0.00 24.50 0.00 24.50 0.00 0.00 0.00 24.50
Central 0.00 297.82 0.00 297.82 0.00 329.72 0.00 627.54
Sub-Total 60.00 598.52 20.69 679.21 0.00 429.72 31.11 1140.04
State 0.00 0.00 15.88 15.88 0.00 0.00 103.91 119.79
Private 0.00 0.00 0.00 0.00 0.00 0.00 0.00 0.00
Central 0.00 32.05 0.00 32.05 0.00 97.57 0.00 129.62
Sub-Total 0.00 32.05 15.88 47.93 0.00 97.57 103.91 249.41
State 0.00 0.00 2.05 2.05 0.00 282.00 31.03 315.08
Private 0.00 0.00 0.00 0.00 0.00 0.00 0.00 0.00
Central 0.00 65.61 0.00 65.61 0.00 74.58 0.00 140.19
Sub-Total 0.00 65.61 2.05 67.66 0.00 356.58 31.03 455.27
State 0.00 169.50 4.85 174.35 0.00 0.00 16.01 190.36
Private 0.00 0.00 0.00 0.00 0.00 0.00 0.00 0.00
Central 0.00 180.34 0.00 180.34 0.00 62.37 0.00 242.71
Sub-Total 0.00 349.84 4.85 354.69 0.00 62.37 16.01 433.07
State 0.00 0.00 45.41 45.41 0.00 0.00 5.45 50.86
Private 0.00 0.00 0.00 0.00 0.00 0.00 0.00 0.00
Central 0.00 46.96 0.00 46.96 0.00 80.98 0.00 127.94
Sub-Total 0.00 46.96 45.41 92.37 0.00 80.98 5.45 178.80
State 0.00 0.00 2.00 2.00 0.00 0.00 28.67 30.67
Private 0.00 0.00 0.00 0.00 0.00 0.00 0.00 0.00
Central 0.00 32.84 0.00 32.84 0.00 53.32 0.00 86.16
Sub-Total 0.00 32.84 2.00 34.84 0.00 53.32 28.67 116.83
State 0.00 0.00 51.86 51.86 0.00 0.00 36.47 88.33
Private 0.00 0.00 0.00 0.00 0.00 0.00 0.00 0.00
Central 0.00 27.28 0.00 27.28 0.00 34.31 0.00 61.59
Sub-Total 0.00 27.28 51.86 79.14 0.00 34.31 36.47 149.92
0.00 55.40 0.00 55.40 0.00 127.15 0.00 182.55
State 60.00 445.70 142.74 648.44 0.00 382.00 252.65 1283.09
Private 0.00 24.50 0.00 24.50 0.00 0.00 0.00 24.50
Central 0.00 738.30 0.00 738.30 0.00 860.00 0.00 1598.30
Grand Total 60.00 1208.50 142.74 1411.24 0.00 1242.00 252.65 2905.89
(As on28.02.2014)
Coal Gas Diesel Total
State 0.00 0.00 40.05 40.05 0.00 0.00 5.25 45.30
Private 0.00 0.00 20.00 20.00 0.00 0.00 5.10 25.10
Central 0.00 0.00 0.00 0.00 0.00 0.00 0.00 0.00
Sub-Total 0.00 0.00 60.05 60.05 0.00 0.00 10.35 70.40
State 0.00 0.00 9.97 9.97 0.00 0.00 0.00 9.97
Private 0.00 0.00 0.00 0.00 0.00 0.00 0.00 0.00
Central 0.00 0.00 0.00 0.00 0.00 0.00 0.00 0.00
Sub-Total 0.00 0.00 9.97 9.97 0.00 0.00 0.00 9.97
State 0.00 0.00 50.02 50.02 0.00 0.00 5.25 55.27
Private 0.00 0.00 20.00 20.00 0.00 0.00 5.10 25.10
Central 0.00 0.00 0.00 0.00 0.00 0.00 0.00 0.00
Grand Total 0.00 0.00 70.02 70.02 0.00 0.00 10.35 80.37
20
RES (MNRE)
Andaman &
Nicobar
lakshadwee
p
Total (Islands)
INSTALLED CAPACITY (IN MW) OF POWER UTILITIES IN THE STATES/UTS LOCATED IN
ISLANDS
INCLUDING ALLOCATED SHARES IN JOINT & CENTRAL SECTOR UTILITIES
State Ownership/
Sector
Modewise breakup
Grand TotalThermalNuclear Hydro (Renewable)
Central - Unallocated
Total (North-
Eastern
Region)
Assam
Arunachal
Pradesh
Meghalaya
Tripura
Manipur
Nagaland
Mizoram
INCLUDING ALLOCATED SHARES IN JOINT & CENTRAL SECTOR UTILITIES
State Ownership/
Sector
Modewise breakup
Grand TotalThermalNuclear Hydro (Renewable) RES (MNRE)
INSTALLED CAPACITY (IN MW) OF POWER UTILITIES IN THE STATES/UTS LOCATED IN
NORTH-EASTERN REGION
Coal Gas Diesel Total
State 14713.00 2829.20 12.99 17555.19 0.00 7052.55 1221.81 25829.55
Private 8570.00 108.00 0.00 8678.00 0.00 2148.00 4507.81 15333.81
Central 12000.50 2344.06 0.00 14344.56 1620.00 6794.20 0.00 22758.76
Sub Total 35283.50 5281.26 12.99 40577.75 1620.00 15994.75 5729.62 63922.12
State 18932.50 2617.72 17.28 21567.50 0.00 5480.50 461.74 27509.74
Private 23399.00 3588.00 0.20 26987.20 0.00 447.00 9463.45 36897.65
Central 11738.01 3533.59 0.00 15271.60 1840.00 1520.00 0.00 18631.60
Sub Total 54069.51 9739.31 17.48 63826.30 1840.00 7447.50 9925.19 83038.99
State 12582.50 555.70 362.52 13500.72 0.00 11398.03 1495.76 26394.51
3360.00 4047.50 576.80 7984.30 0.00 0.00 11631.57 19615.87
Central 10640.00 359.58 0.00 10999.58 1320.00 0.00 0.00 12319.58
Sub Total 26582.50 4962.78 939.32 32484.60 1320.00 11398.03 13127.33 58329.96
State 6790.00 100.00 17.06 6907.06 0.00 3168.92 289.56 10365.54
Private 6391.38 0.00 0.14 6391.52 0.00 99.00 127.85 6618.37
Central 11546.50 90.00 0.00 11636.50 0.00 845.20 0.00 12481.70
Sub Total 24727.88 190.00 17.20 24935.08 0.00 4113.12 417.41 29465.61
State 60.00 445.70 142.74 648.44 0.00 382.00 252.65 1283.09
Private 0.00 24.50 0.00 24.50 0.00 0.00 0.00 24.50
Central 0.00 738.30 0.00 738.30 0.00 860.00 0.00 1598.30
Sub Total 60.00 1208.50 142.74 1411.24 0.00 1242.00 252.65 2905.89
State 0.00 0.00 50.02 50.02 0.00 0.00 5.25 55.27
Private 0.00 0.00 20.00 20.00 0.00 0.00 5.10 25.10
Central 0.00 0.00 0.00 0.00 0.00 0.00 0.00 0.00
Sub Total 0.00 0.00 70.02 70.02 0.00 0.00 10.35 80.37
State 53078.00 6548.32 602.61 60228.93 0.00 27482.00 3726.77 91437.70
Private 41720.38 7768.00 597.14 50085.52 0.00 2694.00 25735.78 78515.30
Central 45925.01 7065.53 0.00 52990.54 4780.00 10019.40 0.00 67789.94
Total 140723.39 21381.85 1199.75 163304.99 4780.00 40195.40 29462.55 237742.94
Figures at decimal may not tally due to rounding off
Note : - 1.RES include SHP, BP, U&I, Solar and Wind Energy. Installed capacity in respect of RES (MNER) as on : 30.09.2013
2.The installed capacity in respect of Old Talcher TPS and Bairasul HEP stations is reduced to 460 MW and180 MW
from 470 MW and 198 MW as earlier respectively.
21
ALL INDIA
Abbreviation:-SHP=Small Hydro Project (≤ 25 MW), BP=Biomass Power, U&I=Urban & Industrial Waste Power, RES=Renewable Energy Sources
Northern
Region
Western
Region
Southern
Region
Eastern
Region
North
Eastern
Region
Islands
(UTILITIES)
RegionOwnership/
Sector
Modewise breakup
Grand TotalThermalNuclear Hydro (Renewable) RES (MNRE)
ALL INDIA INSTALLED CAPACITY (IN MW) OF POWER STATIONS
LOCATED IN THE REGIONS OF MAIN LAND AND ISLANDS
(As on28.02.2014)
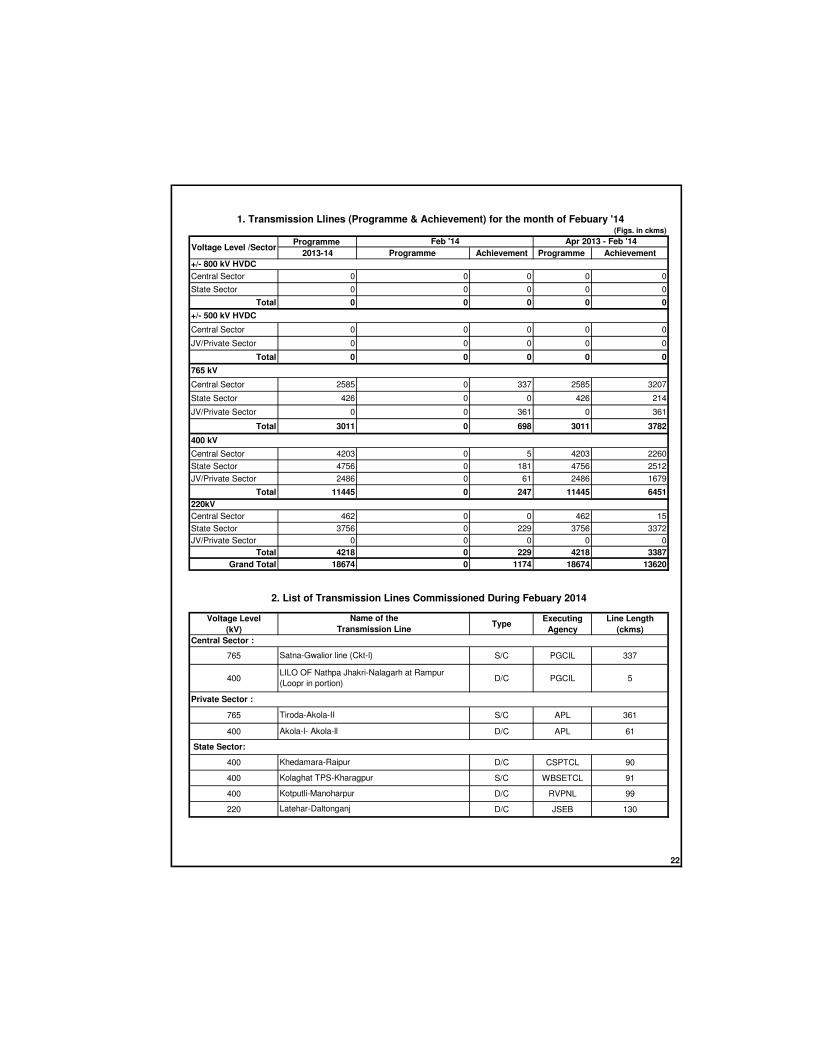
Programme
2013-14 Programme Achievement Programme Achievement
Central Sector 0 0 0 0 0
State Sector 0 0 0 0 0
Total 0 0 0 0 0
Central Sector 0 0 0 0 0
JV/Private Sector 0 0 0 0 0
Total 0 0 0 0 0
Central Sector 2585 0 337 2585 3207
State Sector 426 0 0 426 214
JV/Private Sector 0 0 361 0 361
Total 3011 0 698 3011 3782
Central Sector 4203 0 5 4203 2260
State Sector 4756 0 181 4756 2512
JV/Private Sector 2486 0 61 2486 1679
Total 11445 0 247 11445 6451
Central Sector 462 0 0 462 15
State Sector 3756 0 229 3756 3372
JV/Private Sector 0 0 0 0 0
Total 4218 0 229 4218 3387
Grand Total 18674 0 1174 18674 13620
Voltage Level
(kV)Type
Executing
Agency
Line Length
(ckms)
765 S/C PGCIL 337
400 D/C PGCIL 5
765 S/C APL 361
400 D/C APL 61
400 D/C CSPTCL 90
400 S/C WBSETCL 91
400 D/C RVPNL 99
220 D/C JSEB 130
22
400 kV
Central Sector :
220kV
2. List of Transmission Lines Commissioned During Febuary 2014
Name of the
Transmission Line
1. Transmission Llines (Programme & Achievement) for the month of Febuary '14
+/- 800 kV HVDC
+/- 500 kV HVDC
765 kV
Apr 2013 - Feb '14Feb '14
(Figs. in ckms)
Voltage Level /Sector
Satna-Gwalior line (Ckt-l)
Akola-l- Akola-ll
Khedamara-Raipur
Kolaghat TPS-Kharagpur
State Sector:
Private Sector :
LILO OF Nathpa Jhakri-Nalagarh at Rampur
(Loopr in portion)
Kotputli-Manoharpur
Latehar-Daltonganj
Tiroda-Akola-II

SN Contents Page
1 Programme and Achievements in Feb '14 and during April 2013 to Feb. 2014
2 List of Transmission lines commissioned in Feb.2014
Section C - Transmission Lines
22

Programme
2013-14 Programme Achievement Programme Achievement
Central Sector 0 0 0 0 0
State Sector 0 0 0 0 0
Total 0 0 0 0 0
Central Sector 0 0 0 0 0
JV/Private Sector 0 0 0 0 0
Total 0 0 0 0 0
Central Sector 2585 0 337 2585 3207
State Sector 426 0 0 426 214
JV/Private Sector 0 0 361 0 361
Total 3011 0 698 3011 3782
Central Sector 4203 0 5 4203 2260
State Sector 4756 0 181 4756 2512
JV/Private Sector 2486 0 61 2486 1679
Total 11445 0 247 11445 6451
Central Sector 462 0 0 462 15
State Sector 3756 0 229 3756 3372
JV/Private Sector 0 0 0 0 0
Total 4218 0 229 4218 3387
Grand Total 18674 0 1174 18674 13620
Voltage Level
(kV)Type
Executing
Agency
Line Length
(ckms)
765 S/C PGCIL 337
400 D/C PGCIL 5
765 S/C APL 361
400 D/C APL 61
400 D/C CSPTCL 90
400 S/C WBSETCL 91
400 D/C RVPNL 99
220 D/C JSEB 130
22
400 kV
Central Sector :
220kV
2. List of Transmission Lines Commissioned During Febuary 2014
Name of the
Transmission Line
1. Transmission Llines (Programme & Achievement) for the month of Febuary '14
+/- 800 kV HVDC
+/- 500 kV HVDC
765 kV
Apr 2013 - Feb '14Feb '14
(Figs. in ckms)
Voltage Level /Sector
Satna-Gwalior line (Ckt-l)
Akola-l- Akola-ll
Khedamara-Raipur
Kolaghat TPS-Kharagpur
State Sector:
Private Sector :
LILO OF Nathpa Jhakri-Nalagarh at Rampur
(Loopr in portion)
Kotputli-Manoharpur
Latehar-Daltonganj
Tiroda-Akola-II
SN Contents Page
1 Programme and Achievements in Feb. 2014 and during April 2013 to Feb. 2014
2 List of Sub Stations commissioned in Feb. 2014
Section D - Sub Stations
23
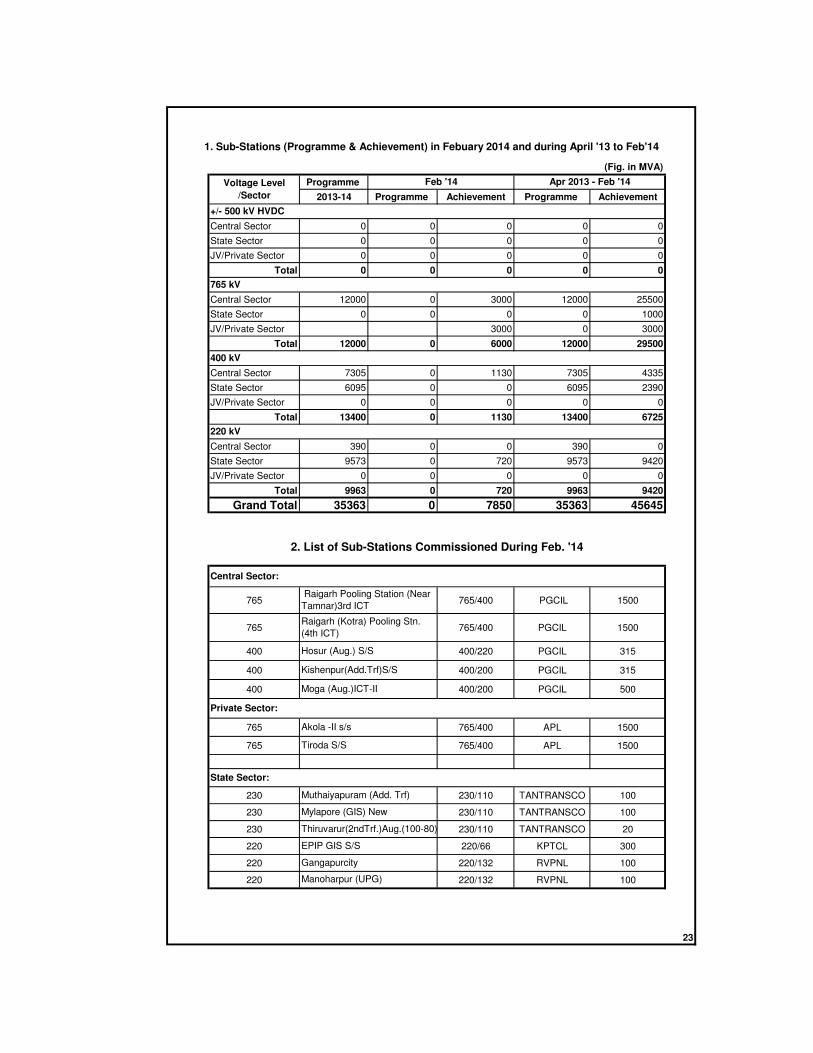
Programme
2013-14 Programme Achievement Programme Achievement
Central Sector 0 0 0 0 0
State Sector 0 0 0 0 0
JV/Private Sector 0 0 0 0 0
Total 0 0 0 0 0
Central Sector 12000 0 3000 12000 25500
State Sector 0 0 0 0 1000
JV/Private Sector 3000 0 3000
Total 12000 0 6000 12000 29500
Central Sector 7305 0 1130 7305 4335
State Sector 6095 0 0 6095 2390
JV/Private Sector 0 0 0 0 0
Total 13400 0 1130 13400 6725
Central Sector 390 0 0 390 0
State Sector 9573 0 720 9573 9420
JV/Private Sector 0 0 0 0 0
Total 9963 0 720 9963 9420
Grand Total 35363 0 7850 35363 45645
765 765/400 PGCIL 1500
765 765/400 PGCIL 1500
400 400/220 PGCIL 315
400 400/200 PGCIL 315
400 400/200 PGCIL 500
765 765/400 APL 1500
765 765/400 APL 1500
230 230/110 TANTRANSCO 100
230 230/110 TANTRANSCO 100
230 230/110 TANTRANSCO 20
220 220/66 KPTCL 300
220 220/132 RVPNL 100
220 220/132 RVPNL 100
23
Kishenpur(Add.Trf)S/S
State Sector:
Moga (Aug.)ICT-II
1. Sub-Stations (Programme & Achievement) in Febuary 2014 and during April '13 to Feb'14
2. List of Sub-Stations Commissioned During Feb. '14
Feb '14 Apr 2013 - Feb '14
(Fig. in MVA)
Voltage Level
/Sector
Hosur (Aug.) S/S
Raigarh (Kotra) Pooling Stn.
(4th ICT)
Central Sector:
Raigarh Pooling Station (Near
Tamnar)3rd ICT
+/- 500 kV HVDC
220 kV
400 kV
765 kV
Akola -II s/s
Tiroda S/S
Private Sector:
Gangapurcity
Manoharpur (UPG)
Muthaiyapuram (Add. Trf)
Mylapore (GIS) New
Thiruvarur(2ndTrf.)Aug.(100-80)
EPIP GIS S/S
SN Contents Page
1 Electricity Generation Targets and Achievements for 2013-14 24
Section E - Electricity Generation
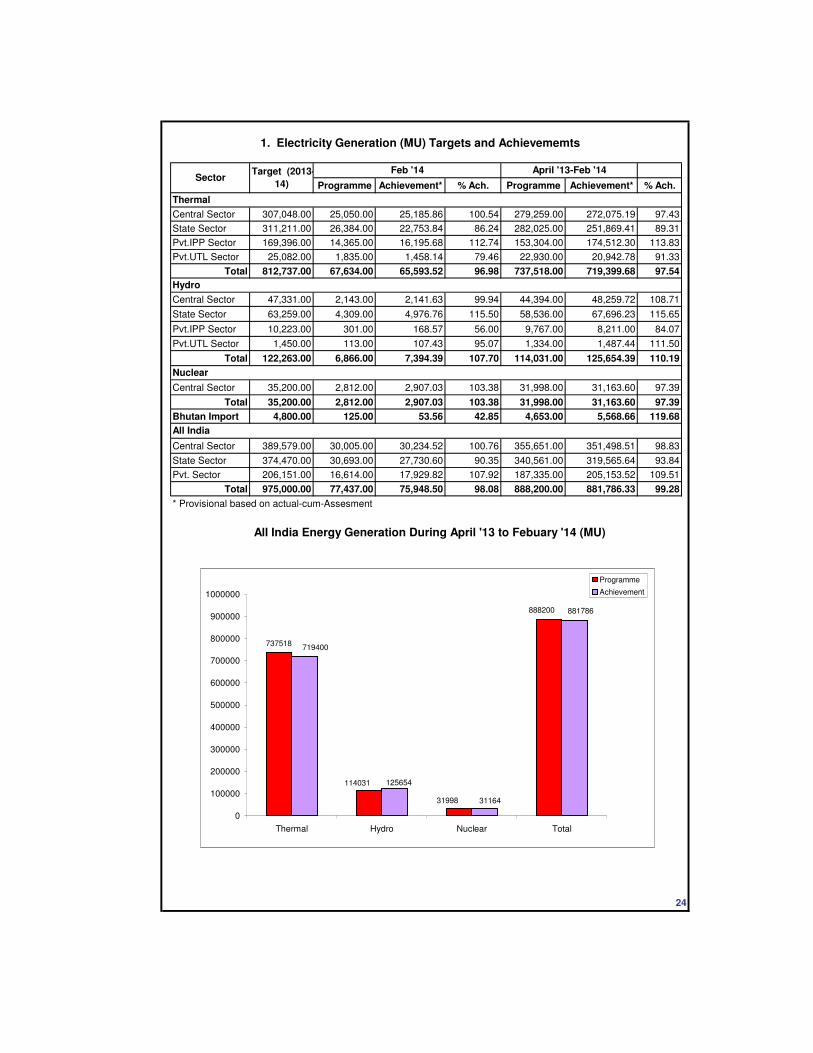
Programme Achievement* % Ach. Programme Achievement* % Ach.
Central Sector 307,048.00 25,050.00 25,185.86 100.54 279,259.00 272,075.19 97.43
State Sector 311,211.00 26,384.00 22,753.84 86.24 282,025.00 251,869.41 89.31
Pvt.IPP Sector 169,396.00 14,365.00 16,195.68 112.74 153,304.00 174,512.30 113.83
Pvt.UTL Sector 25,082.00 1,835.00 1,458.14 79.46 22,930.00 20,942.78 91.33
Total 812,737.00 67,634.00 65,593.52 96.98 737,518.00 719,399.68 97.54
Central Sector 47,331.00 2,143.00 2,141.63 99.94 44,394.00 48,259.72 108.71
State Sector 63,259.00 4,309.00 4,976.76 115.50 58,536.00 67,696.23 115.65
Pvt.IPP Sector 10,223.00 301.00 168.57 56.00 9,767.00 8,211.00 84.07
Pvt.UTL Sector 1,450.00 113.00 107.43 95.07 1,334.00 1,487.44 111.50
Total 122,263.00 6,866.00 7,394.39 107.70 114,031.00 125,654.39 110.19
Central Sector 35,200.00 2,812.00 2,907.03 103.38 31,998.00 31,163.60 97.39
Total 35,200.00 2,812.00 2,907.03 103.38 31,998.00 31,163.60 97.39
Bhutan Import 4,800.00 125.00 53.56 42.85 4,653.00 5,568.66 119.68
Central Sector 389,579.00 30,005.00 30,234.52 100.76 355,651.00 351,498.51 98.83
State Sector 374,470.00 30,693.00 27,730.60 90.35 340,561.00 319,565.64 93.84
Pvt. Sector 206,151.00 16,614.00 17,929.82 107.92 187,335.00 205,153.52 109.51
Total 975,000.00 77,437.00 75,948.50 98.08 888,200.00 881,786.33 99.28
* Provisional based on actual-cum-Assesment
Target (2013-
14)
24
1. Electricity Generation (MU) Targets and Achievememts
April '13-Feb '14
All India Energy Generation During April '13 to Febuary '14 (MU)
Sector
Hydro
Thermal
Nuclear
All India
Feb '14
737518
114031
31998
888200
125654
31164
719400
881786
0
100000
200000
300000
400000
500000
600000
700000
800000
900000
1000000
Thermal Hydro Nuclear Total
Programme
Achievement
SN Contents Page
1 Power Supply Position (Provisional) for Feb '14 and for April '13 to Feb'14 25
2 Peak Demand and Peak Met (Provisional) for Feb '14 and for April '13 to Feb'14 26
3 Power Supply Position (Revised) for Jan '14 and for April '13 to Feb '14 27
4 Peak Demand and Peak Met (Revised) for Jan '14 and for April '13 to Feb '14 28
5 Notified Power cuts / Restrictions on Industries during Feb. 2014 29
6 Power Supply to Agricultural Sector during Feb. 2014 30
Section F - Power supply position
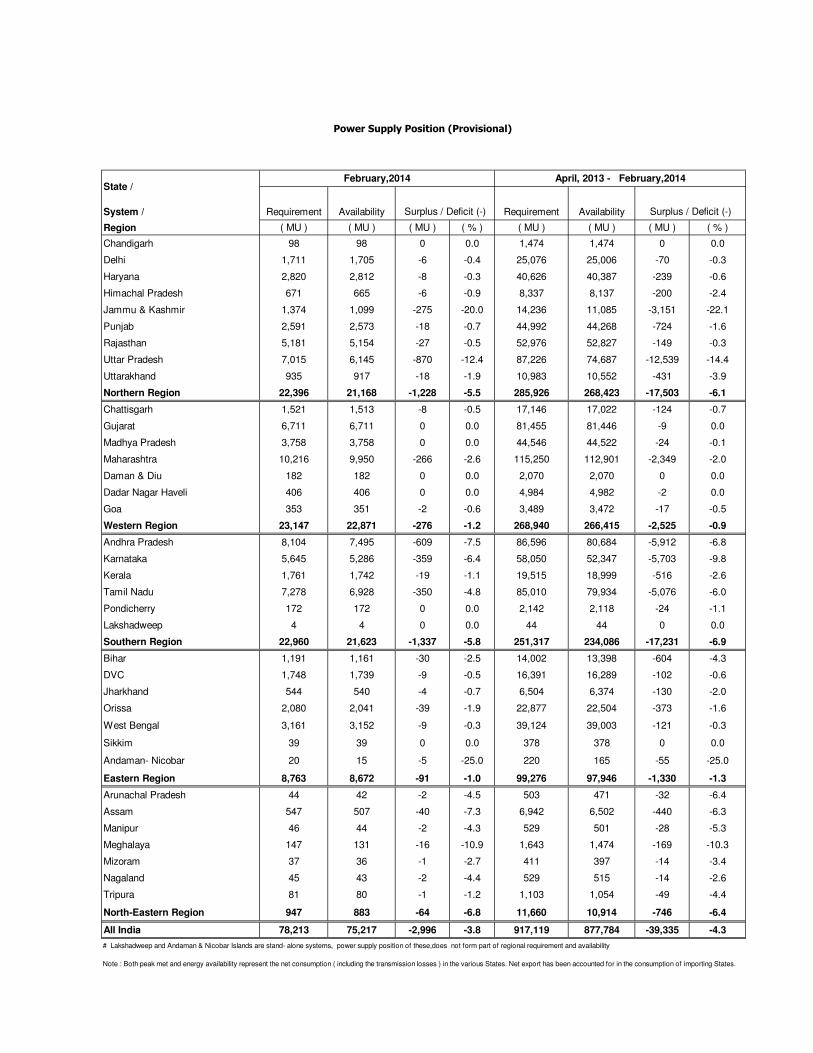
System / Requirement Availability Requirement Availability
Region ( MU ) ( MU ) ( MU ) ( % ) ( MU ) ( MU ) ( MU ) ( % )
Chandigarh 98 98 0 0.0 1,474 1,474 0 0.0
Delhi 1,711 1,705 -6 -0.4 25,076 25,006 -70 -0.3
Haryana 2,820 2,812 -8 -0.3 40,626 40,387 -239 -0.6
Himachal Pradesh 671 665 -6 -0.9 8,337 8,137 -200 -2.4
Jammu & Kashmir 1,374 1,099 -275 -20.0 14,236 11,085 -3,151 -22.1
Punjab 2,591 2,573 -18 -0.7 44,992 44,268 -724 -1.6
Rajasthan 5,181 5,154 -27 -0.5 52,976 52,827 -149 -0.3
Uttar Pradesh 7,015 6,145 -870 -12.4 87,226 74,687 -12,539 -14.4
Uttarakhand 935 917 -18 -1.9 10,983 10,552 -431 -3.9
Northern Region 22,396 21,168 -1,228 -5.5 285,926 268,423 -17,503 -6.1
Chattisgarh 1,521 1,513 -8 -0.5 17,146 17,022 -124 -0.7
Gujarat 6,711 6,711 0 0.0 81,455 81,446 -9 0.0
Madhya Pradesh 3,758 3,758 0 0.0 44,546 44,522 -24 -0.1
Maharashtra 10,216 9,950 -266 -2.6 115,250 112,901 -2,349 -2.0
Daman & Diu 182 182 0 0.0 2,070 2,070 0 0.0
Dadar Nagar Haveli 406 406 0 0.0 4,984 4,982 -2 0.0
Goa 353 351 -2 -0.6 3,489 3,472 -17 -0.5
Western Region 23,147 22,871 -276 -1.2 268,940 266,415 -2,525 -0.9
Andhra Pradesh 8,104 7,495 -609 -7.5 86,596 80,684 -5,912 -6.8
Karnataka 5,645 5,286 -359 -6.4 58,050 52,347 -5,703 -9.8
Kerala 1,761 1,742 -19 -1.1 19,515 18,999 -516 -2.6
Tamil Nadu 7,278 6,928 -350 -4.8 85,010 79,934 -5,076 -6.0
Pondicherry 172 172 0 0.0 2,142 2,118 -24 -1.1
Lakshadweep 4 4 0 0.0 44 44 0 0.0
Southern Region 22,960 21,623 -1,337 -5.8 251,317 234,086 -17,231 -6.9
Bihar 1,191 1,161 -30 -2.5 14,002 13,398 -604 -4.3
DVC 1,748 1,739 -9 -0.5 16,391 16,289 -102 -0.6
Jharkhand 544 540 -4 -0.7 6,504 6,374 -130 -2.0
Orissa 2,080 2,041 -39 -1.9 22,877 22,504 -373 -1.6
West Bengal 3,161 3,152 -9 -0.3 39,124 39,003 -121 -0.3
Sikkim 39 39 0 0.0 378 378 0 0.0
Andaman- Nicobar 20 15 -5 -25.0 220 165 -55 -25.0
Eastern Region 8,763 8,672 -91 -1.0 99,276 97,946 -1,330 -1.3
Arunachal Pradesh 44 42 -2 -4.5 503 471 -32 -6.4
Assam 547 507 -40 -7.3 6,942 6,502 -440 -6.3
Manipur 46 44 -2 -4.3 529 501 -28 -5.3
Meghalaya 147 131 -16 -10.9 1,643 1,474 -169 -10.3
Mizoram 37 36 -1 -2.7 411 397 -14 -3.4
Nagaland 45 43 -2 -4.4 529 515 -14 -2.6
Tripura 81 80 -1 -1.2 1,103 1,054 -49 -4.4
North-Eastern Region 947 883 -64 -6.8 11,660 10,914 -746 -6.4
All India 78,213 75,217 -2,996 -3.8 917,119 877,784 -39,335 -4.3
# Lakshadweep and Andaman & Nicobar Islands are stand- alone systems, power supply position of these,does not form part of regional requirement and availability
Note : Both peak met and energy availability represent the net consumption ( including the transmission losses ) in the various States. Net export has been accounted for in the consumption of importing States.
February,2014 April, 2013 - February,2014
Surplus / Deficit (-) Surplus / Deficit (-)
Power Supply Position (Provisional)
State /
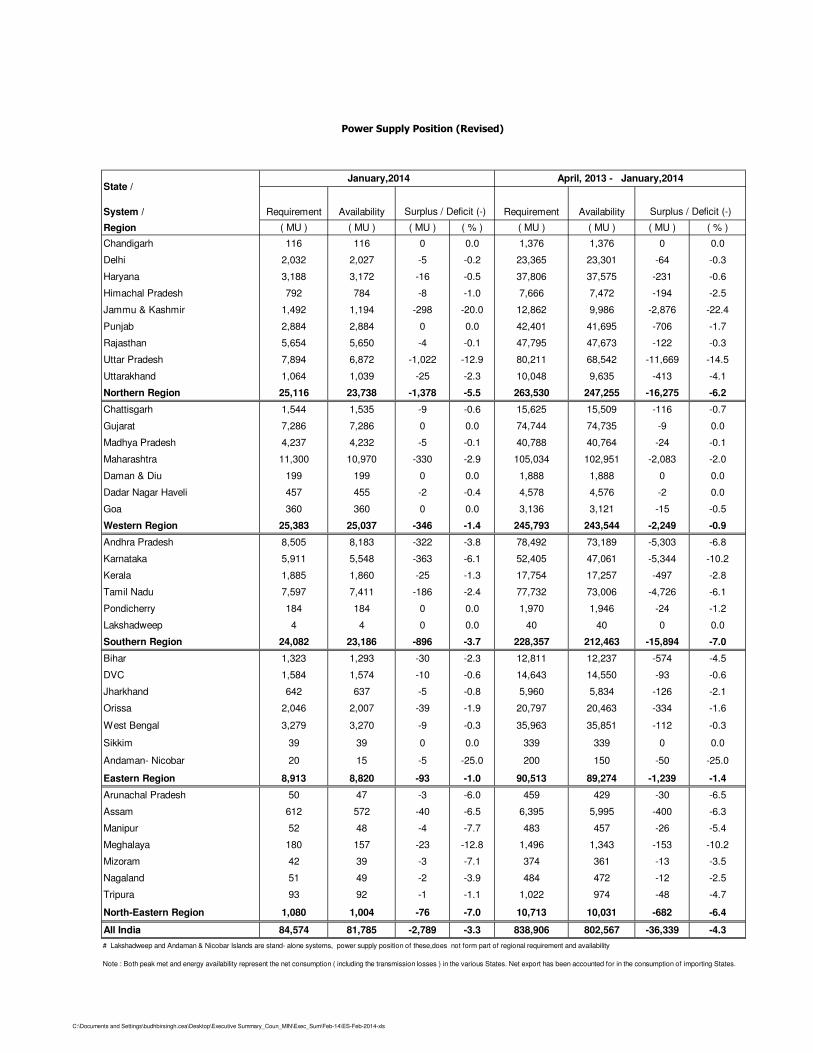
System / Requirement Availability Requirement Availability
Region ( MU ) ( MU ) ( MU ) ( % ) ( MU ) ( MU ) ( MU ) ( % )
Chandigarh 116 116 0 0.0 1,376 1,376 0 0.0
Delhi 2,032 2,027 -5 -0.2 23,365 23,301 -64 -0.3
Haryana 3,188 3,172 -16 -0.5 37,806 37,575 -231 -0.6
Himachal Pradesh 792 784 -8 -1.0 7,666 7,472 -194 -2.5
Jammu & Kashmir 1,492 1,194 -298 -20.0 12,862 9,986 -2,876 -22.4
Punjab 2,884 2,884 0 0.0 42,401 41,695 -706 -1.7
Rajasthan 5,654 5,650 -4 -0.1 47,795 47,673 -122 -0.3
Uttar Pradesh 7,894 6,872 -1,022 -12.9 80,211 68,542 -11,669 -14.5
Uttarakhand 1,064 1,039 -25 -2.3 10,048 9,635 -413 -4.1
Northern Region 25,116 23,738 -1,378 -5.5 263,530 247,255 -16,275 -6.2
Chattisgarh 1,544 1,535 -9 -0.6 15,625 15,509 -116 -0.7
Gujarat 7,286 7,286 0 0.0 74,744 74,735 -9 0.0
Madhya Pradesh 4,237 4,232 -5 -0.1 40,788 40,764 -24 -0.1
Maharashtra 11,300 10,970 -330 -2.9 105,034 102,951 -2,083 -2.0
Daman & Diu 199 199 0 0.0 1,888 1,888 0 0.0
Dadar Nagar Haveli 457 455 -2 -0.4 4,578 4,576 -2 0.0
Goa 360 360 0 0.0 3,136 3,121 -15 -0.5
Western Region 25,383 25,037 -346 -1.4 245,793 243,544 -2,249 -0.9
Andhra Pradesh 8,505 8,183 -322 -3.8 78,492 73,189 -5,303 -6.8
Karnataka 5,911 5,548 -363 -6.1 52,405 47,061 -5,344 -10.2
Kerala 1,885 1,860 -25 -1.3 17,754 17,257 -497 -2.8
Tamil Nadu 7,597 7,411 -186 -2.4 77,732 73,006 -4,726 -6.1
Pondicherry 184 184 0 0.0 1,970 1,946 -24 -1.2
Lakshadweep 4 4 0 0.0 40 40 0 0.0
Southern Region 24,082 23,186 -896 -3.7 228,357 212,463 -15,894 -7.0
Bihar 1,323 1,293 -30 -2.3 12,811 12,237 -574 -4.5
DVC 1,584 1,574 -10 -0.6 14,643 14,550 -93 -0.6
Jharkhand 642 637 -5 -0.8 5,960 5,834 -126 -2.1
Orissa 2,046 2,007 -39 -1.9 20,797 20,463 -334 -1.6
West Bengal 3,279 3,270 -9 -0.3 35,963 35,851 -112 -0.3
Sikkim 39 39 0 0.0 339 339 0 0.0
Andaman- Nicobar 20 15 -5 -25.0 200 150 -50 -25.0
Eastern Region 8,913 8,820 -93 -1.0 90,513 89,274 -1,239 -1.4
Arunachal Pradesh 50 47 -3 -6.0 459 429 -30 -6.5
Assam 612 572 -40 -6.5 6,395 5,995 -400 -6.3
Manipur 52 48 -4 -7.7 483 457 -26 -5.4
Meghalaya 180 157 -23 -12.8 1,496 1,343 -153 -10.2
Mizoram 42 39 -3 -7.1 374 361 -13 -3.5
Nagaland 51 49 -2 -3.9 484 472 -12 -2.5
Tripura 93 92 -1 -1.1 1,022 974 -48 -4.7
North-Eastern Region 1,080 1,004 -76 -7.0 10,713 10,031 -682 -6.4
All India 84,574 81,785 -2,789 -3.3 838,906 802,567 -36,339 -4.3
# Lakshadweep and Andaman & Nicobar Islands are stand- alone systems, power supply position of these,does not form part of regional requirement and availability
Surplus / Deficit (-) Surplus / Deficit (-)
Power Supply Position (Revised)
State /
Note : Both peak met and energy availability represent the net consumption ( including the transmission losses ) in the various States. Net export has been accounted for in the consumption of importing States.
January,2014 April, 2013 - January,2014
C:\Documents and Settings\budhbirsingh.cea\Desktop\Executive Summary_Coun_MIN\Exec_Sum\Feb-14\ES-Feb-2014-xls

‚ããä£ã‡ãŠ¦ã½ã ½ããâØã ‚ããä£ã‡ãŠ¦ã½ã „¹Êãã亣㠂ããä£ã‡ãŠ¦ã½ã ½ããâØã ‚ããä£ã‡ãŠ¦ã½ã „¹Êãã亣ã
¹Çã¥ããÊããè / System Peak Demand Peak Met Peak Demand Peak Met
àãñ¨ã / Region ( MW ) ( MW ) ( MW ) ( % ) ( MW ) ( MW ) ( MW ) ( % )
Þãâ¡ãèØ㤠/ Chandigarh 232 232 0 0.0 345 345 0 0.0
ãäªÊÊããè / Delhi 4,103 4,000 -103 -2.5 6,035 5,653 -382 -6.3
ÖãäÀ¾ãã¥ãã / Haryana 6,043 6,043 0 0.0 8,114 8,114 0 0.0
ãäÖ½ããÞãÊã ¹ÇãªñÍã / Himachal Pradesh 1,479 1,392 -87 -5.9 1,561 1,392 -169 -10.8
•ã½½ãì ‡ãŠÍ½ããèÀ / Jammu & Kashmir 2,490 1,991 -499 -20.0 2,490 1,991 -499 -20.0
¹ãâ•ããºã / Punjab 5,531 5,531 0 0.0 10,089 8,733 -1,356 -13.4
Àã•ãÔ©ãã¶ã / Rajasthan 9,977 9,936 -41 -0.4 9,977 9,936 -41 -0.4
„§ãÀ ¹ÇãªñÍã / Uttar Pradesh 12,885 10,950 -1,935 -15.0 13,089 12,327 -762 -5.8
„§ãÀãŒãâ¡ / Uttarakhand 1,814 1,774 -40 -2.2 1,814 1,774 -40 -2.2
„§ãÀãè àãñ¨ã / Northern Region 40,300 38,227 -2,073 -5.1 45,934 42,774 -3,160 -6.9
œ¦ããèÔãØ㤠/ Chhattisgarh 3,013 2,981 -32 -1.1 3,365 3,320 -45 -1.3
Øãì•ãÀã¦ã / Gujarat 11,218 11,178 -40 -0.4 12,201 12,201 0 0.0
½ã£¾ã ¹ãƪñÍã / Madhya Pradesh 9,604 9,040 -564 -5.9 9,716 9,716 0 0.0
½ãÖãÀãÓ›È / Maharashtra 18,427 17,013 -1,414 -7.7 18,427 17,013 -1,414 -7.7
ª½ã¶ã ‚ããõÀ ã䪄 / Daman & Diu 297 297 0 0.0 322 297 -25 -7.8
ªãªÀ Ìã ¶ãØãÀ ÖÌãñÊããè / Dadra & Nagar Haveli 654 654 0 0.0 661 661 0 0.0
ØããñÌãã / Goa 449 433 -16 -3.6 529 529 0 0.0
¹ããäÍÞã½ããè àãñ¨ã / Western Region 41,097 39,731 -1,366 -3.3 41,335 40,304 -1,031 -2.5
‚ã㶣Çã ¹ÇãªñÍã / Andhra Pradesh 12,280 12,112 -168 -1.4 14,072 12,112 -1,960 -13.9
‡ãŠ¶Ãã㛇㊠/ Karnataka 9,785 9,056 -729 -7.5 9,934 9,056 -878 -8.8
‡ãñŠÀÊã / Kerala 3,495 3,333 -162 -4.6 3,589 3,333 -256 -7.1
¦ããä½ãÊã ¶ãã¡ / Tamil Nadu 13,248 12,492 -756 -5.7 13,380 12,492 -888 -6.6
¹ãì¡ìÞãñÀãè / Puducherry 318 317 -1 -0.3 351 332 -19 -5.4
Êãà¾ã ´ãè¹ã / Lakshadweep # 8 8 0 0 9 9 0 0
ªãäàã¥ããè àãñ¨ã / Southern Region 37,096 34,129 -2,967 -8.0 39,015 34,151 -4,864 -12.5
ãäºãÖãÀ / Bihar 2,138 2,018 -120 -5.6 2,465 2,312 -153 -6.2
ªã½ããñªÀ Üãã›ãè ãä¶ãØã½ã / DVC 2,560 2,550 -10 -0.4 2,745 2,745 0 0.0
¢ããÀŒã¥¡ / Jharkhand 1,010 984 -26 -2.6 1,111 1,069 -42 -3.8
‚ããñãäü¡Íãã / Odisha 3,220 3,200 -20 -0.6 3,727 3,722 -5 -0.1
¹ããäÏÞã½ã ºãâØããÊã / West Bengal 6,257 6,237 -20 -0.3 7,325 7,290 -35 -0.5
ãäÔããä‡ã‹‡ãŠ½ã / Sikkim 80 80 0 0.0 90 90 0 0.0
‚ã⡽ãã¶ã- ãä¶ã‡ãŠãñºããÀ / Andaman- Nicobar # 40 32 -8 -20 40 32 -8 -20
¹ãîÌããê àãñ¨ã / Eastern Region 14,265 14,082 -183 -1.3 15,885 15,528 -357 -2.2
‚ãÁ¥ããÞãÊã ¹ÇãªñÍã / Arunachal Pradesh 118 116 -2 -1.7 125 124 -1 -0.8
‚ãÔã½ã / Assam 1,089 1,079 -10 -0.9 1,329 1,220 -109 -8.2
½ã¥ããè¹ãìÀ / Manipur 129 129 0 0.0 130 129 -1 -0.8
½ãñÜããÊã¾ã / Meghalaya 343 330 -13 -3.8 343 330 -13 -3.8
ãä½ã•ããñÀ½ã / Mizoram 84 82 -2 -2.4 84 82 -2 -2.4
¶ããØããÊãõ¥¡ / Nagaland 107 106 -1 -0.9 109 106 -3 -2.8
ãä¨ã¹ãìÀã / Tripura 201 201 0 0.0 254 250 -4 -1.6
„§ãÀ -¹ãîÌããê àãñ¨ã / North-Eastern Region 2,096 1,925 -171 -8.2 2,164 2,048 -116 -5.4
Ôã½¹ãî¥ãà ¼ããÀ¦ã / All India 134,854 128,094 -6,760 -5.0 135,561 129,815 -5,746 -4.2
# Lakshadweep and Andaman & Nicobar Islands are stand- alone systems, power supply position of these,does not form part of regional requirement and availability
‚ããä£ã‡ãŠ¦ã½ã ½ããâØã ‚ããõÀ ‚ããä£ã‡ãŠ¦ã½ã „¹Êãã亣ã (ÔãâÍããñãä£ã¦ã) / Peak Demand and Peak Met (Revised)
‚ããä£ãÍãñÓã/ ‡ãŠ½ããè (-) ‚ããä£ãÍãñÓã/ ‡ãŠ½ããè (-)À㕾ã /State
‚ããù‡ãŠ¡ñ ½ãñØãã Ìãã› ¶ãñ› / Figures in MW net
•ã¶ãÌãÀãè, 2014 / January,2014 ‚ã¹ÇãõÊã,2013 -•ã¶ãÌãÀãè, 2014/ April,2013 to January,2014
Surplus / Deficit (-) Surplus / Deficit (-)
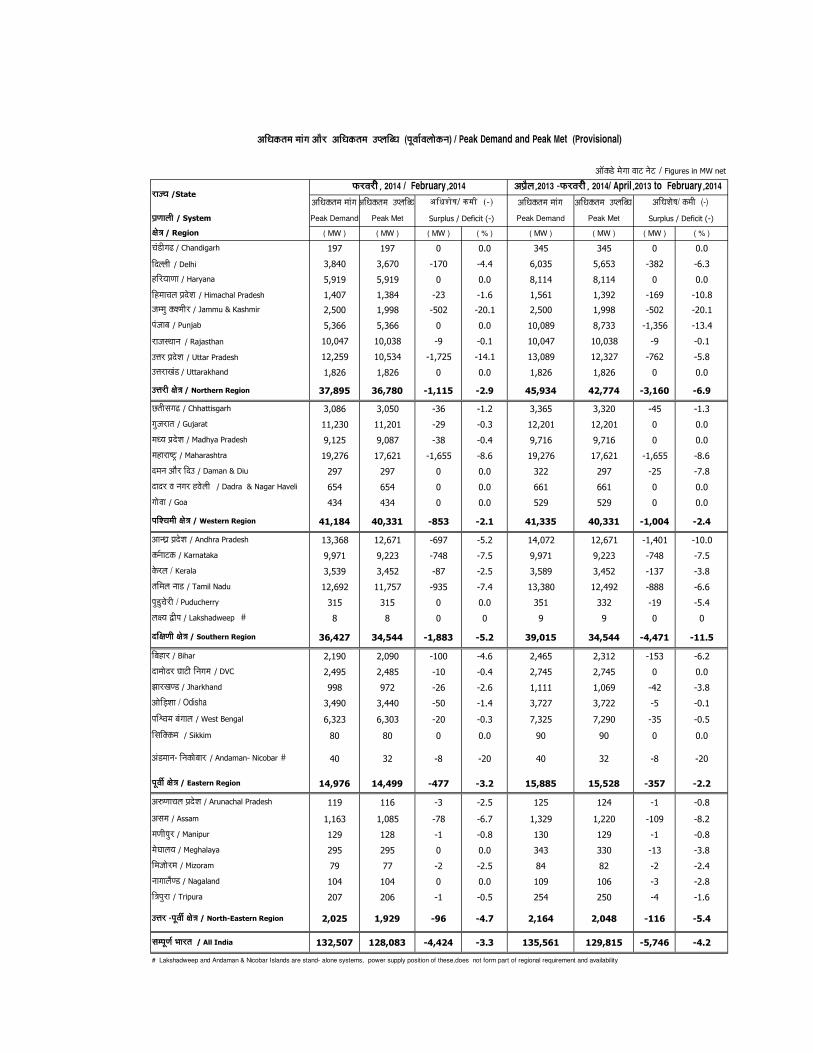
‚ããä£ã‡ãŠ¦ã½ã ½ããâØã ‚ããä£ã‡ãŠ¦ã½ã „¹Êãã亣㠂ããä£ã‡ãŠ¦ã½ã ½ããâØã ‚ããä£ã‡ãŠ¦ã½ã „¹Êãã亣ã
¹Çã¥ããÊããè / System Peak Demand Peak Met Peak Demand Peak Met
àãñ¨ã / Region ( MW ) ( MW ) ( MW ) ( % ) ( MW ) ( MW ) ( MW ) ( % )
Þãâ¡ãèØ㤠/ Chandigarh 197 197 0 0.0 345 345 0 0.0
ãäªÊÊããè / Delhi 3,840 3,670 -170 -4.4 6,035 5,653 -382 -6.3
ÖãäÀ¾ãã¥ãã / Haryana 5,919 5,919 0 0.0 8,114 8,114 0 0.0
ãäÖ½ããÞãÊã ¹ÇãªñÍã / Himachal Pradesh 1,407 1,384 -23 -1.6 1,561 1,392 -169 -10.8
•ã½½ãì ‡ãŠÍ½ããèÀ / Jammu & Kashmir 2,500 1,998 -502 -20.1 2,500 1,998 -502 -20.1
¹ãâ•ããºã / Punjab 5,366 5,366 0 0.0 10,089 8,733 -1,356 -13.4
Àã•ãÔ©ãã¶ã / Rajasthan 10,047 10,038 -9 -0.1 10,047 10,038 -9 -0.1
„§ãÀ ¹ÇãªñÍã / Uttar Pradesh 12,259 10,534 -1,725 -14.1 13,089 12,327 -762 -5.8
„§ãÀãŒãâ¡ / Uttarakhand 1,826 1,826 0 0.0 1,826 1,826 0 0.0
„§ãÀãè àãñ¨ã / Northern Region 37,895 36,780 -1,115 -2.9 45,934 42,774 -3,160 -6.9
œ¦ããèÔãØ㤠/ Chhattisgarh 3,086 3,050 -36 -1.2 3,365 3,320 -45 -1.3
Øãì•ãÀã¦ã / Gujarat 11,230 11,201 -29 -0.3 12,201 12,201 0 0.0
½ã£¾ã ¹ãƪñÍã / Madhya Pradesh 9,125 9,087 -38 -0.4 9,716 9,716 0 0.0
½ãÖãÀãÓ›È / Maharashtra 19,276 17,621 -1,655 -8.6 19,276 17,621 -1,655 -8.6
ª½ã¶ã ‚ããõÀ ã䪄 / Daman & Diu 297 297 0 0.0 322 297 -25 -7.8
ªãªÀ Ìã ¶ãØãÀ ÖÌãñÊããè / Dadra & Nagar Haveli 654 654 0 0.0 661 661 0 0.0
ØããñÌãã / Goa 434 434 0 0.0 529 529 0 0.0
¹ããäÍÞã½ããè àãñ¨ã / Western Region 41,184 40,331 -853 -2.1 41,335 40,331 -1,004 -2.4
‚ã㶣Çã ¹ÇãªñÍã / Andhra Pradesh 13,368 12,671 -697 -5.2 14,072 12,671 -1,401 -10.0
‡ãŠ¶Ãã㛇㊠/ Karnataka 9,971 9,223 -748 -7.5 9,971 9,223 -748 -7.5
‡ãñŠÀÊã / Kerala 3,539 3,452 -87 -2.5 3,589 3,452 -137 -3.8
¦ããä½ãÊã ¶ãã¡ / Tamil Nadu 12,692 11,757 -935 -7.4 13,380 12,492 -888 -6.6
¹ãì¡ìÞãñÀãè / Puducherry 315 315 0 0.0 351 332 -19 -5.4
Êãà¾ã ´ãè¹ã / Lakshadweep # 8 8 0 0 9 9 0 0
ªãäàã¥ããè àãñ¨ã / Southern Region 36,427 34,544 -1,883 -5.2 39,015 34,544 -4,471 -11.5
ãäºãÖãÀ / Bihar 2,190 2,090 -100 -4.6 2,465 2,312 -153 -6.2
ªã½ããñªÀ Üãã›ãè ãä¶ãØã½ã / DVC 2,495 2,485 -10 -0.4 2,745 2,745 0 0.0
¢ããÀŒã¥¡ / Jharkhand 998 972 -26 -2.6 1,111 1,069 -42 -3.8
‚ããñãäü¡Íãã / Odisha 3,490 3,440 -50 -1.4 3,727 3,722 -5 -0.1
¹ããäÏÞã½ã ºãâØããÊã / West Bengal 6,323 6,303 -20 -0.3 7,325 7,290 -35 -0.5
ãäÔããä‡ã‹‡ãŠ½ã / Sikkim 80 80 0 0.0 90 90 0 0.0
‚ã⡽ãã¶ã- ãä¶ã‡ãŠãñºããÀ / Andaman- Nicobar # 40 32 -8 -20 40 32 -8 -20
¹ãîÌããê àãñ¨ã / Eastern Region 14,976 14,499 -477 -3.2 15,885 15,528 -357 -2.2
‚ãÁ¥ããÞãÊã ¹ÇãªñÍã / Arunachal Pradesh 119 116 -3 -2.5 125 124 -1 -0.8
‚ãÔã½ã / Assam 1,163 1,085 -78 -6.7 1,329 1,220 -109 -8.2
½ã¥ããè¹ãìÀ / Manipur 129 128 -1 -0.8 130 129 -1 -0.8
½ãñÜããÊã¾ã / Meghalaya 295 295 0 0.0 343 330 -13 -3.8
ãä½ã•ããñÀ½ã / Mizoram 79 77 -2 -2.5 84 82 -2 -2.4
¶ããØããÊãõ¥¡ / Nagaland 104 104 0 0.0 109 106 -3 -2.8
ãä¨ã¹ãìÀã / Tripura 207 206 -1 -0.5 254 250 -4 -1.6
„§ãÀ -¹ãîÌããê àãñ¨ã / North-Eastern Region 2,025 1,929 -96 -4.7 2,164 2,048 -116 -5.4
Ôã½¹ãî¥ãà ¼ããÀ¦ã / All India 132,507 128,083 -4,424 -3.3 135,561 129,815 -5,746 -4.2
# Lakshadweep and Andaman & Nicobar Islands are stand- alone systems, power supply position of these,does not form part of regional requirement and availability
‚ããä£ã‡ãŠ¦ã½ã ½ããâØã ‚ããõÀ ‚ããä£ã‡ãŠ¦ã½ã „¹Êãã亣ã (¹ãîÌããÃÌãÊããñ‡ãŠ¶ã) / Peak Demand and Peak Met (Provisional)
‚ããä£ãÍãñÓã/ ‡ãŠ½ããè (-) ‚ããä£ãÍãñÓã/ ‡ãŠ½ããè (-)À㕾ã /State
‚ããù‡ãŠ¡ñ ½ãñØãã Ìãã› ¶ãñ› / Figures in MW net
¹ãŠÀÌãÀãèè, 2014 / February,2014 ‚ã¹ÇãõÊã,2013 -¹ãŠÀÌãÀãèè, 2014/ April,2013 to February,2014
Surplus / Deficit (-) Surplus / Deficit (-)

À㕾ã /àãñ¨ã / State/ Region …•ããà ‡ãŠ›ãõ¦ããè / / / / Energy Cut ½ããâØ㠇㊛ãõ¦ããè / / / / Demand cut
„§ãÀãè àãñ¨ã / Northern Region
Þãâ¡ãèØ㤠/ Chandigarh*
ãäªÊÊããè / Delhi NIL NIL
ÖãäÀ¾ãã¥ãã / Haryana NIL NIL
ãäÖ½ããÞãÊã ¹ÇãªñÍã / Himachal
Pradesh
•ã½½ãì ‡ãŠÍ½ããèÀ /
Jammu & Kashmir*
¹ãâ•ããºã / Punjab NIL NIL
Àã•ãÔ©ãã¶ã / Rajasthan NIL NIL
„§ãÀ ¹ÇãªñÍã / Uttar Pradesh NIL NIL
„§ãÀãŒãâ¡ / Uttarakhand 0.445 MU/day on HT/LT industries . 140 MW cut on HT/LT industries.
¹ããäÍÞã½ããè àãñ¨ã / Western Region
œ¦ããèÔãØ㤠/ Chhattisgarh NIL NIL
Øãì•ãÀã¦ã / Gujarat
½ã£¾ã ¹ãƪñÍã / Madhya Pradesh NIL NIL
½ãÖãÀãÓ›È / Maharashtra NIL NIL
ØããñÌãã / Goa NIL NIL
ªãäàã¥ããè àãñ¨ã / Southern Region
‚ã㶣Çã ¹ÇãªñÍã / Andhra Pradesh
‡ãŠ¶Ãã㛇㊠/ Karnataka
‡ãñŠÀÊã / Kerala
¦ããä½ãÊã ¶ãã¡ / Tamil Nadu
¹ãì¡ìÞãñÀãè / Puducherry
¹ãîÌããê àãñ¨ã / Eastern Region
ãäºãÖãÀ / Bihar
¢ããÀŒã¥¡ / Jharkhand
‚ããñãäü¡Íãã / Odisha
¹ããäÏÞã½ã ºãâØããÊã / West Bengal
¹ãŠÀÌãÀãèè, 2014 ½ãñ ƒâ¡ãäԛȕ㠹ãÀ ãäÌã²ãì¦ã ‡ãŠ›ãõ¦ããè ‡ãŠã ãäÌãÌãÀ¥ã / Notified Power Cuts/Restrictions on Industries during February,2014
20% and 90% Cut on base Demand & Energy Consumption in respect of HT industrial and commercial consumers during
day time and evening peak hours from October 2013. 2 Hour Load Shedding for Chennai and 3 hours Load Shedding for
areas other than Chennai City by rotation. However, there was load shedding up to 1557 MW during peak hours (355.36
MU for the month).
Power cuts/ restrictions on Industries is attached as Annex - I.There was load shedding of upto 2650 MW (614.95 MU for
the month).
Nil; However, there was load shedding up to 1450 MW during peak hours (362.75 MU for the month)
All industries are allowed to run their units on all days of week and if they want to avail staggered holiday, then they will
have to be staggered on notified day only and cannot avail as per their choice. All industries are required to keep their
recess timings staggered.
Nil; However, there was load shedding up to 150 MW during peak hours (19.86 MU for the month)
No Notified Power Cut
* Data not received from these States.
Nil
No Notified Cuts
No Notified Cuts
No Notified Cuts
Note:- Although some states have reported "No Notified Power Cuts", load shedding/restrictions are imposed on industries on day to day basis
depending upon availability of power vis-à-vis requirement.
No Notified Cuts
À㕾ã /àãñ¨ã / State/ Region
„§ãÀãè àãñ¨ã / Northern Region
Þãâ¡ãèØ㤠/ Chandigarh*
ãäªÊÊããè / Delhi
ÖãäÀ¾ãã¥ãã / Haryana
ãäÖ½ããÞãÊã ¹ÇãªñÍã / Himachal Pradesh
•ã½½ãì ‡ãŠÍ½ããèÀ / Jammu & Kashmir*
¹ãâ•ããºã / Punjab
Àã•ãÔ©ãã¶ã / Rajasthan
„§ãÀ ¹ÇãªñÍã / Uttar Pradesh
„§ãÀãŒãâ¡ / Uttarakhand
¹ããäÍÞã½ããè àãñ¨ã / Western Region
œ§ããèÔãØ㤠/ Chhattisgarh
Øãì•ãÀã¦ã / Gujarat
½ã£¾ã ¹ãƪñÍã / Madhya Pradesh
½ãÖãÀãÓ›È / Maharashtra
ØããñÌãã / Goa
ªãäàã¥ããè àãñ¨ã / Southern Region
‚ã㶣Çã ¹ÇãªñÍã / Andhra Pradesh
‡ãŠ¶ããۇ㊠/ Karnataka
‡ãñŠÀÊã / Kerala
¦ããä½ãÊã¶ãã¡î / Tamil Nadu
¹ãì¡ìÞãñÀãè / Puducherry No Restrictions
ãäºãÖãÀ / Bihar
¢ããÀŒã¥¡ / Jharkhand
‚ããñãäü¡Íãã / Odisha
¹ããäÏÞã½ã ºãâØããÊã / West Bengal
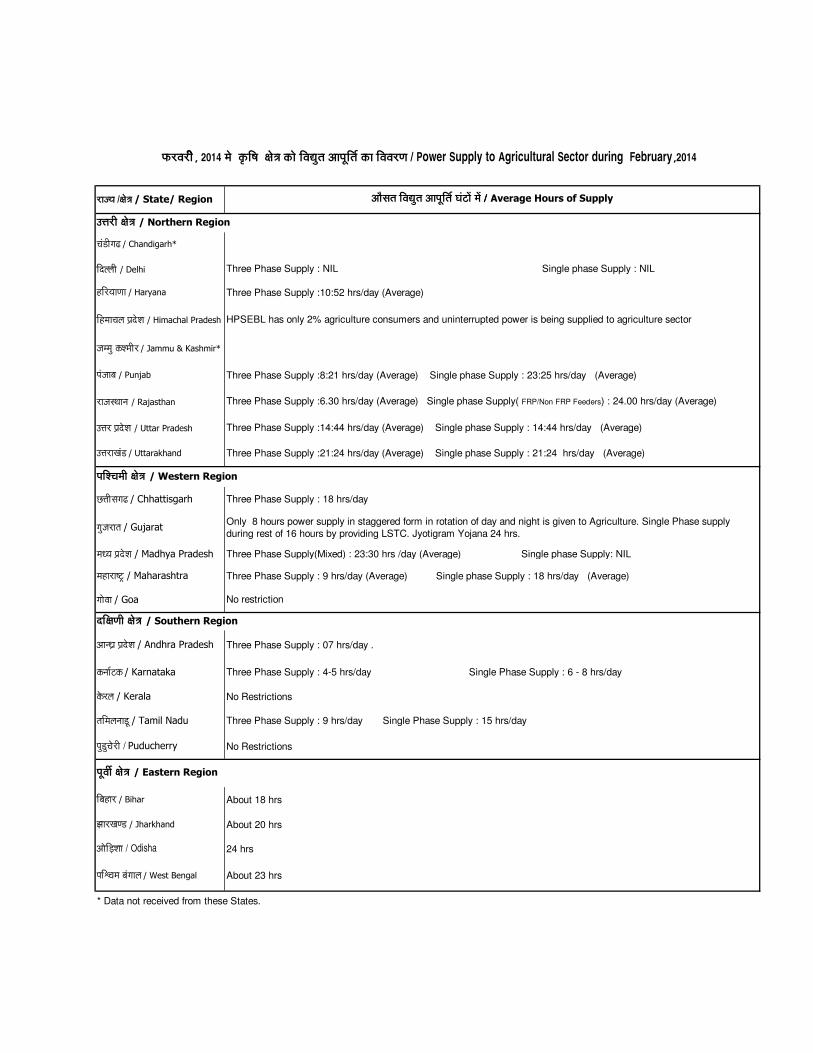
Three Phase Supply :8:21 hrs/day (Average) Single phase Supply : 23:25 hrs/day (Average)
¹ãŠÀÌãÀãèè, 2014 ½ãñ ‡ãðŠãäÓã àãñ¨ã ‡ãŠãñ ãäÌã²ãì¦ã ‚ãã¹ãîãä¦ãà ‡ãŠã ãäÌãÌãÀ¥ã / Power Supply to Agricultural Sector during February,2014
Three Phase Supply : 9 hrs/day (Average) Single phase Supply : 18 hrs/day (Average)
Three Phase Supply : NIL Single phase Supply : NIL
Three Phase Supply :10:52 hrs/day (Average)
HPSEBL has only 2% agriculture consumers and uninterrupted power is being supplied to agriculture sector
Three Phase Supply : 18 hrs/day
Three Phase Supply :6.30 hrs/day (Average) Single phase Supply( FRP/Non FRP Feeders) : 24.00 hrs/day (Average)
‚ããõÔã¦ã ãäÌã²ãì¦ã ‚ãã¹ãîãä¦ãà Üãâ›ãò ½ãò / / / / Average Hours of Supply
¹ãîÌããê àãñ¨ã / Eastern Region
About 23 hrs
No Restrictions
Three Phase Supply : 9 hrs/day Single Phase Supply : 15 hrs/day
About 18 hrs
About 20 hrs
Three Phase Supply(Mixed) : 23:30 hrs /day (Average) Single phase Supply: NIL
Only 8 hours power supply in staggered form in rotation of day and night is given to Agriculture. Single Phase supply
during rest of 16 hours by providing LSTC. Jyotigram Yojana 24 hrs.
* Data not received from these States.
24 hrs
Three Phase Supply : 4-5 hrs/day Single Phase Supply : 6 - 8 hrs/day
Three Phase Supply :14:44 hrs/day (Average) Single phase Supply : 14:44 hrs/day (Average)
Three Phase Supply :21:24 hrs/day (Average) Single phase Supply : 21:24 hrs/day (Average)
Three Phase Supply : 07 hrs/day .
No restriction

SN Contents Page
1 Growth of Installed Capacity since 6th Plan 31
2 Growth of Transmission Sector since 6th Plan 32
3 All India Yearly Coal consumption for Power Generation (Utilities)
4 All India Annual Per Capita Consumption of Electricity since 2005-06
5 Average cost of power supply & Average realisation (Paisa/kwh)
6 Growth of Rural Electrification & Pump Sets Energisation
7 Status of Hydro Schemes Cleared by the CEA during April '13 to Feb '14
Section G - Growth of Power Sector
33
34

(In MW)
Coal Gas Diesel Total
End of 6th Plan 26310.83 541.50 177.37 27029.70 1095 14460.02 0 42584.72
End of 7th Plan 41237.48 2343.00 165.09 43745.57 1565 18307.63 18.14 63636.34
End of 8th Plan 54154.48 6561.90 293.9 61010.28 2225 21658.08 902.01 85795.37
End of 9th Plan 62130.88 11163.10 1134.83 74428.81 2720 26268.76 1628.39 105045.96
End of 10th Plan 71121.38 13691.71 1201.75 86014.84 3900 34653.77 7760.6 132329.21
End of 11th Plan 112022.38 18381.05 1199.75 131603.18 4780 38990.4 24503.45 199877.03
End of Feb '14 140723.39 21381.85 1199.75 163304.99 4780 40195.4 29462.55 237742.94
Captive Generation Capacity in Industries having demand of 1 MW and above, grid interactive (as on 31-03-11) = 34444.12 MW
Coal Gas Diesel Nuclear Hydro Res Total
31
All India Generating Installed Capacity ( MW ) (As on 28-02-2014 )
1. Growth of Installed Capacity Since 6th Plan
RES (MNRE) TotalPlan / Year NuclearThermal
Hydro
1,199.75
140,723.39
21,381.85
40,195.40
29,462.55
4,780.00
Coal Gas Diesel Nuclear Hydro Res
Total 237742.94 MW
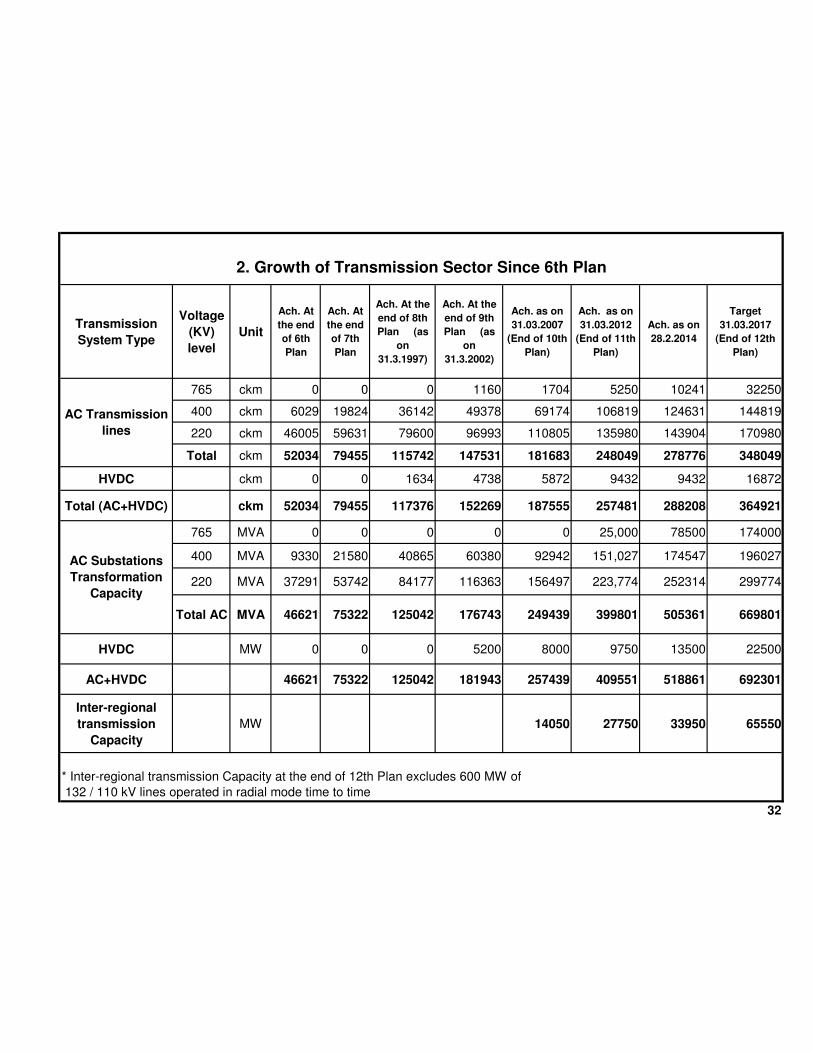
Transmission
System Type
Voltage
(KV)
level
Unit
Ach. At
the end
of 6th
Plan
Ach. At
the end
of 7th
Plan
Ach. At the
end of 8th
Plan (as
on
31.3.1997)
Ach. At the
end of 9th
Plan (as
on
31.3.2002)
Ach. as on
31.03.2007
(End of 10th
Plan)
Ach. as on
31.03.2012
(End of 11th
Plan)
Ach. as on
28.2.2014
Target
31.03.2017
(End of 12th
Plan)
765 ckm 0 0 0 1160 1704 5250 10241 32250
400 ckm 6029 19824 36142 49378 69174 106819 124631 144819
220 ckm 46005 59631 79600 96993 110805 135980 143904 170980
Total ckm 52034 79455 115742 147531 181683 248049 278776 348049
HVDC ckm 0 0 1634 4738 5872 9432 9432 16872
Total (AC+HVDC) ckm 52034 79455 117376 152269 187555 257481 288208 364921
765 MVA 0 0 0 0 0 25,000 78500 174000
400 MVA 9330 21580 40865 60380 92942 151,027 174547 196027
220 MVA 37291 53742 84177 116363 156497 223,774 252314 299774
Total AC MVA 46621 75322 125042 176743 249439 399801 505361 669801
HVDC MW 0 0 0 5200 8000 9750 13500 22500
AC+HVDC 46621 75322 125042 181943 257439 409551 518861 692301
Inter-regional
transmission
Capacity
MW 14050 27750 33950 65550
32
AC Transmission
lines
AC Substations
Transformation
Capacity
* Inter-regional transmission Capacity at the end of 12th Plan excludes 600 MW of
132 / 110 kV lines operated in radial mode time to time
2. Growth of Transmission Sector Since 6th Plan

2004-05 278.00
2005-06 281.00
2006-07 302.00
2007-08 330.00
2008-09 355.00
2009-10 367.00
2010-11 387.00
2011-12 417.56
2012-13 454.60
Year
2005-06
2006-07
2007-08
2008-09
2009-10
2010-11
2011-12
2012-13
2004-05 254 209 75.68
2005-06 260 221 76.36
2006-07 276 227 74.23
2007-08 293 239 77.27
2008-09 340 263 87.13
2009-10 355 268 88.70
2010-11 378 301 115.12
Source:- PFC Reports on the performance of State Power Utilities
33
917.18*
* Provisional # (GrossGen.+ Net Import) / Mid year population
5. Average cost of power supply & average realization ( paise/KWH )
Yearcost of supply
(paise/unit)
Realization(paise/unit)
Including AgricultureOnly
Agriculture
733.5
778.6
818.8
883.63
Per Capita Consumption ( kWh)#
631.4
671.9
717.1
3. All India yearly Coal Consumption for Power Generation (Utilities)
YEARCoal Consumption
Million Tonnes
4. All India Annual per Capita consumption of Electricity Since 2006

Commulative upto 31-1-2014
Sl.
No.
Name of
Scheme State Executing Agency
Installed Capacity
(MW)Cost
Date of
Clearance
1 Hirong HEPArunachal
PradeshM/s. Jaypee Arunachal Power Ltd. 4x125=500
Euro 36.245 Million+ Rs. 5287.80 Cr at
FE rate Rs.67.55/Euro (Completed Cost)10.04.2013
2 Etalin HEPArunachal
PradeshM/s. Etalin Hydro Electric Power Co. Ltd.
10x307+1x19.6
+1x7.4=3097 Rs.25296.95 Cr (Completed Cost) 12.07.2013
3Talong Londa
HEP
Arunachal
PradeshM/s. GMR Londa Hydropower Pvt. Ltd. 3x75=225 Rs.2172.88 Crs (completed cost) 16.08.2013
4 Naying HEPArunachal
PradeshM/s. Naying DSC Power Ltd. 4x250=1000
Rs.9234.17 Crs+US $12.922 Million at FE
rate Rs 51.80/ US $ (completed cost)11/9/2013
5 6x166.67= 1000US$15.864M+Rs.12014.34 rs. FE rate
Rs.54.00/US$ (Completed Cost)17.12.2013
34
Siyom HEP in Arunachal Pradesh by M/s.Siyom Hydro Power Pvt. Ltd.
Plan Year
9th Plan
2002-03
13409
2626
4111
2780
2093
1218
2003-04
2004-05
2781
3884
Pump Sets Energised Villages Electricfied (Nos.)
01.04.11 to 31.03.12
01.04.07 to 31.03.08
01.04.08 to 31.03.09
01.04.09 to 31.03.10
01.04.10 to 31.03.11
5743
10th Plan
3207
316074
1997-98
1998-99
1999-00
2000-01
2001-02
284064
367244
297594
311060
397343
11th Plan
Cumu. upto End of 11th Plan
563238 19027510
Cumu. upto End of 10th Plan
2005-06
2006-07
12632
22594
9769
611750
1576036
44517
482864 # 15455554
2314176
651095
322968
331020
557976
840909
8629
3726
46708
# No. of villages electrified is reduced due to revision of data by states as per new definition of villiage electrification since 2004-05
6. Growth Of Rural Ectrification & Pumpsets Energisation.
7.Status of Hydro Schemes Cleared by the CEA during April 2013 to February, 2014
652913
74575 2963615
557439 18423975
412667
499150