Construction Labor Productivity Benchmarking: A Comparison ...

Feb 13 Primary Productivity: Comparison among Biomes
Central Surinam Reserve, Humid Tropical

How does NPP vary from place to place?
Methods are challenging in forests
Typical field method – tree allometry and diameter increment.
Introduction
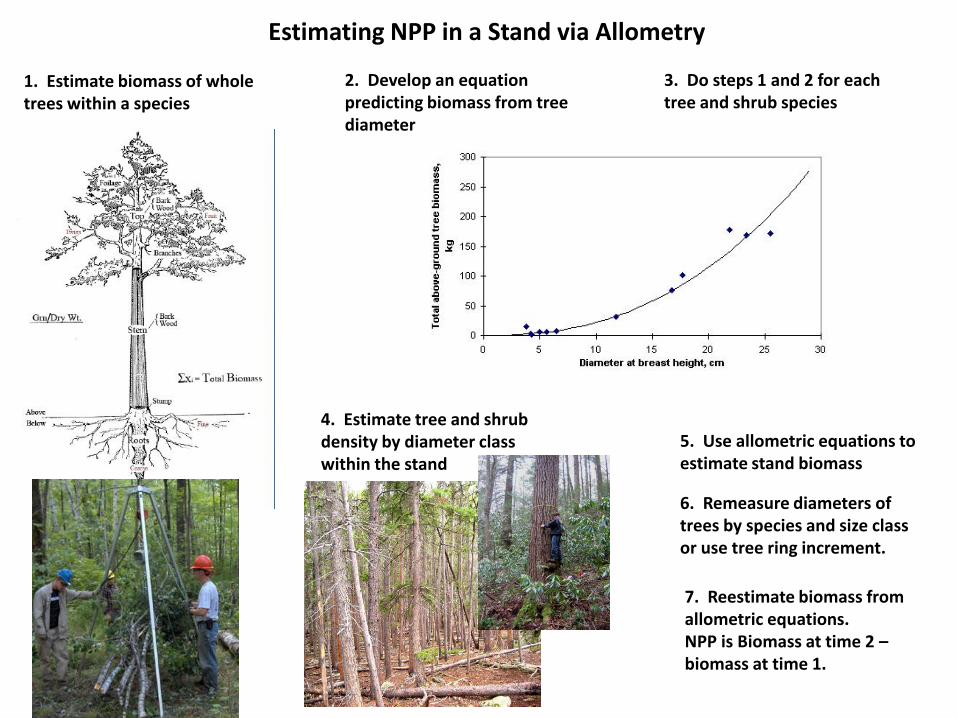
Estimating NPP in a Stand via Allometry
1. Estimate biomass of whole trees within a species
5. Use allometric equations to estimate stand biomass
4. Estimate tree and shrub density by diameter class within the stand
2. Develop an equation predicting biomass from tree diameter
3. Do steps 1 and 2 for each tree and shrub species
6. Remeasure diameters of trees by species and size class or use tree ring increment.
7. Reestimate biomass from allometric equations. NPP is Biomass at time 2 – biomass at time 1.

How does NPP vary from place to place?
• Tree allometry and diameter increment in a stand.
• Compile many stand estimates and average within biomes
Scurlock, J. M. O., and R. J. Olson. 2002. Terrestrial net
primary productivity: a brief history and new worldwide database. Environmental
Reviews (NRC-CNRC) 10:91–110.
Introduction

How does NPP vary from place to place?
• Tree allometry and diameter increment in a stand.
• Compile many stand estimates and average within biomes
• Estimate from satellite data and simulation models
Introduction

Topics
Running et al. 2004. Satellite derived estimates of NPP
Huston and Wolverton 2009. Controversial claim that Running et al. are
wrong about the humid tropics.
Chapin et al. Chapter 6. Reconciling two viewpoints above?
Implications of global patterns of NPP
Introduction

Concept
Can spectral reflectance from satellite data be used to estimate NPP
globally?
NPP from Satellite Data
Steve Running, Univ. Montana Richard Waring, Oregon State Univ.

Methods
• Photosynthesis is driven by visible light.
• Conceptually, GPP in a watered and fertilized plant is a function of
the amount of “good” light absorbed (photosynthetically active
radiation, APAR).
• APAR is a function of radiant energy and leaf area.
NPP from Satellite Data
GPP = APAR x Conversion efficiency or E

Methods
• APAR can be estimated from satellites which measure incoming light
and reflected light.
• NDVI (Normalized difference vegetation index) is based on the ratio
of visible (good) and infrared light (not used).
NPP from Satellite Data
NDVI = (NIR — VIS)/(NIR + VIS)

Methods
• APAR can be estimated from satellites which measure incoming light
and reflected light.
• NDVI (Normalized difference vegetation index) is based on the ratio
of visible (good) and infrared light (not used).
• The key is knowing the fraction of photosyn active light that is
absorbed by the plant.
• Thus, GPP = NDVI times photosyn active radiation times conversion
efficiency, or: GPP = NDVI x PAR x E
• NPP = GPP - respiration
NPP from Satellite Data

Methods
• APAR can be estimated from satellites which measure incoming light
and reflected light.
• NDVI (Normalized difference vegetation index) is based on the ratio
of visible (good) and infrared light (not used).
• The key is knowing the fraction of photosyn active light that is
absorbed by the plant.
• Thus, GPP = NDVI times photosyn active radiation times conversion
efficiency, or:
• GPP = NDVI x PAR x E
• NPP = GPP – respiration
• E varies with veg type and with climatic constraints and so these are
inputs into the model. Nutrients are assumed to influence leaf area
and LAI comes from a look up table.
NPP from Satellite Data

Global Patterns of NPP from Satellite Data
Figure 5. Global terrestrial net primary production (NPP) over 110 million square kilometers for 2002, computed from MODIS (Moderate Resolution Imaging Spectroradiometer) data. Running et al. 2004.

Global Patterns of NPP from Satellite Data
Fig. 7. Three-year (2001–2003) mean and standard deviation of annual GPP, NPP for all vegetated land cover types delineated using MODIS land cover (full name and values for different land cover types are given in Table 1). Zhao et al. 2005.

Global Patterns of NPP from Satellite Data
Chapin et al. 2011.

Huston and Wolverton 2009
Michael Huston, Texas State
“The pattern of terrestrial NPP, based on multiple syntheses and confirmed by satellite images and sophisticated computer models of global vegetation … is [thought to be] greatest in tropical rain forests along the equator and declining toward the temperate regions to the north or south. “ “While temperature and ppt are most favorable in the tropics, they cause soils to be infertile.” “Are wet tropical forests actually high in NPP?”

Huston and Wolverton 2009
Field data from various sources.
Huston and Wolverton 2009
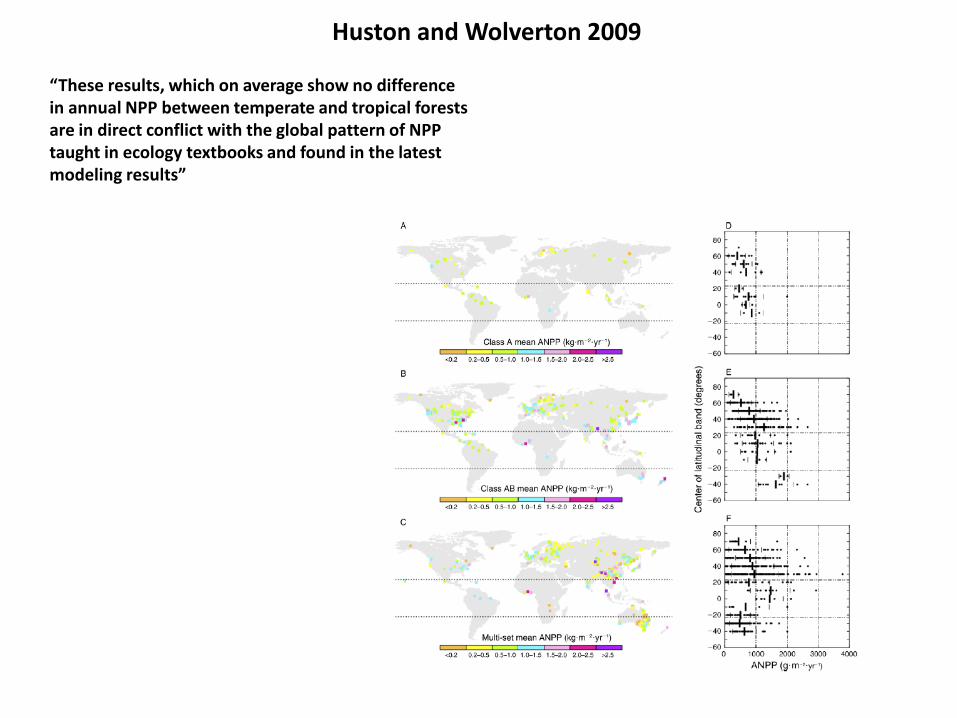
“These results, which on average show no difference in annual NPP between temperate and tropical forests are in direct conflict with the global pattern of NPP taught in ecology textbooks and found in the latest modeling results”

Who is Right? Huston and Wolverton or the World?
Humid Tropical
Location ANPP NPP Method Source
Global tropics (244 sites)
864 +- 96
Field Luyssaert et al. 2007
Amazonia (10 sites)
596-1088 Mean 746
930-1700 Mean 1280
Field Aragao et al. 2009
Neotropics (10 sites)
560-960 Mean 687
Low range 670-1150 High range 1220-2120
Field Clark et al. 2001
Tropical 600-900 Field (Class A sites from ORNL)
Huston an d Wolverton 2009
Amazonia 700-1400 MODIS Zhao et al 2005
Amazonia 800->1100
Regression based on temp
Del Grosso et al. 2008
Location ANPP NPP Method Source
Global (244 sites)
738+-55
Field based on 244 sites
Luyssaert et al. 2007
Walker Branch, TN
540 Field Curtis et al. 2002
Harvard Forrest, NH, 60 yr
300 Field Curtis et al. 2002
Indiana, 80 yrs
529 Field Curtis et al. 2002
MichiganI 90 yr
338 Field Curtis et al. 2002
Wisconsin 66 yrs
300 Field
Curtis et al. 2002
Wisconsin 100+ yrs
750 Reich et al. 1997
Global 450-750 Field Huston and Wolverton 2009
Eastern NA
500-700 MODIS Zhao et al 2005
Humid Temperate Deciduous

Who is Right? Huston and Wolverton or the World?
My Conclusions • Straight up comparison of NPP among places and biomes is very problematic
due to different methods, forest ages, and plain inconsistencies.
• NPP is ca 17% higher in the humid tropics than the humid temperate zone but may not be statistically significant due to high variability.
• Huston and Wolverton overstate slightly their conclusion that there is no evidence of higher annual NPP in the humid tropics and the temperate humid zones (and they offer no statistical evidence).
• MODIS might get the range of annual NPP right in the humid tropics (but is not sensitive to the important differences in soil fertility between the neotropics, Africa, and Asia), but might be a bit low for the EDF in the North America.
• Surprising and lots of work needs to be done.

Who is Right? Huston and Wolverton or the World?
How does Chapin et al. say about how NPP could be high in the tropics despite infertile soils?

Implications of Global Patterns of NPP
Response to Climate Change
Running et al. 2004 Figs 1 and 3
What are the implications of spatial variation in controlling factors for NPP response to climate change?

Implications of Global Patterns of NPP
Response to Climate Change
Running et al. 2004 Figs 1 and 3
1981-1999

Implications of Global Patterns of NPP
Food Quantity and Quality to Herbivores and higher Tropic Levels
Chapin et al. 2011 Figs 6.2
How might plant quality vary with soil fertility in the humid tropics based on the strategies plants use to cope with resource limitations according to Chapin et al.?

Implications of Global Patterns of NPP
Agricultural Productivity
Huston and Wolverton 2009 Fig 4
What are the implications of NPP and soil nutrient patters for agricultural productivity in the tropics?

Scurlock, J.M.O. and R.J. Olson. 2002. Terrestrial net primary productivity: A brief history and a new worldwide
database. Environmental Reviews 10: 91–109.
Zhao, M., F. A. Heinsch, R. R. Nemani, and S. W. Running. 2005. Improvements of the MODIS terrestrial gross and
net primary production global data set. Remote Sensing of Environment 95:164–176.
References