Feature Extraction from Vein Images using Spatial Information and ...
19
Feature Extraction from Vein Images using Spatial Information and Chain Codes Anika Pflug 1 , Daniel Hartung 2 and Christoph Busch 1,2 [email protected] [email protected] [email protected] 1 University of Applied Sciences Darmstadt - CASED, Haardtring 100, 64295 Darmstadt, Germany http://www.h-da.de 2 Norwegian Information Security Laboratory (NISlab) Høgskolen i Gjøvik, Teknologivn. 22, 2815 Gjøvik, Norway http://www.hig.no Abstract. The pattern formed by subcutaneous blood vessels is unique attribute of each individual and can therefore be used as a biometric characteristic. Exploiting the specific near infrared light absorption prop- erties of blood, the capture procedure for this biometric characteristic is convenient and allows contact-less sensors. However, image skeletons ex- tracted from vein images are often unstable, because the raw vein images suffer from low contrast. We propose a new chain code based feature en- coding method, using spatial and orientation properties of vein patterns, which is capable of dealing with noisy and unstable image skeletons. Chain code comparison and a selection of preprocessing methods have been evaluated in a series of different experiments in single and multi- reference scenarios on two different vein image databases. The experi- ments showed that chain code comparison outperforms minutiae-based approaches and similarity based mix matching. Keywords: biometrics, vein recognition, vascular recognition, chain code 1 Introduction Intended to be a robust approach for liveness detection in fingerprint and hand geometry systems, vein recognition evolved to an independent biometric modal- ity over the last decade. Classically the capturing process can be categorized in near and far infrared approaches. Vein recognition systems based on the near in- frared approach are exploiting differences in the light absorption properties of the de-oxygenated blood flowing in subcutaneous blood vessels and the surrounding tissue. Veins become visible, as seen in figure 1, as dark tubular structures. They absorb higher quantities of the infrared light emitted by the LED of the sensor, than the surrounding tissue. Alternatively in the far infrared approach the heat
Transcript of Feature Extraction from Vein Images using Spatial Information and ...
Feature Extraction from Vein Images usingSpatial Information and Chain Codes
Anika Pflug1, Daniel Hartung2 and Christoph Busch1,2
1 University of Applied Sciences Darmstadt - CASED, Haardtring 100,64295 Darmstadt, Germany
http://www.h-da.de2 Norwegian Information Security Laboratory (NISlab)
Høgskolen i Gjøvik, Teknologivn. 22,2815 Gjøvik, Norwayhttp://www.hig.no
Abstract. The pattern formed by subcutaneous blood vessels is uniqueattribute of each individual and can therefore be used as a biometriccharacteristic. Exploiting the specific near infrared light absorption prop-erties of blood, the capture procedure for this biometric characteristic isconvenient and allows contact-less sensors. However, image skeletons ex-tracted from vein images are often unstable, because the raw vein imagessuffer from low contrast. We propose a new chain code based feature en-coding method, using spatial and orientation properties of vein patterns,which is capable of dealing with noisy and unstable image skeletons.Chain code comparison and a selection of preprocessing methods havebeen evaluated in a series of different experiments in single and multi-reference scenarios on two different vein image databases. The experi-ments showed that chain code comparison outperforms minutiae-basedapproaches and similarity based mix matching.
Keywords: biometrics, vein recognition, vascular recognition, chain code
1 Introduction
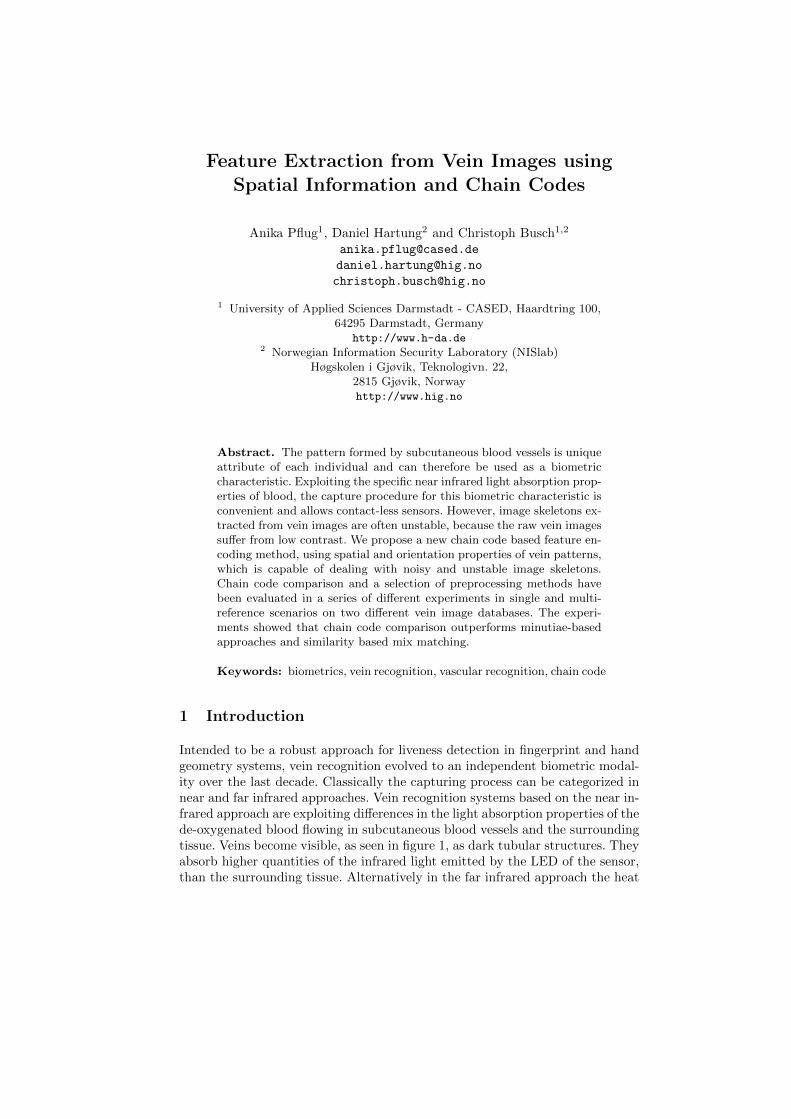
Intended to be a robust approach for liveness detection in fingerprint and handgeometry systems, vein recognition evolved to an independent biometric modal-ity over the last decade. Classically the capturing process can be categorized innear and far infrared approaches. Vein recognition systems based on the near in-frared approach are exploiting differences in the light absorption properties of thede-oxygenated blood flowing in subcutaneous blood vessels and the surroundingtissue. Veins become visible, as seen in figure 1, as dark tubular structures. Theyabsorb higher quantities of the infrared light emitted by the LED of the sensor,than the surrounding tissue. Alternatively in the far infrared approach the heat
2 Anika Pflug, Daniel Hartung and Christoph Busch
(a) (b)
Fig. 1. Finger / wrist vein samples images from: (a) GUC45; (b) UC3M database.
radiation of the body can be measured. Because the temperature of blood istypically higher than the temperature of the surrounding tissue, the tempera-ture gradient between the blood vessels and the tissue can be measured in thisspectrum. Additionally, vein scanners can work contact-less, hence they are con-sidered to be more hygienic than systems requiring direct physical contact. Thismakes them particularly suitable for applications in public areas.
Vein patterns evolve during the embryonic vasculogenesis. Their final struc-ture is mainly influence by the process of cell division and can therefore expectedto be random [7]. Even though scientific research about the uniqueness of veinpatterns is sparse, many resources state that vein patterns are unique amongindividuals. Due to the fact, that the network of blood vessels forming the veinpatterns is located underneath the skin, a vein pattern is hard to forge withoutthe data subject’s knowledge. Known approaches for forging vein patterns notonly include the subject’s knowledge but also his cooperation, such as shown in[38].
It is also expected, that the position of veins is constant over a whole lifetime[14]. Offering the same user convenience as fingerprints while being highly secureagainst forging, vein recognition has been applied in various fields of authenti-cation and access control during the last years such as ATMs or airports. As areaction to increasing misuse of bank cards for instance, a number of large banksin Japan integrated vein recognition systems into their ATMs [32]. The Germanlogistics service DHL decided to use vein recognition for access control to highsecurity areas at their new hub at Leipzig airport [33].
Still vein recognition faces challenges: limitations in capturing in-vivo imagesfrom the inside of the body, as well as ambient sunlight, temperature and vary-ing skin properties like the pigmentation, or the thickness influence the imagequality. As a result of all these factors the raw images delivered by the sensorhave a low contrast, contain noise and a non-uniform brightness. Sophisticatedalgorithms for the preprocessing like contrast enhancement and segmentation aswell as the final feature extraction and comparison are necessary to handle thevariations and the noise.
In this paper we contribute a new chain code based feature extraction methodand investigate its performance in combination with fusion techniques of im-age skeletons. The fusion aims at enhancing the biometric performance and
Feature Extraction using Chain Codes and Spatial Information 3
Preprocessing
Segmentation{3.1}
Contrast Enhancement
{3.1}
Skeletonization
Intersected Skeletons
{3.2.2}
Chain-Code based Error Weighting
{4.3}
Spatial Error Weighting
{4.3}
Chain Code Comparison
Unified Skeletons
{3.2.1}
Experiments
Assignment and Comparison
{4.1, 4.2}
Feature Extraction
{5.3, 6}
Preprocessing{5.2, 6}
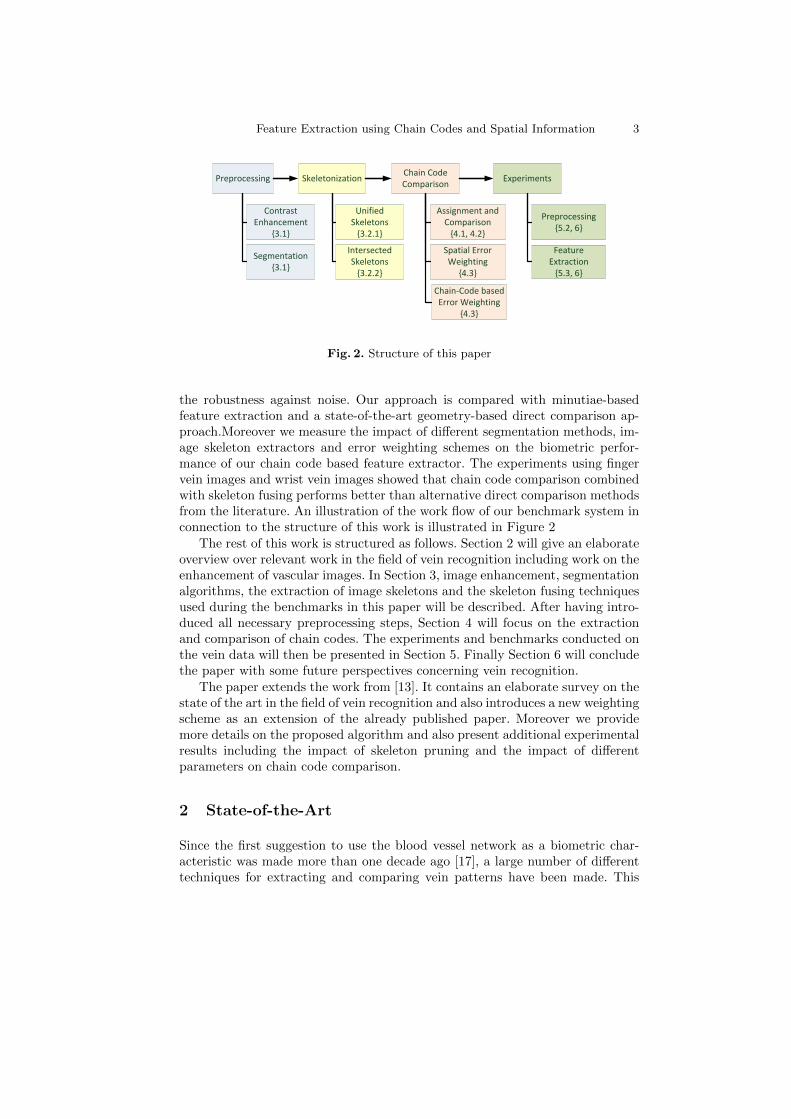
Fig. 2. Structure of this paper
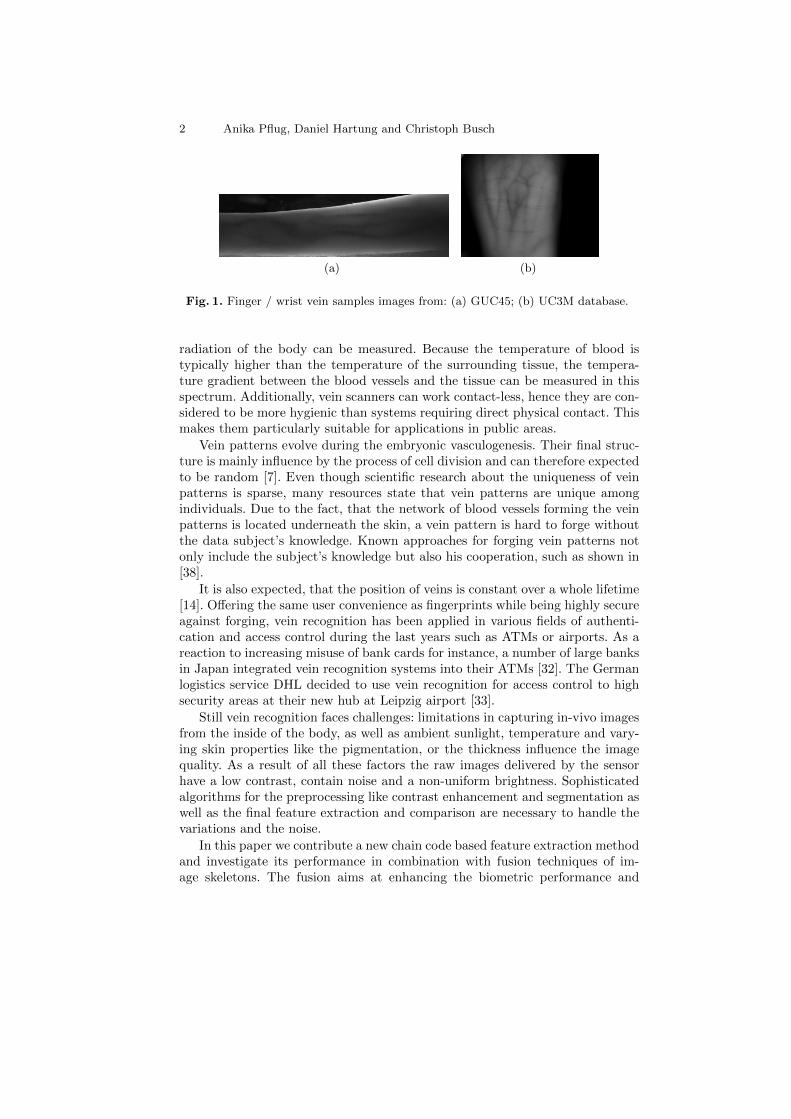
the robustness against noise. Our approach is compared with minutiae-basedfeature extraction and a state-of-the-art geometry-based direct comparison ap-proach.Moreover we measure the impact of different segmentation methods, im-age skeleton extractors and error weighting schemes on the biometric perfor-mance of our chain code based feature extractor. The experiments using fingervein images and wrist vein images showed that chain code comparison combinedwith skeleton fusing performs better than alternative direct comparison methodsfrom the literature. An illustration of the work flow of our benchmark system inconnection to the structure of this work is illustrated in Figure 2
The rest of this work is structured as follows. Section 2 will give an elaborateoverview over relevant work in the field of vein recognition including work on theenhancement of vascular images. In Section 3, image enhancement, segmentationalgorithms, the extraction of image skeletons and the skeleton fusing techniquesused during the benchmarks in this paper will be described. After having intro-duced all necessary preprocessing steps, Section 4 will focus on the extractionand comparison of chain codes. The experiments and benchmarks conducted onthe vein data will then be presented in Section 5. Finally Section 6 will concludethe paper with some future perspectives concerning vein recognition.
The paper extends the work from [13]. It contains an elaborate survey on thestate of the art in the field of vein recognition and also introduces a new weightingscheme as an extension of the already published paper. Moreover we providemore details on the proposed algorithm and also present additional experimentalresults including the impact of skeleton pruning and the impact of differentparameters on chain code comparison.
2 State-of-the-Art
Since the first suggestion to use the blood vessel network as a biometric char-acteristic was made more than one decade ago [17], a large number of differenttechniques for extracting and comparing vein patterns have been made. This

4 Anika Pflug, Daniel Hartung and Christoph Busch
section gives an overview of preprocessing, feature extraction and comparisonalgorithms.
2.1 Preprocessing
As stated above, vein images tend to suffer from low contrast and noise. Thisraises the necessity for contrast enhancement methods. these methods suppressnoise and enhance the local contrast of a vein image. Olsen achieved good resultsby using the STRESS algorithm [16, 21], which not only enhances the image’scontrast but also balances irregular shading. A very fast and simple methodfor contrast enhancement is Wang and Leedham’s normalization method [31].It stretches the contrast by normalizing the grey values contained in the imagesbut is not able to compensate irregular shading.
Another common problem with vein images is noise, which is hard to removewithout loosing information about the vein contours. Due to the imaging tech-nique used by the sensor, the vein’s edges are blurry. Deepika and Kandaswamy[6] solve this problem by using the non-linear diffusion method, which smoothenshomogeneous image regions and preserves the vein’s edges. The GSZ-Shock Fil-ter used by Deepalmar and Madheswaran [5] can also be used for this purpose.If no explicit edge enhancement is needed, noise can be reduced by using aGaussian filter [4] or dyadic wavelet transform [35].
Since many feature extraction algorithms work on image skeletons, the veinimages must be segmented after the noise has been removed. A well-establishedhistogram based segmentation approach was proposed by Otsu [22]. His methodcalculates a number of thresholds based on the grey level histogram in such away that large quantities of similar grey values are considered as representingan object. Wang and Leedham [31] propose an algorithm called Adaptive LocalThresholds, which segments normalized images by using the local brightnessinformation of the image. However this method has problems with blurry edgesand low local contrast.
With their algorithms Repeated Line Tracking [19] and its successor Max-imum Curvature Points [20], Miura and Nagasaka proposed two segmentationmethods, which are robust to irregular shading and blurry edges. The maximumcurvature points algorithm analyses brightness changes in cross-sectional imageprofiles and hence is not affected by a vein’s width and brightness. RepeatedLine Tracking starts at various random points in the vein image and followslight-coloured structures in the image. All pixels visited by the algorithm aretracked in a separate locus image, which is representing the location of the veinsafter the algorithms has terminated. A modified version of repeated line trackingis used by Yang et. al. [37].
A widely used segmentation algorithm in different applications for segmen-tation algorithms is the active contours method as proposed by Chan and Vese[3]. It has been applied to vein images of palm dorsa by Soni et. al. [25]. Activecontours works with the principle of the intensity gradient. At least one initialshape is placed at a random point in the image before active contours moves,
Feature Extraction using Chain Codes and Spatial Information 5
splits, merges and warps this shape until it represents the contours of the veinsdisplayed in the image.
A completely different approach to segmentation are filter based methods.Olsen achieved good segmentation results by using the standard technique ofLaplacian of Gaussian [21], whereas Vlachos and Dermatas designed a dedicatedcompound filter, which is specialized in detecting horizontal, tubular structures[29]. A similar approach has been propose din a earlier publication by Frangiet. al.[9], who also designed a special filter for detecting blood vessels in retinaimages.
2.2 Feature Extraction and Comparison
A multitude of different feature extractors and comparison algorithms have beenproposed over time. This chapter categorizes different comparison algorithmsapplied in vein recognition following the features they are using. We differentiatebetween local comparison methods, which use certain details of the image forfeature extraction, whereas holistic methods use whole images or image skeletonsfor comparison.
Holistic Methods One of the most famous holistic comparison methods is theprincipal component analysis (PCA), which used in numerous pattern recogni-tion tasks. In [15] Khan et. al. applied PCA on image skeletons derived fromhand vein images. Principal component analysis can also be applied directly onenhanced images [30].
Xueyan et. al. derive vein descriptors using invariant moments for distin-guishing the segmented vein images from different subjects. In [10] Guan et.al. have proposed to use bi-directional weighted modular PCA and comparedthe performance of different flavour of their algorithm with each other. In theirstudies, which were conducted with 132 subjects and a self-made capturing de-vice, bi-directional weighted modular PCA showed the best performance amongthe other tested approaches. In a later approach Guan et. al. also evaluate theperformance of an approach based on linear discriminant analysis on the samedatabase, but could not improve the biometric performance with this approach[11].
All feature extraction and comparison algorithms enumerated so far are work-ing with statistical properties of vein images. Chen et. al. [4] propose two algo-rithms for direct point-wise comparison, which overcome problems with affinetransformations. Iterative Closest Point Matching (ICPM) is a modified versionof the Iterative Closest Points algorithm for registering images. The second algo-rithm proposed by Chen et al., Similarity-based Mix-matching (SMM), compen-sates small translation and rotation errors by comparing the segmented versionof one image with the image skeleton of the other one.
Yang and Li [36] propose a set extract energy maps from the responses ofsteerable filters. Based on the amount of energy returned by a filter, they assign agrey value to each block of 5x5 pixels in the vein image. The resulting images with

6 Anika Pflug, Daniel Hartung and Christoph Busch
each pixel representing the average response of a 5x5 block in the vein imageare then compared bit pixel by pixel. They evaluate the performance of theirfeature extraction technique by using a database, which consists of 100 subjects,and showed that their approach performances other approaches. However theydo not provide results using other databases.
In [18], Mirmohamadsadeghi and Drygajlo apply histograms of local binarypatterns (LBP) as well as local derivative patterns (LDP) for feature extractionon palm vein images. In elaborate experiments they evaluated the behaviour ofthese descriptors under different constraints and also measured the performanceof different distance measures for the histograms. They were able to achievepromising results with both descriptors, especially with a histogram intersectionmethod.
Local Methods Known as established features from fingerprints, minutiae havealso been used for extracting features from skeletonized vein images [28]. Becauseminutiae are composed of spatial coordinates, they are subject to translation androtation. This issue is addressed by projecting minutiae points into frequencyspace [34], where translation gets eliminated and rotation becomes translation.Spectral minutiae have also been applied to vein recognition [28] in differentvariants. SML performs an element-wise comparison of two minutiae-spectra infrequency space, whereas SML fast Rotate (SMLFR) compares the spectra whiletrying different translations of them. However the number of minutiae containedin the image can be very small. Instead of comparing their positions directly, itis also possible to use the distances between all minutiae as features [30]. Wangfurther proposes to use the line segments, which are separated by endpoints andbifurcations [31]. Fan et. al. propose to use the watershed algorithm for detectingdominant points from a vein image [8]. Three different filters generate a multiresolution representations of these dominant points, which serve as features.
3 Preprocessing
3.1 Contrast Enhancement and Segmentation
As already mentioned, all vein images have to be enhanced in a preprocessingstage before features can be extracted from the image. The vein images usedduring our experiments are first enhanced by using adaptive non-local meanstaken from [26] followed by the noise suppressing and edge enhancing non-lineardiffusion algorithm [1].
The image enhancement step is followed by a segmentation step. In orderto see, if there is an image segmentation method, which is particularly suitablefor segmenting vein images, three different segmentation methods have beencompared. The first of these methods is Otsu’s histogram-based segmentation[22]. Additionally the active contours algorithm proposed by Chan and Vese [3]and the multi-scale filter method by Frangi et. al. [9] have been tested on thefinger vein images.

Feature Extraction using Chain Codes and Spatial Information 7
(a) Threshold 15 (b) Threshold 35
(c) Threshold 50 (d) Threshold 75
Fig. 3. Skeletons extracted by fast marching skeletonization methods using differentthresholds. The higher the threshold the more details are cut off from the skeleton.
3.2 Skeletonization
In the approaches we used in our experiments, skeleton images are the basis forfeature extraction. Because of noise and poor contrast, these skeletons can lookdifferent, even though they come from the same biometric source. In order toimprove the reliability of the extracted image skeletons and hence the reliabilityof the extracted features, we propose to use fast marching skeletonization asproposed in [27] in combination two different approaches for fusing multipleskeletons to a single one. The goal is to create a more stable version than any ofthe input skeletons.
In fast marching skeletonization incremental indices are assigned to eachpixel on the edge of the figure. Then they are collapsed until only the center lineis left. From the difference between two neighbouring indices in the collapsedfigure, a local weight of a branch can be determined. For those party of theimage skeleton, derived from center part of the figure, the difference betweenthe indices is high and so is their weight. These fine-grained branches are likelyto be artifacts, which were introduced by segmentation errors or noise and canbe removed by applying a threshold. All skeleton points where the differencebetween their indices falls below the threshold are deleted. All other points arekept. Hence, depending on the threshold, more or less of these remote branchesare cut off. The larger the threshold value, the more details are removed (seeFigure 3).
3.3 Skeleton Fusing
In order to further enhance the stability of skeletons, we propose two basic fusingtechniques. The first one is called skeleton unification and produces a skeletonwhich possesses all branches and details, of the input skeletons. The second one,called skeleton intersecting, combines a variable number of input skeletons anddelivers combined skeletons which possess only the branches which the majorityof the input skeletons has in common. The goal is to create a more stable versionthan any of the input skeletons.
8 Anika Pflug, Daniel Hartung and Christoph Busch
(a) (b) (c)
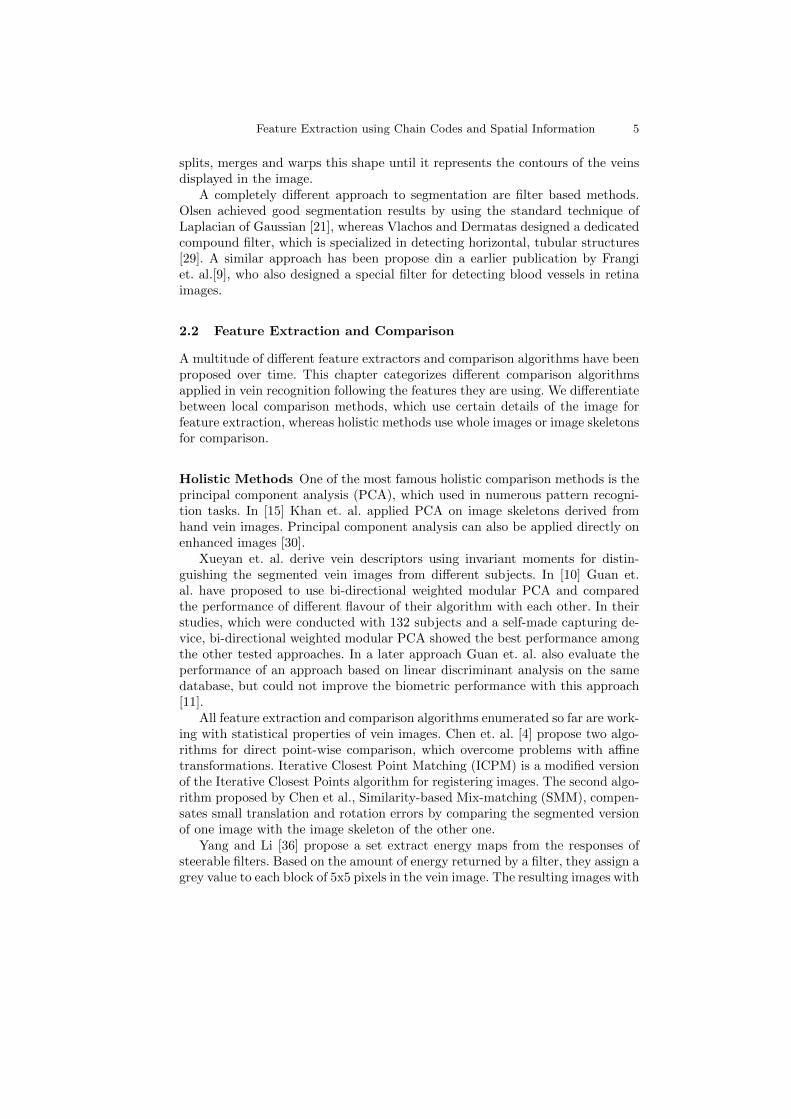
Fig. 4. Fusion based on unification (GUC45 samples) using n = 3 input skeletons:(a) superimposed structure Suni1 ; (b) disk-shape structuring element dilated structureSuni2 ; (c) final unified skeleton Suni.
(a) (b) (c)
Fig. 5. Fusion based on intersection (GUC45 samples) with n = 5 input skeletons andthreshold t = 3: (a) dilated density structure Sint2 ; (b) Sint3 (threshold t applied tosegment Sint2); (c) final intersection skeleton Sint.
Unified Skeletons For deriving a unified skeleton it takes n input skeletons,where n was set to 3 in our experiments. In a first step, all input skeletons Si(x, y)are aligned using ICP [24] and then super-imposed to a common structure Suni1
(Fig. 4(a)).Suni1(x, y) = ∪ni=1Si(x, y) (1)
The registered input skeletons are fused together by dilating the superimposedfigure Suni1 with a disk-shaped structuring element (Fig. 4(b)) to get Suni2 .Afterwards the fast marching skeletonization algorithm [27] is applied to thedilated figure in order to create the unified skeleton Suni (Fig. 4(c)).
Intersected Skeletons The second proposed algorithm creates an intersectedskeleton, which possesses only those features which occur in at least t of theinput skeletons. An example for skeleton intersection with n = 5 input skeletonsis illustrated in Figure 5. The intersected skeleton in Figure 5 consists of thelines which occur in at least three of the five input skeletons (t ≥ 3).
Similarly to the unification approach, the input skeletons Si need to bealigned to each other. Then each of the n input skeletons is dilated with adisk-shaped structuring element, creating binary structures Sint1 . These dilatedskeletons are then added up to form a common unified density structure calledSint2 .
Sint2(x, y) =∑n
Sint1n(x, y) (2)
Sint2 contains values between 0 and n. All input skeletons having a pixel thatis classified as vein at position (x,y) in case of Sint2 = n and 0, meaning thatnone of the input skeletons has any veins at this coordinate. Now a thresholdvalue t with 1 ≤ t ≤ n is applied to Sint2 resulting in Sint3 . In this step all pixels

Feature Extraction using Chain Codes and Spatial Information 9
which at least occur t times in the input skeletons are kept, all other pixels areset to zero.
Sint3(x, y) =
{1 for Sint2 ≥ t0 else
(3)
Finally the fast marching skeletonization is applied again, which results inthe intersected skeleton Sint.
4 Chain Code Comparison
Similarities between two image skeletons can be determined by measuring therelative positions of the skeleton lines as well as their relative orientation. Twolines, which are parallel should be considered to be more similar than two non-parallel skeleton lines. Chain code based feature extraction uses the position ofeach pixel on a skeleton line in combination with its local orientation reflectedby the chain code value for feature encoding. This enables the algorithm to findassociated points between the probe and the reference skeleton and to measureparallelism.
4.1 Preliminaries and Chain Code Assignment
Before chain code values can be assigned to an image skeleton, some preliminarieshave to be met. In a first step the probe and the reference skeleton have tobe aligned with each other. As for skeleton fusing, we used ICP for skeletonalignment. Moreover all points where veins split up (bifurcations) have to beremoved from the image skeleton in order to avoid ambiguities. To make sureall chain codes refer to a common starting point, a reading direction has tobe defined. In our work, chain code extraction started from the bottom leftcorner of the image and ended at the top right corner. If the reading directionis fixed, chain codes extracted from the same shape with different coordinateswill be identical. After the skeletons are computed, the feature extraction moduleiterates over each pixel (x,y) of the skeleton starting from the bottom left corner.Each skeleton pixel is assigned a chain code value according to the relativeposition of its successor in reading direction (see Figure 6). The chain codeassignment for each pixel indexed by its coordinates x and y in the skeletonimage Iskel is defined as
C(x, y) =
1 if Iskel(x + 1, y) = 13 if Iskel(x + 1, y + 1) = 15 if Iskel(x, y + 1) = 17 if Iskel(x− 1, y + 1) = 19 if Iskel(x− 1, y) = 10 else
(4)

10 Anika Pflug, Daniel Hartung and Christoph Busch
4.2 Comparison
After chain code assignment, the similarity between two aligned chain codes Cand C ′ is calculated. The algorithm tries to find pairs of associated points bysearching in orthogonal direction to the local orientation of the chain code valuestored at the currently examined point. The search for associated pixels stopsif either an associated point could be found or if the maximum search depthdmax is exceeded. When a pair of associated skeleton points has been found,their similarity is calculated based on their spatial distance d and the chain codedifference c.Where (x, y) and (x′, y′) are the coordinates of the two associatedpoints and C(x, y) and C ′(x′, y′) are their chain code values.
d =√|x− x′|2 + |y − y′|2 (5)
c = |C(x, y)− C ′(x′, y′)|2 (6)
The local error E at the point (x, y) is then calculated as follows.
E(x, y) =d + c
Emax(7)
Emax =dmax + cmax
2(8)
The values for dmax and cmax denote the maximum search depth and the max-imum possible difference between two chain code values. Following Equation 6and the scheme sketched in Figure 6, cmax = 82 = 64. The local error is stored atposition (x, y) in an error map E, which has the same size as the input images.
The assignment of associated points is depending on the order of the twoskeletons to be compared (probe/reference). If we start with the reference skele-ton and search for an associated pixel in the probe skeleton, a different pixelpair can be identified as if we would have started the other way around. Thisalso means that the local error depends on the order of the two skeletons. Thisis handled by computing two error maps E1 and E2. E1 contains all local errorscalculated by using C as reference and C ′ as probe skeleton and E2 contains alllocal errors using C ′ as probe and C as reference, respectively. The total errormap Etotal is the sum of local errors for each point in the skeleton images andis computed as follows:
Etotal(x, y) = E1(x, y) + E2(x, y) (9)
Finally the similarity score of the skeletons to compare is defined as:
Score = 1−∑
x
∑y Etotal(x, y)∑
x
∑y Emax
(10)
An example of how a point pair can be found by using the local chain codevalue is shown in Figure 6(b). The algorithm starts at the boldly bordered point

Feature Extraction using Chain Codes and Spatial Information 11
5C
79
31(x, y+1) (x+1, y+1)
(x+1, y)
(x+1, y-1)(x, y-1)
(x, y)
X
Y
(a)
3
3
5 3
3
1
3
5 7
5 ...
... 35
3
3
3
7
5 ...
...
C
C
(b)
Fig. 6. Chain code extraction scheme for feature extraction from prepared image skele-tons and calculation of local error using the spacial distance between two associatedpixels and the chain code difference
in C and searches in orthogonal direction for a corresponding point in C ′. Aftertwo mated points have been identified, their local error, which is a value between0 (no error) and 2 (maximum error) is calculated. The global distance measurebetween all points in C and C ′ is, as stated before, the weighted sum of all localerrors.
4.3 Error Weights
Caused by the position of the infrared-LEDs in the sensor and the human phys-iology, the contrast is not the same throughout the image region. Especiallythe edge regions of the image are typically darker than the center region of theimage, which means that local error extracted from the center regions of theimage are more likely to be reliable than local error in the edge regions. In or-der to take this into account a weighting function ω1(x, y) is introduced whichassigns higher weights to the local errors in the center regions of the image. Itcalculates a weight for each local error according to its position in the image.width represents the total width of the image. An threshold value t is defined,which specifies the image region where the weight of the local error decreases.We assigned an error weight smaller than one to the leftmost quarter of errorsand the rightmost quarter of error respectively. Hence the value 0.25 for t wasused here. w denotes the total with of the image.
ω1(x, y) =
y−xw−t if x < w − tt−xt if x > t
1 else(11)

12 Anika Pflug, Daniel Hartung and Christoph Busch
Another possibility of error weighting is based on the fact that most veins inour finger vein image are horizontal, which is caused by the architecture of thesensor. Hence, the portability of being a noise artifacts is assumed to be higher,the more a chain code value differs from horizontal orientation. As the local chaincodes for the veins have already been assigned, this information can additionallybe used for applying a weighting factor based on the local orientation of a line,namely the local chain code value. As mentioned above, chain code values alreadyindicate the local orientation of a skeleton line, hence the local error can alsobe weighted using the chain code values. ω2 calculates a weighting factor foreach error depending on the chain code value C in the comparison image. Theconstant h represents the chain code value assigned to a line with horizontalorientation. For our chain code extraction scheme, h is set to 5.
ω2(C) =
{1− (C − h)2 if C 6= h1 else
(12)
5 Experimental Setup
All experiments were conducted on the basis of a modular vein verification sys-tem implemented in MATLAB. The benchmark system allows for arbitrary com-binations of different segmentation, feature extraction and comparison modules.The main quality measure used for benchmarking different pipeline configura-tions is the equal error rate (EER). We conducted two different experiments, onecovering aspects of preprocessing in connection with chain code comparison andthe second one dealing with the comparison of selected feature extraction, errorweighting and comparison approaches. Information about both experiments andthe databases which were used during the evaluation is provided in this section.
5.1 Vein Databases
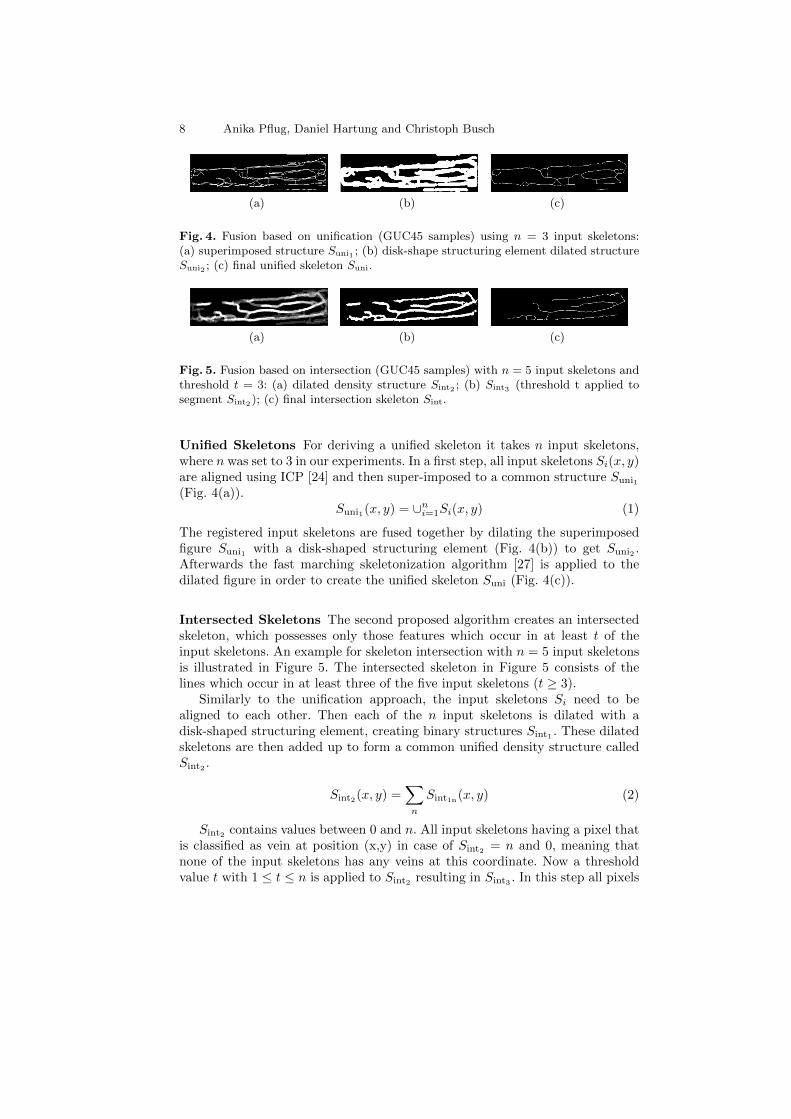
In the experiments two different vein databases were used. Their main propertiesare summarized in Table 1. In both cases the images were captured with aCCD-camera and illuminated with NIR light at a wavelength of 850nm. TheGUC45 dataset contains finger vein images from 45 data subjects collected atGjøvik University College in Norway over a long period of time. Each finger,including the thumbs, was captured two times during each of the 12 sessions,which results in 10800 unique vein images in total. The images from GUC45suffer from low contrast and high noise, which makes it hard for any algorithmto extract stable skeletons and hence to achieve a low error rate on this data.However this fact makes them particularly interesting for research purposes asit allows for exploring the limitations of algorithms for feature extraction andcomparison.
The second database, called UC3M, consists of wrist vein images, which werecollected as described in [23]. The focus of this experiment was to evaluate theeffect of different illumination intensities on the visibility of veins. For each of the
Feature Extraction using Chain Codes and Spatial Information 13
29 users, 6 images were taken for each hand under three different illuminationsettings. This results into 348 images in total.
Database GUC45 UC3M?
Frequency Band NIR (850nm)Sensor non-commercialModality Finger (10) Wrist (2)Data Subjects 45 29Sessions 12 1Images per Session 10 × 2 2 × 6Images 10800 348
Resolution (px) 512 × 240† 640 × 480Depth 8 Bit gray-scale
Table 1. Properties of the biometric vein datasets used in the experimental section.†For the experiment the images are cropped to size 468 × 122 to eliminate most non-finger area. ?Details published in [23].
5.2 Preprocessing
The preprocessing stage consists of three steps, namely image enhancement,segmentation and skeletonization. During image enhancement, noise should beremoved and at the same time image contrast should be enhanced. In orderto meet both criteria, different methods are combined. In a first step, the veinimages are enhanced with adaptive non-local means as proposed by Struc andPavesic [26] followed by non-linear diffusion for noise suppressing and edge en-hancement [1].
The image enhancement step is followed by a segmentation step. In orderto see, if there is an image segmentation method, which is particularly suitablefor segmenting vein images, three different segmentation methods have beenbenchmarked. The first of these methods is Otsu’s histogram-based segmentation[22]. Additionally the active contours algorithm proposed by Chan and Vese [3]and the multi-scale filter method by Frangi et. al. [9] have been tested on thevein images.
Preprocessing is concluded by the skeletonization approach proposed by Teleaand van Wijk [27]. For determining the influence of skeleton pruning on the EER,we compared the biometric performance of different pipelines using chain codecomparison and Otsu’s segmentation algorithm with different thresholds duringthe skeletonization step.
14 Anika Pflug, Daniel Hartung and Christoph Busch
5.3 Feature Extraction Evaluation
For comparing the biometric performance of chain code comparison to otherfeature extraction methods, we evaluated chain code comparison on GUC45and UC3M. We compared the performance to the evaluation results of spectralminutiae (SML and SMLFR) as proposed in [12], Similarity-based Mix-Matching(SMM) [4] and the performance of chain code comparison on single referencesand fused skeletons. In all experiments using fused skeletons, the fused skeletonserved as the reference image and a skeleton extracted from one vein image wasused as the probe image.
We investigate the influence of the maximum search distance on the error rateof chain code comparison and evaluated the discriminating potential of spatialand chain code distance. Furthermore evaluate the influence of the previouslyintroduced error weighting schemes on the EER. For doing this we configureda pipeline using Otsu’s segmentation algorithm, fast marching skeletonizationwith a threshold of 35 and chain code comparison for feature extraction.
6 Results
In our experiments, the segmentation algorithms came to slightly different re-sults, but had a minor effect on the overall system’s performance. The measuredperformance difference between the different segmentation algorithms on GUC45is less than 2% points in terms of the EER. The main difference between theevaluated segmentation approaches was in terms of computation time, howeverthe approach by Frangi and Niessen performed slightly better on the UC3Mdataset.
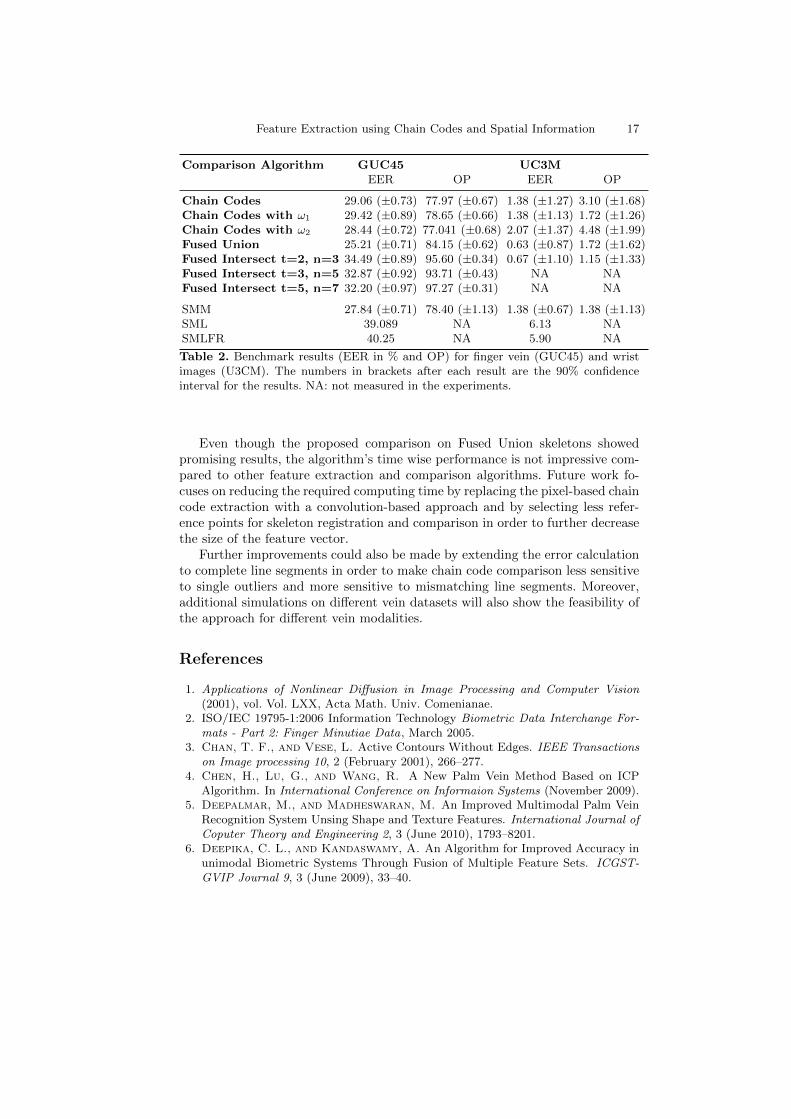
In contrast to the preprocessing step, the impact of the feature extraction andcomparison method is significant. Table 2 summarizes the performance measuresfor each of the datasets. The results for GUC45 were obtained using Otsu’s seg-mentation algorithm, whereas the EER measures on UC3M are based on Frangiand Niessen’s filter-based approach. For each of the evaluated configurationswe measured the EER and the operating point for 0.1% FAR. Furthermore weprovide the 90% confidence intervals for each of the measured performance in-dicators.
The images in GUC45 have a particularly low contrast and therefore cannotbe expected to give good biometric performance. However, GUC45 is a challengefor all tested algorithms. In addition, it also contains multiple samples per sub-ject. The results of the different feature extraction and comparison approacheson GUC45 are summarized in Figure 7. The best performance could be achievedwith chain code comparison using unified skeletons as reference samples andskeletons derived from only one image as probes. This configuration was namedFused Union. With an EER of 24.67% Fused Union outperformed all other con-figurations including SMM, but also single reference chain code comparison. Thisshows that already a simple skeleton fusing approach like the proposed one, en-hances the quality of image skeletons and improves the system performance.

Feature Extraction using Chain Codes and Spatial Information 15
None of the error weighting schemes has an effect on the performance of chaincode comparison. On average, ω2 had a slightly better performance than ω1, butthe confidence value indicate that there is no statistically significant differencebetween these two configurations.
Further investigations on the performance of Fused Union for each finger onGUC45 showed, that the fingers of the left hand appear to be more suited for veinrecognition than the right hand fingers (see Figure 7(b)). In our experiments, thehighest error rate was measured with images from the thumbs (Fingers indices 5and 6). The EER of configurations using intersected skeletons increases the moreinput skeletons are used. A reason for this could be that unstable skeletons haveonly few intersecting parts, which results in fused skeletons with low details. Lessdetails however mean less discriminative power and results in increasing errorrates.
For the UC3M dataset an excellent biometric performance could be mea-sured without the skeleton fusion techniques proposed. SMM and the chain codealgorithm perform at the same level (EER around 1% EER). Skeleton fusioncould reduce the EER to 0.63%, whereas skeleton intersection with n = 3 andt = 2 yielded an EER of 0.67%.
Whereas the segmentation did not have any effect on the EER, the levelof detail in the skeletons had a measurable effect on the performance of chaincode comparison. Figure 7(c) shows, that a careful selection of the thresholdduring fast marching skeletonization can deliver a considerable improvementof the overall performance. The lowest EER could be achieved when using athreshold of 35. The performance obtained from other thresholds is similar andmoves around approximately 31% EER. The only outlier is the threshold 5. Thereason for this are artifacts, introduces by fast marching skeletoization duringthe assignment of indices. These artifacts are removed when applying thresholdsabove 15, but are sill part of the skeleton for low thresholds.
Experiments on the behaviour of chain code comparison using different searchdepths showed, that the careful choice of this parameter is crucial, as the spatialdistance between two skeleton points appeared to have a larger impact on thebiometric performance than the difference between two adjacent chain codes.The reason for this is that there the possible variance between two chain codevalues is small compared to the variance of the spatial distance. The maximumsearch depth should be chosen according to the resolution of the input veinimages and the expected density of the vein patterns. For GUC and UC3M amaximum search depth of 9 pixels delivered the best performance.
7 Conclusion and Future Work
The proposed chain code algorithm as well as the state of the art SMM [4]algorithm perform very similar on the chosen datasets, it seems the qualityof the images is a limiting factor here. Only a multi-reference approach couldfurther improve the results.

16 Anika Pflug, Daniel Hartung and Christoph Busch
(a) (b)
(c) (d)
Fig. 7. ROC curves for (a) selection of feature extraction algorithms and (b) FusedUnion configuration, different finger samples from GUC45 dataset. Finger indices areassigned according to the ISO-standard [2] with indices 1 until 5 for the right handfingers in indices 6 until 10 for the left hand fingers, where counting always startsfrom the thumbs. (c) shows ROC curves for a selection of different thresholds in fastmarching skeletonization using chain code comparison. (d) shows ROC curves for chaincode pipelines and SMM on the UC3M dataset
Feature Extraction using Chain Codes and Spatial Information 17
Comparison Algorithm GUC45 UC3MEER OP EER OP
Chain Codes 29.06 (±0.73) 77.97 (±0.67) 1.38 (±1.27) 3.10 (±1.68)Chain Codes with ω1 29.42 (±0.89) 78.65 (±0.66) 1.38 (±1.13) 1.72 (±1.26)Chain Codes with ω2 28.44 (±0.72) 77.041 (±0.68) 2.07 (±1.37) 4.48 (±1.99)Fused Union 25.21 (±0.71) 84.15 (±0.62) 0.63 (±0.87) 1.72 (±1.62)Fused Intersect t=2, n=3 34.49 (±0.89) 95.60 (±0.34) 0.67 (±1.10) 1.15 (±1.33)Fused Intersect t=3, n=5 32.87 (±0.92) 93.71 (±0.43) NA NAFused Intersect t=5, n=7 32.20 (±0.97) 97.27 (±0.31) NA NA
SMM 27.84 (±0.71) 78.40 (±1.13) 1.38 (±0.67) 1.38 (±1.13)SML 39.089 NA 6.13 NASMLFR 40.25 NA 5.90 NA
Table 2. Benchmark results (EER in % and OP) for finger vein (GUC45) and wristimages (U3CM). The numbers in brackets after each result are the 90% confidenceinterval for the results. NA: not measured in the experiments.
Even though the proposed comparison on Fused Union skeletons showedpromising results, the algorithm’s time wise performance is not impressive com-pared to other feature extraction and comparison algorithms. Future work fo-cuses on reducing the required computing time by replacing the pixel-based chaincode extraction with a convolution-based approach and by selecting less refer-ence points for skeleton registration and comparison in order to further decreasethe size of the feature vector.
Further improvements could also be made by extending the error calculationto complete line segments in order to make chain code comparison less sensitiveto single outliers and more sensitive to mismatching line segments. Moreover,additional simulations on different vein datasets will also show the feasibility ofthe approach for different vein modalities.
References
1. Applications of Nonlinear Diffusion in Image Processing and Computer Vision(2001), vol. Vol. LXX, Acta Math. Univ. Comenianae.
2. ISO/IEC 19795-1:2006 Information Technology Biometric Data Interchange For-mats - Part 2: Finger Minutiae Data, March 2005.
3. Chan, T. F., and Vese, L. Active Contours Without Edges. IEEE Transactionson Image processing 10, 2 (February 2001), 266–277.
4. Chen, H., Lu, G., and Wang, R. A New Palm Vein Method Based on ICPAlgorithm. In International Conference on Informaion Systems (November 2009).
5. Deepalmar, M., and Madheswaran, M. An Improved Multimodal Palm VeinRecognition System Unsing Shape and Texture Features. International Journal ofCoputer Theory and Engineering 2, 3 (June 2010), 1793–8201.
6. Deepika, C. L., and Kandaswamy, A. An Algorithm for Improved Accuracy inunimodal Biometric Systems Through Fusion of Multiple Feature Sets. ICGST-GVIP Journal 9, 3 (June 2009), 33–40.
18 Anika Pflug, Daniel Hartung and Christoph Busch
7. Eichmann, A., Yuan, L., Moyon, D., Lenoble, F., Pardanaud, L., andBrant, C. Vascular Development: From Precursor Cells to Branched Arterialand Venous Networks. International Journal of Developmental Biology 49 (2005),259–267.
8. Fan, K.-C., Lin, C.-L., and Lee, W.-L. Biometric Verification Using thermal Im-ages of Palm-Dorsa Vein-patterns. In 16th IPPR Conference on Computer Vision,Graphics and Image Processing (2003).
9. Frangi, R. F., Niessen, W. J., Vincken, K. L., and Viergever, M. A. Multi-scale Vessel Enhancement Filtering. In Medical Image Computing and Computer-Assisted Interventation. Springer-Verlag, 1998, pp. 130–137.
10. Guan, F., Wang, K., and Wu, Q. Bi-directional weighted modular b2dpcafor finger vein recognition. In Image and Signal Processing (CISP), 2010 3rdInternational Congress on (oct. 2010), vol. 1, pp. 93 –97.
11. Guan, F., Wang, K., and Yang, Q. A study of two direction weighted (2d)2ldafor finger vein recognition. In Image and Signal Processing (CISP), 2011 4th In-ternational Congress on (oct. 2011), vol. 2, pp. 860 –864.
12. Hartung, D., Olsen, M. A., Xu, H., and Busch, C. Spectral Minutiae for VeinPattern Recognition. In The IEEE International Joint Conference on Biometrics(IJCB) (2011).
13. Hartung, D., Pflug, A., and Busch, C. Feature extraction from vein imagesusing spatial information and chain codes. In GI Sicherheit 2012 (March 2012),Lecture Notes in Computer Science, Gesellschaft fr Informatik (GI).
14. Joussen, A. M. Vascular plasticity–the role of the angiopoietins in modulatingocular angiogenesis. Graefes Arch Clin Exp Ophthalmology 239, 12 (December 2001Dec), 972 – 975.
15. Khan, M. H.-M., and Khan, N. M. Feature Extraction of Dorsal hand- VeinPattern Using a Fast Modified PCA Algorithm Based on Cholesky Decompositionand Lanczos Technique. International Journal of Mathematical and ComputerSciences 5, 4 (2009), 230–234.
16. Kol̊as, Ø., Farup, I., and Rizzi, A. Stress: A New Spatial Colour Algorithm(submitted 2011).
17. Kono, M., H, H. U., and Umemura, S. A new method for the identification ofindividuals by using vein pattern matching of a finger. In Proceedings of the 5thsymposium on pattern measurement (Yamaguchi, Japan, 2000), pp. 9–12.
18. Mirmohamadsadeghi, L., and Drygajlo, A. Palm vein recognition with localbinary patterns and local derivative patterns. In Biometrics (IJCB), 2011 Inter-national Joint Conference on (oct. 2011), pp. 1 –6.
19. Miura, N., Nagasaka, A., and Miyatake, T. Feature Extraction of Finger-vein Patterns Based on Repeated Line Tracking and its Application to PersonalIdentification. Machine Vision and Applications 15 (Juli 2004), 194–203.
20. Miura, N., Nagasaka, A., and Miyatake, T. Extraction of Finger-Vein Pat-terns Using Maximum Curvatire Points in Image Profiles. IEICE - Transactionson Information and Systems E90-D, 8 (August 2007), 1185–1194.
21. Olsen, M., Hartung, D., Busch, C., and Larsen, R. Contrast Enhancementand Metrics for Biometric Vein Pattern Recognition. In ICIC (2010).
22. Otsu, N. A Threshold Selection Method from Grey-Level Histograms. Systems,Man and Cybernetics, IEEE Transactions 9 (January 1979), 62–66.
23. Pascual, S., J.E., Uriarte-Antonio, J., Sanchez-Reillo, R., and Lorenz,M. Capturing Hand or Wrist Vein Images for Biometric Authentication Using Low-Cost Devices. In Intelligent Information Hiding and Multimedia Signal Processing(IIH-MSP), 2010 Sixth International Conference on (october 2010), pp. 318 –322.

Feature Extraction using Chain Codes and Spatial Information 19
24. Rusinkiewicz, S., and Levoy, M. Efficient Variants of the ICP Algorithm. Tech.rep., Stanford University, 2001.
25. Soni, M., Gupta, S., and Rao, M. A New Vein Pattern-based VerificationSystem. International Journal of Computer Science and Information Security 8, 1(2010), 58–63.
26. Struc, V., and Pavesic, N. Illumination Invariant Face Recognition by Non-localSmoothing. In Proceedings of the BIOID Multicomm (September 2008).
27. Telea, A., and van Wijk, J. J. An Augmented Fast Marching Method for Com-puting Skeletons and Centerlines. In Joint Eurographics - IEEE TCVG Symposiumon vizalization (2002).
28. Uriarte-Antonio, J., Hartung, D., Pascual, J., and Sanchez-Reillo, R.Vascular biometrics based on a minutiae extraction approach. In Security Tech-nology (ICCST), 2011 IEEE International Carnahan Conference on (oct. 2011),pp. 1 –7.
29. Vlachos, M., and Dermatas, E. Vein Segmentation in Infrared Images UsingCompound Enhancing and Crisp Clustering. Lecture Notes in Computer Science5008/2008 (2008), 393–402.
30. Wang, K., Zhang, Y., Yuan, Z., and Zhuang, D. Hand Vein RecognitionBased on Multi Supplemental Features of Multi-Classifier Fusion Detection. InInternational Conference on Mechatronics and Automation (June 2006).
31. Wang, L., and Leedham, G. A Thermal Hand Vein Pattern Verification System.LNCS: Pattern Recognition and Image Analysis 3687/2005 (2005), 58–65.
32. Watanabe, M., and Endoh, T. Palm Vein Authentication Technology and itsApplications. In Proceedings of the Biometric Consortium Conference (September2005).
33. Witopil, K. Schutzmanahmen im Leipziger DHL-Hub. Protector 6 (June 2008),44–45.
34. Xu, H., and Veldhius, R. N. Spectral Minutae: A Fixed-length Representationof a Minutae Set. In IEEE Computer Society Conference on Computer Vision andPattern Recognition Workshops (2008), pp. 1–6.
35. Xueyan, L., Shuxu, G., and Fengli, G. Vein Pattern Recognition by MomentInvariants. In 1st Conference on Bioinformatics and Biomedical Engineering (July2007).
36. Yang, J., and Li, X. Efficient finger vein localization and recognition. In PatternRecognition (ICPR), 2010 20th International Conference on (aug. 2010), pp. 1148–1151.
37. Yang, W., Xu, X., and Liao, Q. Personal Authentication Using Finger VeinPatterns and Finger-Dorsa Texture Fusion. In MM ’09 Proceedings of the 17thACM international conference on Multimedia (2009).
38. Zeno Geradts, P. S., Ed. FIDIS - Future of Identity in the Information Society(2006).