
Feature-Based Facial Expression Recognition: … · Feature-Based Facial Expression Recognition:...
26
Feature-Based Facial Expression Recognition: Sensitivity Analysis and Experiments With a Multi-Layer Perceptron Zhengyou Zhang Microsoft Research One Microsoft Way Redmond WA 98052, USA E-mail: [email protected] Running head: Feature-Based Facial Expression Recognition: Sensitivity Analysis To appear in International Journal of Pattern Recognition and Artificial Interlligence (IJPRAI) (accepted in 1998) This article is the combined and revised version of the following two conference papers: Z. Zhang, M. Lyons. M. Schuster, and S. Akamatsu, “Comparison between geometry- based and Gabor-wavelets-based facial expression recognition uaing multi-layer percep- tron”, in Proc. IEEE 3rd Int’l Conf. on Automatic Face and Gesture Recognition, Nara, Japan, April 1998. Z. Zhang, “Feature-based facial expression recognition: sensitivity analysis”, in Proc. Post-ECCV Workshop on Advances in Facial Image Analysis and Recognition Technol- ogy, Freiburg, Germany, June 1998. 1
Transcript of Feature-Based Facial Expression Recognition: … · Feature-Based Facial Expression Recognition:...
Feature-Based Facial Expression Recognition: Sensitivity
Analysis and Experiments With a Multi-Layer Perceptron
Zhengyou Zhang
Microsoft Research
One Microsoft Way
Redmond WA 98052, USA
E-mail: [email protected]
Running head: Feature-Based Facial Expression Recognition: Sensitivity Analysis
To appear in International Journal of Pattern Recognition and Artificial Interlligence (IJPRAI)
(accepted in 1998)
This article is the combined and revised version of the following two conference papers:
� Z. Zhang, M. Lyons. M. Schuster, and S. Akamatsu, “Comparison between geometry-based and Gabor-wavelets-based facial expression recognition uaing multi-layer percep-tron”, in Proc. IEEE 3rd Int’l Conf. on Automatic Face and Gesture Recognition, Nara,Japan, April 1998.
� Z. Zhang, “Feature-based facial expression recognition: sensitivity analysis”, inProc.Post-ECCV Workshop on Advances in Facial Image Analysis and Recognition Technol-ogy, Freiburg, Germany, June 1998.
1
Feature-Based Facial Expression Recognition: Sensitivity
Analysis and Experiments With a Multi-Layer Perceptron
Zhengyou Zhang
Abstract
In this paper, we report our experiments on feature-based facial expression recognition within
an architecture based on a two-layer perceptron. We investigate the use of two types of features
extracted from face images: the geometric positions of a set of fiducial points on a face, and a
set of multi-scale and multi-orientation Gabor wavelet coefficients at these points. They can be
used either independently or jointly. The recognition performance with different types of features
has been compared, which shows that Gabor wavelet coefficients are much more powerful than
geometric positions. Furthermore, since the first layer of the perceptron actually performs a
nonlinear reduction of the dimensionality of the feature space, we have also studied the desired
number of hidden units, i.e., the appropriate dimension to represent a facial expression in order
to achieve a good recognition rate. It turns out that five to seven hidden units are probably
enough to represent the space of feature expressions. Then, we have investigated the importance
of each individual fiducial point to facial expression recognition. Sensitivity analysis reveals
that points on cheeks and on forehead carry little useful information. After discarding them,
not only the computational efficiency increases, but also the generalization performance slightly
improves. Finally, we have studied the significance of image scales. Experiments show that facial
expression recognition is mainly a low frequency process, and a spatial resolution of 64 pixels�
64 pixels is probably enough.
Keywords: Facial expression recognition, learning, Gabor wavelets, multilayer perceptron,
sensitivity analysis, image scale.
2
1. Introduction
There are a number of difficulties in facial expression recognition (FER) due to the variation
of facial expression across the human population and to the context-dependent variation even
for the same individual. Even we human beings may make mistakes [9]. On the other hand,
FER by computer is very useful in many applications such as human behavior interpretation and
human-computer interface.
An automatic FER system needs to solve the following problems: detection and location of
faces in a cluttered scene, facial feature extraction, and facial expression classification.
Face detection has been studied by many researchers, and it seems that most successful sys-
tems are based on neural networks [24, 22]. Once a face is detected in the image, the correspond-
ing region is extracted, and is usually normalized to have the same size (for example, the same
distance between two eyes) and the same gray level. In this paper, we do not address the face
detection problem.
Facial feature extraction attempts to find the most appropriate representation of the face im-
ages for recognition. There are mainly two approaches: holistic template-matching systems and
geometric feature-based systems [4]. In holistic systems, a template can be a pixel image or a
feature vector obtained after processing the face image as a whole. In the latter, principal com-
ponent analysis and multilayer neural networks are extensively used to obtain a low-dimensional
representation. In geometric feature-based systems, major face components and/or feature points
are detected in the images. The distances between feature points and the relative sizes of the ma-
jor face components are computed to form a feature vector. The feature points can also form a
geometric graph representation of the faces. Feature-based techniques are usually computation-
ally more expensive than template-based techniques, but are more robust to variation in scale,
size, head orientation, and location of the face in an image. The work to be described in this
paper is, to some extent, an hybrid approach. We first locate a set of feature points, and then
extract a set of Gabor wavelet coefficients at each point through image convolution.
3
Compared with face recognition, there is relatively a small amount of work on facial expres-
sion recognition. The first category of previous work uses image sequences. Suwa et al. [23]
did a preliminary analysis of facial expressions by tracking the motion of twenty identified spots.
Mase [17] uses the means and variances of optical flow data at evenly divided small blocks.
Yacoob and Davis [28] use the inter-frame motion of edges extracted in the area of the mouth,
nose, eyes, and eyebrows. Bartlett et al. [2] use the combination of optical flow and principal
components obtained from image differences. Essa and Pentland [10] builds a dynamic para-
metric model by tracking facial motion over time, which can then be used for analyzing facial
expressions. The second category of previous work tries to classify facial expressions from
static images. Turk and Pentland [26] represent face images by eigenfaces through linear prin-
cipal component analysis. Padgett and Cottrell [19] use an approach similar to eigenfaces but
with seven pixel blocks from feature regions (both eyes and mouth). Cottrell and Metcalfe [5]
use holistic representations based on principal components, extracted by feed forward networks.
Rahardja et al. [20] also use holistic representations with neural networks, but the images are
represented in a pyramid structure. Lanitis et al. [14] use parameterized deformable templates
(flexible models) which take into account both variations in shape and grey-level appearance.
In this paper, we extract two types of features from face images in order to recognize facial
expressions (Sect. 2). The first type is the geometric positions of a set of fiducial points on a face.
The second type is a set of multi-scale and multi-orientation Gabor wavelet coefficients extracted
from the face image at the fiducial points. They can be used either independently or jointly.
The architecture we developed is based on a two-layer perceptron (Sect. 3). The recognition
performance with different types of features will be compared in Sect. 4. Since the first layer
of the perceptron actually performs a nonlinear reduction of the dimensionality of the feature
space, we will also study the desired number of hidden units, i.e., the appropriate dimension to
represent a facial expression in order to achieve a good recognition rate. The importance of each
individual fiducial point to facial expression recognition is studied in Sect. 5 through sensitivity
analysis. Finally, we investigate the significance of image scales for facial expression recognition
4
in Sect. 6.
The use of Gabor waveletts was motivated by the study of Lyons et al. [16]. Through the
analysis based on nonmetric multidimensional scaling (nMDS) [25], Lyons et al. show that there
exists a significant similarity between Gabor coding and human ratings for facial expressions.
We also note that a similar representation of faces has been developed in Wiskott et al. [27]
for face recognition, where they use a labeled graphs, based on a Gabor wavelet transform, to
represent faces, and face recognition is done through elastic graph matching.
2. Data Set and Representation
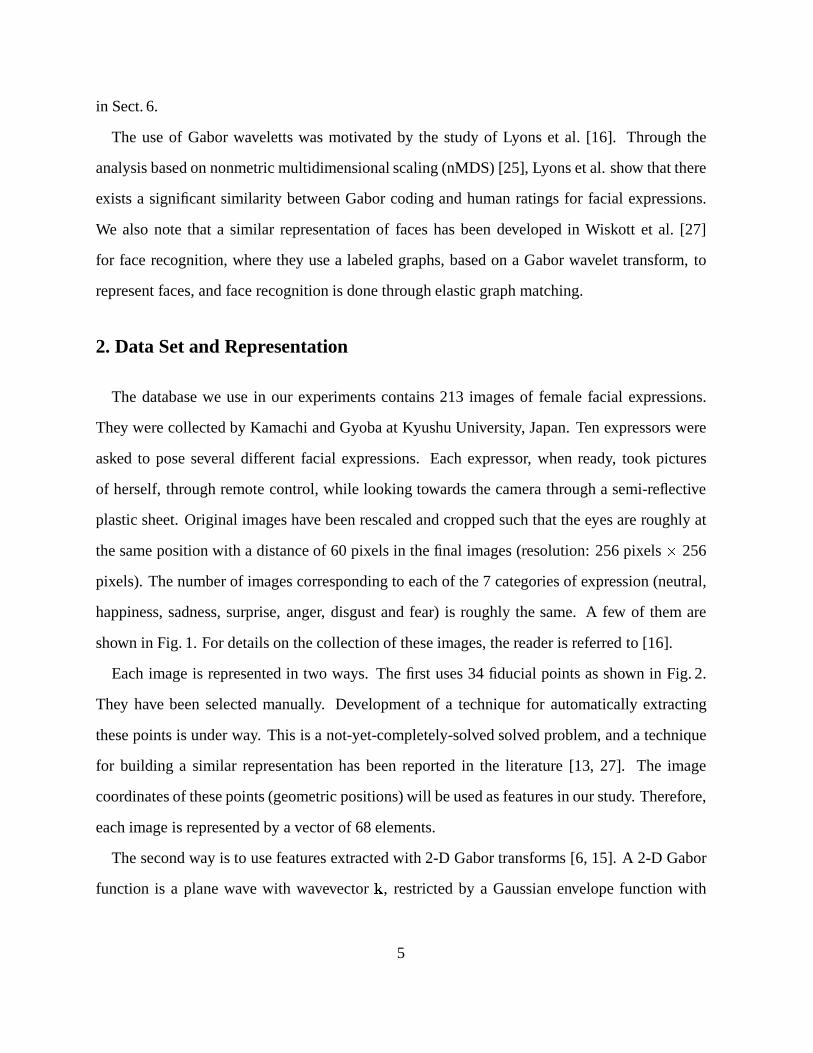
The database we use in our experiments contains 213 images of female facial expressions.
They were collected by Kamachi and Gyoba at Kyushu University, Japan. Ten expressors were
asked to pose several different facial expressions. Each expressor, when ready, took pictures
of herself, through remote control, while looking towards the camera through a semi-reflective
plastic sheet. Original images have been rescaled and cropped such that the eyes are roughly at
the same position with a distance of 60 pixels in the final images (resolution: 256 pixels� 256
pixels). The number of images corresponding to each of the 7 categories of expression (neutral,
happiness, sadness, surprise, anger, disgust and fear) is roughly the same. A few of them are
shown in Fig. 1. For details on the collection of these images, the reader is referred to [16].
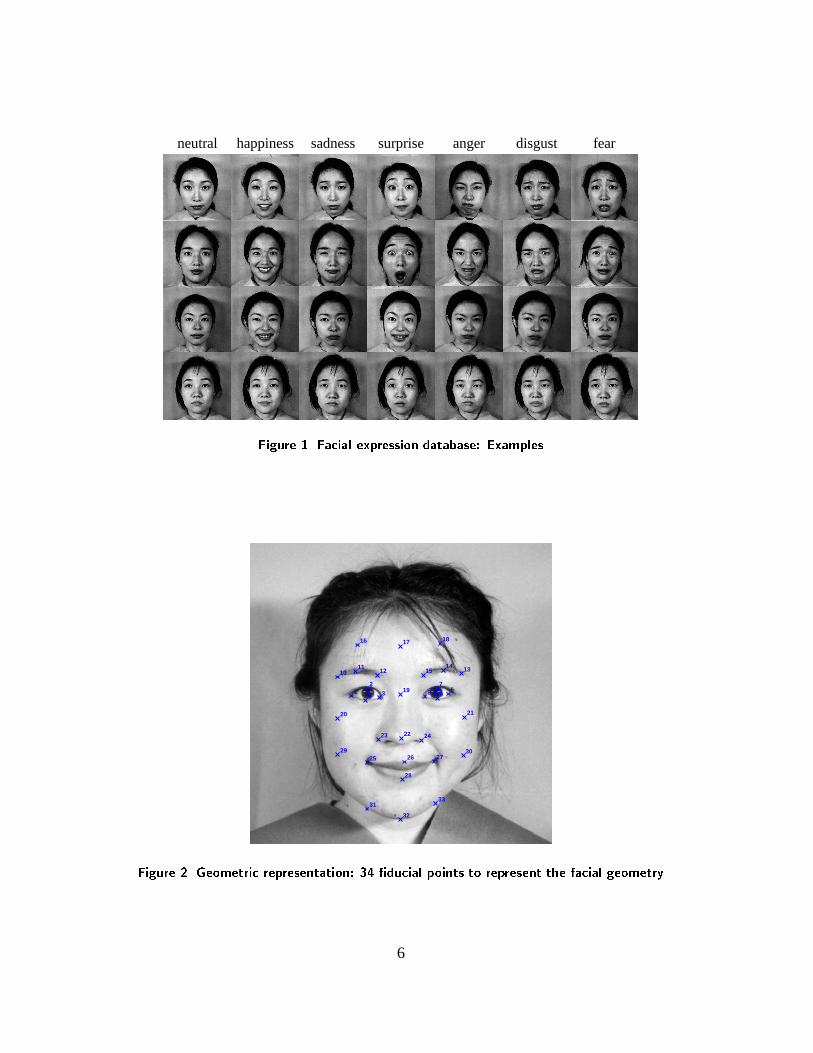
Each image is represented in two ways. The first uses 34 fiducial points as shown in Fig. 2.
They have been selected manually. Development of a technique for automatically extracting
these points is under way. This is a not-yet-completely-solved solved problem, and a technique
for building a similar representation has been reported in the literature [13, 27]. The image
coordinates of these points (geometric positions) will be used as features in our study. Therefore,
each image is represented by a vector of 68 elements.
The second way is to use features extracted with 2-D Gabor transforms [6, 15]. A 2-D Gabor
function is a plane wave with wavevectork, restricted by a Gaussian envelope function with
5
neutral happiness sadness surprise anger disgust fear
Figure 1. Facial expression database: Examples
012
345 67
8 9
1011
12 131415
16 17 18
19
20 21
2223 24
25 26 27
28
29 30
31
32
33
Figure 2. Geometric representation: 34 �ducial points to represent the facial geometry
6
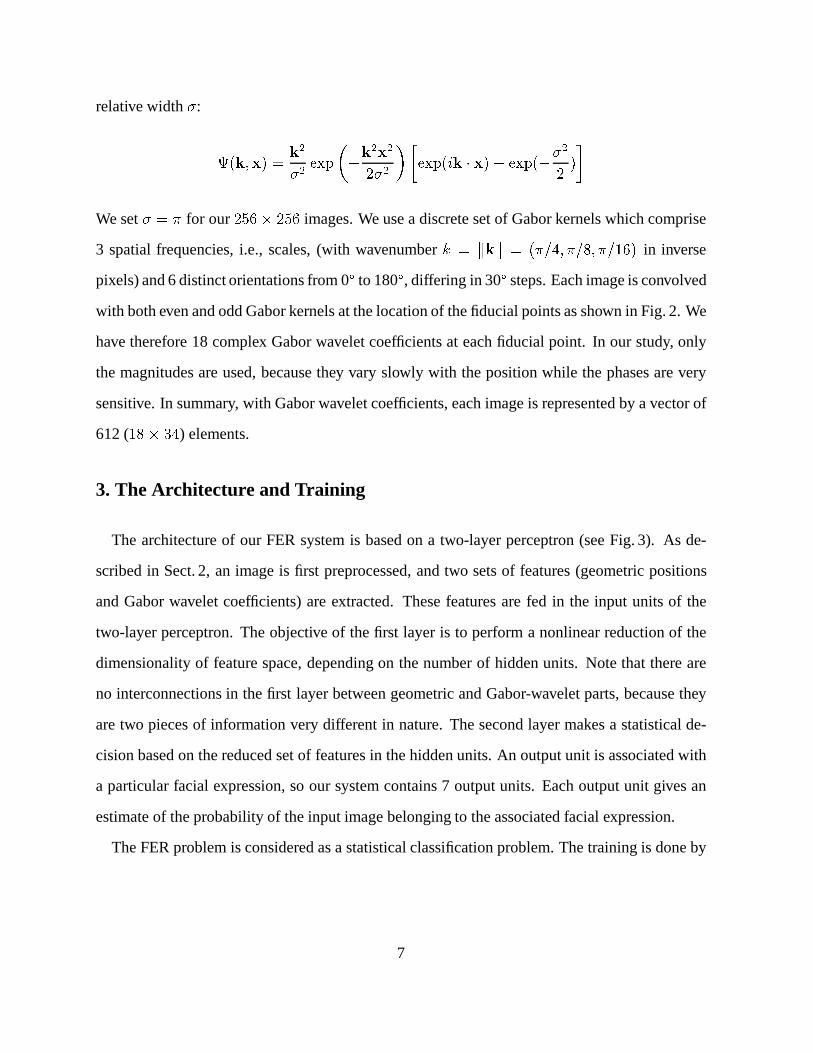
relative width�:
(k;x) =k2
�2exp
��k2x2
2�2
��exp(ik � x)� exp(�
�2
2)
�
We set� = � for our256� 256 images. We use a discrete set of Gabor kernels which comprise
3 spatial frequencies, i.e., scales, (with wavenumberk = kkk = (�=4; �=8; �=16) in inverse
pixels) and 6 distinct orientations from 0� to 180�, differing in 30� steps. Each image is convolved
with both even and odd Gabor kernels at the location of the fiducial points as shown in Fig. 2. We
have therefore 18 complex Gabor wavelet coefficients at each fiducial point. In our study, only
the magnitudes are used, because they vary slowly with the position while the phases are very
sensitive. In summary, with Gabor wavelet coefficients, each image is represented by a vector of
612 (18� 34) elements.
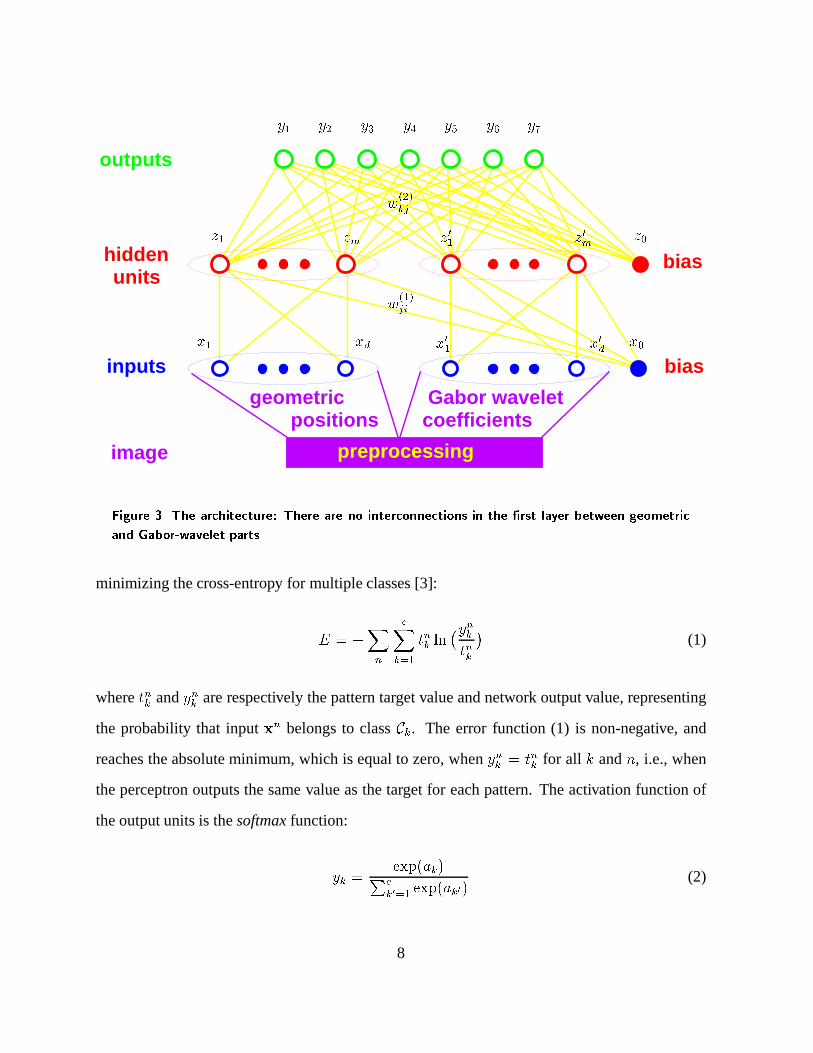
3. The Architecture and Training
The architecture of our FER system is based on a two-layer perceptron (see Fig. 3). As de-
scribed in Sect. 2, an image is first preprocessed, and two sets of features (geometric positions
and Gabor wavelet coefficients) are extracted. These features are fed in the input units of the
two-layer perceptron. The objective of the first layer is to perform a nonlinear reduction of the
dimensionality of feature space, depending on the number of hidden units. Note that there are
no interconnections in the first layer between geometric and Gabor-wavelet parts, because they
are two pieces of information very different in nature. The second layer makes a statistical de-
cision based on the reduced set of features in the hidden units. An output unit is associated with
a particular facial expression, so our system contains 7 output units. Each output unit gives an
estimate of the probability of the input image belonging to the associated facial expression.
The FER problem is considered as a statistical classification problem. The training is done by
7
bias
biasinputs
hiddenunits
outputs
preprocessingimage
geometricpositions
Gabor waveletcoefficients
x1 xd x01 x0d x0
z1 zm z01 z0m z0
w(1)ji
w(2)kj
y1 y2 y3 y4 y5 y6 y7
Figure 3. The architecture: There are no interconnections in the �rst layer between geometric
and Gabor-wavelet parts
minimizing the cross-entropy for multiple classes [3]:
E = �Xn
cXk=1
tnk ln�ynktnk
�(1)
wheretnk andynk are respectively the pattern target value and network output value, representing
the probability that inputxn belongs to classCk. The error function (1) is non-negative, and
reaches the absolute minimum, which is equal to zero, whenynk = tnk for all k andn, i.e., when
the perceptron outputs the same value as the target for each pattern. The activation function of
the output units is thesoftmaxfunction:
yk =exp(ak)Pc
k0=1 exp(ak0)(2)
8
whereak =P
j wkjzj andzj is the output of hidden unitj. This is the soft version of thewinner-
takes-allactivation model in which the unit with the largest input has output+1 while all other
units have output 0. The hidden units use the widely adopted ‘tanh’ activation function:
zj = g(aj) = tanh(aj) �eaj � e�aj
eaj + e�aj(3)
whereaj =P
iwjixi andxi is the value of input uniti.
The two-layer perceptron is trained through Rprop (Resilient propagation) [21], which is a
local adaptive learning scheme, performing supervised batch learning. The idea is to eliminate
the harmful influence of the size of the partial derivative on the weight step. In consequence,
the weight update depends only the sign of the derivative, and is exclusively determined by a
weight-specific, so-called “update-value”�(t)ij :
�w(t)ij =
8>>>>><>>>>>:
��(t)ij if @E
@wij
(t)> 0
+�(t)ij if @E
@wij
(t)< 0
0 otherwise
where @E@wij
(t)denotes the summed gradient information over all patterns of the pattern set. There-
fore, we increase a weight by its update-value if that direction contributes to the reduction of the
overall errorE, and decrease it, otherwise. The update-value�(t)ij itself is adapted based on a
sign-dependent learning process:
�(t)ij =
8>>>>><>>>>>:
�+ ��(t�1)ij if @E
@wij
(t�1)� @E
@wij
(t)> 0
�� ��(t�1)ij if @E
@wij
(t�1)� @E
@wij
(t)< 0
�(t�1)ij otherwise
where0 < �� < 1 < �+. In words, each time the partial derivative of the corresponding weight
9
Rec
ogni
tion
rate
(%
)
Number of hidden units
1 2 3 4 5 6 7 8 9 100
10
20
30
40
50
60
70
80
90
100
training
generalization
20
Rec
ogni
tion
rate
(%
)
Number of hidden units1 2 3 4 5 6 7 8 9 10
0
10
20
30
40
50
60
70
80
90
100
training
generalization
20
Rec
ogni
tion
rate
(%
)
Number of hidden units1 2 3 4 5 6 7 8 9 10
0
10
20
30
40
50
60
70
80
90
100
20
training
generalization
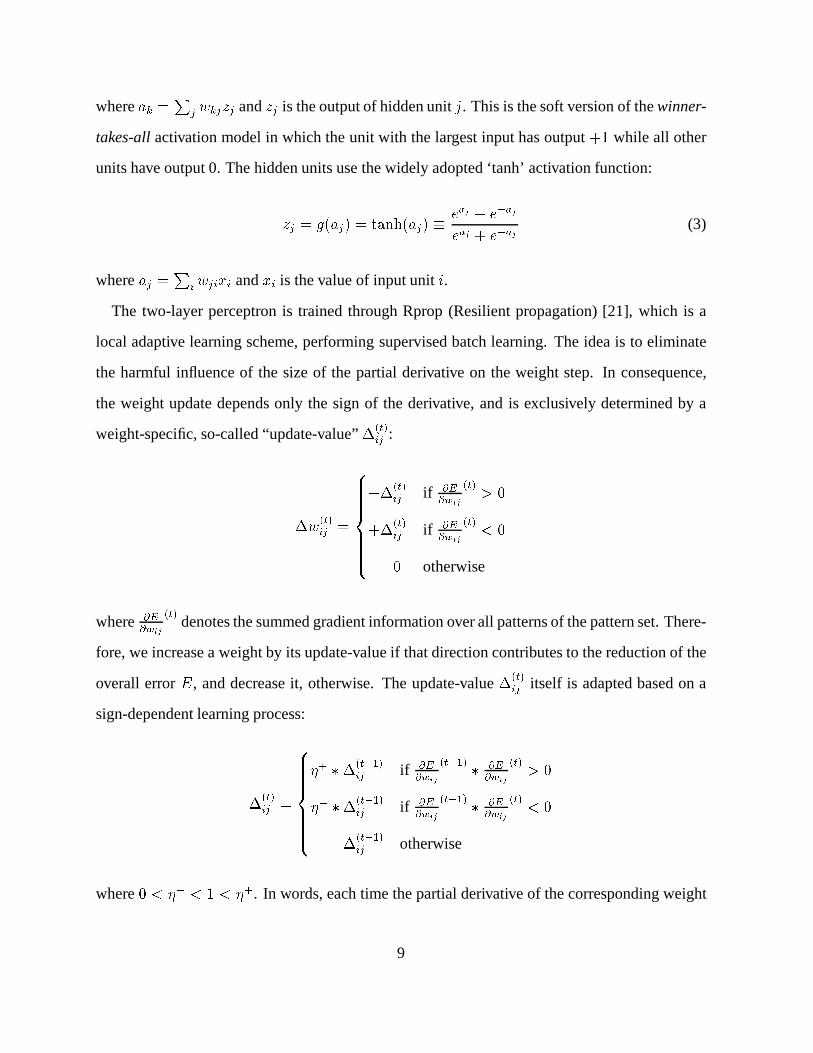
(a) Geometric positions (b) Gabor coefficients (c) Combined information
Figure 4. Recognition rate with respect to the number of hidden units
wij changes its sign, indicating that the last uodate was too big and that the algorithm has jumped
over a local minimum, the update-value�(t)ij is decreased by the factor��; otherwise, it is slightly
increased by a factor�+ in order to accelerate convergence. We use�� = 0:5, �+ = 1:2.
4. Experiments on the number of hidden units
4.1. Computer Recognition Results
Our goal is to develop a recognition system which not only works well on the training data but
also gives good predictions for new data. Since the size of our database is limited (213 images),
we use the cross-validation technique to test different configurations of our FER architecture.
Cross-validation technique is a variant of the test protocols (Jack Knife) used in statistical classi-
fication [8]. Many people have used it in order to improve the statistical reliabilities of the tests
in general [3] and in face recognition in particular [7], More precisely,
� We partition the data set at random intoS distinct segments (we setS = 10).
� We then train a two-layer perceptron using data fromS � 1 of the segments and test
its performance, by evaluating the error function (recognition rate), using the remaining
segment.
10
Rec
ogni
tion
rate
(%
)
Number of hidden units1 2 3 4 5 6 7 8 9 10
0
10
20
30
40
50
60
70
80
90
100
20
geometric
combination
Gabor
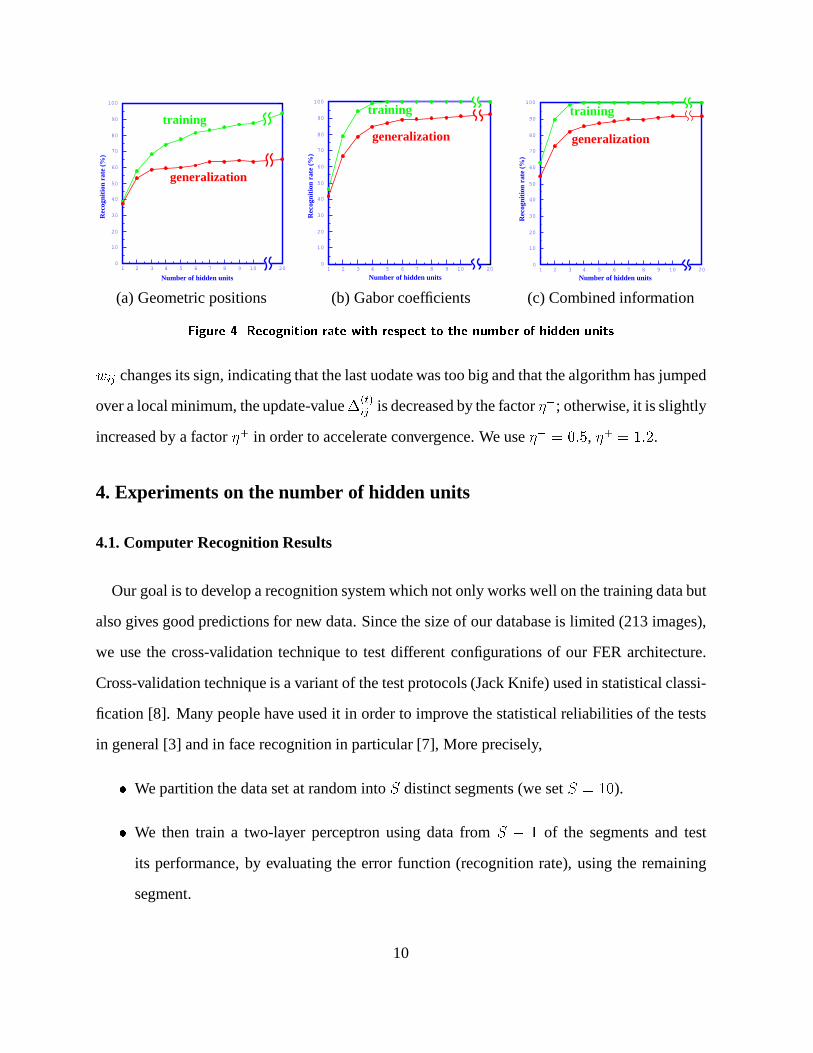
Figure 5. Comparison of the generalized recognition rates
� The above process is repeated for each of theS possible choices of the segment to be
omitted from the training process.
� Finally, we average the results over allS trained two-layer perceptrons.
Since the training is a nonlinear optimization problem, the final result depends on the initial
guess of the weights of the perceptrons. So, each perceptron is furthermore trained ten times
with randomly initialized weights. Thus, the result for each configuration shown below is the
average of the results produced by 100 trained two-layer perceptrons.
We have carried out experiments on the FER using the developed architecture by using geo-
metric positions alone, using Gabor wavelet coefficients alone, and by using the combination of
the two pieces of information. In order to investigate the appropriate dimension to code the facial
expression, we vary the number of hidden units from 1 to 20. The perceptrons with geometric
positions alone were trained by running 250 cycles through all the training data, while other per-
ceptrons were trained by running only 100 cycles. The recognition rates on the training data and
on the test data (generalization) with respect to the number of hidden units are shown in Fig. 4.
For comparison, the generalized recognition rates of the three configurations are displayed in
11
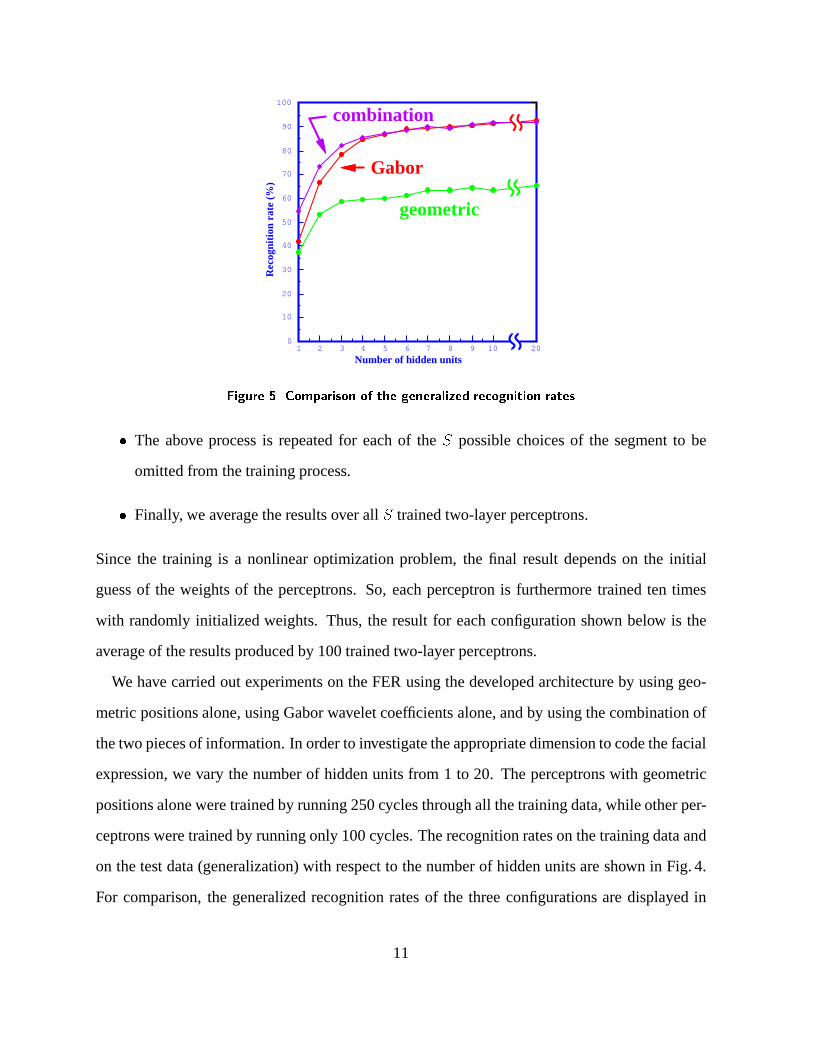
Label: Surprise NN outputs Label: Happiness NN outputsNeu. 0.000Hap. 0.000Sad. 0.000Sur. 1.000Ang. 0.000Dis. 0.000Fear 0.000
Neu. 0.122Hap. 0.720Sad. 0.000Sur. 0.000Ang. 0.000Dis. 0.000Fear 0.158
Label: Disgust NN outputs Label: Fear NN outputsNeu. 0.001Hap. 0.000Sad. 0.428Sur. 0.000Ang. 0.016Dis. 0.555Fear 0.000
Neu. 0.002Hap. 0.000Sad. 0.022Sur. 0.000Ang. 0.001Dis. 0.005Fear 0.970
Figure 6. Examples of correct labeling
Fig. 5.
From the experimental results, we have the following observations:
� Gabor coefficients are much more powerful than geometric positions;
� At least two hidden units are necessary to code reasonably facial expressions;
� Probably from 5 to 7 hidden units are sufficient to code precisely facial expressions;
� Adding geometric positions improves the recognition rate only for low dimensional coding
(with less than 5 hidden units). No improvement is observed when 5 or more hidden units
are used.
The recognition rate (i.e., the agreement with the labeling provided by the expressors) achieved
by our system is 90.1% with 7 hidden units. This should be compared with the agreement be-
tween human subjects and expressors’ labeling. In the study of Lyons et al. [16], 60 human
non-expert subjects were asked to rate each facial image for content of the six basic facial ex-
pressions. In 20.5% of all cases, the category which received the highest rating (averaged over all
12
Label: Anger NN outputs Label: Fear NN outputsNeu. 0.000Hap. 0.000Sad. 0.091Sur. 0.000Ang. 0.224Dis. 0.685Fear 0.000
Neu. 0.010Hap. 0.000Sad. 0.502Sur. 0.000Ang. 0.001Dis. 0.007Fear 0.479
Label: Sadness NN outputs Label: Happiness NN outputsNeu. 0.099Hap. 0.846Sad. 0.052Sur. 0.000Ang. 0.000Dis. 0.002Fear 0.002
Neu. 0.822Hap. 0.017Sad. 0.150Sur. 0.011Ang. 0.000Dis. 0.000Fear 0.000
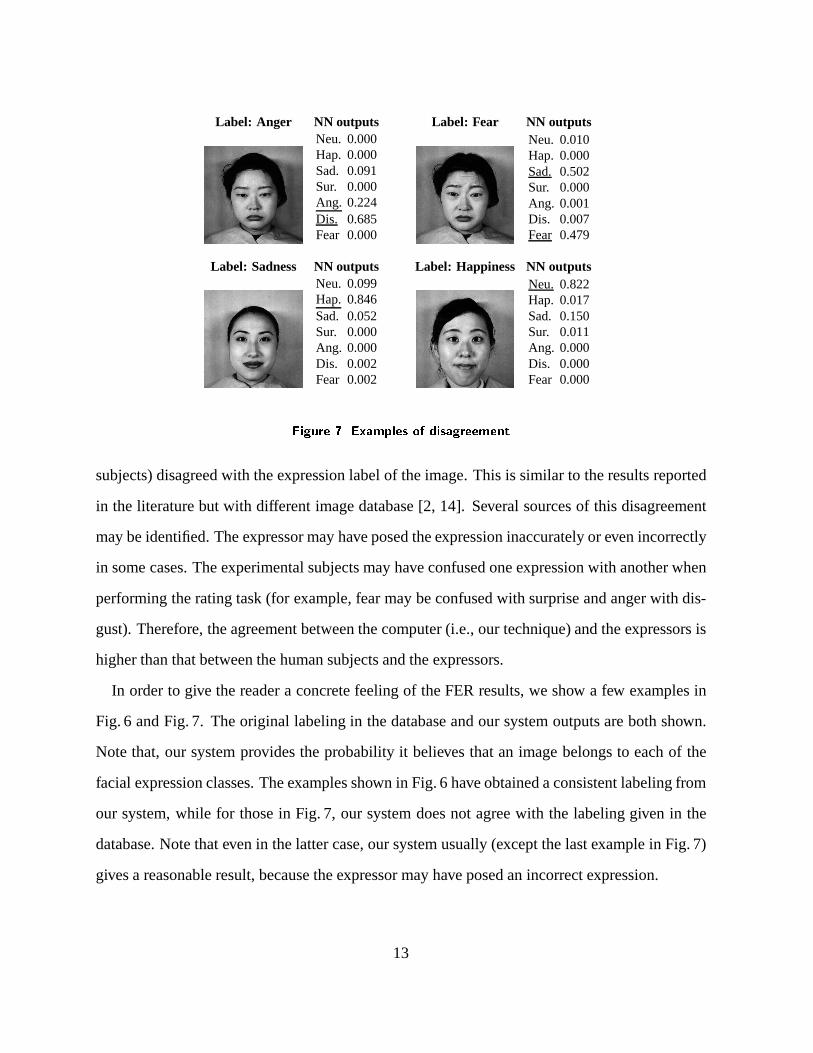
Figure 7. Examples of disagreement
subjects) disagreed with the expression label of the image. This is similar to the results reported
in the literature but with different image database [2, 14]. Several sources of this disagreement
may be identified. The expressor may have posed the expression inaccurately or even incorrectly
in some cases. The experimental subjects may have confused one expression with another when
performing the rating task (for example, fear may be confused with surprise and anger with dis-
gust). Therefore, the agreement between the computer (i.e., our technique) and the expressors is
higher than that between the human subjects and the expressors.
In order to give the reader a concrete feeling of the FER results, we show a few examples in
Fig. 6 and Fig. 7. The original labeling in the database and our system outputs are both shown.
Note that, our system provides the probability it believes that an image belongs to each of the
facial expression classes. The examples shown in Fig. 6 have obtained a consistent labeling from
our system, while for those in Fig. 7, our system does not agree with the labeling given in the
database. Note that even in the latter case, our system usually (except the last example in Fig. 7)
gives a reasonable result, because the expressor may have posed an incorrect expression.
13
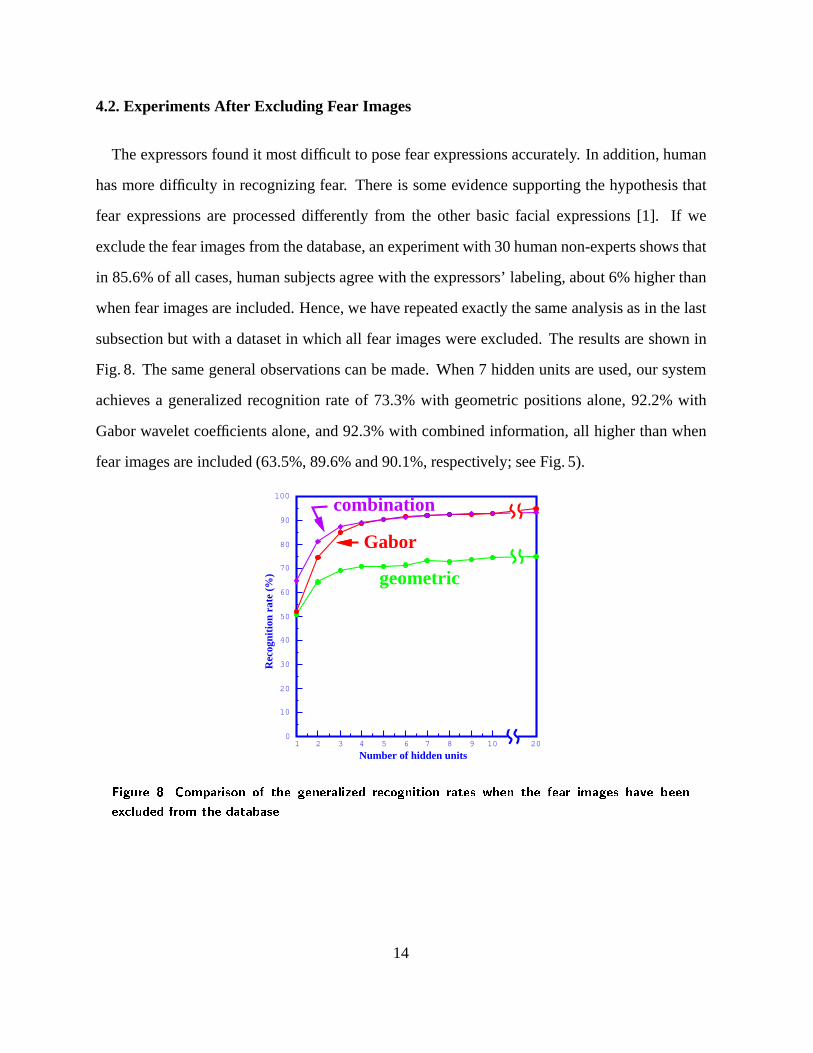
4.2. Experiments After Excluding Fear Images
The expressors found it most difficult to pose fear expressions accurately. In addition, human
has more difficulty in recognizing fear. There is some evidence supporting the hypothesis that
fear expressions are processed differently from the other basic facial expressions [1]. If we
exclude the fear images from the database, an experiment with 30 human non-experts shows that
in 85.6% of all cases, human subjects agree with the expressors’ labeling, about 6% higher than
when fear images are included. Hence, we have repeated exactly the same analysis as in the last
subsection but with a dataset in which all fear images were excluded. The results are shown in
Fig. 8. The same general observations can be made. When 7 hidden units are used, our system
achieves a generalized recognition rate of 73.3% with geometric positions alone, 92.2% with
Gabor wavelet coefficients alone, and 92.3% with combined information, all higher than when
fear images are included (63.5%, 89.6% and 90.1%, respectively; see Fig. 5).
Rec
ogni
tion
rate
(%
)
Number of hidden units1 2 3 4 5 6 7 8 9 10
0
10
20
30
40
50
60
70
80
90
100
20
Gabor
combination
geometric
Figure 8. Comparison of the generalized recognition rates when the fear images have been
excluded from the database
14
5. Sensitivity Analysis of Individual Fiducial Points
In this section, we shall study the importance of each fiducial point. We have used 34 fiducial
points together with their Gabor wavelet coefficients. It is conceivable that each point does not
play the same role, e.g., the points on the cheek should not be very informative.
This study is important for several reasons. First, by removing the least important points, i.e.,
by reducing the dimension of the input space, the computational cost for training and executing
the multilayer perceptron is reduced. Second, the cost for extracting the fiducial points from
images is reduced. Furthermore, the points on the cheek, for example, are difficult to locate
precisely in the image. Third, too many input variables with respect to the training sample size
can harm the performance of a sample discriminant rule. This has been noted by a number of
researchers and practitioners in statistical data analysis [11, 18, 3].
The commonly used technique for dimensionality reduction is the principal component analy-
sis (PCA), which is a linear technique. It does reduce the redundancy between the input variables,
but has a big drawback: this dimensionality reduction is not related to the task at hand (in our
case, FER). Big variation will be retained even though it is not informative for discriminating
different classes. For example, the points on the cheek are difficult to locate precisely in the
images, and therefore, there will be a large variation in the image coordinates. That variation
is, however, not useful for facial expression recognition. On the other hand, the first layer of
our multilayer perceptron also performs reduction of dimensionality, but the reduction is non-
linear and is related to the discrimination power of the features. This nonlinear dimensionality
reduction is thus preferable over the PCA.
We are now more interested in the reduction of the number of fiducial points. We follow the
approach of sensitivity analysis. If an input variable is important in FER, removing it will cause
a significant change in the output, i.e., the derivative of the error function with respect to that
input should be high. In our case, we have a feature vector as input for each fiducial point. Let
x(p) be the feature vector of pointp andx(p)i be itsith element. We compute the gradient of the
15
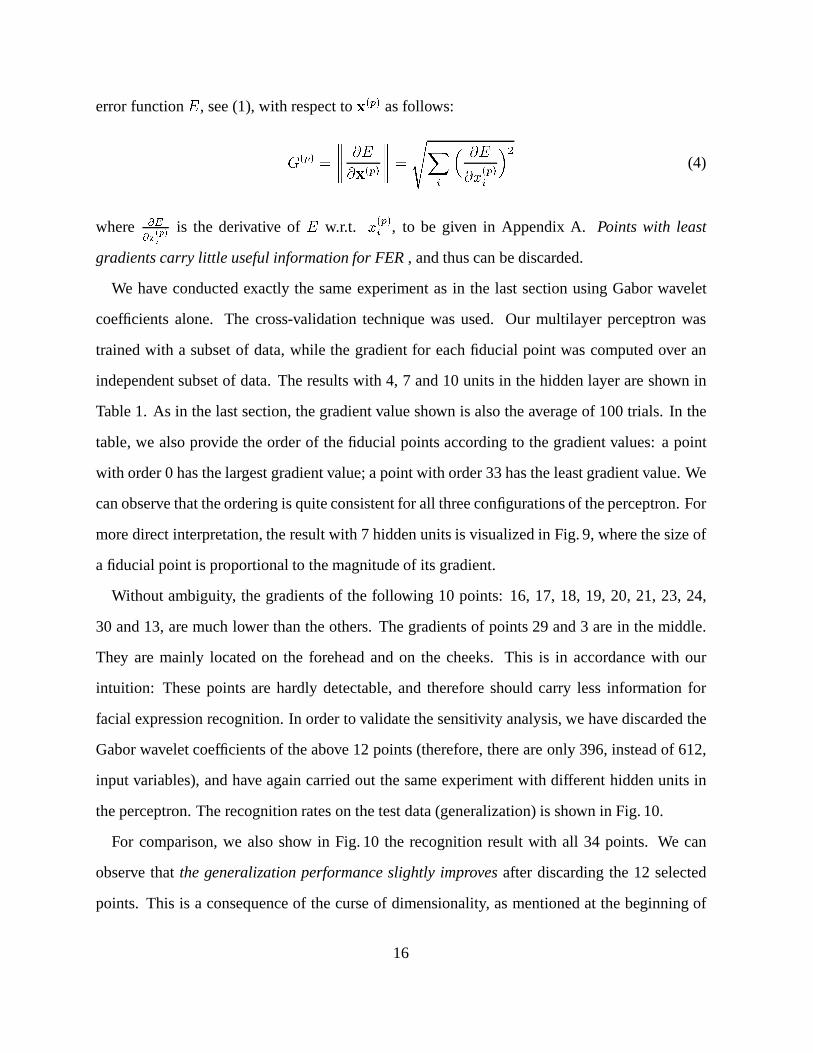
error functionE, see (1), with respect tox(p) as follows:
G(p) =
@E
@x(p)
=sX
i
� @E
@x(p)i
�2(4)
where @E
@x(p)i
is the derivative ofE w.r.t. x(p)i , to be given in Appendix A.Points with least
gradients carry little useful information for FER, and thus can be discarded.
We have conducted exactly the same experiment as in the last section using Gabor wavelet
coefficients alone. The cross-validation technique was used. Our multilayer perceptron was
trained with a subset of data, while the gradient for each fiducial point was computed over an
independent subset of data. The results with 4, 7 and 10 units in the hidden layer are shown in
Table 1. As in the last section, the gradient value shown is also the average of 100 trials. In the
table, we also provide the order of the fiducial points according to the gradient values: a point
with order 0 has the largest gradient value; a point with order 33 has the least gradient value. We
can observe that the ordering is quite consistent for all three configurations of the perceptron. For
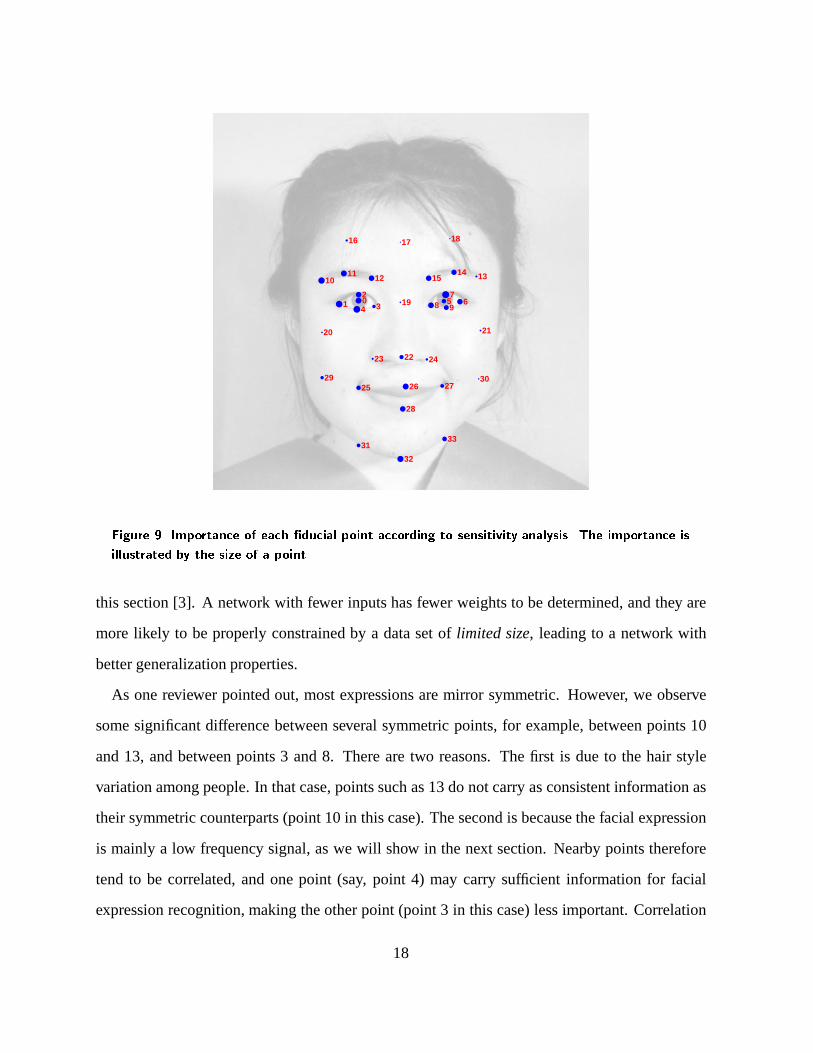
more direct interpretation, the result with 7 hidden units is visualized in Fig. 9, where the size of
a fiducial point is proportional to the magnitude of its gradient.
Without ambiguity, the gradients of the following 10 points: 16, 17, 18, 19, 20, 21, 23, 24,
30 and 13, are much lower than the others. The gradients of points 29 and 3 are in the middle.
They are mainly located on the forehead and on the cheeks. This is in accordance with our
intuition: These points are hardly detectable, and therefore should carry less information for
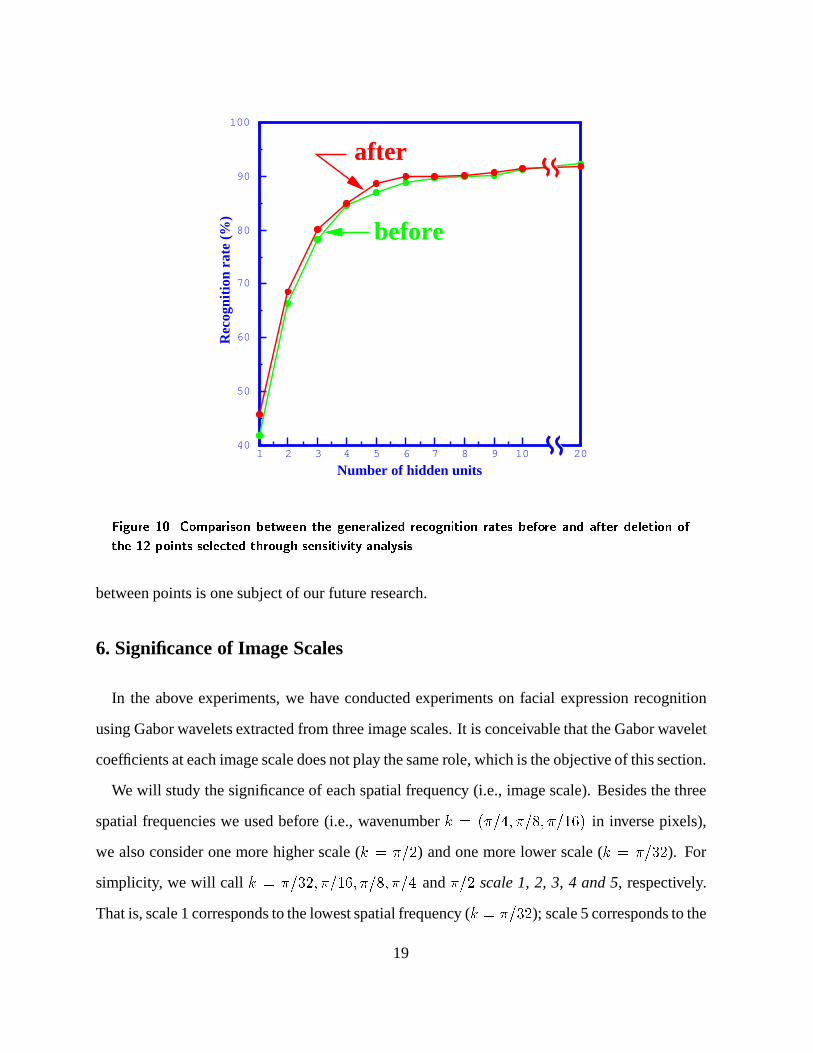
facial expression recognition. In order to validate the sensitivity analysis, we have discarded the
Gabor wavelet coefficients of the above 12 points (therefore, there are only 396, instead of 612,
input variables), and have again carried out the same experiment with different hidden units in
the perceptron. The recognition rates on the test data (generalization) is shown in Fig. 10.
For comparison, we also show in Fig. 10 the recognition result with all 34 points. We can
observe thatthe generalization performance slightly improvesafter discarding the 12 selected
points. This is a consequence of the curse of dimensionality, as mentioned at the beginning of
16
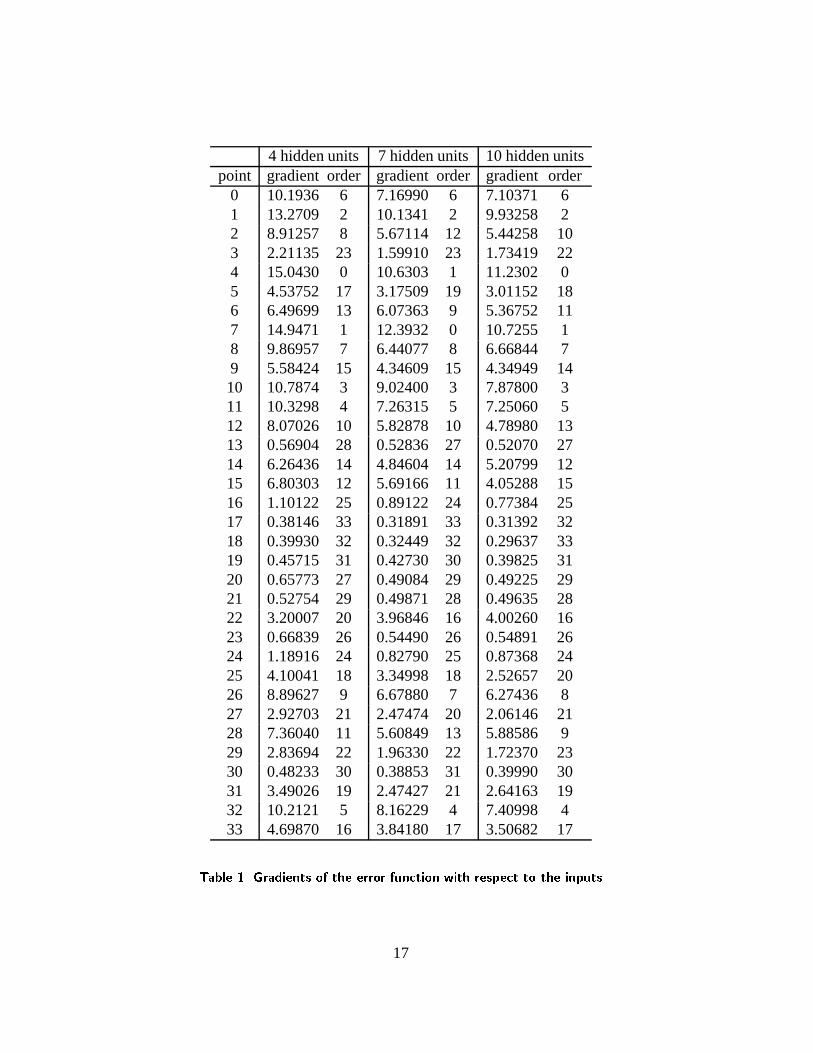
4 hidden units 7 hidden units 10 hidden unitspoint gradient order gradient order gradient order
0 10.1936 6 7.16990 6 7.10371 61 13.2709 2 10.1341 2 9.93258 22 8.91257 8 5.67114 12 5.44258 103 2.21135 23 1.59910 23 1.73419 224 15.0430 0 10.6303 1 11.2302 05 4.53752 17 3.17509 19 3.01152 186 6.49699 13 6.07363 9 5.36752 117 14.9471 1 12.3932 0 10.7255 18 9.86957 7 6.44077 8 6.66844 79 5.58424 15 4.34609 15 4.34949 1410 10.7874 3 9.02400 3 7.87800 311 10.3298 4 7.26315 5 7.25060 512 8.07026 10 5.82878 10 4.78980 1313 0.56904 28 0.52836 27 0.52070 2714 6.26436 14 4.84604 14 5.20799 1215 6.80303 12 5.69166 11 4.05288 1516 1.10122 25 0.89122 24 0.77384 2517 0.38146 33 0.31891 33 0.31392 3218 0.39930 32 0.32449 32 0.29637 3319 0.45715 31 0.42730 30 0.39825 3120 0.65773 27 0.49084 29 0.49225 2921 0.52754 29 0.49871 28 0.49635 2822 3.20007 20 3.96846 16 4.00260 1623 0.66839 26 0.54490 26 0.54891 2624 1.18916 24 0.82790 25 0.87368 2425 4.10041 18 3.34998 18 2.52657 2026 8.89627 9 6.67880 7 6.27436 827 2.92703 21 2.47474 20 2.06146 2128 7.36040 11 5.60849 13 5.88586 929 2.83694 22 1.96330 22 1.72370 2330 0.48233 30 0.38853 31 0.39990 3031 3.49026 19 2.47427 21 2.64163 1932 10.2121 5 8.16229 4 7.40998 433 4.69870 16 3.84180 17 3.50682 17
Table 1. Gradients of the error function with respect to the inputs
17
012
345 67
8 9
1011 12 1314
15
16 17 18
19
20 21
2223 24
25 26 27
28
29 30
31
32
33
Figure 9. Importance of each �ducial point according to sensitivity analysis. The importance is
illustrated by the size of a point.
this section [3]. A network with fewer inputs has fewer weights to be determined, and they are
more likely to be properly constrained by a data set oflimited size, leading to a network with
better generalization properties.
As one reviewer pointed out, most expressions are mirror symmetric. However, we observe
some significant difference between several symmetric points, for example, between points 10
and 13, and between points 3 and 8. There are two reasons. The first is due to the hair style
variation among people. In that case, points such as 13 do not carry as consistent information as
their symmetric counterparts (point 10 in this case). The second is because the facial expression
is mainly a low frequency signal, as we will show in the next section. Nearby points therefore
tend to be correlated, and one point (say, point 4) may carry sufficient information for facial
expression recognition, making the other point (point 3 in this case) less important. Correlation
18
Number of hidden units1 2 3 4 5 6 7 8 9 10
40
50
60
70
80
90
100
Rec
ogni
tion
rate
(%
)
20
before
after
Figure 10. Comparison between the generalized recognition rates before and after deletion of
the 12 points selected through sensitivity analysis
between points is one subject of our future research.
6. Significance of Image Scales
In the above experiments, we have conducted experiments on facial expression recognition
using Gabor wavelets extracted from three image scales. It is conceivable that the Gabor wavelet
coefficients at each image scale does not play the same role, which is the objective of this section.
We will study the significance of each spatial frequency (i.e., image scale). Besides the three
spatial frequencies we used before (i.e., wavenumberk = (�=4; �=8; �=16) in inverse pixels),
we also consider one more higher scale (k = �=2) and one more lower scale (k = �=32). For
simplicity, we will call k = �=32; �=16; �=8; �=4 and�=2 scale 1, 2, 3, 4 and 5, respectively.
That is, scale 1 corresponds to the lowest spatial frequency (k = �=32); scale 5 corresponds to the
19

highest spatial frequency (k = �=2). We have performed exactly the same type of experiments
as in Sect. 4 by using the Gabor wavelet coefficients of only one particular image scale (The fear
images are included). The results of the generalized recognition rates with respect to the number
of hidden units are shown in Fig. 11. A subset of the results, corresponding to 7 hidden units, is
shown in Fig. 12. It is clear that facial expression recognition by computer is mainly a low spatial
frequency process. In particular, scales 2 and 3 are most significant to the recognition. Recall
that the images we use have a spatial resolution of 256 pixels� 256 pixels. Therefore, the above
result of our study reveals that a resolution of64 pixels� 64 pixelsor lower is probably enough
for facial expression recognition, which is in accordance of the general belief that a resolution of
16 pixels� 16 pixels is the minimum resolution that allows face identification [12].
Rec
ogni
tion
rate
(%
)
Number of hidden units1 2 3 4 5 6 7 8 9 10 20
0
10
20
30
40
50
60
70
80
90
100
scale 5
scale 4
scale 1
scale 3scale 2
Figure 11. Generalized recognition rates of di�erent image scales with respect to the number of
hidden units
20
Rec
ogni
tion
rate
(%
)
scale of Gabor kernels1 2 3 4 5
0
10
20
30
40
50
60
70
80
90
100
Figure 12. Generalized recognition rates with respect to image scales for 7 hidden units
7. Conclusion
In this paper, we have developed an architecture based on a two-layer perceptron for recog-
nizing facial expressions. We have first compared the use of two types of features extracted from
face images. The first type is the geometric positions of a set of fiducial points on a face. The
second type is a set of multi-scale and multi-orientation Gabor wavelet coefficients extracted
from the face image at the fiducial points. They can be used either independently or jointly.
Comparison of the recognition performance with different types of features shows that Gabor
wavelet coefficients are much more powerful than geometric positions and that the agreement
between computer and the expressors’ labeling is higher than that between human subjects and
the expressors’ labeling.
Furthermore, since the first layer of the perceptron actually performs a nonlinear reduction
21
of the dimensionality of the feature space, we have also studied the desired number of hidden
units, i.e., the appropriate dimension to represent a facial expression in order to achieve a good
recognition rate. It turns out that at least two hidden units are necessary to code reasonably
facial expressions and that five to seven hidden units are probably enough to give a precise
representation.
Then, we have investigated the importance of each individual fiducial point to facial expression
recognition. Sensitivity analysis reveals that points on cheeks and on forehead carry little useful
information. After discarding them, not only the computational efficiency increases, but also the
generalization performance slightly improves. This has an important consequence: we only need
to extract features in the eyes and mouth regions from images. Note that we have only studied
the sensitivity of each individual fiducial point on a face. There may exist strong correlations
between the features of some points such as those on both eyes. This is one subject of our future
research.
Finally, we have studied the significance of image scales. Experiments show that facial ex-
pression recognition is mainly a low frequency process, and a spatial resolution of 64 pixels�
64 pixels or lower is probably enough.
Acknowledgment
Part of this work was done when the author was on sabbatical at ATR (Advanced Telecommu-
nications Research Institute International), Kyoto, Japan, in 1997. The draft version of this paper
was prepared when the author was still employed at INRIA Sophia-Antipolis, France. Michael
Lyons, Michael Schuster, and Shigeru Akamatsu (all from ATR, Japan) have contributed to the
initial stage of the work. The author thanks Miyuki Kamachi and Jiro Gyoba (Kyushu University,
Japan) for providing the facial expression database, and Michael Lyons for computing the Gabor
wavelet coefficients. The author appreciates the comments from the reviewers.
22
A Derivative Evaluation
We now calculate@E=@xi, the derivative of the error functionE given in (1) with respect to
the input variablexi. The error function (1) can be rewritten as
E =Xn
En with En = �cX
k=1
tnk ln�ynktnk
�(5)
Then,
@E
@xi=Xn
@En
@xi(6)
Using the chain rule for partial derivatives, we have
@En
@xi=
cXk=1
@
@yk
��tnk ln
�ynktnk
�� @yk@xi
= �cX
k=1
tnkyk
@yk@xi
(7)
where the summation runs over all output units, andyk is the softmax function (2). Note thatyk
depends on inputxi via the hidden units. By applying the chain rule, the derivative of outputyk
with respect to inputxi, @yk=@xi, is computed as follows:
@yk@xi
=mXj=1
@yk@aj
@aj@xi
=mXj=1
w(1)ji
@yk@aj
(8)
where the summation runs over all units in the hidden layer. The evaluation of@yk=@aj can be
done in a recursive way:
@yk@aj
=cX
k0=1
@yk@ak0
@ak0
@aj=
cXk0=1
@yk@ak0
�g0(aj)w
(2)k0j
�
= g0(aj)cX
k0=1
w(2)k0j
@yk@ak0
(9)
23
whereg0(aj) is the first derivative of the activation function (3), and from (2),@yk=@ak0 is given
by
@yk@ak0
= yk0�kk0 � yk0yk (10)
where�kk0 is the Kronecker delta symbol, and is equal to 1 ifk = k0 and 0 otherwise.
In summary, we can compute@E=@xi as follows. First, apply the input vectorxn of pattern
n and propagate forward to obtain the activations of all of the hidden and output units in the
multilayer perceptron. Second, back-propagate the derivatives@yk@aj
according to the recursive
formula (9), starting with (10), for all hidden units. Third, back-propagate to the inputs to obtain
the derivative@yk=@xi using (8). The second and third steps are repeated for each outputyk
and each inputxi. Finally,@En=@xi is calculated using (7). Repeat the above procedure for all
patterns and use (6) to compute@E=@xi.
References
[1] R. Adolphs, D. Tranel, H. Damasio, and A. Damasio. Impaired recognition of emotion in facial
expressions following bilateral damage to the human amygdala.Nature, 372:669–672, 1994.
[2] M. Bartlett, P. Viola, T.Sejnowski, L. Larsen, J. Hager, and P. Ekman. Classifying facial action.
In D. Touretzky, M. Mozer, and M. Hasselmo, editors,Advances in Neural Information Processing
Systems 8. MIT Press, Cambridge, MA, 1996.
[3] C. Bishop.Neural Networks for Pattern Recognition. Clarendon Press, Oxford, 1995.
[4] R. Chellappa, C. Wilson, and S. Sirohey. Human and machine recognition of faces: A survey.
Proceedings of the IEEE, 83(5):705–740, May 1995.
[5] G. Cottrell and J. Metcalfe. Face, gender and emotion recognition using holons. In D. Touretzky, ed-
itor, Advances in Neural Information Processing Systems 3, pages 564–571. Morgan and Kaufman,
San Mateo, 1991.
24
[6] J. Daugman. Complete discrete 2-D Gabor transforms by neural networks for image analysis and
compression.IEEE Transactions on Acoustic, Speech and Signal Processing, 36(7):1169–1179,
July 1988.
[7] B. Duc, G. Maı̂tre, S. Fischer, and J. Bigun. Person authentication by fusing face and speech
information. In J. Bigun, G. Chollet, and G. Borgefors, editors,Audio and Video Based Person
Authentication - AVBPA97, volume LNCS-1206, pages 311–318. Springer, 1997.
[8] B. Efron and R. Tibshirani.An introduction to the Boostrap. Chapman & Hall, New York, 1993.
[9] P. Ekman and W. Friesen.Unmasking the Face: A guide to recognizing emotions from facial expres-
sions. Consulting Psychologists Press, Palo Alto, CA, 1975.
[10] I. Essa and A. Pentland. Coding, analysis, interpretation, and recognition of facial expressions.
IEEE Transactions on Pattern Analysis and Machine Intelligence, 19(7):757–763, July 1997.
[11] R. Gnanadesikan.Methods for Statistical Data Analysis of Multivariate Observations. Wiley Series
in Probability and Statistics. Wiley, New York, 2nd edition, 1997.
[12] L. Harmon. The recognition of faces. In R. Held, editor,Image, Object, and Illusion, Readings
from Scientific American, chapter 10, pages 101–112. W.H. Freeman and Company, San Francisco,
1974.
[13] M. Lades, J. Vorbr¨uggen, J. Buhmann, J. Lange, C. von der Malsburg, R. Wurtz, and W. Konen.
Distortion invariant object recognition in the dynamic link architecture.IEEE Transactions on Com-
puters, 42(3):300–311, 1993.
[14] A. Lanitis, C. Taylor, and T. Cootes. Automatic interpretation and coding of face images using
flexible models.IEEE Transactions on Pattern Analysis and Machine Intelligence, 19(7):743–756,
July 1997.
[15] T. Lee. Image representation using 2d Gabor wavelets.IEEE Transactions on Pattern Analysis and
Machine Intelligence, 18(10):959–971, Oct. 1996.
[16] M. Lyons, S. Akamatsu, M. Kamachi, and J. Gyoba. Coding facial expressions with gabor wavelets.
In Proceedings of the Third IEEE International Conference on Automatic Face and Gesture Recog-
nition, Nara, Japan, Apr. 1998.
[17] K. Mase. Recognition of facial expression from optical flow.IEICE Transactions E, 74(10):3473–
3483, 1991.
25
[18] G. McLachlan.Discriminant Analysis and Statistical Pattern Recognition. Wiley Series in Proba-
bility and Mathematical Statistics. Wiley, New York, 1992.
[19] C. Padgett and G. Cottrell. Identifying emotion in static images. InProceedings of the 2nd Joint
Symposium on Neural Computation, volume 5, pages 91–101, La Jolla, CA, 1997.
[20] A. Rahardja, A. Sowmya, and W. Wilson. A neural network approach to component versus holistic
recognition of facial expressions in images. InIntelligent Robots and Computer Vision X: Algorithms
and Techniques, volume 1607 ofSPIE Proc., pages 62–70, 1991.
[21] M. Riedmiller and H. Braun. A direct adaptive method for faster backpropagation learning: The
RPROP algorithm. In H. Ruspini, editor,Proceedings of the International Conference on Neural
Networks, pages 586 – 591, San Fransisco, CA, Mar. 1993.
[22] H. Rowley, S. Baluja, and T. Kanade. Human face detection in visual scenes. Technical Report
CMU-CS-95-158R, School of Computer Science, Carnegie Mellon University, Nov. 1995.
[23] M. Suma, N. Sugie, and K. Fujimora. A preliminary note on pattern recognition of human emotional
expression. InProceedings of the 4th International Joint Conference on Pattern Recognition, pages
408–410, 1978.
[24] K.-K. Sung and T. Poggio. Example-based learning for view-based human face detection. Technical
Report A.I. Memo 1521, CBCL Paper 112, MIT, Dec. 1994.
[25] T. Takane, F. Young, and J. de Leeuw. Nonmetric individual differences multidimensional scaling:
An alternating least squares method with optimal scaling features.Psychometrika, 42:7–67, 1977.
[26] M. Turk and A. Pentland. Eigenfaces for recognition.J. of Cognitive Neuroscience, 3(1):71–86,
Mar. 1991.
[27] L. Wiskott, J.-M. Fellous, N. Kr¨uger, and C. von der Malsburg. Face recognition by elastic bunch
graph matching.IEEE Transactions on Pattern Analysis and Machine Intelligence, 19(7):775–779,
July 1997.
[28] Y. Yacoob and L. Davis. Recognizing facial expressions by spatio-temporal analysis. InProceedings
of the International Conference on Pattern Recognition, volume 1, pages 747–749, Jerusalem, Israel,
Oct. 1994. Computer Society Press.
26