FEASIBILITYREPORTFOR...
34
Transcript of FEASIBILITYREPORTFOR...
FEASIBILITY REPORT FOR
NORTH CENTRAL CATTLE FEEDERS COOPERATIVE
Phase One
prepared for
North Central Cattle Feeders Cooperative
Minot Magic Fund, Inc.
ND Ag Products Utilization Commission
North Central Electric Cooperative
Bottineau EDC
Souris Basin Planning Council
Systems Research and Development, Ltd.
September 1992
Table of Contents
Item Page
Introduction 1
Canadian Feeder Calf Associations 2
Feeder Cattle Sources 3
Existing Markets 6
Profitability 7
Analysis of Financial Institutions 15
References 19
APPENDIX A
1992 COW-CALF AND COW-CALF BACKGROUNDING BUDGETS 20
APPENDIX B
PRODUCTION COEFFICIENTS FOR ECONOMIC ANALYSIS 22
APPENDIX C
INDEXES OF PRICES, 1958-2001 24
APPENDIX D
BEEF CATTLE PRICES USED, 1958-2001 - 27
APPENDIX E
CONTACT PERSONS 30
List of Tables
Item
TABLE I. ESTIMATED NUMBER OF FEEDER CATTLE AVAILABLE TO
BACKGROUND, JANUARY 1991 4
TABLE 2. IN-SHIPMENTS OF FEEDER AND SLAUGHTER CATTLE FROM
CANADA TO UNITED STATES, 1970-1990 6
TABLE 3. HISTORICAL PROFITABILITY OF TRADITIONAL COW-CALF
(SELLING CALF AT WEANING) AND COW-CALF BACKGROUNDING,
1958-1991 10
TABLE 4. PROJECTED PROFIT OF TRADITIONAL COW-CALF (SELLING CALF
AT WEANING) AND COW-CALF BACKGROUNDING, 1992-2001 11
TABLE 5. CASH FLOW IMPACTS OF SELLING 1992 CALF AT WEANING
VERSUS BACKGROUNDING 11
List of Figures
Item
Figure 1. Total Revenue for 400 Pound steer in Fall Versus 675 Pound Steer in Spring . . 12
Figure 2. Historical Profitability of Backgrounding Versus Traditional Cow-calf, 1958-91 12
Figure 3. Profitability of Backgrounding Steers Versus Heifers, 1958-90 13
Figure 4. Historical Profitability of Backgrounding Versus Traditional Cow-calf at
Bank of Cooperative Lending Rate, 1958-90 13
Figure 5. Projected Profitability of Backgrounding Versus Traditional Cow-calf, 1992-
2001 14
Figure 6. Projected Profitability of Backgrounding Steers and Heifers, 1992-2001 14

Introduction
Because of an inability to obtain financing many cattlemen in North Dakota are forced
to liquidate their calves following weaning. Also, some ranchers have feed resources which
they are unable to utilize efficiently because of lending limits imposed by creditors. Many
times, these limits are designed by the calendar year rather than the production cycle of the
beef animal. Feeder calf cooperatives have been formed in Canadian provinces which
improve the cattlemen's access to capital. The objectives of this report are as follows:
1) Analyze backgrounding operations currently operating in U.S. and Canada
A) Current sources of feeder cattle
B) Existing markets for feeder cattle
Q Historical trends and 10 year price projections to estimate profitability
2) Analyze existing financial structures and lending requirements
3) Proposed cash flow with and without backgrounding to determine impact of
backgrounding
4) Investigate if existence of Coop would increase access to capital

Canadian Feeder Calf Associations
Canadian Feeder Calf Association representatives in Manitoba, Saskatchewan, and
Alberta were contacted to determine how the cooperatives worked in their provinces, the
number and size of their cooperatives, the length of lime they have been in operation, and the
success of the Canadian program. In the discussion, the terms association and cooperative are
used interchangeable, as all associations are incorporated cooperatives. Following is a
summary of their answers.
Manitoba
Manitoba is in their first year for operating feeder calf associations. Currently, they
have 4 operating cooperatives, with 7 more in various stages of incorporation. They expect
10-14 more to come into existence next year. In Manitoba, at least 15 members are required
to form a cooperative. There is a $3 million maximum loan per cooperative. One existing
association has 32 members while the others have 20-25 members in each. Loan limits beginat $25,000 the first year of feeding in the cooperative and grow to a $100,000 limit in the
fifth year. To date, there have been no problems with operation of the cooperatives.
Alberta
Feeder calf associations have been operating in Alberta for more than 50 years. There
61 active associations with an average of 100 members and $4 million in activity annually.The largest has $12 million annual activity. The 25 percent provincial guarantee has not been
used in over 10 years. The five percent farmer assurance fund is used about 10 percent of thetime, but some larger cooperatives have not touched this fund for years. In Alberta, a farmer
who'has been an active feeder within the association for five years has a maximum credit
limit of $100,000.
Each association is incorporated as a cooperative, and governed by a board of directors
with a permanent supervisor and secretary. The only problems that have occurred in theirfeeder calf cooperatives is when there has been outright fraud or negligence on the part of theboard or supervisor. The representative stressed the necessity of hiring a supervisor that has
no vested interest in the cooperative such as a livestock dealer or sales barn operator.
Saskatchewan
The Saskatchewan feeder calf cooperatives are different from the other provinces.
Legislation by the provincial legislature authorizes formation of production associations which
include feeder calf associations. The provincial government extends a 25 percent line ofcredit to producers through the association. The associations act as a trustee on behalf of the
members and borrows money from the bank. There are 105 active associations in

Saskatchewan, 80 percent of which are combination breeder and feeder associations (two
associations in one). The remnining 20 percent are feeder calf associations. The associations
have been running since 1984, have nearly $30 million out on loan, and have never had to
touch the government guarantee. The five percent guarantee fund has been used less than ten
times in the Saskatchewan feeder calf associations.
As in the other provinces, the amount of money extended to each feeder depends on
the number of years of active membership in the association. In the feeder association, the
limit starts at $25,000 and increases to $100,000 after five years of active feeding within the
association. The breeder associations begin at $25,000 and have a $50,000 limit that is
attained following five years active membership in the association. The breeder associations
require a 10 percent assurance deposit, where their feeder association deposit is 5 percent of
the loan value.
Feeder Cattle Sources
There are two main sources of feeder cattle to producers located in northern North
Dakota. The first source is feeders raised within the area. The second source is cattle
imported from Canada (Saskatchewan or Manitoba). There were an estimated 643 thousand
feeder cattle produced in North Dakota during 1990 (Table 1). Of these, approximately 50
percent are sold outside the state at weaning (Petry, 1992). Along the northern tier of
counties in North Dakota, approximately 132 thousand feeder cattle were produced in 1990.
In-shipments from outside North Dakota amounted to 135 thousand head (North Dakota
Agricultural Statistics, 1991).
If 50 percent of calves, currently sold outside the state, are sold because of a lack of
financing, then it seems plausible that an additiQnal 167 thousand calves could be kept in the
state to be backgrounded. At a projected price of $92.31/cwt in March, 1993, the additional
backgrounded calves would generate an additional $230.78/steer in gross sales (assuming the
backgrounded calf gains 250 pounds). The gross receipts sales multiplier for North Dakota is
4.49 (Coon, et al, 1989). This means each steer backgrounded within the state would
generate an additional $1,036 in economic activity within the state of North Dakota.
Canadian exports into North Dakota represent another potential source of feeder cattle
for North Dakota Producers. Although no statistics were found estimating the number of
feeder calves exported from Canada into North Dakota, most beef animals from Canada into
the U. S. are finished animals (Table 2).
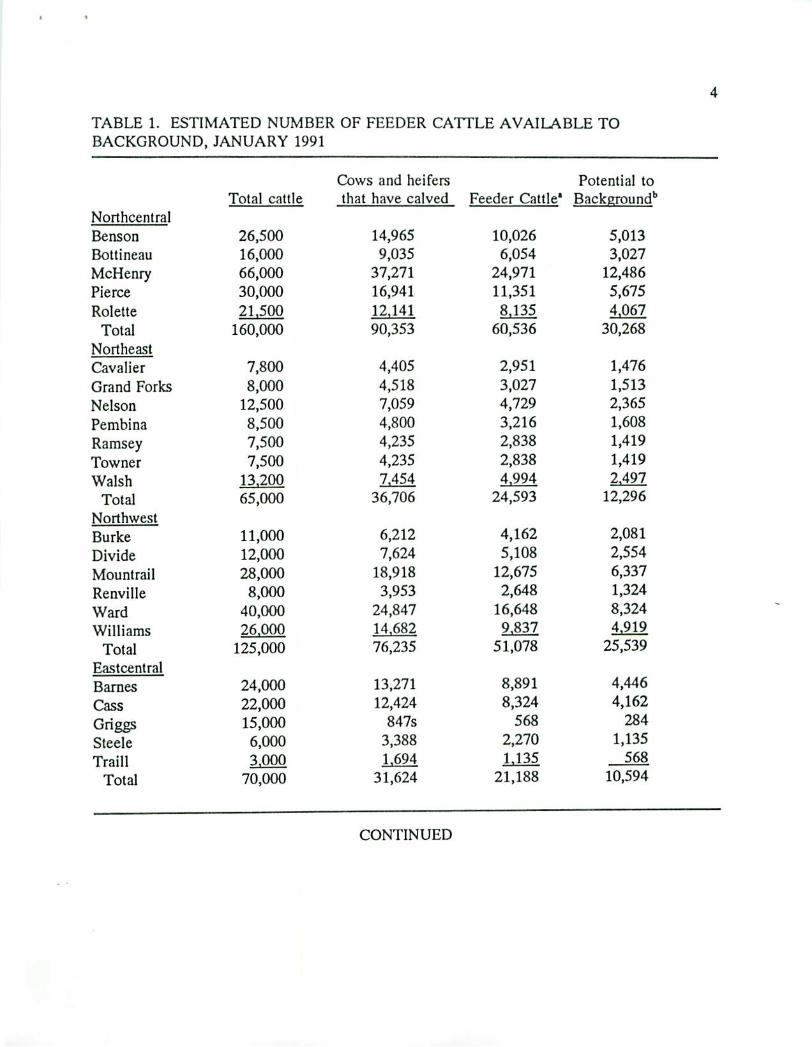
TABLE 1. ESTIMATED NUMBER OF FEEDER CATTLE AVAILABLE TO
BACKGROUND, JANUARY 1991
Northcenlral
Benson
Bottineau
McHenry
Pierce
Rolette
Total
Northeast
Cavalier
Grand Forks
Nelson
Pembina
Ramsey
Towner
Walsh
Total
Northwest
Burke
Divide
Mountrail
Renville
Ward
Williams
Total
Eastcentral
Barnes
Cass
Griggs
Steele
Traill
Total
Total cattle
26,500
16,000
66,000
30,000
21,500
160,000
7,800
8,000
12,500
8,500
7,500
7,500
13.200
65,000
11,000
12,000
28,000
8,000
40,000
26.000
125,000
24,000
22,000
15,000
6,000
3,000
70,000
Cows and heifers
that have calved
14,965
9,035
37,271
16,941
12,141
90,353
4,405
4,518
7,059
4,800
4,235
4,235
7.454
36,706
6,212
7,624
18,918
3,953
24,847
14.682
76,235
13,271
12,424
847s
3,388
1.694
31,624
Feeder Cattle1
10,026
6,054
24,971
11,351
8,135
60,536
2,951
3,027
4,729
3,216
2,838
2,838
4.994
24,593
4,162
5,108
12,675
2,648
16,648
9.837
51,078
8,891
8,324
568
2,270
1,135
21,188
Potential to
Background11
5,013
3,027
12,486
5,675
4.067
30,268
1,476
1,513
2,365
1,608
1,419
1,419
2.497
12,296
2,081
2,554
6,337
1,324
8,324
4.919
25,539
4,446
4,162
284
1,135
568
10,594
CONTINUED

TABLE 1. CONTINUED
Central
Eddy
Foster
Kidder
Sheridan
Stutsman
Wells
Total
Westcentral
Dunn
McKenzie
McLean
Mercer
Oliver
Total
Statewide
Total cattle
20,000
19,000
74,500
25,000
54,000
27,500
220,000
77,000
75,000
40,000
40,000
28,000
260,000
1,700,000
Cows and heifers
that have calved
11,294
10,729
42,071
14,118
30,494
15,529
124,235
43,482
42,353
22,588
22,588
15.812
146,824
960,000
Feeder Cattle1
7,567
7,189
28,187
9,459
20,431
10,405
83,238
29,133
28,376
15,134
15,134
10,594
98,372
643,200
Potential to
Background11
3,784
3,594
14,094
4,729
10,216
5,202
41,619
14,567
14,188
7,567
7,567
5,297
49,186
321,600
SOURCE: North Dakota Agricultural Statistics Service, 1991.
'Feeder cattle inventory estimated as 67 percent of cows that have calved.
bAssuming 50 percent of all weaned calves are currently marketed outside the state.
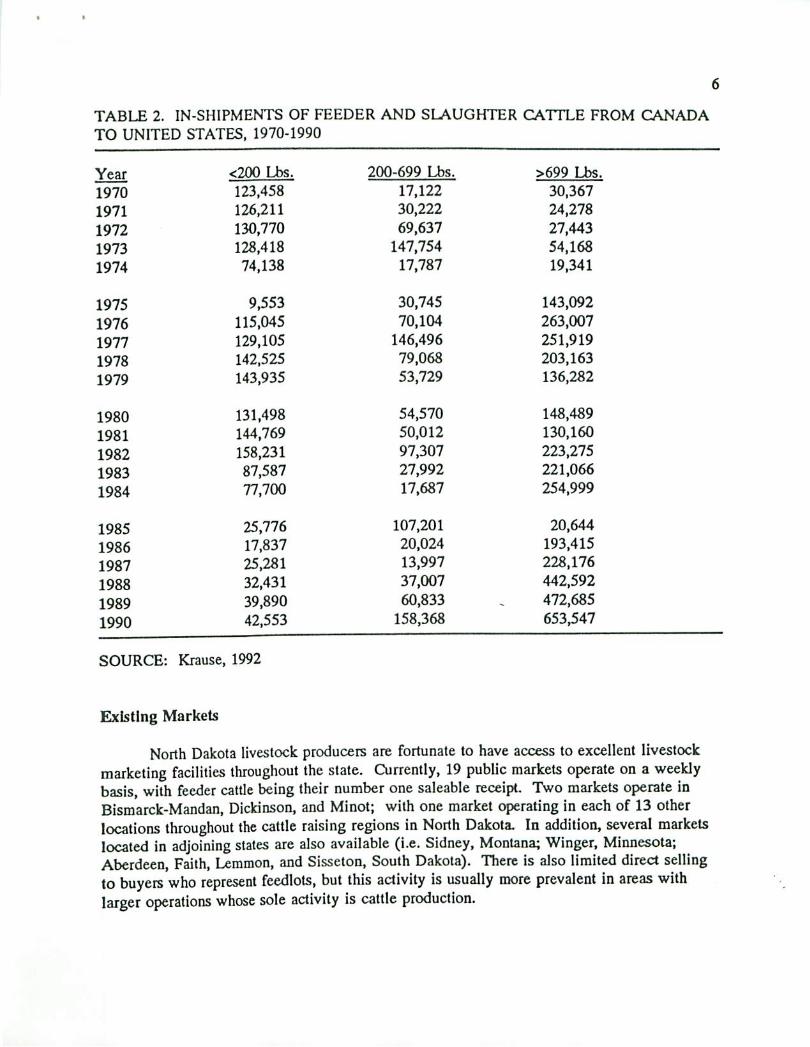
TABLE 2. IN-SHIPMENTS OF FEEDER AND SLAUGHTER CATTLE FROM CANADA
TO UNITED STATES, 1970-1990
Year
1970
1971
1972
1973
1974
1975
1976
1977
1978
1979
1980
1981
1982
1983
1984
1985
1986
1987
1988
1989
1990
<200 Lbs.
123,458
126,211
130,770
128,418
74,138
9,553
115,045
129,105
142,525
143,935
131,498
144,769
158,231
87,587
77,700
25,776
17,837
25,281
32,431
39,890
42,553
200-699 Lbs.
17,122
30,222
69,637
147,754
17,787
30,745
70,104
146,496
79,068
53,729
54,570
50,012
97,307
27,992
17,687
107,201
20,024
13,997
37,007
60,833
158,368
>699 Lbs.
30,367
24,278
27,443
54,168
19,341
143,092
263,007
251,919
203,163
136,282
148,489
130,160
223,275
221,066
254,999
20,644
193,415
228,176
442,592
472,685
653,547
SOURCE: Krause, 1992
Existing Markets
North Dakota livestock producers are fortunate to have access to excellent livestock
marketing facilities throughout the state. Currently, 19 public markets operate on a weekly
basis, with feeder cattle being their number one saleable receipt. Two markets operate in
Bismarck-Mandan, Dickinson, and Minot; with one market operating in each of 13 other
locations throughout the cattle raising regions in North Dakota. In addition, several markets
located in adjoining stales are also available (i.e. Sidney, Montana; Winger, Minnesota;
Aberdeen, Faith, Leramon, and Sisseton, South Dakota). There is also limited direct selling
to buyers who represent feedlots, but this activity is usually more prevalent in areas with
larger operations whose sole activity is cattle production.
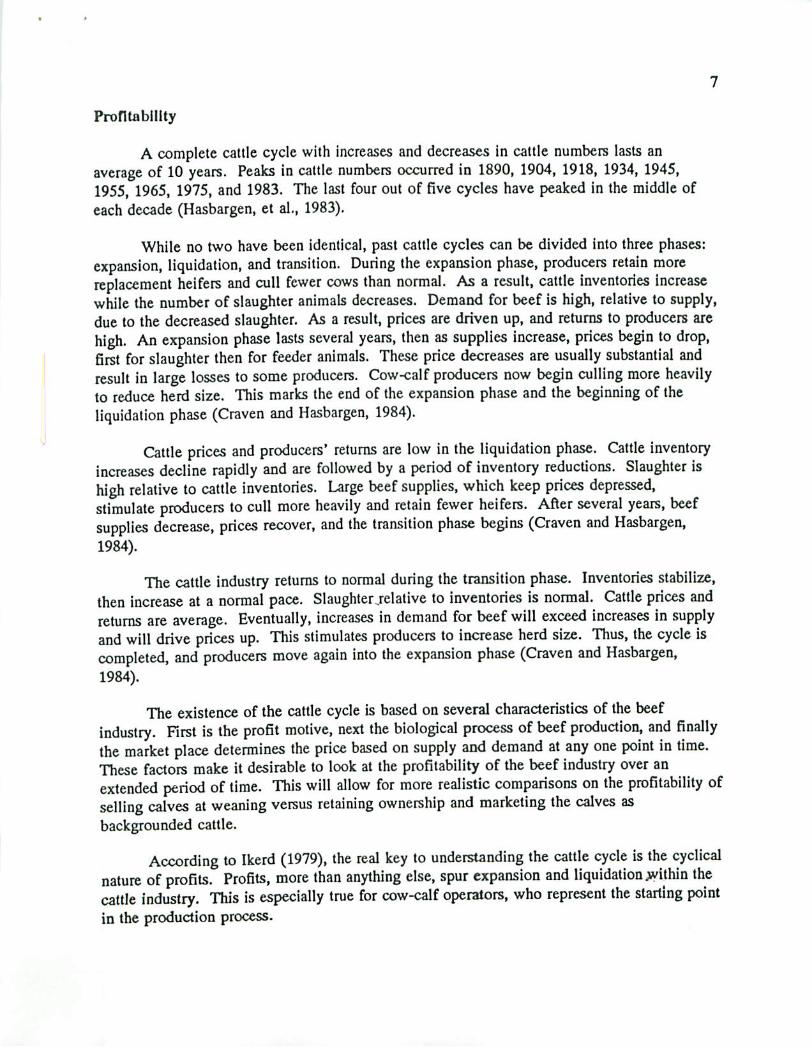
Profitability
A complete cattle cycle with increases and decreases in cattle numbers lasts an
average of 10 years. Peaks in cattle numbers occurred in 1890, 1904, 1918, 1934, 1945,
1955, 1965, 1975, and 1983. The last four out of five cycles have peaked in the middle of
each decade (Hasbargen, et al., 1983).
While no two have been identical, past cattle cycles can be divided into three phases:
expansion, liquidation, and transition. During the expansion phase, producers retain more
replacement heifers and cull fewer cows than normal. As a result, cattle inventories increase
while the number of slaughter animals decreases. Demand for beef is high, relative to supply,
due to the decreased slaughter. As a result, prices are driven up, and returns to producers are
high. An expansion phase lasts several years, then as supplies increase, prices begin to drop,
first for slaughter then for feeder animals. These price decreases are usually substantial and
result in large losses to some producers. Cow-calf producers now begin culling more heavily
to reduce herd size. This marks the end of the expansion phase and the beginning of the
liquidation phase (Craven and Hasbargen, 1984).
Cattle prices and producers' returns are low in the liquidation phase. Cattle inventory
increases decline rapidly and are followed by a period of inventory reductions. Slaughter is
high relative to cattle inventories. Large beef supplies, which keep prices depressed,
stimulate producers to cull more heavily and retain fewer heifers. After several years, beef
supplies decrease, prices recover, and the transition phase begins (Craven and Hasbargen,
1984).
The cattle industry returns to normal during the transition phase. Inventories stabilize,
then increase at a normal pace. Slaughter .relative to inventories is normal. Cattle prices and
returns are average. Eventually, increases in demand for beef will exceed increases in supply
and will drive prices up. This stimulates producers to increase herd size. Thus, the cycle is
completed, and producers move again into the expansion phase (Craven and Hasbargen,
1984).
The existence of the cattle cycle is based on several characteristics of the beef
industry. First is the profit motive, next the biological process of beef production, and finally
the market place determines the price based on supply and demand at any one point in time.
These factors make it desirable to look at the profitability of the beef industry over an
extended period of time. This will allow for more realistic comparisons on the profitability of
selling calves at weaning versus retaining ownership and marketing the calves as
backgrounded cattle.
According to Ikerd (1979), the real key to understanding the cattle cycle is the cyclical
nature of profits. Profits, more than anything else, spur expansion and liquidation>vithin the
cattle industry. This is especially true for cow-calf operators, who represent the starting point
in the production process.

The first year of our study, 1958, was the first of several generally profitable years in
[he cattle industry. This period followed an unprofitable stretch of years that coincided with
the peak in cattle numbers that occurred in 1955. By the early 1960s cattle inventories had
been built up, driving prices down, and resulting in losses near the middle of that decade.
The cattle industry was generally profitable throughout the latter part of the 1960s and
the 1970s. This made the industry attractive. Many operators expanded their enterprises,
while others started new ones. The rapid expansion continued until cattle inventories peaked
in 1975. The overabundant cattle supply resulted in sharp drops in prices and operators'
profits throughout the mid-1970s. Cattle inventories were reduced by the end of the decade
and prices rose. The profitability of the cattle industry at the end of the 1970s encouraged
producers to expand their herds.
Cattle inventories increased steadily during the early 1980s. The cattle industry has
been, for the most part, unprofitable during this period, especially for cow-calf operators.
Higher feed prices in 1981, resulting from a drought in 1980, higher interest rates, as well as
an abundant supply of substitutable meats, and a shift in consumer preferences away from red
meat have all contributed to the losses experienced throughout the early 1980s. The cattle
cycle is currently nearing the end of an expansion phase. As such prices will begin to decline
in the next one to three years.
Profits in all segments of the cattle industry, like in all other agricultural enterprises,
are contingent on production costs in addition to market prices, In this study budgets
reflecting the costs of production for the traditional cow-caif and cow-calf backgrounding
enterprises were constructed at 1992 price levels (Appendix A). Production coefficients used
in developing the budgets are presented in Appendix B.
The production cost components were adjusted to reflect actual prices from 1958 to
1991 using indices of prices paid by fanners (Appendix C). Per cow production costs are -
divided by the hundredweights (cwt) of expected output to derive an estimate of a break even
price that would cover all costs using this equation:
BE= (CC, + WBJ/EO
Where:
BE = Break even price per cwt produced
CC, = Cow-calf production costs in year t
WB, = Winter feeding production costs in year t
WBt=(.45 X steer winter production costs + .27 X heifer winter
production costs)
EO = Expected output per cow
EO = (.45 X expected steer selling weight + .27 X expected heifer
selling weight + revenue from cull cows and heifers)
The percentages used to adjust the steer and heifer production costs and expected
selling weights reflect the percentage of steers and heifers sold per cow in (he herd. It was
assumed that a 100 cow herd would sell 45 head of steers (half of the 90 percent calf crop)
and 27 heifers (half of the 90 percent calf crop minus 18 percent retention rate). Production
costs of winter feeding were included only when applicable. For example, if a calf was sold
at weaning, then all production costs terms would equal zero except the cow-calf production
costs.
The break-even price was subtracted from an adjusted market price to derive an
estimate of profit per cwt. The adjusted market price was equal to 63 percent of the steer
price [.45/(.45+.27)] plus 37 percent of the heifer price [,27/(.45+.27)], which reflects the
combination of steers and heifers that are sold per cow (Appendix D). Profit per cwt was
multiplied by the cwt of expected output per cow to yield an estimate of the profit per cow.
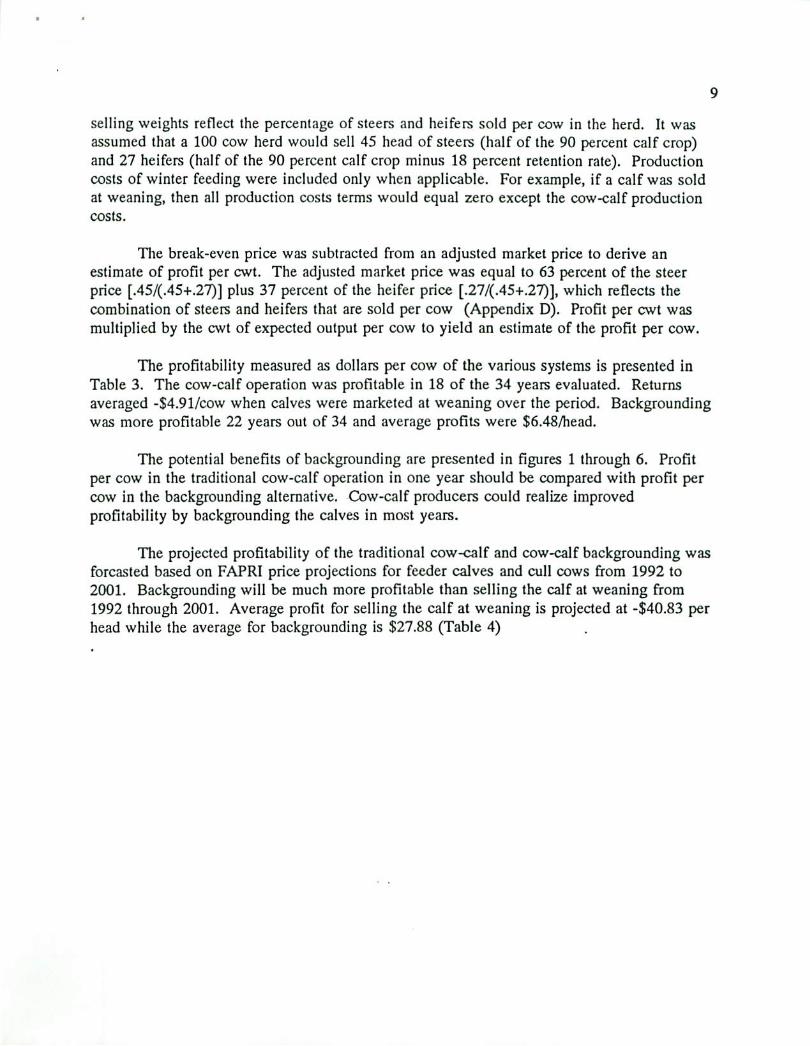
The profitability measured as dollars per cow of the various systems is presented in
Table 3. The cow-calf operation was profitable in 18 of the 34 years evaluated. Returns
averaged -$4.91/cow when calves were marketed at weaning over the period. Backgrounding
was more profitable 22 years out of 34 and average profits were $6.48/head.
The potential benefits of backgrounding are presented in figures 1 through 6. Profit
per cow in the traditional cow-calf operation in one year should be compared with profit per
cow in the backgrounding alternative. Cow-calf producers could realize improved
profitability by backgrounding the calves in most years.
The projected profitability of the traditional cow-calf and cow-calf backgrounding was
forcasted based on FAPRI price projections for feeder calves and cull cows from 1992 to
2001. Backgrounding will be much more profitable than selling the calf at weaning from
1992 through 2001. Average profit for selling the calf at weaning is projected at -$40.83 per
head while the average for backgrounding is $27.88 (Table 4)

10
TABLE 3. HISTORICAL PROFITABILITY OF TRADITIONAL COW-CALF (SELLING
CALF AT WEANING) AND COW-CALF BACKGROUNDING, 1958-1991
Years
1958
1959
1960
1961
1962
1963
1964
1965
1966
1967
1968
1969
1970
1971
1972
1973
1974
1975
1976
1977
1978
1979
1980
1981
1982
1983
1984
1985
1986
1987
1988
1989
1990
1991
Average
Profit
Sell at weanine/cow
$35.12
$18.01
$12.50
$16,87
$19.82
$2.02
($9.91)
$4.76
$8.09
$9.02
$14.77
$19.97
$27.72
$46.83
$77.50
$24.49
($78.56)
($55.62)
($40.56)
$3.76
$74.31
$63.68
($15.05)
($80.60)
($59.58)
($51.64)
($55.40)
($20.27)
($56.25)
($0.94)
($32.51)
($55.99)
($28.41)
f$23.65i
($4.91)
Profit
Backeround i ne/cow
$31.51
$14.60
$9.99
$13.31
$7.86
($5.86)
($13.80)
1.03
($15.75 )
($1.55)
$3.20
$14.47
$19.65
$5.60
$15.97
$35.06
($52.06)
($15.14)
$20.19
($4.69)
$42.21
$86.36
($53.68)
($46.70)
($2.48)
$5.85
$1.19
$8.47
($13.44)
$36.32
$16.72
($12.96)
$9.04
$28.18
$6.48
11
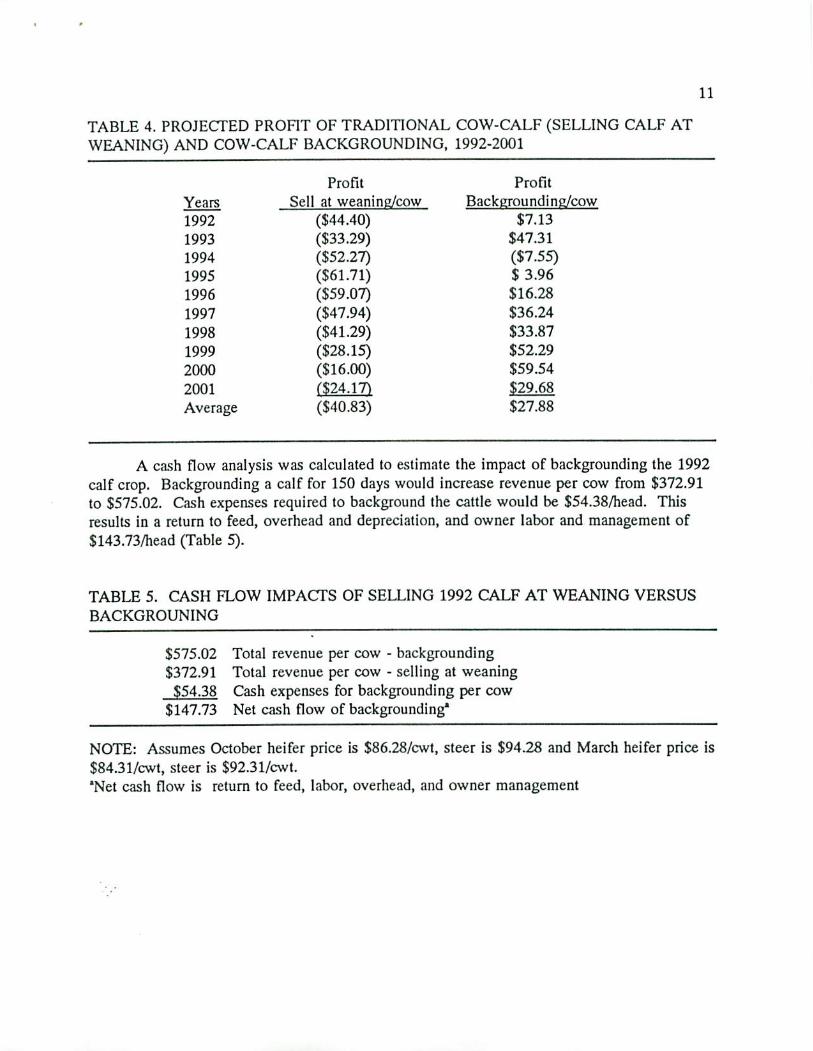
TABLE 4. PROJECTED PROFIT OF TRADITIONAL COW-CALF (SELLING CALF AT
WEANING) AND COW-CALF BACKGROUNDING, 1992-2001
Years
1992
1993
1994
1995
1996
1997
1998
1999
2000
2001
Average
Profit
Sell at weanine/cow
($44.40)
($33.29)
($52.27)
($61.71)
($59.07)
($47.94)
($41.29)
($28.15)
($16.00)
(■$24,171
($40.83)
Profit
Backeroundina/cow
$7.13
$47.31
($7.55)
$ 3.96
$16.28
$36.24
$33.87
$52.29
$59.54
$29.68
$27.88
A cash flow analysis was calculated to estimate the impact of backgrounding the 1992
calf crop. Backgrounding a calf for 150 days would increase revenue per cow from $372.91
to $575.02. Cash expenses required to background the cattle would be $54.38/head. This
results in a return to feed, overhead and depreciation, and owner labor and management of
$143.73/head (Table 5).
TABLE 5. CASH FLOW IMPACTS OF SELLING 1992 CALF AT WEANING VERSUS
BACKGROUNING
$575.02 Total revenue per cow - backgrounding
$372.91 Total revenue per cow - selling at weaning
$54.38 Cash expenses for backgrounding per cow
$147.73 Net cash flow of backgrounding1
NOTE: Assumes October heifer price is $86.28/cwt, steer is $94.28 and March heifer price is
$84.31/cwt, steer is $92.31/cwt.
'Net cash flow is return to feed, labor, overhead, and owner management

700
600 -
1958 1961 1964 1967 1970 1973 1976 1979 1982 1985 1988 1991
Cow-calf (sell at weaning) _^ CC-Background
Figure 1. Total Revenue for 400 Pound Steer in Fall Versus 675 Pound Steer in Spring
1958 1961 1964 1967 1970 1973 1976 1979 1982 1985 1988 1991
Figure 2. Historical Profitability of Backgrounding Versus Traditional Cow-calf, 1958-91
13
150
100 -
150 -
-50 -
-1001958 1961 1964 1967 1970 1973 1976 1979 1982 1985 1988 1991
_ Steers Heifers
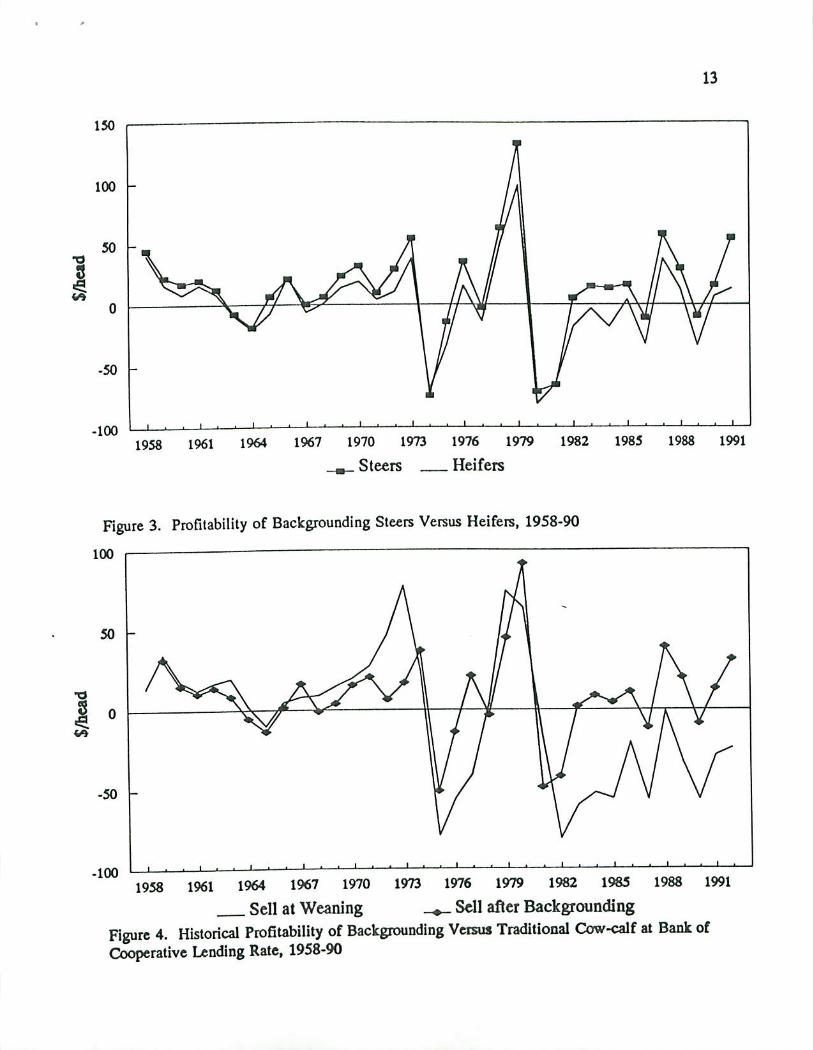
Figure 3. Profilability of Backgrounding Steers Versus Heifers, 1958-90
100
50 -
-50 -
-100
1958 1961 1964 1967 1970
Sell at Weaning
1973 1976 1979 1982 1985
_+_ Sell after Backgrounding
1988 1991
Figure 4. Historical Profitability of Backgrounding Versus Traditional Cow-calf at Bank of
Cooperative Lending Rate, 1958-90

14
100
•1001992 1993 1994 1995 1996 1997 1998 1999
m , Sell calf at weaning^_ Backgrounding
2000 2001
Figure 5. Projected Profitability of Backgrounding Versus Traditional Cow-calf, 1992-2001
100
80 -
60 -
40 -
20 -
-20 -
-40
1992 1993 1994 1995 1996
, m Profit Background Steers.
1997 1998 1999 2000
Profit Background Heifers
2001
Figure 6. Projected Profitability of Backgrounding Steers and Heifers, 1992-2001
15
Analysis or Financial Institutions
Local banks, traditional lending agencies, and some less traditional lending agencies
were contacted to get their opionions on creadit availability for a feeder calf cooperative
association. The concept of a feeder calf cooperative was explained to them. Their reactions
to the concept were positive in most cases, but all felt some form of a guarantee is required.
In the Canadian program, each association borrows 100 percent of the loan from a provincial
bank, the feeder provides a five percent assurance deposit, and the provincial government
either through producer programs or provincial legislation, provides a 25 percent guarantee.
The United States' banking system is similar to the Canadian banking system. U.S. federal
and state governments guarantee loans when mandated through legislative action, as in
Canada. No such guarantee program exists at this time for a feeder cooperative at the federal
or North Dakota level. Loan guarantees for rural utility cooperatives are legislated at the
federal level, while several state legislated guarantee programs are administered through the
Bank of North Dakota. Rural electric, telephone, and water cooperatives fall under a federal
mandate and the North Dakota Beginning Farmer program, Project Sheep, and Project Pigs
are state legislated guarantee programs. Reactions, interest rates, equity requirements, and
contact persons for each agency follow.
Local Banks
Minot banks, overall, were receptive to the feeder calf cooperative concept as a whole.
Prospective interest rates ranged from 9.5 to 10.2 percent. Although they would be dealing
with a cooperative, they said the strength of the cooperative lies in the financial strength of
the members, and as such, they would require financial statements from all members. One
bank, requires statements for three previous years. All indicated they would not accept any
highly leveraged individuals. As with all of the lenders contacted, the banks would require a
first mortgage on the feeder cattle. The lending limit for each bank was high enough to
accommodate the feeder calf cooperative.
Farmers Home Administration
The Farmers Home Administration (FHA) works with local lenders thus, all rules of
the local lender apply. FHA will guarantee up to 90 percent of a maximum $400,000 loan.
They treat a cooperative, partnership, corporation, or individual borrower as a single entity.
Therefore, the maximum loan which they will guarantee would not be sufficient for this
project. The financial position of each feeder will be reviewed for loan approval. On an
individual producer basis, since each feeder is reviewed for credit worthiness, there is no
advantage to forming a cooperative.
16
Farm Credit Services
Farm Credit Services (FCS) is interested in working with a feeder calf cooperative.
Farm Credit Services is a farmer-owned cooperative. Participants join to procure funds
collectively from investors. A statutes require the borrower to purchase stock in the Federal
Land Bank Association equal to at least 5 percent of the amount borrowed. FCS will work
with each producer through a cooperative, and requires individual financial statements. Their
interest rates are competitive with financial industry rates. When dealing with FCS, there
appears to be no advantage in the cooperative formation.
Bank of North Dakota
The Bank of North Dakota does not guarantee loans unless mandated by legislative
process. They cooperate with local banks to finance this type of venture usually on a 70/30
basis, local bank to Bank of ND. They offer a break in interest rate for cooperatives. Their
short term loans are at 7 percent and long term loans are at 8 percent.
AG PACE
AG PACE, a program administered through the Bank of North Dakota, specializes in
non-agricultural, on-farm businesses financed by the farmer. This program will also lend
capital to non-traditional agribusinesses; however, it primarily was created to lend capital to
directly increase rural employment.
North Dakota Future Fund
The North Dakota Future Fund is also a jobs creation program. Their loan limit is
$300,000 or about $10-15,000 per job created. They do not usually fund production
agriculture. Also, the Future Fund expenditure for the Minot area is nearly expended.
St. Paul Bank of Cooperatives
The St. Paul Bank of Cooperatives would consider a loan of 70-100 percent of
necessary capital after reviewing profit/loss projections for the cooperative, financial position
of cooperative, articles of incorporation, by-laws of the cooperative, and an explanation of the
project. The Bank of Cooperatives would prefer a guarante by the state of North Dakota.
However, if the cooperative is formed to raise capital, there may be problems obtaining the
risk capital or guarantee. A cooperative has to have equity capital to begin. If someone
would be willing to invest 25 percent of the necessary capital in the cooperative as preferred
stock, the Bank of Cooperatives would be more likely to lend to this cooperative.
17
American Credit Indemnity Insurance
American Credit Indemnity, Lombard, Illinois, was contacted regarding loan guarantee
insurance. This company insures accounts receivable, where one company selling to another
insures the account receivable. When presented with the feeder cooperative concept, heindicated two things. One, his underwriters would be probably not be willing to underwrite
this type of project because their underwriters are skeptical of farming projects. Second, he
does not feel that this type of guarantee insurance, is what the banks are looking for.
Fin-Ag
Fin-Ag, a less traditional agricultural lending agency, was contacted for information on
their lending program. They are a South Dakota corporation and a wholly owned subsidiary
of Harvest Stales Cooperative of St. Paul, Minnesota. They are in business to develop and
implement financing programs to satisfy the needs of patrons of Harvest States Cooperatives
and at the same lime generate business and margins for Harvest States, its operating divisions
and affiliates.
Fin-Ag, whose current interest rate is approximately nine percent, is interested in
cooperating in'this project. They will work with the farmers through an incorporatedcooperative structure. But, since the cooperative would not have the financial strength to
guarantee the loans, they would make the loan to the feeder, through the cooperative, on an
individual basis. They may loan 100 percent of the capital requirements provided certain
qualifications are met. Fin-Ag requires an individual financial statement from each feeder,
and will lend up to twice the net worth shown by the feeder. The feeder's feed supply and
five percent feeder security deposit may be a sufficient equity contribution. The borrower
must be of good character with no outstanding past due obligations. The feeder will also
have to purchase some feed (supplement) from a Harvest States affiliated feed company. Fin-
Ag would have a first mortgage on the cattle.
They like the cooperative concept with the five percent guarantee by the feeder and
may be willing to negotiate the terms of a loan. With several years of positive results, Fin-
Ag may be willing to lend directly with the cooperative in the future. Walt Wiseman,
President of Fin-Ag, indicated would like to meet with the cooperative members to discuss
their lending program.
North Dakota Association of Rural Electric Cooperatives
Rural electric cooperatives do not generally provide this type of loan guarantee for
businesses. But, William Patrje, North Dakota Rural Electric Cooperatives, offered several
suggestions for a feeder calf cooperative to provide their own guarantee or equity account.
The feeder cooperative could sell preferred stock to raise the equity capital necessary to
18
reduce the risk that lenders may see over the five percent feeder provided assurance fund.
This preferred stock may be sold to an individual or group of individuals, with the
cooperative paying an annual interest dividend and purchasing the stock from the owners. A
second option is where a local Rural Electric Cooperative would purchase the preferred stock,
apply to REA through the zero interest loan program and receive the a loan at no interest.
When the cooperative sells cattle, the cooperative would retain a percentage of sales to
purchase the stock back from the REC. In this way, there is no interest dividend paid to the
REC and the feeder calf cooperative would build its own equity account. After a 5-7 year
repayment period, the feeder cooperative would have a very strong financial position from
which to negotiate loans for future operation.
19
References
Coon, Randal C, F. Larry Leistritz, and Thor A. Hertsgaard. March 1989. North Dakota
Economic Projection Model: Documentation and Users Guide, Version 2.0
Department of Agricultural Economics. Agricultural Experiment Station North Dakota
State University, Fargo.
Craven, Robert H. and Paul R. Hasbargen. 1984. Production/Marketing Alternatives for
Northern Minnesota Cow-Calf Producers. Item No. AD-SB-2208, Agricultural
Experiment Station, University of Minnesota, St. Paul.
Economic Report of the President. 1992. Transmitted to the CongTess February 1992
together with the Annual Report of the Council of Economic Advisers. United States
Government Printing Office, Washington.
Food and Agricultural Policy Research Institute (FAPRI). Baseline 1992. Iowa State
University and the University of Missouri-Columbia.
Hasbargen, Paul R.., Tommy Beale, John E. Ikerd, Douglas E. Murfield, and David C. Petritz.
1983. Cattle Cycles: How to Profit From Them. Miscellaneous Publication Number
1430, Extension Service, U.S. Department of Agriculture, Washington, D.C.
Ikerd, John E. April 1979. Integrated Risk Management for Beef Cattle Producers.
Oklahoma State University, Agricultural Economics paper given at the Extensioo-
Industry Long-Run Beef Outlook Seminar, Kansas City.
Krause, Kenneth R. June 1992. The Beef Cow-Calf Industry, 1964-87. United States
Department of Agriculture, Economic Research Service, Rpt. No. 659,
North Dakota Agricultural Statistics Service. 1991. North Dakota Agricultural Statistics
1991. North Dakota State University, Fargo. United States Department of
Agriculture, Washington DC.
Petry, Timothy A. August 10, 1992. Personal Communication. Associate Professor,
Department of Agricultural Economics. North Dakota State University, Fargo.
United States Department of Agriculture. June 1992. Agricultural Prices: 1991 Summary.
National Agricultural Statistics Service, Washington DC.
20
APPENDIX A
1992 COW-CALF AND COW-CALF BACKGROUNDING BUDGETS
21
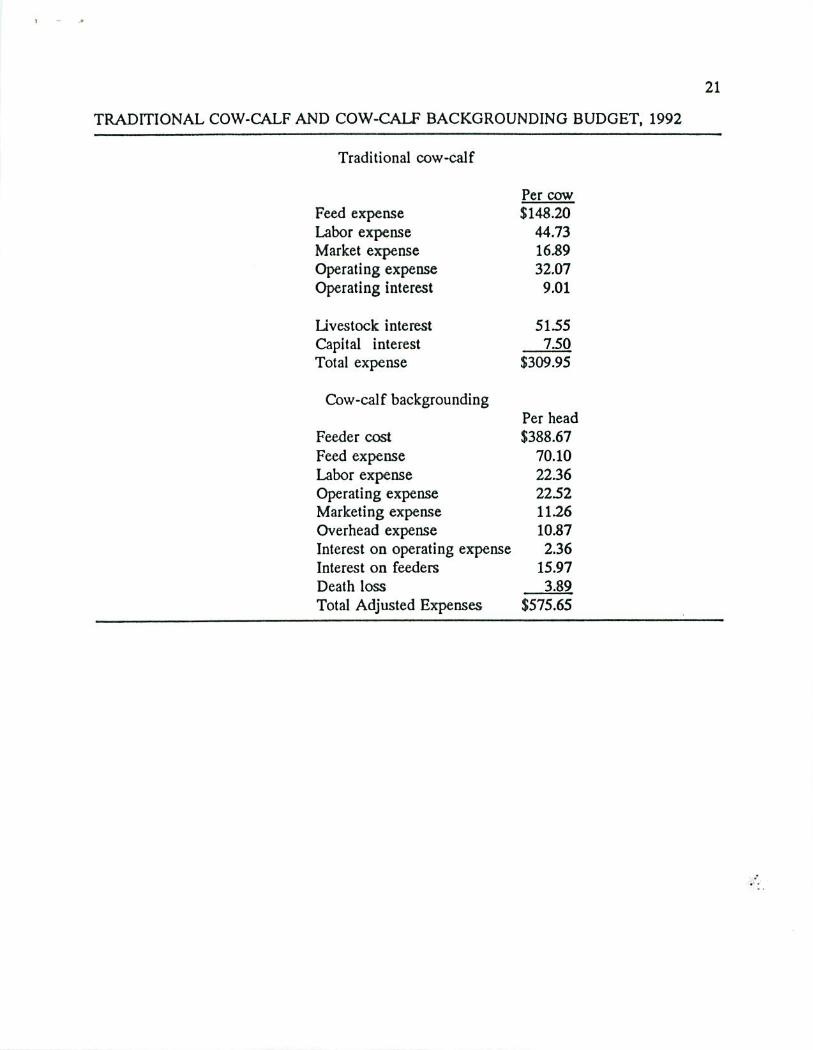
TRADITIONAL COW-CALF AND COW-CALF BACKGROUNDING BUDGET, 1992
Traditional cow-calf
Per cow
Feed expense $148.20
Labor expense 44.73
Market expense 16.89
Operating expense 32.07
Operating interest 9.01
Livestock interest 51.55
Capital interest 7.50
Total expense $309.95
Cow-calf backgrounding
Per head
Feeder cost $388.67
Feed expense 70.10
Labor expense 22.36
Operating expense 22.52
Marketing expense 11.26
Overhead expense 10.87
Interest on operating expense 2.36
Interest on feeders 15.97
Death loss 3.89
Total Adjusted Expenses $575.65

22
APPENDIX B
PRODUCTION COEFFICIENTS FOR ECONOMIC ANALYSIS

23
COW-CALF SELLING AT WEANING AND BACKGROUNDING PRODUCTION
COEFFICIENTS AND ASSUMPTIONS
Weaning weight-steer 425 pounds
Weaning weight-heifer 400 pounds
Cull heifer wt. 750 pounds
Cull cow wt. 1000 pounds
Cow replacement rate 16 percent
Cow death loss 1 percent
Heifer retention rate 18 percent
Calf crop 90 percent (45% steers + 45% heifers)
Cows per herd 100 head
Calf sold per cow 299.25 pounds

24
APPENDIX C
INDEXES OF PRICES, 1958-2001
25
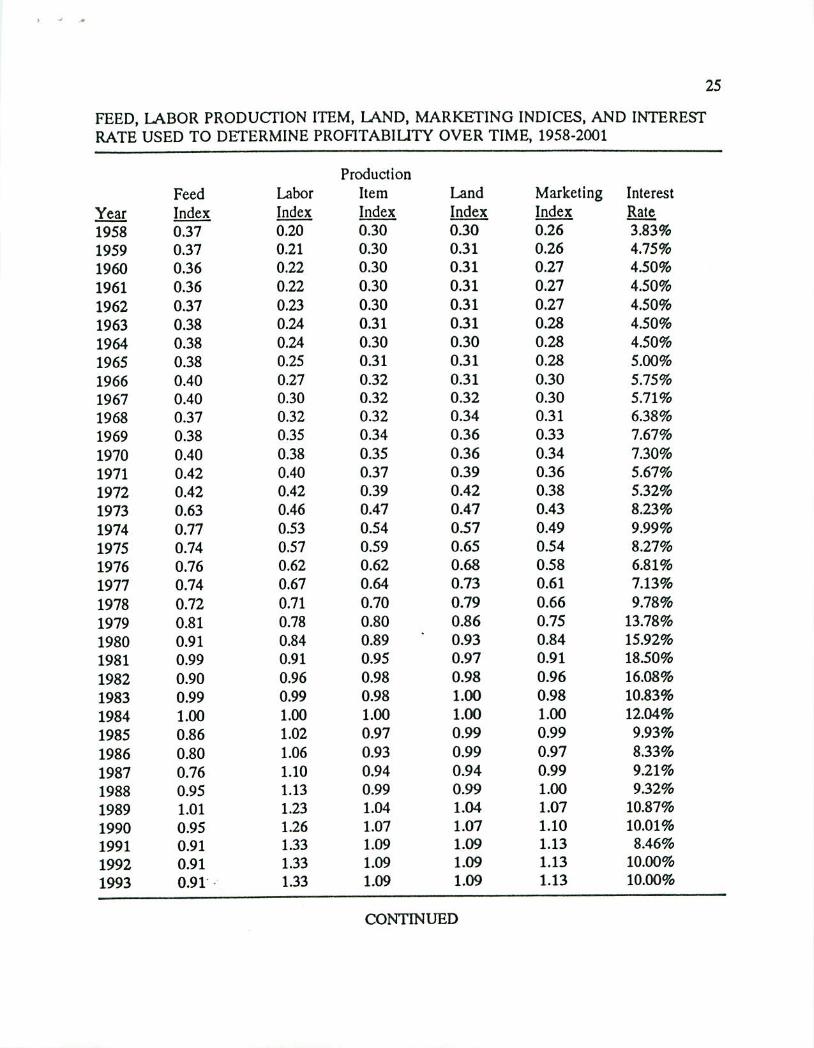
FEED, LABOR PRODUCTION ITEM, LAND, MARKETING INDICES, AND INTEREST
RATE USED TO DETERMINE PROFITABILITY OVER TIME, 1958-2001
Year
1958
1959
1960
1961
1962
1963
1964
1965
1966
1967
1968
1969
1970
1971
1972
1973
1974
1975
1976
1977
1978
1979
1980
1981
1982
1983
1984
1985
1986
1987
1988
1989
1990
1991
1992
1993
Feed
Index
0.37
0.37
0.36
0.36
0.37
0.38
0.38
0.38
0.40
0.40
0.37
0.38
0.40
0.42
0.42
0.63
0.77
0.74
0.76
0.74
0.72
0.81
0.91
0.99
0.90
0.99
1.00
0.86
0.80
0.76
0.95
1.01
0.95
0.91
0.91
0.91
Labor
Index
0.20
0.21
0.22
0.22
0.23
0.24
0.24
0.25
0.27
0.30
0.32
0.35
0.38
0.40
0.42
0.46
0.53
0.57
0.62
0.67
0.71
0.78
0.84
0.91
0.96
0.99
1.00
1.02
1.06
1.10
1.13
1.23
1.26
1.33
1.33
1.33
Production
Item
Index
0.30
0.30
0.30
0.30
0.30
0.31
0.30
0.31
0.32
0.32
0.32
0.34
0.35
0.37
0.39
0.47
0.54
0.59
0.62
0.64
0.70
0.80
0.89
0.95
0.98
0.98
1.00
0.97
0.93
0.94
0.99
1.04
1.07
1.09
1.09
1.09
Land
Index
0.30
0.31
0.31
0.31
0.31
031
0.30
0.31
0.31
0.32
0.34
0.36
0.36
0.39
0.42
0.47
0.57
0.65
0.68
0.73
0.79
0.86
0.93
0.97
0.98
1.00
1.00
0.99
0.99
0.94
0.99
1.04
1.07
1.09
1.09
1.09
Marketing
Index
0.26
0.26
0.27
0.27
0.27
0.28
0.28
0.28
0.30
0.30
0.31
0.33
0.34
0.36
0.38
0.43
0.49
0.54
0.58
0.61
0.66
0.75
0.84
0.91
0.96
0.98
1.00
0.99
0.97
0.99
1.00
1.07
1.10
1.13
1.13
1.13
Interest
Rate
3.83%
4.75%
4.50%
4.50%
4.50%
4.50%
4.50%
5.00%
5.75%
5.71%
6.38%
7.67%
7.30%
5.67%
5.32%
8.23%
9.99%
8.27%
6.81%
7.13%
9.78%
13.78%
15.92%
18.50%
16.08%
10.83%
12.04%
9.93%
8.33%
9.21%
9.32%
10.87%
10.01%
8.46%
10.00%
10.00%
CONTINUED

26
FEED, LABOR PRODUCTION ITEM, LAND, MARKETING INDICES, AND INTEREST
RATE USED TO DETERMINE PROFITABILITY OVER TIME, 1958-2001
Year
1994
1995
1996
1997
1998
1999
2000
2001
Feed
Index
0.91
0.91
0.91
0.91
0.91
0.91
0.91
0.91
Labor
Index
1.33
1.33
1.33
1.33
1.33
1.33
1.33
1.33t-I—r-i—■ ■■■^—IMll'T
Item
Index
1.09
1.09
1.09
1.09
1.09
1.09
1.09
1.09
Land
Index
1.09
1.09
1.09
1.09
1.09
1.09
1.09
1.09
iroduciion
Marketing
Index
1.13
1.13
1.13
1.13
1.13
1.13
1.13
1.13
Interest
Rate
10.00%
10.00%
10.00%
10.00%
10.00%
10.00%
10.00%
10.00%
27
APPENDIX D
BEEF CATTLE PRICES USED, 1958-2001

28
BEEF COW, CULL HEIFER, FEEDER STEERS AND HEIFER PRICES FROM WEST
FARGO, NORTH DAKOTA, 1958-1991
Years
1958
1959
1960
1961
1962
1963
1964
1965
1966
1967
1968
1969
1970
1971
1972
1973
1974
1975
1976
1977
1978
1979
1980
1981
1982
1983
1984
1985
1986
1987
1988
1989
1990
1991
cull
cows
$18.57
$15.62
$14.25
$14.95
$15.33
$13.39
$11.74
$13.62
$16.53
$15.86
$16.68
$18.98
$19.83
$21.04
$25.29
$32.74
$20.30
$22.22
$22.99
$25.34
$41.10
$48.17
$47.30
$40.90
$39.62
$37.30
$36.84
$34.84
$37.11
$50.69
$53.19
$46.29
$53.62
$47.27
cull heifer
7-800#
$26.18
$26.84
$23.50
$23.37
$24.32
$22.02
$18.01
$20.93
$24.09
$24.01
$24.52
$28.05
$29.03
$33.21
$35.24
$45.43
$26.13
$31.88
$30.24
$35.12
$56.23
$68.42
$64.34
$56.94
$57.27
$51.48
$57.25
$52.51
$58.01
$68.55
$75.45
$77.29
$84.17
$82.64
steers
4-500#
steers
6O0-70O#
$33.73
$30.38
$26.27
$27.86
$30.49
$26.93
$21.65
$25.84
$29.13
$29.86
$29.59
$33.12
$36.54
$40.69
$49.46
$61.32
$29.66
$34.84
$38.96
$45.89
$73.10
$95.41
$82.38
$65.85
$65.92
$62.22
$66.03
$63.34
$67.75
$88.98
$92.99
$95.34
$100.64
$97.96
$29.75
$31.70
$28.62
$26.52
$26.53
$25.37
$21.39
$22.00
$27.24
$26.23
$27.50
$30.36
$34.25
$33.36
$39.21
$52.29
$42.10
$31.18
$42.25
$39.52
$55.13 .
$86.10
$71.84
$65.64
$64.43
$65.88
$63.98
$64.55
$57.94
$71.15
$83.19
$81.73
$86.43
$94.87
heifer
4-50O#
$30.13
$27.07
$22.77
$25.01
$26.43
$24.89
$19.80
$19.93
$26.20
$26.02
$25.96
$29.90
$32.44
$36.56
$44.04
$54.32
$26.10
$28.74
$32.16
$3934
$66.32
$84.06
$72.63
$58.43
$58.70
$53.33
$57.08
$55.16
$60.51
$80.96
$85.43
$85.96
$93.06
$89.03
heifers
600-700#
$27.36
$29.26
$25.80
$24.38
$24.70
$23.03
$20.09
$19.10
$24.52
$23.87
$24.79
$27.30
$31.07
$30.59
$34.64
$47.64
$38.64
$26.51
$36.38
$34.26
$50.65
$78.91
$63.47
$60.16
$57.33
$59.84
$54.69
$58.36
$50.51
$65.32
$7734
$74.62
$80.96
$85.78
SOURCE: PETRY, 1992

29
BEEF COW, CULL HEIFER, FEEDER STEERS AND HEIFER PRICES FROM FAPRI
ADJUSTED TO NORTH DAKOTA 1992-2001
Years
1992
1993
1994
1995
1996
1997
1998
1999
2000
2001
cull
cows
$51.55
$50.71
$47.32
$43.79
$44.43
$46.72
$48.71
$50.67
$53.19
$49.80
cull heifer
7-800*
$81.73
$87.00
$78.45
$75.37
$76.05
$80.86
$83.49
$89.24
$94.59
$91.56
steers
4-50O#
steers
600-70O#
$91.45
$96.72
$88.17
$85.09
$85.77
$90.58
$93.21
$98.96
$104.31
$101.28
$87.04
$92.31
$83.76
$80.68
$81.36
$86.17
$88.80
$94.55
$99.90
$96.87
heifer
4-50O#
$85.65
$90.92
$82.37
$79.29
$79.97
$84.78
$87.41
$93.16
$98.51
$95.48
heifers
6OO-70O#
$82.52
$87.79
$79.24
$76.16
$76.84
$81.65
$84.28
$90.03
$95.38
$92.35
SOURCE: FAPRI, 1992

.
30
APPENDIX E
CONTACT PERSONS

31
St Paul Bank of Cooperatives
Jeff Swanhorst
2521 University Drive S.
Fargo, ND 58103
(701) 237-0456
Steve Vangsness
Norwest Bank North Dakota NA
15 2nd Ave. SW
Minot, ND
(701) 852-1331
Todd Vangsness
First American Bank West
20 SW 1st St.
Minot, ND
(701) 852-3361
Warren Sandsness
First Western Bank and Trust
900 S. Broadway
Minot, ND
(701) 852-3711
Bank of North Dakota
700 East Main
PO Box 5509
Bismarck, ND 58502-5509
1-800-472-2166
John Malmberg - 224-5691
Keith Maetzold
North Dakota Future Fund
Barry Pfeiff
Department of Economic Development and
Finance
1833 E. Bismarck Expressway
Bismarck, ND 58504
(701) 221-5300
Dale Rosberg - Loan Guarantee Section
Farmer Home Administration District
Office V
220 E Rosser Ave.
Bismarck, ND 58501
(701) 250-4661
Marv Langerud
Farm Credit Services
1749 38lh St. SW
Fargo, ND 58103
(701) 282-9494
Bill Patrie
ND Assoc of Rural Electric Cooperatives
PO Box 727
Mandan, ND 58554-0727
1-800-234-0518
American Credit Indemnity
James Furio, Agent
377 Butterfield Road, Suite 510
Lombard, IL 60148
(708) 960-9220
(708) 960-3271 (fax)
Canadian Representatives
Rob McNabb
Winnipeg, MB
(204) 945^327
Doug Milligan
Calgary, Alberta
(403) 297-6652
Gordon Hamilton
Regina Saskatchewan
(306) 787-1362