Feasibility Study of the Modernization and Upgrade of a...
11
THE AMERICAN SOCIETY OF MECHANICAL ENGINEERS 345 E. 47 St.. New York, N.Y. 10017 88-JPGC/GT-4 The Society shall not be responsible for statements or opinions advanced in papers or in dis- cussion at meetings of the Society or of its Divisions or Sections, or printed in its publications. Discussion is printed only if the paper is published in an ASME Journal. Papers are available from ASME for fifteen months after the meeting. Printed in USA. Feasibility Study of the Modernization and Upgrade of a Combined Cycle Power Plant MIKE MADISON Public Service of Oklahoma Tulsa, Oklahoma BEN SNOW Westinghouse Electric Corporation Orlando, Florida PERRY ALLISON Public Service of Oklahoma Tulsa, Oklahoma WAYNE SGHWEIKHARD Public Service of Oklahoma Tulsa, Oklahoma ABSTRACT The 220MW Public Service of Oklahoma Comanche Station PACE (Power at Combined Efficiency) combined cycle power plant located in Lawton, Oklahoma under- went a major upgrade and life extension during 1985- 1986. Prior to committing the project, an extensive study was performed to quantify and eva luate the effects of the project on the PSO system and its impact on PSO's long-term goal of providing quality, economical service to its customers. This paper presents techniques used to assess these effects (generical ly) on a utility system and determine the benefits to both consumers and investors. This information is presented in such a form that it may be used as a guide to perform similar studies of plant upgrades and modernizations. INTRODUCTION In May 1972 site work started on the Public Service Company of Oklahoma Comanche Station, the first PACE 260 combined cycle power plant built by Westinghouse. The plant, located 7 miles southeast of Lawton, Oklahoma, was guaranteed by Westinghouse to produce 216 MW at base load with a heat rate of 9193 BTU/KWh at site conditions of 80'F ambient and 1116 ft elevation. Initial Gas Turbine operation began in mid-1973 with the total plant following in March 1974. The original cycle diagram is shown in Figure 1. The plant consists of two W-501 gas turbines, directly coupled to Westinghouse 85,000 KW generators, exhaust- ing to supplementary fired heat recovery steam genera- tors supplying steam to a single cylinder axial flow steam turbine-generator exhausting at 2 1/2" Hg and producing approximately 100 MW. The design uti lizes a turbine bypass valve to permit operation of the Com- bustion Turbine/HRSG combination without operation of the steam turbine. This valve provides flexibility in operation of the plant by permitting operation of the HRSG at various steam flows so that desired steam con- ditions may be achieved prior to steam turbine start- up. The bypass valve also controls steam pressure, stabilizing the steam cycle in the event of a steam turbine trip. DEAERATING FEEOWATER HEATER STACK FEEDWATER , STACK GAS � I J GAS ;;: ;: , ;::::; , " . 0 (. ����cr1-:l �---�-1· . ' � . ,, ;; : ;: , ;::; : ; , , I CONDENSER : . ��· : ----- ii-�- ' 1 : �G��� Ne i'�-�-- = ! SUPPLEMENTARY "---- 7 I�-"�-. - 1GENERA� / SUPPLEMENTARV FUEL � SUPERHEATED STEAM FUEL EXHAUST� . r FUEL UEL . f EXHAUST GAS � · GAS . , I \ ' r \ AIR AIR , COMBUSTION TURBINE & GENERATORS Figure 1 - PACE Coined Cycle Various operating configurations are possible with the major components. Most prominent among these are: A. One or two gas turbines with HRSGS dry. B. One or two gas turbines with HRSGS wet with or without supplemental firing producing steam for the steam turbine. C. One or two gas turbines with the HRSGS wet without the steam turbine. D. Either gas turbine with the HRSG wet, with or without the steam turbine, while the other unit is being operated with the HRSG dry. Presented at the Jt. ASME/IEEE Power Generation Conference Philadelphia, Pennsylvania-September 25-29. 1988 Copyright © 1988 by ASME Downloaded From: http://proceedings.asmedigitalcollection.asme.org/ on 06/27/2018 Terms of Use: http://www.asme.org/about-asme/terms-of-use
Transcript of Feasibility Study of the Modernization and Upgrade of a...
THE AMERICAN SOCIETY OF MECHANICAL ENGINEERS 345 E. 47 St.. New York, N.Y. 10017
88-JPGC/GT-4 The Society shall not be responsible for statements or opinions advanced in papers or in discussion at meetings of the Society or of its Divisions or Sections, or printed in its publications. Discussion is printed only if the paper is published in an ASME Journal. Papers are available from ASME for fifteen months after the meeting.
Printed in USA.
Feasibility Study of the Modernization and Upgrade of a Combined Cycle Power Plant
MIKE MADISON Public Service of Oklahoma
Tulsa, Oklahoma
BEN SNOW Westinghouse Electric Corporation
Orlando, Florida
PERRY ALLISON Public Service of Oklahoma
Tulsa, Oklahoma
WAYNE SGHWEIKHARD Public Service of Oklahoma
Tulsa, Oklahoma
ABSTRACT
The 220MW Public Service of Oklahoma Comanche Station PACE (Power at Combined Efficiency) combined cycle power plant located in Lawton, Oklahoma underwent a major upgrade and life extension during 1985-1986. Prior to committing the project, an extensive study was performed to quantify and eva luate the effects of the project on the PSO system and its impact on PSO's long-term goal of providing quality, economical service to its customers. This paper presents techniques used to assess these effects (generical ly) on a utility system and determine the benefits to both consumers and investors. This information is presented in such a form that it may be used as a guide to perform similar studies of plant upgrades and modernizations.
INTRODUCTION
In May 1972 site work started on the Public Service Company of Oklahoma Comanche Station, the first PACE 260 combined cycle power plant built by Westinghouse. The plant, located 7 miles southeast of Lawton, Oklahoma, was guaranteed by Westinghouse to produce 216 MW at base load with a heat rate of 9193 BTU/KWh at site conditions of 80'F ambient and 1116 ft elevation. Initial Gas Turbine operation began in mid-1973 with the total plant following in March 1974.
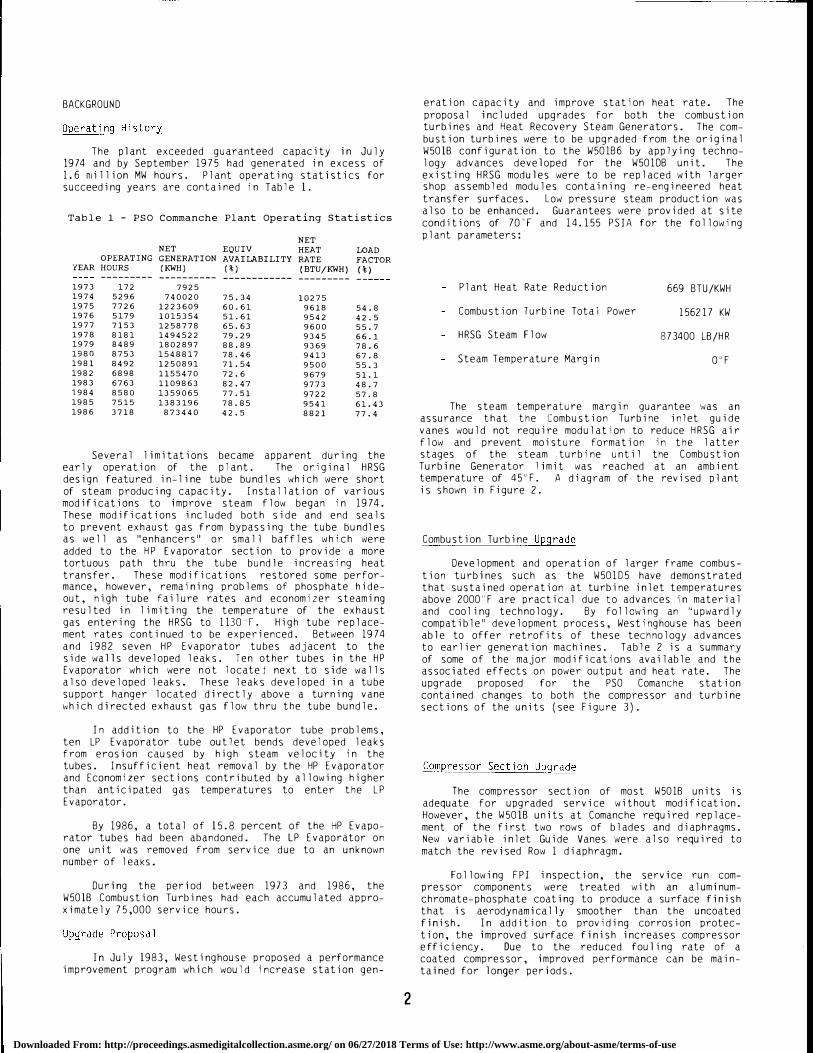
The original cycle diagram is shown in Figure 1. The plant consists of two W-501 gas turbines, directly coupled to Westinghouse 85,000 KW generators, exhausting to supplementary fired heat recovery steam generators supplying steam to a single cylinder axial flow steam turbine-generator exhausting at 2 1/2" Hg and producing approximately 100 MW. The design uti lizes a turbine bypass valve to permit operation of the Combustion Turbine/HRSG combination without operation of the steam turbine. This valve provides flexibility in operation of the plant by permitting operation of the
HRSG at various steam flows so that desired steam conditions may be achieved prior to steam turbine startup. The bypass valve also controls steam pressure, stabilizing the steam cycle in the event of a steam turbine trip.
DEAERATING FEEOWATER HEATER
STACK FEEDWATER , STACK GAS � I J GAS ;;:;:,;::::;," . 0 (.����cr10N-:l�---�-1=-·. -----==-'' �. ,"-, ;;:;:,;::;:;,,
I CONDENSER
: . �9fij�· : ----- ii-�-
'1 : �G���Ne i'�-�--a=...= = ! SUPPLEMENTARY "----7 I�-"�-. - 1GENERA1'� ""' / SUPPLEMENT ARV FUEL � SUPERHEATED STEAM "-./ FUEL
EXHAUST�
.
r FUEL Dp;jUEL . f EXHAUST GAS �· GAS . , I
\ ' r
\ AIR AIR ,
COMBUSTION TURBINE & GENERATORS
Figure 1 - PACE Combined Cycle
Various operating configurations are possible with the major components. Most prominent among these are:
A. One or two gas turbines with HRSGS dry.
B. One or two gas turbines with HRSGS wet with or without supplemental firing producing steam for the steam turbine.
C. One or two gas turbines with the HRSGS wet without the steam turbine.
D. Either gas turbine with the HRSG wet, with or without the steam turbine, while the other unit is being operated with the HRSG dry.
Presented at the Jt. ASME/IEEE Power Generation Conference Philadelphia, Pennsylvania-September 25-29. 1988
Copyright © 1988 by ASME
Downloaded From: http://proceedings.asmedigitalcollection.asme.org/ on 06/27/2018 Terms of Use: http://www.asme.org/about-asme/terms-of-use
BACKGROUND
Operating History
The pl ant exceeded guaranteed capacity in July 1974 and by September 1975 had generated in excess of 1. 6 million MW hours. Plant operating statistics for succeeding years are contained in Table 1.
Table 1 - PSO Commanche Plant Operating statistics
NET NET EQUIV HEAT LOAD
OPERATING GENERATION AVAILABILITY RATE FACTOR YEAR HOURS (KWH) (%) (BTU/KWH) (%)
--------- ---------- ------------ ---------1973 172 7925 1974 5296 740020 75.34 10275 1975 7726 1223609 60.61 9618 54.8 1976 5179 1015354 51. 61 9542 42.5 1977 7153 1258778 65.63 9600 55.7 1978 8181 1494522 79.29 9345 66.1 1979 8489 1802897 88.89 9369 78.6 1980 8753 1548817 78.46 9413 67.8 1981 8492 1250891 71. 54 9500 55.3 1982 6898 1155470 72.6 9679 51.1 1983 6763 1109863 82.47 9773 48.7 1984 8580 1359065 77.51 9722 57.8 1985 7515 1383196 78.85 9541 61. 43 1986 3718 873440 42.5 8821 77.4
Several limitations became apparent during the early operation of the plant. The original HRSG design featured in-line tube bundles which were short of steam producing capacity. Installation of various modifications to improve steam flow began in 1974. These modifications included both side and end seals to prevent exhaust gas from bypassing the tube bundles as well as "enhancers" or small baffles which were added to the H P Evaporator section to provide a more tortuous path thru the tube bundle increasing heat transfer. These modifications restored some performance, however, remaining problems of phosphate hideout, high tube failure rates and economizer steaming resulted in limiting the temperature of the exhaust gas entering the HRSG to 1130 r. High tube replacement rates continued to be experienced. Between 1974 and 1982 seven HP Evaporator tubes adjacent to the side walls developed leaks. Ten other tubes in the HP Evaporator which were not l ocateJ next to side walls also developed leaks. These leaks developed in a tube support hanger located directly above a turning vane which directed exhaust gas flow thru the tube bundle.
In addition to the HP Evaporator tube problems, ten LP Evaporator tube outlet bends developed leaks from erosion caused by high steam velocity in the tubes. Insufficient heat removal by the HP Evaporator and Economizer sections contributed by allowing higher than anticipated gas temperatures to enter the LP Evaporator.
By 1986, a total of 15. 8 percent of the HP Evaporator tubes had been abandoned. The LP Evaporator on one unit was removed from service due to an unknown number of leaks.
During the period between 1973 and 1986, the W501B Combustion Turbines had each accumulated approximately 75,000 service hours.
Upgrade Proposal
In July 1983, Westinghouse proposed a performance improvement program which would increase station gen-
2
eration capacity and improve station heat rate. The proposal included upgrades for both the combustion turbines and Heat Recovery Steam Generators. The combustion turbines were to be upgraded from the original W501B configuration to the W501B6 by applying technology advances developed for the W501DB unit. The existing HRSG modules were to be replaced with larger shop assembled modules containing re-engineered heat transfer surfaces. Low pressure steam production was also to be enhanced. Guarantees were provided at site conditions of 70"F and 1 4.155 PS IA for the following plant parameters:
Plant Heat Rate Reduction
Combustion Turbine Total Power
HRSG Steam Flow
Steam Temperature Margin
669 BTU/KWH
156217 KW
873400 LB/HR
0°F
The steam temperature margin guarantee 'l'laS an assurance that the Combustion Turbine inlet guide vanes would not require modulation to reduce HRSG air flow and prevent moisture formation in the latter stages of the steam turbine until the Combustion Turbine Generator limit was reached at an ambient temperature of 45" F. A diagram of the revised pl ant is shown in Figure 2.
Combustion Turbine Upgrade
Development and operation of larger frame combustion turbines such as the W501D5 have demonstrated that sustained operation at turbine inlet temperatures above 2000"F are practical due to advances in material and cooling technology. By follO\ving an "upwardly compatible" development process, Westinghouse has been able to offer retrofits of these technology advances to earlier generation machines. Table 2 is a summary of some of the major modifications available and the associated effects on power output and heat rate. The upgrade proposed for the PSO Comanche station contained changes to both the compressor and turbine sections of the units (see Figure 3) .
Compressor Section Upgrade
The compressor section of most W501B units is adequate for upgraded service without modification. However, the W501B units at Comanche required replacement of the first two rows of blades and diaphragms. New variable inlet Guide Vanes were also required to match the revised Row 1 diaphragm.
Following F PI inspection, the service run compressor components were treated with an aluminumchromate-phosphate coating to produce a surface finish that is aerodynamically smoother than the uncoated finish. In addition to providing corrosion protection, the improved surface finish increases compressor efficiency. Due to the reduced fouling rate of a coated compressor, improved performance can be maintained for longer periods.
Downloaded From: http://proceedings.asmedigitalcollection.asme.org/ on 06/27/2018 Terms of Use: http://www.asme.org/about-asme/terms-of-use

EXTACTION
TO
UNIT NO -
DEA.ERA TOR FROM CONf,f:NSER
;.p-,VAPO"R.TOR--t::>-.... -----� NO - 2
�EV".\ro"°RA;;R-·U>------NO - l
�----0.-----... ___ - -. . -- - - -' , ____ _
'� -----�. o-..... ---ECON OMIZER
c-::..--=--=- � -P>-<---. r - - - _,,
::-�:::� ·-- - - -=---
HP EVAPORATOR
,- - - - - -r ....... �-- -- - -,- - - --2=-�-=--� SUPERHEATER
t EXHAUST GAS FLOW
BYPASS PIPING ENTERS HEADER FROM BOTH ENDS
LP SEPARATION
VESSEL
LP crnc PUMP NO - 2
LP CIRc PUMP NO - 1
LP. STORAGE DRUM
liP
STEAM
DRUM 1311 PSIA
UNIT NO -
LINE T PREVENT VACUUM IN DEACRATOR AT PART LOAD
��-NR NR VALVE VALVE FROM
UNIT NO -
TO TUR!1!NE
Figure 2 - Revised HRSG Cycle Diagram
Table 2 - Combustion Turbine Upgrade Programs
lMPROVE�ENT REDUCTION IN
ITEM UPGRADE IN POWER HEAT RATE MAJOR MODIFICATION
PACE W501B 4 S�o 34% R 1 R 2 TURBlr-..E BLADES
COMBINED CYCLE"
R 1 R 2 STATIONARY STAGES
WSOlB 7 O'\ O"·, R 1 R 2 TURBINE BLADES
SIMPLE CYCLE
"THE COMBINED CYCLE POWER AND HEAT RATE ARE EXPRESSED AS A PERCENTAGE OF PLANT POWER ANO
HEAT RATE THE PLANT CONSISTS QF TWO GAS TURBINES ANO A STEAM TURBINE
Figure 3 - W501B Upgrade
Turbine Section Upgrade
The existing triple vane segments utilized in the W501B and early W501D units were replaced with single vane segments similar to those in the later W50105 (see Figure 4). This vane, shown in cross section in Figures 5 and 6 contains two cavities separated by a reinforcing rib. Dual cooling inserts are used, with cooling air entering from the top of the vane lnto the insert and exiting through multiple holes in the
3
insert. Fins cast into :he trailing edge facilitate convective cooling in that area. In addition, two rows of gill holes on the suction and pressure sides of the airfoil provide film coo ling of the vane panels on the hot gas sides o f the vane.
� BLADE RING SEGMENT
COOLING AIR SUPPLY TO BLADE RING - :- vANE SEGMENT � ;-COOLING AIR �-�8·�-�
-'----r'-.,+--
IM
_
P
_
l
�
NGEMENT PLATE
VANE SEGMENT LOCK SCREW ,
FL -
�G" ""' S'GM'N' REMOVABLE BY EXTRACTING FORWARD AFTER DISENGAGING LOCK SCREW
Figure 4 - Single Vane Segment
RINGJ SEGMENT
Downloaded From: http://proceedings.asmedigitalcollection.asme.org/ on 06/27/2018 Terms of Use: http://www.asme.org/about-asme/terms-of-use

COOLING AIR DISCHARGE
Figure 5 - Top View of Vane Showing Inserts
TYPICAL GILL HOLES
·� , -- _REINFORCING
,'/./·,-·-·-·-·�. RIB ' I ; _J , '�� GILL , HOLES
TRAILING EDGE-· COOLING FINS
VANE TYPE: 2 CAVITY WITH CAST-IN TRAILING EDGE SLOTS. PIN FINS WITH EDM MACHINED GILL HOLES
INSERT TYPE: 2-IMPINGEMENT INSERTS
Figure 6 _ cross section of Vane
The single vane concept offers the following advantages:
1.
2.
3.
The vanes are individual ly removable from within the combustor shell after removal
. of
the transitions, eliminating the need to lift the turbine cover. This feature also allows the vanes to be "indexed" around the blade ring to equalize the exposure of the vane segmeds.
Sophisticated cooling reduces the operating temperature of the single vane below that of a triple vane segment at equal firing temperatures.
Increased creep life and stresses between the airfoil the vares to be run more repairs.
lower thermal and shroud allow
hours without
4
4. The accessibility of the vanes during combustor inspections, allows increasing the intervals between turbine section inspections.
New Row 2 vane segments originally the W5010 unit were also installed. utilize improved impingement cooling enhanced trailing edge cooling.
developed for These vanes
inserts and
The existing U720 Row 1 turbine blades which had accumulated in excess of 30,000 operating hours on each unit were replaced with new blades with improved leading edge cooling during the rebuild of the rotors. These bl ad es wi 11 be replaced with new U520 blades during the first hot path inspection.
Cooled Row 2 turbine blades made from U520 material were installed in the existing Row 2 turbine disc. The torque tube air separator was modified to provide additional cooling air for operation at the new firing temperature.
The Row 3 turbine blades were reused without modification following an NOT inspection. The Row 3 and Row 4 turbine vane segments were also FPI inspected and reused.
Row 4 turbine blades were "reorofi led" to reduce their response to third harmonic excitation resulting from differences in energy inputs from the individual baskets.
More durable turbine interstage seal assemblies were installed (see Figure 7). The revised seal design utilizes caulked seal strips in a machined housing rather than individual segments. The ruggedized seal assembly eliminates the possibility that individual seal segments can be excited by jets of high pressure rotor cooling air 'n the event that a crack develops in a turbine disc air baffle.
Figure 7 - Cross Section of Interstage Seal Assembly
Combustor Section
Ribs were added to the existing transitions to reduce stresses at the increased firing temperature. �odifications were also made to allow use of new inner and outer seals on the transition outlet.
A coating to reduce fretting was applied to high wear areas in the combustor section. New combustor baskets wi th improved cooling and brazed primary sections completed the combustion system modifications.
Downloaded From: http://proceedings.asmedigitalcollection.asme.org/ on 06/27/2018 Terms of Use: http://www.asme.org/about-asme/terms-of-use
HEAT RECOVERY STEAM GENERATOR UPG�ADE
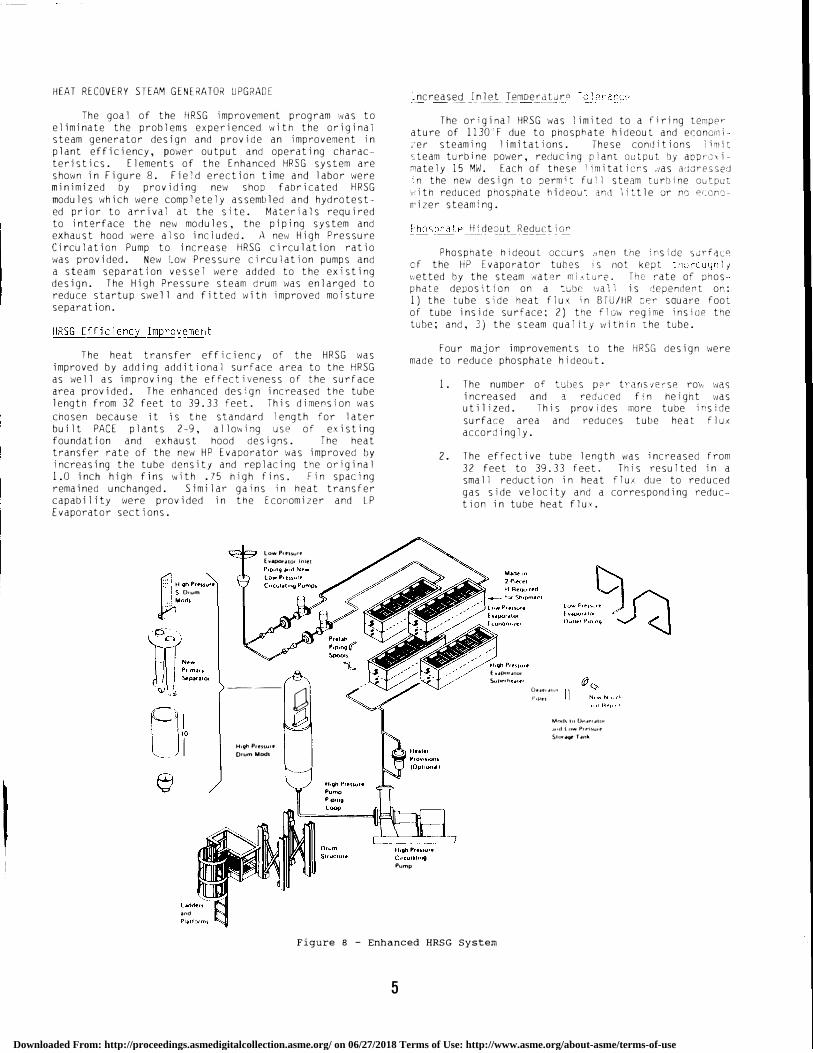
The goal of the HRSG improvement program ',,1as to eliminate the problems experienced with the original steam generator design and provide an improvement in plant efficiency, power output and operating characteristics. Elements of the Enhanced HRSG system are shown in Figure 8. Field erection time and labor were minimized by providing new shop fabricated HRSG modules which were completely assembled and hydrotested prior to arrival at the site. Materials required to interface the nevi modules, the piping system and exhaust hood were also included. A new High Pressure Circulation Pump to increase HRSG circulation ratio was provided. New Low Pressure circulation pumps �nd a steam separation vessel were added to the existing design. The High Pressure steam drum was enlarged to reduce startup swell and fitted with improved moisture separation.
HRSG Efficiency Improvement
The heat transfer efficienc1 of the HRSG was improved by adding additional surface area to the HRSG as wel 1 as improving the effectiveness of the surface area provided. The enhanced design increased the tube length from 32 feet to 39.33 feet. This dimension was chosen because it is the standard length for 1 ater built PACE plants 2-9, allowing use of existing foundation and exhaust hood designs. The heat transfer rate of the new HP Evaporator was improved by increasing the tube density and replacing the original 1.0 inch high fins 1.'lith . 75 high fins. Fin spacing remained unchanged. Similar gains in heat transfer capability were provided in the Economizer and LP Evaporator sections.
�HoghP"""" S Orum
"°"'
•nd
low Pin�" E¥�oi101lnlet
---a I?
High P1euur•
Orum Mods
_ncreas�Jn�J__J�moe_r:_d_!_Jr"
The original HRSG was limited to a fir i ng temper ature of 1130 F due to phosphate hideout and economi;er steaming limitations. These conditions limit �team turbine power, reducing plant output by aopro\imately 15 MW. Each of these I imitaticrs was a�aresseJ 'n the new design to �ermit ful I steam turbine output with reduced phosphate hideou· and little or no elonon·izer steaming.
£b_()SiJhate _f11 de0u_t_Recj�_ct i Of'
Phosphate hideout occurs �nen the irside surface cf the HP Evaporator tubes is not kept thorouc;h l / �etted by the steam water m i A t u re. The rate of phos phate deposition on a �ubr 1,1a11 is dependent on: 1) the tube side heat flux in BTU/HR cer square foot of tube inside surface; 2) the flm" regime insic1e the tube; and, 3) the steam qua 1 i ty v1 i th in the tube.
Four major improvements to the HRSG design were made to reduce phosphate hideout.
Pump
1. The number of tuiles P'"' trar1S'lersR ro" was increased and a reduced fin height was utilized. This provides more tube inside surface area and reduces tube heat flux accordingly.
2. The effective tube length vias increased from 32 feet to 39.33 feet. This resulted in a small reduction in heat flu; due to reduced gas side velocity and a corresponding reduction in tube heat flux.
E �.ipm.itrn Supr1h .. . ue•
D•H·•<tlVI r,'-'"
Motl\ In Ot'.ol'r.tlm
.1,.d low Pr .. Hu•t SlrnqT.ink
Figure 8 - Enhanced HRSG System
5
Downloaded From: http://proceedings.asmedigitalcollection.asme.org/ on 06/27/2018 Terms of Use: http://www.asme.org/about-asme/terms-of-use
r
3. A new HP circulation pump was utilized which more than doubled the circulation ratio of the HP Evaporator thus reducing evaporator exit steam quality.
4. The new tube bundle eliminates the heat transfer enhancers utilized in the original design. These enhancers, while increasing heat transfer, caused local increases in tube heat f lux of 20 to 30 percent.
The enhanced HRSG modules offer a 65� decrease in turbine back pressure and a 15i\ reduction in average heat flux. The ne1v HRSG design has substantially lower heat flux at the 1 180 to 1200 F firing temperature range the original HRSG at 1130·F gas inlet temperature and will permit full steam production at reduced phosphate hideout levels.
Economizer Steaming Reduction
The original HRSG at Comanche experienced excessive steaming in the economizer section at elevated gas inlet temperatures. This was an operating limitation because the feedwater control valve lacked sufficient capacity to pass the increased vo lumetric flow. This resulted in a loss of drum leve l when the HRSG steam flow exceeded this limiting value. This condition >t1as shown to be primarily due to a lack of heat transfer capability in the HP Evaporator which resulted in a pinch temperature (the difference between the gas exiting the evaporator section and the evaporator saturation temperature) of lOO"F versus an expected pinch of 50'F.
Econo1J1izer Recircu lation Flow a lso affected economizer steaming. The minimum expected economizer recirculation flow was approximately 10% of maximum design flow. In actual practice, it proved more efficient to minimize or el iminate this flow when extraction steam was available from the steam turbine. This improved plant efficiency but the reduced economizer flow aggravated economizer steaming. The Enhanced HRSG design eliminated economizer steaming by adding additional heat transfer surface area to the HP Evaporator section reducing the pinch temperature. The head capacity characteristic of the Boiler Feed pump was also mod ified to ensure that the economizer saturation temperature was above the gas exit temperature of the HP Evaporator at all operating conditions.
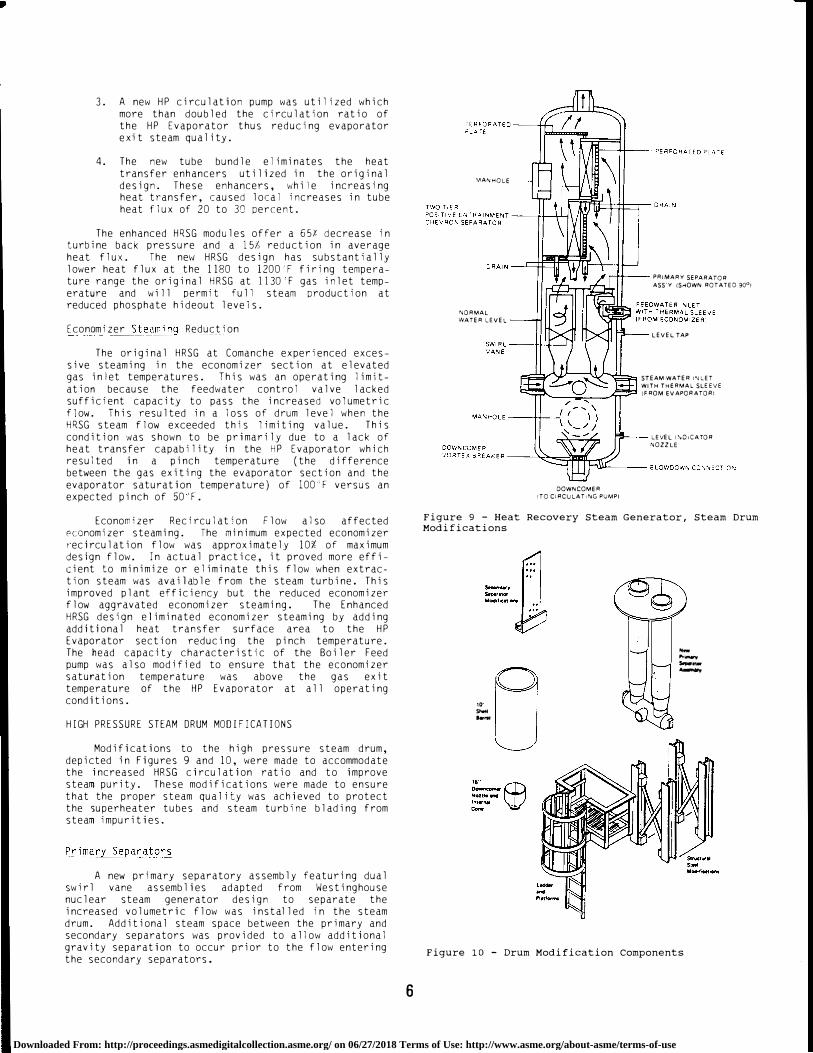
HIGH PRESSURE STEAM DRUM MODIFICAT IONS
Modifications to the high pressure steam drum, depicted in Figures 9 and 10, were made to accommodate the increased HRSG circulation ratio and to improve steam purity. These modifications were made to ensure that the proper steam quality was achieved to protect the superheater tubes and steam turbine blading from steam impurities.
Primary Separators
A new primary separatory assembly featuring dual sw irl vane assemblies adapted from Westinghouse nuclear steam generator design to separate the increased volumetric flow was installed in the steam drum. Additional steam space between the pr imary and secondary separators was provided to allow additiona l gravity separation to occur prior to the flow entering the secondary separators.
6
\1ANHOLE
NORMAL
WATER LEVEL
r-t1f--- PRIMARY SEPARATOR
DOWNCOMER
!TO CiACULAT11\jG PUMP)
ASS'Y {SMOWN ROT A TED 9001
L EVEL TAP
STEAM WATER l"JLET
WITH THERMAL SLEEVE
!FROM EVAPOAATOAI
LEVEL l�OICATOR
1�0ZZLE
Figure 9 - Heat Recovery Steam Generator, Steam Drum Modifications
10· ...... .....
-...... ---
Figure 10 - Drum Modification Components
Downloaded From: http://proceedings.asmedigitalcollection.asme.org/ on 06/27/2018 Terms of Use: http://www.asme.org/about-asme/terms-of-use

� I
Perforated Plate Modifications
Perforated plates were added at the inlet plane of the secondary chevron separators. These plates aid the separation process in two ways. First, they promote uniform flow into the chevron separators thereby maximizing their effectiveness. Secondly, the perforated plates provide nucleation zones for water contained in the steam flow. The water droplets which collect on the plates are collected in drains and piped to the bottom of the vessel.
Shell Barrel Extension
The steam drum length was increased by ten feet by the addition of a shell barrel extension. This increased the operating range of 't1ater level to 180 inches between trip setpoints. This wide separation of trip points provides a large water inventory to accommodate level excursions which may occur during HRSG startup, pressure transients or circulation pump trip and restart.
Downcomer Nozzle
The original downcomer nozzle was replaced with a new 16 inch down comer nozzle complete with internal inlet cone and vortex breaker required to min1m1ze entrance losses to the larger High Pressure Circulation Pump.
Structural Changes
A ten foot structural steel extension was installed elevating the top section of the vessel ten feet. The lower drum head was retained at its origi
�al elevation following the HP drum shell length increase. A new ladder and platform to provide access �o the upper drum manway and safety valves was also inst a 11 ed.
LOW PRESSURE EVAPORATOR
The low pressure evaporator section of the original PACE HRSG was replaced t1ith two separate low pressure evaporator loops. The production of low pressure steam is matched to plant load conditions by the control system to provide the maximum available low pressure steam supply to the deaerator while not exceeding the maximum extraction pressure of the Steam Turbine and avoiding excessive deaerator pressures at low loads. The new lc-w pressure evaporation section was designed to provide both increased steam production and reduced tube exit velocities. (See Figure 1 1.) Tube exit velocity was reduced by increasing the inside diameter of the low pressure evaporator tubes. The fin height was reduced so that the tube O.D. of the low pressure evaporator and economizer are equal. This maintains the same transverse pitch on both the low pressure evaporator and economizer sections so that cleanability and inspectability are not impaired. The redesign of the tube circuits also eliminated the tube bend erosion experienced by the previous PACE HRSG design.
The primary benefit of increased low pressure evaporator steam flow occurs at intermediate Steam Turbine power outputs where less Steam Turbine extraction flow is required for feed1vater heating in the deaerator. This results in higher steam turbine power output at these conditions.
A separate Low Pressure Steam Separation Vessel was provided to reduce the volumetric flow through the deaerator section.
7
220 0 w (f) 180 .... "- 160 >->--
140 0 120 0 ...J 100 w > 60 >--x 60 w w 40 "' :::> 20 ->--
ORIGINAL DESIGN 380"F ---ECONONMIZEA OUTLET GAS TEMP
ALTERNATE LP EVAPORATOR TUBF DESIGN
� 380�F ECONOMIZER OUTLET GAS TEMP.
20 25
DEAERATOR PRESSURE - PSIA 30
EXPECTED
OPERATING
POINT
Figure 11 - L.P. Evaporator Tube Exit Velocity vs. Deaerator Operating Pressure
ECONOMIC EVALUATION
The economic performance of an improvement can be determined by examining the effect of the improvement on the system fuel cost and pl ant maintenance cost. During the negotiation phase of the project, Westinghouse performed an economic evaluation of the upgrade.
System Fuel Cost
Yearly system fuel costs are determined by the system demand and the capacity, heat rate and fuel cost of the individual generating plants operating on the system. While some items such as the power output and heat rate of individual plants may remain relatively constant, other items such as fuel cost and load growth are affected by random pressures and can seldom be predicted to a single value in the future. These items usually exist as a range with a lowest, highest and most likely value for each.
A common statistical assumption may be used to compute a most probable value for such items provided the distributions for these items are unimodal; i.e. have only one most likely occuring value. The standard deviation for such distributions is generally one sixth of the range of the distribution. This estimate is based on the fact that 89'.lo or more of any normal distribution lies within three standard deviations of the mean. By establishing estimates for the lowest and highest values of the range, the standard deviation of the range may be estimated as:
Standard Deviation = (Highest Value - Lowest Value/6
The most likely value of the distribution is commonly known as the mode. Provided the distribution is unimodal i.e. contains only one most probable value, the lowest, highest and most likely values can be combined in the following equation based on the previously described estimate of the standard deviation to produce a closer approximation of the most probable value of the distribution. This concept is illustrated in Figure 12.
Most Prob Value = (Lowest Value + 4*Most Like Value + Highest Value)/6
This principle was applied to determine the most probable values for the costs of fuels used in the PSO system over the fifteen year span of the study. Fuel costs for the different coal fired plants on the PSO system are summarized in Table 3. Fuel costs for gas were considered uniform for the system and are shown in Table 4.
Downloaded From: http://proceedings.asmedigitalcollection.asme.org/ on 06/27/2018 Terms of Use: http://www.asme.org/about-asme/terms-of-use

µ±Ja ----i 99.7%
I �--- µ± 2o ___ __.
95.40/o
µ-3a µ-a
µ-2a
0-= Standard Deviation
µ±a 68.J"lo
µ
a
µ+a µ+ Ja
µ-2a
J.-l = Most Probable Valve
Figure 12 - Normal Probability Distribution
Table 3 - PSO Coal Costs ($/MMBTU)
A simple dispatching model was developed to
determine the expected annual fuel expenditures on the
PSO system for the span of the study. Discounted cash
flow techniques were used to determine the net present
value in 1984 dollars of these expenditures. Both
current and proposed generating capacity were included
in the model. The base case generating plants making
up the PSO system are shown in Table 5. The values
shown for yearly generation for each plant were
computed from the following relation:
Yearly Generation = Rated Plant KW * Load Factor *Availability * 8760
Table 5 - PSO System Generation Capability
PSO SYSTEM GENERATION WITHOUT UPGRADE
PLANT
TYPE
N.E.3&4 OKLA UNION PROPOSED COMANCHE REM GAS
COAL COAL COAL GAS GAS
RATED KW 940000 170000 380000 214000
rl.EAT RATE 10200
LOAD FACTOR 0. 97
Z,,VAILABILITY 0. 9
iRLY GEN MWH 7188631
9600
0. 9
1340280
9600
1
0. 9
2995920
9270
0. 8
0. 85
1274755
PSO SYSTEM GENERATION WITH UPGRADE
PLANT
TYPE
RATE KW '!EAT RATE
LOAD FACTOR
AVAILABILITY
N.E.3&4 OKLA UNION
COAL COAL
940000 170000
10200 9600
0. 97 1
0. 9 0. 9
iRLY GEN mm 7188631 1340280
OKLA UNION
PROPOSED COMANCHE
COAL GAS
380000 246000
9600 8500
1 0. 8
0.9 0.85
2995920 1465373
PROPOSED PLANT
11204
REM GAS
GAS
11204
YEAR LOWEST LIKELY HIGHEST PROBABLE LOWEST LIKELY HIGHEST PROBABLE LOWEST LIKELY HIGHEST PROBABLE
1984 1.96 1985 2.05 1986 2.14 1987 2.24 1988 2.34 1989 2.44 1990 2.55 1991 2.67 1992 2.79 1993 2.91 1994 3.04 1995 3. 18 1996 3.32 1997 3.47 1998 3.63 1999 3.79
1.96 2.06 2.16 2.27 2.38 2.50 2.63 2.76 2.90 3.04 3. 19 3.35 3.52 3.70 3.88 4.07
1.96 2.10 2.24 2.40 2.57 2.75 2.94 3.15 3.37 3.60 3.86 4 .13 4.41 4.72 5.05 5.41
1.96 2.06 2.17 2.29 2.41 2.53 2.67 2.81 2.96 3 .11 3.28 3.45 3.64 3.83 4.03 4.25
Table 4 - PSO Gas Costs ($?MMBTU)
YEAR
1984
1985
1986
1987
1988
1989
1990
1991
1992
1993
1994
1995
1996
1997
1998
1999
LOWEST LIKELY HIGHEST
2.29 2.29 2.29
2.36 2.40 2.52
2.43 2.52 2.77
2.50 2.65 3.05
2.58
2.65
2.73
2.82
2.90
2.99
3.08
3. 17
3.26
3. 3 6
3.46
3.57
2.78
2.92
3.07
3.22
3.38
3.55
3.73
3.92
4 .11
4.32
4.53
4.76
3.35
3.69
4.06
4.46
4.91
5.40
5.94
6.53
7 .19
7.91
8.70
9.57
3.41 3.55 3.69 3.84 3.99 4.15 4.31 4.49 4.67 4.85 5.05 5.25 5.46
PROBABLE
2.29
2.42
2.55
2.69
2.84
3.01
3 .18
3.36
3.56
3. 77
3.99
4.23
4.48
4.76
5.05
5.36
3.41 3.60 3.80 4.00 4.22 4.46 4.70 4.96 5.23 5.52 5.82 6.15 6.48
8
3.41 3.65 3.90 4. 18 4.47 4.78 5. 12 5.48 5.86 6.27 6.71 7.18 7.68
3.41 3.60 3.80 4.00 4.23 4.46 4.71 4.97 5.24 5.53 5.84 6.17 6.51
2.66 2.74 2.82 2.91 2.99 3.08 3.18 3.27 3.37
2.66 2.79 2.93 3.08 3.23 3.39 3.56 3.74 3.93
2.66 2.82 2.99 3.17 3.36 3.56 3.77 4.00 4.24
2.66 2.79 2.92 3.07 3.21 3.37 3.53 3.71 3.89
To ensure conservatism, the load factors and availabilities for the coal plants were shown as being higher than those for the Comanche Plant although this is contrary to existing data. Most probable values for total system generation were calculated from estimates of lowest, most likely and highest values of load growth. These values are shown in Table 6.
The simplified dispatching model assumed that all coal fired plants and the Comanche Combined Cycle plant would generate their calculated yearly generation. The difference between the total yearly generation and the total system generation was assumed to be generated by the remaining gas plan'.:s. The yearly fuel cost for each plant was determined by:
Yearly Fuel Cost = Yearly Generation * Fuel Cost * Heat Rate
Downloaded From: http://proceedings.asmedigitalcollection.asme.org/ on 06/27/2018 Terms of Use: http://www.asme.org/about-asme/terms-of-use

Table 6 - PSO Expected System Total Generation
YEAR LOWEST LIKELY HIGHEST PROBABLE
1984 12763300 12763300 12763300 12763300
1985 13031329 13210015 13401465 13212142
1986 13304987 13579895 14004530 13604850
1987 13584392 13973712 14704757 14030666
1988 13869664 14357990 15425290 14454485
1989 14160927 14774371 16119428 14896307
1990 14458307 15188054 16828683 15339867
1991 14761931 15605725 17560731 15790927
1992 15071932 16027080 18298281 16246422
1993 15298011 16411730 18938721 16647275
1994 15527481 16805611 19696270 17074366
1995 15760393 17217349 20523514 17525550
1996 15996799 17647782 21385501 17995572
1997 16236751 18097801 22283692 18485274
1998 16480302 18562914 23219607 18991928
1999 16727507 19045550 24194831 19517423
Table 7 - Probable System Fuel Costs Without Upgrade
FUEL COST
OKLA
YEAR TOT GEN N.E. 3&4
1984 12763300 143715115
1985 13212142 151260158
1986 13604850 159260158
UNION
1987 14030666 167588809 43875406
1988 14454485 176418438 46288553
1989 14896307 185724478 48837715
1990 15339867 195533349 51530732
PROPOSED
Total fuel costs of the PSO system ,Jithout and with the Comanche upgrade are shown in Tab les 7 and 8. An annual discount rate of 13% '.•JaS used to determine the value of fuel expenditures in 1984 dollars. Fuel savings resulting from the upgrade program were determined by subtracting the Net Present Value of fuel costs for the PSO system 1;1ith the upgraded Comanche plant from the system fuel costs without the upgrade program.
Maintenance Costs
In order to maintain the pre-upgrade levels of power output and availability of the Comanche Station, substantia l replacement of HRSG tubes would have been required. Previous maintenance history was
_used to
predict future HRSG maintenance costs with the original HRSG design. This experience indicated t�at the HP Evaporator section of each HRSG would require retubi ng every seven years and the economizer tubes every twelve. Five unscheduled tube replacements per year were also included in the model. These costs are
COMANCHE REM GAS
SYSTEM
GENERATION
COAL GAS
27060886 110323571 56% 44%
28549235 128540779 54% 46%
30131845 146885557 53% 47%
31815605 127508476 61% 39%
33607969 148196625 59% 41%
35517008 171492838 57% 43%
37551471 197108522 56%
TOT.c'\L
FUEL COST
1991 15790927 205872980 54375911 76503813 39720837 112655111 73%
1992 16246422 216772899 57382045 80201497 42035391 137373285 71%
1993 16647275 228264327 60558449 84084066 44506289 162363323 69%
1994 17074366 240380279 63914985 88160992 47145644 191082937 67%
1995 17525550 253155670 67462103 92442245 49966609 223891124 66%
1996 17995572 266627427 71210867 96938312 52983476 261020706 64%
1997 18485274 280834608 75173002 101660230 56211781 303023964 62%
1998 18991928 295818533 79360925 106619613 59668416 350320867 61%
1999 19517423 311622614 83787794 111828683 63371761 403637784 59%
44�.
27%
29%
31%
33%
34%
36%
38%
39%
41%
42481'+687 45961 l330 49543�599 53837''107 58093>023 62729,�·51 7 67725/423 61849�·819
67033<",519
72395c715 78290<, 125 847631176 91846q903 996077963
1080098274 1174043166
1984 NPV OF FUEL COST 4089100572
Table 8 - Probable System Fuel Costs With Upgrades
FUEL COST SYSTEM
OKLA
YEAR TOT GEN N.E. 3&4 UNION GENERATION TOTAL
PROPOSED COMANCHE REM GAS COAL GAS FUEL COST
1984 12763300 143715115
1985 13212142 151260158
1986 13604850 159210598
1987 14030666 167588809 43875406
1988 14454485 176418438 46288553
1989 14896307 185724478 48837715
1990 15339867 165533349 51530732
28523482 105432865 56%
30092273 123381084 54%
31760421 141439837 53%
33535186 121758451 61%
35424423 142122666 59%
37436643 165073859 57%
39581065 190321856 56%
1991 15790927 205872980 54375911 76503813 41867682 105476375 73%
1992 16246422 216772899 57382045 80201497 44307334 129776241 71%
1993 16647275 228264327 60558449 '84084066 46911780 145319714 69%
1994 17074366 240380279 63914985 88160992 49693787 182562318 67%
1995 17525550 253155670 67462103 92442245 52667221 214860673 66%
1996 17995572 266627427 71210867 969383i2 55847145 251445018 64%
1997 18485274 280834608 75173002 101660230 59249934 292864824 62%
1998 18991928 295818533 79360925 106619613 62893395 339537011 61%
1999 19517423 311622914 83787794 111828683 66796899 392184623 59%
1984 NPV OF SYSTEM FUEL COST
9
44%
46%
47%
39%
41%
43%
44%
421386576
455993674
491621'+55
534346662
576672'.119
622797173
672500'151
27% 613465''28
29% 655011" 1 7
3 1 % 71 8328'.:·96
33% 776931 t.49
34% 842301�037
36% 911757883
38% 988956'· 76
39% 1073428�<97
41% 1166015'.43
4058277'10 1
Downloaded From: http://proceedings.asmedigitalcollection.asme.org/ on 06/27/2018 Terms of Use: http://www.asme.org/about-asme/terms-of-use

tabulated in Table 9. Projected expenditures for HRSG maintenance over the study period are shown in Table 10. The base year costs shown in Table 9 were escalated by five percent per year to arrive at the annual expenditures shown.
Table 9 - HRSG Maintenance Requirements W/O Upgrade
TOTAL NUMBER OF TUBES REQUIRING REPLACEMENT
284 (2 X624) 128 (2 x 64) 938 (2 x 469)
5
HP EVAPORATOR TUBES
LP EVAPORATOR TUBES
ECONOMISER TUBES
UNSCHEDULED PER YEAR
RECURRING MAINTENANCE REQUIREMENTS
HP EVAPORATOR: RETUBE COMPLETE SECTION EVERY SEVEN YEARS
ECONOMISER: RETUBE COMPLETE SECTION EVERY TWELVE YEARS
UNSCHEDULED: 5 TUBE REPLACEMENTS PER YEAR
�ATERIAL COSTS
HP EVAPORATOR TUBE
LP EVAPORATOR TUBE
ECONOMISER TUBE
HEADER
187.00 EA.
264.00 EA.
EA.
EA.
2 64. 00 5000.00
1986 LABOR COST 27.00
CRANE REQUIRED: ONE DAY FOR EACH
REPLACEMENTS.
PER MAN HOUR
11 SCHEDULED TUBE
THREE DAYS OF EACH 5 UNSCHEDULED TUBE
REPLACEMENTS.
'!ANHOUR REQUIREMENTS
HP EVAPORATOR 75 MANHOURS PER TUBE
LP EVA!'ORATOR 50 MANHOURS !'ER TUBE
ECONDMISER 50 MAN HOURS PER TUBE
HEADER 100 MAN HOURS !'ER HEADER
UNSCHEDULED 136 MANHOURS !'ER TUBE
Table 10 - Projected HRSG Maintenance Costs Without r:psrade
YEAR LABOR
1984 1985 1986 1245712 1987 1597378 1988 1452052 1989 1496304 1990 1571120 1991 1992 1993 1489140 1994 2247671 1995 1996 1997 1998 1999
CRANE
39690 47926 64133 67340 70707
44678 67436
MATERIAL UNSCHEDULED TOTAL
164863 21968 1472233 159326 23067 1827697 300998 24220 1841403 316048 25431 1905123 331851 26703 2000381
28038 28038 29440 29440
148530 30912 1713260 22418 8 32457 2571752
34080 34080 35784 35784 37573 37573 39452 39452 41425 41425
1984 NPV OF HRSG MAINTINANCE COST 7834689
Combustion turbine inspection intervals with and without the upgrade are listed in Table 11. A substantial saving in Combustion Turbine maintenance can be realized by the elimination of the turbine hot path inspection after the upgrade program. This is made possible by the Row 1 Single Vane which can be replaced during an annual combustor inspection.
Annual Combustion Turbine maintenance expenditures are shown in Table 12. As with the annual HRSG maintenance costs, a 5% escalation was applied to the base year costs to arrive at the projected annual Combustion Turbine maintenance expenditures. Combus-
10
tion Turbine components which were nearing the end of their predicted operating life and were replaced with improved components as part of the upgrade were not shown separately in the material costs for the upgraded units.
Table 11 - Combustion Turbine Maintenance
Requirements
MATERIAL COST W/0 UPGRADE
COMPONENT COST EXPENDITURE
YEAR
ROW 2 RING SEGMENTS
ROW 2 VANE SEGMENTS
ROTOR INSPECTION
INSPECTION INTERVALS
INSPECTION
$ 115,000.00 $ 801,600.00 $ 684,000.00
TYPE W/O UPGRADE W UPGRADE
COMBUSTOR 8000 HOURS 8000 HOURS HOT PATH 16000 HOURS NOT REQ'D MAJOR 24000 HOURS 24000 HOURS
1985 1987 1985
$ COST
65,000.00 $ 245,000.00 $ 245,000.00
Table 12 - Projected HRSG Maintenance costs With Upgrade
W/O UPGRADE
YEAR LABOR MATERIAL TOTAL
1984 1985 245000 800000 1045000 1986 0 1987 259700 801600 1061300 1988 0 0 1989 275282 275282 1990 0 0 1991 291799 291799 1992 0 0 1993 309307 309307 1994 0 0 1995 327865 327865 1996 0 0 1997 347537 347537 1998 0 0 1999 368389 368389 1984
NPV 988538 1263514 2252051
W UPGRADE
LABOR MATERIAL TOTAL
0 0 0
245000 245000 0 0
259700 259700 0 0 0 0
275282 275282 0 0 0 0
291799 291799 0 0 0 0
401321 401321 NOTE: COST OF OPERATING SPARES NOT INCLUDED
Performance
Following completion of the plant modifications, plant performance was tested. Comparison to a similar test performed prior to the upgrade program is given below:
Pre Mod. Post Mod. Guarantee
- Plant Heat 9359 8469 8690 Rate
(BTU/KWH)
- CT Total 138024 159982 156217 Power (KW)
- HRSG Steam 745928 984341 873400 Flow
(LBM/HR)
- Steam Temp NA 23. 2 0 Margin (F)
Downloaded From: http://proceedings.asmedigitalcollection.asme.org/ on 06/27/2018 Terms of Use: http://www.asme.org/about-asme/terms-of-use
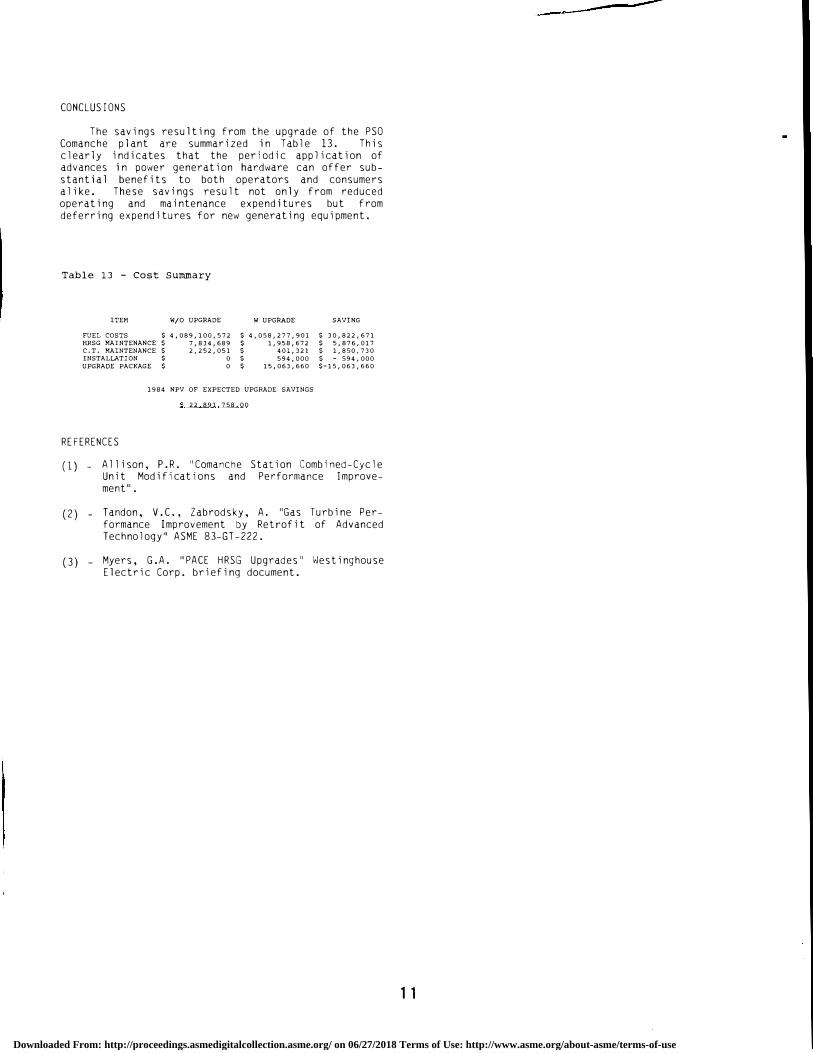
CONCLUSIONS
The savings resulting from the upgrade of the PSO Comanche plant are summarized in Table 13. This clearly indicates that the periodic application of advances in power generation hardware can offer substantial benefits to both operators and consumers alike. These savings result not only from reduced operating and maintenance expenditures but from deferring expenditures for new generating equipment.
Table 13 - Cost Summary
ITEM W/O UPGRADE W UPGRADE SAVING
FUEL COSTS $ 4,089,100,572 $ 4,058,277,901 $ 30,822,671 HRSG MAINTENANCE$ 7,834,689 $ 1,958,672 $ 5,876,017 C.T. MAINTENANCE$ 2,252,051 $ 401,321 $ 1,850,730 INSTALLATION $ 0 $ 594, 000 $ - 594 I 000 UPGRADE PACKAGE $ 0 $ 15,063,660 $-15,063,660
1984 NPV OF EXPECTED UPGRADE SAVINGS
$ 22 891 758.00
REFERENCES
(1) -
(2) -
( 3) -
Allison, P.R. "Comanche Station Combined-Cycle Unit Modificat ions and Performance Improvement".
Tandon, V.C., Zabrodsky, A. "Gas Turbine Performance Improvement by Retrofit of Advanced Technology" ASME 83-GT-222.
Myers, G. A. "PACE HRSG Upgrades" Westinghouse Electric Corp. briefing document.
1 1
Downloaded From: http://proceedings.asmedigitalcollection.asme.org/ on 06/27/2018 Terms of Use: http://www.asme.org/about-asme/terms-of-use