FEASIBILITY STUDY FOR UNDERGROUNDING ELECTRIC DISTRIBUTION ...
26
i FEASIBILITY STUDY FOR UNDERGROUNDING ELECTRIC DISTRIBUTION LINES IN MASSACHUSETTS December 2014
Transcript of FEASIBILITY STUDY FOR UNDERGROUNDING ELECTRIC DISTRIBUTION ...

i
FEASIBILITY STUDY FOR UNDERGROUNDING
ELECTRIC DISTRIBUTION LINES IN
MASSACHUSETTS
December 2014

ii
Acknowledgments: This report was prepared by staff at the Department of Energy Resources (DOER)
with Joanna Troy serving as the primary researcher and author.

iii
Table of Contents
1. Executive Summary ................................................................................................................................. 1
2. Overview of National, State, and City Investigations .............................................................................. 1
3. Current Massachusetts Law on Undergrounding .................................................................................... 3
3.1 Chapter 166 Section 22D ..................................................................................................... 3
3.2 Zoning Regulations ............................................................................................................... 3
4. Storms and Adverse Weather ................................................................................................................. 4
5. Benefits and Limitations of Undergrounding Electrical Lines ................................................................. 7
6. Basics of the Grid and Undergrounding Installation ............................................................................... 8
6.1 Undergrounding Project Construction ................................................................................. 8
6.2 Undergrounding Reliability ................................................................................................ 10
7. Costs of Undergrounding ...................................................................................................................... 15
7.1 Previous Review Estimates ................................................................................................ 15
7.2 Cost Allocation ................................................................................................................... 18
7.3 PEPCO and DC P.L.U.G. – Undergrounding D.C. ................................................................ 19
7.4 Massachusetts Project Estimates ...................................................................................... 21
8. Conclusions and Recommendations ..................................................................................................... 22

1
1. Executive Summary After the 2011 Halloween Nor’easter, many residents of Massachusetts suffered prolonged outages
caused by falling trees and heavy ice and snow. The failure of the overhead electrical system caused
some to question whether these sub-transmission and distribution lines should be buried underground,
protected from the Massachusetts weather.1 After the February Nor’easter of 2013, Governor Deval
Patrick recognized both the high cost of underground electrical infrastructure but also the high cost of
cleanup and restoration of major storms.2 The Massachusetts Department of Energy Resources in
consultation with the Department of Public Utilities was directed to complete a review of the feasibility
of undergrounding the Massachusetts electrical distribution system for the investor owned utilities
(IOUs) to improve reliability and storm resiliency. This report summarizes national, state, and municipal
studies of undergrounding, including order of magnitude cost estimates. After a general overview of
Massachusetts storm outages there is a summary of the benefits and limitations of undergrounding,
which extend beyond increased reliability in storms and high cost of installation. The decision to
underground an electrical line is complex, dependant on multiple site-specific factors. The cost of
converting the entire existing overhead electric distribution system underground would likely be borne
by the rate payers and could be prohibitively expensive. Technological limitations may make such a large
project infeasible. However, converting a targeted selection of circuits may be part of a successful storm
resiliency program and worth the investment.
2. Overview of National, State, and City Investigations Many states and municipalities have already investigated the costs and benefits of converting all or
some of their overhead electrical distribution systems to underground lines. The following table includes
the reports reviewed for this study. The studies are all either directly or indirectly a result of a major
storm event that damaged an area’s overhead electrical distribution system. Of particular interest are
the reports from New York City following Superstorm Sandy, the comprehensive report “Out of Sight,
Out of Mind” summarizing the national costs and benefits of undergrounding, and the reports about the
planning and implementation of the current $1 billion undergrounding project in the District of
Columbia.
Mayor’s Power Line Undergrounding Task Force
DC 2013
The final report and recommendations for a large investment in a selective undergrounding project in Washington, D.C. These findings are heavily based on
the cost estimates and reliability statistics reported in the 2010 Pepco report below.
Utilization of Underground and Overhead Power Lines in the City of New York
NYC 2013 After the Moreland report, the Mayor’s Office of Long-Term Planning and
Sustainability completed a more detailed analysis of the costs and benefits of undergrounding utility lines in New York City.
Moreland Commission on Utility Storm Preparation and Response - Final Report
1 Connor Barry, “Power lines: To bury, or not to bury -- that's the question,” MassLive, Nov. 22, 2011,
http://www.masslive.com/news/index.ssf/2011/11/power_outage_in_hampden.html (last visited Dec. 5, 2014) 2 “Mass. Gov. proposes underground power lines,” WPRI, Feb 12, 2013,
https://www.youtube.com/watch?v=EdaE9pERerE (last visited Dec. 5, 2014)

2
NYC 2013 This large report, completed by the Moreland Commission in response to the
devastation caused by Sandy, analyzed the preparedness of utilities and municipal services.
Report of the Subcommittee on Burying Electric Utility Lines to the Chevy Chase Town Council
Chevy Chase, MD 2013 This short report summarizes the general benefits of undergrounding to the city of Chevy Chase. A subcommittee of the Town Council completed this report and
suggested engineers conduct a more in-depth study.
Out of Sight, Out of Mind 2012: An Updated Study on the Undergrounding Of Overhead Power Lines
USA 2012 A comprehensive report done by the Edison Electric Institute (EEI, an association
of all the investor owned utilities) surveying IOUs for undergrounding cost estimates and compiling publically available outage data.
Undergrounding Electric Lines
CT 2011 A short review for the Office of Legislative Research about cost estimates and
reliability of underground electric lines in response to the CT legislature reviewing an undergrounding project.
Underground Electric Transmission Lines by the Public Service Commission of Wisconsin
WI 2011 A technical report summarizing the engineering requirements of different types
of underground cables and underground cable installation. Study of the Feasibility and Reliability of Undergrounding Electric Distribution Lines in the District of Columbia
DC 2010 Shaw Consultants published this report detailing the cost estimates for
undergrounding lines in Washington, DC. Cost-Benefit Analysis of the Deployment of Utility Infrastructure Upgrades and Strom Hardening Programs
TX 2009 Quanta Technology completed this report for the Public Utility Commission of Texas (PUCT), comparing the costs of undergrounding to pole and vegetation maintenance in light of recent major storm events, including Hurricane Ike.
Overhead to Underground Conversion
NH 2008
This appendix report was included in the New Hampshire December 2008 Ice Storm Assessment Report published by NEI Electric Power Engineering which addresses the utility response to the major storm. The assessment makes a
general cost estimate for undergrounding the overhead system.
Inquiry into Undergrounding Electric Facilities
OK 2008
This report was prepared by the Oklahoma Corporation Commission Public Utility Division in response to the December 2007 Ice Storm. The Commission
estimated the cost to underground their transmission and distribution systems based on the local utility’s order of magnitude estimates.
Infrasource Study
FL 2007-08 This multi-phase study included a literature review of existing undergrounding
studies and case studies of undergrounding projects in Florida.
Cost-Effectiveness of Undergrounding Electric Distribution Facilities in Florida
FL 2006 The Municipal Underground Utilities Consortium, an organization of Florida cities
and towns, published this report to support undergrounding legislation.
Review of Undergrounding Policies and Practices
NY 2005 Navigant Consulting prepared this report for the Long Island Power Authority reviewing the estimated rate impact to NY customers for an undergrounded
distribution system.
Preliminary Analysis of Placing Investor-Owned Electric Utility Transmission and Distribution Facilities
FL 2005 This report updates previous studies on the cost and benefits of undergrounding

3
electrical systems as a response to an active 2004 Hurricane season.
Placement of Utility Distribution Lines Underground
VA 2005 The Virginia General Assembly requested this report from the State Corporation Commission, which found that the cost to underground the entire distribution
system to be prohibitive.
Maryland Task Force to Study Moving Overhead Utility Lines Underground
MD 2003
The Maryland Task Force was created by law in 2002 and charged with facilitating converting the overhead lines to underground lines. The Task Force
recommendations included increased storm preparedness, vegetation management, and selective undergrounding.
Statewide Undergrounding Study
NC 2003
The North Carolina Public Utilities Commission staff completed this report to the Natural Disaster Preparedness Task Force, reviewing the engineering
requirements of undergrounding and the comparative costs to an overhead system.
3. Current Massachusetts Law on Undergrounding
3.1 Chapter 166 Section 22D Massachusetts General Law (MGL) Chapter 166 § 22D allows municipalities to pass an ordinance or by-
law requiring their utility to bury existing overhead electric utility lines and the utility to recover costs by
increasing rates. Although some municipalities have passed this legislation, few towns serviced by IOUs
have utilized it. The rate increase, limited to 7%, does not cover the total cost of a large undergrounding
project. The municipality is therefore left to cover the remainder of the upfront project cost and must
work directly with the utility to coordinate construction. Some towns not served by the investor owned
utilities, such as Holden and Concord, have completed undergrounding projects, likely due to the close
project coordination associated with municipal electric utilities.3
3.2 Zoning Regulations
Without passing a by-law requiring the conversion of existing overhead electric distribution lines, many
towns have met their goals for increased underground utility lines by requiring them for new
construction through zoning by-laws. These regulations are usually associated either with specific zoning
districts, such as a business or commercial district4, or with a specific type of building, such as large
condominiums.5 These zoning regulations generally cover the secondary lines that connect buildings to
the grid and exclude the higher voltage sub-transmission and distribution lines. There is therefore less of
an impact on the overall reliability of the grid, and instead a focus on the building and neighborhood
aesthetics.
3 http://www.massmunichoice.org/f.html
4 For examples see Charlton zoning by-laws (http://www.townofcharlton.net/forms/ZoningBylaw2012.pdf)
requiring underground on-site utilities for so-defined business enterprise districts (BED) or Leominster zoning by-laws (http://www.leominster-ma.gov/pdf/zoning-13/leominster-zoning-ordinance.pdf) requiring underground utilities on all new or redeveloped buildings in the Downtown Overlay District. 5 For an example see Suttons zoning by-laws requiring new condominium complexes with more than 25 units be
built with underground utility connections (http://www.suttonma.org/Pages/SuttonMA_Planning/Zbylaw, p. 68).
4
4. Storms and Adverse Weather The Edison Electric Institute, a representative body of all the investor-owned utilities (IOUs) including
those IOUs serving Massachusetts, completed a report in 2012 that surveyed utilities nationally and
reviewed the benefits and costs of undergrounding utility lines.6 Part of this report looked at storm
events, which is one of the most commonly cited reasons for considering undergrounding. Using
publically available data provided by the Energy Information Administration (EIA) from 2003 to 2011, the
EEI found that the number of storm events causing “major system incidents” has been increasing
nationally.7 These major events are defined by major load-shedding, reduction in voltage, and other
grid disturbances.
6 Edison Electric Institute, Out of Sight, Out of Mind 2012: An Updated Study on the Undergrounding Of Overhead
Power Lines, 2012 7 Id. at p. 10
Figure 1: Days with Reported NOAA Weather Events in Massachusetts (2008-2013)
5
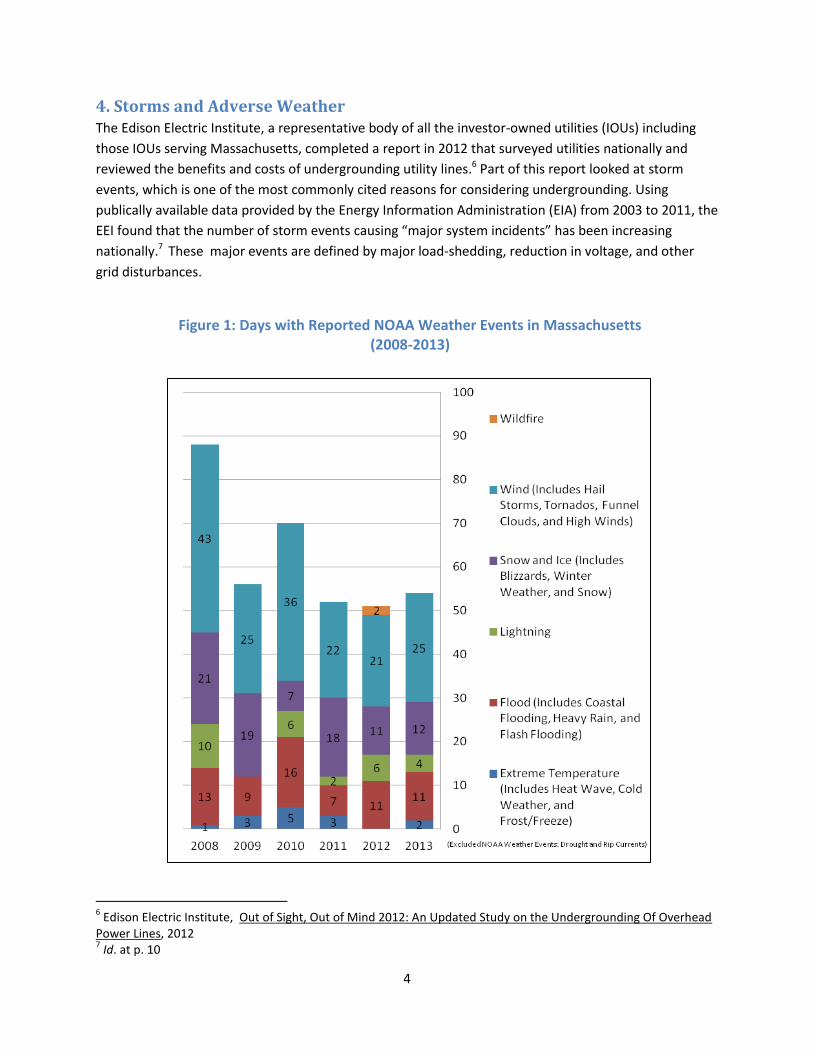
Massachusetts follows a
similar trend. The
National Ocean and
Atmospheric
Administration (NOAA)
publishes observed storm
events through its Storm
Events Database.8 For
Massachusetts, the
number of days with
weather events has
decreased over the last 6
years from 2008-2013 as
seen in Figure 1. But this
count does not measure
the severity of the storm
event or its impact on the
grid. In 2011, there were
only 52 days with
reported weather events,
but 2011 was also one of
the worst years for major
outages starting with the
January 2011 Blizzard,
Hurricane Irene on
August 28 and finishing
with the 2011 Halloween
Nor’easter. Figure 2,
which shows outages
from 1997-2013 that
affected at least 5% of
each IOU’s service area,
shows that within the last
three years
Massachusetts has seen a greater concentration of major storms with large customer outages. In
addition to increased storm outages, Figure 3 shows that for most IOUs the percent of their customers
that suffer outages for each major event has increased from 1997-2013. This means that the increase in
the total number of customers seeing outages in these events cannot be attributed to an increase in
population alone.
8 National Ocean and Atmospheric Administration Storm Events Database,
http://www.ncdc.noaa.gov/stormevents/
Figure 2: Major Outages in Massachusetts 1997-2012 Impacting 5% of More of Company’s Service Area

6
With each major storm, regardless of the location, citizens question the reliability of overhead lines they
can see breaking under the weight of fallen trees and heavy snow and ice. Most of the aforementioned
reports were completed in response to specific storm events, such as Hurricane Ike and Sandy. But
undergrounding a state’s electrical distribution grid is a complex decision than cannot be made in
response to a specific outage event. Overhead electrical lines can have lives of over 60 years and any
decision to bury these lines underground requires understanding of undergrounding project
construction and the implications in terms of both the frequency and duration of outages over the life of
the electrical line.
Figure 3: Major Outages in Massachusetts: Percent of Customers Affected.
From 1997 -2013, the percent of customers affected during each major outage has increased for almost all the
utilities in Massachusetts
7
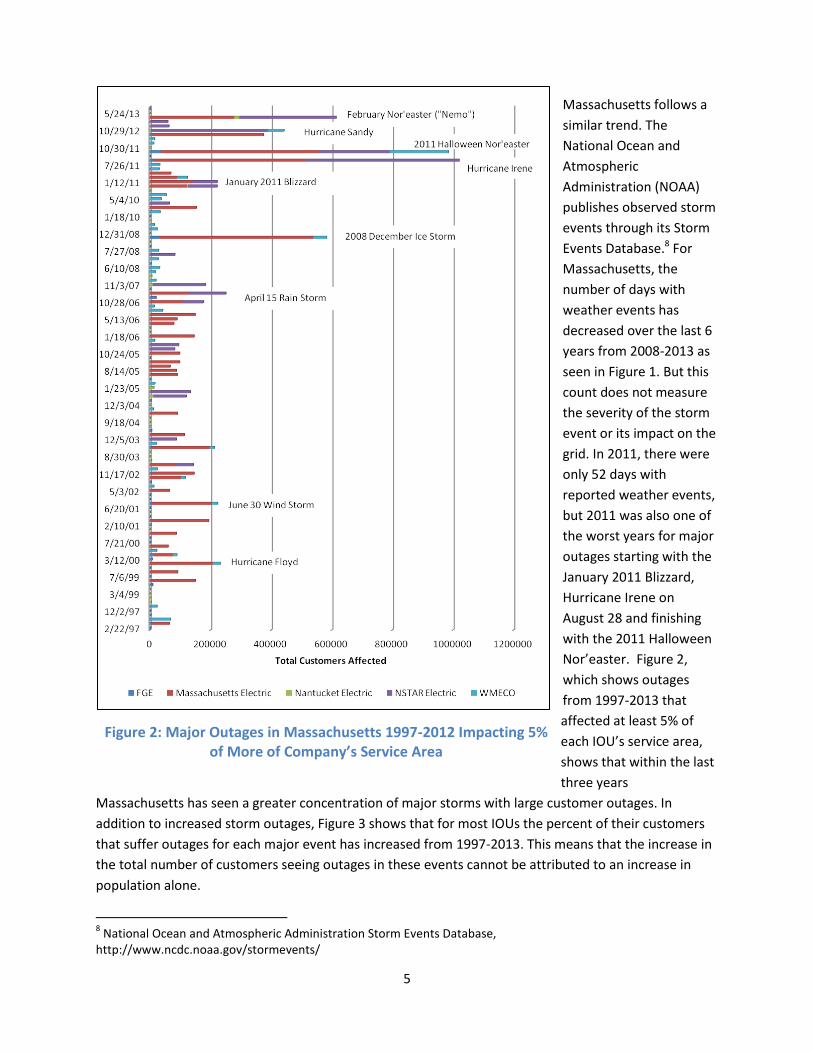
5. Benefits and Limitations of Undergrounding Electrical Lines The following table summarizes some of the many aspects of an undergrounding project, many of which
are dependent upon each other. The two most important factors, the cost of installation and the
subsequent reliability improvement will be discussed in further detail below.
Benefits from Undergrounding Limitations to Undergrounding Improved reliability in wind and winter weather events
Increased cost of materials and labor
Aesthetics Increased duration of outages because failures are difficult to locate and access9
Reduced vegetation management Requires disruptive trenching
Increase in property values with underground utility connections10
Exposure to road salt and corrosive chemicals11
Can be paired with undergrounding cable and telecommunication lines12
Shortened line life as compared to overhead lines13
Can reduce cost of conversion through salvage Increased thermal loading during heat waves and because of urban heat islands14
Reduced electro-magnetic fields (EMF) because steel pipe acts as shield15
Possible environmental damage from leaking cooling fluid16
Reduction in public safety risks from downed wires17
Higher maintenance costs18
Improved public relations Susceptible to storm surges and flooding19
Fewer vehicle impacts with poles Vegetation management still requires the removal of plants with possible disruptive roots
Can shorten outages duration after major storm damage
Heat buildup in above buildings and possible early seed germination20
Less lost commercial activity because of frequent outages
More complex and costly maintenance and repair
9 Office of Long-Term Planning and Sustainability, Office of the Mayor. City of New York, Utilization of
Underground and Overhead Power Lines in the City of New York, 2013, p. 11 10
Al Lang and John Bickerman, Report of the Subcommittee on Burying Electric Utility Lines to the Chevy Chase Town Council ,2013, p. 4 (finding possible property increases up to $25,000) 11
Utilization of Underground and Overhead Power Lines in the City of New York at 12 12
Burying Electric Utility Lines to the Chevy Chase Town Council at 4 13
Utilization of Underground and Overhead Power Lines in the City of New York at 12 14
Id. at at 13 15
Public Service of Wisconsin, Underground Electric Transmission Lines by the Public Service Commission of Wisconsin, 2011, p. 19 16
Id. at at 3 17
Oklahoma Corporation Commission Public Utility Division Staff, Inquiry into Undergrounding Electric Facilities, 2008, p. 8 18
Underground Electric Transmission Lines by the Public Service Commission of Wisconsin at 17 19
Utilization of Underground and Overhead Power Lines in the City of New York at 13 20
Underground Electric Transmission Lines by the Public Service Commission of Wisconsin at 19

8
6. Basics of the Grid and Undergrounding Installation The electric grid consists of
generators, transmission lines,
primary distribution circuits,
secondary distribution feeders that
connect the grid to buildings, and
other associated infrastructure that
converts voltage and maintains
reliability. The high-voltage
transmission lines that connect the
power plants to the sub-
transmission and distribution grid
are often found overhead with large
rights-of-way that are cleared of all
trees and shrubs.21 These high
voltage lines then connect through
substations to lower voltage
transmission and distribution lines
that may or may not be buried underground. Many
people are familiar with the overhead lines often
running along public streets on wooden poles but
may be unfamiliar with the technology required to
transmit electrical power underground.
6.1 Undergrounding Project Construction
A significant technological challenge with
underground electric cables is the dissipation of the
heat created by the electric circuits’ thermal load.22
Cables burdened from high loads can overheat and
fail. Overhead lines are less susceptible to
overheating because circulating air quickly dissipates
heat. Underground lines, on the other hand, are
surrounded by soil and rock, which insulates them
capturing the heat. To counteract this, underground
transmission and sub-transmission cables are
21
See the Occupational Health & Safety Administration (OSHA) Illustrated Glossary of Electric Power, https://www.osha.gov/SLTC/etools/electric_power/illustrated_glossary/transmission_lines.html 22
Underground Electric Transmission Lines by the Public Service Commission of Wisconsin at 1
Figure 4: Transmission and Distribution Systems (from Mayor’s Power Line Undergrounding Task Force, District of Columbia, p. 52)
Figure 5: Example off Trench Construction: Massachusetts Ave, Cambridge, MA as part of NSTAR’s
Cambridge Reliability Project (http://nstar.watkinsstrategies.com/progress.htm)

9
encased in pipe filed by pressured gas or pressured fluid that is circulated to help cool the cable.23 Lower
voltage cables, however, can rely on the thermal conductivity of the surrounding soil to dissipate their
heat.
High voltage transmission lines, such as 138kV or higher, are
generally not buried unless necessary (such as under water
bodies or protected areas) because of the technological
limitations with thermal load and line length. There are
fewer of these important lines in the grid, allowing utilities to
maintain more rigorous vegetation management. They are
therefore significantly more reliable and likely would not
benefit from undergrounding projects.
Lower voltage transmission lines can be buried along
roadways, such as the 115 kV line buried in Cambridge, MA.24
NSTAR recently completed a project installing new pipe and
heat exchanger pumps along the existing line, which has
three copper cables encased in a dielectric fluid filled steel
pipe. These new pumps will help dissipate the thermal load
and increase reliability to Cambridge customers.25
Undergrounding project construction, such as the
Cambridge Reliability Project described above, can
create temporary community disruption. Most
underground cables are installed by trenching.
Sometimes, when there are obstructions that
cannot be trenched, such as railways and water
bodies, underground projects can only be
completed by more complex boring or drilling.26
The depth and width of the trench depend on the
size of the cable (which depends on the required
voltage and ampacity), the substrate and its
insulating properties, and obstructions (such as
existing underground infrastructure). These
complications vary the project’s timing and cost. In addition to digging the trench in which the cables
23
Underground Electric Transmission Lines by the Public Service Commission of Wisconsin at 2 24
John A. Hawkinson. “The cause of MIT’s major power loss,” The Tech, Dec. 4, 2012, http://tech.mit.edu/V132/N58/power.html (last visited Dec.4, 2014) 25
NSTAR, “Cambridge Cooling Line Reliability Project,” http://www.nstar.com/system_improvements/cambridge.asp (last visited Dec. 4, 2014) 26
Underground Electric Transmission Lines by the Public Service Commission of Wisconsin at 11
Figure 6: 138 kV Overhead to Underground Transition Structure (From Public Service
Commission of Wisconsin Report, 6)
Figure 7: Pad-mounted residential transformers to reduce voltage from underground distribution line for end-user
(from OSHA Illustrated Glossary of Electric Power)
10
will be installed, vaults of sufficient size need to be built to allow maintenance workers to enter through
manholes to inspect and repair cables.27 At the end of an undergrounded line there are above-ground
structures that connect to the overhead grid, such as transmission risers or transmission stations,28
pumping stations, and pad-mounted transformers as needed to change voltage and connect to the rest
of the distribution grid (Figure 7).
Because electrical lines are often buried along existing public streets and right-of-ways, undergrounding
projects are best incorporated into plans for street improvement to reduce costs and community
disturbance. This will reduce the
project construction time and
combine cost.
6.2 Undergrounding
Reliability
Reliability metrics not only
measure how often a customer
may experience an outage but
how long it takes the utility to
restore service. Common
reliability metrics include the
system average interruption
frequency index (SAIFI, the
average number of
interruptions a customer can
expect), the customer average
interruption duration index
(CAIDI, the average duration of
a customer’s outage in hours),
and the system average
interruption duration index
(SAIDI, the average duration of
an interruption divided by all
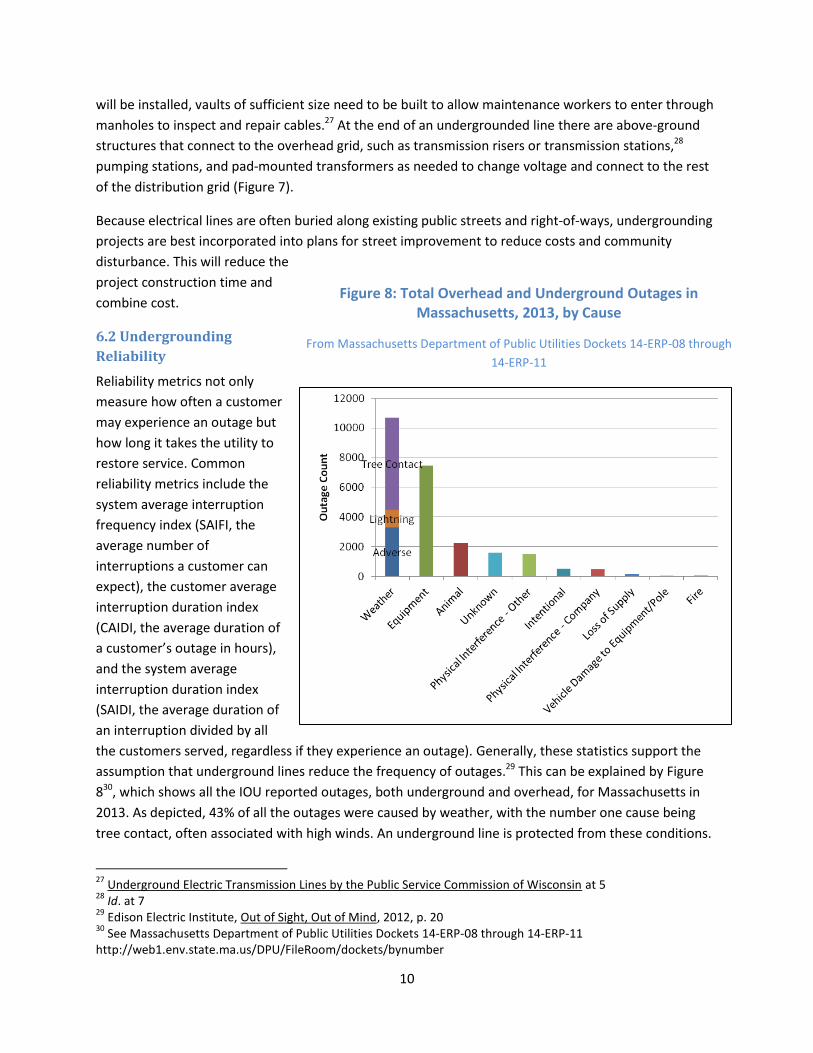
the customers served, regardless if they experience an outage). Generally, these statistics support the
assumption that underground lines reduce the frequency of outages.29 This can be explained by Figure
830, which shows all the IOU reported outages, both underground and overhead, for Massachusetts in
2013. As depicted, 43% of all the outages were caused by weather, with the number one cause being
tree contact, often associated with high winds. An underground line is protected from these conditions.
27
Underground Electric Transmission Lines by the Public Service Commission of Wisconsin at 5 28
Id. at 7 29
Edison Electric Institute, Out of Sight, Out of Mind, 2012, p. 20 30
See Massachusetts Department of Public Utilities Dockets 14-ERP-08 through 14-ERP-11 http://web1.env.state.ma.us/DPU/FileRoom/dockets/bynumber
Figure 8: Total Overhead and Underground Outages in Massachusetts, 2013, by Cause
From Massachusetts Department of Public Utilities Dockets 14-ERP-08 through
14-ERP-11

11
Although reliability data shows that outages are less frequent with underground lines, burying a line
does not eliminate the danger of an outage in general, or from adverse weather. While many of the
outages in 2013 were caused by tree contact, 30% were caused by general equipment failure, unrelated
to any weather
events.
Underground
lines are still
susceptible to
equipment failure
and, as discussed
below, the
complexity of
their equipment
can add to
reliability issues.
Figures 9 and 10
show that both
overhead and
underground
lines are most
susceptible to
rain events that
can cause both
downed trees and
flooding.31 Where
overhead lines are susceptible to high winds, underground lines are susceptible to high heat, related to
the difficulty cooling underground cable’s thermal loads. While snow and ice may not weigh down
underground cables, road salt and other chemicals used on overlying roads can seep into the ground
and lead to equipment failure and shortened line life.32 Because underground lines are connected to
overhead transmission and feeders, failures in other parts of the grid can mean users supplied by
functioning underground lines still experience outages. Undergrounding an electrical line may decrease
the frequency of outages, especially during times of adverse weather, but it will not insulate a customer
from all outages.
Although underground lines experience fewer outages, the duration of an outage may increase because
of the difficulty locating and repairing faulted devices.33 In order to repair an underground line, the
utility must first locate the cause of the outage. Unlike with overhead lines that are completely visible,
31
See Dockets 14-ERP-08 through 14-ERP-11 32
Utilization of Underground and Overhead Power Lines in the City of New York at 12 33
Id. at 11
Figure 9: Massachusetts Outages 2013: Overhead Outages due to Adverse Weather
Figure 10: Massachusetts Outages 2013: Underground Outages due to Adverse Weather

12
locating an underground line failure can be technically difficult and requires more time. Additionally, if
the issue is located with a substation, a maintenance worker must enter a vault through a man hole. If
the issue is with the line itself, the maintenance worker must pull the cable out of the ground and its
protective casing until the fault is found. Further, excessive snowfall can block access to underground
vaults and increase the duration of an outage.

13
Table 1: Reliability Metrics Comparing the Primarily Underground Con-Edison System of New York City to Primarily Overhead New York State Systems
(does not include outages from major storm events)
2012 5 Year Average
SAIFI CAIDI SAIFI CAIDI
Frequency Duration Frequency Duration
Con Edison Non-Network (partial underground system) 0.36 2.02 0.4 1.93
Con Edison Network (predominately underground) 0.012 6.33 0.02 6.28
Con Edison System Wide (both network and non-network)
0.1 2.39 0.12 2.44
All NYS electric utilities except Con Edison (predominately overhead)
0.85 1.87 0.9 1.84
The best examples of studying underground utility reliability were those of Superstorm Sandy’s
aftermath in New York City. After Sandy, the Mayor’s Office of Long Term Planning and Sustainability for
New York City looked at the reliability statistics for both their overhead and underground utilities. New
York City, with its dense population, has a predominately underground transmission and distribution
Figure 10: The total outages in New York City during Sandy, separated by causation. (from PlaNYC, “A Stronger, More Resilient New York, 2013, p. 115)

14
system, while the rest of New York State maintains an overhead grid. When comparing the reliability
metrics in normal weather of the underground grid of the Con Edison network to all other New York
State utilities, Con Edison network averaged over a 5-year period a SAIFI of .02 while New York State
averaged .90 (Table 1).34 Con Edison network customers average a significantly lower frequency of
outages. But the Con Edison network averaged a CAIDI of 6.28 hours compared to New York State’s 1.84
hours meaning that the average Con Edison network customer outage lasted almost three times longer.
But these statistics represented the system reliability with storm events removed.35 The performance of
the grid was more complex during and following the devastation of Sandy.
A significant portion of the electrical system damage in New York City happened when underground
substations connecting the transmission and distribution systems were flooded. Figure 10 shows the
number of customers that suffered outages in NYC during Sandy and their causation.36 While almost half
of the outages were caused by overhead line failure, customers affected by unexpected substation
flooding experienced more significant outage durations. Figure 11 shows the percent of customers still
without power 1, 4, 9, 13, and 17 days after the super storm passed.37 All those customers with
overhead line damage had service returned by day 17 after the storm while those who had suffered
outages caused by underground
equipment flooding were still without
power. Within the city of New York,
the overhead outage duration was
significantly shorter than across New
York State. Sandy’s devastation in the
rest of the State to the overhead
electrical system was so significant
that it was not back in service until
after New York City had regained
service.38 Understanding a system’s
reliability during a major storm event
is harder to predict but is important to
consider.
34
Utilization of Underground and Overhead Power Lines in the City of New York at 12 35
Id. at 12 36
PlaNYC, A Stronger, More Resilient New York, Office of the Mayor Michael Bloomberg, 2013, p. 115 37
A Stronger, More Resilient New York at 115 38
Utilization of Underground and Overhead Power Lines in the City of New York at 13
Figure 11: Days after Sandy Customer Outage Percents (from PlaNYC, A Stronger, More Resilient New York, 2013, p. 115)
15
7. Costs of Undergrounding
7.1 Previous Review Estimates
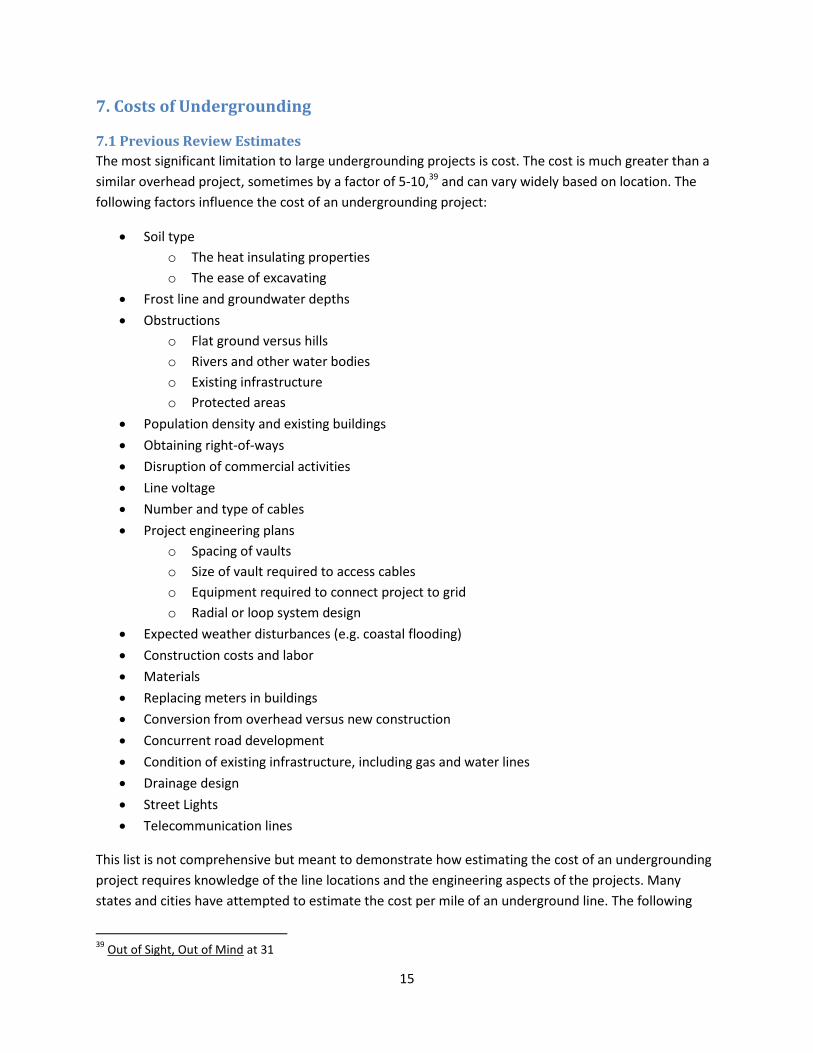
The most significant limitation to large undergrounding projects is cost. The cost is much greater than a
similar overhead project, sometimes by a factor of 5-10,39 and can vary widely based on location. The
following factors influence the cost of an undergrounding project:
Soil type
o The heat insulating properties
o The ease of excavating
Frost line and groundwater depths
Obstructions
o Flat ground versus hills
o Rivers and other water bodies
o Existing infrastructure
o Protected areas
Population density and existing buildings
Obtaining right-of-ways
Disruption of commercial activities
Line voltage
Number and type of cables
Project engineering plans
o Spacing of vaults
o Size of vault required to access cables
o Equipment required to connect project to grid
o Radial or loop system design
Expected weather disturbances (e.g. coastal flooding)
Construction costs and labor
Materials
Replacing meters in buildings
Conversion from overhead versus new construction
Concurrent road development
Condition of existing infrastructure, including gas and water lines
Drainage design
Street Lights
Telecommunication lines
This list is not comprehensive but meant to demonstrate how estimating the cost of an undergrounding
project requires knowledge of the line locations and the engineering aspects of the projects. Many
states and cities have attempted to estimate the cost per mile of an underground line. The following
39
Out of Sight, Out of Mind at 31

16
table, “Underground Cost Estimates from Various Reports,” (Table 2) shows just some of the estimates
that reports have developed. These estimates have not been altered for inflation, with most estimates
from the 2012 EEI study but also including estimates from the 2010 D.C. report and the 2013 PlanNYC
study. They represent both averages for states and specific projects, all presented by cost per mile.
They also represent mainly conversion projects but also some new construction estimates. For
conversion projects, there will be some reduction in cost based on salvaging the existing overhead line
but there will also be stranded costs associated with lost investment from removing a line before the
end of its life. For new construction projects, the cost estimates would need to be compared to
overhead line estimates which are generally significantly less. These costs are the cost borne by the
utility and do not include the cost to towns and other utilities, such as telecommunication companies.

17
$158,100
$297,200
$313,600
$500,000
$528,000
$536,760
$1,000,000
$1,100,000
$1,100,000
$1,141,300
$1,400,000
$1,500,000
$1,840,000
$1,960,000
$2,000,000
$2,000,000
$2,300,000
$2,300,000
$2,420,000
$3,000,000
$3,500,000
$3,800,000
$4,000,000
$4,500,000
$5,000,000
$6,000,000
$7,737,400
$7,810,000
$7,872,960
$8,290,000
$8,297,937
$8,588,800
$8,709,845
$11,000,000
$12,000,000
$27,000,000
$30,000,000
$30,000,000
$0 $10,000,000 $20,000,000 $30,000,000
EEI Conversion Distribution Rural: Min
EEI New Construction Distribution Rural: Min
EEI Conversion Distribution Suburban: Min
Brookline Committee Estimates: Min
EEI New Construction Distribution Suburban: Min
EEI Conversion Transmission Urban: Min
EEI Conversion Distribution Urban: Min
EEI Conversion Transmission Rural: Min
EEI Conversion Transmission Suburban: Min
EEI New Construction Distribution Urban: Min
EEI New Construction Transmission Rural: Min
WI 69 kV single-circuit transmission line
EEI New Construction Distribution Rural: Max
EEI Conversion Distribution Rural: Max
WI 138 kV single-circuit transmission line
Brookline Committee Estimates: Max
EEI New Construction Transmission Suburban: …
EEI New Construction Distribution Suburban: Max
EEI Conversion Distribution Suburban: Max
PEPCO 2006 Estimate: Feeder 14007
EEI New Construction Transmission Urban: Min
Anaheim Undergrounding Project: 2010 to …
CT Yale Biology Building
EEI New Construction Distribution Urban: Max
EEI Conversion Distribution Urban: Max
EEI Conversion Transmission Rural: Max
Southborough Project: Park St to Rt. 85
PlanNYC2030 Staten Island
Southborough Project: Rt. 85 to Parkerville Rd
PlanNYC2030 Bronx/Westchester
Southborough Project: Parkerville Rd to Sears Rd
Southborough Project: Boston Rd to Park St
Southborough Project: Total
EEI Conversion Transmission Suburban: Max
EEI Conversion Transmission Urban: Max
EEI New Construction Transmission Rural: Max
EEI New Construction Transmission Suburban: …
EEI New Construction Transmission Urban: Max
Cost per Mile
Table 2: Underground Cost Estimates from Various Reports

18
7.2 Cost Allocation
One of the most challenging aspects of project costs is cost allocation. Utilities may be responsible for
construction but they are not responsible for covering the entire project cost. Total project costs also
include landowner costs to connect to the new updated system, town costs to replace lights and move
water and sewage lines, and costs for other utilities, for example, telecommunications utilities, to
underground their own lines. Electrical utilities recover their debt by increasing the rates of customers
who benefited from the project. Which customers are required to pay the increased rate is determined
by which customers are affected but can be decided by law. For example, with the current DC
undergrounding project discussed below, low income customers are exempt from increased rates and
commercial and residential customers have separate rate increases.40
In Massachusetts, MGL Chap. 166 § 22D allows for rate increases but only up to 7%, which would not be
enough to cover the cost of a whole undergrounding project. In fact, covering the cost of these projects
only through rate increases would be prohibitive for most customers. New Hampshire’s report on the
December 2008 Ice Storm included cost estimates for converting the entire overhead sub-transmission
and distribution system and estimated an increase of between $434-907/month on the average
customers electricity bill assuming 40 years to repay the cost of the project .41 Assuming a conservative
cost estimate of $3 million dollars per mile and assuming that only the primary distribution network for
the Massachusetts IOUs would be placed underground, the average customer bill increase would be
between $40-100 a month. This also assumes a 40-year payback period and does not include any
inflation, additional costs to the homeowner, increased maintenance costs, or reduced line life. In this
scenario, all transmission lines would remain overhead.
Table 3: Rough Estimate of a Monthly Bill Increase to Underground Primary Overhead Distribution Lines in Massachusetts. Calculation assumes all lines will require a $3 million per mile investment and the debt will be paid back over 40 years. Line length estimates provided by utilities.
40
Government of the District of Columbia, Mayor’s Power Line Undergrounding Task Force, 2013, p. 12 41
NEI Electric Power Engineering, Appendix B: Overhead to Underground Conversion, 2008, p. B-13
National Grid NSTAR WMECo Unitil
Primary Overhead Distribution Circuits (miles)
13,210 8,000 3,416 410
Customers Served (2012) 1,277,574 1,163,135 212,728 29,000
Estimate cost per mile for Conversion
$ 3 Million $ 3 Million $ 3 Million $ 3 Million
Total Cost of Conversion $39.630 Billion $24 Billion $10.248 Billion $1.230 Billion
Cost per Average Customer $31,000 $21,000 $48,000 $42,000
Monthly Bill Increase for Average Massachusetts Customer for 40-Years
$65 $43 $100 $88

19
Part of the EEI 2012 study surveyed customers to determine how much they would be willing to pay as
a rate increase for undergrounding their electric lines. The study separated their results based on region
and whether the customer was located in a rural or urban area. For the northeast, the EEI found that
over 35% of people would be willing to spend up to 10% more on their monthly bill, but less than 10%
would pay more than 21%. In rural areas, 40% of people responded they would be unwilling to increase
their monthly bill at all. Because the cost of undergrounding in rural areas is spread over so few, rural
customers may be the ones to see the greatest monthly bill increase.
As part of a study investigating a large redevelopment project in Bridgewater, MA, consultants
interviewed residents about paying for underground utilities. 34% of residents stated they would not
want to pay for undergrounding while only 14% said they would.42 Generally, when faced with a
significant increase to their monthly electricity bill, customers are unwilling to fully support a total
undergrounding project.
7.3 PEPCO and DC P.L.U.G. – Undergrounding D.C.
Following the Mayor’s Power Line Undergrounding Task Force report recommendations in 201343 the
Council of the District of Columbia passed the Electric Company Infrastructure Improvement Financing
Act of 2014.44 This legislation allowed DC to secure $375 million in bonds, adding up to $125 million in
Department of Transportation funding. PEPCO, the utility that services the D.C. customers, is also
required to match D.C.’s $500 million investment and will recoup their investment with raised utility
rates, with the average residential customer seeing a monthly increase of $3.25.45 The Public Service
Commission approved the financing plan on November 12, 2014 and the project, now called D.C. Power
Line Undergrounding or DC PLUG, will move forward.
42
The Cecil Group and Nelson\Nygaard, Bridgewater Downtown Community Development Master Plan, 2014, p. 66 43
Mayor’s Power Line Undergrounding Task Force 44
See www.pepco.com/dcplug/ 45
Mayor’s Power Line Undergrounding Task Force at 86
Figure 12: Percent of Survey Respondents (from Out of Sight, Out
of Mind, p.3)
This survey asked each respondent to
choose how much they were willing to
allow their monthly electricity bill to
increase in order to cover an
undergrounding project. The results
are separated by region and by
rural/suburban/urban divisions.

20
The project closely follows
the task force’s
recommendations and is
based on PEPCO’s findings
in the Shaw Consultants’
Underground Feasibility
report.46 Instead of
starting with the cost
estimate to bury all the
electrical lines, the DC
PLUG project has set aside
a $1 billion investment and
engineers have
determined which would
be the best lines to bury to
have the greatest
reliability impact.
Engineers have looked at
the 5 year reliability
performance of the DC
electrical grid and found
that focusing work on the
primary distribution lines
would have the greatest
impact on the greatest
number of customers.47
Undergrounding the
electrical line would be the
last resort when other
reliability improvement
measures, such as
increased vegetation
46
Study of the Feasibility and Reliability of Undergrounding Electric Distribution Lines in the District of Columbia 47
Shaw report, 4
Figure 13: Existing and Proposed DC Distribution Grids (Mayor’s Task Force Report, p. 57)
On the left, with overhead primary distribution lines, the tree contact at the entrance to the neighborhood caused
outages at all the homes. On the right, after the proposed undergrounding of the primary distribution lines, the
same tree falling does not cause any outages. Outages can still be caused by a tree falling on the secondary
distribution lines connecting homes to the grid, which will remain overhead. Here though, only three homes will
experience outages instead of the whole neighborhood.

21
management and updating the lines with additional circuits or advanced technologies, do not work.48
The targeted scenario proposed by the task force, undergrounding only the primary and lateral
distribution lines, would require a $3 billion investment but would result in an expected reduction in
outage frequency of 97%.49 Because the investment has been limited to $1 billion, each overhead
primary distribution feeder has been ranked based on multiple factors, including reliability statistics,
customers served, and other possible reliability improvement measures.50
7.4 Massachusetts Project Estimates
Massachusetts communities have investigated the costs and benefits to underground some or all of the
town’s electrical systems. Peter Ditto, the town engineer for Brookline, Massachusetts, produced a
report for Town Meeting in 2004 after a subcommittee had expressed a desire to bury the Brookline
distribution grid. After a cost estimate of $500,000 - $2 million per line and the prospect of requiring an
increase to customers’ monthly bills, the town decided not to pursue any undergrounding projects.
The town of Southborough retained VBH Consultants in 2011 to investigate the specific costs with
undergrounding a less than 1-mile stretch of overhead line by Main Street (Route 30).51 The request
coincided with the MassDOT Main Street (Route 30) Reconstruction Project, which was to include
sidewalk reconstruction and minor street widening. The numbers VBH published and seen below (Table
4) are based on responses from some utilities for order of magnitude cost estimates. 52 These cost
estimates are not meant to be actual project costs but demonstrate the many stakeholders of an
undergrounding project.
An underground project involves more parties than just the town and the utilities. The below cost
estimates are a great example of how many different costs are associated with an entire
undergrounding project. While most of the cost estimates from the national and state reports are
estimates about how much cost the utilities will incur, the VBH Southborough report shows how other
parties may be affected by the project. The poles used to support the overhead electrical lines are
sometimes owned by the telecommunication companies. If removing these poles is part of the project
for aesthetic reasons, the telecommunication lines must also be buried. Many of the poles also support
the town’s street light system. For this Southborough project, the estimate includes the cost of
installing new light poles and LED lights. The town is also responsible for moving any water and gas lines
that might interfere with the required duct-bank construction and must pay for the project
coordination.
Depending on how the project is funded, private landowner(s) may be required to pay to connect their
homes and businesses to the grid. If a Massachusetts town passes a MGL Chap. 166 § 22D bylaw, the
utilities are required to install service at least 50 feet into private property, but it is up to the private
48
Mayor’s Power Line Undergrounding Task Force at 36 49
Id. at 55 50
Id. at 59 51
VBH Consultants, Main Street/Route 30 Utility Undergrounding Feasibility Study, 2011, p. 1, http://www.southboroughtown.com/dpw/dpw/Underground%20Feasibility%20Study.pdf 52
Main Street/Route 30 Utility Undergrounding Feasibility Study, at 7-9

22
land owner to cover the cost of any additional line required.53 If the town does not choose to pass the
bylaw, the cost of connecting to the distribution line will be the sole responsibility of the land owner.
Table 4: Cost Estimates from VBH Consultants to Underground a Nearly 1-Mile Section of Overhead Line in Southborough, Massachusetts
This table shows the many parties that contribute to the cost of an undergrounding project. The second table
shows the cost to the town and landowners. The final column shows the total cost per mile for the whole project,
not just for the electrical utility.
Cost to Utilities
Roadway Segments Length (FT) National Grid Verizon Charter Lightower Verizon Business Total Cost
Boston Rd to Park St 450 $437,000 $112,000 $112,000 N/A N/A $661,000
Park St to Rt. 85 1,200 $1,086,000 $245,000 $245,000 N/A N/A $1,580,000
Rt. 85 to Parkerville Rd 2,750 $2,488,000 $561,000 $561,000 $40,000 N/A $3,650,000
Parkerville Rd to Sears Rd 950 $859,000 $194,000 $194,000 N/A $25,000 $1,280,000
Total 4,900 $4,870,000 $1,112,000 $1,112,000 $40,000 $25,000 $7,170,000
Cost to Town and Landowners Total Project Cost
Roadway Segments Lights Water Line Gas Line Total Landowner Cost Total Project Cost Cost per Mile
Boston Rd to Park St $56,000 $5,000 $10,000 $71,000 $0 $732,000 $8,588,800
Park St to Rt. 85 $141,500 $10,000 $20,000 $171,500 $7,000 $1,758,500 $7,737,400
Rt. 85 to Parkerville Rd $328,500 $15,000 $30,000 $373,500 $77,000 $4,100,500 $7,872,960
Parkerville Rd to Sears Rd $113,000 $10,000 $20,000 $143,000 $70,000 $1,493,000 $8,297,937
Total $639,000 $40,000 $80,000 $759,000 $154,000 $8,083,000 $8,709,845
8. Conclusions and Recommendations Both general reviews and specific project estimates, such as the DC PLUG and Southborough Route 30
projects, show that undergrounding is a site specific choice. While undergrounding the entire grid may
be cost prohibitive, as well as technically difficult and unnecessary to improve reliability, there may be
specific lines that are good candidates for undergrounding. To determine which lines would be best
buried, utilities should follow a ranking system similar to PEPCO DC PLUG project. These would be the
lines that serve a significant amount of customers and have reliability issues that are not solved by
cheaper measures such as increased vegetation management. Even when undergrounding would
improve reliability, utilities should first try more aggressive tree trimming or advanced technologies to
not increase customers’ monthly electricity bills.
Understanding the benefits and limitations of undergrounding as a part of storm resiliency is a more
complex issue, especially when considering the effects of the Sandy storm surge on New York City’s
53
See MGL Chap. 166 §22H; Main Street/Route 30 Utility Undergrounding Feasibility Study at 9

23
underground substations. One of the most difficult aspects of predicting the benefit of an
undergrounded line is determining the cost avoided. The cost of a failure, especially during a large
weather event, is not limited to the cost of repair and replacement but loss of business and risk of public
safety. There have been reports that attempted to determine the cost of a prolonged storm outage and
the probability a major storm will damage a particular line.55 This type of study exceeds the scope of this
review but may prove beneficial to understanding where a large undergrounding investment may still be
feasible.
Undergrounding should only be one part of a larger policy to improve storm resiliency. There are many
alternative technologies and grid modifications that can help to prevent and reduce the frequency and
duration of outages. The Department of Energy Resources (DOER) already considers many of these
alternatives such as distributed generation using solar panels and storage, and micro grids connecting
small communities.56 DOER should continue to incentivize these alternatives as long as they remain a
reasonable financial decision as compared to undergrounding.
55
See Quanta Technology, Cost-Benefit Analysis of the Deployment of Utility Infrastructure Upgrades and Storm Hardening Programs, 2009. 56
See “Community Clean Energy Resiliency, ” http://www.mass.gov/eea/energy-utilities-clean-tech/renewable-energy/resiliency-initiative.html (last visited Dec 5, 2014)