Feasibility of Residential Wind Energy Generation in ...
6
International Conference on Renewable Energies and Power Quality (ICREPQ’13) Bilbao (Spain), 20th to 22th March, 2013 Renewable Energy and Power Quality Journal (RE&PQJ) ISSN 2172-038 X, No.11, March 2013 Feasibility of Residential Wind Energy Generation in Puerto Rico R. Darbali Zamora, Student Member, IEEE and Dr. A. J. Díaz Castillo Senior Member, IEEE Department of Electrical and Computer Engineering University of Puerto Rico 00681-9000 Mayagüez E-mail: [email protected], [email protected] Abstract. In Puerto Rico the rising cost of electrical energy from fossil fuels has created the necessity to use alternative energy sources for electricity generation. Wind energy, an accessible and clean source of energy, can help Puerto Rico achieve energy independence. Due to high population density, urban spread, lack of land use planning and the ever-growing concerns for the safety of flora and fauna, large-scale commercial wind generation has been met with increasing public opposition. Residential wind energy is most commonly used by homes and private land owners, making it less controversial. In this study we analyze recently obtained wind speed data from CariCOOS to help select a small residential wind turbine. An economical analysis of a residential wind turbine project is presented using the estimated energy produced. Index Terms – wind energy, small wind, residential wind energy generation, weibull distribution, economical analysis 1. Introduction he increasing price of foreign fossil fuels causes an economic burden in Puerto Rico that promotes the use of endogenous renewable energy resources [1]. Reducing pollution and greenhouse gas emissions are additional incentives to implement renewable energy. Puerto Rico is a mountainous island with a total area of 9,104km 2 and a population of approximately 3,979,000 [U.S. Census Bureau]. The annual average energy consumption for residential customers in the United States is 11,000kWh at a rate of 9¢ per kWh [Department of Energy, 2008]. The average price of residential electricity in Puerto Rico as of 2010 was between 18-20¢ [J. Maduro, Personal Communication, February 8, 2010] and as of 2012 has increased to 28¢ per kWh [AEE, March, 1, 2012]. Puerto Rico possesses strong enough winds to utilize existing technology designed to harness wind to generate electricity [2]. Wind turbines use blades that are lifted and rotated when hit by strong winds. The blades spin a shaft connected to an electrical generator that converts the wind’s kinetic energy into mechanical energy used to produce electricity. Small residential wind turbines, mostly used to power homes, farms and small businesses, are able to generate electricity in an environmentally friendly manner by harnessing the power of wind. A typical residential wind turbine has a hub height that can range from 30ft to 130ft tall. In this article we show that using compact wind turbines in residential and small commercial applications is economically viable with the wind resources available in Puerto Rico. This analysis considers the positive effect of tax incentives and investment rebates available to individuals who decide to invest in renewable energy. This article is organized in the following manner: section 2 presents the available wind energy resources for selected sites in the northern, eastern and southern coast of Puerto Rico. We present and analyze wind data available from CariCOOS. Section 3 shows the wind turbine we selected and presents the method used to match the wind resource with the selected wind turbine as well as an estimate of the amount of electricity generated at each site. Section 4 introduces the Net Present Value (NPV), the Simple Payback (SPB) and the Internal Rate of Return (IRR) as well as an economical comparison of each site. Finally, section 5 presents our conclusions. 2. Wind Characteristics In Puerto Rico Wind is the movement of air produced as our planet attempts to reach thermal equilibrium due to the change in surface temperature caused by uneven absorption of solar radiation. Winds in Puerto Rico are a result of trade winds that originate from the east. Figure 1 illustrates the map of Puerto Rico and the sites under study. Fig. 1: Map of Puerto Rico In order to identify which locations have favorable wind characteristics, hourly wind speed data was obtained from the Caribbean Coastal Ocean Observation System T Aguadilla Cabo Rojo San Juan Fajardo Las Mareas Yabucoa https://doi.org/10.24084/repqj11.250 175 RE&PQJ, Vol.1, No.11, March 2013
Transcript of Feasibility of Residential Wind Energy Generation in ...

International Conference on Renewable Energies and Power Quality (ICREPQ’13)
Bilbao (Spain), 20th to 22th March, 2013
Renewable Energy and Power Quality Journal (RE&PQJ)
ISSN 2172-038 X, No.11, March 2013
Feasibility of Residential Wind Energy Generation in Puerto Rico
R. Darbali Zamora, Student Member, IEEE and Dr. A. J. Díaz Castillo Senior Member, IEEE
Department of Electrical and Computer Engineering
University of Puerto Rico
00681-9000 Mayagüez
E-mail: [email protected], [email protected]
Abstract. In Puerto Rico the rising cost of electrical energy
from fossil fuels has created the necessity to use alternative energy
sources for electricity generation. Wind energy, an accessible and
clean source of energy, can help Puerto Rico achieve energy
independence. Due to high population density, urban spread, lack
of land use planning and the ever-growing concerns for the safety
of flora and fauna, large-scale commercial wind generation has
been met with increasing public opposition. Residential wind
energy is most commonly used by homes and private land owners,
making it less controversial. In this study we analyze recently
obtained wind speed data from CariCOOS to help select a small
residential wind turbine. An economical analysis of a residential
wind turbine project is presented using the estimated energy produced.
Index Terms – wind energy, small wind, residential wind energy
generation, weibull distribution, economical analysis
1. Introduction he increasing price of foreign fossil fuels causes an
economic burden in Puerto Rico that promotes the use
of endogenous renewable energy resources [1]. Reducing
pollution and greenhouse gas emissions are additional
incentives to implement renewable energy. Puerto Rico is a
mountainous island with a total area of 9,104km2 and a
population of approximately 3,979,000 [U.S. Census
Bureau]. The annual average energy consumption for
residential customers in the United States is 11,000kWh at a
rate of 9¢ per kWh [Department of Energy, 2008]. The
average price of residential electricity in Puerto Rico as of
2010 was between 18-20¢ [J. Maduro, Personal
Communication, February 8, 2010] and as of 2012 has
increased to 28¢ per kWh [AEE, March, 1, 2012]. Puerto
Rico possesses strong enough winds to utilize existing
technology designed to harness wind to generate electricity
[2]. Wind turbines use blades that are lifted and rotated
when hit by strong winds. The blades spin a shaft connected
to an electrical generator that converts the wind’s kinetic
energy into mechanical energy used to produce electricity.
Small residential wind turbines, mostly used to power
homes, farms and small businesses, are able to generate
electricity in an environmentally friendly manner by
harnessing the power of wind. A typical residential wind
turbine has a hub height that can range from 30ft to 130ft
tall. In this article we show that using compact wind turbines
in residential and small commercial applications is
economically viable with the wind resources available in
Puerto Rico. This analysis considers the positive effect of
tax incentives and investment rebates available to
individuals who decide to invest in renewable energy. This
article is organized in the following manner: section 2
presents the available wind energy resources for selected
sites in the northern, eastern and southern coast of Puerto
Rico. We present and analyze wind data available from
CariCOOS. Section 3 shows the wind turbine we selected
and presents the method used to match the wind resource
with the selected wind turbine as well as an estimate of the
amount of electricity generated at each site. Section 4
introduces the Net Present Value (NPV), the Simple
Payback (SPB) and the Internal Rate of Return (IRR) as
well as an economical comparison of each site. Finally,
section 5 presents our conclusions.
2. Wind Characteristics In Puerto Rico
Wind is the movement of air produced as our planet
attempts to reach thermal equilibrium due to the change in
surface temperature caused by uneven absorption of solar
radiation. Winds in Puerto Rico are a result of trade winds
that originate from the east. Figure 1 illustrates the map of
Puerto Rico and the sites under study.
Fig. 1: Map of Puerto Rico
In order to identify which locations have favorable wind
characteristics, hourly wind speed data was obtained from
the Caribbean Coastal Ocean Observation System
T
Aguadilla
Cabo Rojo
San Juan
Fajardo
Las Mareas Yabucoa
https://doi.org/10.24084/repqj11.250 175 RE&PQJ, Vol.1, No.11, March 2013
(CariCOOS). CariCOOS forms part of the Caribbean
Regional Association for Integrated Coastal Ocean
Observing (CaRA). This effort is funded by the NOAA
IOOS office. All studied sites are located next to the ocean
in the Municipalities of: Aguadilla, Cabo Rojo, Las Mareas,
Yabucoa, Fajardo, and San Juan. Table I shows the
coordinates for each site and the height at which the wind
data was measured. We analyzed one year of data, from
January 26, 2010 at noon (12:00) to January 26, 2011 at
11:00 am.
TABLE I: Measurement Site Description
Location Latitude Longitude Height (m)
Aguadilla 18.43 -67.16 4.3
Cabo Rojo 18.10 -67.19 16.2
Fajardo 18.29 -65.63 13.4
Las Mareas 17.93 -66.16 8.8
San Juan 18.46 -66.13 14.3
Yabucoa 18.05 -65.83 9.8
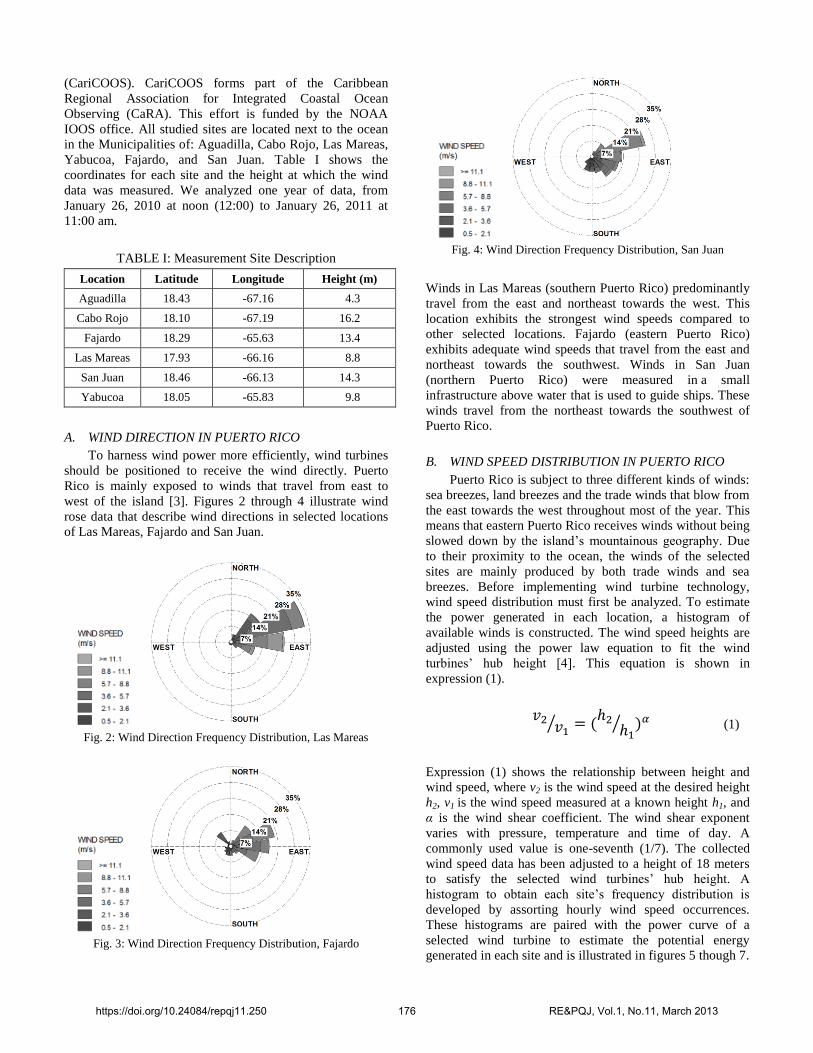
A. WIND DIRECTION IN PUERTO RICO
To harness wind power more efficiently, wind turbines
should be positioned to receive the wind directly. Puerto
Rico is mainly exposed to winds that travel from east to
west of the island [3]. Figures 2 through 4 illustrate wind
rose data that describe wind directions in selected locations
of Las Mareas, Fajardo and San Juan.
Fig. 2: Wind Direction Frequency Distribution, Las Mareas
Fig. 3: Wind Direction Frequency Distribution, Fajardo
Fig. 4: Wind Direction Frequency Distribution, San Juan
Winds in Las Mareas (southern Puerto Rico) predominantly
travel from the east and northeast towards the west. This
location exhibits the strongest wind speeds compared to
other selected locations. Fajardo (eastern Puerto Rico)
exhibits adequate wind speeds that travel from the east and
northeast towards the southwest. Winds in San Juan
(northern Puerto Rico) were measured in a small
infrastructure above water that is used to guide ships. These
winds travel from the northeast towards the southwest of
Puerto Rico.
B. WIND SPEED DISTRIBUTION IN PUERTO RICO
Puerto Rico is subject to three different kinds of winds:
sea breezes, land breezes and the trade winds that blow from
the east towards the west throughout most of the year. This
means that eastern Puerto Rico receives winds without being
slowed down by the island’s mountainous geography. Due
to their proximity to the ocean, the winds of the selected
sites are mainly produced by both trade winds and sea
breezes. Before implementing wind turbine technology,
wind speed distribution must first be analyzed. To estimate
the power generated in each location, a histogram of
available winds is constructed. The wind speed heights are
adjusted using the power law equation to fit the wind
turbines’ hub height [4]. This equation is shown in
expression (1).
(1)
Expression (1) shows the relationship between height and
wind speed, where v2 is the wind speed at the desired height
h2, v1 is the wind speed measured at a known height h1, and
α is the wind shear coefficient. The wind shear exponent
varies with pressure, temperature and time of day. A
commonly used value is one-seventh (1/7). The collected
wind speed data has been adjusted to a height of 18 meters
to satisfy the selected wind turbines’ hub height. A
histogram to obtain each site’s frequency distribution is
developed by assorting hourly wind speed occurrences.
These histograms are paired with the power curve of a
selected wind turbine to estimate the potential energy
generated in each site and is illustrated in figures 5 though 7.
https://doi.org/10.24084/repqj11.250 176 RE&PQJ, Vol.1, No.11, March 2013

Fig. 5: Las Mareas, Wind Speed Frequency
Fig. 6: Fajardo, Wind Speed Frequency
Fig. 7: San Juan Wind Speed Frequency
C. WEIBULL PROBABILITY DENSITY FUNCTION
The Weibull distribution is a probabilistic function that
helps describe the likelihood of certain events. Due to its
accuracy, it is frequently used to identify the viability of
wind turbine projects by predicting the variations of wind
speeds. The equation for the Weibull Probability Function is
shown in expression (2).
(2)
The Weibull probability density function is defined by two
parameters. The variable k is known as the shape factor,
reflects the shape of the Weibull distribution. The variable λ
is known as the scale factor and defines where the majority
of the distribution lies as well as how stretched out the
distribution will be. The variable v is a vector of the
measured wind speeds at the desired location [5]. Using the
Matlab function wblfit(x), which returns the maximum
likelihood estimates for the Weibull probability density
function and our collected wind speed data, it is possible to
obtain the Weibull parameters k and λ needed for the
analysis [6]. Table II shows the calculated parameters k and
λ given by the Matlab function wblfit(x) for all the selected
areas.
TABLE II: Weibull Probability Distribution Parameters
Location Parameter: λ Parameter: k
Aguadilla 3.48846 1.19145
Cabo Rojo 2.3436 2.0084
Fajardo 4.7458 2.2770
Las Mareas 5.4298 2.0592
San Juan 4.9890 2.1095
Yabucoa 4.6563 2.0978
Using these parameters we are able to use the Matlab
function wblpfd(v, λ, k), that calculates the probability
density function for each of the selected measurement
stations and is shown in figures 8 through 10.
Fig. 8: Weibull Distribution in Las Mareas
Fig. 9: Weibull Distribution in Fajardo
Fig. 10: Weibull Distribution in San Juan
0
500
1,000
1,500
2,000
1 2 3 4 5 6 7 8 9 10 11 12 13 14 15
Hours
Wind Speed (m/s)
Las Mareas ADJUSTED WIND SPEED FREQUENCY
0
500
1,000
1,500
2,000
1 2 3 4 5 6 7 8 9 10 11 12 13 14 15
Hours
Wind Speed (m/s)
Fajardo ADJUSTED WIND SPEED FREQUENCY
0
500
1,000
1,500
2,000
1 2 3 4 5 6 7 8 9 10 11 12 13 14 15
Hours
Wind Speed (m/s)
San Juan ADJUSTED WIND SPEED FREQUENCY
0 2 4 6 8 10 12 14 160
0.1
0.2
0.3
0.4
Wind Speed (m/s)
Pro
bab
ilit
y
Weibull Probability Density Function: Las Mareas
0 2 4 6 8 10 12 14 160
0.1
0.2
0.3
0.4
Wind Speed (m/s)
Pro
bab
ilit
y
Weibull Probability Density Function: Fajardo
0 2 4 6 8 10 12 14 160
0.1
0.2
0.3
0.4
Wind Speed (m/s)
Pro
bab
ilit
y
Weibull Probability Density Function: San Juan
https://doi.org/10.24084/repqj11.250 177 RE&PQJ, Vol.1, No.11, March 2013

3. Power Generation In Puerto Rico
The power generated by a wind turbine can be
calculated from available wind speeds using the equation
shown in expression (3).
(3)
In this equation ρ is air density in kg/m3, v is wind speed in
m/s and A is sweep area in m2. When calculations are made,
a 10% inaccuracy in wind speeds can produce a 33%
miscalculation in actual power generation [6]. To avoid this
imprecision, energy production is estimated by matching the
obtained wind speed frequency with a wind turbines power
curve that can accommodate wind speeds in the desired
regions [7]. A power curve is a characteristic graph that
represents the turbine power output at different wind speed
values and is normally provided by the turbine’s
manufacturer to help approximate power generation. The
residential wind turbine model selected for this analysis is
the Bornay Inclin 6000, generating 6kW at a rated speed of
12m/s. The lifetime of the selected wind turbine is 20 years.
Figure 11 shows the power curve of the selected wind
turbine model.
Fig. 11: Inclin 6000 Wind Turbine Power Curve
To determine what sites are prospective locations for wind
energy generation, the annual energy produced by a Bornay
Inclin 6000 was estimated. Figure 12 shows the results for
the annual energy generation.
Fig. 12: Annual Energy Generated in Puerto Rico
Table III shows the yearly energy generated in Puerto Rico
for an entire year using the Bornay Inclin 6000 wind turbine
model.
TABLE III: Annual Energy Generated in Puerto Rico
Location Energy Generated (kWh)
Aguadilla 6,444
Cabo Rojo 2,760
Fajardo 11,284
Las Mareas 14,316
San Juan 12,481
Yabucoa 10,914
4. Economical Analysis
To fully understand if a residential wind turbine project
will be a successful investment, an economical analysis is
performed. An important aspect is the price of energy per
kWh. This cost varies through the years and may escalate;
this is known as the utility escalation. To obtain the utility
escalation we examine its behavior using historical data
[AEE]. Figure 13 shows how the cost of energy has
increased during the past 10 years.
Fig. 13: Average Cost of Energy in the Last Decade
These results show that the price of energy escalates
approximately 2¢ per kWh each year. This analysis assumes
an initial value of 28¢ per kWh to obtain the initial annual
price of energy generated. Figure 14 shows the price of the
energy generated in Puerto Rico for an entire year using the
Bornay Inclin 6000 wind turbine model.
Fig. 14: Price of Energy Produced in Puerto Rico
0
1
2
3
4
5
6
7
1 2 3 4 5 6 7 8 9 10 11 12 13 14 15
Po
we
r O
utp
ut
(kW
)
Wind Speed (m/s)
Wind Turbine Power Curve
0
3,000
6,000
9,000
12,000
15,000
Aguadilla Cabo Rojo
Fajardo Las Mareas
San Juan Yabucoa Ene
rgy
Ge
ne
rate
d (
kWh
)
Annual Energy Generated
0.22
0.24
0.18
0.13
0.11
0.11 0.00
0.10
0.20
0.30
2000 2002 2004 2006 2008 2010
Co
st (
$/k
Wh
)
Year
Average Cost of Energy - Residential ($/kWh)
$0
$1,000
$2,000
$3,000
$4,000
Aguadilla Cabo Rojo
Fajardo Las Mareas
San Juan Yabucoa
Estimated Value of Energy
https://doi.org/10.24084/repqj11.250 178 RE&PQJ, Vol.1, No.11, March 2013

Table IV shows the numerical results of the price of the
energy generated in Puerto Rico for an entire year.
TABLE IV: Price of Energy Produced in Puerto Rico
Location Price of Energy
Aguadilla $ 1,804
Cabo Rojo $ 773
Fajardo $ 3,160
Las Mareas $ 4,008
San Juan $ 3,495
Yabucoa $ 3,056
The capital cost of the project is composed of the unit price
of the wind turbine, an 18 meter tower, shipping, inverter,
installation, and miscellaneous costs. The economic analysis
takes into account the availability of tax incentives and
investment rebates available for investments in residential
scale renewable energy projects [8]. Table V summarizes
the approximate cost of a small-scale residential wind
turbine project.
TABLE V: Estimated Wind Turbine Costs and Incentives
General Case Scenario
Capacity 6 kW
Project Lifetime 20 yrs
Electrical Retail Rate 28 ¢/kWh
Utility Escalation 2 ¢/kWh per year
Capital Cost
Inclin 6000 Wind Turbine $ 15,000.00 -
Equipment Cost $ 22,600.00 -
Installation Cost $ 5,000.00 -
Total Cost $ 42,600.00 -
Operation and Maintenance
Annual O&M $ 143.16 $0.01 per kWh
Annual Insurance $ 170.00 1% of Capital Cost
Inflation Rate 3% [9]
Economic Details
Grant percentage 60% -
Grant 60% $ 25,560.00 -
Rate 10% -
Using these conditions it is possible to construct the
cumulative cash flow for all the selected locations. A cash
flow is the study of money that is financially invested during
a specific period of time. A positive outcome illustrates that
the project is generating profit. Consequently, a negative
outcome implies that the system is generating losses. The
cumulative cash flow helps identify the total net cash flow
through the end of each period. The location with the most
profit can be identified by the cash flow that starts
generating profit in the least amount of time. Figures 15
through 17 illustrate the cumulative cash flow for the
selected locations of Las Mareas, Fajardo and San Juan.
Fig. 15: Cash Flow, Las Mareas
Fig. 16: Cash Flow, Fajardo
Fig. 17: Cash Flow, San Juan
The cash flow for Las Mareas shows that the investment
starts generating earnings in year 5. In the same manner the
cash flow for Fajardo also indicates the investment becomes
profitable in 6 years. It takes 5 years for San Juan to start
generating income. To avoid any negative economical
consequences and determine that a project is cost-effective,
the NPV, SPB and IRR calculations are made to help
provide a glimpse of the value of an investment on a given
date [10]. The NPV is the process of taking an investment
and projecting its future net income. It represents the
-$20,000
$0
$20,000
$40,000
$60,000
$80,000
$100,000
0 1 2 3 4 5 6 7 8 9 10 11 12 13 14 15 16 17 18 19 20
Years
Cumulative Cash Flow - Las Mareas
-$20,000
$0
$20,000
$40,000
$60,000
$80,000
$100,000
0 1 2 3 4 5 6 7 8 9 10 11 12 13 14 15 16 17 18 19 20
Years
Cumulative Cash Flow - Fajardo
-$20,000
$0
$20,000
$40,000
$60,000
$80,000
$100,000
0 1 2 3 4 5 6 7 8 9 10 11 12 13 14 15 16 17 18 19 20 Years
Cumulative Cash Flow - San Juan
https://doi.org/10.24084/repqj11.250 179 RE&PQJ, Vol.1, No.11, March 2013

amount of money an investment is worth in the present. The
equation that represents the NPV is shown in expression (4).
(4)
The variable n represents the cash flow period, while Cn is
the cash flow and i is the rate of return [11]. Figure 18
shows the results obtained by calculating the NPV in all
locations.
Fig. 18: Net Present Value
The SPB is the amount of time it will take to recover an
initial investment. The IRR is a rate of return on an
investment. Numerical results for the calculated NPV, the
IRR and for the SPB are summarized in Table VI.
TABLE VI: Economical Analysis Results
Location NPV IRR SPB
Aguadilla $ 462.32 10% 10.9
Cabo Rojo -$ 9,583.56 0% 29.7
Fajardo $13,660.49 20% 5.9
Las Mareas $21,928.43 25% 4.6
San Juan $16,924.58 22% 5.3
Yabucoa $12,651.53 19% 6.1
5. Conclusion
It is apparent that the studied locations to the west side of
Puerto Rico do not possess enough strength for a profitable
outcome. However, results show that there are wind speeds
for a feasible residential wind turbine project located closer
to the east side of Puerto Rico. These locations are directly
exposed to trade winds, sea breezes and consequently
produce greater power output. Creating a wind rose helps
illustrate that any wind turbine placed in these sites should
be oriented facing the northeast. The Weibull probability
density function provides an idea of how frequently strong
winds will occur. The Matlab Weibull function is a quick
and easy way to obtain the necessary parameters needed to
generate these distributions. As we move farther from
locations in the west and closer to locations in the east, the
likelihood of receiving low wind speeds decreases while
stronger wind speeds become more probable. In the case
scenario, the Bornay Inclin 6000 model takes advantage of
the low wind speeds and is more cost-effective compared to
other residential wind turbines that are on the market. This
research is the stepping stone in developing low-cost drivers
for residential wind turbines, one of the graduate level
research areas of the power electronics program at
University of Puerto Rico. This will also form part of an
undergraduate curriculum review that focuses on developing
proposed DOE-UMN-UPR laboratories.
Acknowledgements
The authors gratefully acknowledge the contributions made
by Dr. Agustín Irizarry-Rivera, the Caribbean Coastal Ocean
Observation System (CariCOOS), University of Minnesota
(UMN), and University of Puerto Rico at Mayagüez
(UPRM), as well as the financial support of the Department
of Energy (DOE) through grant number A000211546.
References [1]. H.R. Zamot, E. O'Neill-Carrillo and A. Irizarry-Rivera,
“Analysis of Wind Projects Considering Public Perception
and Environmental Impact,” Power Symposium, 2005.
Proceedings of the 37th Annual North American, Oct 23 - 25
2005, pp. 591 - 596.
[2]. A. Irizarry, J. A. Colucci-Rios and E. O’Neill, “Achievable
Renewable Energy Targets for Puerto Rico’s Energy
Standard: Final Report, Puerto Rico’s Energy Affairs
Administration”, Oct. 2007 - Nov. 2008.
[3]. K. Altaii and R.N Farrugia, “Wind characteristics on the
Caribbean island of Puerto Rico,” Renewable Energy, Sept.
2003, Vol. 28, pp. 1701 - 1710.
[4]. T. Burton, D. Sharpe and N. Jenckins, E. Bossanyi, “Wind
Energy Handbook,” Second Edition, John Wiley & Sons,
June 21, 2011.
[5]. R. Wang; W. Li; and B. Bagen, “Development of Wind
Speed Forecasting Model Based on the Weibull Probability
Distribution,” Computer Distributed Control and Intelligent
Environmental Monitoring (CDCIEM), 2011 International
Conference on, pp. 2062 - 2065, Feb 2011 19-20
[6]. C. Ramos-Robles and A. Irizarry-Rivera, “Economical
Effects of the Weibull Parameter Estimation on Wind
Energy Projects,” Power Symposium, 2005. Proceedings of
the 37th Annual North American, pp. 597 - 602, Oct. 23-25
2005.
[7]. P. Gipe, “Wind Power for Home and Business: Renewable
Energy for the 1990s and Beyond,” Vermont: Chelsea Green
Publishing Company, 1993.
[8]. E. Arosemena Munoz, “Green Energy Fund Rebates
Regulation, Government of Puerto Rico: Puerto Rico Energy
Affairs Administration”, June 2011.
[9]. P. Gipe, “Wind Power: Renewable Energy for Home, Farm,
and Business,” Vermont: Chelsea Green Publishing
Company, 2004.
[10]. M. Rasheduzzaman, E. Stahlman, and B.H. Chowdhury,
“Investment payback calculator for distributed generation
sources,” North American Power Symposium (NAPS), 2011,
Aug. 4 - 6 2011, pp. 1 - 7.
[11]. C. A. Magni, “Average Internal Rate of Return and
Investment Decisions: A New Perspective. (Internal Rate of
Return).” Engineering Economist. April-June 2011, pp 150.
-$10,000
$0
$10,000
$20,000
$30,000
Aguadilla Cabo Rojo Fajardo Las Mareas
San Juan Yabucoa
Net Present Value
https://doi.org/10.24084/repqj11.250 180 RE&PQJ, Vol.1, No.11, March 2013