Feasibility of high-density climate reconstruction based on Forest ... · Feasibility of...
7
Feasibility of High-Density Climate Reconstruction Based on Forest Inventory and Analysis (FIA) Collected Tree-Ring Data R. JUSTIN DEROSE Forest Inventory and Analysis, Rocky Mountain Research Station, Ogden, Utah SHIH-YU WANG Department of Plants, Soils, and Climate, and Utah Climate Center, Utah State University, Logan, Utah JOHN D. SHAW Forest Inventory and Analysis, Rocky Mountain Research Station, Ogden, Utah (Manuscript received 13 August 2012, in final form 5 November 2012) ABSTRACT This study introduces a novel tree-ring dataset, with unparalleled spatial density, for use as a climate proxy. Ancillary Douglas fir and pin ˜ on pine tree-ring data collected by the U.S. Forest Service Forest Inventory and Analysis Program (FIA data) were subjected to a series of tests to determine their feasibility as climate proxies. First, temporal coherence between the FIA data and previously published tree-ring chronologies was found to be significant. Second, spatial and temporal coherence between the FIA data and water year pre- cipitation was strong. Third, the FIA data captured the El Nin ˜ o–Southern Oscillation dipole and revealed considerable latitudinal fluctuation over the past three centuries. Finally, the FIA data confirmed the quadrature-phase coupling between wet/dry cycles and Pacific decadal variability known to exist for the Intermountain West. The results highlight the possibility of further developing high-spatial-resolution climate proxy datasets for the western United States. (The preliminary FIA data are provided online at http://cliserv. jql.usu.edu/FIAdata/ in both station and gridded format.) 1. Introduction Networks of tree-ring data represent important con- tributions to the study of regional climate, providing in situ evidence of past spatiotemporal climate variability. Tree-ring indices yield annually dated records of climate events from specific locations. In the semiarid western United States, a voluminous literature has reconstructed past climate using tree-ring chronologies, for example, precipitation (Gray et al. 2004b), temperature (Briffa et al. 1992), drought (Cook et al. 2004), and streamflow (Woodhouse et al. 2006). Classically, the preparation of climatically sensitive tree- ring chronologies requires careful selection of species, sites (e.g., elevation), sample replication, cross dating, and chronology development (Fritts 1976). Creating large spatial grids of chronologies for paleoclimate re- construction is therefore expensive and time consuming. Geographically uniform reconstructions of temperature and precipitation (Fritts 1991) and drought (Cook et al. 2004) have been developed for North America at 2.58 longitude/latitude resolution, which is coarse consider- ing the complex climate regimes and terrain in the western United States. While the number of chronolo- gies available from the International Tree-Ring Data Bank (ITRDB) for the western United States appears substantial, sparse spatial representation remains for many regions, for example, Utah. Because developing dense spatial networks of classic chronologies over large areas is time and cost prohibitive, examination of pos- sible alternatives should be considered. Here we introduce a tree-ring dataset collected by the U.S. Forest Service Forest Inventory and Analysis (FIA) Program. The FIA conducts a geographically unbiased, systematic sample across the United States, Corresponding author address: Shih-Yu (Simon) Wang, De- partment of Plants, Soils and Climate, and Utah Climate Center, Utah State University, 4280 Old Main Hill, Logan, UT 84322-4820. E-mail: [email protected]; [email protected] FEBRUARY 2013 DEROSE ET AL. 375 DOI: 10.1175/JHM-D-12-0124.1 Ó 2013 American Meteorological Society
Transcript of Feasibility of high-density climate reconstruction based on Forest ... · Feasibility of...
Feasibility of High-Density Climate Reconstruction Based on Forest Inventoryand Analysis (FIA) Collected Tree-Ring Data
R. JUSTIN DEROSE
Forest Inventory and Analysis, Rocky Mountain Research Station, Ogden, Utah
SHIH-YU WANG
Department of Plants, Soils, and Climate, and Utah Climate Center, Utah State University, Logan, Utah
JOHN D. SHAW
Forest Inventory and Analysis, Rocky Mountain Research Station, Ogden, Utah
(Manuscript received 13 August 2012, in final form 5 November 2012)
ABSTRACT
This study introduces a novel tree-ring dataset, with unparalleled spatial density, for use as a climate proxy.
Ancillary Douglas fir and pinon pine tree-ring data collected by the U.S. Forest Service Forest Inventory and
Analysis Program (FIA data) were subjected to a series of tests to determine their feasibility as climate
proxies. First, temporal coherence between the FIA data and previously published tree-ring chronologies was
found to be significant. Second, spatial and temporal coherence between the FIA data and water year pre-
cipitation was strong. Third, the FIA data captured the El Nino–Southern Oscillation dipole and revealed
considerable latitudinal fluctuation over the past three centuries. Finally, the FIA data confirmed the
quadrature-phase coupling between wet/dry cycles and Pacific decadal variability known to exist for the
IntermountainWest. The results highlight the possibility of further developing high-spatial-resolution climate
proxy datasets for the western United States. (The preliminary FIA data are provided online at http://cliserv.
jql.usu.edu/FIAdata/ in both station and gridded format.)
1. Introduction
Networks of tree-ring data represent important con-
tributions to the study of regional climate, providing in
situ evidence of past spatiotemporal climate variability.
Tree-ring indices yield annually dated records of climate
events from specific locations. In the semiarid western
United States, a voluminous literature has reconstructed
past climate using tree-ring chronologies, for example,
precipitation (Gray et al. 2004b), temperature (Briffa
et al. 1992), drought (Cook et al. 2004), and streamflow
(Woodhouse et al. 2006).
Classically, the preparation of climatically sensitive tree-
ring chronologies requires careful selection of species,
sites (e.g., elevation), sample replication, cross dating,
and chronology development (Fritts 1976). Creating
large spatial grids of chronologies for paleoclimate re-
construction is therefore expensive and time consuming.
Geographically uniform reconstructions of temperature
and precipitation (Fritts 1991) and drought (Cook et al.
2004) have been developed for North America at 2.58longitude/latitude resolution, which is coarse consider-
ing the complex climate regimes and terrain in the
western United States. While the number of chronolo-
gies available from the International Tree-Ring Data
Bank (ITRDB) for the western United States appears
substantial, sparse spatial representation remains for
many regions, for example, Utah. Because developing
dense spatial networks of classic chronologies over large
areas is time and cost prohibitive, examination of pos-
sible alternatives should be considered.
Here we introduce a tree-ring dataset collected by the
U.S. Forest Service Forest Inventory and Analysis
(FIA) Program. The FIA conducts a geographically
unbiased, systematic sample across the United States,
Corresponding author address: Shih-Yu (Simon) Wang, De-
partment of Plants, Soils and Climate, and Utah Climate Center,
Utah State University, 4280OldMain Hill, Logan, UT 84322-4820.
E-mail: [email protected]; [email protected]
FEBRUARY 2013 DEROSE ET AL . 375
DOI: 10.1175/JHM-D-12-0124.1
� 2013 American Meteorological Society

designed to infer population-level estimates of the na-
tion’s forests (Smith 2002). The periodic FIA inventory
covered all forest types in the Intermountain West at
high spatial density and included collection of one or
more increment cores from the species that represented
the forest type at each location (Fig. 1a). The temporal
resolution of the FIA tree-ring data (hereafter FIA
data) extends from multiple decades to many centuries
(Figs. 1b,c). While the 100–200-yr time span of the FIA
data may be short compared to classic chronologies, it is
twice as long, and more spatially dense, than most in-
strumental records in the region. Moreover, the FIA
records are largely distributed over unpopulated areas
with few stations.
This paper reports the descriptive potential of the
gridded FIA data using a subset of tree-ring series
[Douglas fir (DF, Pseudotsuga menziessii var. glauca)
and pinon pine (PP, Pinus edulis Engelm.)] from Utah
(Fig. 1); both species are found at elevations routinely
subject to drought (e.g., Gray et al. 2006). Utah is situ-
ated on a climate dipole between the southwestern and
northwestern United States forced by the El Nino–
Southern Oscillation (ENSO) and the Pacific decadal
oscillation (PDO) (Brown and Comrie 2004;Wang et al.
2009). This unique climate regime poses a challenge for
spatiotemporal tree-ring analyses and is therefore a de-
sirable test bed for the FIA data. In the following anal-
yses, the FIA data are comparedwith 1) existing ITRDB
chronologies, 2) instrumental records, and 3) known
climate patterns. We will demonstrate that the FIA data
are in good agreement with both classic chronologies
and instrumental records. The analysis also provides
corroboration of recently observed variation in climate
teleconnections. The results highlight the potential for
the use of FIA data in climate research in western North
America.
2. Data sources and treatment
FIA data were prepared using standard dendrochro-
nological procedures. Each series was crossdated using
the closest available species-specific or congener chro-
nology from the ITRDB (Grissino-Mayer and Fritts 1997)
or unpublished chronologies before verification with
COFECHA (a crossdating quality analysis program;
Holmes 1983). Each series was detrended using the
‘‘super smoother’’ (Friedman 1984) to remove the ef-
fects of age on growth when present and to accentuate
FIG. 1. (a) Location of FIA plots with current available tree-ring series (green dots) in the IntermountainWest. (b) Location of FIA data
used in this study, with the period of record in years represented by the size and color of triangles (upper right) overlaid with terrain
(shading). (c) Number of DF and PP tree-ring series over time within Utah used in this study.
376 JOURNAL OF HYDROMETEOROLOGY VOLUME 14
high-frequency (year to year) variability in growth in an
unbiased manner across all series. After detrending, raw
ring widths were subtracted to create a dimensionless
index (Cook et al. 2007). We utilized existing climate
reconstructions, including the North American Drought
Atlas for the reconstructedPalmer drought severity index
(PDSI, 2.58 3 2.58 resolution; Cook et al. 2004), an AD
1300–2003 reconstruction of the Nino-3.4 (58N–58S,17081208W) sea surface temperature anomaly index
(Cook et al. 2009), and an AD 993–1996 reconstruction
of the PDO index (MacDonald and Case 2005). We
utilized the instrument-based, gridded daily precip-
itation and temperature data (Maurer et al. 2002).
3. Analysis and results
Two primary differences, site selection and sample
replication, exist between classic chronologies and the
FIA data. For classic chronologies, sites are purposely
sampled to maximize climatic signal and temporal
length, whereas the FIA grid represents a systematic
random sample. Second, with respect to sample replica-
tion, classic chronologies consist of multiple averaged
series, requiring a large investment in time and resources,
whereas FIAdatawere collected as part of a standardized
protocol onplots;5 kmapart.Usingnonclassical tree-ring
data is not new, and previous works have demonstrated
the usefulness of this approach (Esper et al. 2012;
LeBlanc and Terrell 2009; Cook et al. 2001; Graumlich
1993). What is new is the spatial density of the FIA data
(Fig. 1). Given this high density, individual series com-
bined within a short distance might correspond to
nearby classic chronologies. On the basis of this hy-
pothesis, we applied the Cressman (1959) objective in-
terpolation scheme at 1/88 grid spacing over the FIA data
in Utah. The Cressman scheme achieves its result by
forcing convergence of the (station) data to the in-
terpolated values using multiple iterations. However,
the Cressman scheme does not involve a first-guess field,
with the disadvantage of potentially creating spurious
values due to interpolation. We gridded the data at 1/88using four radii of influence—1/88, 1/48, ½8, and 18 frominner to outer radius—before applicationwith an inverse-
square distance weighting (1/r2) centered at the site.
a. Comparison with ITRDB records
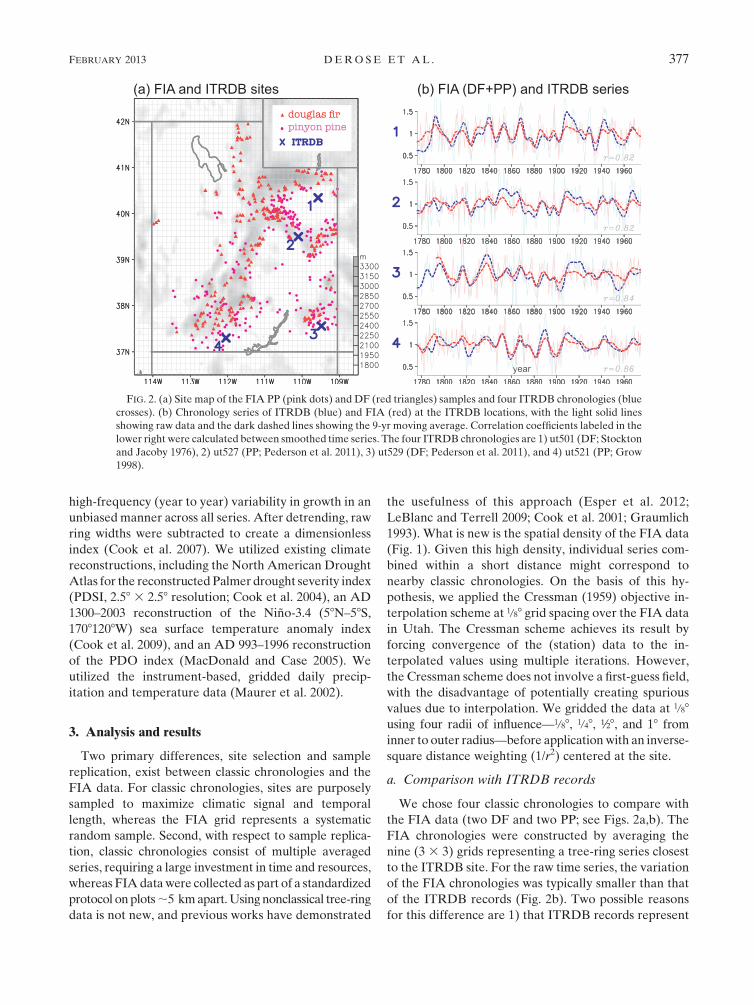
We chose four classic chronologies to compare with
the FIA data (two DF and two PP; see Figs. 2a,b). The
FIA chronologies were constructed by averaging the
nine (3 3 3) grids representing a tree-ring series closest
to the ITRDB site. For the raw time series, the variation
of the FIA chronologies was typically smaller than that
of the ITRDB records (Fig. 2b). Two possible reasons
for this difference are 1) that ITRDB records represent
FIG. 2. (a) Site map of the FIA PP (pink dots) and DF (red triangles) samples and four ITRDB chronologies (blue
crosses). (b) Chronology series of ITRDB (blue) and FIA (red) at the ITRDB locations, with the light solid lines
showing raw data and the dark dashed lines showing the 9-yr moving average. Correlation coefficients labeled in the
lower right were calculated between smoothed time series. The four ITRDB chronologies are 1) ut501 (DF; Stockton
and Jacoby 1976), 2) ut527 (PP; Pederson et al. 2011), 3) ut529 (DF; Pederson et al. 2011), and 4) ut521 (PP; Grow
1998).
FEBRUARY 2013 DEROSE ET AL . 377

trees that were believed to be particularly sensitive to
drought and 2) that the FIA series presented here were
averaged from random samples over a;50-km2 area that
may have mixed microclimate signals. Nevertheless, de-
cadal fluctuations were present in the smoothed series,
where the two datasets exhibited strong coherence (r 50.82–0.86). Also noteworthy were the decadal and bide-
cadal cycles present at varying degrees throughout Utah.
This feature echoed the predominant low-frequency
drought cycles observed over the Intermountain West
(Herweijer et al. 2007; Cook et al. 2004) and in Utah
(Wang et al. 2010, 2012).
b. Comparison with instrumental records
A point-by-point correlation map, computed between
each grid point of the FIA data and the gridded in-
strumental precipitation data (1950–95) for the water
year (WY; August of the prior year through July), re-
vealed a significant relationship that was particularly
prevalent throughout the north–south trending moun-
tains of Utah (Fig. 3a). Negative correlations in the west
desert region did not correspond to tree-ring sites and
therefore was likely an artifact of extrapolation. The
high correlation (.0.7) over central and southern Utah
was encouraging and suggested the potential for the FIA
data to be used for reconstructing local precipitation. A
similar correlation map was created with the gridded
WY mean temperature (Fig. 3b). Compared to pre-
cipitation, the chronologies were typically negatively
correlated with temperature, as has been found for DF
(Gray et al. 2004a) and PP (Gray et al. 2004b).
To examine possible correspondence to seasonal cli-
mate cycles (reflecting the growing season), we calcu-
lated the cross correlation between the FIA data and
precipitation/temperature averaged over 12 months
with a 1-month time lag, from month 212 (previous
calendar year) to month 112 (next calendar year) (Fig.
3c). This approach was used instead of month-by-month
correlations to test for a Utah-wide response. The peak
correlation of both precipitation (positive) and tem-
perature (negative) occurred around lag 25 month, in-
dicating that WY precipitation, in particular snowpack,
was likely the primary driver of subsequent tree-ring
increment for DF and PP in Utah.
c. Comparison with climate teleconnections
The impact of ENSO on precipitation anomalies pro-
duces the so-called North American dipole, encompass-
ing the northwestern/southwestern United States with
opposite polarity. However, short-term climate fore-
casts based on ENSO have frequently failed for Utah
(Wood and Warner 2011), as the region lies on the
margin of the north–south dipole and therefore is shiel-
ded from the direct influence of ENSO. On the basis of
theAugust–JulyWY from 1950 to 1997, we constructed a
one-point correlation map of precipitation with ENSO,
defined as theDecember–February (DJF)meanNino-3.4
sea surface temperature anomaly (SSTA) index (obtained
online at http://www.cpc.ncep.noaa.gov/data/indices/ersst3b.
nino.mth.81-10.ascii). The resultantmap depicted the dipole
acrossUtah, oriented northwest–southeast (Fig. 4a). ENSO
correlated with the FIA data depicted a similar pattern
FIG. 3. Point-by-point correlation map (contours) between (a) the FIA data and gridded precipitation and (b) the FIA data and gridded
temperature during the water year (August–July) over the period 1950–97, overlaid with terrain (shading) and the FIA sites (black dots).
Contours that are significant at the 99% level are in bold; a nine-point spatial smoothing was applied. (c) Cross correlation between FIA
data, annual precipitation (solid line), and annual temperature (dashed line), with a 1-month sliding interval from the previous calendar
year (212 for January–December of last year) through the current year (0 for January–December of this year) to the next year (112 for
January–December of next year). The shaded area indicates the 99% significance level (t test).
378 JOURNAL OF HYDROMETEOROLOGY VOLUME 14

with similar orientation (Fig. 4b). Agreement between
Figs. 4a and 4b suggested reasonable representation of
local climate anomalies by the FIA data with regard to
ENSO.
One advantage of the FIA data is that it can extend
the depiction of ENSO impact further into the past by
computing a latitude–time section of the sliding corre-
lation across Utah (Fig. 4c). This involved 1) computing
the correlation map of the FIA chronologies with the
reconstructed DJF Nino-3.4 index (Cook et al. 2009)
using amoving 30-yr window based on the last year (e.g.,
1980 indicates the 1951–80 period) and 2) averaging the
correlations zonally across Utah longitudes 1148–1098W.
The resultant sliding correlations exhibited distinct changes
over time (Fig. 4c).While the 30 years from 1950 onward
indeed exhibited a transition of ENSO impact (i.e., zero
correlation) across central Utah, this transition was not
steady during the past 3001 years. In fact, for the period
from 1750 to 1900, the correlation was primarily positive
with episodes of significant values, suggesting that ENSO
impacted climate anomalies uniformly throughout the
state, instead of just a portion, as was the case post-1950.
Past studies (Hidalgo and Dracup 2003; Brown and
Comrie 2004) have also noted that the ENSO climate
impact in this region has fluctuated in the past, likely
modulated by the PDO.
d. Supportive evidence of the decadal cycles
Although Utah is only marginally affected by prom-
inent climate modes like ENSO and PDO (for the past
century), recent studies have uncovered pronounced wet/
dry cycles that are unique to the Intermountain West,
with spectral peaks at;25 and 10–15 yr. Focusing on the
Great Salt Lake (GSL) in Utah,Wang et al. (2010, 2012)
found that the hydrological factors controlling the GSL
elevation respond to a type of Pacific teleconnection
that is induced at the transition point of the so-called
interdecadal Pacific oscillation (IPO; Folland et al. 2002),
which exhibits signals also found in PDO. The transition
lies approximately halfway between the warmest and
coldest SSTA in the central tropical Pacific, correspond-
ing to the extreme IPO/PDO phases. At those transition
points, a distinctive teleconnection emerges, forming
atmospheric circulation anomalies over the Gulf of
Alaska; this directs moisture flux across the Great Basin
and subsequently drives wet/dry conditions over Utah.
The IPO/PDO life cycle therefore modulates local
droughts and pluvials in a quarter-phase manner.
To examine whether the FIA data capture this known
decadal variability, the data were projected onto a
coarser grid mesh (0.58 3 0.58) with a 0.58 radius of in-fluence for the period of 1800–1995, after which an
empirical orthogonal function (EOF) was computed.
The first EOF eigenvector (EOF1) was dominant, ex-
plaining 33.5% of the total variance, and was uniformly
distributed throughout the state (Fig. 5a), which sug-
gested the FIA data have strong spatial fidelity. For
comparison we analyzed the PDSI dataset (Cook and
Krusic 2004), averaged from the four Utah grid points
(Fig. 5a). Although both datasets were derived from tree
rings, they are wholly independent, and each was col-
lected using completely different designs. The first
principal component (PC1) of the FIA data and the
PDSI, smoothed by a 3-yr running mean, were coherent
FIG. 4. One-point correlation map (contours) between the DJF Nino-3.4 index with (a) the water year precipitation, and (b) the FIA
data during the period 1950–97, overlaid with terrain (shading) and the FIA sites [black dots in (b)]. (c) Correlation between the FIA data
and the reconstructed Nino-3.4 index (Cook et al. 2009) within a 30-yr sliding window averaged across the longitudes of Utah from 1680
(indicating 1651–80) to 1995 (indicating 1966–95). Values greater than the 99% significance level (absolute values. 0.372) are shaded in
pink. For all panels, zero contours are highlighted in purple.
FEBRUARY 2013 DEROSE ET AL . 379

(r 5 0.86, Fig. 5b). Decadal variability was present in
both the PC1 and the PDSI, while their power spectra
(not shown) revealed a primary peak between 10 and
15 yr and a secondary peak around 25 yr, consistent
with previous studies (Wang et al. 2010, 2012).
Since the IPO reconstruction is not available, we
correlated a PDO index (MacDonald and Case 2005)
with the FIA data PC1 and the PDSI data (Fig. 5b).
Significant correlations existed, with the PDO leading
the PC1 by 4 yr (and leading the PDSI by 5 yr). A sec-
ondary correlation peak was found, with the inverse
PDO phase lagging both time series by 7–8 yr. Com-
bined, these lead/lag times confirmed that the decadal
wet/dry cycles, as previously noted, are present in the
FIA data and are linked to the PDO. Furthermore, with
the simultaneous correlation near zero, these wet/dry
cycles are quarter-phase shifted with the PDO. This re-
sult is consistent with—and supportive of—the quadrature-
phase coupling of the PDOwith the wet/dry cycles in this
region (Wang et al. 2009) and the associated ‘‘transition-
phase teleconnection’’ mechanism proposed by Wang
et al. (2010, 2012).
4. Conclusions
We investigated the potential for FIA data to be used
as a climate proxy for the western United States using
data from Utah as a test case. Although different than
classic tree-ring chronologies, the FIA locations cover
a broad area with substantially higher spatial density than
existing chronologies or station data, allowing more
detailed local climate information to be extracted. By
grouping FIA data within fixed grid spacing, we showed
strong relationships with ITRDB data, especially for
decadal variability. The FIA data were most sensitive to
WY precipitation, indicated by the correlation with in-
strumental data, which oftentimes exceeded 0.8. The
FIA data reproduced the known dipole of precipitation
anomalies associated with ENSO. Moreover, we re-
vealed considerable latitudinal fluctuation of the ENSO
dipole over the past 300 years, suggesting spatiotempo-
ral instability of this climate pattern. Finally, the FIA
data confirmed the recently discovered quadrature-
phase coupling between the pronounced wet/dry cycles
and Pacific decadal variability.
These results highlight the feasibility of FIA data to be
developed into high-resolution sets of climate recon-
structions, such as precipitation or drought. Full prepa-
ration of the FIA tree-ring series analyzed herein
represents a multiple-year effort (they are provided
online at http://cliserv.jql.usu.edu/FIAdata/ in both sta-
tion and gridded formats). Future work will seek to
enhance the FIA data representation throughout the
Intermountain West (indicated in Fig. 1a). Upon com-
pletion, a very high-resolution, gridded proxy climate
dataset will be reported and made available for the re-
search community.
Acknowledgments. Unpublished chronologies were
provided byMattBekker, EricAllen,ConnieWoodhouse,
and Jeff Lukas. Comments offered by Roger Kjelgren
are appreciated. This research was supported by the
FIG. 5. (a) EOF1 of the gridded FIA data during the period 1800–1995 overlaid with the PDSI grids (red dots; Cook and Krusic 2004)
and FIA sites (yellow dots). (b) PC1 series (blue solid line) overlaid with the four-point average of the PDSI (red dashed line), with their
correlation coefficient indicated in the bottom right and both smoothed by a 3-yr moving average. The two smoothed time series showed
strong coherence (r5 0.86). (c) Cross correlation of the reconstructed PDO index (MacDonald and Case 2005) with PC1 (solid blue line)
and the PDSI (red dashed line); for example, lag 24 means that PC1/PDSI lags PDO by 4 yr. The shaded area indicates the 99%
significance level after taking into consideration the reduction in degrees of freedom from the moving average.
380 JOURNAL OF HYDROMETEOROLOGY VOLUME 14

Bureau of Reclamation Project R11AC81456 and ap-
proved by the Utah Agricultural Experiment Station,
Utah State University, as journal paper number 8448.
REFERENCES
Briffa, K. R., P. D. Jones, and F. H. Schweingruber, 1992: Tree-ring
density reconstructions of summer temperature patterns across
western North America since 1600. J. Climate, 5, 735–754.
Brown, D. P., and A. C. Comrie, 2004: A winter precipitation ‘di-
pole’ in the western United States associated with multi-
decadal ENSO variability. Geophys. Res. Lett., 31, L09203,doi:10.1029/2003GL018726.
Cook, E. R., and P. J. Krusic, cited 2004: The North American
drought atlas. Lamont-Doherty Earth Observatory. [Available
online at http://iridl.ldeo.columbia.edu/SOURCES/.LDEO/.
TRL/.NADA2004/.pdsi-atlas.html.]
——, J. S. Glitzenstein, P. J. Krusic, and P. A. Harcombe, 2001:
Identifying functional groups of trees in west Gulf Coast
forests (USA): A tree-ring approach. Ecol. Appl., 11, 883–
903.
——, C. A. Woodhouse, C. M. Eakin, D. M. Meko, and D. W.
Stahle, 2004: Long-term aridity changes in the western United
States. Science, 306, 1015–1018.
——, P. J. Krusic, R. H. Holmes, and K. Peters, cited 2007:
ARSTAN Version 41d. Columbia University. [Available
online at http://www.ldeo.columbia.edu/tree-ring-laboratory/
resources/software.]
——, R. D. D’Arrigo, and K. J. Anchukaitis, cited 2009: Tree ring
500 year ENSO index reconstructions. IGBP PAGES/World
Data Center for Paleoclimatology Data Contribution Series
2009-105, NOAA/NCDC Paleoclimatology Program. [Avail-
able online at ftp://ftp.ncdc.noaa.gov/pub/data/paleo/treering/
reconstructions/nino-cook2008.txt.]
Cressman, G. P., 1959: An operational objective analysis system.
Mon. Wea. Rev., 87, 367–374.
Esper, J., M. Benz, and N. Pederson, 2012: Influence of wood
harvest on tree-ring time-series of Picea abies in a temperate
forest. For. Ecol. Manage., 284, 86–92.
Folland, C. K., J. A. Renwick, M. J. Salinger, and A. B. Mullan,
2002: Relative influences of the interdecadal Pacific Oscilla-
tion and ENSO on the South Pacific convergence zone. Geo-
phys. Res. Lett., 29, 1643, doi:10.1029/2001GL014201.
Friedman, J. H., 1984: A variable span smoother. Tech. Rep. 5,
Laboratory for Computational Statistics, Department of Sta-
tistics, Stanford University, Stanford, CA, 30 pp. [Available
online at http://www.slac.stanford.edu/cgi-wrap/getdoc/slac-pub-
3477.pdf.]
Fritts, H. C., 1976:Tree Rings andClimate. Academic Press, 567 pp.
——, 1991:Reconstructing Large-Scale Climatic Patterns fromTree
Ring Data: A Diagnostic Analysis. University of Arizona
Press, 286 pp.
Graumlich, L. J., 1993: Response of tree growth to climatic varia-
tion in the mixed conifer and deciduous forests of the upper
Great Lakes region. Can. J. For. Res., 23, 133–143.
Gray, S. T., C. L. Fastie, S. T. Jackson, and J. L. Betancourt, 2004a:
Tree-ring-based reconstructions of precipitation in the Big-
horn Basin, Wyoming, since 1260 A.D. J. Climate, 17, 3855–
3865.
——, S. T. Jackson, and J. L. Betancourt, 2004b: Tree-ring based
reconstructions of interannual to decadal scale precipitation
variability for northeastern Utah since 1226 AD. J. Amer.
Water Resour. Assoc., 40, 947–960.
——, J. L. Betancourt, S. T. Jackson, andR. G. Eddy, 2006: Role of
multidecadal climate variability in a range extension of pinyon
pine. Ecology, 87, 1124–1130.
Grissino-Mayer, H. D., and H. C. Fritts, 1997: The International
Tree-Ring Data Bank: An enhanced global database serving
the global scientific community. Holocene, 7, 235–238.Grow, D. W., cited 1998: Yovimpa Point, Bryce Canyon, Utah.
National Climatic Data Center, Asheville, NC, digital media.
[Available online at http://www.ncdc.noaa.gov/paleo/treering.
html.]
Herweijer, C., R. Seager, E. R. Cook, and J. Emile-Geay, 2007:
NorthAmerican droughts of the last millenium from a gridded
network of tree-ring data. J. Climate, 20, 1353–1376.Hidalgo, H. G., and J. A. Dracup, 2003: ENSO and PDO effects on
hydroclimatic variations of the Upper Colorado River basin.
J. Hydrometeor., 4, 5–23.
Holmes, R. L., 1983: Computer-assisted quality control in tree-ring
dating and measurement. Tree-Ring Bull., 43, 69–78.
LeBlanc, D. C., andM. A. Terrell, 2009: Radial growth response of
white oak to climate in eastern North America. Can. J. For.
Res., 39, 2180–2192.MacDonald, G. M., and R. A. Case, 2005: Variations in the Pacific
decadal oscillation over the past millennium. Geophys. Res.
Lett., 32, L08703, doi:10.1029/2005GL022478.
Maurer, E. P., A. W. Wood, J. C. Adam, D. P. Lettenmaier, and
B. Nijssen, 2002: A long-term hydrologically based dataset of
land surface fluxes and states for the conterminous United
States. J. Climate, 15, 3237–3251.Pederson,G. T., andCoauthors, 2011: The unusual nature of recent
snowpack declines in the North American Cordillera. Science,
333, 332–335.
Smith, W. B., 2002: Forest inventory and analysis: A national in-
ventory andmonitoringprogram.Environ. Pollut., 116, 233–242.
Stockton, C. W., and G. C. Jacoby, 1976: Long-term surface-water
supply and streamflow trends in the Upper Colorado River
basin based on tree-ring analyses. Lake Powell Research
Project Bulletin 18, 70 pp. [Available online at http://www.
gcmrc.gov/library/reports/physical/hydrology/Stockton1976.
pdf.]
Wang, S.-Y., R. R. Gillies, J. Jin, and L. E. Hipps, 2009: Recent
rainfall cycle in the Intermountain Region as a quadrature
amplitude modulation from the Pacific decadal oscillation.
Geophys. Res. Lett., 36, L02705, doi:10.1029/2008GL036329.
——, ——, ——, and ——, 2010: Coherence between the Great
Salt Lake level and the Pacific quasi-decadal oscillation.
J. Climate, 23, 2161–2177.
——, ——, and T. Reichler, 2012: Multi-decadal drought cycles in
the Great Basin recorded by the Great Salt Lake: Modulation
from a transition-phase teleconnection. J. Climate, 25, 1711–
1721.
Wood, A. W., and K. Warner, 2011: Development of a seasonal
climate and streamflow forecasting testbed for the Colorado
River Basin. Proc. 36th Climate Diagnostic and Prediction
Workshop, Fort Worth, TX, NOAA, 101–105. [Available
online at http://www.nws.noaa.gov/ost/climate/STIP/36CDPW/
36cdpw-awood.pdf.]
Woodhouse, C. A., S. T. Gray, and D. M. Meko, 2006: Updated
streamflow reconstructions for the Upper Colorado Riv-
er basin. Water Resour. Res., 42, W05415, doi:10.1029/
2005WR004455.
FEBRUARY 2013 DEROSE ET AL . 381