
Feasibility of GDAHA Hospitals Meeting the Surge Capacity ...
47
Wright State University Wright State University CORE Scholar CORE Scholar Master of Public Health Program Student Publications Master of Public Health Program 5-21-2006 Feasibility of GDAHA Hospitals Meeting the Surge Capacity and Feasibility of GDAHA Hospitals Meeting the Surge Capacity and Capability Requirements of an Avian Flu Pandemic in the Miami Capability Requirements of an Avian Flu Pandemic in the Miami Valley Valley Raymond P. Ten Eyck Wright State University - Main Campus Follow this and additional works at: https://corescholar.libraries.wright.edu/mph Part of the Community Health and Preventive Medicine Commons Repository Citation Repository Citation Ten Eyck, R. P. (2006). Feasibility of GDAHA Hospitals Meeting the Surge Capacity and Capability Requirements of an Avian Flu Pandemic in the Miami Valley. Wright State University, Dayton, Ohio. This Master's Culminating Experience is brought to you for free and open access by the Master of Public Health Program at CORE Scholar. It has been accepted for inclusion in Master of Public Health Program Student Publications by an authorized administrator of CORE Scholar. For more information, please contact library- [email protected].
Transcript of Feasibility of GDAHA Hospitals Meeting the Surge Capacity ...

Wright State University Wright State University
CORE Scholar CORE Scholar
Master of Public Health Program Student Publications Master of Public Health Program
5-21-2006
Feasibility of GDAHA Hospitals Meeting the Surge Capacity and Feasibility of GDAHA Hospitals Meeting the Surge Capacity and
Capability Requirements of an Avian Flu Pandemic in the Miami Capability Requirements of an Avian Flu Pandemic in the Miami
Valley Valley
Raymond P. Ten Eyck Wright State University - Main Campus
Follow this and additional works at: https://corescholar.libraries.wright.edu/mph
Part of the Community Health and Preventive Medicine Commons
Repository Citation Repository Citation Ten Eyck, R. P. (2006). Feasibility of GDAHA Hospitals Meeting the Surge Capacity and Capability Requirements of an Avian Flu Pandemic in the Miami Valley. Wright State University, Dayton, Ohio.
This Master's Culminating Experience is brought to you for free and open access by the Master of Public Health Program at CORE Scholar. It has been accepted for inclusion in Master of Public Health Program Student Publications by an authorized administrator of CORE Scholar. For more information, please contact [email protected].

1
Feasibility of GDAHA Hospitals Meeting the Surge Capacity and Capability
Requirements of an Avian Flu Pandemic in the Miami Valley
MPH Culminating Experience Report
Wright State University
Boonshoft School of Medicine
Raymond P. Ten Eyck
May 21, 2006
2
Acknowledgements
I would like to express my sincere gratitude to my family as well as the staff and
faculty of the Wright State University, Boonshoft School of Medicine, Master of Public
Health Program for their encouragement and dedication. I am grateful to Dr. Mark
Gebhart for providing his oversight as the chairman of my research committee despite his
many other academic and clinical commitments. I am deeply indebted to Mr. William
Mase, who has provided his inspiration and encouragement throughout the MPH
program. He has been a key figure in guiding my efforts and refining this final
manuscript. I would also like to thank Mr. Bill Bines and Mr. Steve Jez for helping
formulate this project along with Ms. Pat Bernitt and the members of the Greater Dayton
Area Hospital Association Disaster Preparedness Committee for their assistance and for
providing the opportunity to conduct this research.

3
Abstract
Hospital surge capacity is a crucial portion of disaster preparedness planning
within a community. The demands generated by a disaster require additional capacity, in
the form of beds, equipment, personnel, and special capabilities. The scope and urgency
of these requirements must be balanced with a practical approach addressing cost and
space concerns. The advent of new infectious disease threats, particularly an avian flu
pandemic, have reinforced the need to be prepared for a prolonged surge, lasting six to
eight weeks, in addition to the shorter duration surges required for industrial accidents,
tornados, chemical disasters and terrorists. Using a standardized data form, the surge
capacity/capability plan for each hospital in the Greater Dayton Area Hospital
Association (GDAHA) was assessed in six areas and compared to the demand projected
for an avian flu pandemic using the CDC’s FluAid and FluSurge tools.
Using the CDC’s models, the cumulative GDAHA capability exceeds the
projected demand for bed space, ICU beds, ventilators, and morgue space. There is a
shortage of negative pressure beds, basic equipment for some of the surge rooms, and
neuraminidase inhibitors to treat healthcare workers contaminated in the course of their
duties. Many facilities do not have screening plans designed to segregate contaminated
patients/staff prior to entering the hospital and do not have a complete set of written
policies to address various aspects of a sustained surge. Few facilities have agreements
with nursing homes or home health care agencies to care for patients discharged early in
order to clear surge beds. Most facilities had programs, such as child care, to
accommodate their workers’ needs. However, most of the personnel surge plans were
designed for short term events, such as a tornado or an industrial accident, and might not

4
be sustainable for a prolonged surge. If some of the assumptions are changed in the
CDC’s models, to match the rates reported from the 1918 pandemic, the surge capacity of
GDAHA facilities would not meet the projected demand.
Introduction
Public health has taken on a growing role in disaster response over the past five
years. In addition to the traditional role of dealing with natural disasters and epidemics,
local Public Health departments have been assigned a central role in planning for and
responding to terrorist threats. Since the additional resources that have been allocated are
not nearly sufficient to support the expanded mission, an “all-hazards” approach has been
adopted to ensure that available resources are effectively utilized (Hoard et al., 2005).
The “all-hazards” approach applies to all involved agencies and requires a high degree of
coordination among the responding agencies within a community and among local, state
and federal responding agencies. Over the past few years news threats have surfaced in
the form of severe acute respiratory syndrome (SARS) outbreaks and a growing number
of avian influenza cases. This research addresses the ability of the Greater Dayton Area
Hospital Association (GDAHA) facilities to respond to an avian flu pandemic involving
the Miami Valley. This scenario was chosen because it poses a credible threat that would
significantly tax the surge capacity and capability of the GDAHA facilities and there are
CDC models available to predict the demand for health care resources during an avian flu
pandemic. The inventory of available surge resources documented by this research can
assist in evaluating surge capacity for a variety of scenarios.

5
Purpose Statement
This project is designed to evaluate the collective surge plans and resources
available to provide care, in the event of an avian flu pandemic, to the residents of the
eight counties served predominantly by the GDAHA hospitals. The null hypothesis for
this project states that there is no difference between the surge capacity and capability
that would realistically be generated by the cumulative GDAHA hospital plans and the
demands of the most likely scenario projected for an avian flu pandemic. The demands
will be calculated using the CDC’s FluAid (CDC, 2000) and FluSurge (Zhang, Meltzer,
& Wortley, 2005) tools.
Methods
After securing approval from the Wright State University Institutional Review
Board and the GDAHA Director of Corporate Financial and Emergency Medical
Systems, the designated preparedness representative for each GDAHA hospital was
interviewed by the investigator using an Access database to record the results. In
advance of the interview, the subjects were provided with copies of Excel spreadsheets
listing the desired data points including a definition for each point. The database tables
included the elements required for a hospital to mount a surge response to an avian flu
pandemic based on a review of the literature addressing avian flu and SARS since the
latter represents a similar viral respiratory infection that has caused large-scale outbreaks.
The elements were divided into six groups with a table for each group (Appendix). The
six groups include surge beds, surge staff, surge personal protective equipment, surge
pharmaceuticals, surge equipment and supplies and surge policies. The primary objective
6
was to determine the number of beds that would be available for a protracted surge
response to an avian flu pandemic. The timeline for the availability of surge beds was
assessed although the speed of surge bed availability should not be as critical a factor for
a flu pandemic as it would be for some other scenarios such as a chemical exposure, an
explosion or a tornado. The responses from each of the hospitals were collated to
determine the total number of surge beds that would be available if all hospitals activated
the surge capacity portion of their disaster plans. In addition, the various aspects of the
surge plans were evaluated to assess elements that might compromise the anticipated
surge availability. The surge in demand generated by an avian flu pandemic was
calculated using two tools provided by CDC. The FluAid (CDC, 2000) program was
populated with resource information obtained from the GDAHA hospitals and with
population data from the US Census Bureau homepage (American Fact Finder, 2005) in
order to calculate the most likely numbers for gross attack rates, outpatient visits,
hospitalizations, and deaths. The total numbers of ICU beds, non-ICU beds and
ventilators required were calculated using the CDC’s FluSurge tool (Zhang, Meltzer, &
Wortley, 2005). The number of collective surge beds and other surge resources
forecasted by the disaster plans were compared to the predicted demand for each of the
items calculated by the FluSurge and FluAid models. The underlying assumptions in
creating the models include the following:
1. Average length of non-ICU hospital stay for influenza-related illness is 5 days.
2. Average length of ICU stay for influenza-related illness is 10 days.
3. Average length of ventilator usage for influenza-related illness is 10 days.
4. Average proportion of admitted influenza patients that will need ICU care is 15%.

7
5. Average proportion of admitted influenza patients that will need ventilators is 7.5%.
6. Average proportion of influenza deaths assumed to be hospitalized is 70%.
7. Daily percentage increase in cases arriving compared to previous day is 3%.
The remaining elements of the surge plans were evaluated to assess the overall adequacy
of the plans to meet the projected demands of an avian flu pandemic.
Results and Data Analysis
Surge Spaces
The combined average number of operating beds for the GDAHA facilities is
3,192. The maximum combined surge capacity is 1,143 beds, which represents a 36%
increase over baseline. The projected time to achieve 50% of surge capacity ranged from
1 hour to 24 hours with a mean of 8.5 hours and a median of 3.5 hours. The projected
time to 100% surge capacity ranged from 2 to 72 hours with a mean of 26.6 hours and a
median of 19.5 hours. The 1,143 surge beds consist of 566 new in-patient beds created
within the facilities, 400 beds created by early discharges and freezing elective
admissions and 177 beds in designated facilities outside of the current hospital buildings
(Figure 1). Special function beds in the surge total included 361 additional negative
pressure beds and 244 additional ICU beds (Figure 2). Although the feasibility of each
element of individual facility surge plans was not assessed, some special considerations
addressed in the literature, for expediting availability of existing beds, were assessed in
the survey. Twenty one percent of the hospitals have a discharge holding area to stage
patients awaiting services such as transportation home or outpatient medications
following discharge. Only 14% have agreements with home health care companies and

8
36% with nursing homes to ensure that these functions are also able to surge in order to
absorb the increased patient load resulting from accelerated hospital discharges (Figure
3).
Components of GDAHA Surge Beds
400
Discharge
Off-Site
177On-Site
566
On-Site
Discharge
Off-Site
Figure 1 – Breakdown of the 1143 surge beds in GDAHA facility surge plans
Figure 2 – Breakdown of special function beds in GDAHA facility surge plans
Special Surge Beds
244361
1143
0
200
400
600
800
1000
1200
1400
ICU Surge Neg Pressure Surge Total Surge
Type of Bed
Number

9
Percent of Facilities with Discharge Agreements
0%
5%
10%
15%
20%
25%
30%
35%
40%
Discharge holding Area NH Surge Home HC Surge
Agreement
Perc
en
t
e
Percent
Figure 3 – Percent of GDAHA facilities with programs to expedite clearing beds
Surge Staff
The increased staffing needed to provide services during a prolonged surge in
demand was the most difficult area to quantify. The GDAHA facility representatives are
confident that they can secure the increased staff needed to meet a surge demand, but the
process of securing fixed numbers of surge staff are oriented more toward an acute onset,
short duration surge than toward a sustained demand for six to eight weeks for an avian
flu pandemic. For certain disciplines, such as respiratory therapists, almost all of the
surge capacity is projected to come from longer work hours. In other areas, such as
nursing, the increased staffing is planned to come from a combination of longer shifts and
redeploying nurses from suspended elective services within the hospital. The number of
administrative nurses was assessed as a potential pool of candidates to help meet the

10
nurse surge. However, an avian flu pandemic would require a surge in activity to address
the logistic as well as clinical issues associated with a sustained surge in demand.
Consequently, many of the nurses in these positions might be working additional hours in
their primary job and not be available to supplement the increased clinical demand. The
physician surge is the most difficult number to try to assess since most of the hospitals do
not have a contractual relationship with the physicians that admit to their facilities. The
physician surge numbers included as part of figure 4 are a combination of estimates of
increased staffing provided by residents, physician groups affiliated with the hospital, and
hospital based physicians, including hospitalists and emergency physicians. The numbers
provided most likely overestimate the physician surge capacity for a sustained surge in
which the need for crew rest and the increased demand for office visits will compete for
providers’ time. The availability of medical professionals from outside the local area
may not be a realistic alternative in a true pandemic due to the widespread nature of the
threat. In addition, the estimates of staff surge capacity do not take healthcare worker
attrition into account. Unless an appropriate immunization is available in advance of the
pandemic, healthcare workers are at greater risk than the overall population due to the
increased exposure incurred as part of their regular duties.

11
Staff Surge
869
515311
22186
323185 212
590
3213
0
500
1000
1500
2000
2500
3000
3500
Nurs
e
Adm
in N
urse
Phy
sician
Adm
in P
hysician
Cle
rk
Lab
Radi
olog
y
Sec
urity
Oth
er
Total
Staff Category
Number
Figure 4 – Cumulative estimates of staff surge capacity for GDAHA facilities
Surge Equipment and Supplies
Most of the GDAHA facilities have appropriate stores of equipment to operate
their surge spaces in both standard wards and intensive care settings (Figure 5). The
hospitals have a cumulative store of 316 surge Vortran Surevent ventilators to
supplement the standard ventilators utilized in daily operations. This represents nearly a
100% increase in capacity to meet surge demands. However, the Vortran medical
resuscitator user guide states: “This policy/protocol is intended for use with patients
requiring short-term ventilatory support while being monitored by a clinician trained in
the use of mechanical ventilation” (Vortran user guide, 2005). Considering these
limitations, these ventilators are not particularly suited for prolonged ventilation of
patients with an acute respiratory distress syndrome requiring high airway pressures.

12
Many of the patient care spaces designated for surge activity are already stocked
with beds and equipment and there are stores of readily available supplies and equipment
to set up most of the off-site areas. There were no particular patterns to the areas in
which surge equipment shortages exist. In some instances, there was a shortage of
additional critical care equipment such as monitors and in others there was a lack of extra
bedside equipment such as sphygmomanometers and stethoscopes. Although there were
adequate numbers of thermometers and/or disposable thermometer probe covers for
patient care under surge conditions, nearly half of the hospitals do not have sufficient
supplies on hand to screen the temperature of everyone entering the hospital in order to
segregate potentially infected individuals.
Surge Supplies/Equipment
71% 71%
57%
86%
100% 100%
0%
20%
40%
60%
80%
100%
120%
Noncrit Equip Critical Equip Thermometers Min Wash
Furn
IC Signs Sharps Cont
Category
Facil
itie
s
li
Percent
Figure 5 – Percent of GDAHA facilities with various categories of supplies/equipment
needed to meet surge demands

13
Personal Protective Equipment
The cumulative stock of personal protective equipment (PPE) in the GDAHA
facilities is adequate to provide protection for all staff and patients until the facilities can
be restocked (Figure 6), provided that the distributors can meet contractual delivery
times. An avian flu pandemic would require extensive use of PPE within the hospitals.
The World Health Organization recommends the use of N95 masks in addition to contact
and droplet precautions (WHO, 2004a). The Hong Kong (Lau et al., 2004) and Canadian
(Borgundvaag et al., 2004) experiences with SARS, which has a similar epidemiologic
profile, generated recommendations for use of masks, gowns and gloves by hospital staff
and masks for patients. Since the demand would build up over days to weeks instead of
hours, there should be an adequate amount of time to restock. All of the hospitals are
using just-in-time delivery from local distributors to provide needed supplies within a few
hours. However, since each distributor supplies many hospitals, the ability to meet their
contractual requirements may be compromised during a pandemic.
Figure 6 provides a graph of the PPE stocked within the GDAHA facilities with a
comparison bar representing the total number of staff expected to be working within the
facilities over a 24 hour period under surge conditions.

14
Surge Staff Vs PPE On Hand
0
10000
20000
30000
40000
50000
60000
70000
Baselinel
24 Hr staff
Additional
Surge
Staff
Total
Surge
Staff
N95 On-
hand
Masks On-
hand
Gow ns
On-hand
Eye
Shields
On-hand
Staff and PPE Type
Baselinel 24 Hr staff
Additional Surge Staff
Total Surge Staff
N95 On-hand
Masks On-hand
Gowns On-hand
Eye Shields On-hand
Figure 6 – Total 24 hour surge staff and on-site PPE quantities
Surge Pharmaceutical Agents
There is a generous cumulative supply of antibiotics, stocked in the GDAHA
facilities, to treat the secondary bacterial respiratory infections that can arise following an
influenza infection. However, the cumulative stock of neuraminidase inhibitors is 677
doses. This will only be enough to treat 67 patients. Although it is unrealistic to think
that there will soon be sufficient supplies to treat all avian flu patients, efforts should be
made to secure enough stock to treat healthcare workers exposed in the course of their
duty. The WHO does not recommend the use of amantadine or rimantadine due to
demonstrated resistance of avian flu A (H5N1) to these agents (WHO, 2004a).

15
Figure 7 shows the supply of pharmaceuticals compared to the number of hospital beds
and the number of hospital staff under surge conditions. If even 1% of healthcare
workers per day have a PPE failure while working with an avian flu patient, there will not
be an adequate supply of neuraminidase inhibitors to provide treatment.
Antiviral/Antibiotic Supply/Demand
677
52700
31921143
4335
25471
0
10000
20000
30000
40000
50000
60000
Neuraminidase
Inh
Antibiotics Inpatient Base Additional Surge Total Surge Beds Total Surge Staff
Supply/Demand Category
Medications
Staff
Beds
Figure 7 – Supply of antiviral agents and antibiotics compared to total surge beds and
surge staff at risk
Surge Policies
There is wide variation in the availability of formal surge policies among the
GDAHA facilities (Figure 8). All of the facilities have a policy that permitted
accelerated hiring to meet surge demands. However, in most instances, the policy only
applies to emergency credentialing of providers and there are no provisions to address
accelerated hiring procedures for nurses and other healthcare personnel. Most of the
facilities have policies addressing the use of PPE, and the handling of contaminated lab
16
specimens, linen and waste. About 2/3 of the facilities have a policy to define the special
role of security personnel in a surge environment when access to the hospital, movement
within the facility, and other activities will be significantly restricted. A similar number
have policies to define how accelerated discharges and the opening of surge beds would
be initiated. Less than 1/3 of the facilities have a policy to screen employees prior to
entering the hospital and during their work shift in the event of a surge response to an
infectious agent. Similarly, 29% of the facilities have a policy addressing plans for just-
in-time training for new equipment and procedures that would be required during a surge
for an infectious agent. Twenty-one percent of the facilities have a policy addressing the
operation of an off-site facility, which represented all of the facilities that currently plan
to operate an off-site facility as part of the spectrum of their surge response. Twenty-one
percent of the facilities have a policy to address screening all people entering the hospital
during a surge in response to an infectious agent. Two policies included in the survey are
not part of any of the facility plans. The first one is a mass care policy to address the
process for limiting critical care services in the event that demand greatly outstrips
available supplies. The second one is a policy to conduct ongoing epidemiologic studies
during the surge in order to be able to provide real-time evaluation of the effectiveness of
new treatments.

17
% Facilities with Surge Policies
0%
20%
40%
60%
80%
100%
120%
Mass C
are
Data
Off
-site
Em
p S
cre
en
Scre
en
Tra
inin
g
Food
Beds
Dis
charg
e
Security
CritC
are
Waste
Lin
en
Lab
PP
E
Hire
Policy
%
Percent
Figure 8 – Percent of GDAHA facilities with various policies to guide surge response
GDAHA Facility Cumulative Ability to Meet Demand
Projected by the FluAid and FluSurge Models
The FluAid and FluSurge models were populated with the census numbers for the
eight counties served predominantly by GDAHA hospitals (Figure 9) and the cumulative
results from the survey. The results demonstrated that the cumulative resources provided
by the GDAHA facilities were sufficient to meet the calculated regional demands of an
avian flu pandemic.
The most likely scenario would generate a peak of 810 admissions per week
during a 6 week period (Figure 10). This level of demand is below the 1143 surge beds

18
that are projected to be available in the cumulative GDAHA facility plans. Even if the
total admissions follow the worst case scenario, in the CDC model, the maximum number
of admissions during peak weeks would be 1071. Since one of the assumptions in the
model is that the average non-ICU stay will be 5 days, the peak number of projected
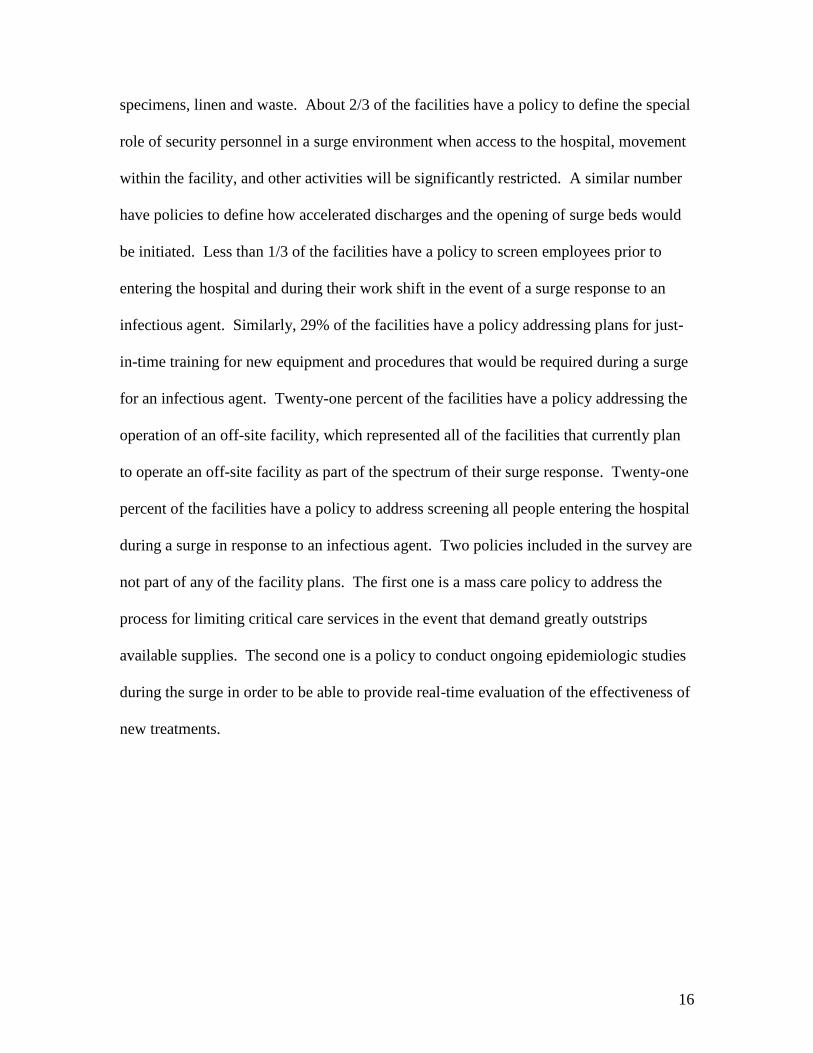
surge beds required is actually less than the weekly admission total. As demonstrated in
figure 11, approximately 616 surge beds would be needed at the peak of the pandemic for
the most likely scenario involving a 25% attack rate. Although the surge beds would be
available, the projected requirement would greatly exceed the planned 361 negative
pressure surge beds. The peak ICU bed demand is projected to be 179, which should be
adequately covered by the 189 cumulative surge ICU beds in the GDAHA hospital surge
plans. Using the above assumptions employed by CDC within the models, the peak
number of ventilators required for avian flu patients is 89 in the most likely scenario,
which would require only about 25% of the backup portable ventilators in the GDAHA
surge supplies.
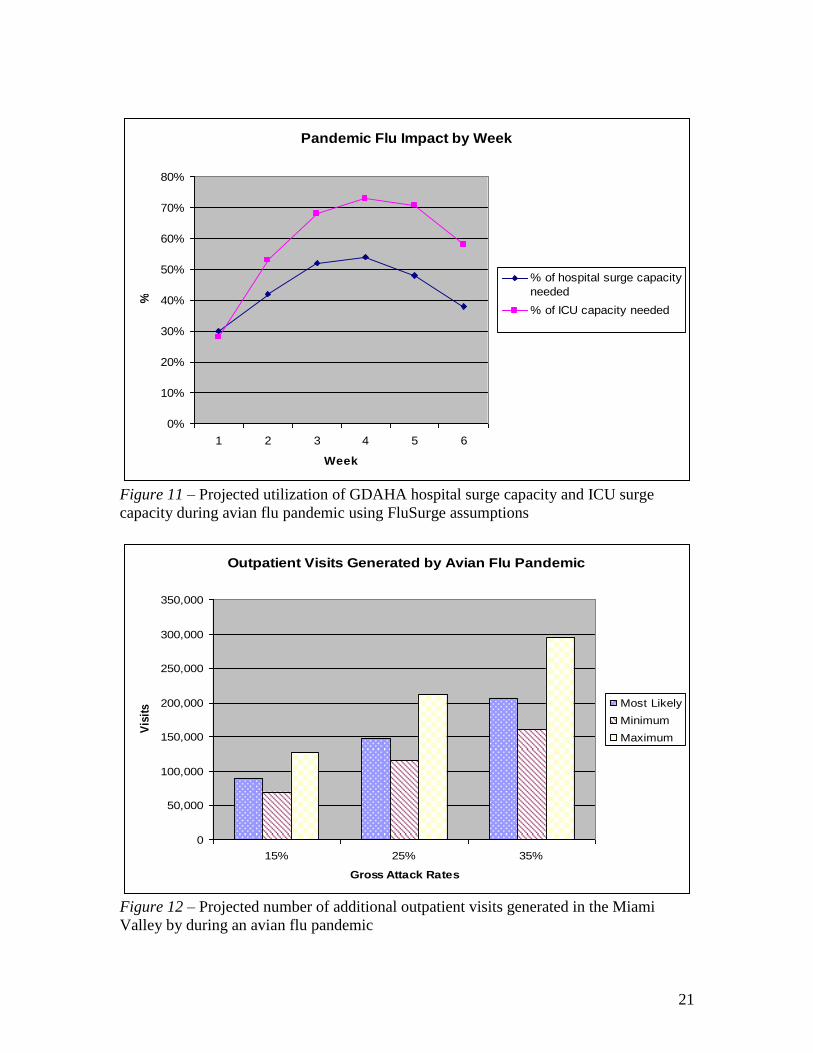
The projected number of additional outpatient visits (Figure 12) predicted by the
FluAid model for an avian flu pandemic in the Miami Valley is 147,998 with a range
from 69,251 to 296,197 based on the gross attack rates and normal variation. FluAid’s
most likely scenario projects 770 deaths in the Miami Valley with a range from 271 to
1,782 based on the gross attack rate and normal variation. The expanded morgue
capability across the GDAHA facilities, using some refrigerated trucks and stacking
bodies in current morgue space would easily meet this demand.
Assuming the estimates used to derive the FluAid and FluSurge models are
accurate, the GDAHA hospitals can meet and exceed most of the space requirements of

19
an avian flu pandemic. However, it is important to perform some type of sensitivity
analysis to evaluate the impact of changing a few of the assumptions in these models.
The FluSurge model was recalculated after substituting the admission rates and death
rates derived from the data provided in The Great Influenza (Barry, 2005). Barry found
an overall mortality rate of 0.65% in the United States during the 1918 flu pandemic. In
addition, he found that the 1918 virus led to pneumonia in 10-20% of the cases. Using
the lower end of this range with the assumption that all pneumonia cases and no other
cases would need admission to a ward bed, the number of admissions would increase
significantly over those predicted in the baseline assumptions. The FluSurge Model was
recalculated without changing any other assumptions. The results, shown in figure 13,
demonstrate that the GDAHA hospitals would fall substantially short of meeting the
requirements for total beds, ICU beds and ventilators. The total number of admissions
would increase to 27,711. The ICU bed and ventilator demand would peak in the fourth
week at 1,283 and 682 respectively. In addition, the total number of projected deaths
would increase to 7,205 with an average mortality rate of approximately 1200 patients
per week during the six week period. This rate would overwhelm the cumulative
GDAHA morgue capacity of 192 reported in the surge plans.

20
Population in Eight Counties Predominantly Served by GDAHA
277,079
682,565
148,813
1,108,457
0
200,000
400,000
600,000
800,000
1,000,000
1,200,000
0-18 19-64 >65 Total
Age group
Population
Figure 9 – Population in the eight counties served predominantly by GDAHA facilities
Hospital Admissions by Week
0
200
400
600
800
1000
1200
1 2 3 4 5 6
Number of Weeks
Ad
mis
sio
n s
Most Likely
Scenario
Minimum
Scenario
Maximum
Scenario
Figure 10 – Projected hospital admissions per week during an avian flu pandemic using
FluAid assumptions
21
Pandemic Flu Impact by Week
0%
10%
20%
30%
40%
50%
60%
70%
80%
1 2 3 4 5 6
Week
%
% of hospital surge capacity
needed
% of ICU capacity needed
Figure 11 – Projected utilization of GDAHA hospital surge capacity and ICU surge
capacity during avian flu pandemic using FluSurge assumptions
Outpatient Visits Generated by Avian Flu Pandemic
0
50,000
100,000
150,000
200,000
250,000
300,000
350,000
15% 25% 35%
Gross Attack Rates
Vis
itss
Most Likely
Minimum
Maximum
Figure 12 – Projected number of additional outpatient visits generated in the Miami
Valley by during an avian flu pandemic

22
Pandemic Avian Flu Impact Calculated with Modified Admission
Rate Derived from 1918 Data
0%
100%
200%
300%
400%
500%
600%
1 2 3 4 5 6
Week
%
% of hospital surge capacity
needed
% of ICU surge capacity
needed
% Ventilator surge capacity
needed
Figure 13 - Projected utilization of GDAHA hospital surge capacity, ICU surge capacity,
and ventilator surge capacity during an avian flu pandemic using the modified admission
rate derived from the 1918 flu pandemic data (Barry, 2005)
Discussion
Although there were three influenza pandemics in the 20th century, the pandemic
of 1918-19 was exceptional in two ways (Reid, Fanning, Janczewski, & Taubenberger,
2000). First, it was responsible for over 20 million deaths worldwide and second, it
produced a higher than normal mortality rate in the 15-45 year old group as opposed to
mainly impacting the extremes of age. The increased mortality was attributed to the
increased virulence of the 1918 influenza virus and its propensity for causing pneumonic
symptoms. The increased virulence of the virus stemmed from a complicated interaction

23
of a number of factors in both the virus and the host species, but the key role was
attributed to a novel composition of the viral surface antigens. The two main antigen
groups on the influenza virus are the hemagglutinin (HA) protein and the neuraminidase
(NA) protein. The 1918 virus’s HA protein is credited with the enabling the virus to
readily invade human cells. In addition, its antigenic properties at both the HA and NA
sites differed sufficiently from previous influenza strains so that the population did not
have any cross-immunity from prior infections (Hampton, 2004). Many unique strains
exist in natural reservoirs with birds serving as a key reservoir for influenza viruses.
Only a limited number of NA and HA subtype combinations have been found in
mammals, but all subtypes and the majority of combinations have been isolated from
birds (Alexander, 2000). The viruses within any species are constantly undergoing point
mutations resulting in changes in their antigenic profile, a process that is referred to as
antigenic drift. With sufficient antigenic drift, a substantial proportion of the world’s
population becomes susceptible and a pandemic can result (Capua, & Alexander, 2002).
However, severe pandemics usually occur as a result of antigenic shift when a virus with
a new antigenic profile jumps species and thus has no antigens that are recognized by the
human immune system. In either case, the new antigenic profile of the virus bears little
resemblance to any profile to which the population has previously been exposed (Barry,
2005). Although human volunteers have been successfully infected with avian influenza
viruses under experimental conditions, there is an impediment to natural infection of
humans by avian viruses due to one or more gene segments (Beare, & Webster, 1991).
However, pigs can readily be infected by both human and avian influenza viruses and

24
may have the mixing vessel for gene rearrangements that led to human infection with the
1918 stain.
In the past decade, a number of instances of human infections with avian
influenza have been documented. They involved three different strains including H7N7
(Kurtz, Manvell, & Banks, 1996), H9N2 (Peiris, Yam, Chan, Ghose, & Shortridge, 1999)
and H5N1 (Shortridge et al., 1998). As of December 6, 2005, the World Health
Organization Website listed a total of 134 cases of human infections with H5N1 reported
from five countries and resulting in 69 deaths (WHO, 2005). The approach to addressing
the threat posed by H5N1 has mainly involved extensive culling of infected flocks
(Normile, 2005). To date there has not been any clear human-human transmission of
H5N1. The World Health Organization has investigated the possible transmission for
H5N1 from a man to his two sisters in Vietnam, but the findings have been inconclusive
(Parry, 2004). The major fear is that if an individual develops concurrent infections with
both avian flu and human flu, he/she might serve as the “mixing vessel” to produce a new
strain that is virulent, has a novel antigenic profile and can be transmitted readily from
human to human (Anderson, 2004).
If the course of events described above were to occur, the ensuing pandemic
would place significant demands on both the capacity (total number of available beds)
and capability (number of specialty beds) of local, regional, national and international
health care systems. The World Health Organization has published interim infection
control guidelines for health care facilities in the event of an outbreak of influenza A
(H5N1) (WHO, 2004a). The WHO recommends the use of standard precautions along
with droplet precautions, contact precautions, and airborne precautions (including high
25
efficiency masks, and negative pressure rooms if available). These precautions are
recommended for the duration of the infectious period, which is from time of admission
until seven days after resolution of fever for patients > 12 years old. For patients less
than 12, the precautions are recommended to continue from the time of admission until
21 days after the onset of illness. The patients should be isolated in single rooms if
possible. Otherwise confirmed cases of influenza A (H5N1) can stay together in rooms
with multiple beds or in wards with a minimum of one meter between beds that are
separated by a physical barrier with monitored negative pressure airflow.
Surge capacity is a part of most current hospital disaster plans, but it has been
infrequently utilized in recent times. During the 1918 influenza pandemic, surge capacity
was extensively employed and frequently overwhelmed (Schoch-Spana, 2001). Hick
defined three levels of surge capacity (Hick et al., 2004). The first is facility-based
capacity that includes measures taken by individual facilities to augment services within
the hospital or on the hospital grounds. The second level is community-based surge
capacity, which encompasses actions taken at a community level to augment health care
facility responses. These may include off-site facilities for functions such as triage,
ambulatory care, and non-ambulatory overflow under the control of a jurisdictional body
such as Public Health or emergency management. The third level is Public Health surge
capacity, which includes a broader surge involving patient care, communications, mass
vaccinations or prophylaxis, laboratory services, mental health support, and other
activities.
Some disaster scenarios, such as explosions and chemical events, can be expected
to produce large surges of patients within hours (Greenberg & Hendrickson, 2003) with a
26
relatively short duration of the surge in demand for acute services. In the case of
bioterrorism or an influenza pandemic, the surge can be expected to develop over a
period of weeks and last for one to two months. A working group on emergency mass
critical care convened by the University of Pittsburgh Medical Center and the Society of
Critical Care Medicine (Rubinson et al., 2005) addressed hospital critical care concerns
following a bioterrorist attack or epidemic. The group’s initiated their planning with four
main assumptions, which are listed below:
1. Supportive critical care will play an essential role in decreasing morbidity and
mortality rates.
2. There will be a limited ability to divert or transfer patients
3. There will be limited outside support from Defense Medical Assistance Teams or
National Medical Response Teams.
4. There will be a need to depend on nonfederal equipment and supplies for the first
48 hours.
Based on these assumptions, the consensus opinion was that a 20%-50% expansion in
ICU capacity, while maintaining a baseline standard of care, could be achieved with a
preplanned critical care augmentation strategy. The strategy includes plans to transfer
ICU patients unlikely to benefit from continued ICU care and opening beds in other
monitored areas such as the recovery room, the GI lab, outpatient surgery facilities and
the catheterization lab. Their additional recommendations for enhancing staffing can be
applied to all staff positions and not just the ICU. Additional beds require additional
staff. One way of increasing the staffing is through use of measures such as modifying
schedules to 12 hour shifts, canceling vacations, reassigning clinicians in administrative

27
and teaching positions to clinical jobs, canceling routine care functions and redeploying
personnel, and providing preprinted order sets based on the nature of the disaster. A
second method of addressing increased staffing requirements involves securing outside
support. The experience in the United States has consistently involved an overwhelming
response by medical professionals to disasters such as the Oklahoma City bombing
(Hogan, 1999) and the destruction of the World Trade Center towers in New York. After
the terrorist attack on September 11, 2001, over 8,000 physicians offered to respond to
New York (Cone, 2003; Romano, 2001). Much of the volunteer response was organized
as part of government programs such as the Disaster Medical Readiness Teams (DMAT)
or the Medical Reserve Corps (MRC). However, these events also generated a large
amount of spontaneous volunteerism that was excessive and, at times, actually impeded
medical responses (Cone, 2003). This level of response is particularly impressive in view
of the fact that it occurred in a setting in which the volunteer activity resulted in a loss of
normal income and the volunteers had limited protection from liability suits and limited
or no compensation for any injuries or illness sustained as a result of the volunteer
activity (Hodge, 2005).
In contrast to actual experience, the literature addressing anticipated responses to
catastrophic disasters is less optimistic. Qureshi et al. (2005) conducted a survey of
6,428 healthcare workers from 47 institutions that were members of the Greater New
York Hospital Association. Addressing both the willingness and ability of healthcare
workers to report to work after seven hypothetical catastrophic disasters, they found that
48.9% to 82.5% of responders indicated they would be able to report to work. The most
frequent reasons for not being able to report to work were transportation issues, childcare,

28
personal health concerns, eldercare responsibilities, pet care and secondary job
obligations. The percentage of responders indicating that they would be willing to report
ranged from 48.4% to 85.7% with the lowest percentages for scenarios involving
infectious agents or radiation. The most frequent reasons for not being willing to report
to work were fear and concern for family, fear and concern for self, personal health
problems and childcare or eldercare. This study provided some practical, although not
proven, recommendations for mitigating the major factors anticipated to negatively
impact the ability and/or willingness of healthcare workers to report to work following a
disaster. The recommendations included: 1) Establishing pools of employees with four-
wheel drive vehicles and pre-established pick-up points to get healthcare workers to work
when roads are clogged with snow or debris; 2) Formation of childcare/eldercare pools;
3) Up to date employee health records with policies to provide chronic medications to
workers during disasters; 4) Prearranged pet care with local veterinarians or animal
shelters during disasters and 5) Ensuring adequate supplies and training in the use of
personal protective equipment.
In 1991, Shapira et al. published the results of a similar survey completed by
1,374 healthcare workers in Israel during the first Persian Gulf War. Although Israel had
experienced conventional missile attacks from Iraq, the study was based on how the
workers thought they would respond to a scenario involving a missile attack with
chemical agents. Only 42% of those completing the survey indicated that they would be
willing to respond to the hospital in this scenario. The reasons given by those unwilling
to respond were similar to the findings in the subsequent New York survey. The main
concerns listed by the respondents included: 1) Fear of leaving home; 2) Transportation

29
difficulties; 3) Fear of opening the family’s sealed room; and 4) Vision problems due to
an inability to wear glasses while wearing a gas mask. Seventy-five percent of those
unwilling to respond indicated that they would be willing to do so if these four issues
were addressed. My review of the growing body of medical literature addressing the
2003 SARS epidemic did not produce any information regarding willingness of
healthcare workers to report to duty. However, several articles addressed healthcare
workers’ duty to treat SARS patients (Sibbeld, 2003; Reid, 2005). In prolonged disasters
such as SARS or an avian flu pandemic, with a threat that could persist for months,
refusal to treat is a more relevant concern than the issue of failure to report to work. The
consensus from these articles was that healthcare worker concerns needed to be addressed
prior to an event and agreements established with the workers and their representative
organizations.
In addition to increasing the number of front line staff and expanding staff hours it
is of equal importance to minimize staff attrition. During the outbreak of severe acute
respiratory syndrome in Taiwan in 2003, 27% of all cases occurred in healthcare workers
including seven of the 83 deaths (Tsai et al., 2004). It is essential to protect healthcare
workers in a hazardous work environment by addressing good preventive measures
including personal protective equipment, vaccination and/or prophylaxis. In addition,
systems are needed for rapid evaluation of clinical exposures and close monitoring of
staff for signs and symptoms of infection. The WHO interim guidelines on clinical
management of humans infected by influenza A (H5N1) (WHO, 2004b) advises that all
healthcare workers with direct patient contact check their own temperature twice a day
and report any fever (>38 degrees C) in order to receive immediate treatment with a

30
neuraminidase inhibitor and appropriate isolation. The guidelines also recommend
offering post-exposure prophylaxis with a neuraminidase inhibitor to any healthcare
worker exposed to droplets from an infected patient because of inadequate PPE or failure
of PPE. Finally, they recommend keeping healthcare workers with other illnesses out of
direct patient care activities with avian influenza patients since these workers will be
more prone to illness and to complications if they do become ill. Lau et al. (2004a)
analyzed SARS attack rates in three groups of healthcare workers in all Hong Kong
Hospital Authority hospitals that admitted SARS patients. Healthcare workers accounted
for 20.5% of all their SARS cases thus making this type of threat a significant risk for
worker attrition as a result of becoming a patient or by being relieved from duty in order
to be quarantined. The percent of infected healthcare workers correlated with the total
number of SARS patients admitted and the phase of the epidemic. In addition, the group
of workers not involved in direct patient care unexpectedly had the highest attack rate.
Since this was an epidemiologic study, it did not contain individual patient data thus
limiting our ability to establish a cause and effect relationship. However, it provided
valuable information for hospital planners to address potential risks for all of their
workers.
An important component of surge capacity/capability involves separating patients
who are infected from those who are not infected, but are anxious or susceptible. The
ratio of the “worried well” to those actually requiring treatment can exceed 5-10:1
(Flowers, Mothershead, & Blackwell, 2002). If not adequately addressed, the patients
who only require screening can quickly overwhelm the system and a complete
breakdown in care can occur along with actual exposure as they mix with the infected
31
patients. Following the 2003 SARS outbreak in Taiwan, the National Cheng Kung
University Hospital published the results of their experiences. The hospital set up two
screening areas, one outside the emergency department (ED) and one outside the
outpatient clinic entrance. In addition, they set up an ED surge area consisting of 12 beds
in three temporary shelters. Their experience, during the 83 day period of the outbreak,
helps delineate the scope of screening efforts required to effectively segregate out the
actual SARS cases from the masses presenting to the hospital. The daily average number
of patients screened was 4520 at the outpatient clinic entrance and 580 at the ED
entrance. Of these patients, an average of 35 per day were referred to the SARS
assessment unit for further evaluation and 19 per day were subsequently isolated in one
of the SARS units.
The evaluation of hospital surge capacity/capability is multifaceted. The most
obvious component is the expansion of the number of patient beds. This facet
incorporates a wide variety of areas including ED beds, ward beds, negative pressure
airflow beds, and special unit beds. It is impacted by the availability of a patient
discharge holding area, nursing home beds and home healthcare capacity for patients
discharged to clear acute care beds in the hospital. Other major considerations in the
evaluation of surge capacity/capability include staff (both patient care staff and support
staff), support services, supplies and equipment, information systems, pharmaceuticals,
morgue space and procedures to deal with the unique threat (e.g. the handling of
contaminated bodies, lab specimens, and linens from infectious patients). Failure to
address any one aspect of surge capacity/capability can create a bottleneck that will
impede activities in all of the areas. Two final considerations that should be included in
32
surge capacity/capability plans are education and research. Despite ongoing training and
exercises, most personnel are going to require some real-time training during the
implementation of a surge plan in areas ranging from their role in the plan to the proper
use of required PPE. The second area is real-time epidemiologic investigation to help
define the threat and progression of the medical response as well as the gathering of data
for previously untested treatment modalities to evaluate their potential value for future
events.
Conclusions
Based on the demand forecasted by CDC models, the individual GDAHA
facilities will be able to meet and exceed the demands generated by an avian flu
pandemic involving the Miami Valley. If they execute their current surge plans, they will
have capacity for both the most likely scenario as well as for the worse case scenario.
The total planned surge beds involve a composite of approaches which include
reallocating current hospital space, freeing up currently available beds and, to a lesser
extent, opening some off-site operations. There are adequate numbers of ICU surge beds,
surge ventilators, and morgue spaces to meet the calculated demand. However, the
adequacy of the portable backup ventilators to provide prolonged ventilation for avian flu
patients is doubtful. A significant surge capacity in negative pressure beds is part of the
plan, but would not be sufficient to meet a significant part of the projected demand from
an avian flu pandemic. Some facilities have employed relatively inexpensive
modifications that allow sections of wards or whole wards to be converted to a negative
pressure environment. Wider use of these modifications in existing structures or in new
33
construction is recommended to close the gap in negative pressure capability at an
affordable price.
If the estimates used in the CDC models are replaced with the data reported from
the 1918 flu pandemic, the GDAHA cumulative capacity will fall substantially short of
the demand. An expanded off-site surge capacity is needed for ward beds, ICU beds, and
morgue space in order to be prepared for this contingency. Additional staff and
additional equipment needed to supply this space, particularly additional ventilators for
ICU patients, are also required.
The extent of the plans to provide increased personnel to cover the surge activity
varied by discipline, but overall the plans focused mainly on the more typical short
duration scenario. The source of the physician surge response was not clearly defined in
most cases. Based on historical response and demonstrated commitment from the
medical professionals in the Miami Valley, a better than adequate response is anticipated
by each of the GDAHA facilities. However, in the face of an increase of up to 300,000
outpatient visits during a pandemic, many physicians and other healthcare workers might
be overwhelmed and not able to support hospital efforts as well as they have in past
scenarios. An equally important concern is the potential loss of personnel from failure to
report to work during a disaster, refusal to take care of high risk patients or from
becoming a victim in the line of duty. Surge plans should address the issues of providing
transportation to the hospital, child care, elder care, pet care and providing for the
medical needs of healthcare workers during extended duty. The issue of caring for high
risk patients should be addressed with workers and their representative organizations in
advance of a disaster. Worker attrition can best be minimized by having adequate stores

34
of PPE with proper training in its use and just-in-time refresher training. Healthcare
worker compliance with the proper use of PPE should be monitored and real time
corrections should be made when unsafe practices are noted. This is similar to the culture
that has been successfully fostered in operating rooms for decades.
The hospitals have sufficient stores of PPE on hand to meet the initial need during
the ramp up period of a pandemic despite the substantial increased requirement for this
equipment. The issue of restocking from local distributors is a potential choke point
since each distributor supplies multiple facilities and the demand for this equipment
would increase precipitously. The distributors’ ability to meet this surge in demand
should be explored by the facilities.
There is a severe shortage of neuraminidase inhibitors. Due to global shortages of
these agents, it is unlikely that significant quantities will be available in the near future to
meet all patient care needs. However, an effort should be made to secure a sufficient
stock to provide prophylaxis for employees who become exposed in the course of their
duties during an avian flu pandemic. This action will help motivate healthcare workers
during a period of extreme stress as well as help minimize staff attrition.
The majority of facilities do not have formal agreements with nursing homes or
home health care agencies that address their ability to accommodate the surge in demand
for service generated by accelerated discharges from the hospital. Without such plans,
some of the expected surge beds might be tied up by patients who can’t be discharged.
Most facilities do not have plans to screen people prior to or upon entering the
hospital. They should develop such plans and secure the needed resources, including an
increased supply of temperature screening devices and portable screening facilities. The

35
latter can be potentially secured through partnering with regional organizations. Policies
for all aspects of surge operations should be included in a surge planning document.
Many of the policies will overlap with existing policies for daily operations such as
infection control and can be simply cross referenced to those existing policies.

36
References
Alexander, D. J. (2000). A review of avian influenza. Proceedings of the European
Society for Veterinary Virology (ESVV) Symposium on Influenza Viruses of
Wild and Domestic Animals, Ghent, 16–18 May, 1999. Veterinary Microbiology,
74, 3–13.
American Fact Finder; US Census Bureau Website. Retrieved Nov 15, 2005, from
http://factfinder.census.gov/home/saff/main.html?_lang=en
Anderson, M. (2004). Avian Flu: WHO prepares for the worst. Canadian Medical
Association Journal, 15(55), 777.
Barry, J.M. (2005). The Great Influenza. New York, New York: Penguin Group.
Beare, A. S., & Webster, R. G. (1991). Replication of avian influenza viruses in humans.
Archives of Virology, 119, 37–42.
Borgundvaag, B., Ovens, H., Goldman, B., Schull, M., Rutledge, T., Boutis, K.,
Walmsley, S., McGreer, A., Rachlis, A., & Farquarson, C. (2004). SARS
outbreak in the Greater Toronto Area: the emergency department experience.
Journal of Applied Mathematics and Computing, 171(11), 1342-1344.
Capua, I., & Alexander, D. (2002). Avian influenza and human health. Acta Tropica, 83,
1-6.
Cone, D.C., Weir, S.C., & Bogucki, S. (2004). Convergent volunteerism. Annals of
Emergency Medicine, 41(4), 457-462.
Flowers, L., Mothershead, J., & Blackwell, T. (2002). Bioterrorism Preparedness II: the
community and emergency medical services systems. Emergency Medicine
Clinics of North America, 20, 457-476.
37
Greenberg, M. I., & Hendrickson, R. G. (2003). CIMERC: Drexel University Emergency
Department Terrorism Preparedness Consensus Panel: report of the
CIMERC/Drexel University Emergency Preparedness Consensus Panel.
Academic Emergency Medicine, 10, 783-788.
Hampton, T. (2004). Clues to the deadly 1918 flu revealed. Journal of the American
Medical Association, 291(13), 1553.
Hick, J. L., Hanfling, D., Burstein, J. L.,DeAtley, C., Barbisch, D., Bogdan, D. N. &
Cantrill, S. (2004). Health care facility and community strategies for patient surge
care capacity. Annals of Emergency Medicine, 44(3), 253-261.
Hoard, M., Homer, J., Manley, W., Furbee, P., Haque, A., & Helmkamp, J. (2005).
Systems modeling in support of evidence-based disaster planning for rural areas.
International Journal of Hygiene and Environmental Health, 208, 117-125.
Hodge, J. G., Gable, L. A., & Calves, S. H. (2005). Volunteer health professionals and
emergencies: assessing and transforming the legal environment. Biosecurity and
Bioterrorism, 3(3), 216-223.
Hogan, D. E., Waeckerle, J. F., Dire, D. J., & Lillibridge, S. R. (1999). Emergency
department impact of the Oklahoma City bombing. Annals of Emergency
Medicine, 34(2), 160-167.
Kurtz, J., Manvell, R. J., & Banks, J. (1996). Avian influenza virus isolated from a
woman with conjunctivitis. Lancet, 348, 901–902.
Lau, J. T., Yang, X., Leung, P., Chan, L., Wong, E., Fong, C., & Tsui, H. (2004a). SARS
in three categories of hospital workers, Hong Kong. Emerging Infectious
Diseases, 10(8), 1399-1404.

38
Lau, J. T., Fung, K.S., Wong, T.W., Kim, J. H., Wong, E., Chung, S., Ho, D., Chan, L.Y.,
Lui, S. F., & Cheng, A. (2004b). SARS transmission among hospital workers in
Hong Kong. Emerging Infectious Diseases, 10(2), 280-286.
Meltzer M. I., Shoemaker H., & Kownaski M. (2000). FluAid 2.0: a manual to aid state
and local level public health officials plan, prepare, and practice for the next
influenza pandemic. Centers for Disease Control and Prevention, U.S.
Department of Health and Human Services. Retrieved Nov 15, 2005 from
http://www.cdc.gov/flu/flusurge.htm
Normile, D. (2005). Vietnam battles bird flu and critics [Electronic Version]. Science,
309, 368-373.
Parry, J. (2004). WHO investigates possible human to human transmission of avian flu
[Electronic Version]. British Medical Journal, 328, 308.
Peiris, M., Yam, Y. C., Chan, K. H., Ghose, P., & Shortridge, K. F. (1999). Influenza A
H9N2: aspects of laboratory diagnosis. Journal of Clinical Microbiology, 37,
3426–3427.
Qureshi, K., Gershon, R. M., Sherman, M. F., Straub, T., Gebbie, E., McCollum, M.,
Erwin, M. J., & Morse, S. S. (2005). Health care workers’ ability and willingness
to report to duty during catastrophic disasters. Journal of Urban Health, 82(3),
378-388.
Reid, A., Fanning, T. G., Janczewski, T. A., & Taubenberger, J. K. (2000).
Characterization of the 1918 “Spanish” influenza virus neuraminidase gene
[electronic Version]. Proceedings of the National Academy of Science, 97, 6785-
6790.

39
Reid, L. (2005). Diminishing returns? Risk and the duty to care in the SARS epidemic.
Bioethics, 19(4), 348-361.
Romano, M. (2001). Medical personnel respond: physicians across the nation eager to
volunteer. Modern Healthcare, 31(38), 24.
Rubinson, L., Nuzzo, J. B., Talmor, D. S., O’Tool, T., Kramer, B. R., & Inglesby, T. V.
(2005). Augmentation of hospital critical care capacity after bioterrorist attacks or
epidemics: Recommendations of the Working Group on Emergency Mass Critical
Care. Critical Care Medicine, 33(10), E1-E13.
Schoch-Spana, M. (2001). Hospital’s full-up: the 1918 influenza pandemic. Public
Health Report, 116, 32-33.
Shapira, Y., Marganitt, B., Roziner, I., Shochet, T. A., Bar, Y., & Shemer, J. (1991).
Willingness of staff to report to their hospital duties following an unconventional
missile attack. Israel Journal of Medical Sciences, 27, 704-711.
Shortridge, K. F., Zhou, N. N., Guan, Y., Gao, P., Ito, T., Kawaoka, Y., Kodihalli, S.,
Krauss, S., Markwell, D., Murti, K. G., Norwood, M., Senne, D. A., Sims, L.,
Takada, A., & Webster, R. G. (1998). Characterization of avian H5N1 influenza
viruses from poultry in Hong Kong. Virology, 252, 331–342.
Sibbeld, B. (2003). Right to refuse work becomes another SARS issue. Canadian
Medical Association Journal, 169(2), 141.
Tsai, M. C., Arnold, J. L., Chuang, C. C., Chi, C. H., Liu, C. C.. & Yang, Y. J. (2004).
Impact of an outbreak of severe acute respiratory syndrome on a hospital in
Taiwan, ROC. Emergency Medicine Journal, 21, 311-316.

40
Vortran Medical Technology 1, Inc. (2005). Vortran Automatic Resuscitator User Guide.
Retrieved May 16, 2006 from http://www.vortran.com
World Health Organization (WHO). (2004a). Influenza A (H5N1): WHO interim
infection control guidelines for health care facilities. Retrieved Dec 6, 2005 from
http://www.wpro.who.int/NR/rdonlyres/B045DC3C-A776-4455-8A6A-
B70F5269454F/0/Guidelines_for_health_care_facilities_10Mar.pdf
WHO. (2004b). WHO interim guidelines on clinical management of humans infected by
influenza A (H5N1). Retrieved Dec 6, 2005 from
http://www.who.int/csr/disease/avian_influenza/guidelines/clinicalmanage/en/
WHO. (2005). Cumulative number of confirmed human cases of avian influenza
A/(H5N1) reported to WHO. Retrieved Dec 6, 2005 from
http://www.who.int/csr/disease/avian_influenza/country/cases_table_2005_12_06
/en/index.html
Zhang, X., Meltzer, M. I. & Wortley, P. (2005). FluSurge2.0: a manual to assist state and
local public health officials and hospital administrators in estimating the impact of
an influenza pandemic on hospital surge capacity (Beta test version). Centers for
Disease Control and Prevention, U.S. Department of Health and Human Services.
Retrieved Nov 15, 2005 from
http://www.cdc.gov/flu/pdf/FluSurge2.0_Manual_060705.pdf

41
Appendix – Surge Interview Sheets
Surge Spaces
Field Name Date Type Description
Inpatient baseline Number of inpatient ward beds for normal daily operation
ED baseline Number of ED beds for normal daily operation Neg press baseline
Number of negative pressure inpatient ward beds for normal daily operation
ICU baseline Number of ICU beds for normal daily operation
Total surge Total number of surge beds
Inpatient surge Maximum number of additional inpatient beds after surge implementation
ED surge Maximum number of additional ED beds after surge implementation
Neg press surge Max # of additional negative pressure inpatient beds after surge implementation
ICU surge Maximum number of additional ICU beds after surge implementation
Discharge openings
Anticipated number of beds that can be freed up in 12 hours by early discharges and freezing elective admissions
Discharge holding area Yes No
Is there a designated discharge holding area for patients moved from beds, but awaiting prescriptions, transportation etc.
Time 50% surge Time (in hours) to achieve 50% of surge capacity
Time 100% surge Time (in hours) to achieve 100% of surge capacity
Nursing home surge Yes No
Is there a provision to surge nursing home capacity to handle early hospital discharges?
Home healthcare surge Yes No
Is there a provision to surge home healthcare capacity to handle early hospital discharges?
Pre-screening In Out None
Is there a provision for a screening area inside or outside the entrance to the ER or clinics?
Morgue Maximum number of bodies that the morgue can hold during surge operations
Offsite facility Yes No Does surge plan include opening an offsite facility if needed? If no, skip to comments
Time 50% offsite Time (in hours) to until the offsite location is operating at 50% or capacity
Time 100% offsite Time (in hours) to until the offsite location is operating at 100% or capacity
Offsite cap inpatient
Maximum number of inpatients that can be accommodated in the offsite facility
Offsite cap outpatient
Max # of outpatients that can be accommodated in the offsite facility per 24 period
Comments

42
Staffing Field Name Data Description
Total normal 24 hour staff
Total number of staff in hospital per 24 hour under normal conditions
Nurse surge Number of additional FTE nurses per 24 hours in surge mode
Administrative nurses
Number of FTE nurses in non-clinical positions that can be assigned to clinical jobs during surge
Physician surge
Number of additional FTE hospital employed physicians per 24 hours in surge mode
Administrative physicians
Number of FTE physicians in non-clinical positions that can be assigned to clinical jobs during surge
Clerk surge Number of additional FTE clerks per 24 hours in surge mode
Lab surge Number of additional FTE lab technicians per 24 hours in surge mode
Radiology surge
Number of additional FTE radiology technicians per 24 hours in surge mode
Security surge
Number of additional FTE security personnel per 24 hours in surge mode
Other surge Number of additional FTE of other hospital personnel (transport, facilities, food service per 24 hours in surge mode
Comments
43
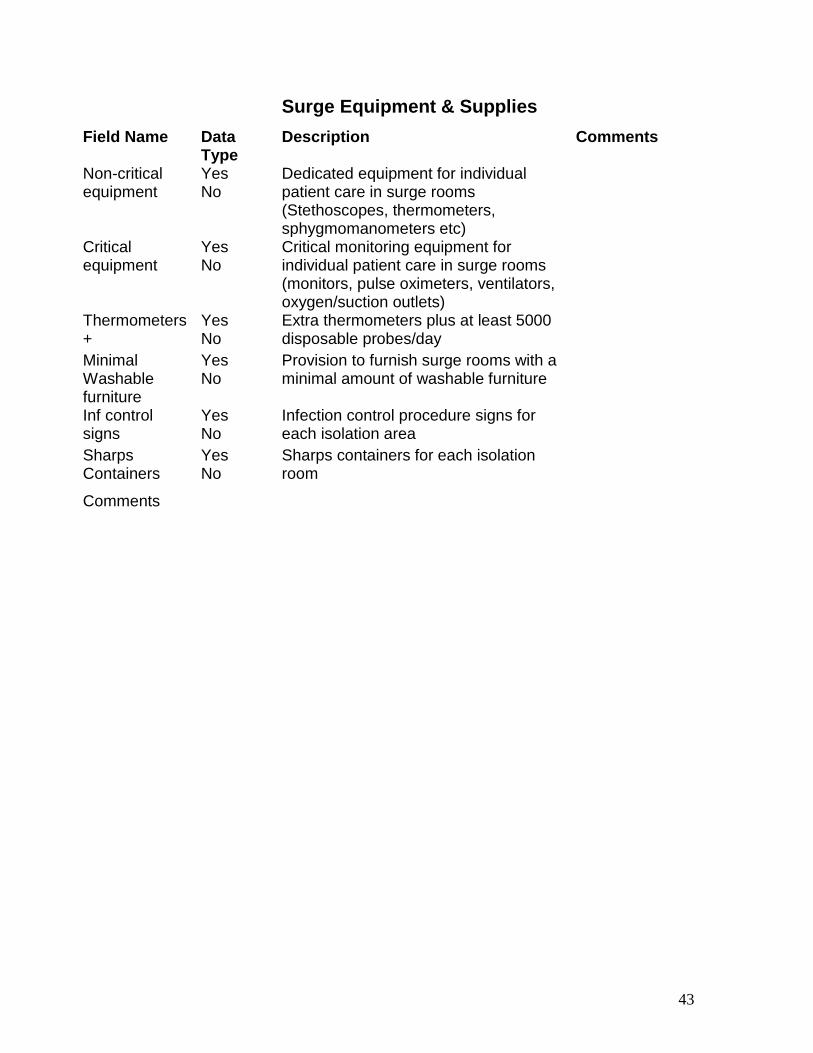
Surge Equipment & Supplies
Field Name Data Type
Description Comments
Non-critical equipment
Yes No
Dedicated equipment for individual patient care in surge rooms (Stethoscopes, thermometers, sphygmomanometers etc)
Critical equipment
Yes No
Critical monitoring equipment for individual patient care in surge rooms (monitors, pulse oximeters, ventilators, oxygen/suction outlets)
Thermometers +
Yes No
Extra thermometers plus at least 5000 disposable probes/day
Minimal Washable furniture
Yes No
Provision to furnish surge rooms with a minimal amount of washable furniture
Inf control signs
Yes No
Infection control procedure signs for each isolation area
Sharps Containers
Yes No
Sharps containers for each isolation room
Comments

44
Surge Pharmaceuticals
Field name Data Description Comments
Neuraminidase Inhibitors
Total number of doses of antiviral neuraminidase inhibitors on-hand
Antibiotics Total number of doses of respiratory antibiotics on hand for patients developing secondary infections (macrolides, tequin, levoquin, second or third generation cephalosporins)
Comments

45
Personnel Protective Equipment
Field Name Data Type
Description Comments
N95 on-hand Number of N95 masks stored in the hospital
N95 restocking time Time (in days) to restocking N95 masks
Masks on-hand Number of surgical masks stored in the hospital
Mask restocking time
Time (in days) to restocking surgical masks
Gowns on-hand Number of protective gowns on-hand in the hospital
Gown restocking time
Time (in days) to restocking protective gowns
Goggles on-hand Number of goggles or eye shields on-hand in the hospital
Goggle restocking time
Time (in days) to restocking goggles or eye shields
Comments

46
Surge Policies
Field Name Data Description Comments
Screening Yes No
Policy for set up and operation of screening area(s) at hospital entrances to separate patients with suspected avian flu infections
Surge beds Yes No
Policy for opening surge beds and operating surge areas
PPE Yes No
Policy for initiating the use of masks, gowns, gloves & eyewear
Employee screen
Yes No
Policy for screening employees prior to start of a shift and after exposure to infected patients and for use of vaccines/antiviral agents
Discharge surge Yes No
Policy for accelerated discharges, discharge holding area and coordination with nursing homes and home healthcare
Critical care surge
Yes No
Policy for clearing ICU beds
Lab surge Yes No
Policy for handling lab specimens from surge patients on wards, during transport and in the lab
Food surge Yes No
Policy for delivery of food in disposable containers to surge Pts
Security surge Yes No
Policy for the roles and authority of security personnel in the enforcement of isolation procedures and patient & visitor flow during surge operations
Waste surge Yes No
Policy for the handling and disposal of waste from infected patient rooms during surge operations
Linen surge Yes No
Policy for handling linen and other non-disposable supplies from infected patient rooms during surge operations
Hire surge Yes No
Policy for emergency hiring and accelerated credentialing during surge operations
Training surge Yes No
Policy for training personnel on surge unique procedures and equipment
Mass care Yes No
Policy for curtailing the scope of critical care to a limited number of procedures with proven efficacy
Offsite surge Yes No
Set of policies to active, operate and deactivate an offsite surge facility
Data surge Yes No
Policy to collect data to track exposures and evaluate new treatment during surge operations