feasibility, benefits and challenges of modular construction
102
FEASIBILITY, BENEFITS AND CHALLENGES OF MODULAR CONSTRUCTION IN HIGH RISE DEVELOPMENT IN THE UNITED STATES: A DEVELOPER’S PERSPECTIVE by Sri Velamati Bachelor of Science, Economics University of Pennsylvania Submitted to the Program in Real Estate Development in Conjunction with the Center for Real Estate in Partial Fulfillment of the Requirements for the Degree of Master of Science in Real Estate Development at the Massachusetts Institute of Technology September, 2012 ©2012 Sri Velamati All rights reserved The author hereby grants to MIT permission to reproduce and to distribute publicly paper and electronic copies of this thesis document in whole or in part in any medium now known or hereafter created. Signature of Author___________________________________________________________ Center for Real Estate July 30, 2012 Certified by__________________________________________________________________ Christopher Gordon Lecturer, Center for Real Estate Thesis Supervisor Accepted by_________________________________________________________________ David Geltner Chair, MSRED Committee, Interdepartmental Degree Program in Real Estate Development
-
Upload
doankhuong -
Category
Documents
-
view
232 -
download
0
Transcript of feasibility, benefits and challenges of modular construction
FEASIBILITY, BENEFITS AND CHALLENGES OF MODULAR CONSTRUCTION IN HIGH
RISE DEVELOPMENT IN THE UNITED STATES: A DEVELOPER’S PERSPECTIVE
by
Sri Velamati
Bachelor of Science, Economics
University of Pennsylvania
Submitted to the Program in Real Estate Development in Conjunction with the
Center for Real Estate in Partial Fulfillment of the Requirements for the Degree of
Master of Science in Real Estate Development
at the
Massachusetts Institute of Technology
September, 2012
©2012 Sri Velamati
All rights reserved
The author hereby grants to MIT permission to reproduce and to distribute
publicly paper and electronic copies of this thesis document in whole or in part
in any medium now known or hereafter created.
Signature of Author___________________________________________________________
Center for Real Estate
July 30, 2012
Certified by__________________________________________________________________
Christopher Gordon
Lecturer, Center for Real Estate
Thesis Supervisor
Accepted by_________________________________________________________________
David Geltner
Chair, MSRED Committee, Interdepartmental
Degree Program in Real Estate Development

2
3
Feasibility, Benefits And Challenges Of Modular Construction In High Rise
Development In The United States: A Developer’s Perspective
by
Sri Velamati
Submitted to the Program in Real Estate Development in Conjunction with the
Center for Real Estate on July 30, 2012 in Partial Fulfillment of the Requirements
for the Degree of Master of Science in Real Estate Development
ABSTRACT
Modular construction has long been utilized in the construction of residential
and many other commercial product types as a means for potentially quicker
construction delivery times. Over the past 5 years this construction technique
has slowly been introduced into the high rise residential market throughout the
world. The additional structural challenges of high rise construction make
modular construction in this setting more challenging, but the high construction
costs of high rise construction also make any savings in time and hard cost worth
consideration. Based on case studies, interviews and financial simulations this
thesis will address the design, engineering, sustainability, scheduling, legal and
financial considerations a developer would likely consider in adopting modular
construction in a high rise project in the United States.
Thesis Supervisor: Christopher Gordon
Title: Lecturer, Center for Real Estate

4
5
ACKNOWLEDGEMENTS
I would like to thank those that have been so instrumental in this work product
and throughout my time at the Massachusetts Institute of Technology’s Center for
Real Estate.
My thesis advisor, Chris Gordon, provided a tremendous amount of guidance
and expertise in the few calculated words he utilized and is emblematic of his
Socratic approach. I would also like to thank the faculty and staff at MIT,
especially Dennis Frenchman, David Geltner and W. Tod McGrath, who allowed
me to explore my interests, learn and grow more than I could have imagined.
I especially would like to thank my family who helped me while I was away at
MIT. My son, parents and in-laws gave me the strength to go to MIT. But my wife,
Praveena, was the unsung hero in this and all my endeavors. Without her none of
this would be possible and her resolve, character, kindness and enthusiasm
have always inspired me and carried me during the most challenging times.
6
TABLE OF CONTENTS
I. Introduction ................................................................................................................. 8
II. Methodology ............................................................................................................ 10
III. Brief History of Modular Construction .................................................................... 13
IV. Modular Process ....................................................................................................... 16
A. Factory .............................................................................................................................. 19
B. Transportation .................................................................................................................. 22
C. Onsite ................................................................................................................................ 25
V. Modular Construction Industry ............................................................................... 27
VI. Design Considerations ............................................................................................. 28
VII. Structural Considerations ........................................................................................ 35
VIII. MEP Considerations ................................................................................................. 39
IX. Sustainability Considerations .................................................................................. 40
X. Legal Considerations ............................................................................................... 43
XI. Schedule Considerations ........................................................................................ 44
XII. Financial Considerations ......................................................................................... 46
A. Financing .......................................................................................................................... 47
B. Labor Markets .................................................................................................................. 49
C. Pricing ................................................................................................................................ 50
XIII. Case Studies .............................................................................................................. 58
A. Paragon, Brentford, West London, UK .......................................................................... 59
B. Phoenix Court, Bristol, UK ................................................................................................ 62
C. Victoria Hall, Wembley, UK ............................................................................................. 65
D. Victoria Hall, Wolverhampton, UK ................................................................................. 67
E. Atlantic Yards, Brooklyn, NY ........................................................................................... 71

7
F. Sky City, Changsa, China ............................................................................................... 74
XIV. Conclusions ............................................................................................................... 75
Appendix .......................................................................................................................... 82
Bibliography ................................................................................................................... 101
8
I. Introduction
Development and operating margins in real estate have continued to diminish
over the past 30 years as the industry has been more efficient. Market
participants have utilized every advantage at their disposal and competition
has squeezed out excess profit in the form of higher land and acquisition prices.
(Cassidy, 2008) Substantial innovations have occurred in past 40-50 years in
capital markets, financing, design, marketing, operations, construction delivery
and materials.
However, relatively far few innovations have occurred in construction
sequencing and process, as each project is built predominately in the same
order: design, site work, foundations, structural, exterior, mechanical and finally
interior finishes. Some innovations have occurred such as “fast tracking” a
process by which only partial design work is required prior to starting site work
and foundations. Since type of foundations (slab-on-grade vs. deep footings vs.
piers) and construction (concrete vs. steel vs. wood) can typically be decided
early on, work can commence well before the full project is designed. This allows
final design and some construction work to occur simultaneously thus saving
time and some costs related to construction loan interest carry. Similarly “up-
down construction” improves schedule timing by allowing construction to
simultaneously occur above and below grade. The process effectively allows
below grade excavation and foundations to be poured while construction on
above grade structural elements are also occurring, which is in stark contrast to
the typical approach of construction starting below grade and ending at the
top of the building.
Even these approaches are relatively new in the development industry and not
widely adopted. But these and other substantial changes in construction
practices maybe a final frontier in harvesting financial yields in development. To
9
that end, modular construction appears poised to address financial, scheduling
and other concerns in development. This technology may provide similar or
better savings than the previously mentioned innovations.
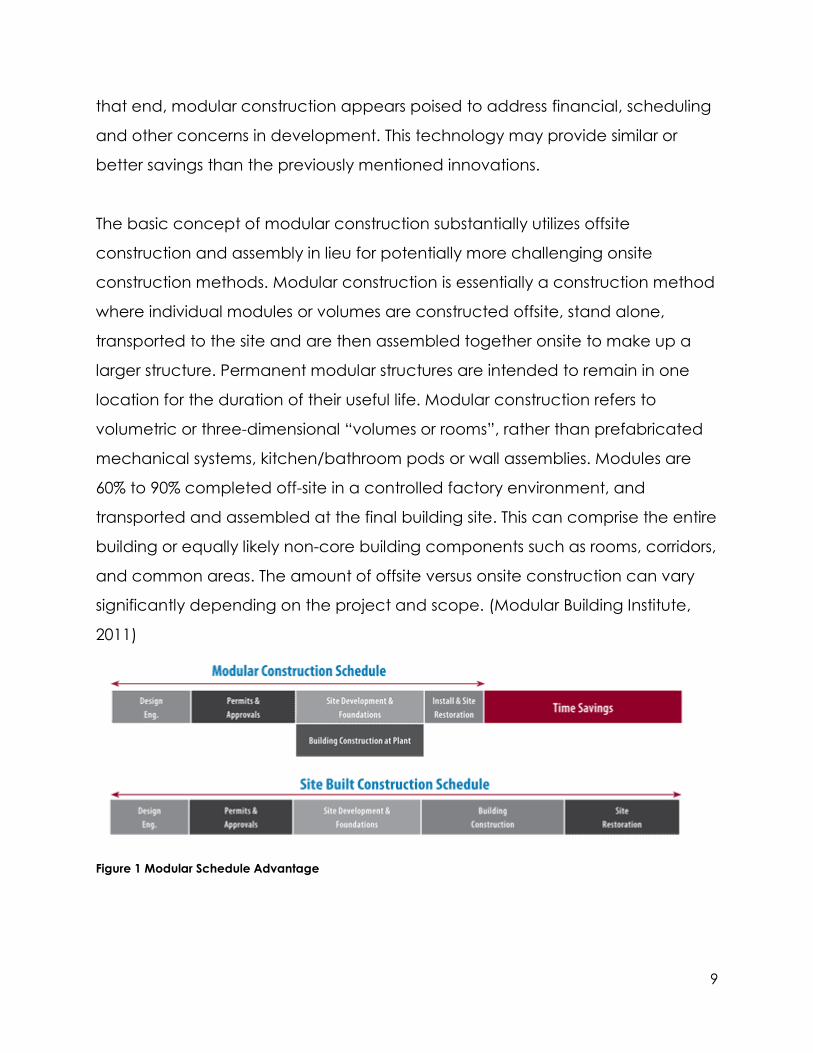
The basic concept of modular construction substantially utilizes offsite
construction and assembly in lieu for potentially more challenging onsite
construction methods. Modular construction is essentially a construction method
where individual modules or volumes are constructed offsite, stand alone,
transported to the site and are then assembled together onsite to make up a
larger structure. Permanent modular structures are intended to remain in one
location for the duration of their useful life. Modular construction refers to
volumetric or three-dimensional “volumes or rooms”, rather than prefabricated
mechanical systems, kitchen/bathroom pods or wall assemblies. Modules are
60% to 90% completed off-site in a controlled factory environment, and
transported and assembled at the final building site. This can comprise the entire
building or equally likely non-core building components such as rooms, corridors,
and common areas. The amount of offsite versus onsite construction can vary
significantly depending on the project and scope. (Modular Building Institute,
2011)
Figure 1 Modular Schedule Advantage
10
The benefits potential include higher financial return due to less construction
interest carry and related time savings via a shortened construction schedule
and potentially reduced hard cost from repeatable and higher efficiency
construction methods, streamlined construction process, reduced material
waste and higher construction quality.
This thesis will attempt to address the potential impact of high rise modular
construction that could inure time and financial savings that would lend itself to
a higher adoption rate throughout the US. The thesis will further address physical,
design, legal, building code, scheduling and financing considerations that will
impact the adoption of modular technology in high rise construction.
II. Methodology
Although modular technology has been around for decades and established
low rise examples have existed for over 20 years, the technology is relatively new
in high rise construction and very limited examples exist that have been
completed or are under construction. As such, large data set analysis is not
currently possible and analysis must be limited to the few dozen projects
available for review around the world. In light of this data set, the methodology
of research primarily relies upon literature review, interviews, case studies and
financial analysis based upon scenarios of available construction data.
The scope of the literature review was focused on the technical aspects of
current modular systems and case studies of high rise modular projects from
around the world. Interviews were conducted of adopters, manufacturers,
contractors, industry representatives and lenders that would likely be involved in
the development of a high rise modular project.
11
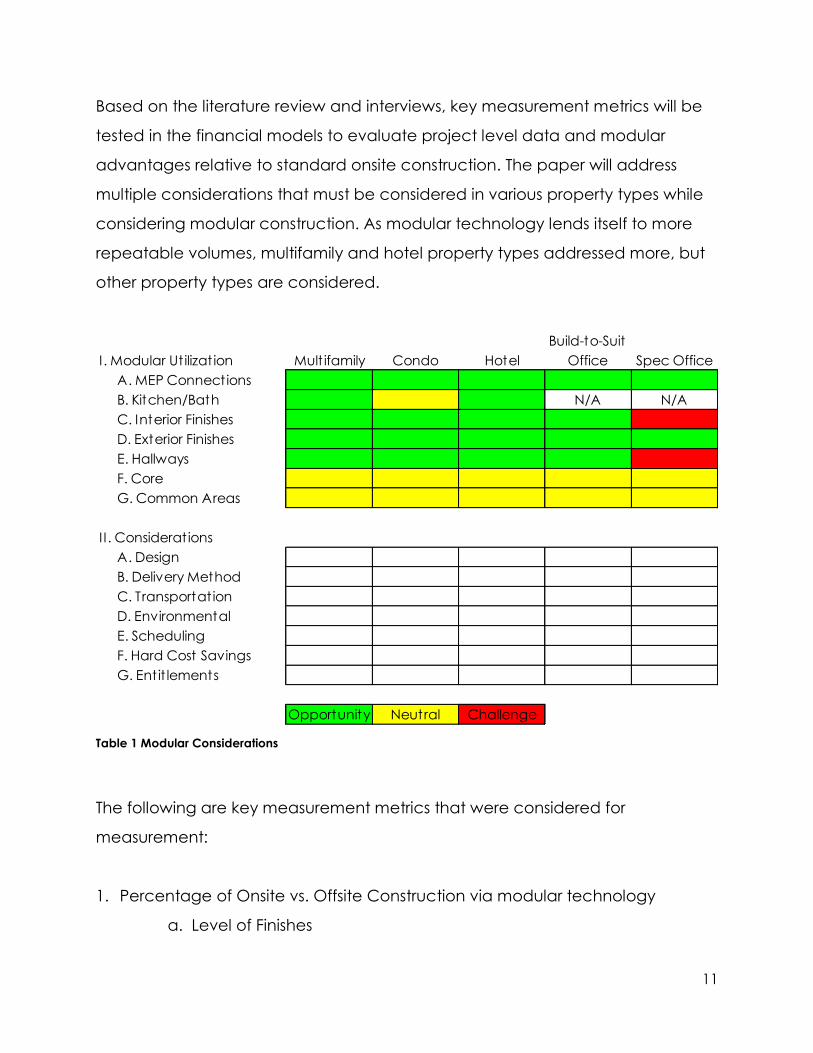
Based on the literature review and interviews, key measurement metrics will be
tested in the financial models to evaluate project level data and modular
advantages relative to standard onsite construction. The paper will address
multiple considerations that must be considered in various property types while
considering modular construction. As modular technology lends itself to more
repeatable volumes, multifamily and hotel property types addressed more, but
other property types are considered.
Table 1 Modular Considerations
The following are key measurement metrics that were considered for
measurement:
1. Percentage of Onsite vs. Offsite Construction via modular technology
a. Level of Finishes
I . Modular Ut ilizat ion Mult ifamily Condo Hotel
Build-to-Suit
Office Spec Office
A. MEP Connections
B. Kitchen/Bath N/A N/A
C. Interior Finishes
D. Exterior Finishes
E. Hallways
F. Core
G. Common Areas
II. Considerations
A. Design
B. Delivery Method
C. Transportat ion
D. Environmental
E. Scheduling
F. Hard Cost Savings
G. Ent it lements
Opportunity Neutral Challenge
12
b. Economies of Scale and Project Size
2. Project Timing – parse time savings related to each element of modular
construction
a. Fast tracking vertical construction in factory, while site work
continues
b. Climate controlled environment & minimized weather related
delays
c. Assembly of pre-cut and manufactured parts versus field assembly
d. Sequencing of trades is minimized by utilizing MEP integrated
modules
e. Reduced down time due to assembly line installation versus
constant movement of trades to each installation site in a purely
onsite project
3. Cost Savings – parse cost savings related to each element
a. Reduced interest carry on construction loan resulting from reduced
construction time
b. Increased interest or contingency reserve to address lender
underwriting concerns related to uncertainty. This maybe irrelevant
as the lending community becomes more comfortable with
modular.
c. Materials cost of modules vs. standard onsite construction
d. Reduced labor cost
i. Due to cheaper labor markets of the manufacturer vs. onsite
project city
ii. Due to less skilled labor vs experienced trades
iii. Due to non-union vs. union labor
13
iv. Due to controlling many trades within one manufacturing
company
v. Due to increased job safety and lower insurance premiums
e. Storage costs –need to store raw materials on site versus carry cost
of finished modules at manufacturer’s facility
f. Reduced capital expenditures related to modules
g. Reduced contingency carry by forcing module manufacturers to
buyout the contract.
h. Does project scale impact cost savings (300 vs. 3,000 units)
i. Can dedicated manufacturers owned by general contractor or
developer ramp up and effectively achieve economies of scale
that inure to the project versus separate modular manufacturer
j. Operating Costs
i. Buildings cannot be partially occupied in most modular
projects, due to the crane and setting functions that are
necessary. This results in lost income due to partial
occupancy.
ii. Buildings can be occupied in entirety quicker due to modular
construction. This yields quicker property income and quicker
stabilization. However, delivery of entire buildings without
substantial pre-leasing occupancy translates to higher
operating expenses.
III. Brief History of Modular Construction
Among the earliest examples of prefabrication in during Britain’s Great Exhibition
of 1851, when the Crystal Palace was constructed in a few months and
assembled using a series of prefabricated parts. The exhibit was also taken apart
after the event and reassembled at another site. This is the precursor to modular
or factory-based fabrication of buildings. In the 1900s the United States entered
14
the market when the Sears Roebuck Company so prefabricated homes via mail
order. The purchaser would receive a kit of parts that assembled onsite to build
the home. But mass fabrication was first introduced in World War II when easy to
assemble mass accommodation was required for soldiers. The Army utilized
Quonset huts that could be easily assembled without skilled labor. This skill was
later utilized by the Europeans and Japanese to quickly rebuild war devastated
areas. In the 1960s and 1970s high rise concrete modular construction was
introduced. The Hilton Palacio del Rio Hotel was among the first concrete high
rise modular buildings in the world. The project was across from the Texas
World's Exposition of 1968, the 500-room hotel was designed, completed and
occupied in an unprecedented period of 202 working days. The hotel's room
modules were pre-cast from light-weight structural concrete. Before arriving on
the construction site, each room was fully decorated, including color TV, AM/FM
radios, beds, carpeting, and all FF&E. The units are 32 feet 8 inches and 29 feet
8 inches long, 13 feet wide and 9 feet 6 inches high. They weigh 35 tons each
and were manufactured at a plant located eight miles from the project site. All
units were installed in 46 days. A production line consisting of two rows of eight
room-size forms that produced eight complete units daily. The working crews
were composed, as an average, of more than 100 men who completed a
designated task 496 times, thus creating a true assembly line arrangement with
inexpensive labor. The casting process was started by coating the permanent,
hinged, outer forms with a forming release agent. Reinforcing steel for floors was
added, and in 30 minutes, six and a half cubic yards of lightweight ready-mix
concrete was poured to form a five-inch thick floor. When the concrete had set,
it was hard finished and was allowed to cure for several hours. After that, crews
placed steel reinforcing for the walls and ceilings, installed plumbing, electrical
conduits and positioned block-outs for doors and other openings. In 30 minutes,
fifteen and a half cubic yards of light weight ready-mix concrete for walls and
ceilings were poured and vibrated into place.
15
Each module received a code number that keyed its position during the whole
process, including date of erection and its exact placement in the building.
Once on the site, a 350hp crane equipped with a special 36-foot diameter ring
base and a 270-foot boom maneuvered them into place. So that they could
literally be "flown" into place without turning or dangling in mid-air, a Sikorsky
helicopter stabilizing tail section was attached to each room at job site. The tail,
rotor, engine, magnetic compass and a set of automatic controls were
fastened to a platform attached to the top of each unit. By giving the room a
pre-determined magnetic heading and by feathering the vertical propeller, the
operator atop the “flying" room controlled the direction of each unit as it was
being hoisted to a precise location.
An average of 17 modules was placed each day. Because the module
placement had to match the elevator shaft, each unit had to be set exactly on
the unit underneath, at a precise elevation, with a maximum working tolerance
of 3/4 inch to prevent creeping. Plumbing and wiring conduits were run up a 20-
inch chase between modules for quick connections to individual rooms. In their
final location, the reinforcing rods, extending from the lip at the corridor end of
each room, were welded together. Forms were then placed under the
interlacing rods and concrete poured to join the extensions in order to form the
corridor's floor. Removable panels in the corridors were then added to close the
20-inch chase which provides access to the continuous vertical mechanical
and electrical chaseways. (Modular Building Institute, 2007)
From this inefficient concrete module and elaborate, installation method arose
the need to create more manageable modules with greater application. Some
16
builders chose to utilize prefabricated subassemblies such as kitchen and
bathroom only pods that were inserted onsite in the appropriate locations. This
allowed for expensive areas to be developed in the factory and be attached in
the field to reduce the need for trade coordination. Other builders chose to
utilize wood frame and lightweight steel modules for low rise construction. The
minimal loads in low rise construction allowed for greater flexibility in application.
From these various methods, modern advances and the ability to solve
structural concerns arose the modern day steel high rise modules that provide
more flexibility in design and manufacturing.
Prefabrication and modular construction are processes that have been used in
some capacity by generations of construction professionals. Over the past
century, these processes have developed a stigma of cheapness and poor
quality; however, through modern technology, that image has changed.
Modular construction could be a key component that drives construction
industry productivity. Prefabrication and modular building processes are not
new activities in that 63% of the people that have been using it have been
doing so for 5 years or more. 85% of all industry participants have been using
these processes. Of those using it only 37% are using it at a high level in their
course of work. The primary reason industry participants are not using it is that
architects did not design it into their projects and architects cite owner
resistance as the primary reason they do not design modular construction.
(McGraw Hill Construction, 2011)
IV. Modular Process
Modular construction techniques are analogous to assembly line car
manufacturing and are readily observable on numerous videos on the internet
and modular manufacturer websites. Typically, four stages make up a modular
17
construction project. First, design development by the developer and plan
approval by any regulating authorities; second, assembly of module
components in a factory; third, transportation of modules to the project site; and
fourth, erection of modular units to form the building.
Modular contractors manufacture buildings at off-site locations. They may also
operate as general contractors on projects, coordinating the delivery,
installation, site work and finish of the building or the modular contractor will be
responsible for construction, delivery and installation of only the modules and an
overall general contractor will be responsible for the entire project. Construction
primarily occurs indoors away from harsh weather conditions preventing
damage to building materials and allowing builders to work in comfortable
conditions.
Unique to modular construction, while modules are being assembled in a
factory, site work is occurring at the same time or in some cases prior to
construction. This allows for much earlier building occupancy and contributes to
a much shorter overall construction period, reducing labor, financing and
supervision costs. Compared to traditional onsite construction, more
coordination of design and engineering of the modules is required before
construction of the modules can be completed; however, this requirement is
also changing as the modular manufacturing industry is maturing and evolving
to accommodate fast track construction techniques and the variety of delivery
modern construction delivery methods. Everything from traditional general
contracting to design-build-operate-transfer has been utilized in the modular
industry. In fact many schools, hospitals and prisons are built with modular
technology and an array of delivery methods. However, the off-site modular
construction requires more coordination during the design/construction process
and forces developers to make decisions earlier. For example in a steel frame,
18
high rise project, it’s possible to make decisions on foundations and some
structural elements, but size and depths of the modules will dictate necessary
structural supports. Similarly the exterior finishes, material specs and elevations
need to be decided before modules can be fabricated. Even if the building
exteriors will be built onsite the module volumes will be impacted by the
elevations. Thus a traditional design-bid-build model is possible, but more
challenging. It would be more appropriate to incorporate modular constrains
into the projects at an earlier date to ensure the project time and cost savings
are realized.
Through techniques that have been around for decades,
prefabrication/modularization is seeing a renaissance as technologies, such as
BIM, have enabled better assembly and precise design of modular
components. Changes in design such as the emergence of environmentally
sensitive design have also increased the opportunity for permanent modular
buildings. (Modular Building Institute, 2011) Additionally in light of the long
recession, more contractors are thinking of lean construction methods and
looking for ways to build for less and thus the growth of prefabrication and
modular construction. Although the trend for greater use of off-site construction
has been growing slowly for years, the recession and new technologies could
increase their use.
Permanent modular buildings may be Type III and V (wood frame, combustible)
or Type I and II (steel, concrete, non-combustible) and can have as many stories
as building codes allow. The focus in this thesis will be on the later as Type I and II
modular construction has been limited and untested in many markets and Type
V modular projects have been well documented, regardless of their relatively
small market share.
19
A. Factory
After the design is finalized with an architect, construction plans are sent to a
factory where the majority of the building is erected. PMC uses prefabricated
elements for as many building components as possible. Everything from walls
and mechanical systems to painting and carpet can be completed on the
assembly line. (Morton, 2011) Steel studs are usually cut to a standard length
and shipped to a jobsite where they're cut to the needed size. Instead of
wasting 2 feet of metal, the studs are created on the factory line to the exact
length required. Modular building factories maintain a high level of quality
control with inspections at each station, eliminating on-the-fly decisions or
unexpected complications that can occur in the field. (Morton, 2011)
Factory construction of modular components varies greatly from static factory
floors to conveyer belts to even robotic construction of modules. Toyota Motor
Corporation known for its automobiles successfully transferred robotic assembly
line manufacturing technology from the automobile sector to the construction
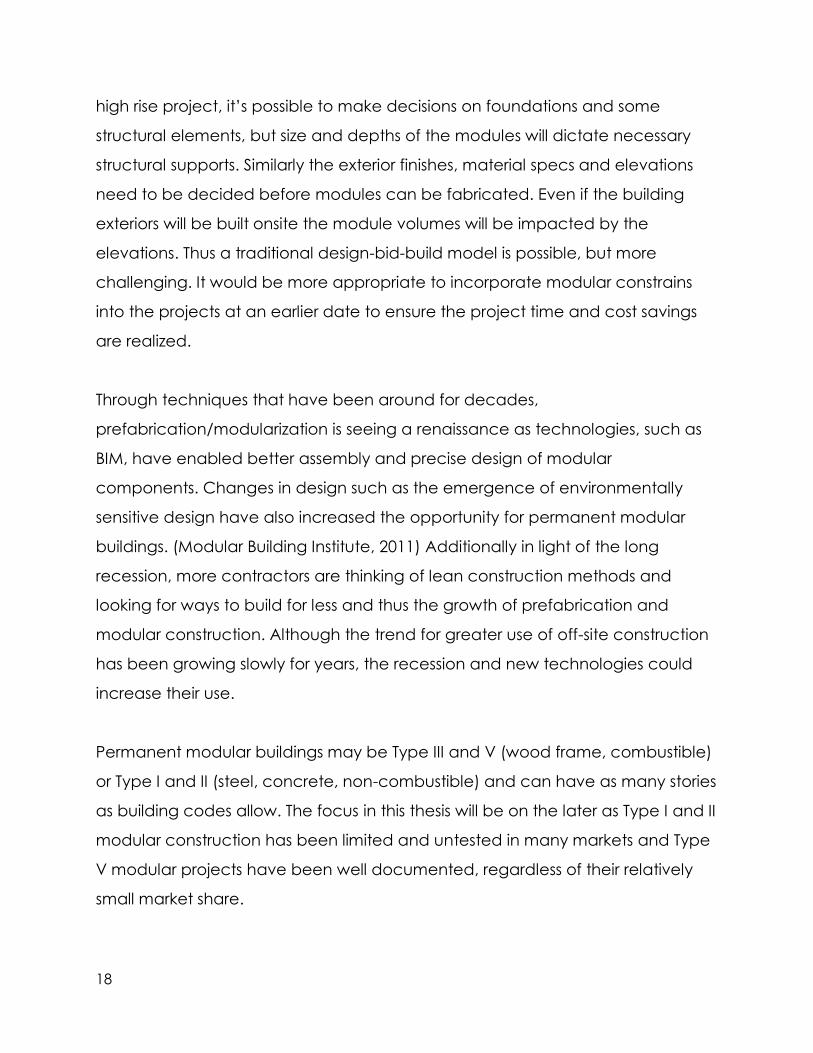
industry. (Bock, 2007) As seen in Picture 1 Typical Assembly Line Modular Factory a
typical modular factory works similar to other manufacturing facilities. Partially
assembled modules are visible on the right and assembly stations are visible in
the middle and left. The modules are moved from area to area on rollers.
20
Picture 1 Typical Assembly Line Modular Factory
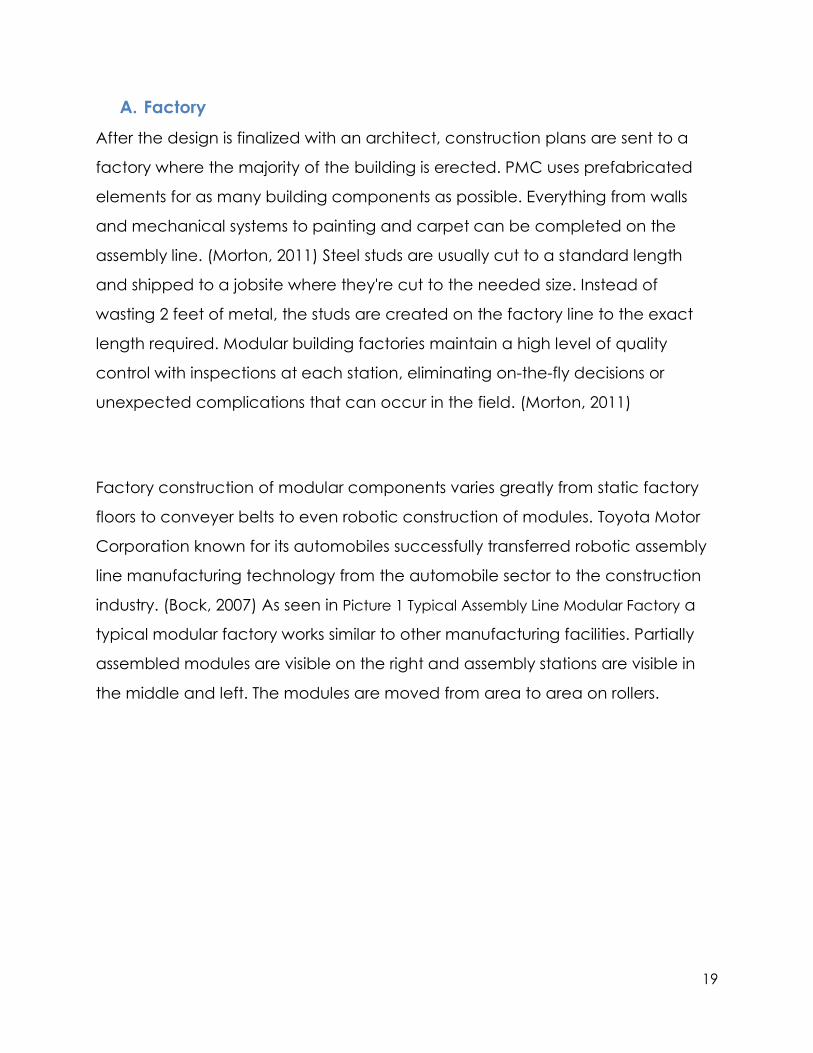
In Picture 2 the structural steel frame and decking are already installed and
each module is essentially a self-contained structural element that can
withstand the rigors of transportation, crane lifting, setting and final structural
assembly onsite.
21
Picture 2 Typical Steel Frame Assembly
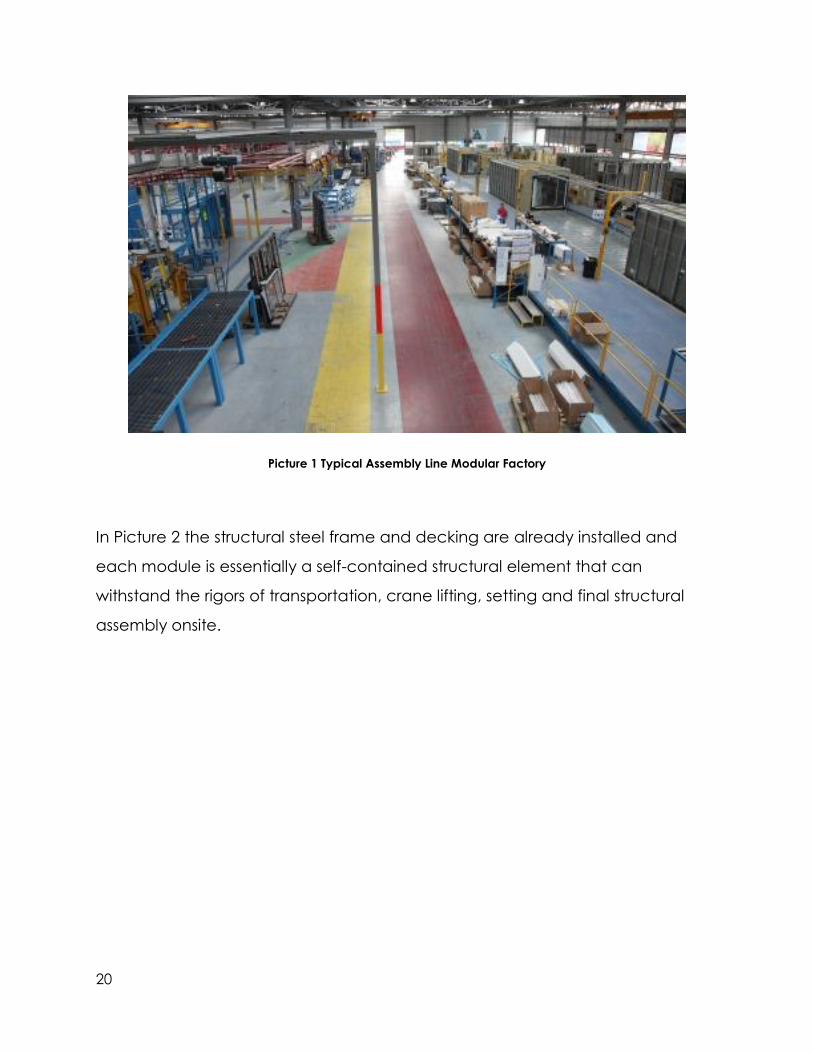
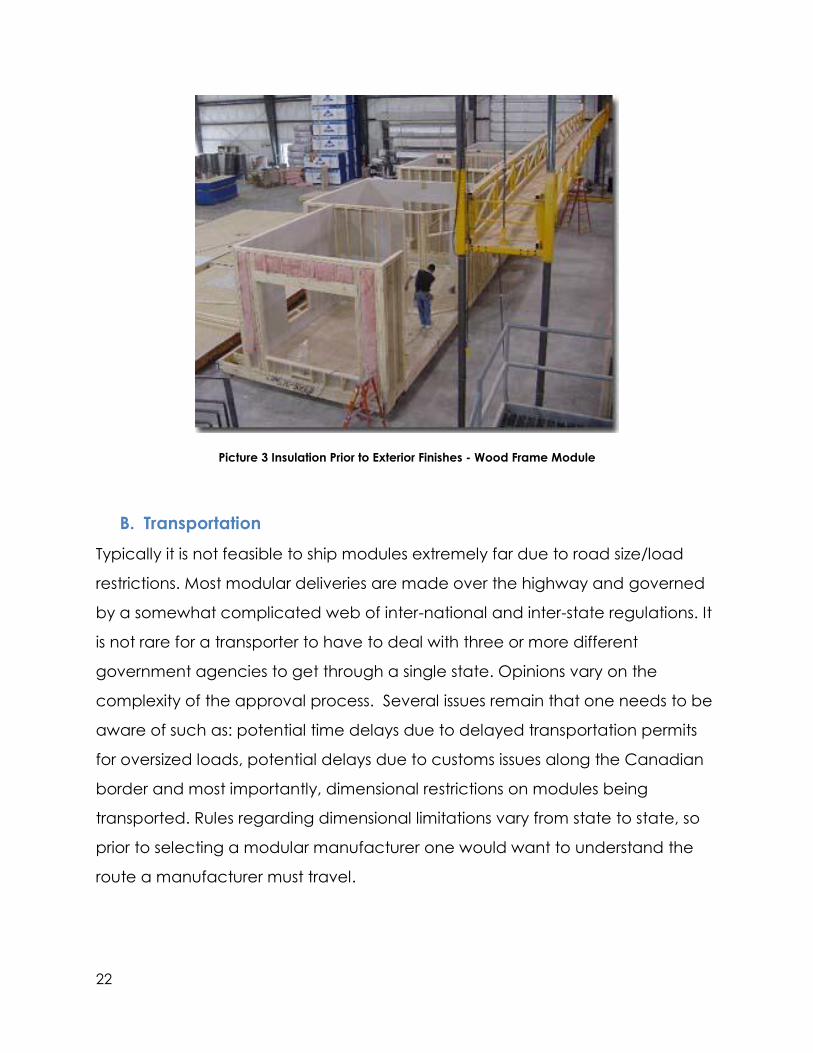
In Picture 3 note how insulation can be readily applied in every corner, since the
exterior in not finished and installers essentially have 360 degree access to the
entire module. Although a wood frame module, the same principle applies to a
steel frame module and the requisite fire proofing applications. This module can
have exterior finishes applied at the factory or sent to the site with only framing
and insulation.
22
Picture 3 Insulation Prior to Exterior Finishes - Wood Frame Module
B. Transportation
Typically it is not feasible to ship modules extremely far due to road size/load
restrictions. Most modular deliveries are made over the highway and governed
by a somewhat complicated web of inter-national and inter-state regulations. It
is not rare for a transporter to have to deal with three or more different
government agencies to get through a single state. Opinions vary on the
complexity of the approval process. Several issues remain that one needs to be
aware of such as: potential time delays due to delayed transportation permits
for oversized loads, potential delays due to customs issues along the Canadian
border and most importantly, dimensional restrictions on modules being
transported. Rules regarding dimensional limitations vary from state to state, so
prior to selecting a modular manufacturer one would want to understand the
route a manufacturer must travel.
23
A general rule of thumb to understand the most basic size limitations is that the
maximum width allowed anywhere is 16 feet, the maximum height is 13’6”
including trailer and the maximum length feasible for transport is around 60-65
feet long. Within these limitations there are varying levels of state specific
regulations and added expense mostly relating to width. Modules less than
twelve feet wide are mostly allowed to travel with no restrictions. When the size
increases to between twelve and fifteen feet wide there is an accompanying
increase in the restrictions and often a requirement for police escort. Once a
module reaches the fifteen to sixteen foot width it is almost universally declared
a wide-load that requires police escorts and can often be required to travel
overnight as to not impede local traffic. Additionally, the ceiling height must also
be considered, since most highway height restrictions are 13’ 6” and with a 4’
trailer height that leaves 9’ 6” for the module. Typically this will yield a finished
ceiling height of 9’ of the module and thus high ceilings may not be possible in
standard module construction. However the additional cost of the
transportation must be carefully balanced with the additional square footage
gained per trip and crane lift cost in a wider load. If there is a sufficient
economy of scale the larger volume modules will actually reduce the total
transportation cost even though the per trip cost is higher with the larger volume
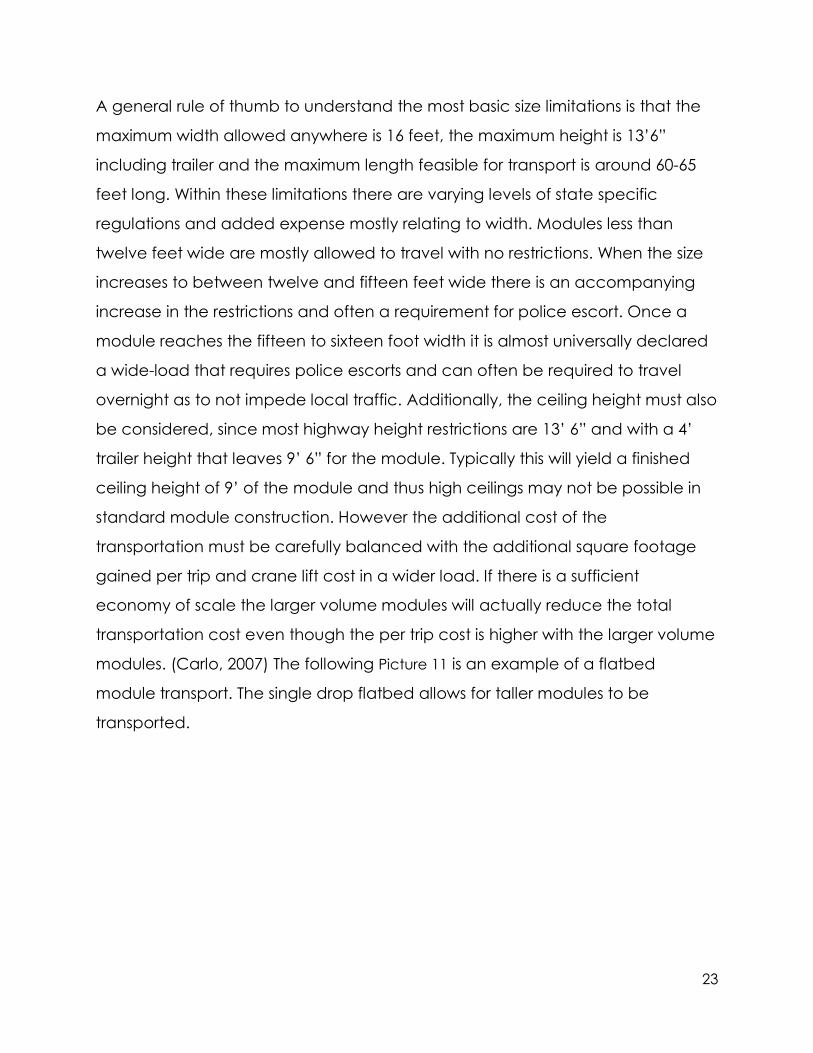
modules. (Carlo, 2007) The following Picture 11 is an example of a flatbed
module transport. The single drop flatbed allows for taller modules to be
transported.
24
Picture 4 Flatbed Module Transport
Modular manufacturers are located throughout North America, with larger
“clusters” of manufacturers in Pennsylvania, Georgia, Texas, Indiana, California,
and Alberta CN. Most manufacturers in North America are single location
operations and can competitively transport units within a 500 mile radius of their
plant. (Modular Building Institute, 2011) Shipping costs are billed separately on a
per mile basis and these costs must be weighed against the savings in modular
technology. Modular builders have begun utilizing both sea barge and
helicopter delivery to islands or particularly remote locations, but this has not yet
become widespread in the US. Despite the obvious difficulty inherent in such
complicated transport it may often be a more cost effective alternative than
utilizing a site built method in expensive labor markets or locations will poorly
trained construction trades.
25
C. Onsite
Once the modules are ready, they are shipped to the site and fastened
together. Module installation includes matte line connections for MEP, exterior
finishes and interior finishes, where applicable. The tolerances for such
connections have decreased considerably of the past 50 years and can be as
little as 1/32nd to 1/16th. The final construction stage includes completing exterior
systems such as cladding and roofing components and internal spaces like
lobbies, stairwells, and elevator shafts. (Morton, 2011)
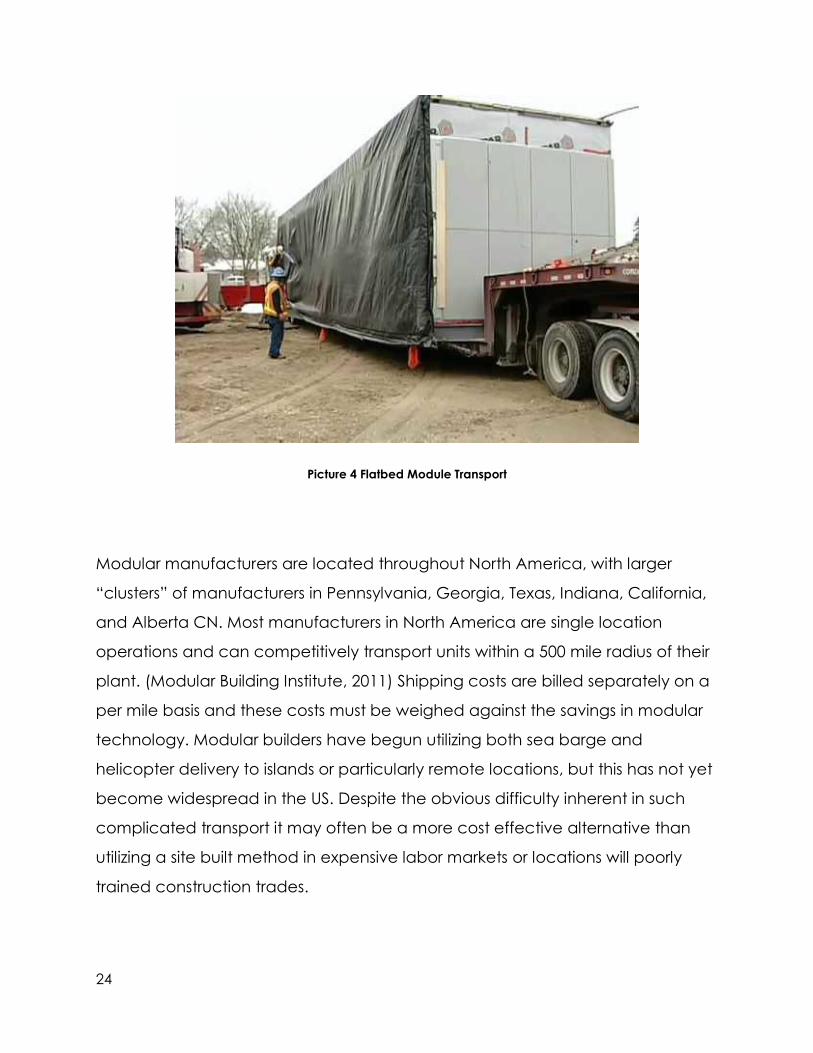
Picture 5 Lift of Steel Frame Module with Exterior Finishes
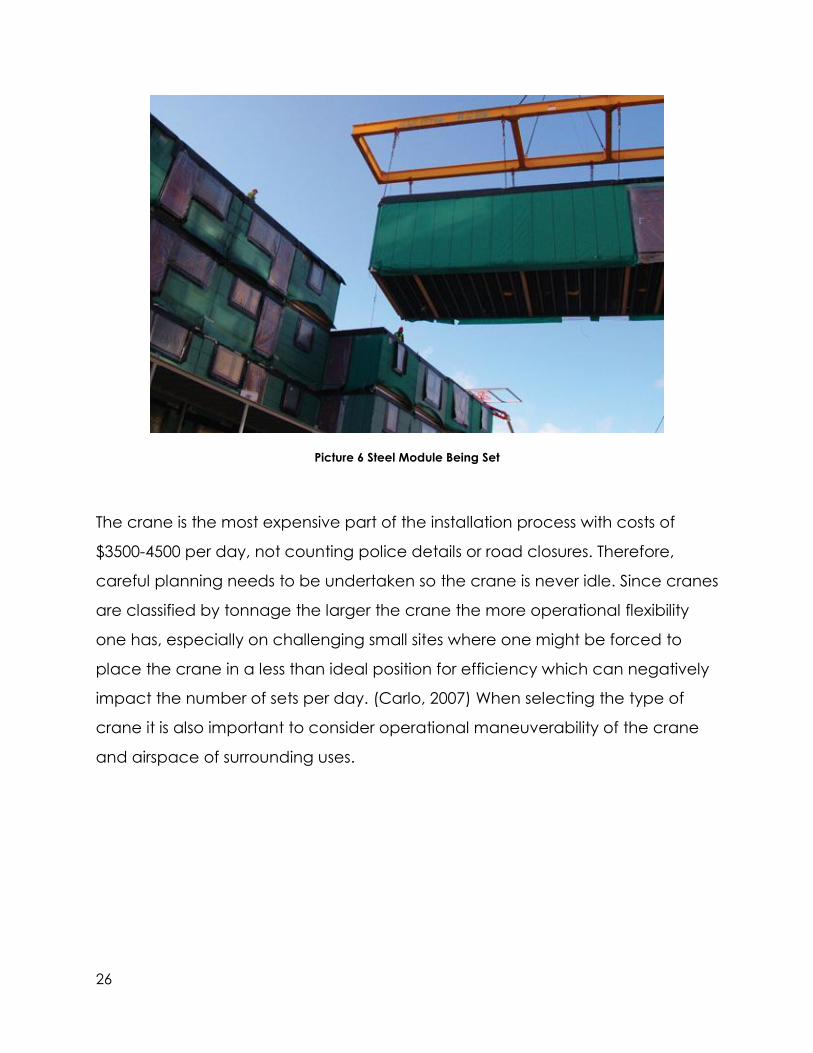
In Picture 6 a steel module is being lifted into place by a crane operated and 2
site personnel are guiding the setting process. This module is temporarily sealed
with waterproof material to withstand weather conditions during transport.
Additionally, windows are already installed the exterior surface is ready for any
finishing materials from masonry to siding to EIFS.
26
Picture 6 Steel Module Being Set
The crane is the most expensive part of the installation process with costs of
$3500-4500 per day, not counting police details or road closures. Therefore,
careful planning needs to be undertaken so the crane is never idle. Since cranes
are classified by tonnage the larger the crane the more operational flexibility
one has, especially on challenging small sites where one might be forced to
place the crane in a less than ideal position for efficiency which can negatively
impact the number of sets per day. (Carlo, 2007) When selecting the type of
crane it is also important to consider operational maneuverability of the crane
and airspace of surrounding uses.
27
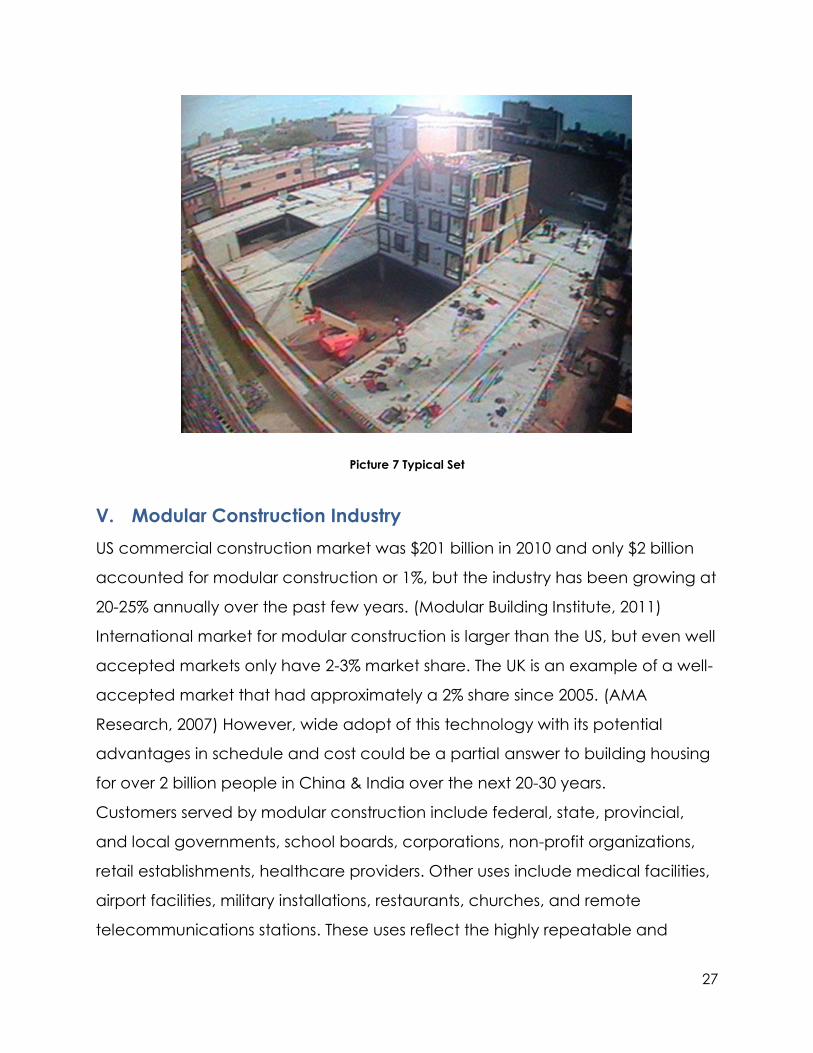
Picture 7 Typical Set
V. Modular Construction Industry
US commercial construction market was $201 billion in 2010 and only $2 billion
accounted for modular construction or 1%, but the industry has been growing at
20-25% annually over the past few years. (Modular Building Institute, 2011)
International market for modular construction is larger than the US, but even well
accepted markets only have 2-3% market share. The UK is an example of a well-
accepted market that had approximately a 2% share since 2005. (AMA
Research, 2007) However, wide adopt of this technology with its potential
advantages in schedule and cost could be a partial answer to building housing
for over 2 billion people in China & India over the next 20-30 years.
Customers served by modular construction include federal, state, provincial,
and local governments, school boards, corporations, non-profit organizations,
retail establishments, healthcare providers. Other uses include medical facilities,
airport facilities, military installations, restaurants, churches, and remote
telecommunications stations. These uses reflect the highly repeatable and
28
componentized nature of modular construction that lends itself well to
repeatable assembly line construction.
Larger facilities employ between 140-150 workers during their peak production,
while smaller plants employ between 60-70. The typical modular manufacturer
produced about 158,000 square feet in 2010, producing an average of 232
“modules.” This production is about 7% less than reported in 2009, which reflects
the challenging economic climate. Each module is roughly 600-700 square feet,
commonly 12 feet wide by 50+ feet in length. Transportation regulations are
commonly the limiting factor in module size. Depending on the level of
customization required by the owner and architect, most modules leave the
factory 60-90% complete, with wiring, plumbing, structural, and mechanical
systems inspected and approved before arriving at the site. (Modular Building
Institute, 2011)
Many including the National Research Council of the US National Academies
believe greater use of the modular construction techniques could greatly
improve both the efficiency and competitiveness of the US construction industry.
This need is further exacerbated by the lack of skilled onsite construction workers
and the need for construction companies to be leaner to be more competitive.
(McGraw Hill Construction, 2011)
However, capacity and access issues continue to exist in the modular industry.
The historical availability skilled trade labor and product demand hav
VI. Design Considerations
The decision to use modular construction must be made from the onset of
design; however there are a few examples of conventional site built designed
projects being later converted to modular construction. The advantages of
29
modular also wane considerably if your intended building doesn't have
repeating spaces. The prefabrication of entire rooms lies at the heart of modular
construction, so a building with open expanses is not the best candidate. For
example, an office building shell designed with unfinished interiors and intended
for multiple tenants who would finish out their own individual space would not
be a good option; however a build-to-suit office building could be viable.
(Morton, 2011) In addition finish customization, as required in most condominium
projects, can be possible and will yield very similar costs as traditional site built
customization. Challenges that arise from customization deal with very limited
opportunity to change structural and demising elements of the modules and
unit plans. The advantages of modularity and assembly line production are
limited by the lack of multiple master tradespeople at the factory to make
changes like swapping the location of a bedroom and bathroom. In a site build
project it may be possible to make such changes in the field and modify MEP
connections to accommodate a buyer’s needs, but such changes are more
challenging in a factory. If such market demands are necessary, it may be more
appropriate to provide a cold, dark shell module with exterior finishes and allow
onsite construction to complete the finishes. This example highlight the fact that
modular construction is not a binary condition in that many projects use both
onsite and offsite construction on projects. The question is more about how
much offsite construction is appropriate for a particular project.
Modular construction is not necessarily a barrier to creativity. The architects for
the Victoria Hall Wolverhampton project readily admit that the challenges of
converting a traditional building to a modular building arises from planning
issues, which require structural changes to the design. However, none of those
changes critically impacted the overall aesthetic of the buildings. (Modular
Building Institute, 2010) Modular rooms or pairs of rooms or room/corridor
modules can be used to create a variety of unit layouts. These layouts can be
30
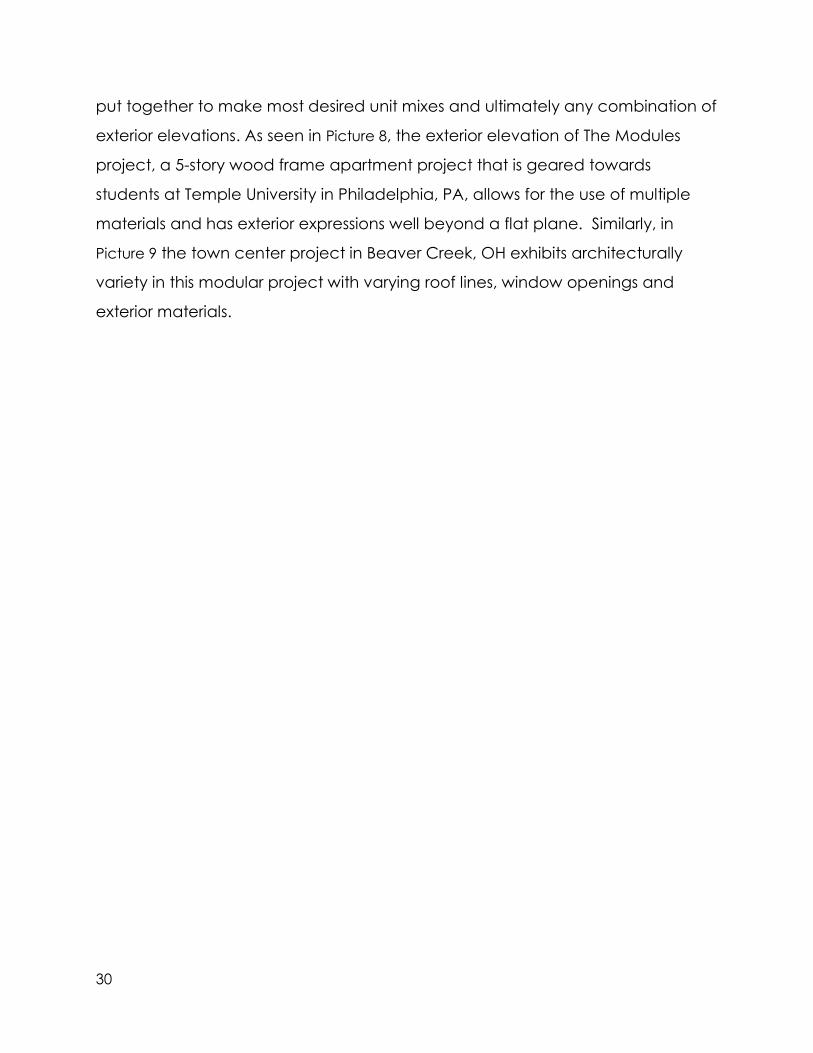
put together to make most desired unit mixes and ultimately any combination of
exterior elevations. As seen in Picture 8, the exterior elevation of The Modules
project, a 5-story wood frame apartment project that is geared towards
students at Temple University in Philadelphia, PA, allows for the use of multiple
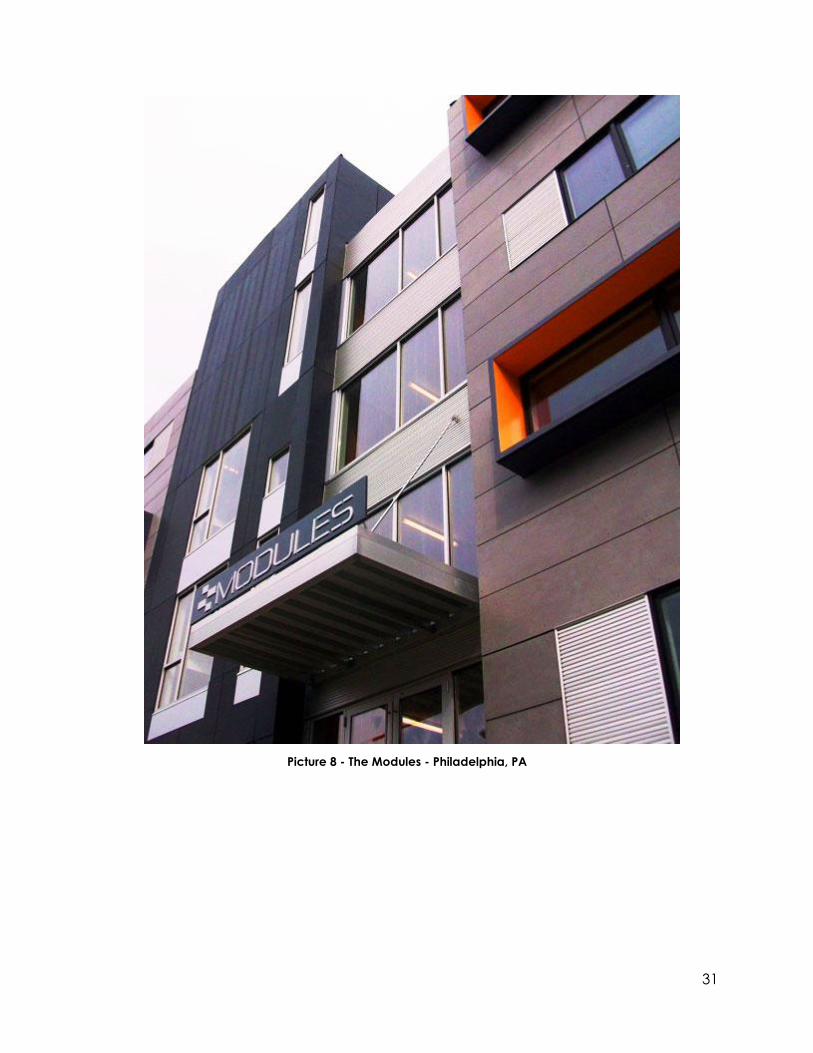
materials and has exterior expressions well beyond a flat plane. Similarly, in
Picture 9 the town center project in Beaver Creek, OH exhibits architecturally
variety in this modular project with varying roof lines, window openings and
exterior materials.
31
Picture 8 - The Modules - Philadelphia, PA
32
Picture 9 Exterior Elevation - Beaver Creek, OH
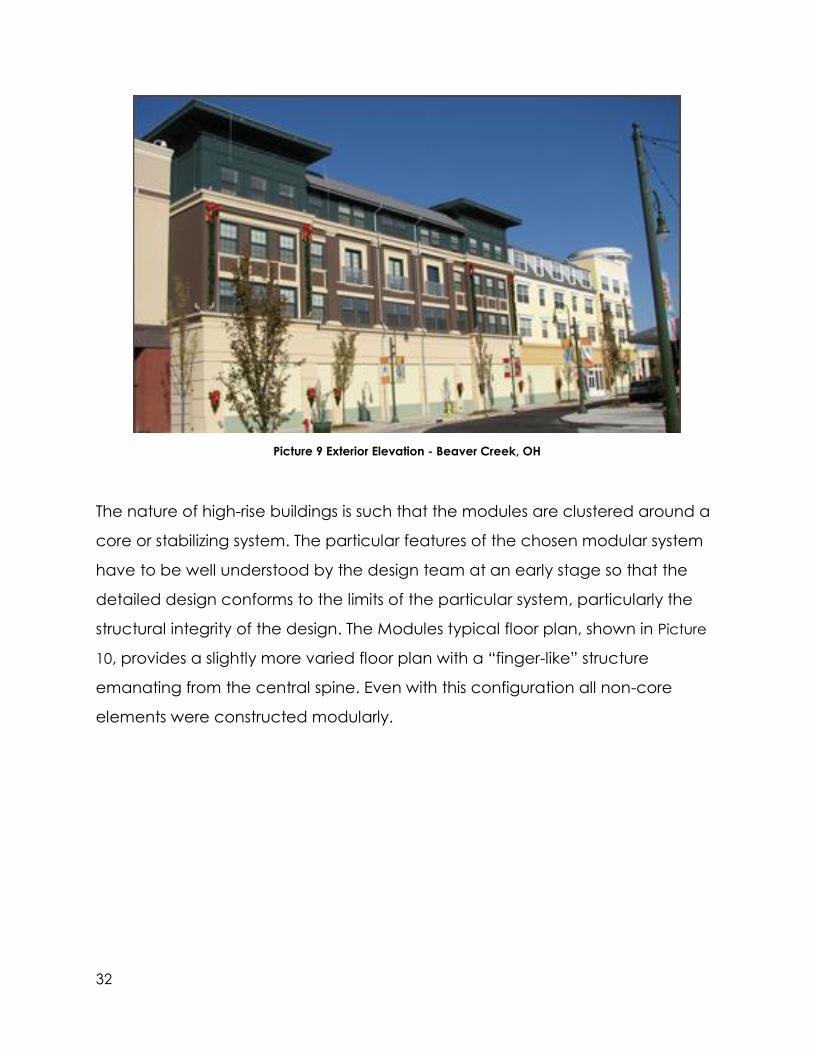
The nature of high-rise buildings is such that the modules are clustered around a
core or stabilizing system. The particular features of the chosen modular system
have to be well understood by the design team at an early stage so that the
detailed design conforms to the limits of the particular system, particularly the
structural integrity of the design. The Modules typical floor plan, shown in Picture
10, provides a slightly more varied floor plan with a “finger-like” structure
emanating from the central spine. Even with this configuration all non-core
elements were constructed modularly.
33
Picture 10 - The Modules - Floor Plan
The design of high-rise modular buildings is strongly influenced by structural, fire
and services requirements. From a building layout viewpoint, two generic floor
plans may be considered for the spatial relationship of the modules around a
stabilizing concrete core:
A generally square configuration where the corridor surrounds the central
core on all sides and units are access off the corridor or a traditionally single
loaded, central corridor.
A generally rectilinear configuration where the corridor extends in opposite
directions from the core and units are access on either side of the corridor or
a traditionally double-loaded corridor.
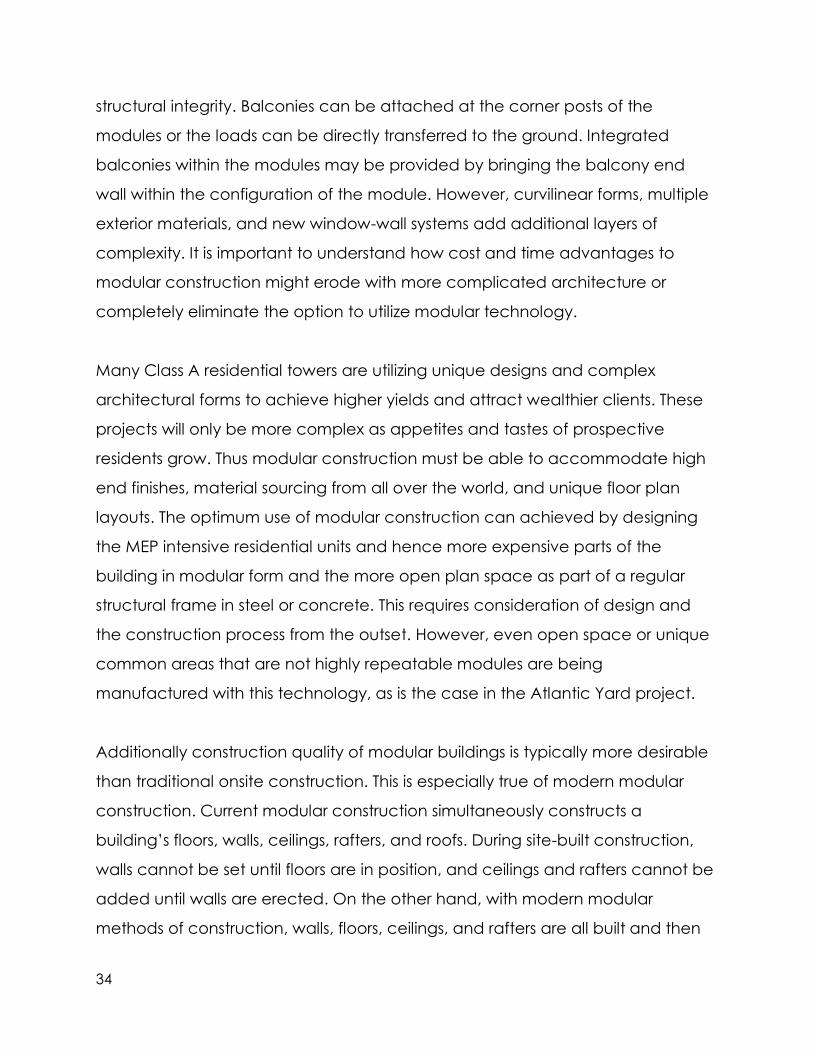
The addition of external balconies, cantilevers or other architectural features
can be used to create a layer of architectural interest, while still maintaining
34
structural integrity. Balconies can be attached at the corner posts of the
modules or the loads can be directly transferred to the ground. Integrated
balconies within the modules may be provided by bringing the balcony end
wall within the configuration of the module. However, curvilinear forms, multiple
exterior materials, and new window-wall systems add additional layers of
complexity. It is important to understand how cost and time advantages to
modular construction might erode with more complicated architecture or
completely eliminate the option to utilize modular technology.
Many Class A residential towers are utilizing unique designs and complex
architectural forms to achieve higher yields and attract wealthier clients. These
projects will only be more complex as appetites and tastes of prospective
residents grow. Thus modular construction must be able to accommodate high
end finishes, material sourcing from all over the world, and unique floor plan
layouts. The optimum use of modular construction can achieved by designing
the MEP intensive residential units and hence more expensive parts of the
building in modular form and the more open plan space as part of a regular
structural frame in steel or concrete. This requires consideration of design and
the construction process from the outset. However, even open space or unique
common areas that are not highly repeatable modules are being
manufactured with this technology, as is the case in the Atlantic Yard project.
Additionally construction quality of modular buildings is typically more desirable
than traditional onsite construction. This is especially true of modern modular
construction. Current modular construction simultaneously constructs a
building’s floors, walls, ceilings, rafters, and roofs. During site-built construction,
walls cannot be set until floors are in position, and ceilings and rafters cannot be
added until walls are erected. On the other hand, with modern modular
methods of construction, walls, floors, ceilings, and rafters are all built and then
35
brought together in the same factory to form a building. Additionally most
modular buildings are built from the inside-out with exteriors being attached last.
Two layers of plasterboard or gypsum board are then attached to the internal
face of the wall by screws at not more than 1’ apart. Cement particle board
(CPB) or oriented strand board (OSB) are often attached to the exterior of the
walls of the modules. In production, boards may be fixed via air driven nails or
screws enhanced by glued joints. These boards restrain the C sections against
buckling. This process provides numerous construction advantages that are not
physically possible in standard construction. (Lawson R. M., 2011)
1) Tighter Building Envelope –screws are used to connect modules, ceilings to
floors and walls to walls instead of nails. This advantage may have
substantially decreased as most high-quality projects no longer use nails;
however, the tolerances of the connections between the walls, ceiling and
floor are still minimized in modular.
2) Better Insulation - constructing building envelope last allows even small
interior cavities to be accessible and well insulated
3) Moisture Control – minimizing environmental factors during construction
allows wood and other natural materials to behave at normal tolerances and
reduce settling in the field
In spite of these advantages the modular industry in the United States suffers
from an image and perception problem related to its foundations in
manufactured housing the poor quality associated with it from 1950s. However,
modular condominium projects do not appear to suffer from a discount to
market and in fact may have a slight benefit amongst well informed purchasers.
VII. Structural Considerations
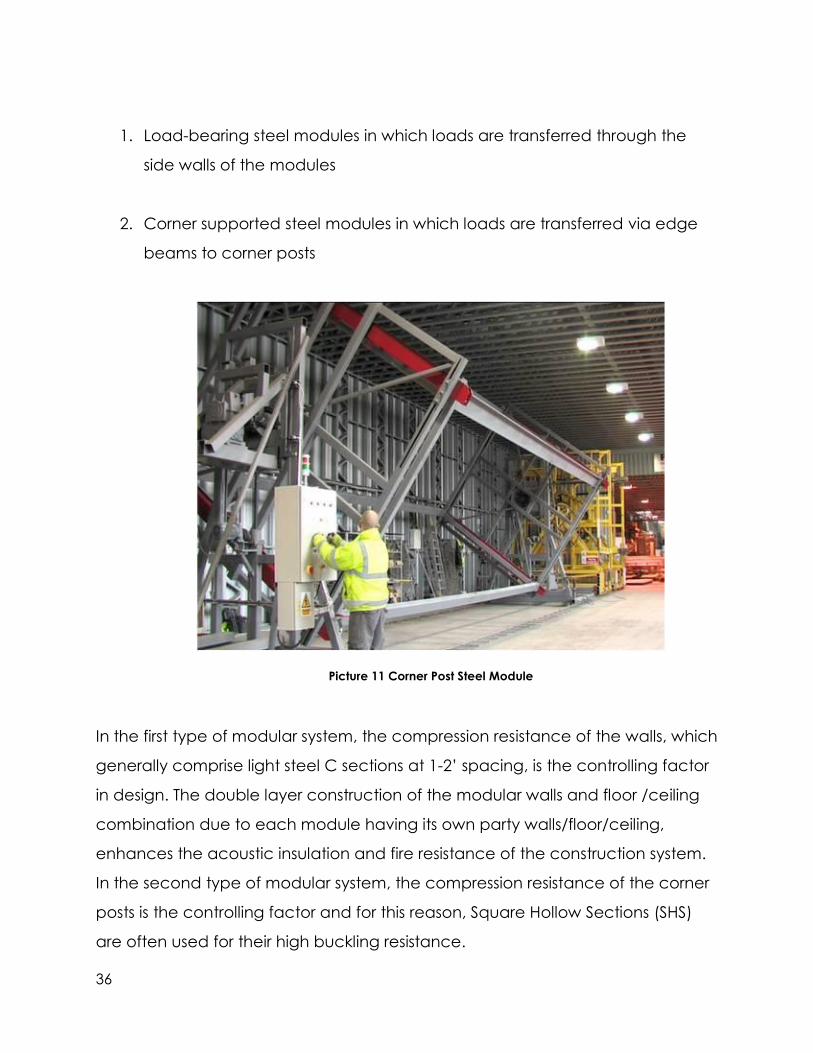
There are two basic types of modular construction that are applicable to high
rise applications and affect the building forms that can be designed:
36
1. Load-bearing steel modules in which loads are transferred through the
side walls of the modules
2. Corner supported steel modules in which loads are transferred via edge
beams to corner posts
Picture 11 Corner Post Steel Module
In the first type of modular system, the compression resistance of the walls, which
generally comprise light steel C sections at 1-2’ spacing, is the controlling factor
in design. The double layer construction of the modular walls and floor /ceiling
combination due to each module having its own party walls/floor/ceiling,
enhances the acoustic insulation and fire resistance of the construction system.
In the second type of modular system, the compression resistance of the corner
posts is the controlling factor and for this reason, Square Hollow Sections (SHS)
are often used for their high buckling resistance.
37
Resistance to horizontal forces, such as wind loads and other actions, become
increasingly important with the height of the building. The strategies employed
to ensure adequate stability of modular assemblies, as a function of the building
height, are:
Diaphragm action of boards or bracing within the walls of the modules –
suitable for 4 to 6 story buildings
Separate braced structure using hot rolled steel members located in the
lifts and stair area or in the end gables – suitable for 6 to10 stories
Reinforced concrete or steel core – suitable for taller buildings
Lateral bracing elements integrated into the building core to care load to
the core and structural columns near the perimeter of the building
Modules are tied at their corners so that structurally they act together to transfer
wind loads and to provide for alternative load paths in the event of one module
being severely damaged. For taller buildings, questions of compression
resistance and overall stability require a deeper understanding of the behavior
of the light steel C sections in load-bearing walls and of the robust performance
of the inter-connection between the modules.
For modules with load-bearing walls, the side walls of the modules should align
vertically through the building, although openings of up to 8’ width can be
created in the side walls, depending on the loading. For modules with corner
posts, the walls are non-load-bearing, but the corner posts must align and be
connected throughout the building height. Additional intermediate posts may
be required in long modules, so that the edge beams which span between the
posts are not excessively deep.
38
The structural behavior of an assembly of modules is complex because of the
influence of the tolerances in the installation procedure, the multiple inter-
connections between the modules, and the way in which forces are transferred
to the stabilizing elements, such as vertical bracing or core walls.
In most building codes utilized in the US, 2 hour fire rating and sprinklers are
required for Type II (high rise) residential buildings. The fire resistance of modular
construction derives from four important aspects of performance.
The stability of the light steel walls is a function of the load applied to the
walls and the fire protection of the internal face of the walls of the module.
The load capacity of the module floor is influenced by the thermal shielding
effect of the ceiling of the module beneath.
The elimination of fire spread by fire barriers placed between the modules (to
prevent smoke or fire spread in the cavity between the modules)
The limiting of heat transfer through the double leaf wall and floor-ceiling
construction of the modules.
Generally, the internal face of the walls and ceiling of the module are provided
with two 0.6” plasterboard layers (at least one layer being fire resistant
plasterboard using vermiculite and glass fiber). Mineral wool is placed between
the C-sections (also required for acoustic purposes). The floor and ceiling in
combination and the load-bearing light steel walls can achieve 2 hour fire
resistance, depending on the type of sheathing board used on the outside of
the modules. The double layer walls and floor-ceiling of the modules also
provides excellent resistance to airborne and impact sound particularly when
supplemented by external sheathing board. Additional sound reductions and
floor stiffness to minimize vibrations can be achieved by a thin concrete floor
39
either placed on the light steel floor or as a composite slab spanning between
the walls or edge beams.
Modules in tall buildings can be clustered around a core, or alternatively, they
can be connected to a braced corridor, which transfers wind loading to the
core. The design of the load-bearing walls or corner posts should take into
account the effects of eccentricities due to manufacturing and installation
tolerances. The various case studies of modular buildings show the different floor
plan that can be created depending on the type of modular system. Modules
with corner posts provide more flexibility in room layouts but are more costly in
manufacture than the wholly light steel load–bearing systems. (Lawson R. M.,
2011)
VIII. MEP Considerations
Mechanical, electrical and plumbing considerations must be addressed early
and consistently throughout the design and construction process. Installing MEP
in the modules provides advantages beyond simply installing conduits in the
module and installing MEP onsite. Additionally, multiple mechanical systems can
be installed included individual and central plants. With central systems the
plant is typically an onsite item and only the ducting and distribution system is
installed in the module with module-to-core connections made on site. Any
number of distribution systems including single duct, double duct, VAV, plenums
and raised floor systems are possible. Even more advanced systems with floor by
floor controlled air handler units or sustainable technologies such as chilled
beams could be implemented, but have not been utilized in most projects.
Similarly individual fan coil and heat pump units have been successfully utilized,
but no studies have determined optimum mechanical systems for modular
construction. However, highly sustainable systems have been utilized in
40
institutional modular projects such as schools and barracks. These have included
higher efficiency HVAC systems, reduced solar gain windows, and water
reclamation systems.
Similarly, electrical and plumbing systems can be configured to almost any
specifications. Although the capability and the physical possibility of these
systems are viable, most projects have not utilized cutting edge MEP systems.
However, since the modules are typically more setup for distribution of MEP and
the generation and central systems are in the building core, MEP will not
typically drive or limit the viability of modular construction.
IX. Sustainability Considerations
Architectural, engineering and construction choices are the decisions that
comprise how a project is designed and constructed. Material selection,
construction techniques, building systems selection, installation and controls and
most other decisions that pertain to building envelope, mechanical, electrical
and plumbing systems and space conditioning are in this category. Modular
building offers significant opportunities for environmental stewardship, economic
opportunity, LEED certification and market penetration in this area. Material
handling, optimal construction conditions and environmental control during
construction all can contribute to attaining LEED credits. It is extremely
challenging to identify specific LEED criteria or points that favor modular
construction, since each project will be different and the extent of modular
construction and other decisions will change the certification level. However,
what is clear is that the market desire for LEED approved and sustainable
buildings will only benefit the further adoption of modular construction. (Kobet,
2009)
41
Modular construction provides several opportunities to improve the sustainability
of the project during the construction process and maintain superior operating
performance within the completed building.
Construction waste is substantially reduced from 10 to 15% in a traditional
building site to less than 5% in a factory environment. It is estimated that
modular construction can achieve the highest level of waste reduction
relative to both traditional construction and any other modern construction
techniques, such as panelized or pre-fabricated pods. (AMA Research, 2007)
The majority of waste in traditional construction projects is generated from
the concreting process and the related wet trades, which constitutes over
80% of construction waste. Concrete waste is generated mainly from both
the direct work, steel from the cutting of reinforcement bars, surplus or spilled
concrete, etc. Rework, the need to replace, remove or extend work
previously considered completed also results in construction waste. One way
of reducing construction waste is by precasting or creating repeatable forms
in the factory. (Baldwin, 2009)
With steel modular units, the wall and roof frames are typically constructed
using the stud and track method of connection, whereby sections are joined
together using self-drill/tap fasteners, bolts and rivets. Consequently, at the
end of life, these should be easy to disassemble. The floor and ceiling joists
have service conduits in the form of holes that allow for the running of cables
and pipework, which are easily removed. With the façade and roof covering
elements, the façade panels and insulation boards are all connected using a
system of brackets, rails and self-drill/tap fasteners. As no mortar, is used,
disassembly of these components should be straightforward. The steel
components are all highly recyclable and are metal facade materials such
as aluminum, and zinc and also brick slips, timber and slates. (AMA Research,
2007)
42
Acoustic and insulation benefits of a modular building are largely due to
additional materials used in the construction. Several manufacturers estimate
that anywhere from 10-25% more structural materials are used in a modular
home. So, while fewer natural resources are “wasted” during the modular
construction process, more are being consumed to create the same square
footage of livable area. The net usage of total building materials in a
modular project is only slightly less than that utilized by a conventional onsite
project, but more materials are used to the benefit of the building than
wasted and result in landfill.
The number of visits to site by delivery vehicles is reduced by up to 70%. The
bulk of the transport activity is moved to the factory where each delivery
provides more material in bulk than is usually delivered to a construction site.
Noise and disruption are reduced on site, further diminished by the 30 to 50%
reduction in the construction period, which means that neighboring buildings
are not affected as much during a traditional building process.
The air-tightness and the thermal performance of the building fabric can be
much higher than is usually achieved on site due to the tighter tolerances of
joints that can be achieved in a factory environment which reduces the
need for higher utility expenditure.
The efficient use of lightweight materials and the reduced waste means that
embodied energy of the construction materials is also reduced.
Safety on site and in the factory is greatly improved and it is estimated that
reportable accidents are reduced by over 80% relative to site intensive
construction. The modules can be installed with pre-attached protective
barriers or in some cases, a protective ‘cage’ is provided as part of the lifting
system. (Lawson R. M., 2011)
Theft is also greatly reduced as most finishes and expensive exterior elements
are set in the factory and tied to the module.
43
X. Legal Considerations
Modular manufacturers and early adopters of this technology do not consider
there to be any limitations in this technology due to the building codes used in
the US. Most states require that the modular manufacturers have an approved
quality-assurance program and that it be monitored by an accredited, third-
party agency. These third-party agencies make inspections on both the modular
builder's plant and the building under construction. Where a third-party agency
is not a local requirement, building department officials and/or certifying
engineers typically assume the same inspection role. (Hardiman, Dispelling the
Myths of Modular Construction, 2008) Any building code issues can be
effectively addressed in the design process and the building code itself
prescribes design guidelines and tolerances, not construction techniques.
Additionally, the modular process presents both opportunities and challenging
for the developer during the entitlement process. The construction advantages
specifically the reduced environmental impact, traffic, noise and construction
time will likely engender substantial support amongst the community and
adjoining neighbors, all else equal. Additionally, the reduced construction
timeline will yield quicker property tax revenue streams and quicker
development fees. There is also speculation that more affordable construction
techniques could yield lower rents and sale prices as derivative advantage to
the community. (Kastenbaum, 2011) However, the likely reduction in
construction jobs in a modular project versus traditional project will likely draw
criticism with labor supporters particular unions. An argument can be made that
adopt of modular construction will lead to further US manufacturing jobs,
minimize offshoring and supporting a renewed construction industry that could
become a global leader and exporter of modular technology.
44
Unico Properties, a developer based in Seattle tested this strategy and utilized
the benefits of modular construction to gain not only city approvals, but also
gain public support for an environmentally friendly project. The company
commission two modular units of 480 and 675 sq. ft. with complete finishes. The
projects were well received by the building inspector who reviewed the entire
manufacturing process. (Cassidy, 2008)
XI. Schedule Considerations
One of the greatest benefits is the ability to dramatically reduce the time
needed for construction. Factory efficiencies allow building components to be
completed quickly and without weather delays. The factory has all of the key
players onsite to handle multiple building requirements and multiple
subcontractors are not always required. This makes modular construction
suitable for owners who need buildings quickly, properties with hard dates for
occupancy, and areas where seasonal weather restricts or even halts
construction. (Morton, 2011) Additionally, modular construction allows horizontal
construction on the factory floor rather than vertical construction in high rise
buildings onsite, thus saving additional time for all trades to move throughout the
building.
Although modular construction that integrates MEP into the module allows the
manufacturer to employ multiple trades and provide near finished modules to
the site, both the manufacturer and onsite contractor must coordinate
schedules and module installation. Delays and lack of schedule coordinate
either onsite or in the factory could mitigate much of the time and cost savings.
Additionally the access to cranes and the timely arrival of modules to efficiently
utilize the crane is important in maintaining the schedule. An idle crane or too
many modules onsite could change the financial dynamics of the project.
45
Typically the modular manufacturer is responsible for delivery and assembly of
the modules. MEP connections can be the responsibility of the general
contractor or the modular manufacturer depending the project scope. It is
important to know the liability of the manufacturer during and after installation
of the module. These schedule coordinates are further complicated by the
inability of the general contractor to control the manufacturer, but some
projects have resolved this conflict by requiring the general contractor to
subcontract the manufacturer and thus eliminating any conflicts of interest and
keeping complete control at the general contractor level.
Additionally, in standard residential construction it is important to maintain a
predictable, moderate and steady stream of unit deliveries through the
construction process. Most major markets that can financial support high rise
construction can absorb 25-40 residential rental units per month per project
under typical market conditions. This delivery equates to delivering certificates
of occupancy for 1-2 floors per month. It is important to consider the cost of
delivering 100 units per month versus the lease up cost of 100 vacant units over
2-4 months. Smoothing unit delivery will be important to many developers. To
that end modular construction can deliver entire buildings in weeks, as opposed
to months, so most developers who utilize modular technology choose not to
occupy any part of the building until construction is complete. This will result in a
loss of a few weeks of potential leasing or occupancy, but could be offset by a
few additional months of time savings when the project is completed with no
construction activity on site and much easier opportunity to solicit potential
property income. These competing costs and advantages will be further
discussed in the financial analysis, but will vary for each project.
46
XII. Financial Considerations
Modular construction takes most of the production away from the construction
site, and essentially the slow unproductive site activities are replaced by more
efficient faster factory processes. However, the infrastructure for factory
production requires greater investment in fixed manufacturing facilities, and
repeatability of output to achieve economy of scale in production.
An economic model for modular construction must take into account the
following factors:
Production volume (economy of scale).
Proportion of on-site construction (in relation to the total build cost)
Transport and installation costs
Benefits in speed of installation versus limited change order opportunities
Savings in site infrastructure and construction management
Materials use and wastage are reduced and productivity is increased, but
conversely, the fixed costs of the manufacturing facility can be as high as 20% of
the total built cost. Even in a highly modular project, a significant proportion of
additional work is done on-site. Limited data is available on multifamily modular
construction, but some guidance can be provided may be taken from a UK
government report on modular home construction. This report estimates that the
proportion of on-site work is approximately 30% of cost for a fully modular
building, and can be broken down into foundations (4%), general services (7%),
exterior finishes (13%) and interior finishes(6%). However, in many modular
projects, the proportion of on-site work can be as high as 55%, as was the case
in the Victoria Hall Wolverhampton case study. Modular construction also saves
on commissioning and change order costs that can be as high as 2% in
traditional construction. (Lawson R. M., 2011)
47
The previously verified financial benefits of improved construction timing are:
Reduced interest carry charges
Earlier inception of rental income.
The tangible benefits due to reduced interest carry can be 2 to 3% over the
shorter building cycle. The UK report estimates that the total financial savings
when using modular construction are as high as 5.5%. However, the scalability of
single family homes is limited and commensurately so are the savings. (Lawson
R. M., 2011) Additionally, all trades and consultants on the project are also likely
to be in support of modular construction if the reduce project time also equates
to a quicker release of fees upon project completion. This will also lead to a
reduced carry cost on general conditions for the overall project and reduced
opportunity for cost overruns due to weather related delays.
Perhaps more important than any quantifiable difference between modular
and traditional construction costs is the value in an accelerated construction
schedule relative to market changes. With a quicker delivery time the developer
reduces the risk of market changes and can more efficiently meet just in time
market demand. This is more applicable in low rise garden and detached home
construction, but the general principle applies to high rise projects also.
A. Financing
The current equity and debt communities are making themselves aware of
modular construction and are beginning to explore the opportunity, but they
are in the early stages of their learning curve. Of the lenders that were
interviewed, none believe there is an inherent challenge to modular
construction that would like the sources of funding, but all continue to explore
48
ways of mitigating risk in this new technology and industry. Lenders will provide
terms based on the quality of the sponsor and project, but may not substantially
change financial underwriting terms if modular construction is utilized. However,
they may consider additional contingencies and projections in the form of
reserves and guarantees until they are more comfortable with the technology.
In particular, the lenders are concerned about completion guarantees if a
modular manufacturer becomes financially troubled. With only 3-4 companies
capable of high rise modular construction, the lending community is concerned
about project completion if the manufacturer is insolvent. Some solutions maybe
building a contingency fund, that can be drawn down as the project nears
completion, to address any potential disruptions in the factory and need to
change fabricators. Additionally, a lender may require additional interest
reserves or other considerations to satisfy their uncertainty from the sponsor and
a Letter of Credit or other credit enhancements form the modular manufacturer.
These requirements will likely atrophy as modular becomes more accepted
within the lending community. This is decidedly a first mover disadvantage.
Issues may arise when a manufacturer wants payment upon delivery but prior to
the modules being set but the lender or the developer resists. A manufacturer
typically would want payment at this time to avoid the conversion from personal
property to real property that occurs as soon as the module is set as this can
add a significant amount of additional legal complications to a manufacturer’s
recourse if there are payment disputes. A lender typically wants the module set
first so that their disbursement to the developer goes towards real property that
they could perfect a lien on. Its possible to find a solution to this problem by
splitting payments up or holding a sufficient retainage to ensure the set goes
smoothly.
49
B. Labor Markets
International Trade – Firms specializing in modular construction have not gained
hold in the US as only 1% of all commercial construction employs this method.
Other markets around the world have been early adopters of this technology,
but their adoption rate is only 2-3% of their construction activity. Industry experts
believe this technology will grow 20-25% annually. (Modular Building Institute,
2011) However, certain countries and industries have been more apt to adopt
this technology and have long seeded histories with similar technology. In
particular Scandinavian countries with their long history of ship building have
employed similar modular designs and fabrication techniques, which
companies such as IKEA and Skanska have applied to real estate. If other
countries have incubators and/or government support to foster this technology
it’s possible that the majority of modular construction could be built overseas
and significantly dislocate the construction industry. Currently the Broad Group
in China has been a leading adopter of this technology and has pushed the
limits of construction by building a 30 story hotel in 15 days and announcing
plans to building the world’s tallest building in a mere 90 days.
Project labor is typically local and supports local economies. A strong modular
construction industry could substantially limit the need for local construction
labor and allow for centralization for the labor force. This will have substantial
impact on local economies and wages. Unions in particular will be reticent to
allow local jobs to be shifted away. Manufacturers must address the likelihood
that developers will need to support union labor to secure entitlements and
zoning approvals. As such, manufacturers may need to consider hiring union
labor as a mechanism to support developer’s interests and thus increase their
operating costs. As noted in the Atlantic Yards project, there is even a steep
difference in wages between onsite construction union workers and
50
manufacturing union workers. The going rate for a union carpenter in NYC is $85
versus $35 for a factory union worker. (Bagli, 2011)
C. Pricing
Based on the guidance provided by various developers, modular manufacturers,
contractors, lenders and others a financial model was developed to parse the various
changes between traditional site built construction and modular construction. A single
development example will be utilized to compare the differences between the
approaches. Based on confidential underwriting, budget and schedule information
provided by an institutional developer on a 20 story Class A+ high rise building in a
major east coast MSA the project costs will be analyzed. The project has 397 units and is
based on a completed project. Some elements of the project have been altered to
maintain confidentiality, but the changes are not material to this analysis. All rents,
returns and costs are considered market rate, but will not be altered between the
scenarios, unless it merits consideration. Each item listed in the following section was
modified individually to determine its sole impact and ultimately all variables between
the two models were altered to provide a comparison between onsite and modular
construction. Lastly, sensitivity analysis of key metrics will be presented to provide ranges
of values.
Baseline Assumptions:
397 Multifamily units with 13% affordable units
Timing
o Land acquisition July 1, 2012
o Construction Start – April 2014
Income/Expense Growth constant at 2%
Land Price - $50,000 per unit or $19,837,5000
Development Fee – 3.0%
Construction
o Guaranteed Maximum Price contract will be executed immediately prior
to construction start. There are multiple options on the type of contract
51
that could be utilized, but these yield operation and risk mitigation
opportunities; however, these will not be considered in this analysis
o Sponsor will maintain a contingency and inflation factor for current
underwriting purposes, since the current hard cost budget is based on an
estimate and not an actual GMP.
Construction Loan – based on strong sponsorship
o 70% LTC
o 3.5% Interest Rate
o Recourse considerations do not impact this analysis
o Construction loan is in place until disposition.
Sponsorship
o Institutional sponsorship with 100% funding from sponsor. This method is
utilized to simplify the understanding of the modular impact. Use of capital
partners should only magnify the impacts.
o Discount Rate – 8.0% - Most sponsors are requiring minimum 7.0% current
yields on core development opportunities
Disposition
o Asset sale 6 months after stabilization, while allows for property marketing
and closing period.
o 5.25% - reversion cap rate. Kept constant throughout analysis
o 0.40% - transaction costs. Given the size of the asset lower cost is market.
Modular Construction
o Utilize modular construction for all residential units, structural, MEP, 85%
interior finishes and 85% exterior finishes.
o Not utilize modular construction for building core, including central plants,
elevators, stairs and common areas.
Measurement
o Project Level – All returns are considered only at the project level, since no
partnership structures were considered.
o Monthly NPV – to accurately measure the opportunity cost of the baseline
return required and additional wealth creation between approaches
52
o Monthly IRR –secondary measure will allow industry practitioners more
familiar return metrics. Monthly was utilized since the development
timeline is substantially shorter than most stabilized project holds and one
month changes cannot be accurately reflected in annual returns.
Variables Considered
1. Percentage of building using modular technology – if there are advantages
to modular construction the savings are substantially magnified with a
greater level of modular utilization. A base high rise building would need to at
minimum use structural and MEP in the adoption of modular construction.
Additionally, most would strongly recommend completing a high level of
interior finishes within the module and only external finish work would be an
optional element. Alternatively it is also possible to achieve savings with a
relatively low level of interior/exterior finish work if the project supports a very
high number of modules. For example, a 150 unit high rise modular building
with all possible interior/exterior finishes could yield a similar per unit savings as
a 400 unit building with almost no finish work. However, a 400 unit building
with a high level of modular adoption would achieve substantial savings
since both the size of the project and level of modular adopt is high. It is
extremely difficult to apply a simple formula for how much savings could be
achieved with either more units or more modular adoption. (Manufacturer,
2012)
Based on multiple interviews with manufacturers, it is very challenging to
manipulate this variable and achieve definable quantitative results. Each
project is unique and bidding construction costs on multiple hypothetical
scenarios can lead to gross over simplifications. As such we have chosen to
utilize an appropriately higher level of offsite construction in this model. But
recognize the advantages of both economies of scale and higher modular
adoption.
53
2. Project Timing – modular construction offers timing savings on multiple fronts,
but each element produces different results. Each time savings element was
modeled by minimizing only the construction time and changing no other
variable. The financial savings typically will flow from reduced interest carry
and quicker completion. Since most modular buildings cannot be occupied
until construction is complete, initial occupancy will not change based on
time savings and thus the benefits of quicker construction is offset by higher
operating expenses as lease up cannot be started until after project
completion, which is an effective loss of 6-8 months of construction period
lease up. In this section we have chosen to only address the temporal savings
and will address material and labor savings in other sections.
a. Fast Tracking - The overall advantage results from fast tracking module
construction while site work is occurring. However, not all of this fast
tracking savings can be attributed to modular technology. There are
other fast tracking methods such as “up-down” construction that also
yield time savings. A project of this scope with 3.5 floors of underground
parking could yield 4-6 month savings by fast tracking alone. Thus these
savings could be attributed to any fast track system and is not unique
to modular construction.
b. Climate Controlled Construction – There can be numerous delays
related to the weather on a site built project. These can cause the site
be shut down, certain trades to stop their work or cause delivery
delays. Although these delays can exist most projects are able to
compensate by forces subcontractors to work more aggressive hours
to get back on schedule. Some of these potential delays are also built
into schedules. In factory construction there are never any weather
related delays and schedules also reflect that time savings. These
savings could be magnified in jobsites that have extreme weather
54
conditions, such as inclement coast areas or very hot climates. Given
this project scope offsite construction will result in at most 1 month of
savings.
c. Assembly of pre-cut and manufactured parts versus field assembly –
The opportunity to install a kit of parts, as opposed to field
measurement and installation does save time by taking some of the
guesswork out for the installers, minimizing errors and re-construction.
These savings at the factory will also yield 1 month in savings, but also
minimize risk by reducing opportunity for critical errors that impact
multiple trades and material sourcing.
d. Sequencing of trades is minimized by utilizing MEP integrated modules
– Factory construction allows modules to roll from one trade’s station to
the next and thus eliminates the need for any trade to wait for the
previous trade to complete their work in the building and minimizes
downtime. However, if a bottleneck occurs in the assembly line this
can eliminate those savings. This can be a savings of 1-2 months.
e. Reduced down time due to assembly line installation versus constant
movement of trades to each installation site in a purely onsite project –
This is the second component of downtime, especially on a high rise
project. Factory construction eliminates the need for every worker to
go up the elevator to their construction area and then move to the
next area. This is a task that is repeated multiple times a day by every
worker on every business day. Each minute or hour that is spent getting
to/from an area also eliminates opportunity for actually completing a
task. Of the time savings this is the single largest component and could
be a 3-4 month savings.
Total time savings of modular utilization can yield between 10-12 months on a
project of this nature. The time savings estimated is a conservative estimate
55
based on discussion with developers and manufacturers utilizing this
technology; however, it is possible the time savings could be up to 14 months
given optimum crane, setting and factory conditions. An 11 month time
savings result in $309,000 in NPV value and 108 bps in IRR value. The increase
in NPV and IRR results from reducing the project timing by almost 1 year or
20%, but the lease up period is lengthened and thus only reduces the time to
stabilization by 4 months. The effective project time savings is thus only 4
months. The project cost increases by $790,000. The cost increase is due
almost exclusively to a $2,144,000 operating deficit increase during the lease
up period. This is mostly offset by $847,000 in interest carry savings and
another $333,000 in capitalized expense savings during construction and
$211,000 reduced builder’s risk premium due to a shorter construction period.
The far more dramatic savings would result if both the construction period
and 1st unit occupancy could be reduced by 11 months.
3. Hard Cost and Other Project Costs – Beyond time savings there are other
financial impacts related to modular construction. These variables are
addressed individually prior to any modification for time savings.
a. Increased interest or contingency reserve to address lender
underwriting concerns related to modular uncertainty. This maybe
irrelevant as the lending community becomes more comfortable with
modular; however, in this model this was addressed by assuming an
increase in builder’s risk insurance by almost 50% and increase
financing costs from 4.05% to 4.55% to loan cost. This resulted in a -33%
IRR and -$729,000 NPV loss.
b. Materials cost of modules vs. standard onsite construction – Based on
costing estimates of the economics of scale that could be achieve on
a project of this magnitude its anticipated that concrete, steel, exterior
cladding and finish work could yield 2% in materials cost savings and
56
thus provide $2,589,000 in hard cost savings, but this would likely be
offset by at least a $250,000 increase in soft cost, as additional design
and consulting services might be necessary in a modular project for a
first-time adopter.
c. Reduced labor cost – Beyond material savings more savings are
attributable to labor savings due to 1) the cheaper manufacturing
wage rate, 2) increased labor efficiency of off-site construction, 3)
non-union offsite labor (not all manufacturers have this savings), 4)
cheaper overall labor markets for manufacturers and 5) improved job
safety. This yields an additional $3,900,000 in hard cost savings.
d. Storage costs – The need to store raw materials on site versus carry cost
of finished modules at manufacturer’s facility. Given the substantial
variability of material procurement and contract buyouts it was very
challenging to estimate these costs. Payment terms for both offsite and
onsite subcontractors will vary greatly from project to project and it is
likely that costs are more related to risk management and have less
financial impact, given the size of the project.
e. Reduced capital expenditures related to modules. Developers and
lenders did not believe there was a material advantage to modular
construction in being able to reduce capital reserves or
repairs/maintenance for the project. Although there are likely
operational and long-term capital benefits the technology does not
have enough history or data to support lower reserves and lenders
would likely not allow any change in that expense.
f. Reduced contingency carry by forcing module manufacturers to
buyout the contract. Although this is also a risk mitigation item there is
an opportunity for a developer to substantially reduce their pricing
exposure, since most modular manufacturers procure their materials at
the outset of fabrication. Thus nearly all trades can be bought out early
57
in the process. Thus a conservative developer could reduce their
contingency from 4% to 2.5% as construction documents are near
completion.
g. Does project scale impact cost savings (300 vs. 3,000 units) – This was
partially addressed in Item 1, but there is strong support from the
modular manufacturing industry to support 10-20% cost savings as
projects sizes approach 2,000+. There is evidence to suggest such
savings based on stick-built modular projects for government entities,
but there is no large scale high rise modular project for comparison.
The Atlantic Yards project claims to have 20% cost savings, but it is
unclear how these savings are achieved and this is merely an ex-ante
claim.
h. Can dedicated manufacturers owned by general contractor or
developer ramp up and effectively achieve economies of scale that
inure to the project versus separate modular manufacturer. Given the
relative youth of the modern modular industry, it is difficult to determine
any advantage that may arise from supply chain management of
integrating the manufacturer with either the general contractor or the
developer. However, some contractors believe there maybe an
opportunity to acquire modular companies if the demand for modular
construction grows.
The resulting savings from hard cost and related items yields approximately $5,351,000 in
NPV value and 212 bps in IRR. The value creation mostly results from project savings of
$7,479,000 or 4.75% which is almost entirely from hard cost savings. In total all changes
result in $5,879,000 in NPV value creation and an increase in 348 bps IRR monthly return.
The project cost has also similarly decreased by $6,809,000 or 4.33% in savings.
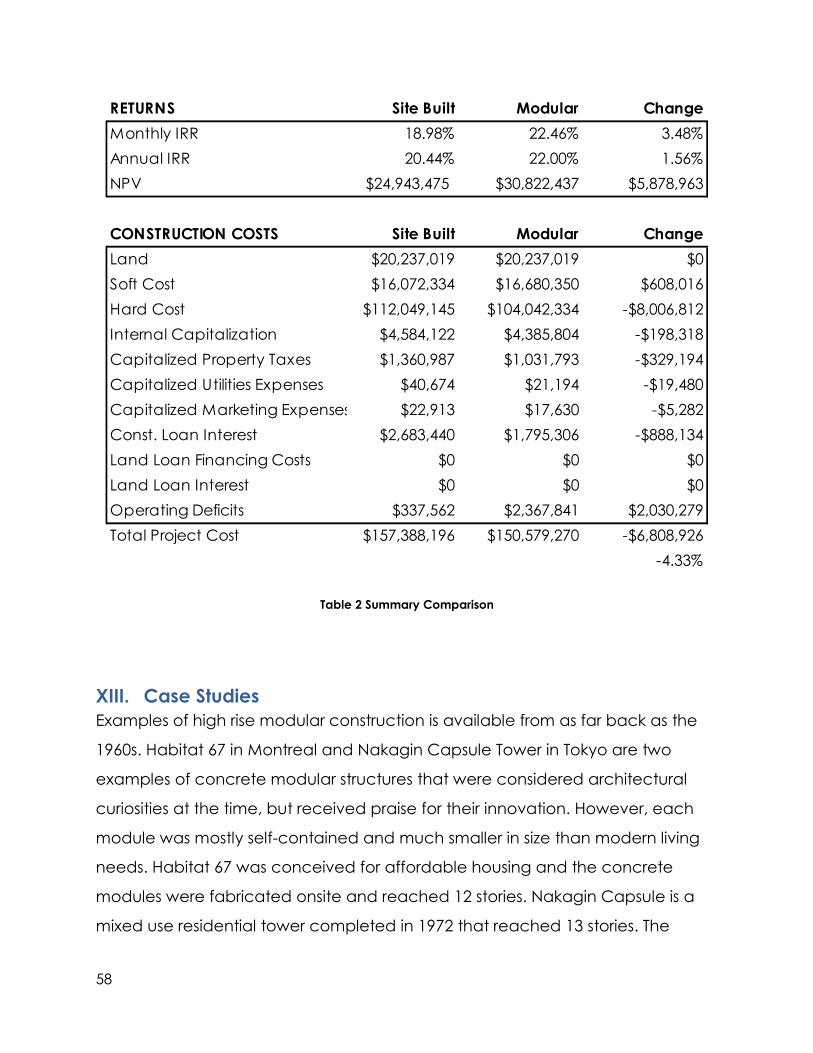
58
Table 2 Summary Comparison
XIII. Case Studies
Examples of high rise modular construction is available from as far back as the
1960s. Habitat 67 in Montreal and Nakagin Capsule Tower in Tokyo are two
examples of concrete modular structures that were considered architectural
curiosities at the time, but received praise for their innovation. However, each
module was mostly self-contained and much smaller in size than modern living
needs. Habitat 67 was conceived for affordable housing and the concrete
modules were fabricated onsite and reached 12 stories. Nakagin Capsule is a
mixed use residential tower completed in 1972 that reached 13 stories. The
RETURNS Site Built Modular Change
Monthly IRR 18.98% 22.46% 3.48%
Annual IRR 20.44% 22.00% 1.56%
NPV $24,943,475 $30,822,437 $5,878,963
CONSTRUCTION COSTS Site Built Modular Change
Land $20,237,019 $20,237,019 $0
Soft Cost $16,072,334 $16,680,350 $608,016
Hard Cost $112,049,145 $104,042,334 -$8,006,812
Internal Capitalization $4,584,122 $4,385,804 -$198,318
Capitalized Property Taxes $1,360,987 $1,031,793 -$329,194
Capitalized Utilities Expenses $40,674 $21,194 -$19,480
Capitalized Marketing Expenses $22,913 $17,630 -$5,282
Const. Loan Interest $2,683,440 $1,795,306 -$888,134
Land Loan Financing Costs $0 $0 $0
Land Loan Interest $0 $0 $0
Operating Deficits $337,562 $2,367,841 $2,030,279
Total Project Cost $157,388,196 $150,579,270 -$6,808,926
-4.33%
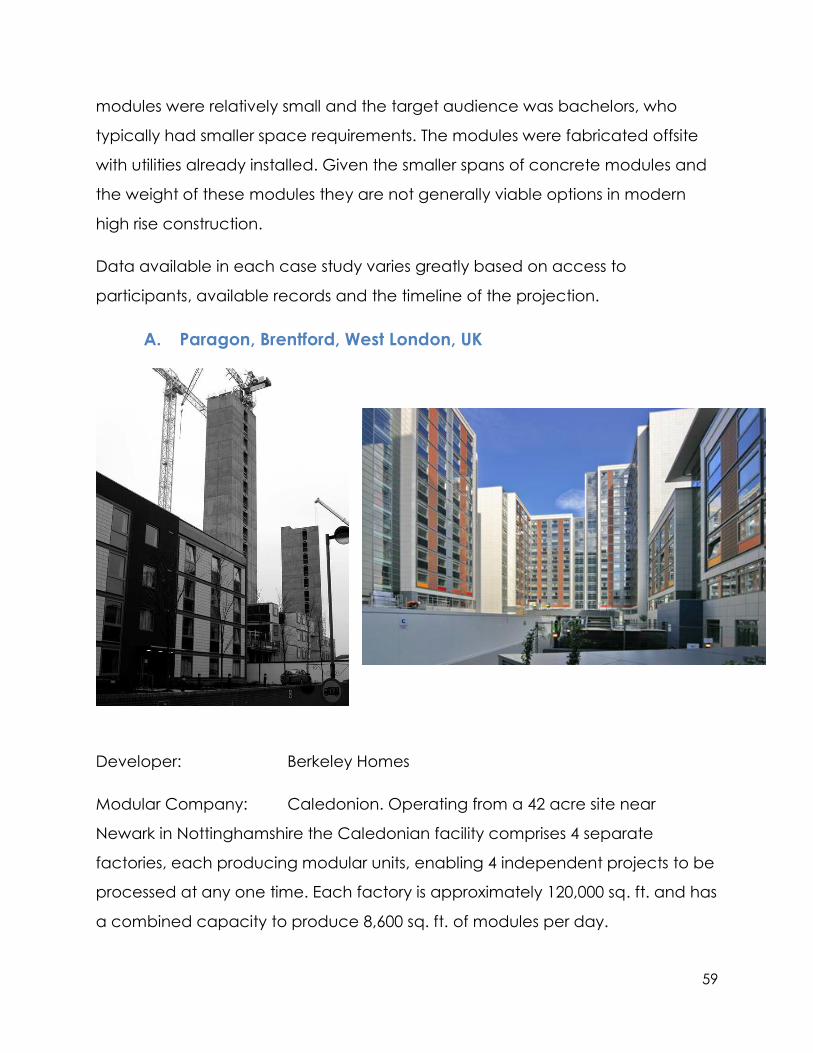
59
modules were relatively small and the target audience was bachelors, who
typically had smaller space requirements. The modules were fabricated offsite
with utilities already installed. Given the smaller spans of concrete modules and
the weight of these modules they are not generally viable options in modern
high rise construction.
Data available in each case study varies greatly based on access to
participants, available records and the timeline of the projection.
A. Paragon, Brentford, West London, UK
Developer: Berkeley Homes
Modular Company: Caledonion. Operating from a 42 acre site near
Newark in Nottinghamshire the Caledonian facility comprises 4 separate
factories, each producing modular units, enabling 4 independent projects to be
processed at any one time. Each factory is approximately 120,000 sq. ft. and has
a combined capacity to produce 8,600 sq. ft. of modules per day.
60
Contractor: Caledonion. Operated as the modular manufacturer
and general contractor.
Architect: Carey Jones
Key Dates: 22 months to completion
Financials: £26,000,000 (Pounds – UK) Hard Cost
Height: 17 stories
Berkeley First and Thames Valley University partnered through a Nominations
Agreement to develop 839 bed dormitory for students attending the university.
In addition to this the project also includes 221 unit worker and shared ownership
homes and 129,000 sq. ft. of academic facilities for the university. This inner city
project for Berkeley First, a division of Berkeley Homes, incorporates a mix of
student, key worker and affordable one and two bedroom condominium units.
The 5 housing blocks, incorporate 1060 accommodation units, and range from 4
stories to 8, to 11 and culminate at 18 stories. At the time the project was the
tallest modular building in the world. The project was awarded Major Housing
Project of the Year (UK) 2007.
From on site construction start, the entire development took 22 months to
complete –12 months less than what would have been required for traditional
construction. The benefits of early occupation and revenue generation
produced financial benefits to the developer and university.
The modular component is built over a concrete podium which provides below
grade parking and slip formed or poured-in-place concrete core included
elements such as the stairs and elevator shafts. All of the accommodation
spaces are fully modular, with rooms completed with finished windows, doors,
finishes, fixtures and M&E fit out – final M&E connections, FF&E and carpeting
were the only trades required on site to complete the construction.

61
The buildings from 11 to 17 stories were constructed using modules with load-
bearing corner posts. The floor plan of the L shaped building is shown in Fig. 1.
The modules were also manufactured with integrated corridors in which half of
the corridor was included in each module. The corner columns were therefore
in-board of the ends of the modules and the projection of the floor into the
corridor was achieved by the stiff edge beams of the modules. In the corridor
arrangement, horizontal loads are transferred via in-plane bracing in the
corridors and are again connected to the core. The distance of the outer
module from the core was limited by the shear force that could be transferred
via the corridor or by the travel distance for life safety. This phase of the project
consisted of a total of 827 modules in the form of 600 student rooms, 114 studios ,
44 one- bedroom and 63 two-bedroom key worker apartments. The 17 storey
building consists of 413 modules. Modules are 9 ft to 13.5 ft wide, which is the
maximum for highway transport in the UK. The edge beams were 8 in x 3.5 in
Parallel Flange Channels (PFC) at floor level and 5.5 in x 2.7 in PFC at ceiling
level in order to design the modules with partially open-sides of up to 20 ft span.
The one or two bedroom apartments were constructed using 2 or 3 modules,
each 375 to 590 sq. ft. The plan view shows the many variations in room layouts
that were possible using corner supported modules. (Lawson R. M., 2011)
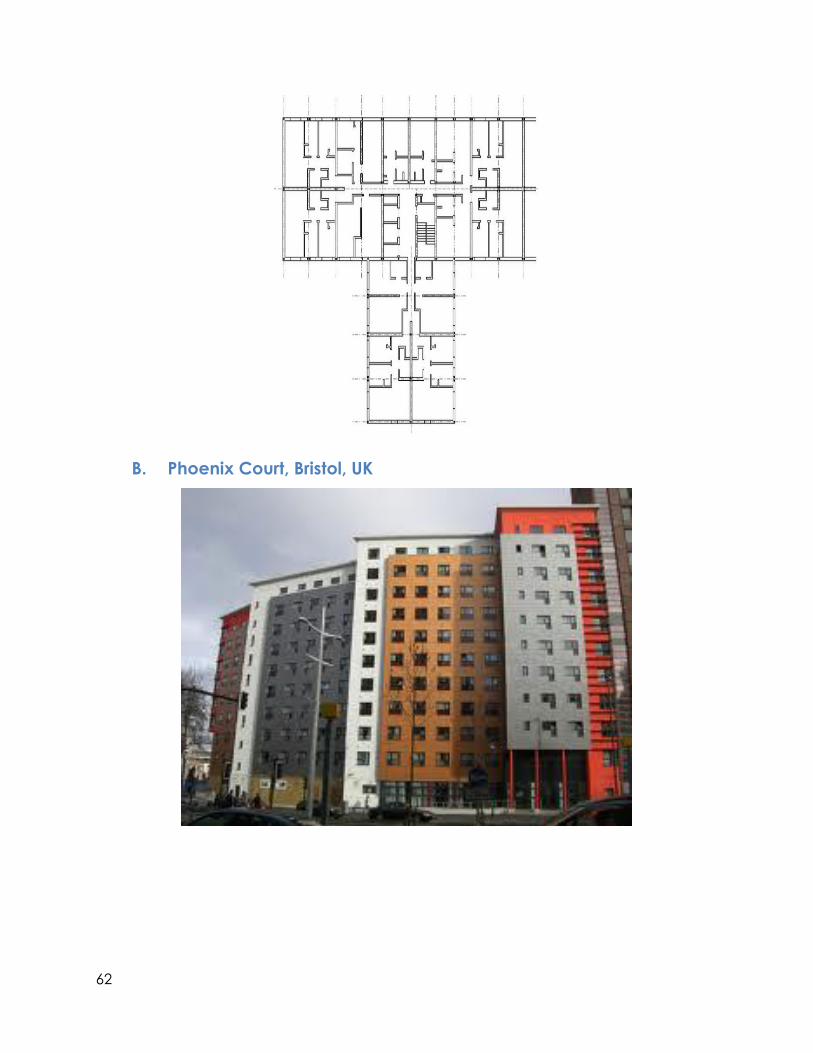
62
B. Phoenix Court, Bristol, UK
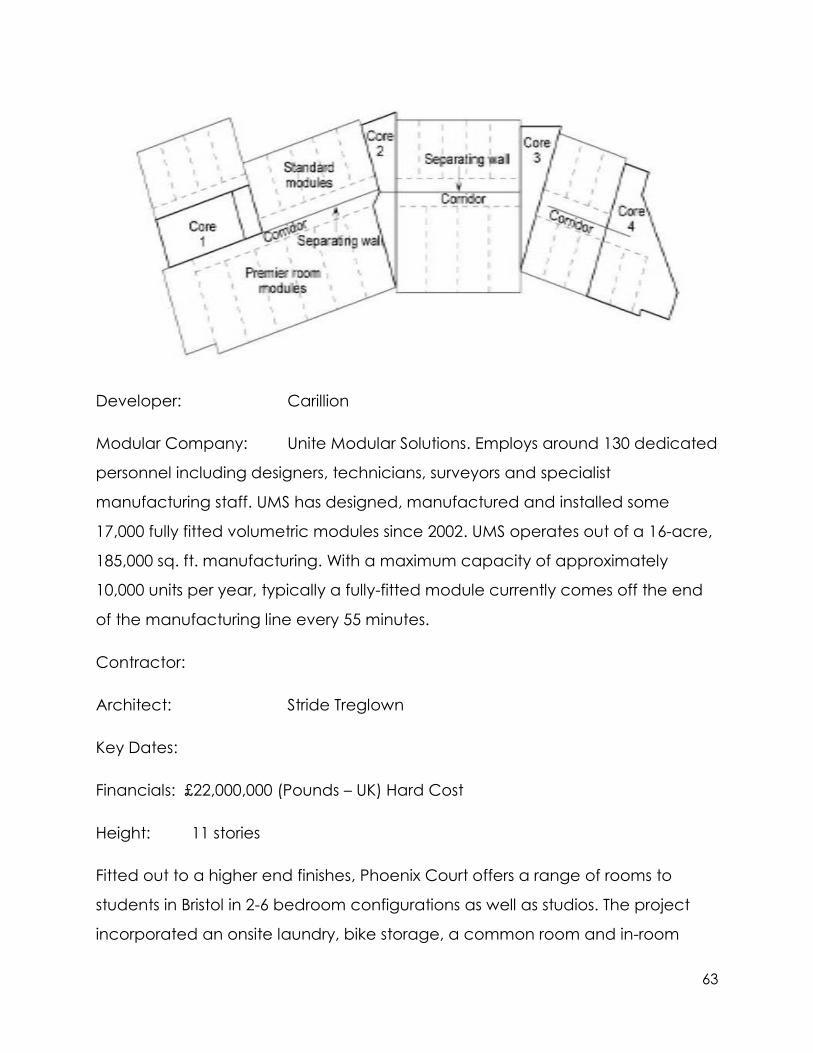
63
Developer: Carillion
Modular Company: Unite Modular Solutions. Employs around 130 dedicated
personnel including designers, technicians, surveyors and specialist
manufacturing staff. UMS has designed, manufactured and installed some
17,000 fully fitted volumetric modules since 2002. UMS operates out of a 16-acre,
185,000 sq. ft. manufacturing. With a maximum capacity of approximately
10,000 units per year, typically a fully-fitted module currently comes off the end
of the manufacturing line every 55 minutes.
Contractor:
Architect: Stride Treglown
Key Dates:
Financials: £22,000,000 (Pounds – UK) Hard Cost
Height: 11 stories
Fitted out to a higher end finishes, Phoenix Court offers a range of rooms to
students in Bristol in 2-6 bedroom configurations as well as studios. The project
incorporated an onsite laundry, bike storage, a common room and in-room
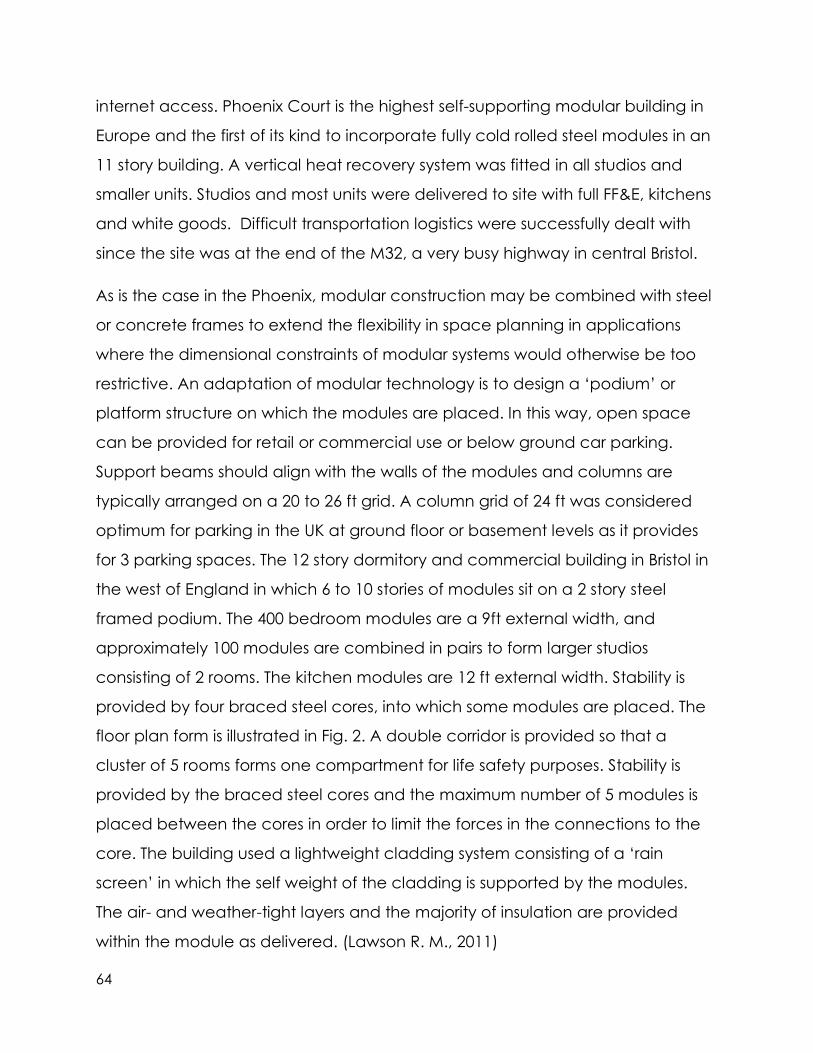
64
internet access. Phoenix Court is the highest self-supporting modular building in
Europe and the first of its kind to incorporate fully cold rolled steel modules in an
11 story building. A vertical heat recovery system was fitted in all studios and
smaller units. Studios and most units were delivered to site with full FF&E, kitchens
and white goods. Difficult transportation logistics were successfully dealt with
since the site was at the end of the M32, a very busy highway in central Bristol.
As is the case in the Phoenix, modular construction may be combined with steel
or concrete frames to extend the flexibility in space planning in applications
where the dimensional constraints of modular systems would otherwise be too
restrictive. An adaptation of modular technology is to design a ‘podium’ or
platform structure on which the modules are placed. In this way, open space
can be provided for retail or commercial use or below ground car parking.
Support beams should align with the walls of the modules and columns are
typically arranged on a 20 to 26 ft grid. A column grid of 24 ft was considered
optimum for parking in the UK at ground floor or basement levels as it provides
for 3 parking spaces. The 12 story dormitory and commercial building in Bristol in
the west of England in which 6 to 10 stories of modules sit on a 2 story steel
framed podium. The 400 bedroom modules are a 9ft external width, and
approximately 100 modules are combined in pairs to form larger studios
consisting of 2 rooms. The kitchen modules are 12 ft external width. Stability is
provided by four braced steel cores, into which some modules are placed. The
floor plan form is illustrated in Fig. 2. A double corridor is provided so that a
cluster of 5 rooms forms one compartment for life safety purposes. Stability is
provided by the braced steel cores and the maximum number of 5 modules is
placed between the cores in order to limit the forces in the connections to the
core. The building used a lightweight cladding system consisting of a ‘rain
screen’ in which the self weight of the cladding is supported by the modules.
The air- and weather-tight layers and the majority of insulation are provided
within the module as delivered. (Lawson R. M., 2011)
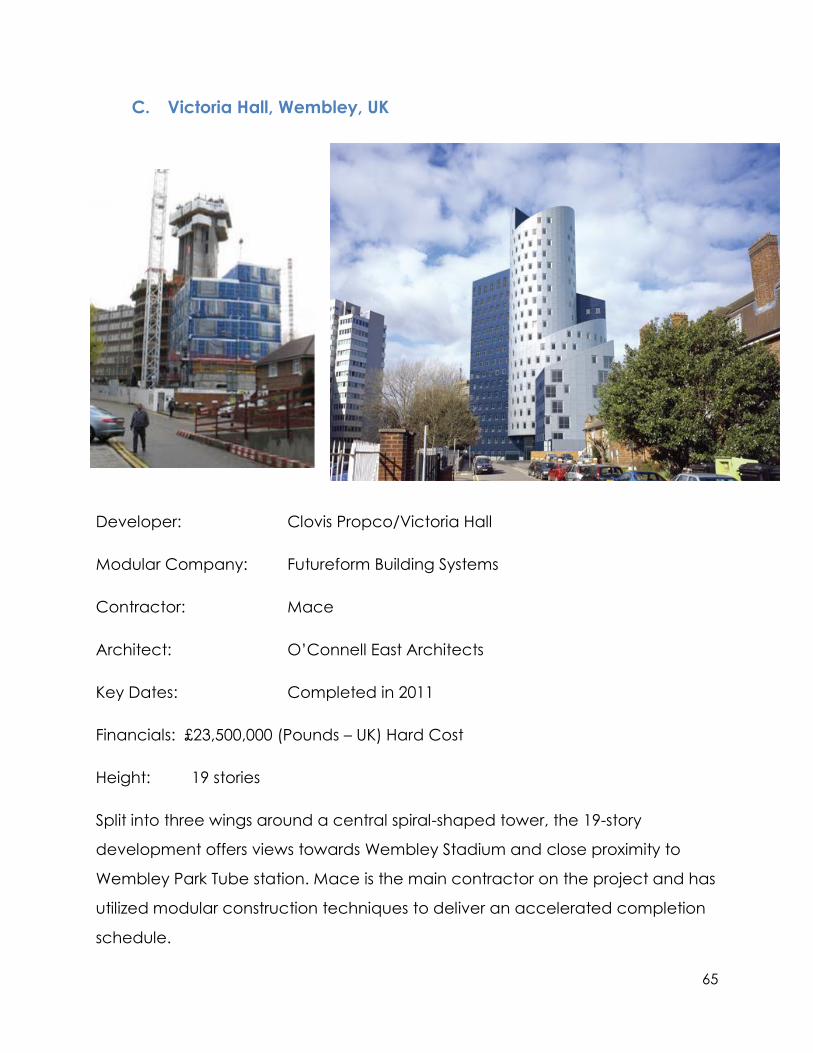
65
C. Victoria Hall, Wembley, UK
Developer: Clovis Propco/Victoria Hall
Modular Company: Futureform Building Systems
Contractor: Mace
Architect: O’Connell East Architects
Key Dates: Completed in 2011
Financials: £23,500,000 (Pounds – UK) Hard Cost
Height: 19 stories
Split into three wings around a central spiral-shaped tower, the 19-story
development offers views towards Wembley Stadium and close proximity to
Wembley Park Tube station. Mace is the main contractor on the project and has
utilized modular construction techniques to deliver an accelerated completion
schedule.
66
The building contains 435 student rooms and features buildings at different
heights to respond to neighboring lower residential and commercial buildings
and nearby amenities. Two of the wings are designed to be partially clad in blue
cladding panels complementing the main cladding in silver. Biomass boilers are
incorporated within a central plant room. Features include a double-height
entrance, a launderette, management offices and extensive bicycle parking.
Two landscaped amenity areas—one for gatherings and one for a quiet
garden—provide ample space for residents to enjoy the outdoors.
This important project, for Victoria Hall, is a student residence consisting of a
concrete core and circular concrete floor plan with north, east and west facing
modular wings radiating from it. The west wing consists of 17 stories of modules,
whilst the north and east wings consist of four and seven stories of modules
respectively, on a single story concrete podium.
This project also is a first in terms of the size of the modules that are
manufactured and installed, which are 52’ long × up to 12.5’ wide. With this size
its possible to achieve two rooms and a twin corridor can be introduced into the
modular concept, which minimizes on-site work. The services can be connected
along the corridors and the modules are delivered with additional finishes to
allow the corridors to be finished after installation. The walls of the module
consist of C section steel frames and top hat sections that created a rigid form,
which enable larger modules to be manufactured and installed. A typical
module weighs up to 12 tons. Lifting was done by a 200 ton mobile crane.
Construction tolerances were extremely tight. A maximum deviation of 5 mm to
the adjoining module was achieved in manufacturing and the module positions
were reset out on each floor to ensure verticality. The modules were tied at their
corners into the concrete core which provided overall stability. In-plane wind
loads were transferred through the connections between the modules. (Steel
Construction Institute, 2011)
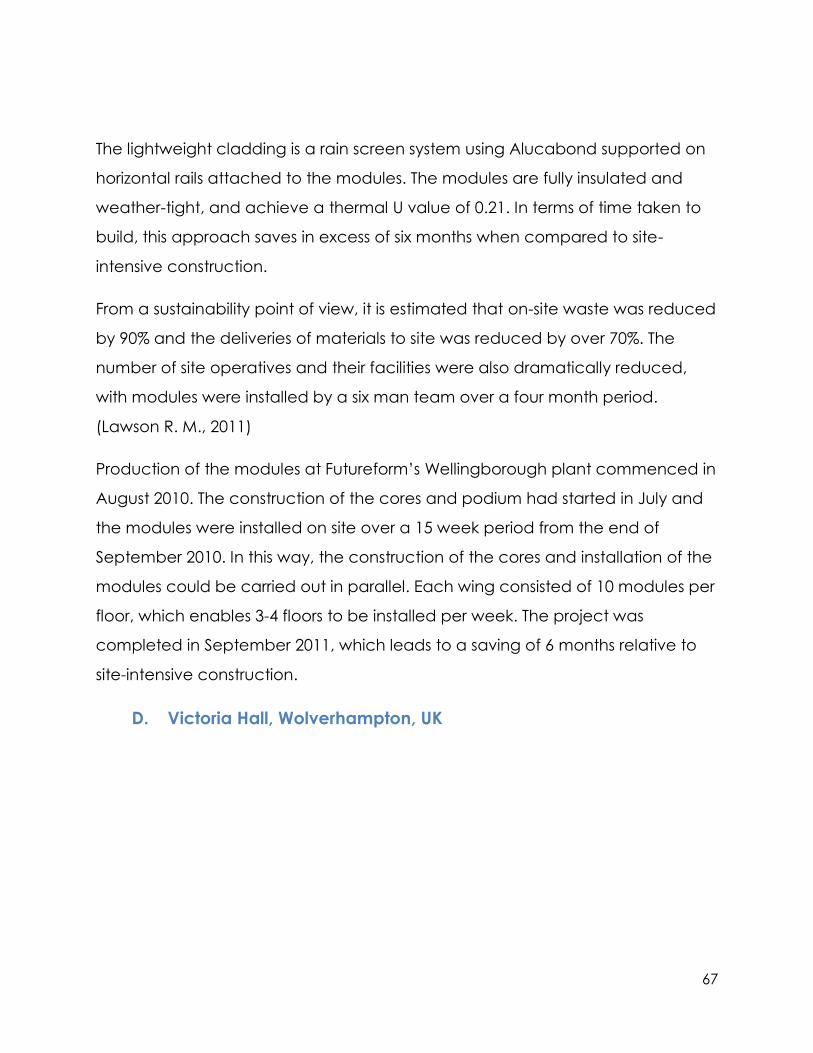
67
The lightweight cladding is a rain screen system using Alucabond supported on
horizontal rails attached to the modules. The modules are fully insulated and
weather-tight, and achieve a thermal U value of 0.21. In terms of time taken to
build, this approach saves in excess of six months when compared to site-
intensive construction.
From a sustainability point of view, it is estimated that on-site waste was reduced
by 90% and the deliveries of materials to site was reduced by over 70%. The
number of site operatives and their facilities were also dramatically reduced,
with modules were installed by a six man team over a four month period.
(Lawson R. M., 2011)
Production of the modules at Futureform’s Wellingborough plant commenced in
August 2010. The construction of the cores and podium had started in July and
the modules were installed on site over a 15 week period from the end of
September 2010. In this way, the construction of the cores and installation of the
modules could be carried out in parallel. Each wing consisted of 10 modules per
floor, which enables 3-4 floors to be installed per week. The project was
completed in September 2011, which leads to a saving of 6 months relative to
site-intensive construction.
D. Victoria Hall, Wolverhampton, UK
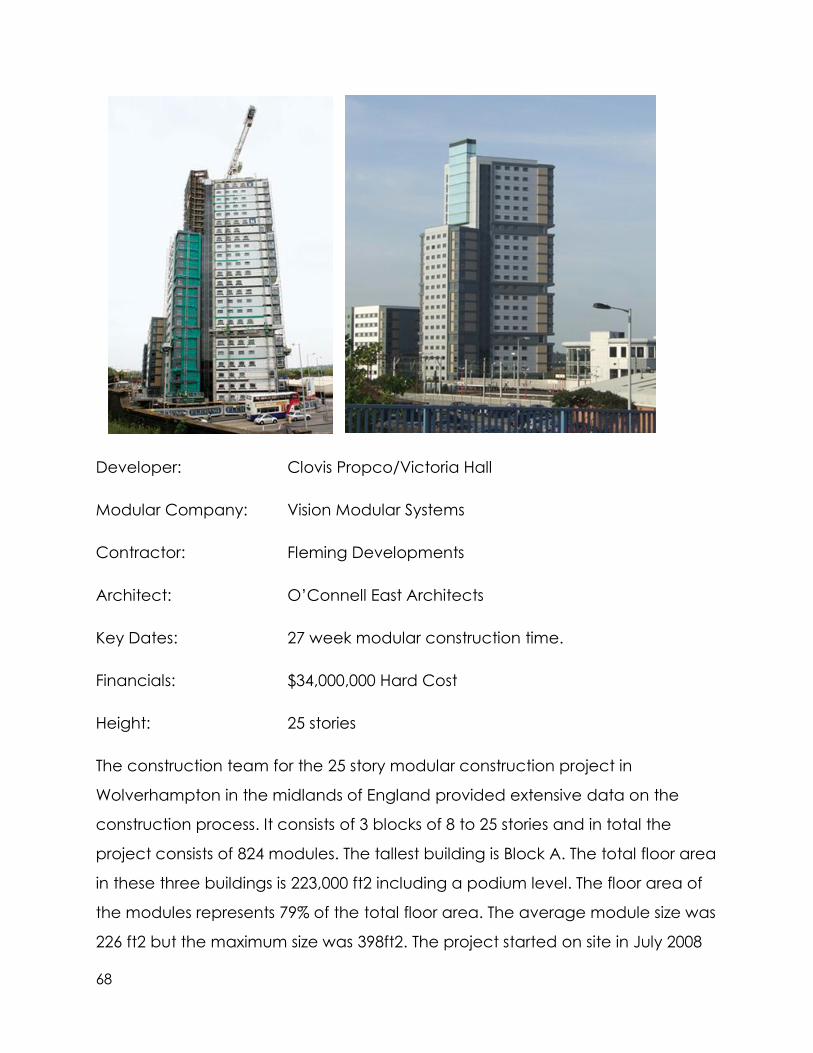
68
Developer: Clovis Propco/Victoria Hall
Modular Company: Vision Modular Systems
Contractor: Fleming Developments
Architect: O’Connell East Architects
Key Dates: 27 week modular construction time.
Financials: $34,000,000 Hard Cost
Height: 25 stories
The construction team for the 25 story modular construction project in
Wolverhampton in the midlands of England provided extensive data on the
construction process. It consists of 3 blocks of 8 to 25 stories and in total the
project consists of 824 modules. The tallest building is Block A. The total floor area
in these three buildings is 223,000 ft2 including a podium level. The floor area of
the modules represents 79% of the total floor area. The average module size was
226 ft2 but the maximum size was 398ft2. The project started on site in July 2008
69
and was handed over to the client in August 2009 (a total of 59 weeks).
Installation of the modules started in October 2008 after completion of the
podium slab, and construction of the concrete core to Block A was carried out
in parallel with the module installation on Blocks C and B. Importantly, the use of
off-site technologies meant that the site activities and storage of materials are
much less than in traditional construction, which was crucial to the planning of
this project. The tallest building, Block A, has various set back levels using
cantilevered modules to reduce its apparent size. Lightweight cladding was
used on all buildings and comprises a mixture of insulated and composite
panels, which are attached directly to the external face of the modules. The
total area of exterior cladding was 112,300 ft2 for the 3 blocks.
The modules were fabricated in Cork, Ireland and were sent via ship to the site.
(Kalette, 2009) The module weights varied from 10 to 25 Tons depending on their
floor size and the module self weight was approximately 120 pounds/ ft2 floor
area. The modules in the first Block C were installed by mobile cane, whereas
the modules in Blocks A and C were installed by the tower crane that was
supported by the concrete core. The installation period for the 824 modules was
32 weeks and the installation team was a total of 8 workers plus 2 site managers.
The average installation rate was 7 modules per day although the rate was as
high as 15 per day. This corresponds to 14.5 man-hours per module in installation.
The overall construction team for the non-modular components varied over the
59 week project from 40 to 110 with 3 to 4 site managers. It was estimated that
the reduction in construction period relative to site-intensive concrete
construction was over 50 weeks (or a saving of 45% in construction period).
It was estimated by the modular supplier that the manufacture and in –house
management effort was equivalent to a productivity of 0.7 man -hours per
square foot module floor area for a 225 ft2 module floor size This does not take
70
into account the design input of the architect and external consultants, which
would probably add about 20% to this total effort.
For modules at the higher levels, approximately 14% of the module weight is in
the steel components and 56% in its concrete floor slab. At the lower levels of
the high-rise block, the steel weight increased to 19% of the module weight. The
steel usage varied from 14 to 24 pounds/ ft2, which is higher than the 10 to 12
pounds/ ft2 generally used in medium-rise modular systems. This is because of
the use of concrete floors in this type of modular system.
The estimated breakdown of man effort with respect to the completed building
was; 36% in manufacturing, 9% in transportation and installation, and 55% in
construction of the rest of the building. The total effort in manufacturing and
constructing the building was approximately 1.5 man-hours per ft2, which
represents an estimated productivity increase of about 80% relative to site-
intensive construction.
Site deliveries were monitored over the construction period. During installation of
the modules, approximately 6 major deliveries per day were made, in addition
to the 6 to 12 modules delivered on average. The concrete core progressed at
a rate of one story every 3 days.
Waste was removed from site at a rate of only 2 skids of 210 cubic ft per week
during the module installation period and 6 skips per week in the later stages of
construction, equivalent to approximately, 3 Tons of general waste, including
waste and packaging. This is equivalent to about 1.8 pounds per ft2. The
manufacturing waste was equivalent to 5.1 pounds/ ft2 of the module area, of
which, 43% of this waste was recycled. For the proportion of module floor area
to total area of 79%, this is equivalent to about 5% of the weight of the overall
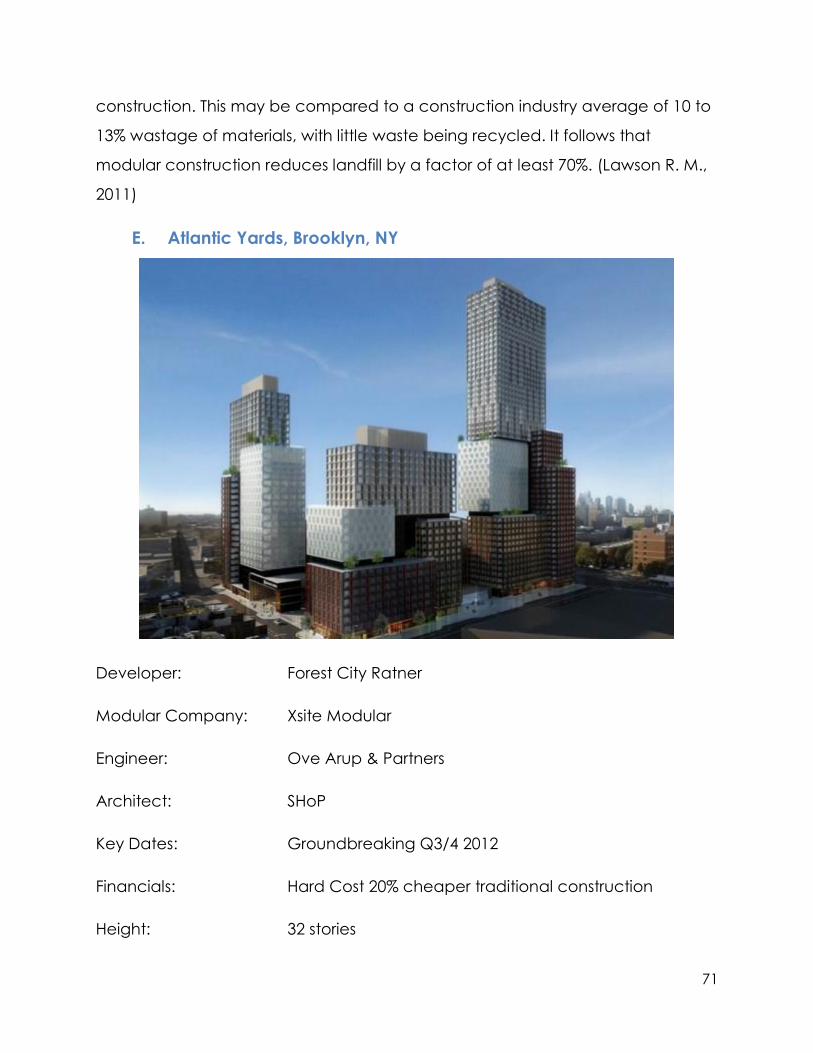
71
construction. This may be compared to a construction industry average of 10 to
13% wastage of materials, with little waste being recycled. It follows that
modular construction reduces landfill by a factor of at least 70%. (Lawson R. M.,
2011)
E. Atlantic Yards, Brooklyn, NY
Developer: Forest City Ratner
Modular Company: Xsite Modular
Engineer: Ove Arup & Partners
Architect: SHoP
Key Dates: Groundbreaking Q3/4 2012
Financials: Hard Cost 20% cheaper traditional construction
Height: 32 stories
72
The $4.9 billion Atlantic Yards project is the redevelopment of 22 acres in
downtown Brooklyn by Forest City Ratner Companies that will include
approximately 6 million square feet of residential space (6,430 units of affordable
and market-rate housing), a state of the art sports and entertainment arena, the
Barclays Center, 247,000 square feet of retail use, approximately 336,000 square
feet of office space and 8 acres of publicly accessible open space. All 6,430
residential units are scheduled to be constructed utilizing modular
manufacturing, which make it the tallest and largest modular project in the
world. The project also includes major transportation improvements, including a
new storage and maintenance facility for the LIRR and a new subway entrance
to the Atlantic Terminal Transit Hub, the third largest hub in the City. The project’s
Master Plan was designed by renowned architect Frank Gehry. The first
residential building is B2 and comprised 363 units in a 32 story tower and will
utilize approximately 930 modules. (New York City Housing Development
Corporation, 2012) The project has been delayed due to economic market
conditions and local politics; however, Forest City must begin construction by
May 2013 or pay $5 million in penalties for every year the project is behind
schedule. (Bagli, 2011)
The modules would be constructed with most interior finishes, mechanical
electrical and exterior finishes completed at the factory. The current module
design utilizes corner post steel construction with lateral bracing. Kitchen and
bathroom subassemblies are then attached to the steel superstructure. Then
MEP and interior/exterior finishes are attached to the module prior to onsite
delivery. Although the building utilizes central cores the height of the building
dictated additional use of steel bracing that allow the modules to attach and
transfer loads downwards without directly attaching to the central core. More
73
detailed information on the project is not available due to Forest City’s desire to
maintain proprietary data in house.
The modular manufacturing would be produced by union labor in New York City
and was pitched to unions and the community as a way to expand
manufacturing export opportunities from NYC. Modular was also touted as
having the potential to introduce union labor into affordable housing
development at scale for the first time in New York City.
Modular buildings built in NYC must meet the NYC Building Code as well as all
fire and life safety codes. The construction is non-combustible and is subject to
the same requirements and provisions as conventional construction.
Manufacturing is six times safer than on-site construction. (HAPREST Research
Project, 2004). Conventional on-site workers are also safer as they are primarily
working within finished, enclosed portions of the building away from the typical
risks of an open construction site. When building a modular project compared to
an equivalently traditionally built project there is reduced energy consumption
of up to 67% (ARUP Research & Development). It is further anticipated that
modular construction could save 20% of construction cost and at least 60% of
the total construction would be done in the factory. (Kastenbaum, 2011) The
financial and schedule savings are higher at Atlantic Yards due to the vast
economies of scale of the 6,430 units.
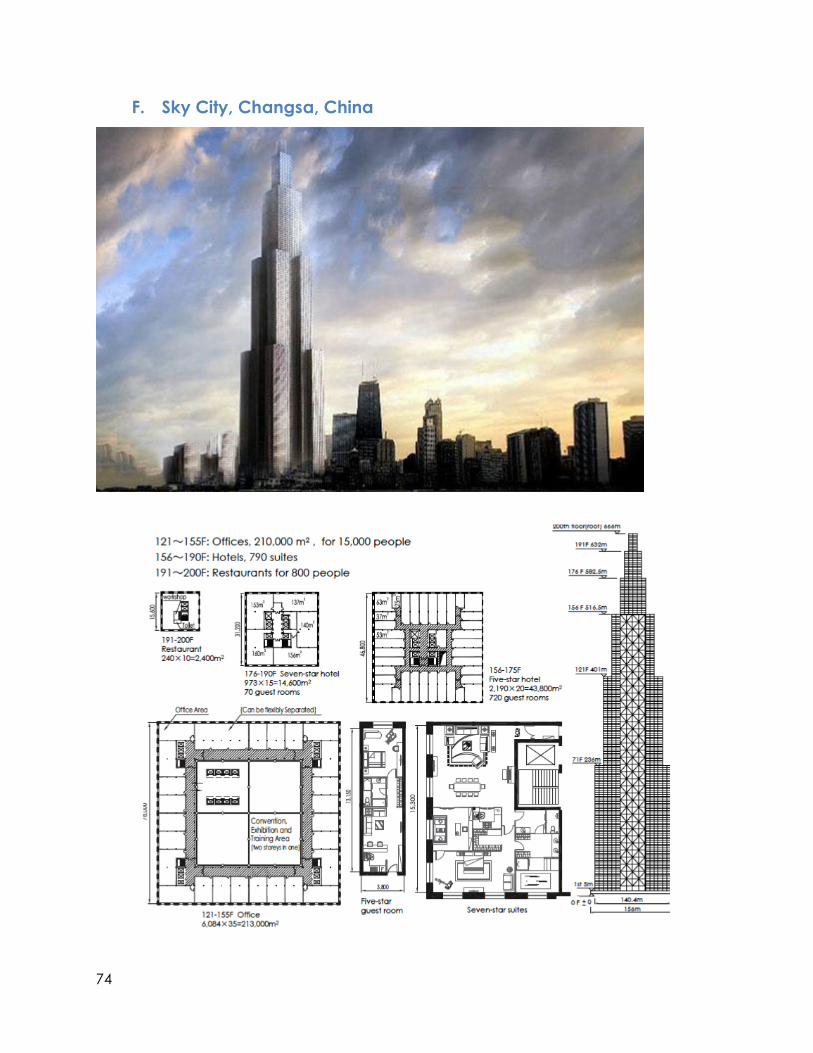
74
F. Sky City, Changsa, China

75
Developer: Broad Group
Modular Company: Broad Sustainable Building (related to Developer)
Architect: Unknown
Key Dates: Groundbreaking November 2012
Financials: $628 Million in Hard Cost
Height: 220 stories
The Broad Group has announced plans to erect the world’s tallest building in 90
days. The building will surpass the Burg Khalifa in height which took 5 years to
complete and was $1.5 billion to construct. Its 220 stories will provide a total of 1
million square meters of usable space, linked by 104 elevators. 95 percent of Sky
City will be completed in the factory before breaking ground on the site. The 220
story building also aims to be as sustainable as possible by using quadruple
glazing and 15 centimeter-thick exterior walls for thermal insulation. It is also
expected to use a fifth of the energy that a regular building requires due to
BSB’s unique construction methods, and will serve as a city unto itself by housing
over 100,000 people. It will feature the world’s tallest hotel, “The J Hotel” and be
linked by 104 elevators.
XIV. Conclusions
The modern modular industry has made great strides in improving its product
and providing benefits that are appealing to owners. The industry continues to
evolve and 5 years ago would never have imagined the possibility of a project
the scope of Atlantic Yards or Sky City. These opportunities and recent successes
have required all developers to at least consider modular technology for their
projects. Additionally, the push for sustainable development and financial
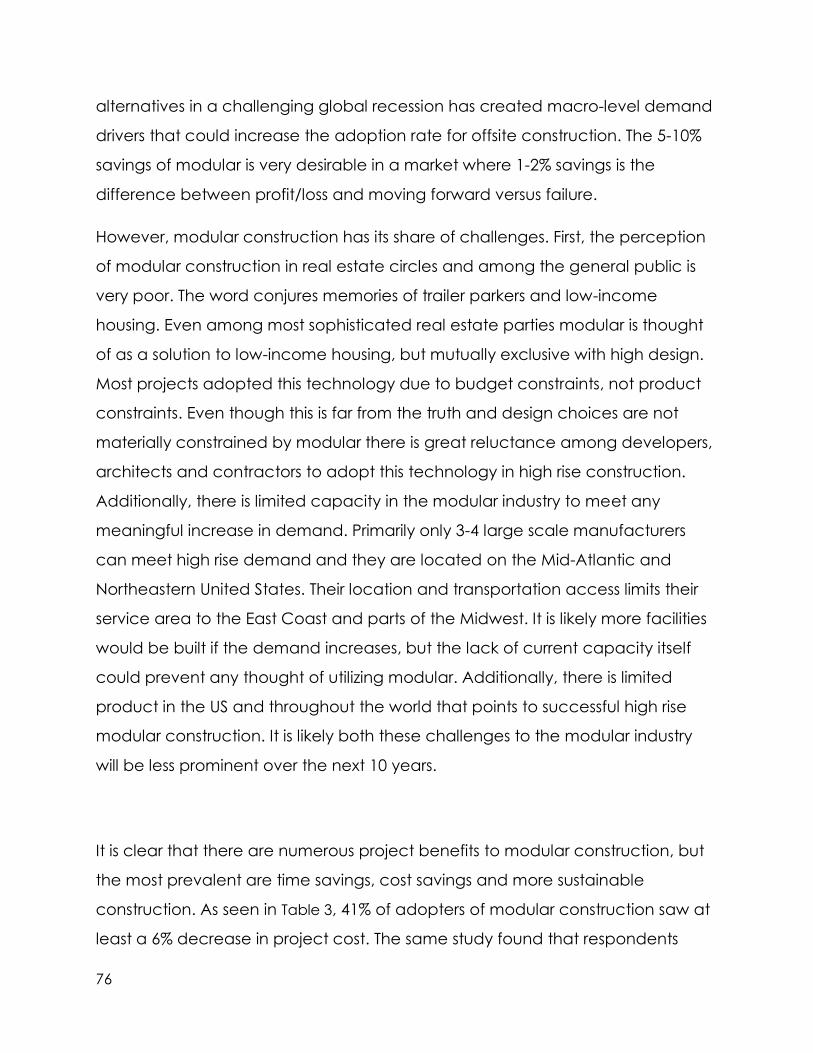
76
alternatives in a challenging global recession has created macro-level demand
drivers that could increase the adoption rate for offsite construction. The 5-10%
savings of modular is very desirable in a market where 1-2% savings is the
difference between profit/loss and moving forward versus failure.
However, modular construction has its share of challenges. First, the perception
of modular construction in real estate circles and among the general public is
very poor. The word conjures memories of trailer parkers and low-income
housing. Even among most sophisticated real estate parties modular is thought
of as a solution to low-income housing, but mutually exclusive with high design.
Most projects adopted this technology due to budget constraints, not product
constraints. Even though this is far from the truth and design choices are not
materially constrained by modular there is great reluctance among developers,
architects and contractors to adopt this technology in high rise construction.
Additionally, there is limited capacity in the modular industry to meet any
meaningful increase in demand. Primarily only 3-4 large scale manufacturers
can meet high rise demand and they are located on the Mid-Atlantic and
Northeastern United States. Their location and transportation access limits their
service area to the East Coast and parts of the Midwest. It is likely more facilities
would be built if the demand increases, but the lack of current capacity itself
could prevent any thought of utilizing modular. Additionally, there is limited
product in the US and throughout the world that points to successful high rise
modular construction. It is likely both these challenges to the modular industry
will be less prominent over the next 10 years.
It is clear that there are numerous project benefits to modular construction, but
the most prevalent are time savings, cost savings and more sustainable
construction. As seen in Table 3, 41% of adopters of modular construction saw at
least a 6% decrease in project cost. The same study found that respondents
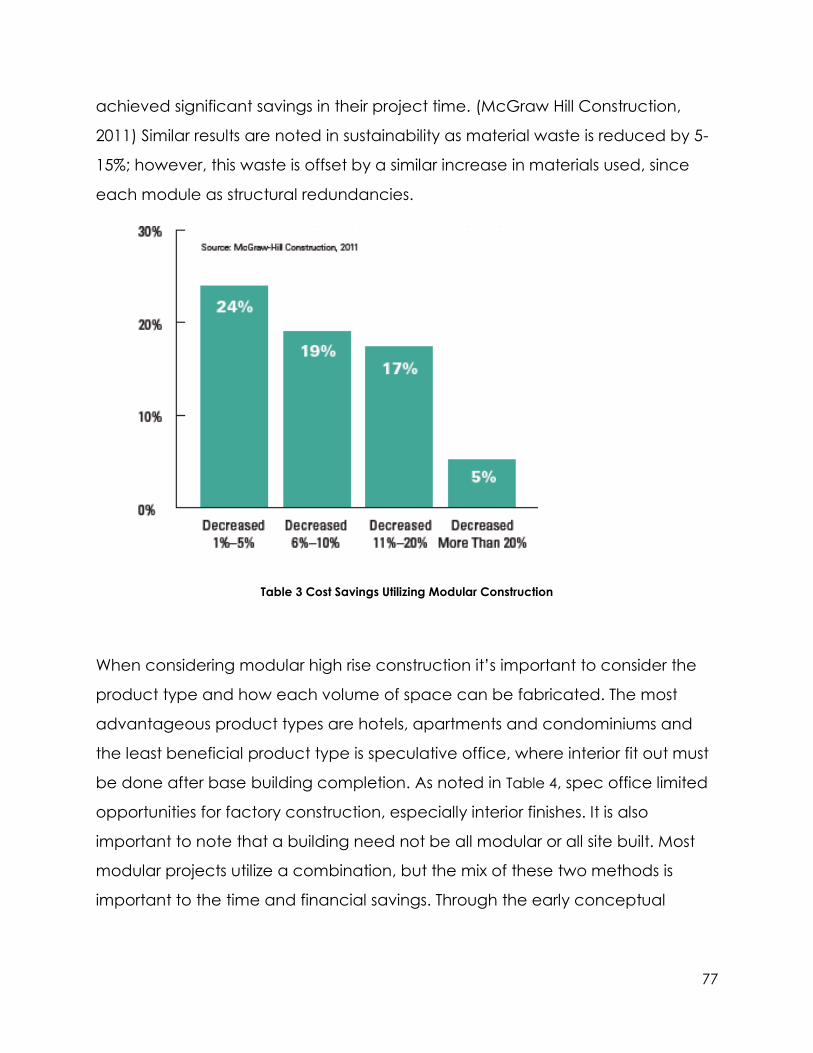
77
achieved significant savings in their project time. (McGraw Hill Construction,
2011) Similar results are noted in sustainability as material waste is reduced by 5-
15%; however, this waste is offset by a similar increase in materials used, since
each module as structural redundancies.
Table 3 Cost Savings Utilizing Modular Construction
When considering modular high rise construction it’s important to consider the
product type and how each volume of space can be fabricated. The most
advantageous product types are hotels, apartments and condominiums and
the least beneficial product type is speculative office, where interior fit out must
be done after base building completion. As noted in Table 4, spec office limited
opportunities for factory construction, especially interior finishes. It is also
important to note that a building need not be all modular or all site built. Most
modular projects utilize a combination, but the mix of these two methods is
important to the time and financial savings. Through the early conceptual
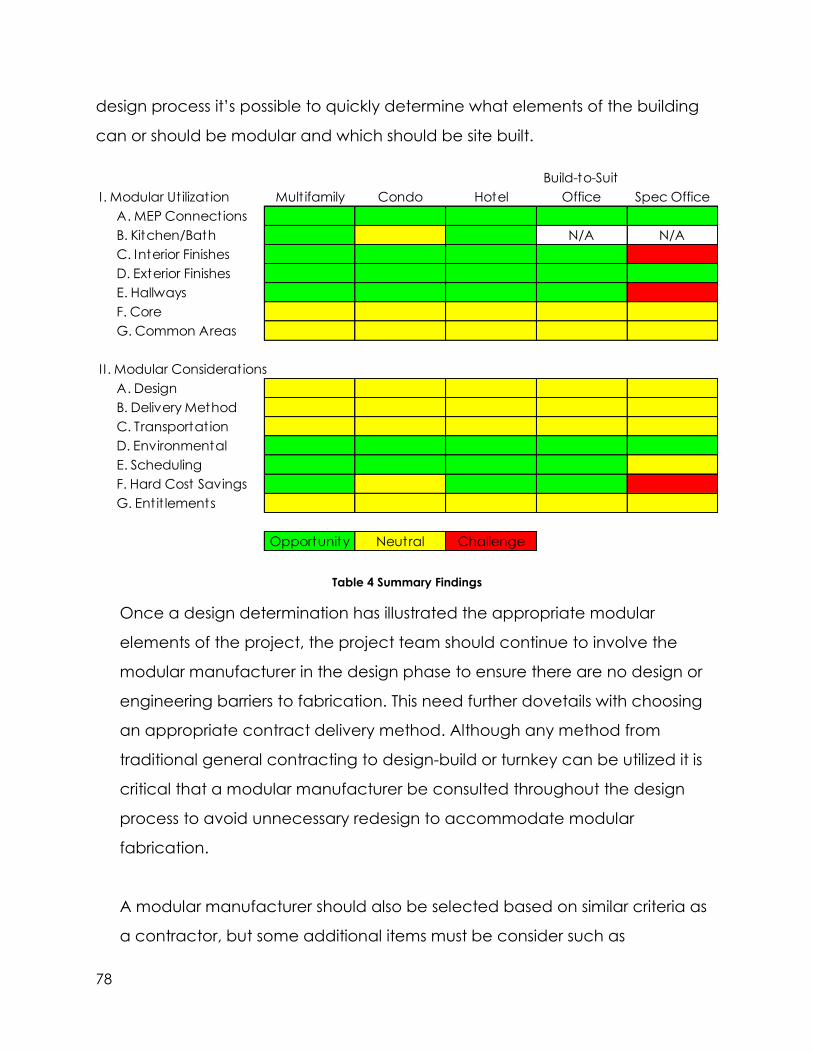
78
design process it’s possible to quickly determine what elements of the building
can or should be modular and which should be site built.
Table 4 Summary Findings
Once a design determination has illustrated the appropriate modular
elements of the project, the project team should continue to involve the
modular manufacturer in the design phase to ensure there are no design or
engineering barriers to fabrication. This need further dovetails with choosing
an appropriate contract delivery method. Although any method from
traditional general contracting to design-build or turnkey can be utilized it is
critical that a modular manufacturer be consulted throughout the design
process to avoid unnecessary redesign to accommodate modular
fabrication.
A modular manufacturer should also be selected based on similar criteria as
a contractor, but some additional items must be consider such as
I . Modular Ut ilizat ion Mult ifamily Condo Hotel
Build-to-Suit
Office Spec Office
A. MEP Connections
B. Kitchen/Bath N/A N/A
C. Interior Finishes
D. Exterior Finishes
E. Hallways
F. Core
G. Common Areas
II. Modular Considerations
A. Design
B. Delivery Method
C. Transportat ion
D. Environmental
E. Scheduling
F. Hard Cost Savings
G. Ent it lements
Opportunity Neutral Challenge

79
transportation cost, delivery route, capacity and financial health.
Transportation considerations impact the cost and timing of module
deliveries. Typically a factory within 400-600 miles can offer reasonable
transportation costs, but escort and night/day delivery restrictions should also
be considered. Lastly, given an owner’s and lender’s concern about
completion guarantees the financial health of the manufacturer must be
closely assessed to ensure they can deliver. This is especially important since
there maybe no other manufacturer that is within delivery range of the
project site or has the capacity to create the number of modules.
The lack of depth of the higher capacity modular manufacturers requires
developers to be especially vigilant in risk mitigation when engaging a
manufacturer. This is especially true for lenders who may require
manufacturers to provide enhanced credit to ensure completion. Similarly,
owners will have to address payment and procurement concerns of the
manufacturers as they typically secure most of their materials at the outset of
the project, but cannot deliver finished product until nearly all modules are
complete. This lag creates materials carry that may need to be financed or
priced into the manufacturing contract.
The most important consideration is scheduling and project timing. As seen
the financial model some of the project time savings can erode if they do
not resolve the financial needs of the project. For example, a high rise
apartment building typically benefits from stagger unit delivery that results to
a slow ramp up in operating expenses and a stead lease up. In a modular
project the operation of cranes, matte line connections and tying modules to
the building core typically limit the opportunity for lease up until all modules
are set and installed. Given the high level of finishes in many modular projects
there is limited onsite construction after module setting, especially if the
80
exteriors are also finished in the factory. With these parameters, as in the
financial model, a project may delivery 150 units per month that requires
near full operating expense but only 20-30 of those units maybe leased per
month and thus generating revenue. As noted in the model this condition
greatly increases the operating deficit of the project during construction and
today’s low interest rate environment may have a greater impact than the
reduced interest carry. Despite this operational challenge there is still a small,
but meaningful financial benefit from schedule savings. On the other hand,
hotels, build-to-suit offices and condos, which can have 30-100% pre-sales,
can have near 100% economical use of the building immediately following
construction completion. Thus these property types will suffer from almost no
increased operating deficit due to modular construction and will have all of
the reduced interest carry yield bottom line savings.
Financial savings are more pronounced and appropriate when considering
materials, labor and schedule as a collective pricing metric. Although there is
some meaningful material cost savings due to pre-cut and bulk order
materials, the far greater savings results from the reduced labor time and
wages in offsite construction. In combination all of these savings can
produce 5-10% total project savings. With larger projects and more
amenable property types the saving will be on the higher end of the range.
Without question there are material benefits to modular construction, but any
developer should carefully study the opportunities and challenges prior to
adoption. At this point in time, this technology has not matured enough for
an owner to effectively outsource complete oversight and quality control.
Given the financial and schedule benefits, a developer would be wise to
consider this technology based on their product type and location relative to
manufacturing facilities. The developer should engage a modular company
81
early in the design process, but not allow the manufacturer to drive the
design process. Further it’s important to understand the differences between
a traditional contractor and a manufacturer, as both debt and equity
partners will require more assurances, financial considerations and
explanations before allowing its use. However, if a developer has successfully
navigated this path there are clear financial benefits to offsite modular
construction.
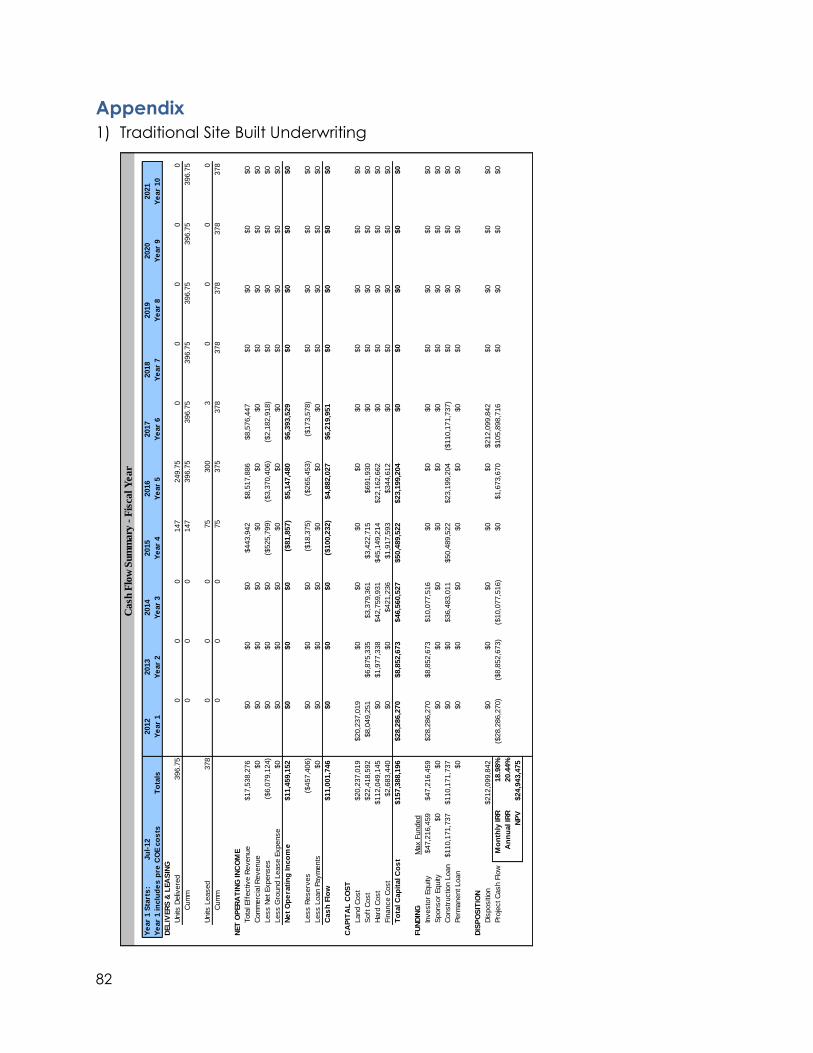
82
Appendix
1) Traditional Site Built Underwriting
Ca
sh F
low
Sum
ma
ry -
Fis
cal Y
ea
r
Ye
ar
1 S
tart
s:
Ju
l-12
2012
2013
2014
2015
2016
2017
2018
2019
2020
2021
Ye
ar
1 in
clu
de
s p
re C
OE c
os
tsT
ota
lsY
ear
1Y
ear
2Y
ear
3Y
ear
4Y
ear
5Y
ear
6Y
ear
7Y
ear
8Y
ear
9Y
ear
10
DEL
IVER
S &
LEA
SIN
G
Units
Deliv
ere
d396.7
50
00
147
249.7
50
00
00
Cum
m0
00
147
396.7
5396.7
5396.7
5396.7
5396.7
5396.7
5
Units
Leased
378
00
075
300
30
00
0
Cum
m0
00
75
375
378
378
378
378
378
NET
OP
ER
AT
ING
IN
CO
ME
Tota
l Eff
ectiv
e R
evenue
$17,5
38,2
76
$0
$0
$0
$443,9
42
$8,5
17,8
86
$8,5
76,4
47
$0
$0
$0
$0
Com
merc
ial R
evenue
$0
$0
$0
$0
$0
$0
$0
$0
$0
$0
$0
Less N
et Expenses
($6,0
79,1
24)
$0
$0
$0
($525,7
99)
($3,3
70,4
06)
($2,1
82,9
18)
$0
$0
$0
$0
Less G
round L
ease E
xpense
$0
$0
$0
$0
$0
$0
$0
$0
$0
$0
$0
Ne
t O
pe
rati
ng
In
co
me
$11,4
59,1
52
$0
$0
$0
($81,8
57)
$5,1
47,4
80
$6,3
93,5
29
$0
$0
$0
$0
Less R
eserv
es
($457,4
06)
$0
$0
$0
($18,3
75)
($265,4
53)
($173,5
78)
$0
$0
$0
$0
Less L
oan P
aym
ents
$0
$0
$0
$0
$0
$0
$0
$0
$0
$0
$0
Cas
h F
low
$11,0
01,7
46
$0
$0
$0
($100,2
32)
$4,8
82,0
27
$6,2
19,9
51
$0
$0
$0
$0
CA
PIT
AL
CO
ST
Land C
ost
$20,2
37,0
19
$20,2
37,0
19
$0
$0
$0
$0
$0
$0
$0
$0
$0
Soft
Cost
$22,4
18,5
92
$8,0
49,2
51
$6,8
75,3
35
$3,3
79,3
61
$3,4
22,7
15
$691,9
30
$0
$0
$0
$0
$0
Hard
Cost
$112,0
49,1
45
$0
$1,9
77,3
38
$42,7
59,9
31
$45,1
49,2
14
$22,1
62,6
62
$0
$0
$0
$0
$0
Fin
ance C
ost
$2,6
83,4
40
$0
$0
$421,2
36
$1,9
17,5
93
$344,6
12
$0
$0
$0
$0
$0
To
tal C
ap
ital C
os
t$157,3
88,1
96
$28,2
86,2
70
$8,8
52,6
73
$46,5
60,5
27
$50,4
89,5
22
$23,1
99,2
04
$0
$0
$0
$0
$0
FU
ND
ING
Max F
unded
Investo
r Equity
$47,2
16,4
59
$47,2
16,4
59
$28,2
86,2
70
$8,8
52,6
73
$10,0
77,5
16
$0
$0
$0
$0
$0
$0
$0
Sponsor
Equity
$0
$0
$0
$0
$0
$0
$0
$0
$0
$0
$0
$0
Constr
uctio
n L
oan
$110,1
71,7
37
$110,1
71,7
37
$0
$0
$36,4
83,0
11
$50,4
89,5
22
$23,1
99,2
04
($110,1
71,7
37)
$0
$0
$0
$0
Perm
anent Loan
$0
$0
$0
$0
$0
$0
$0
$0
$0
$0
$0
DIS
PO
SIT
ION
Dis
positi
on
$212,0
99,8
42
$0
$0
$0
$0
$0
$212,0
99,8
42
$0
$0
$0
$0
Pro
ject C
ash F
low
Mo
nth
ly IR
R18.9
8%
($28,2
86,2
70)
($8,8
52,6
73)
($10,0
77,5
16)
$0
$1,6
73,6
70
$105,8
98,7
16
$0
$0
$0
$0
An
nu
al IR
R20.4
4%
NP
V$24,9
43,4
75
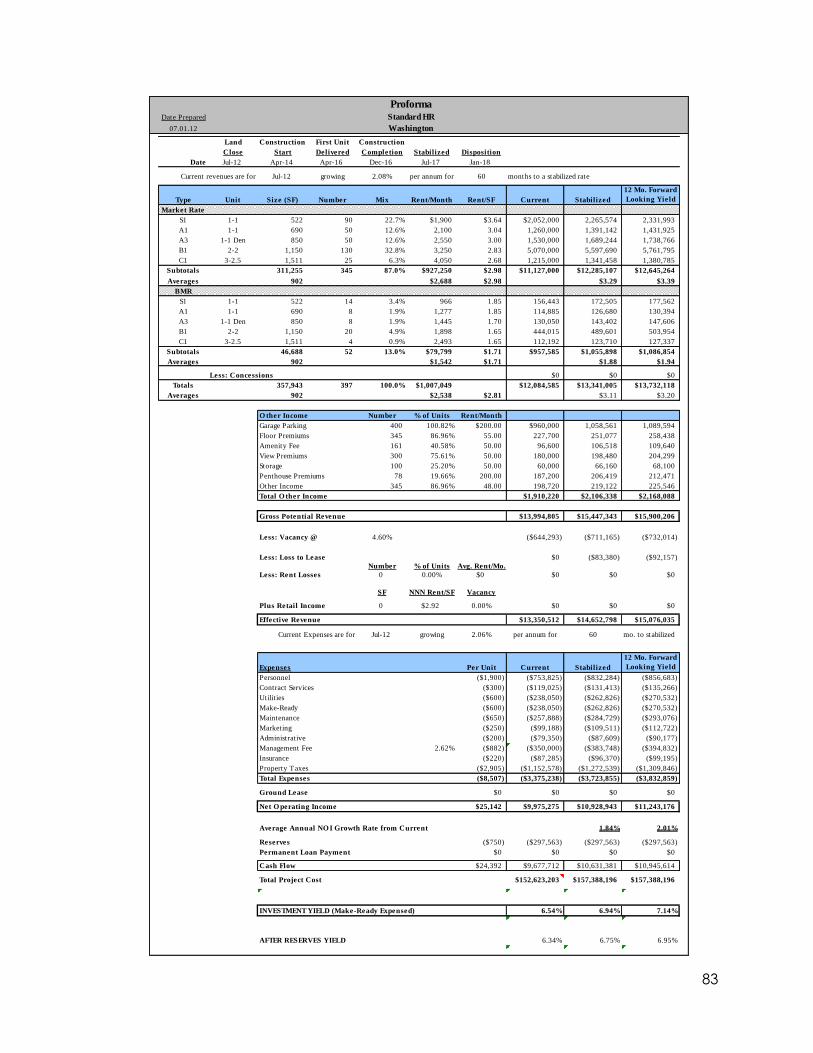
83
Proforma Date Prepared Standard HR
07.01.12 Washington
Land Construction First Unit Construction
Close Start Delivered Completion Stabilized Disposition
Date Jul-12 Apr-14 Apr-16 Dec-16 Jul-17 Jan-18
Current revenues are for Jul-12 growing 2.08% per annum for 60 months to a stabilized rate
Type Unit Size (SF) Number Mix Rent/Month Rent/SF Current Stabilized
12 Mo. Forward
Looking Yield
Market Rate
S1 1-1 522 90 22.7% $1,900 $3.64 $2,052,000 2,265,574 2,331,993
A1 1-1 690 50 12.6% 2,100 3.04 1,260,000 1,391,142 1,431,925
A3 1-1 Den 850 50 12.6% 2,550 3.00 1,530,000 1,689,244 1,738,766
B1 2-2 1,150 130 32.8% 3,250 2.83 5,070,000 5,597,690 5,761,795
C1 3-2.5 1,511 25 6.3% 4,050 2.68 1,215,000 1,341,458 1,380,785
Subtotals 311,255 345 87.0% $927,250 $2.98 $11,127,000 $12,285,107 $12,645,264
Averages 902 $2,688 $2.98 $3.29 $3.39
BMR
S1 1-1 522 14 3.4% 966 1.85 156,443 172,505 177,562
A1 1-1 690 8 1.9% 1,277 1.85 114,885 126,680 130,394
A3 1-1 Den 850 8 1.9% 1,445 1.70 130,050 143,402 147,606
B1 2-2 1,150 20 4.9% 1,898 1.65 444,015 489,601 503,954
C1 3-2.5 1,511 4 0.9% 2,493 1.65 112,192 123,710 127,337
Subtotals 46,688 52 13.0% $79,799 $1.71 $957,585 $1,055,898 $1,086,854
Averages 902 $1,542 $1.71 $1.88 $1.94
Less: Concessions $0 $0 $0
Totals 357,943 397 100.0% $1,007,049 $12,084,585 $13,341,005 $13,732,118
Averages 902 $2,538 $2.81 $3.11 $3.20
O ther Income Number % of Units Rent/Month
Garage Parking 400 100.82% $200.00 $960,000 1,058,561 1,089,594
Floor Premiums 345 86.96% 55.00 227,700 251,077 258,438
Amenity Fee 161 40.58% 50.00 96,600 106,518 109,640
View Premiums 300 75.61% 50.00 180,000 198,480 204,299
Storage 100 25.20% 50.00 60,000 66,160 68,100
Penthouse Premiums 78 19.66% 200.00 187,200 206,419 212,471
Other Income 345 86.96% 48.00 198,720 219,122 225,546
Total O ther Income $1,910,220 $2,106,338 $2,168,088
Gross Potential Revenue $13,994,805 $15,447,343 $15,900,206
Less: Vacancy @ 4.60% ($644,293) ($711,165) ($732,014)
Less: Loss to Lease $0 ($83,380) ($92,157)
Number % of Units Avg. Rent/Mo.
Less: Rent Losses 0 0.00% $0 $0 $0 $0
SF NNN Rent/SF Vacancy
Plus Retail Income 0 $2.92 0.00% $0 $0 $0
Effective Revenue $13,350,512 $14,652,798 $15,076,035
Current Expenses are for Jul-12 growing 2.06% per annum for 60 mo. to stabilized
Expenses Per Unit Current Stabilized
12 Mo. Forward
Looking Yield
Personnel ($1,900) ($753,825) ($832,284) ($856,683)
Contract Services ($300) ($119,025) ($131,413) ($135,266)
Utilit ies ($600) ($238,050) ($262,826) ($270,532)
Make-Ready ($600) ($238,050) ($262,826) ($270,532)
Maintenance ($650) ($257,888) ($284,729) ($293,076)
Marketing ($250) ($99,188) ($109,511) ($112,722)
Administrative ($200) ($79,350) ($87,609) ($90,177)
Management Fee 2.62% ($882) ($350,000) ($383,748) ($394,832)
Insurance ($220) ($87,285) ($96,370) ($99,195)
Property Taxes ($2,905) ($1,152,578) ($1,272,539) ($1,309,846)
Total Expenses ($8,507) ($3,375,238) ($3,723,855) ($3,832,859)
Ground Lease $0 $0 $0 $0
Net O perating Income $25,142 $9,975,275 $10,928,943 $11,243,176
Average Annual NO I Growth Rate from Current 1.84% 2.01%
Reserves ($750) ($297,563) ($297,563) ($297,563)
Permanent Loan Payment $0 $0 $0 $0
Cash Flow $24,392 $9,677,712 $10,631,381 $10,945,614
Total Project Cost $152,623,203 $157,388,196 $157,388,196
#REF! #REF! #REF! #REF!
INVESTMENT YIELD (Make-Ready Expensed) 6.54% 6.94% 7.14%
INVESTMENT YIELD (After BM Debt & Tax Credits) #REF! #REF! #REF!
AFTER RESERVES YIELD 6.34% 6.75% 6.95%
AFTER RESERVES YIELD (After BM Debt & Tax Credits) #REF! #REF! #REF!
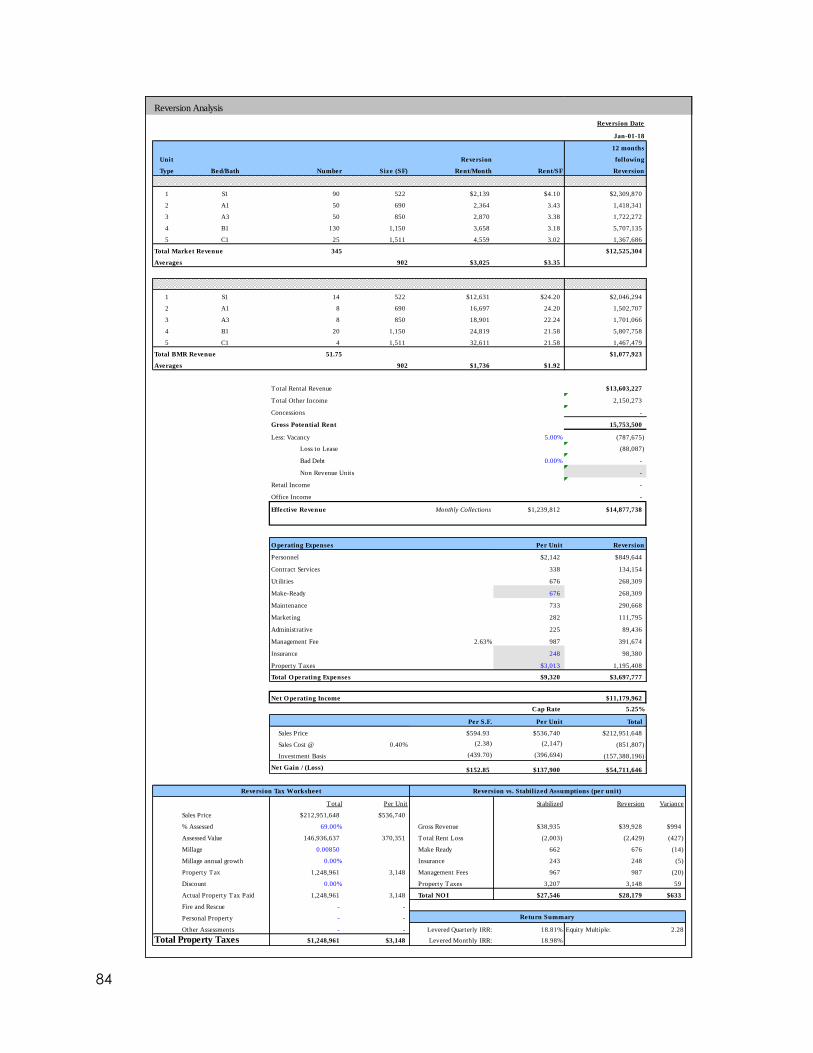
84
Reversion Analysis
Reversion Date
Jan-01-18
12 months
Unit Reversion following
Type Bed/Bath Number Size (SF) Rent/Month Rent/SF Reversion
1 S1 90 522 $2,139 $4.10 $2,309,870
2 A1 50 690 2,364 3.43 1,418,341
3 A3 50 850 2,870 3.38 1,722,272
4 B1 130 1,150 3,658 3.18 5,707,135
5 C1 25 1,511 4,559 3.02 1,367,686
Total Market Revenue 345 $12,525,304
Averages 902 $3,025 $3.35
1 S1 14 522 $12,631 $24.20 $2,046,294
2 A1 8 690 16,697 24.20 1,502,707
3 A3 8 850 18,901 22.24 1,701,066
4 B1 20 1,150 24,819 21.58 5,807,758
5 C1 4 1,511 32,611 21.58 1,467,479
Total BMR Revenue 51.75 $1,077,923
Averages 902 $1,736 $1.92
Total Rental Revenue $13,603,227
Total Other Income 2,150,273
Concessions -
Gross Potential Rent 15,753,500
Less: Vacancy 5.00% (787,675)
Loss to Lease (88,087)
Bad Debt 0.00% -
Non Revenue Units -
Retail Income -
Office Income -
Effective Revenue Monthly Collections $1,239,812 $14,877,738
O perating Expenses Per Unit Reversion
Personnel $2,142 $849,644
Contract Services 338 134,154
Utilit ies 676 268,309
Make-Ready 676 268,309
Maintenance 733 290,668
Marketing 282 111,795
Administrative 225 89,436
Management Fee 2.63% 987 391,674
Insurance 248 98,380
Property Taxes $3,013 1,195,408
Total O perating Expenses $9,320 $3,697,777
Net O perating Income $11,179,962
Cap Rate 5.25%
Per S.F. Per Unit Total
Sales Price $594.93 $536,740 $212,951,648
Sales Cost @ 0.40% (2.38) (2,147) (851,807)
Investment Basis (439.70) (396,694) (157,388,196)
Net Gain / (Loss) $152.85 $137,900 $54,711,646
Total Per Unit Stabilized Reversion Variance
Sales Price $212,951,648 $536,740
% Assessed 69.00% Gross Revenue $38,935 $39,928 $994
Assessed Value 146,936,637 370,351 Total Rent Loss (2,003) (2,429) (427)
Millage 0.00850 Make Ready 662 676 (14)
Millage annual growth 0.00% Insurance 243 248 (5)
Property Tax 1,248,961 3,148 Management Fees 967 987 (20)
Discount 0.00% Property Taxes 3,207 3,148 59
Actual Property Tax Paid 1,248,961 3,148 Total NO I $27,546 $28,179 $633
Fire and Rescue - -
Personal Property - -
Other Assessments - - Levered Quarterly IRR: 18.81% Equity Multiple: 2.28
Total Property Taxes $1,248,961 $3,148 Levered Monthly IRR: 18.98%
Reversion Tax Worksheet Reversion vs. Stabilized Assumptions (per unit)
Return Summary
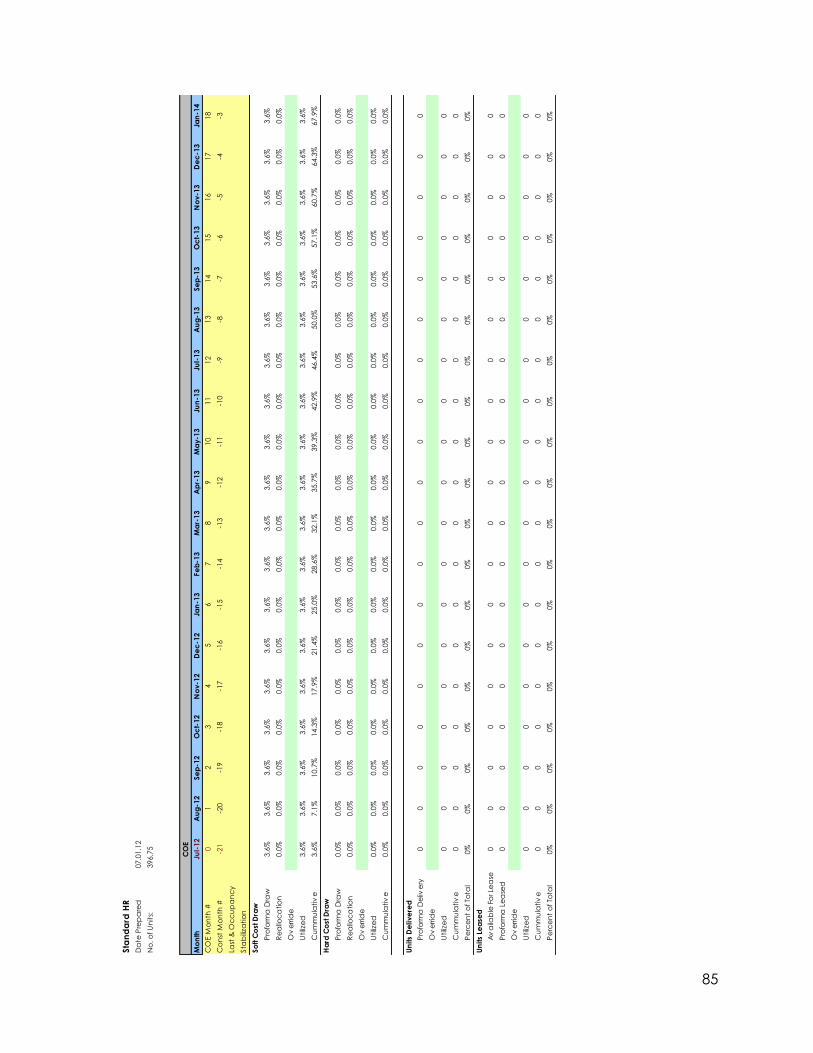
85
Sta
nd
ard
HR
Da
te P
rep
are
d07.0
1.1
2
No
. o
f U
nits:
396.7
5
CO
E
Mo
nth
Jul-
12
Au
g-1
2Se
p-1
2O
ct-
12
No
v-1
2D
ec
-12
Jan
-13
Fe
b-1
3M
ar-
13
Ap
r-13
Ma
y-1
3Ju
n-1
3Ju
l-13
Au
g-1
3Se
p-1
3O
ct-
13
No
v-1
3D
ec
-13
Jan
-14
CO
E M
on
th #
01
23
45
67
89
10
11
12
13
14
15
16
17
18
Co
nst
Mo
nth
#-2
1-2
0-1
9-1
8-1
7-1
6-1
5-1
4-1
3-1
2-1
1-1
0-9
-8-7
-6-5
-4-3
Last
& O
cc
up
an
cy
Sta
biliza
tio
n
So
ft C
ost
Dra
w
Pro
form
a D
raw
3.6
%3.6
%3.6
%3.6
%3.6
%3.6
%3.6
%3.6
%3.6
%3.6
%3.6
%3.6
%3.6
%3.6
%3.6
%3.6
%3.6
%3.6
%3.6
%
Re
allo
ca
tio
n0.0
%0.0
%0.0
%0.0
%0.0
%0.0
%0.0
%0.0
%0.0
%0.0
%0.0
%0.0
%0.0
%0.0
%0.0
%0.0
%0.0
%0.0
%0.0
%
Ov
errid
e
Utiliz
ed
3.6
%3.6
%3.6
%3.6
%3.6
%3.6
%3.6
%3.6
%3.6
%3.6
%3.6
%3.6
%3.6
%3.6
%3.6
%3.6
%3.6
%3.6
%3.6
%
Cu
mm
ula
tiv
e3.6
%7.1
%10.7
%14.3
%17.9
%21.4
%25.0
%28.6
%32.1
%35.7
%39.3
%42.9
%46.4
%50.0
%53.6
%57.1
%60.7
%64.3
%67.9
%
Ha
rd C
ost
Dra
w
Pro
form
a D
raw
0.0
%0.0
%0.0
%0.0
%0.0
%0.0
%0.0
%0.0
%0.0
%0.0
%0.0
%0.0
%0.0
%0.0
%0.0
%0.0
%0.0
%0.0
%0.0
%
Re
allo
ca
tio
n0.0
%0.0
%0.0
%0.0
%0.0
%0.0
%0.0
%0.0
%0.0
%0.0
%0.0
%0.0
%0.0
%0.0
%0.0
%0.0
%0.0
%0.0
%0.0
%
Ov
errid
e
Utiliz
ed
0.0
%0.0
%0.0
%0.0
%0.0
%0.0
%0.0
%0.0
%0.0
%0.0
%0.0
%0.0
%0.0
%0.0
%0.0
%0.0
%0.0
%0.0
%0.0
%
Cu
mm
ula
tiv
e0.0
%0.0
%0.0
%0.0
%0.0
%0.0
%0.0
%0.0
%0.0
%0.0
%0.0
%0.0
%0.0
%0.0
%0.0
%0.0
%0.0
%0.0
%0.0
%
Un
its
De
live
red
Pro
form
a D
eliv
ery
00
00
00
00
00
00
00
00
00
0
Ov
errid
e
Utiliz
ed
00
00
00
00
00
00
00
00
00
0
Cu
mm
ula
tiv
e0
00
00
00
00
00
00
00
00
00
Pe
rce
nt
of To
tal
0%
0%
0%
0%
0%
0%
0%
0%
0%
0%
0%
0%
0%
0%
0%
0%
0%
0%
0%
Un
its
Lea
sed
Av
aila
ble
Fo
r Le
ase
00
00
00
00
00
00
00
00
00
0
Pro
form
a L
ea
sed
00
00
00
00
00
00
00
00
00
0
Ov
errid
e
Utiliz
ed
00
00
00
00
00
00
00
00
00
0
Cu
mm
ula
tiv
e0
00
00
00
00
00
00
00
00
00
Pe
rce
nt
of To
tal
0%
0%
0%
0%
0%
0%
0%
0%
0%
0%
0%
0%
0%
0%
0%
0%
0%
0%
0%
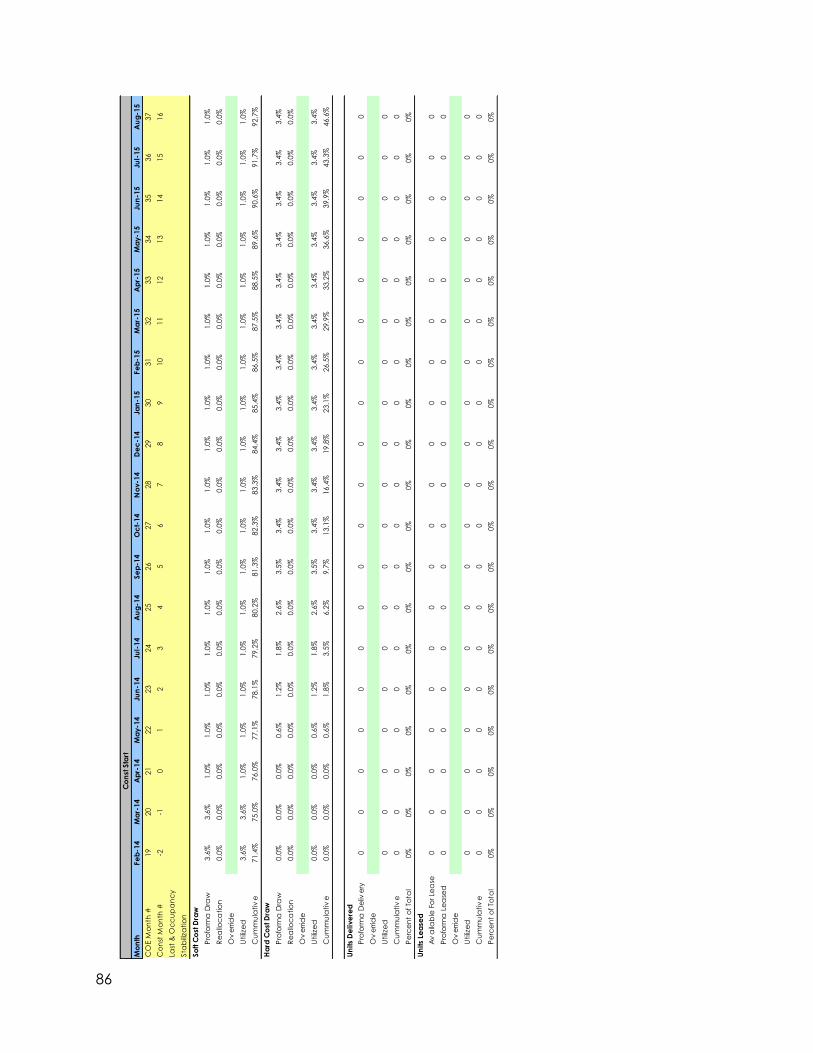
86
Co
nst
Sta
rt
Mo
nth
Fe
b-1
4M
ar-
14
Ap
r-14
Ma
y-1
4Ju
n-1
4Ju
l-14
Au
g-1
4Se
p-1
4O
ct-
14
No
v-1
4D
ec
-14
Jan
-15
Fe
b-1
5M
ar-
15
Ap
r-15
Ma
y-1
5Ju
n-1
5Ju
l-15
Au
g-1
5
CO
E M
on
th #
19
20
21
22
23
24
25
26
27
28
29
30
31
32
33
34
35
36
37
Co
nst
Mo
nth
#-2
-10
12
34
56
78
910
11
12
13
14
15
16
Last
& O
cc
up
an
cy
Sta
biliza
tio
n
So
ft C
ost
Dra
w
Pro
form
a D
raw
3.6
%3.6
%1.0
%1.0
%1.0
%1.0
%1.0
%1.0
%1.0
%1.0
%1.0
%1.0
%1.0
%1.0
%1.0
%1.0
%1.0
%1.0
%1.0
%
Re
allo
ca
tio
n0.0
%0.0
%0.0
%0.0
%0.0
%0.0
%0.0
%0.0
%0.0
%0.0
%0.0
%0.0
%0.0
%0.0
%0.0
%0.0
%0.0
%0.0
%0.0
%
Ov
errid
e
Utiliz
ed
3.6
%3.6
%1.0
%1.0
%1.0
%1.0
%1.0
%1.0
%1.0
%1.0
%1.0
%1.0
%1.0
%1.0
%1.0
%1.0
%1.0
%1.0
%1.0
%
Cu
mm
ula
tiv
e71.4
%75.0
%76.0
%77.1
%78.1
%79.2
%80.2
%81.3
%82.3
%83.3
%84.4
%85.4
%86.5
%87.5
%88.5
%89.6
%90.6
%91.7
%92.7
%
Ha
rd C
ost
Dra
w
Pro
form
a D
raw
0.0
%0.0
%0.0
%0.6
%1.2
%1.8
%2.6
%3.5
%3.4
%3.4
%3.4
%3.4
%3.4
%3.4
%3.4
%3.4
%3.4
%3.4
%3.4
%
Re
allo
ca
tio
n0.0
%0.0
%0.0
%0.0
%0.0
%0.0
%0.0
%0.0
%0.0
%0.0
%0.0
%0.0
%0.0
%0.0
%0.0
%0.0
%0.0
%0.0
%0.0
%
Ov
errid
e
Utiliz
ed
0.0
%0.0
%0.0
%0.6
%1.2
%1.8
%2.6
%3.5
%3.4
%3.4
%3.4
%3.4
%3.4
%3.4
%3.4
%3.4
%3.4
%3.4
%3.4
%
Cu
mm
ula
tiv
e0.0
%0.0
%0.0
%0.6
%1.8
%3.5
%6.2
%9.7
%13.1
%16.4
%19.8
%23.1
%26.5
%29.9
%33.2
%36.6
%39.9
%43.3
%46.6
%
Un
its
De
live
red
Pro
form
a D
eliv
ery
00
00
00
00
00
00
00
00
00
0
Ov
errid
e
Utiliz
ed
00
00
00
00
00
00
00
00
00
0
Cu
mm
ula
tiv
e0
00
00
00
00
00
00
00
00
00
Pe
rce
nt
of To
tal
0%
0%
0%
0%
0%
0%
0%
0%
0%
0%
0%
0%
0%
0%
0%
0%
0%
0%
0%
Un
its
Lea
sed
Av
aila
ble
Fo
r Le
ase
00
00
00
00
00
00
00
00
00
0
Pro
form
a L
ea
sed
00
00
00
00
00
00
00
00
00
0
Ov
errid
e
Utiliz
ed
00
00
00
00
00
00
00
00
00
0
Cu
mm
ula
tiv
e0
00
00
00
00
00
00
00
00
00
Pe
rce
nt
of To
tal
0%
0%
0%
0%
0%
0%
0%
0%
0%
0%
0%
0%
0%
0%
0%
0%
0%
0%
0%
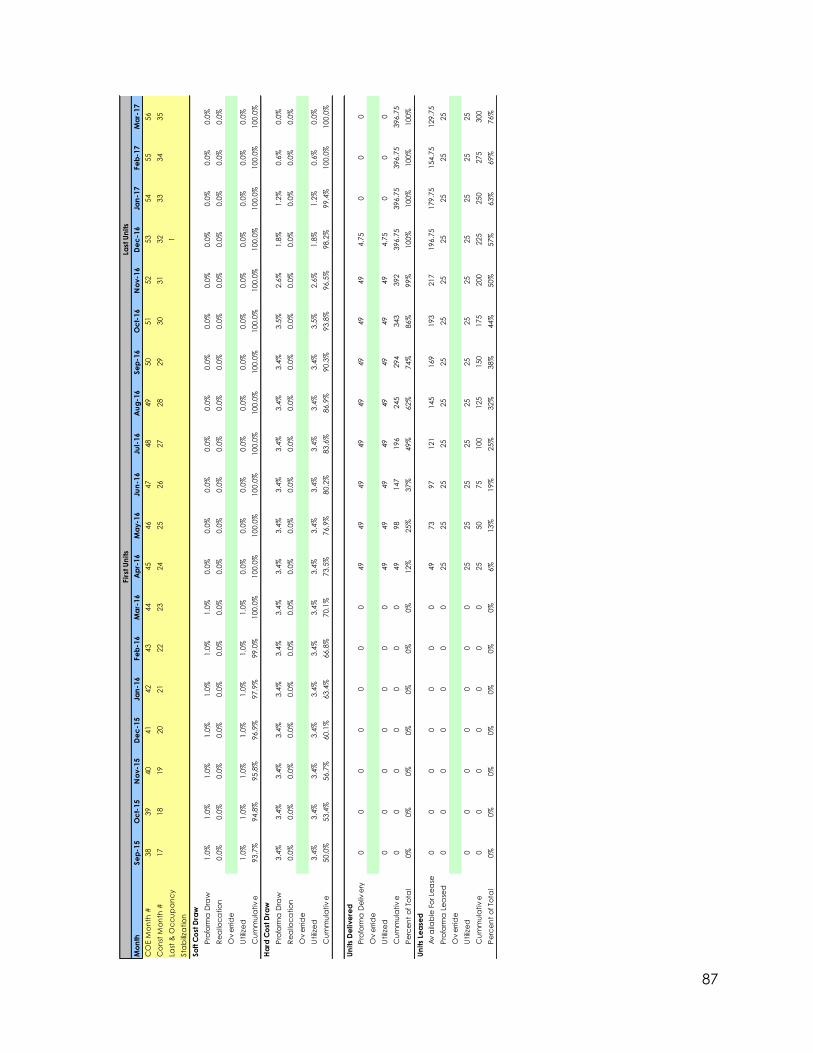
87
Fir
st U
nits
Last
Un
its
Mo
nth
Se
p-1
5O
ct-
15
No
v-1
5D
ec
-15
Jan
-16
Fe
b-1
6M
ar-
16
Ap
r-16
Ma
y-1
6Ju
n-1
6Ju
l-16
Au
g-1
6Se
p-1
6O
ct-
16
No
v-1
6D
ec
-16
Jan
-17
Fe
b-1
7M
ar-
17
CO
E M
on
th #
38
39
40
41
42
43
44
45
46
47
48
49
50
51
52
53
54
55
56
Co
nst
Mo
nth
#17
18
19
20
21
22
23
24
25
26
27
28
29
30
31
32
33
34
35
Last
& O
cc
up
an
cy
1
Sta
biliza
tio
n
So
ft C
ost
Dra
w
Pro
form
a D
raw
1.0
%1.0
%1.0
%1.0
%1.0
%1.0
%1.0
%0.0
%0.0
%0.0
%0.0
%0.0
%0.0
%0.0
%0.0
%0.0
%0.0
%0.0
%0.0
%
Re
allo
ca
tio
n0.0
%0.0
%0.0
%0.0
%0.0
%0.0
%0.0
%0.0
%0.0
%0.0
%0.0
%0.0
%0.0
%0.0
%0.0
%0.0
%0.0
%0.0
%0.0
%
Ov
errid
e
Utiliz
ed
1.0
%1.0
%1.0
%1.0
%1.0
%1.0
%1.0
%0.0
%0.0
%0.0
%0.0
%0.0
%0.0
%0.0
%0.0
%0.0
%0.0
%0.0
%0.0
%
Cu
mm
ula
tiv
e93.7
%94.8
%95.8
%96.9
%97.9
%99.0
%100.0
%100.0
%100.0
%100.0
%100.0
%100.0
%100.0
%100.0
%100.0
%100.0
%100.0
%100.0
%100.0
%
Ha
rd C
ost
Dra
w
Pro
form
a D
raw
3.4
%3.4
%3.4
%3.4
%3.4
%3.4
%3.4
%3.4
%3.4
%3.4
%3.4
%3.4
%3.4
%3.5
%2.6
%1.8
%1.2
%0.6
%0.0
%
Re
allo
ca
tio
n0.0
%0.0
%0.0
%0.0
%0.0
%0.0
%0.0
%0.0
%0.0
%0.0
%0.0
%0.0
%0.0
%0.0
%0.0
%0.0
%0.0
%0.0
%0.0
%
Ov
errid
e
Utiliz
ed
3.4
%3.4
%3.4
%3.4
%3.4
%3.4
%3.4
%3.4
%3.4
%3.4
%3.4
%3.4
%3.4
%3.5
%2.6
%1.8
%1.2
%0.6
%0.0
%
Cu
mm
ula
tiv
e50.0
%53.4
%56.7
%60.1
%63.4
%66.8
%70.1
%73.5
%76.9
%80.2
%83.6
%86.9
%90.3
%93.8
%96.5
%98.2
%99.4
%100.0
%100.0
%
Un
its
De
live
red
Pro
form
a D
eliv
ery
00
00
00
049
49
49
49
49
49
49
49
4.7
50
00
Ov
errid
e
Utiliz
ed
00
00
00
049
49
49
49
49
49
49
49
4.7
50
00
Cu
mm
ula
tiv
e0
00
00
00
49
98
147
196
245
294
343
392
396.7
5396.7
5396.7
5396.7
5
Pe
rce
nt
of To
tal
0%
0%
0%
0%
0%
0%
0%
12%
25%
37%
49%
62%
74%
86%
99%
100%
100%
100%
100%
Un
its
Lea
sed
Av
aila
ble
Fo
r Le
ase
00
00
00
049
73
97
121
145
169
193
217
196.7
5179.7
5154.7
5129.7
5
Pro
form
a L
ea
sed
00
00
00
025
25
25
25
25
25
25
25
25
25
25
25
Ov
errid
e
Utiliz
ed
00
00
00
025
25
25
25
25
25
25
25
25
25
25
25
Cu
mm
ula
tiv
e0
00
00
00
25
50
75
100
125
150
175
200
225
250
275
300
Pe
rce
nt
of To
tal
0%
0%
0%
0%
0%
0%
0%
6%
13%
19%
25%
32%
38%
44%
50%
57%
63%
69%
76%
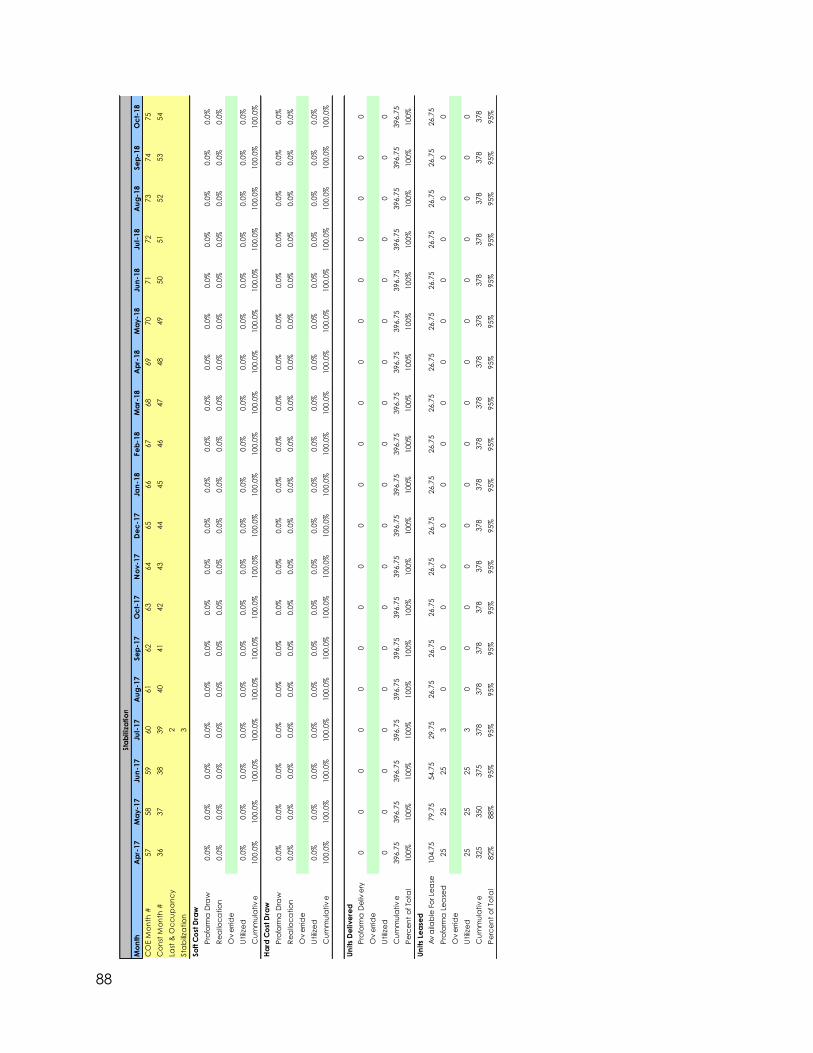
88
Sta
biliz
atio
n
Mo
nth
Ap
r-17
Ma
y-1
7Ju
n-1
7Ju
l-17
Au
g-1
7Se
p-1
7O
ct-
17
No
v-1
7D
ec
-17
Jan
-18
Fe
b-1
8M
ar-
18
Ap
r-18
Ma
y-1
8Ju
n-1
8Ju
l-18
Au
g-1
8Se
p-1
8O
ct-
18
CO
E M
on
th #
57
58
59
60
61
62
63
64
65
66
67
68
69
70
71
72
73
74
75
Co
nst
Mo
nth
#36
37
38
39
40
41
42
43
44
45
46
47
48
49
50
51
52
53
54
Last
& O
cc
up
an
cy
2
Sta
biliza
tio
n3
So
ft C
ost
Dra
w
Pro
form
a D
raw
0.0
%0.0
%0.0
%0.0
%0.0
%0.0
%0.0
%0.0
%0.0
%0.0
%0.0
%0.0
%0.0
%0.0
%0.0
%0.0
%0.0
%0.0
%0.0
%
Re
allo
ca
tio
n0.0
%0.0
%0.0
%0.0
%0.0
%0.0
%0.0
%0.0
%0.0
%0.0
%0.0
%0.0
%0.0
%0.0
%0.0
%0.0
%0.0
%0.0
%0.0
%
Ov
errid
e
Utiliz
ed
0.0
%0.0
%0.0
%0.0
%0.0
%0.0
%0.0
%0.0
%0.0
%0.0
%0.0
%0.0
%0.0
%0.0
%0.0
%0.0
%0.0
%0.0
%0.0
%
Cu
mm
ula
tiv
e100.0
%100.0
%100.0
%100.0
%100.0
%100.0
%100.0
%100.0
%100.0
%100.0
%100.0
%100.0
%100.0
%100.0
%100.0
%100.0
%100.0
%100.0
%100.0
%
Ha
rd C
ost
Dra
w
Pro
form
a D
raw
0.0
%0.0
%0.0
%0.0
%0.0
%0.0
%0.0
%0.0
%0.0
%0.0
%0.0
%0.0
%0.0
%0.0
%0.0
%0.0
%0.0
%0.0
%0.0
%
Re
allo
ca
tio
n0.0
%0.0
%0.0
%0.0
%0.0
%0.0
%0.0
%0.0
%0.0
%0.0
%0.0
%0.0
%0.0
%0.0
%0.0
%0.0
%0.0
%0.0
%0.0
%
Ov
errid
e
Utiliz
ed
0.0
%0.0
%0.0
%0.0
%0.0
%0.0
%0.0
%0.0
%0.0
%0.0
%0.0
%0.0
%0.0
%0.0
%0.0
%0.0
%0.0
%0.0
%0.0
%
Cu
mm
ula
tiv
e100.0
%100.0
%100.0
%100.0
%100.0
%100.0
%100.0
%100.0
%100.0
%100.0
%100.0
%100.0
%100.0
%100.0
%100.0
%100.0
%100.0
%100.0
%100.0
%
Un
its
De
live
red
Pro
form
a D
eliv
ery
00
00
00
00
00
00
00
00
00
0
Ov
errid
e
Utiliz
ed
00
00
00
00
00
00
00
00
00
0
Cu
mm
ula
tiv
e396.7
5396.7
5396.7
5396.7
5396.7
5396.7
5396.7
5396.7
5396.7
5396.7
5396.7
5396.7
5396.7
5396.7
5396.7
5396.7
5396.7
5396.7
5396.7
5
Pe
rce
nt
of To
tal
100%
100%
100%
100%
100%
100%
100%
100%
100%
100%
100%
100%
100%
100%
100%
100%
100%
100%
100%
Un
its
Lea
sed
Av
aila
ble
Fo
r Le
ase
104.7
579.7
554.7
529.7
526.7
526.7
526.7
526.7
526.7
526.7
526.7
526.7
526.7
526.7
526.7
526.7
526.7
526.7
526.7
5
Pro
form
a L
ea
sed
25
25
25
30
00
00
00
00
00
00
00
Ov
errid
e
Utiliz
ed
25
25
25
30
00
00
00
00
00
00
00
Cu
mm
ula
tiv
e325
350
375
378
378
378
378
378
378
378
378
378
378
378
378
378
378
378
378
Pe
rce
nt
of To
tal
82%
88%
95%
95%
95%
95%
95%
95%
95%
95%
95%
95%
95%
95%
95%
95%
95%
95%
95%
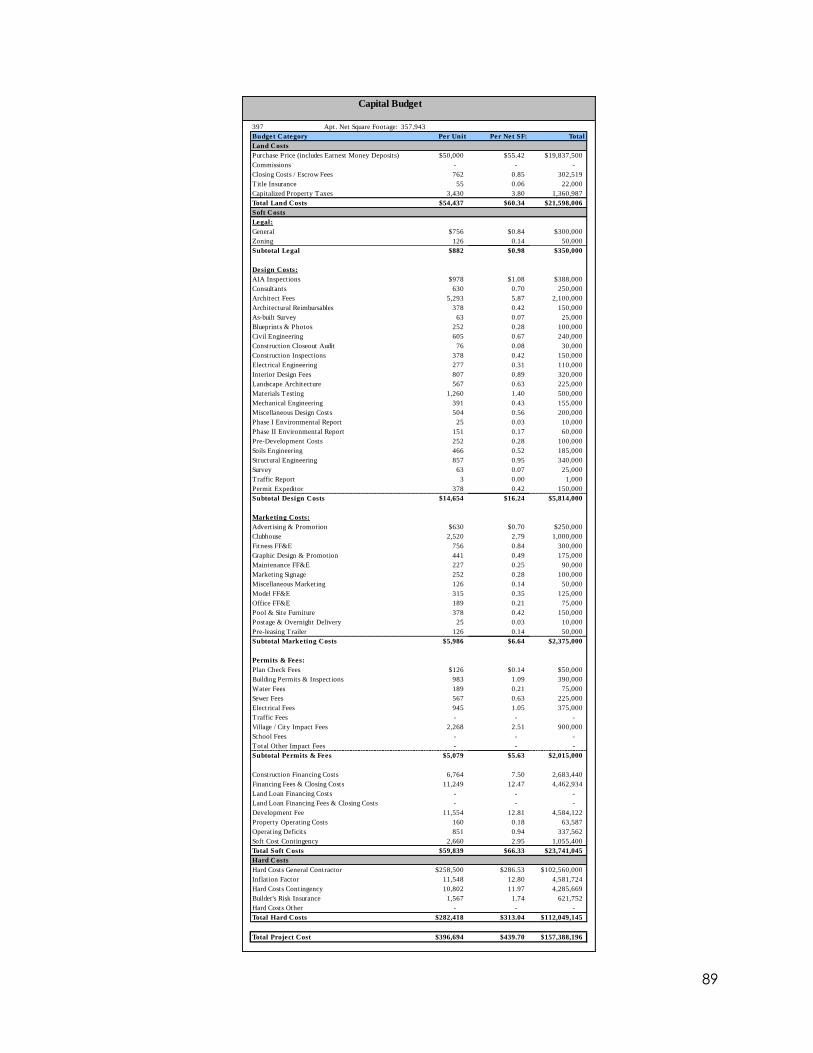
89
Capital Budget
397 Apt. Net Square Footage:
Budget Category Per Unit Per Net SF: Total
Land Costs
Purchase Price (includes Earnest Money Deposits) $50,000 $55.42 $19,837,500
Commissions - - -
Closing Costs / Escrow Fees 762 0.85 302,519
T itle Insurance 55 0.06 22,000
Capitalized Property Taxes 3,430 3.80 1,360,987
Total Land Costs $54,437 $60.34 $21,598,006
Soft Costs
Legal:
General $756 $0.84 $300,000
Zoning 126 0.14 50,000
Subtotal Legal $882 $0.98 $350,000
Design Costs:
AIA Inspections $978 $1.08 $388,000
Consultants 630 0.70 250,000
Architect Fees 5,293 5.87 2,100,000
Architectural Reimbursables 378 0.42 150,000
As-built Survey 63 0.07 25,000
Blueprints & Photos 252 0.28 100,000
Civil Engineering 605 0.67 240,000
Construction Closeout Audit 76 0.08 30,000
Construction Inspections 378 0.42 150,000
Electrical Engineering 277 0.31 110,000
Interior Design Fees 807 0.89 320,000
Landscape Architecture 567 0.63 225,000
Materials Testing 1,260 1.40 500,000
Mechanical Engineering 391 0.43 155,000
Miscellaneous Design Costs 504 0.56 200,000
Phase I Environmental Report 25 0.03 10,000
Phase II Environmental Report 151 0.17 60,000
Pre-Development Costs 252 0.28 100,000
Soils Engineering 466 0.52 185,000
Structural Engineering 857 0.95 340,000
Survey 63 0.07 25,000
T raffic Report 3 0.00 1,000
Permit Expeditor 378 0.42 150,000
Subtotal Design Costs $14,654 $16.24 $5,814,000
Marketing Costs:
Advertising & Promotion $630 $0.70 $250,000
Clubhouse 2,520 2.79 1,000,000
Fitness FF&E 756 0.84 300,000
Graphic Design & Promotion 441 0.49 175,000
Maintenance FF&E 227 0.25 90,000
Marketing Signage 252 0.28 100,000
Miscellaneous Marketing 126 0.14 50,000
Model FF&E 315 0.35 125,000
Office FF&E 189 0.21 75,000
Pool & Site Furniture 378 0.42 150,000
Postage & Overnight Delivery 25 0.03 10,000
Pre-leasing Trailer 126 0.14 50,000
Subtotal Marketing Costs $5,986 $6.64 $2,375,000
Permits & Fees:
Plan Check Fees $126 $0.14 $50,000
Building Permits & Inspections 983 1.09 390,000
Water Fees 189 0.21 75,000
Sewer Fees 567 0.63 225,000
Electrical Fees 945 1.05 375,000
T raffic Fees - - -
Village / City Impact Fees 2,268 2.51 900,000
School Fees - - -
Total Other Impact Fees - - -
Subtotal Permits & Fees $5,079 $5.63 $2,015,000
Construction Financing Costs 6,764 7.50 2,683,440
Financing Fees & Closing Costs 11,249 12.47 4,462,934
Land Loan Financing Costs - - -
Land Loan Financing Fees & Closing Costs - - -
Development Fee 11,554 12.81 4,584,122
Property Operating Costs 160 0.18 63,587
Operating Deficits 851 0.94 337,562
Soft Cost Contingency 2,660 2.95 1,055,400
Total Soft Costs $59,839 $66.33 $23,741,045
Hard Costs
Hard Costs General Contractor $258,500 $286.53 $102,560,000
Inflation Factor 11,548 12.80 4,581,724
Hard Costs Contingency 10,802 11.97 4,285,669
Builder's Risk Insurance 1,567 1.74 621,752
Hard Costs Other - - -
Total Hard Costs $282,418 $313.04 $112,049,145
Total Project Cost $396,694 $439.70 $157,388,196
357,943
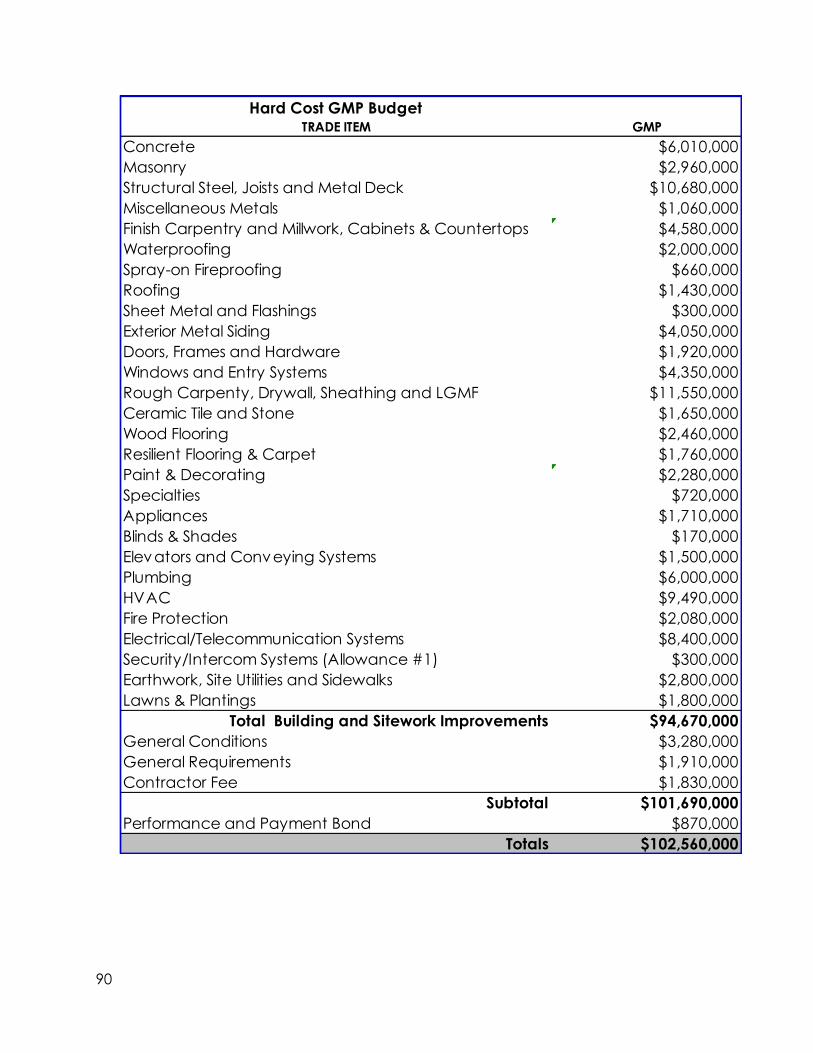
90
Hard Cost GMP BudgetTRADE ITEM GMP
Concrete $6,010,000
Masonry $2,960,000
Structural Steel, Joists and Metal Deck $10,680,000
Miscellaneous Metals $1,060,000
Finish Carpentry and Millwork, Cabinets & Countertops $4,580,000
Waterproofing $2,000,000
Spray-on Fireproofing $660,000
Roofing $1,430,000
Sheet Metal and Flashings $300,000
Exterior Metal Siding $4,050,000
Doors, Frames and Hardware $1,920,000
Windows and Entry Systems $4,350,000
Rough Carpenty, Drywall, Sheathing and LGMF $11,550,000
Ceramic Tile and Stone $1,650,000
Wood Flooring $2,460,000
Resilient Flooring & Carpet $1,760,000
Paint & Decorating $2,280,000
Specialties $720,000
Appliances $1,710,000
Blinds & Shades $170,000
Elevators and Conveying Systems $1,500,000
Plumbing $6,000,000
HVAC $9,490,000
Fire Protection $2,080,000
Electrical/Telecommunication Systems $8,400,000
Security/Intercom Systems (Allowance #1) $300,000
Earthwork, Site Utilities and Sidewalks $2,800,000
Lawns & Plantings $1,800,000
Total Building and Sitework Improvements $94,670,000
General Conditions $3,280,000
General Requirements $1,910,000
Contractor Fee $1,830,000
Subtotal $101,690,000
Performance and Payment Bond $870,000
Totals $102,560,000
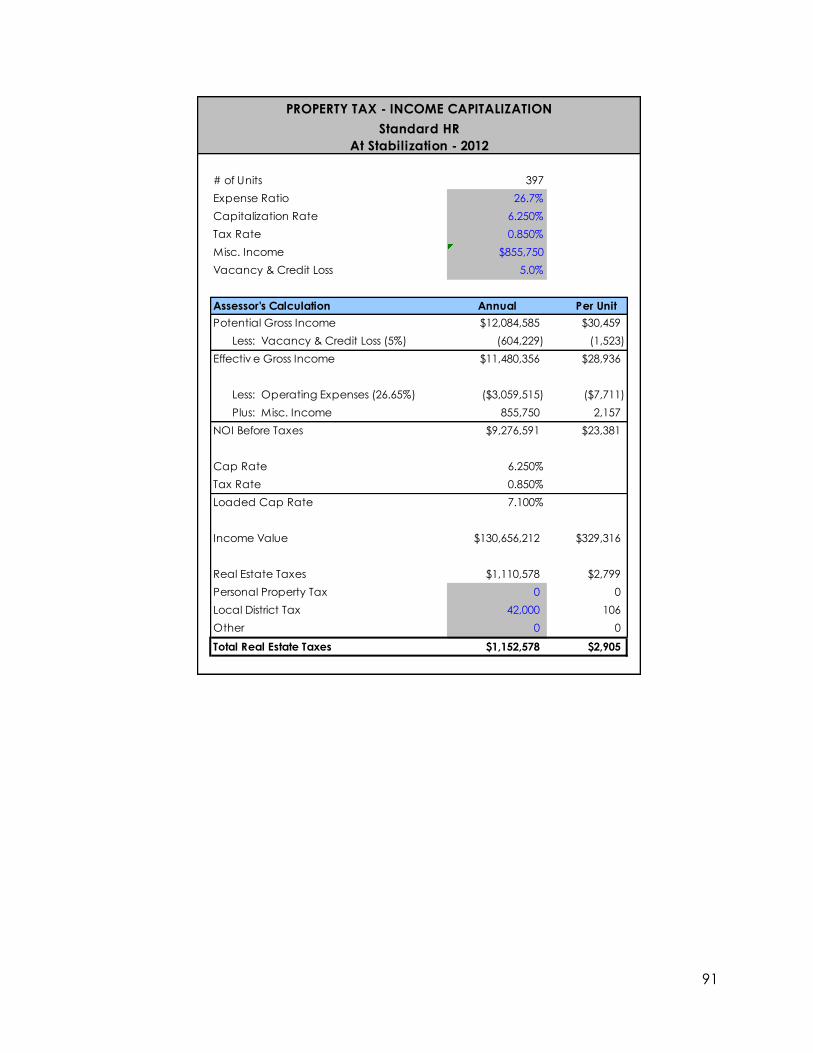
91
PROPERTY TAX - INCOME CAPITALIZATION
Standard HR
At Stabilization - 2012
# of Units 397
Expense Ratio 26.7%
Capitalization Rate 6.250%
Tax Rate 0.850%
Misc. Income $855,750
Vacancy & Credit Loss 5.0%
Assessor's Calculation Annual Per Unit
Potential Gross Income $12,084,585 $30,459
Less: Vacancy & Credit Loss (5%) (604,229) (1,523)
Effectiv e Gross Income $11,480,356 $28,936
Less: Operating Expenses (26.65%) ($3,059,515) ($7,711)
Plus: Misc. Income 855,750 2,157
NOI Before Taxes $9,276,591 $23,381
Cap Rate 6.250%
Tax Rate 0.850%
Loaded Cap Rate 7.100%
Income Value $130,656,212 $329,316
Real Estate Taxes $1,110,578 $2,799
Personal Property Tax 0 0
Local District Tax 42,000 106
Other 0 0
Total Real Estate Taxes $1,152,578 $2,905
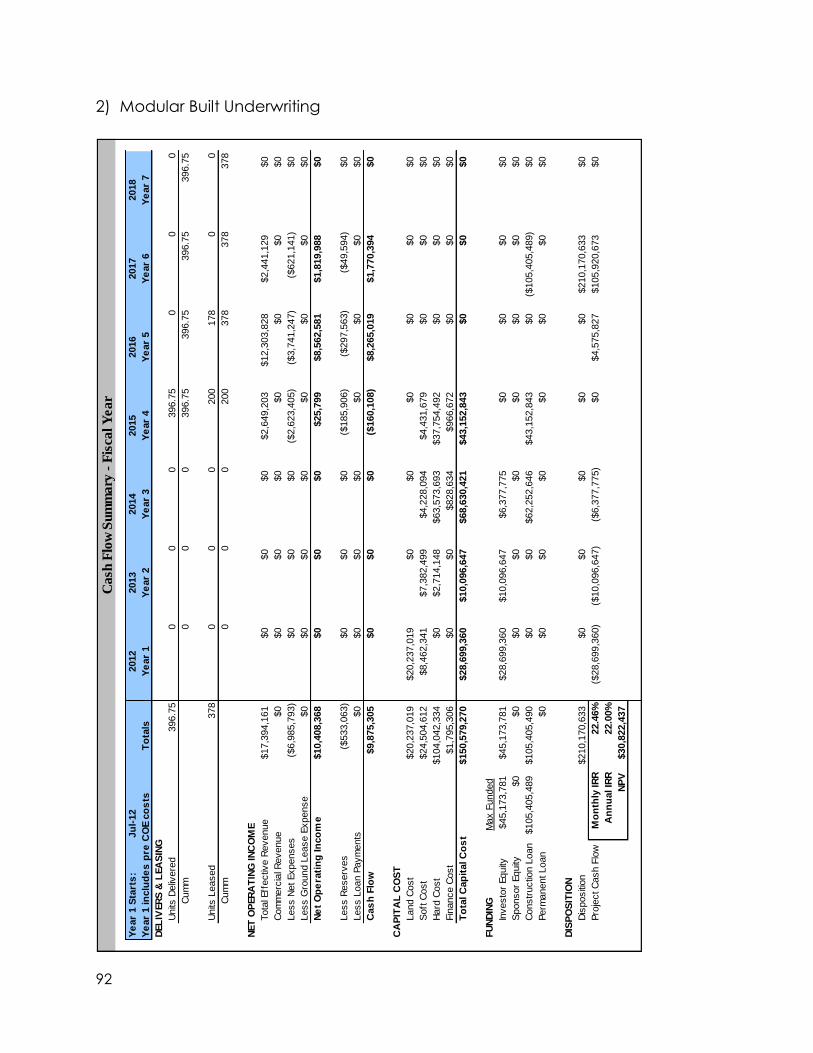
92
2) Modular Built Underwriting
Cash
Flo
w S
um
mary
- F
isca
l Y
ear
Ye
ar
1 S
tart
s:
Ju
l-12
2012
2013
2014
2015
2016
2017
2018
Ye
ar
1 in
clu
de
s p
re C
OE c
os
tsT
ota
lsY
ear
1Y
ear
2Y
ear
3Y
ear
4Y
ear
5Y
ear
6Y
ear
7
DEL
IVER
S &
LEA
SIN
G
Units
Deliv
ere
d396.7
50
00
396.7
50
00
Cum
m0
00
396.7
5396.7
5396.7
5396.7
5
Units
Leased
378
00
0200
178
00
Cum
m0
00
200
378
378
378
NET
OP
ER
AT
ING
IN
CO
ME
Tota
l Eff
ectiv
e R
evenue
$17,3
94,1
61
$0
$0
$0
$2,6
49,2
03
$12,3
03,8
28
$2,4
41,1
29
$0
Com
merc
ial R
evenue
$0
$0
$0
$0
$0
$0
$0
$0
Less N
et Expenses
($6,9
85,7
93)
$0
$0
$0
($2,6
23,4
05)
($3,7
41,2
47)
($621,1
41)
$0
Less G
round L
ease E
xpense
$0
$0
$0
$0
$0
$0
$0
$0
Ne
t O
pe
rati
ng
In
co
me
$10,4
08,3
68
$0
$0
$0
$25,7
99
$8,5
62,5
81
$1,8
19,9
88
$0
Less R
eserv
es
($533,0
63)
$0
$0
$0
($185,9
06)
($297,5
63)
($49,5
94)
$0
Less L
oan P
aym
ents
$0
$0
$0
$0
$0
$0
$0
$0
Cas
h F
low
$9,8
75,3
05
$0
$0
$0
($160,1
08)
$8,2
65,0
19
$1,7
70,3
94
$0
CA
PIT
AL
CO
ST
Land C
ost
$20,2
37,0
19
$20,2
37,0
19
$0
$0
$0
$0
$0
$0
Soft
Cost
$24,5
04,6
12
$8,4
62,3
41
$7,3
82,4
99
$4,2
28,0
94
$4,4
31,6
79
$0
$0
$0
Hard
Cost
$104,0
42,3
34
$0
$2,7
14,1
48
$63,5
73,6
93
$37,7
54,4
92
$0
$0
$0
Fin
ance C
ost
$1,7
95,3
06
$0
$0
$828,6
34
$966,6
72
$0
$0
$0
To
tal C
ap
ital C
os
t$150,5
79,2
70
$28,6
99,3
60
$10,0
96,6
47
$68,6
30,4
21
$43,1
52,8
43
$0
$0
$0
FU
ND
ING
Max F
unded
Investo
r Equity
$45,1
73,7
81
$45,1
73,7
81
$28,6
99,3
60
$10,0
96,6
47
$6,3
77,7
75
$0
$0
$0
$0
Sponsor
Equity
$0
$0
$0
$0
$0
$0
$0
$0
$0
Constr
uctio
n L
oan
$105,4
05,4
89
$105,4
05,4
90
$0
$0
$62,2
52,6
46
$43,1
52,8
43
$0
($105,4
05,4
89)
$0
Perm
anent Loan
$0
$0
$0
$0
$0
$0
$0
$0
DIS
PO
SIT
ION
Dis
positi
on
$210,1
70,6
33
$0
$0
$0
$0
$0
$210,1
70,6
33
$0
Pro
ject C
ash F
low
Mo
nth
ly IR
R22.4
6%
($28,6
99,3
60)
($10,0
96,6
47)
($6,3
77,7
75)
$0
$4,5
75,8
27
$105,9
20,6
73
$0
An
nu
al IR
R22.0
0%
NP
V$30,8
22,4
37
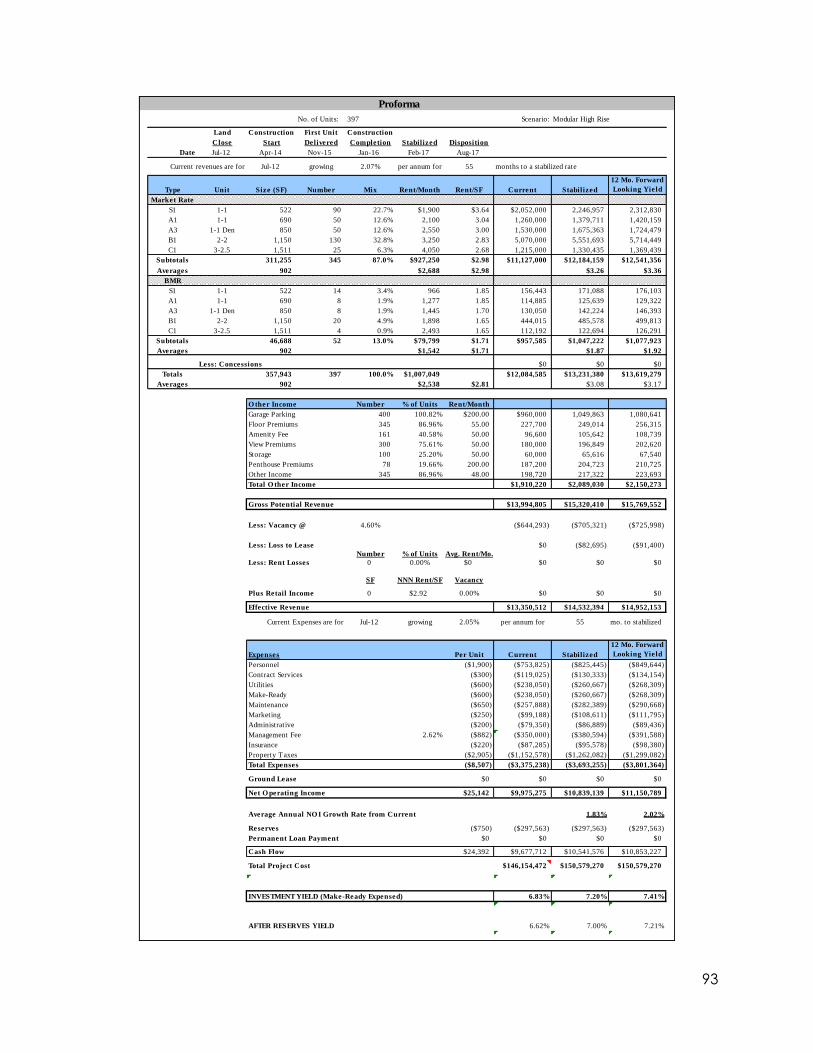
93
Proforma
No. of Units: 397 Scenario: Modular High Rise
Land Construction First Unit Construction
Close Start Delivered Completion Stabilized Disposition
Date Jul-12 Apr-14 Nov-15 Jan-16 Feb-17 Aug-17
Current revenues are for Jul-12 growing 2.07% per annum for 55 months to a stabilized rate
Type Unit Size (SF) Number Mix Rent/Month Rent/SF Current Stabilized
12 Mo. Forward
Looking Yield
Market Rate
S1 1-1 522 90 22.7% $1,900 $3.64 $2,052,000 2,246,957 2,312,830
A1 1-1 690 50 12.6% 2,100 3.04 1,260,000 1,379,711 1,420,159
A3 1-1 Den 850 50 12.6% 2,550 3.00 1,530,000 1,675,363 1,724,479
B1 2-2 1,150 130 32.8% 3,250 2.83 5,070,000 5,551,693 5,714,449
C1 3-2.5 1,511 25 6.3% 4,050 2.68 1,215,000 1,330,435 1,369,439
Subtotals 311,255 345 87.0% $927,250 $2.98 $11,127,000 $12,184,159 $12,541,356
Averages 902 $2,688 $2.98 $3.26 $3.36
BMR
S1 1-1 522 14 3.4% 966 1.85 156,443 171,088 176,103
A1 1-1 690 8 1.9% 1,277 1.85 114,885 125,639 129,322
A3 1-1 Den 850 8 1.9% 1,445 1.70 130,050 142,224 146,393
B1 2-2 1,150 20 4.9% 1,898 1.65 444,015 485,578 499,813
C1 3-2.5 1,511 4 0.9% 2,493 1.65 112,192 122,694 126,291
Subtotals 46,688 52 13.0% $79,799 $1.71 $957,585 $1,047,222 $1,077,923
Averages 902 $1,542 $1.71 $1.87 $1.92
Less: Concessions $0 $0 $0
Totals 357,943 397 100.0% $1,007,049 $12,084,585 $13,231,380 $13,619,279
Averages 902 $2,538 $2.81 $3.08 $3.17
O ther Income Number % of Units Rent/Month
Garage Parking 400 100.82% $200.00 $960,000 1,049,863 1,080,641
Floor Premiums 345 86.96% 55.00 227,700 249,014 256,315
Amenity Fee 161 40.58% 50.00 96,600 105,642 108,739
View Premiums 300 75.61% 50.00 180,000 196,849 202,620
Storage 100 25.20% 50.00 60,000 65,616 67,540
Penthouse Premiums 78 19.66% 200.00 187,200 204,723 210,725
Other Income 345 86.96% 48.00 198,720 217,322 223,693
Total O ther Income $1,910,220 $2,089,030 $2,150,273
Gross Potential Revenue $13,994,805 $15,320,410 $15,769,552
Less: Vacancy @ 4.60% ($644,293) ($705,321) ($725,998)
Less: Loss to Lease $0 ($82,695) ($91,400)
Number % of Units Avg. Rent/Mo.
Less: Rent Losses 0 0.00% $0 $0 $0 $0
SF NNN Rent/SF Vacancy
Plus Retail Income 0 $2.92 0.00% $0 $0 $0
Effective Revenue $13,350,512 $14,532,394 $14,952,153
Current Expenses are for Jul-12 growing 2.05% per annum for 55 mo. to stabilized
Expenses Per Unit Current Stabilized
12 Mo. Forward
Looking Yield
Personnel ($1,900) ($753,825) ($825,445) ($849,644)
Contract Services ($300) ($119,025) ($130,333) ($134,154)
Utilit ies ($600) ($238,050) ($260,667) ($268,309)
Make-Ready ($600) ($238,050) ($260,667) ($268,309)
Maintenance ($650) ($257,888) ($282,389) ($290,668)
Marketing ($250) ($99,188) ($108,611) ($111,795)
Administrative ($200) ($79,350) ($86,889) ($89,436)
Management Fee 2.62% ($882) ($350,000) ($380,594) ($391,588)
Insurance ($220) ($87,285) ($95,578) ($98,380)
Property Taxes ($2,905) ($1,152,578) ($1,262,082) ($1,299,082)
Total Expenses ($8,507) ($3,375,238) ($3,693,255) ($3,801,364)
Ground Lease $0 $0 $0 $0
Net O perating Income $25,142 $9,975,275 $10,839,139 $11,150,789
Average Annual NO I Growth Rate from Current 1.83% 2.02%
Reserves ($750) ($297,563) ($297,563) ($297,563)
Permanent Loan Payment $0 $0 $0 $0
Cash Flow $24,392 $9,677,712 $10,541,576 $10,853,227
Total Project Cost $146,154,472 $150,579,270 $150,579,270
#REF! #REF! #REF! #REF!
INVESTMENT YIELD (Make-Ready Expensed) 6.83% 7.20% 7.41%
INVESTMENT YIELD (After BM Debt & Tax Credits) #REF! #REF! #REF!
AFTER RESERVES YIELD 6.62% 7.00% 7.21%
AFTER RESERVES YIELD (After BM Debt & Tax Credits) #REF! #REF! #REF!
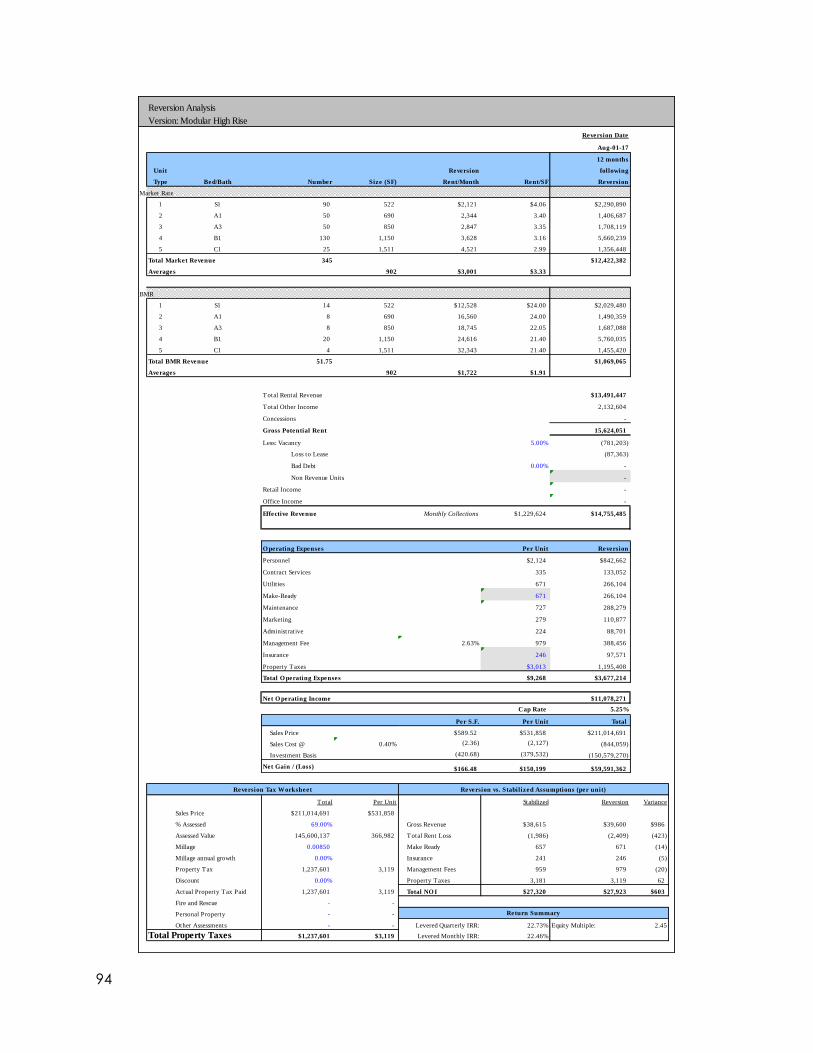
94
Reversion Analysis
Version: Modular High Rise
Reversion Date
Aug-01-17
12 months
Unit Reversion following
Type Bed/Bath Number Size (SF) Rent/Month Rent/SF Reversion
Market Rate
1 S1 90 522 $2,121 $4.06 $2,290,890
2 A1 50 690 2,344 3.40 1,406,687
3 A3 50 850 2,847 3.35 1,708,119
4 B1 130 1,150 3,628 3.16 5,660,239
5 C1 25 1,511 4,521 2.99 1,356,448
Total Market Revenue 345 $12,422,382
Averages 902 $3,001 $3.33
BMR
1 S1 14 522 $12,528 $24.00 $2,029,480
2 A1 8 690 16,560 24.00 1,490,359
3 A3 8 850 18,745 22.05 1,687,088
4 B1 20 1,150 24,616 21.40 5,760,035
5 C1 4 1,511 32,343 21.40 1,455,420
Total BMR Revenue 51.75 $1,069,065
Averages 902 $1,722 $1.91
Total Rental Revenue $13,491,447
Total Other Income 2,132,604
Concessions -
Gross Potential Rent 15,624,051
Less: Vacancy 5.00% (781,203)
Loss to Lease (87,363)
Bad Debt 0.00% -
Non Revenue Units -
Retail Income -
Office Income -
Effective Revenue Monthly Collections $1,229,624 $14,755,485
O perating Expenses Per Unit Reversion
Personnel $2,124 $842,662
Contract Services 335 133,052
Utilit ies 671 266,104
Make-Ready 671 266,104
Maintenance 727 288,279
Marketing 279 110,877
Administrative 224 88,701
Management Fee 2.63% 979 388,456
Insurance 246 97,571
Property Taxes $3,013 1,195,408
Total O perating Expenses $9,268 $3,677,214
Net O perating Income $11,078,271
Cap Rate 5.25%
Per S.F. Per Unit Total
Sales Price $589.52 $531,858 $211,014,691
Sales Cost @ 0.40% (2.36) (2,127) (844,059)
Investment Basis (420.68) (379,532) (150,579,270)
Net Gain / (Loss) $166.48 $150,199 $59,591,362
Total Per Unit Stabilized Reversion Variance
Sales Price $211,014,691 $531,858
% Assessed 69.00% Gross Revenue $38,615 $39,600 $986
Assessed Value 145,600,137 366,982 Total Rent Loss (1,986) (2,409) (423)
Millage 0.00850 Make Ready 657 671 (14)
Millage annual growth 0.00% Insurance 241 246 (5)
Property Tax 1,237,601 3,119 Management Fees 959 979 (20)
Discount 0.00% Property Taxes 3,181 3,119 62
Actual Property Tax Paid 1,237,601 3,119 Total NO I $27,320 $27,923 $603
Fire and Rescue - -
Personal Property - -
Other Assessments - - Levered Quarterly IRR: 22.73% Equity Multiple: 2.45
Total Property Taxes $1,237,601 $3,119 Levered Monthly IRR: 22.46%
Reversion Tax Worksheet Reversion vs. Stabilized Assumptions (per unit)
Return Summary
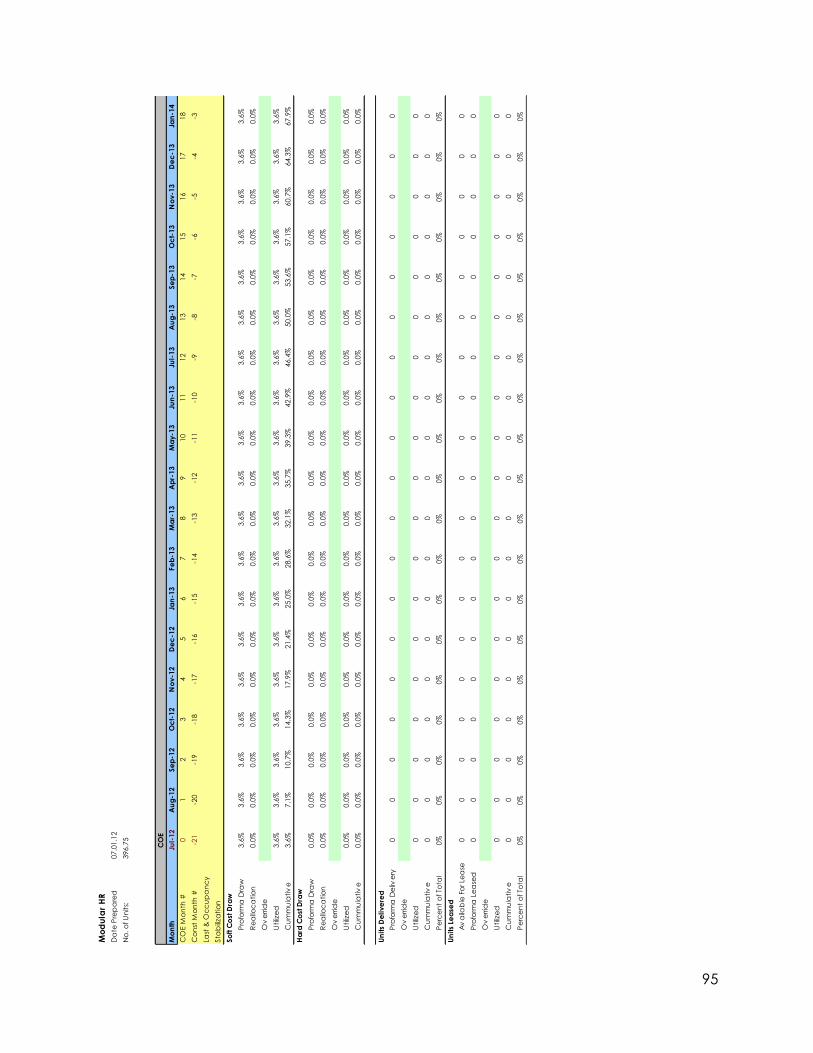
95
Mo
du
lar
HR
Da
te P
rep
are
d07.0
1.1
2
No
. o
f U
nits:
396.7
5
CO
E
Mo
nth
Jul-
12
Au
g-1
2Se
p-1
2O
ct-
12
No
v-1
2D
ec
-12
Jan
-13
Fe
b-1
3M
ar-
13
Ap
r-13
Ma
y-1
3Ju
n-1
3Ju
l-13
Au
g-1
3Se
p-1
3O
ct-
13
No
v-1
3D
ec
-13
Jan
-14
CO
E M
on
th #
01
23
45
67
89
10
11
12
13
14
15
16
17
18
Co
nst
Mo
nth
#-2
1-2
0-1
9-1
8-1
7-1
6-1
5-1
4-1
3-1
2-1
1-1
0-9
-8-7
-6-5
-4-3
Last
& O
cc
up
an
cy
Sta
biliza
tio
n
So
ft C
ost
Dra
w
Pro
form
a D
raw
3.6
%3.6
%3.6
%3.6
%3.6
%3.6
%3.6
%3.6
%3.6
%3.6
%3.6
%3.6
%3.6
%3.6
%3.6
%3.6
%3.6
%3.6
%3.6
%
Re
allo
ca
tio
n0.0
%0.0
%0.0
%0.0
%0.0
%0.0
%0.0
%0.0
%0.0
%0.0
%0.0
%0.0
%0.0
%0.0
%0.0
%0.0
%0.0
%0.0
%0.0
%
Ov
errid
e
Utiliz
ed
3.6
%3.6
%3.6
%3.6
%3.6
%3.6
%3.6
%3.6
%3.6
%3.6
%3.6
%3.6
%3.6
%3.6
%3.6
%3.6
%3.6
%3.6
%3.6
%
Cu
mm
ula
tiv
e3.6
%7.1
%10.7
%14.3
%17.9
%21.4
%25.0
%28.6
%32.1
%35.7
%39.3
%42.9
%46.4
%50.0
%53.6
%57.1
%60.7
%64.3
%67.9
%
Ha
rd C
ost
Dra
w
Pro
form
a D
raw
0.0
%0.0
%0.0
%0.0
%0.0
%0.0
%0.0
%0.0
%0.0
%0.0
%0.0
%0.0
%0.0
%0.0
%0.0
%0.0
%0.0
%0.0
%0.0
%
Re
allo
ca
tio
n0.0
%0.0
%0.0
%0.0
%0.0
%0.0
%0.0
%0.0
%0.0
%0.0
%0.0
%0.0
%0.0
%0.0
%0.0
%0.0
%0.0
%0.0
%0.0
%
Ov
errid
e
Utiliz
ed
0.0
%0.0
%0.0
%0.0
%0.0
%0.0
%0.0
%0.0
%0.0
%0.0
%0.0
%0.0
%0.0
%0.0
%0.0
%0.0
%0.0
%0.0
%0.0
%
Cu
mm
ula
tiv
e0.0
%0.0
%0.0
%0.0
%0.0
%0.0
%0.0
%0.0
%0.0
%0.0
%0.0
%0.0
%0.0
%0.0
%0.0
%0.0
%0.0
%0.0
%0.0
%
Un
its
De
live
red
Pro
form
a D
eliv
ery
00
00
00
00
00
00
00
00
00
0
Ov
errid
e
Utiliz
ed
00
00
00
00
00
00
00
00
00
0
Cu
mm
ula
tiv
e0
00
00
00
00
00
00
00
00
00
Pe
rce
nt
of To
tal
0%
0%
0%
0%
0%
0%
0%
0%
0%
0%
0%
0%
0%
0%
0%
0%
0%
0%
0%
Un
its
Lea
sed
Av
aila
ble
Fo
r Le
ase
00
00
00
00
00
00
00
00
00
0
Pro
form
a L
ea
sed
00
00
00
00
00
00
00
00
00
0
Ov
errid
e
Utiliz
ed
00
00
00
00
00
00
00
00
00
0
Cu
mm
ula
tiv
e0
00
00
00
00
00
00
00
00
00
Pe
rce
nt
of To
tal
0%
0%
0%
0%
0%
0%
0%
0%
0%
0%
0%
0%
0%
0%
0%
0%
0%
0%
0%
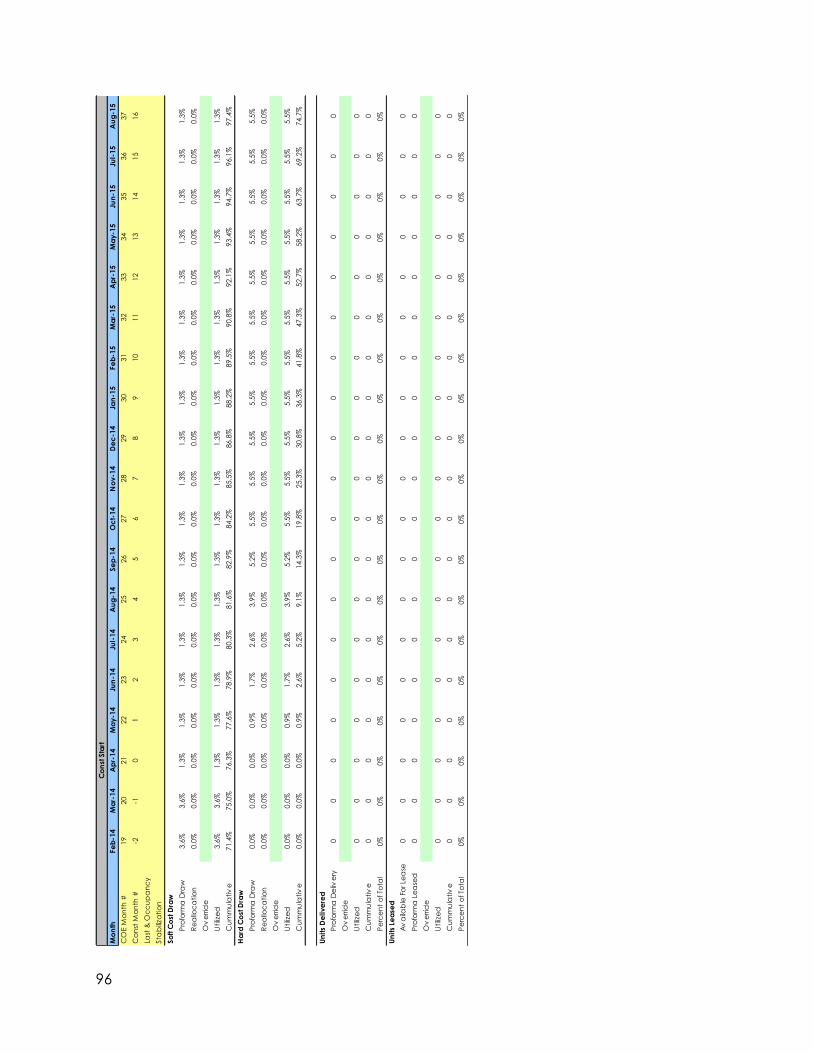
96
Co
nst
Sta
rt
Mo
nth
Fe
b-1
4M
ar-
14
Ap
r-14
Ma
y-1
4Ju
n-1
4Ju
l-14
Au
g-1
4Se
p-1
4O
ct-
14
No
v-1
4D
ec
-14
Jan
-15
Fe
b-1
5M
ar-
15
Ap
r-15
Ma
y-1
5Ju
n-1
5Ju
l-15
Au
g-1
5
CO
E M
on
th #
19
20
21
22
23
24
25
26
27
28
29
30
31
32
33
34
35
36
37
Co
nst
Mo
nth
#-2
-10
12
34
56
78
910
11
12
13
14
15
16
Last
& O
cc
up
an
cy
Sta
biliza
tio
n
So
ft C
ost
Dra
w
Pro
form
a D
raw
3.6
%3.6
%1.3
%1.3
%1.3
%1.3
%1.3
%1.3
%1.3
%1.3
%1.3
%1.3
%1.3
%1.3
%1.3
%1.3
%1.3
%1.3
%1.3
%
Re
allo
ca
tio
n0.0
%0.0
%0.0
%0.0
%0.0
%0.0
%0.0
%0.0
%0.0
%0.0
%0.0
%0.0
%0.0
%0.0
%0.0
%0.0
%0.0
%0.0
%0.0
%
Ov
errid
e
Utiliz
ed
3.6
%3.6
%1.3
%1.3
%1.3
%1.3
%1.3
%1.3
%1.3
%1.3
%1.3
%1.3
%1.3
%1.3
%1.3
%1.3
%1.3
%1.3
%1.3
%
Cu
mm
ula
tiv
e71.4
%75.0
%76.3
%77.6
%78.9
%80.3
%81.6
%82.9
%84.2
%85.5
%86.8
%88.2
%89.5
%90.8
%92.1
%93.4
%94.7
%96.1
%97.4
%
Ha
rd C
ost
Dra
w
Pro
form
a D
raw
0.0
%0.0
%0.0
%0.9
%1.7
%2.6
%3.9
%5.2
%5.5
%5.5
%5.5
%5.5
%5.5
%5.5
%5.5
%5.5
%5.5
%5.5
%5.5
%
Re
allo
ca
tio
n0.0
%0.0
%0.0
%0.0
%0.0
%0.0
%0.0
%0.0
%0.0
%0.0
%0.0
%0.0
%0.0
%0.0
%0.0
%0.0
%0.0
%0.0
%0.0
%
Ov
errid
e
Utiliz
ed
0.0
%0.0
%0.0
%0.9
%1.7
%2.6
%3.9
%5.2
%5.5
%5.5
%5.5
%5.5
%5.5
%5.5
%5.5
%5.5
%5.5
%5.5
%5.5
%
Cu
mm
ula
tiv
e0.0
%0.0
%0.0
%0.9
%2.6
%5.2
%9.1
%14.3
%19.8
%25.3
%30.8
%36.3
%41.8
%47.3
%52.7
%58.2
%63.7
%69.2
%74.7
%
Un
its
De
live
red
Pro
form
a D
eliv
ery
00
00
00
00
00
00
00
00
00
0
Ov
errid
e
Utiliz
ed
00
00
00
00
00
00
00
00
00
0
Cu
mm
ula
tiv
e0
00
00
00
00
00
00
00
00
00
Pe
rce
nt
of To
tal
0%
0%
0%
0%
0%
0%
0%
0%
0%
0%
0%
0%
0%
0%
0%
0%
0%
0%
0%
Un
its
Lea
sed
Av
aila
ble
Fo
r Le
ase
00
00
00
00
00
00
00
00
00
0
Pro
form
a L
ea
sed
00
00
00
00
00
00
00
00
00
0
Ov
errid
e
Utiliz
ed
00
00
00
00
00
00
00
00
00
0
Cu
mm
ula
tiv
e0
00
00
00
00
00
00
00
00
00
Pe
rce
nt
of To
tal
0%
0%
0%
0%
0%
0%
0%
0%
0%
0%
0%
0%
0%
0%
0%
0%
0%
0%
0%
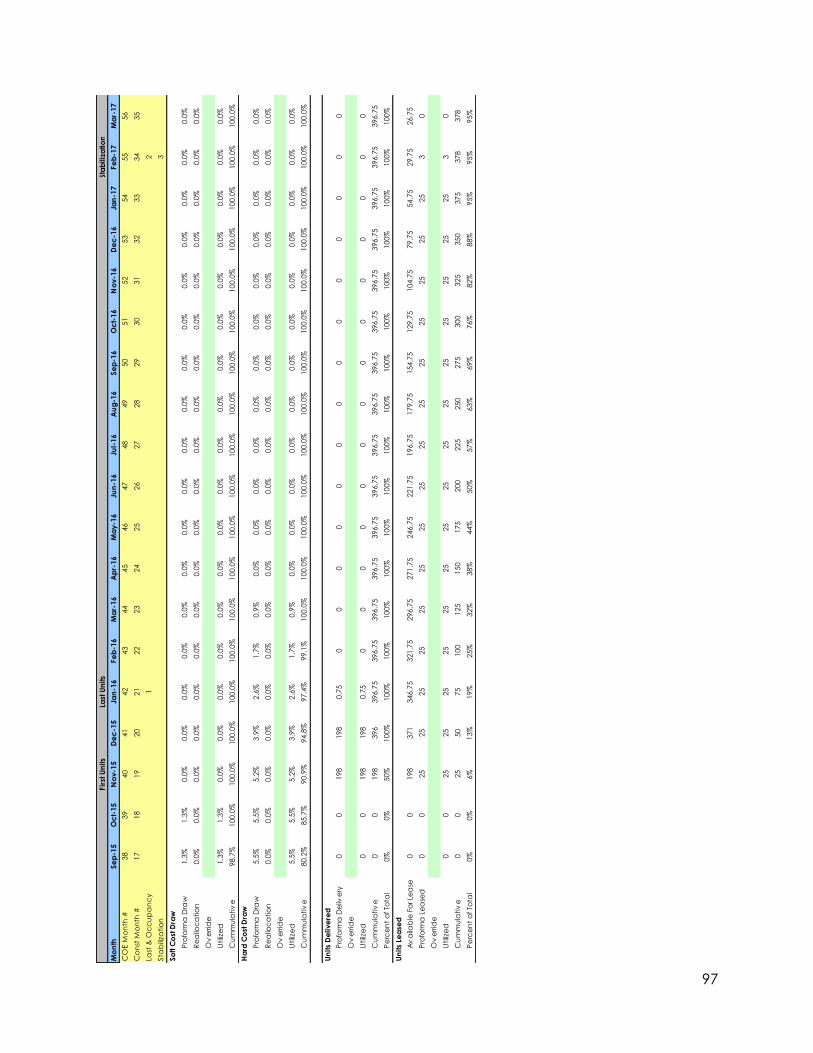
97
Fir
st U
nits
Last
Un
its
Sta
biliz
atio
n
Mo
nth
Se
p-1
5O
ct-
15
No
v-1
5D
ec
-15
Jan
-16
Fe
b-1
6M
ar-
16
Ap
r-16
Ma
y-1
6Ju
n-1
6Ju
l-16
Au
g-1
6Se
p-1
6O
ct-
16
No
v-1
6D
ec
-16
Jan
-17
Fe
b-1
7M
ar-
17
CO
E M
on
th #
38
39
40
41
42
43
44
45
46
47
48
49
50
51
52
53
54
55
56
Co
nst
Mo
nth
#17
18
19
20
21
22
23
24
25
26
27
28
29
30
31
32
33
34
35
Last
& O
cc
up
an
cy
12
Sta
biliza
tio
n3
So
ft C
ost
Dra
w
Pro
form
a D
raw
1.3
%1.3
%0.0
%0.0
%0.0
%0.0
%0.0
%0.0
%0.0
%0.0
%0.0
%0.0
%0.0
%0.0
%0.0
%0.0
%0.0
%0.0
%0.0
%
Re
allo
ca
tio
n0.0
%0.0
%0.0
%0.0
%0.0
%0.0
%0.0
%0.0
%0.0
%0.0
%0.0
%0.0
%0.0
%0.0
%0.0
%0.0
%0.0
%0.0
%0.0
%
Ov
errid
e
Utiliz
ed
1.3
%1.3
%0.0
%0.0
%0.0
%0.0
%0.0
%0.0
%0.0
%0.0
%0.0
%0.0
%0.0
%0.0
%0.0
%0.0
%0.0
%0.0
%0.0
%
Cu
mm
ula
tiv
e98.7
%100.0
%100.0
%100.0
%100.0
%100.0
%100.0
%100.0
%100.0
%100.0
%100.0
%100.0
%100.0
%100.0
%100.0
%100.0
%100.0
%100.0
%100.0
%
Ha
rd C
ost
Dra
w
Pro
form
a D
raw
5.5
%5.5
%5.2
%3.9
%2.6
%1.7
%0.9
%0.0
%0.0
%0.0
%0.0
%0.0
%0.0
%0.0
%0.0
%0.0
%0.0
%0.0
%0.0
%
Re
allo
ca
tio
n0.0
%0.0
%0.0
%0.0
%0.0
%0.0
%0.0
%0.0
%0.0
%0.0
%0.0
%0.0
%0.0
%0.0
%0.0
%0.0
%0.0
%0.0
%0.0
%
Ov
errid
e
Utiliz
ed
5.5
%5.5
%5.2
%3.9
%2.6
%1.7
%0.9
%0.0
%0.0
%0.0
%0.0
%0.0
%0.0
%0.0
%0.0
%0.0
%0.0
%0.0
%0.0
%
Cu
mm
ula
tiv
e80.2
%85.7
%90.9
%94.8
%97.4
%99.1
%100.0
%100.0
%100.0
%100.0
%100.0
%100.0
%100.0
%100.0
%100.0
%100.0
%100.0
%100.0
%100.0
%
Un
its
De
live
red
Pro
form
a D
eliv
ery
00
198
198
0.7
50
00
00
00
00
00
00
0
Ov
errid
e
Utiliz
ed
00
198
198
0.7
50
00
00
00
00
00
00
0
Cu
mm
ula
tiv
e0
0198
396
396.7
5396.7
5396.7
5396.7
5396.7
5396.7
5396.7
5396.7
5396.7
5396.7
5396.7
5396.7
5396.7
5396.7
5396.7
5
Pe
rce
nt
of To
tal
0%
0%
50%
100%
100%
100%
100%
100%
100%
100%
100%
100%
100%
100%
100%
100%
100%
100%
100%
Un
its
Lea
sed
Av
aila
ble
Fo
r Le
ase
00
198
371
346.7
5321.7
5296.7
5271.7
5246.7
5221.7
5196.7
5179.7
5154.7
5129.7
5104.7
579.7
554.7
529.7
526.7
5
Pro
form
a L
ea
sed
00
25
25
25
25
25
25
25
25
25
25
25
25
25
25
25
30
Ov
errid
e
Utiliz
ed
00
25
25
25
25
25
25
25
25
25
25
25
25
25
25
25
30
Cu
mm
ula
tiv
e0
025
50
75
100
125
150
175
200
225
250
275
300
325
350
375
378
378
Pe
rce
nt
of To
tal
0%
0%
6%
13%
19%
25%
32%
38%
44%
50%
57%
63%
69%
76%
82%
88%
95%
95%
95%
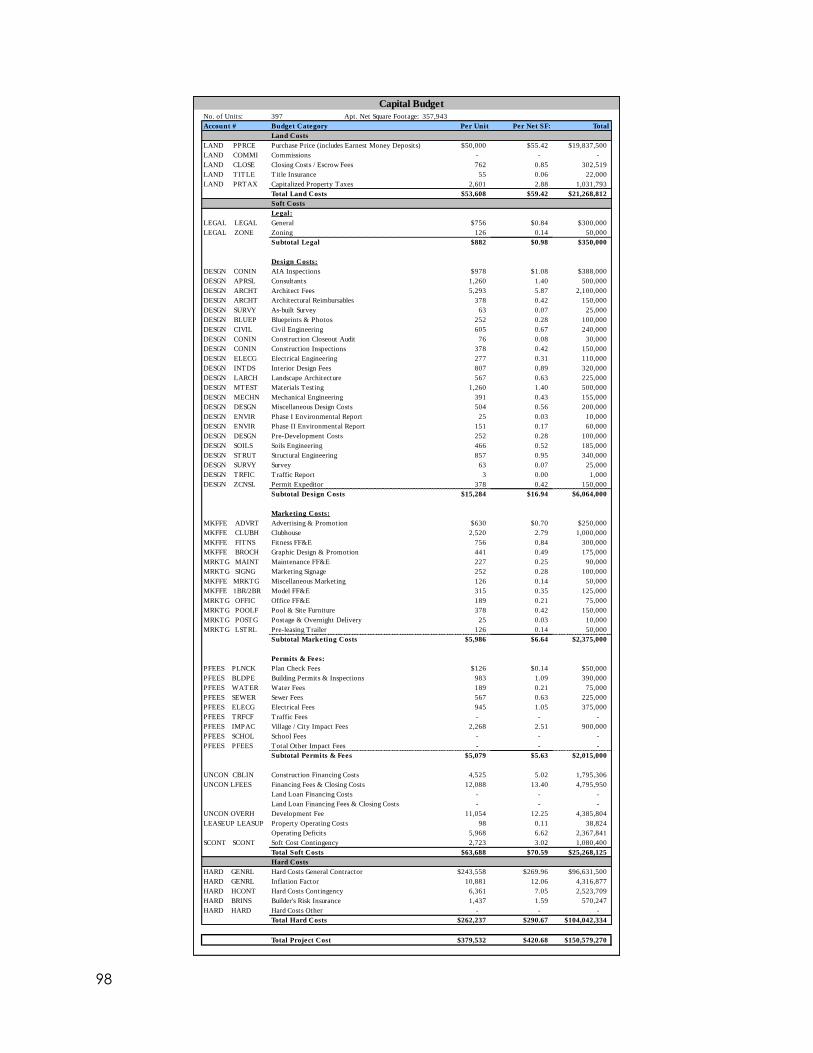
98
Capital Budget
No. of Units: 397 Apt. Net Square Footage:
Account # Budget Category Per Unit Per Net SF: Total
Land Costs
LAND PPRCE Purchase Price (includes Earnest Money Deposits) $50,000 $55.42 $19,837,500
LAND COMMI Commissions - - -
LAND CLOSE Closing Costs / Escrow Fees 762 0.85 302,519
LAND TITLE Title Insurance 55 0.06 22,000
LAND PRTAX Capitalized Property Taxes 2,601 2.88 1,031,793
Total Land Costs $53,608 $59.42 $21,268,812
Soft Costs
Legal:
LEGAL LEGAL General $756 $0.84 $300,000
LEGAL ZONE Zoning 126 0.14 50,000
Subtotal Legal $882 $0.98 $350,000
Design Costs:
DESGN CONIN AIA Inspections $978 $1.08 $388,000
DESGN APRSL Consultants 1,260 1.40 500,000
DESGN ARCHT Architect Fees 5,293 5.87 2,100,000
DESGN ARCHT Architectural Reimbursables 378 0.42 150,000
DESGN SURVY As-built Survey 63 0.07 25,000
DESGN BLUEP Blueprints & Photos 252 0.28 100,000
DESGN CIVIL Civil Engineering 605 0.67 240,000
DESGN CONIN Construction Closeout Audit 76 0.08 30,000
DESGN CONIN Construction Inspections 378 0.42 150,000
DESGN ELECG Electrical Engineering 277 0.31 110,000
DESGN INTDS Interior Design Fees 807 0.89 320,000
DESGN LARCH Landscape Architecture 567 0.63 225,000
DESGN MTEST Materials Testing 1,260 1.40 500,000
DESGN MECHN Mechanical Engineering 391 0.43 155,000
DESGN DESGN Miscellaneous Design Costs 504 0.56 200,000
DESGN ENVIR Phase I Environmental Report 25 0.03 10,000
DESGN ENVIR Phase II Environmental Report 151 0.17 60,000
DESGN DESGN Pre-Development Costs 252 0.28 100,000
DESGN SOILS Soils Engineering 466 0.52 185,000
DESGN STRUT Structural Engineering 857 0.95 340,000
DESGN SURVY Survey 63 0.07 25,000
DESGN TRFIC Traffic Report 3 0.00 1,000
DESGN ZCNSL Permit Expeditor 378 0.42 150,000
Subtotal Design Costs $15,284 $16.94 $6,064,000
Marketing Costs:
MKFFE ADVRT Advertising & Promotion $630 $0.70 $250,000
MKFFE CLUBH Clubhouse 2,520 2.79 1,000,000
MKFFE FITNS Fitness FF&E 756 0.84 300,000
MKFFE BROCH Graphic Design & Promotion 441 0.49 175,000
MRKTG MAINT Maintenance FF&E 227 0.25 90,000
MRKTG SIGNG Marketing Signage 252 0.28 100,000
MKFFE MRKTG Miscellaneous Marketing 126 0.14 50,000
MKFFE 1BR/2BR Model FF&E 315 0.35 125,000
MRKTG OFFIC Office FF&E 189 0.21 75,000
MRKTG POOLF Pool & Site Furniture 378 0.42 150,000
MRKTG POSTG Postage & Overnight Delivery 25 0.03 10,000
MRKTG LSTRL Pre-leasing Trailer 126 0.14 50,000
Subtotal Marketing Costs $5,986 $6.64 $2,375,000
Permits & Fees:
PFEES PLNCK Plan Check Fees $126 $0.14 $50,000
PFEES BLDPE Building Permits & Inspections 983 1.09 390,000
PFEES WATER Water Fees 189 0.21 75,000
PFEES SEWER Sewer Fees 567 0.63 225,000
PFEES ELECG Electrical Fees 945 1.05 375,000
PFEES TRFCF Traffic Fees - - -
PFEES IMPAC Village / City Impact Fees 2,268 2.51 900,000
PFEES SCHOL School Fees - - -
PFEES PFEES Total Other Impact Fees - - -
Subtotal Permits & Fees $5,079 $5.63 $2,015,000
UNCON CBLIN Construction Financing Costs 4,525 5.02 1,795,306
UNCON LFEES Financing Fees & Closing Costs 12,088 13.40 4,795,950
Land Loan Financing Costs - - -
Land Loan Financing Fees & Closing Costs - - -
UNCON OVERH Development Fee 11,054 12.25 4,385,804
LEASEUP LEASUP Property Operating Costs 98 0.11 38,824
Operating Deficits 5,968 6.62 2,367,841
SCONT SCONT Soft Cost Contingency 2,723 3.02 1,080,400
Total Soft Costs $63,688 $70.59 $25,268,125
Hard Costs
HARD GENRL Hard Costs General Contractor $243,558 $269.96 $96,631,500
HARD GENRL Inflation Factor 10,881 12.06 4,316,877
HARD HCONT Hard Costs Contingency 6,361 7.05 2,523,709
HARD BRINS Builder's Risk Insurance 1,437 1.59 570,247
HARD HARD Hard Costs Other - - -
Total Hard Costs $262,237 $290.67 $104,042,334
Total Project Cost $379,532 $420.68 $150,579,270
357,943
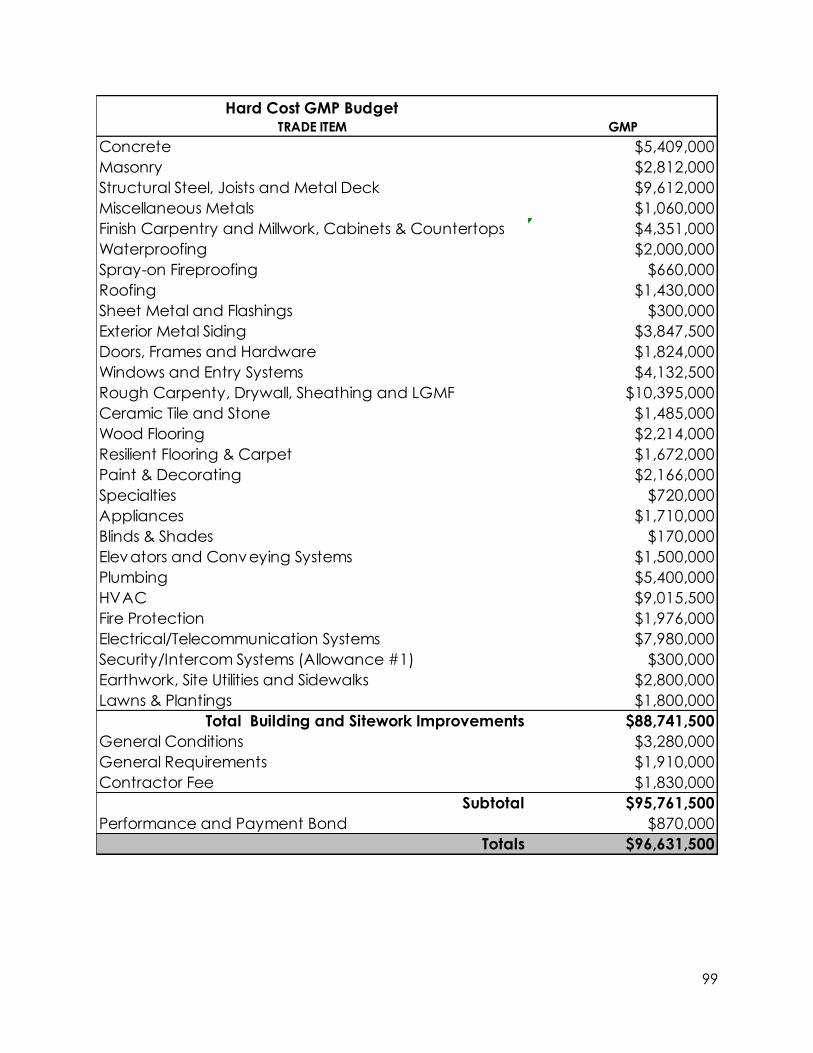
99
Hard Cost GMP BudgetTRADE ITEM GMP
Concrete $5,409,000
Masonry $2,812,000
Structural Steel, Joists and Metal Deck $9,612,000
Miscellaneous Metals $1,060,000
Finish Carpentry and Millwork, Cabinets & Countertops $4,351,000
Waterproofing $2,000,000
Spray-on Fireproofing $660,000
Roofing $1,430,000
Sheet Metal and Flashings $300,000
Exterior Metal Siding $3,847,500
Doors, Frames and Hardware $1,824,000
Windows and Entry Systems $4,132,500
Rough Carpenty, Drywall, Sheathing and LGMF $10,395,000
Ceramic Tile and Stone $1,485,000
Wood Flooring $2,214,000
Resilient Flooring & Carpet $1,672,000
Paint & Decorating $2,166,000
Specialties $720,000
Appliances $1,710,000
Blinds & Shades $170,000
Elevators and Conveying Systems $1,500,000
Plumbing $5,400,000
HVAC $9,015,500
Fire Protection $1,976,000
Electrical/Telecommunication Systems $7,980,000
Security/Intercom Systems (Allowance #1) $300,000
Earthwork, Site Utilities and Sidewalks $2,800,000
Lawns & Plantings $1,800,000
Total Building and Sitework Improvements $88,741,500
General Conditions $3,280,000
General Requirements $1,910,000
Contractor Fee $1,830,000
Subtotal $95,761,500
Performance and Payment Bond $870,000
Totals $96,631,500
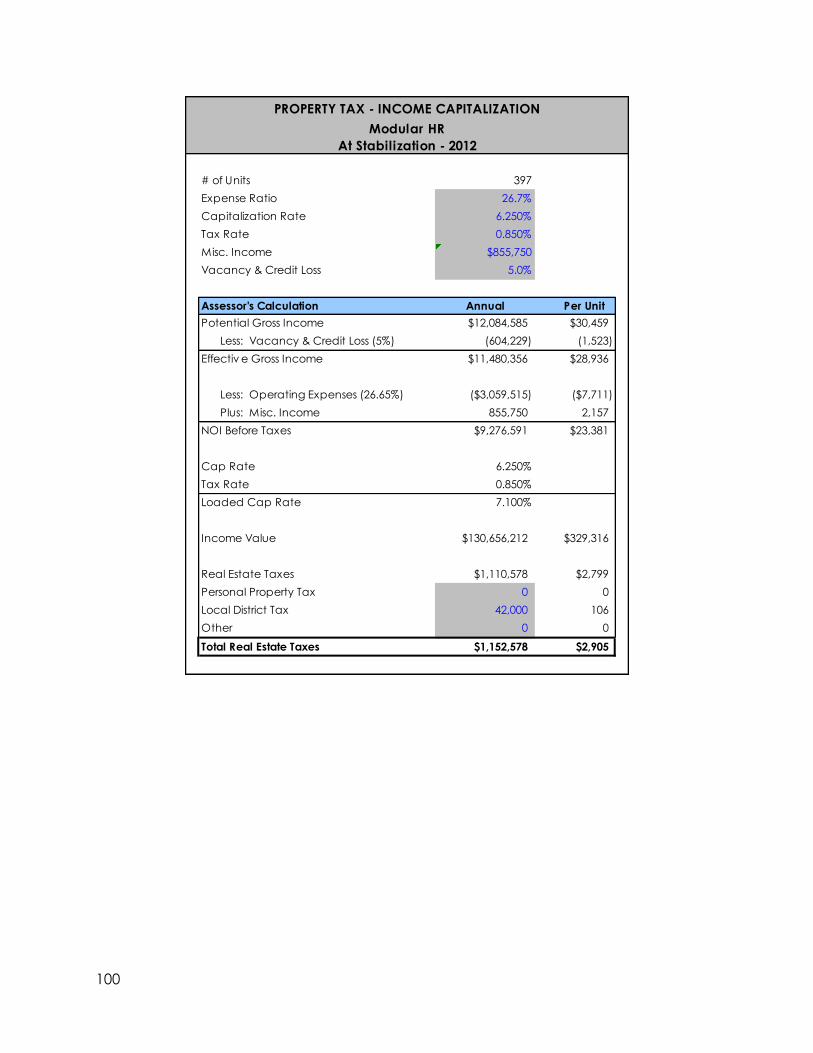
100
PROPERTY TAX - INCOME CAPITALIZATION
Modular HR
At Stabilization - 2012
# of Units 397
Expense Ratio 26.7%
Capitalization Rate 6.250%
Tax Rate 0.850%
Misc. Income $855,750
Vacancy & Credit Loss 5.0%
Assessor's Calculation Annual Per Unit
Potential Gross Income $12,084,585 $30,459
Less: Vacancy & Credit Loss (5%) (604,229) (1,523)
Effectiv e Gross Income $11,480,356 $28,936
Less: Operating Expenses (26.65%) ($3,059,515) ($7,711)
Plus: Misc. Income 855,750 2,157
NOI Before Taxes $9,276,591 $23,381
Cap Rate 6.250%
Tax Rate 0.850%
Loaded Cap Rate 7.100%
Income Value $130,656,212 $329,316
Real Estate Taxes $1,110,578 $2,799
Personal Property Tax 0 0
Local District Tax 42,000 106
Other 0 0
Total Real Estate Taxes $1,152,578 $2,905
101
Bibliography AMA Research. (2007). Current Practices and Future Potential in Modern Methods of
Construction. Banury, UK: WRAP.
Bagli, C. (2011, March 16). Prefabricated Tower May Rise at Brooklyn's Altantic Yards.
New York Times.
Baldwin, A. (2009). Designing out waste in high rise residential buildings. Renewable
Energy, 2067-2073.
Bock, T. (2007). Construction robotics. Auton Robot, 201-209.
Carlo, C. &. (2007). Piecing Together Modular: Understanding the Benefits and
Limitations of Modular Construction Methods for Multifamily Development.
Cambridge, MA: MIT.
Cassidy, R. (2008, January 1). Modular Prototype: IKEA Meets iPod. Building Design &
Construction, p. 39.
Hardiman, T. (2008, January 1). Dispelling the Myths of Modular Construction. Buidings,
p. 24.
Hardiman, T. (2012, July 26). Executive Director. (S. Velamati, Interviewer)
Hong Kong Polytechnic Institute. (2012, May 12). Modular Construction. Retrieved from
cse.polyu.edu.hk/~cescpoon/lwbt/modular/modular.htm
Kalette, D. (2009, September 21). With High-Rise Debut, Modular Construction is Poised
to Take-Off. National Real Estate Investor.
Kastenbaum, S. (2011, March 28). Modular Construction: The Future of High-Rise
Building? And what about the Jobs? Retrieved May 21, 2012, from
thinkwingradio.com.
Kobet, R. (2009). Modular Building and the USGBC's LEED. Charlottesville, VA: Modular
Building Institute.
Lawson, R. M. (2009). Modular Design for High Rise Buildings. Structures and Buildings,
151-164.
Lawson, R. M. (2011). Application of Modular Construction in High-Rise Buildings. Journal
of Architectural Engineering, 148-154.
Manufacturer, C. M. (2012, July). Senior Management. (S. Velamati, Interviewer)
102
McGraw Hill Construction. (2011). Prefabrication and Modularization: Increasing
Productivity in the Construction Industry. Bedford, MA.
Modular Building Institute. (2007). 21-Story Modular Hotel Raised the Roof for Texas World
Fair in 1968. Retrieved July 17, 2012, from modular.org: modular.org
Modular Building Institute. (2010). O'Connell East Architects Design 25-story modular.
Commerical Modular eMagazine.
Modular Building Institute. (2011). Permanent Modular Construction Annual Report.
Morton, J. (2011, December 1). Going to Pieces Over Modular Construction. Buildings,
pp. 28-32.
New York City Housing Development Corporation. (2012). Atlantic Yards B2 Fact Sheet
July 2012. New York City.
Steel Construction Institute. (2011). Modular Building Rises High in Wembley. Ascot, UK.