Feasibility Analysis on Electric Energy Saving Methods … · Feasibility Analysis on Electric...
64
04/25/2013 Worcester Polytechnic Institute Peng Ren, Tianci Zhao 1 Feasibility Analysis on Electric Energy Saving Methods An Interactive Qualifying Project Report Submitted to the faculty Of the WORCESTER POLYTECHNIC INSTITUTE In partial fulfillment of the requirements for the Degree of Bachelor of Science By ____________________________ Peng Ren _____________________________ Tianci Zhao Date: ____________________________ Professor Alexander E. Emanuel
Transcript of Feasibility Analysis on Electric Energy Saving Methods … · Feasibility Analysis on Electric...
04/25/2013 Worcester Polytechnic Institute Peng Ren, Tianci Zhao
1
Feasibility Analysis on Electric Energy Saving Methods
An Interactive Qualifying Project Report
Submitted to the faculty
Of the
WORCESTER POLYTECHNIC INSTITUTE
In partial fulfillment of the requirements for the
Degree of Bachelor of Science
By
____________________________ Peng Ren
_____________________________
Tianci Zhao
Date:
____________________________
Professor Alexander E. Emanuel

04/25/2013 Worcester Polytechnic Institute Peng Ren, Tianci Zhao
2
Abstract
This project addresses the feasibility of two basic methods for saving electric energy. The goal of
the works is to determine the viability of motion detector and remote controller of air-conditioner
to reserve electric energy. After calculation and analysis, it was learned that for building with
good thermally insulation, the intermittent on/off operation on air-conditioner could result in
about 50% reduction on the consumption of electric energy; similarly, installation of motion
sensor in places demanding for great electric lighting would assist people in saving electric cost
in less than 3 years. In conclusion, the paybacks of both of the methods are desirable, which
indicates the worthiness of investment on these two means of saving electric energy.

04/25/2013 Worcester Polytechnic Institute Peng Ren, Tianci Zhao
3
Index Abstract ........................................................................................................................ 2
Chapter 1 Executive Summary ......................................................................................... 7
1.1 Introduction ....................................................................................................................... 7
1.2 Background ........................................................................................................................ 8
1.3 Project Statement ............................................................................................................... 8
1.4 Methods ............................................................................................................................. 9
Chapter 2: Background .................................................................................................. 12
2.1 Introduction ..................................................................................................................... 12
2.2 Types of Lighting ............................................................................................................ 15
2.3 Standards of Lighting ...................................................................................................... 16
2.4 Usage of Motion Sensor .................................................................................................. 18
Chapter 3 Method of Motion Sensor ................................................................................ 20
3.1 Introduction ..................................................................................................................... 20
3.2 Physical Condition Influence........................................................................................... 20
3.3 Light Type Influence ....................................................................................................... 22
3.4 Motion Sensor Type Influence ........................................................................................ 23
3.5 Calculation ....................................................................................................................... 25
3.5.1 Calculation with Motion Sensor ................................................................................... 26
3.5.2 Calculation with Motion Sensor ................................................................................... 27
3.5.3 Calculation of Daily Cost Saved by Motion Sensor in AK116 .................................... 29
3.6 Relationship between Daily Money Saved and Variables ............................................... 30
Conclusion: ............................................................................................................................ 34
3.7 Calculation: ...................................................................................................................... 34
Chapter 4 .................................................................................................................... 36
04/25/2013 Worcester Polytechnic Institute Peng Ren, Tianci Zhao
4
Feasibility Analysis On Remote AC Intermittent Operation Controller ................................. 36
4.1 Introduction ..................................................................................................................... 36
4.2 Methodology .................................................................................................................... 37
4.3 Physical Factors ............................................................................................................... 39
4.4 Feasibility Analysis Calculation ...................................................................................... 40
Calculation ............................................................................................................................. 40
Conclusion ............................................................................................................................. 42
4.5 Insulation Influence ......................................................................................................... 42
4.6 Central Air-Conditioner Analysis .................................................................................... 43
4.7 Feasibility Analysis Calculation ...................................................................................... 46
4.8 Circuit Method ................................................................................................................. 49
4.9 Social Implication ............................................................................................................ 54
Reference .................................................................................................................... 56
Appendices .................................................................................................................. 57
A-3 Survey About Air-conditioning Control Method For American Students ........................ 62

04/25/2013 Worcester Polytechnic Institute Peng Ren, Tianci Zhao
5
Index for Graphs and Figures
Table1.1-Energy consumption of Atwater Kent without motion sensor on kWh per day basis ..................................................................................................................... 9
Table1.2-Energy consumption of apartment on weekdays on kWh per day basis .. 10
Table1.3-Energy consumption of apartment on weekends on kWh per day basis .. 10
Figure 2.1.1: temperature and electricity consumption ........................................... 13
Figure 2.1.2 .............................................................................................................. 14
Figure 2.2.1 .............................................................................................................. 15
Figure 2.2.2 .............................................................................................................. 16
Table 2.3.1 ................................................................................................................ 17
Table 2.4.1 ................................................................................................................ 19
Figure 3.2.1(Atwater Kent First Floor Layout) ....................................................... 21
Figure 3.3.1 .............................................................................................................. 22
Table 3.3.1 (Light Type Table) ................................................................................ 23
Table 3.3.2 (Motion Sensor Information Table) ...................................................... 25
AK First Floor Lights Energy Consumption And Cost Table Without Motion Sensor ....................................................................................................................... 26
Table 3.5.2(AK First Floor Light Energy Cost Table with Motion Sensor) ........... 27
Table 3.6.1 (Relationship Between AK First Floor Daily Lights Energy Cost With Changes in Light-On Time) ..................................................................................... 30
Figure 3.6.1(Curve Graph of Relationship Between AK First Floor Daily Lights Energy Cost With Changes in Light-On Time) ....................................................... 31
Table 3.6.2 (Relationship Between AK First Floor Daily Lights Energy Cost With Changes in Light Number) ....................................................................................... 32

04/25/2013 Worcester Polytechnic Institute Peng Ren, Tianci Zhao
6
Figure 3.6.3(Curve Graph of Relationship Between AK First Floor Daily Lights Energy Cost With Changes in Light Number) ......................................................... 32
Table 3.6.4(Relationship Between AK First Floor Daily Lights Energy Cost With Changes in Light Load) ........................................................................................... 33
Figure 3.6.5 (Curve Graph of Relationship Between AK First Floor Daily Lights Energy Cost With Changes in Light Load) ............................................................. 33
Figure 3.7.1 (Curve Graph Presentation of Break Even Time of Motion Sensor Cost and its Saving) ................................................................................................. 35
Figure 4.1.1(Typical Air-Conditioners) ................................................................... 36
Figure 4.2.1(Circuit Graph of AC Cycling Operation) ............................................ 38
Table 4.4.1(Common Air-Conditioner Info Table) ................................................. 40
Table 4.5.1(AC Controller Price Limit with Changes In Room Insulation) ........... 43
Figure 4.6.1(Air Duct for Central Air Conditioner) ................................................ 44
Table 4.6.2(Central Air-Conditioner Info Table) .................................................... 46
Table 4.7.1(Central AC Controller Price Limit with Changes in Room Insulation) .................................................................................................................................. 48
Figure 4.8.1 .............................................................................................................. 49
Figure 4.8.2 .............................................................................................................. 51
Figure 4.8.3 .............................................................................................................. 52
Figure 4.8.4 .............................................................................................................. 53
Figure 4.8.5 .............................................................................................................. 54
Table 4.8.1 ................................................................................................................ 54

04/25/2013 Worcester Polytechnic Institute Peng Ren, Tianci Zhao
7
Chapter 1 Executive Summary
1.1 Introduction Nowadays in America, approximately 39% of the total national energy is used to generate
electricity. For example, it cost about 24000 dollars per year for LED lighting in Atwater Kent.
[1] If this cost is reduced, the savings may benefit students and staffs through scholarships and
new equipments. The high demand of electric energy also causes problems of energy waste and
pollution. When electricity usage reaches the peak, power companies need to obtain electricity
from backup power plants. However these backup plants are often old and inefficient, which
could result in a higher cost of electricity. For these reasons, a better way for energy
management is to reduce the utility of electricity. However, there are no many efficient ways for
people to reduce the consumption of electric energy, and people's awareness for saving energy is
not very strong. Therefore, it is important to find a way to automatically turn off electronic that
04/25/2013 Worcester Polytechnic Institute Peng Ren, Tianci Zhao
8
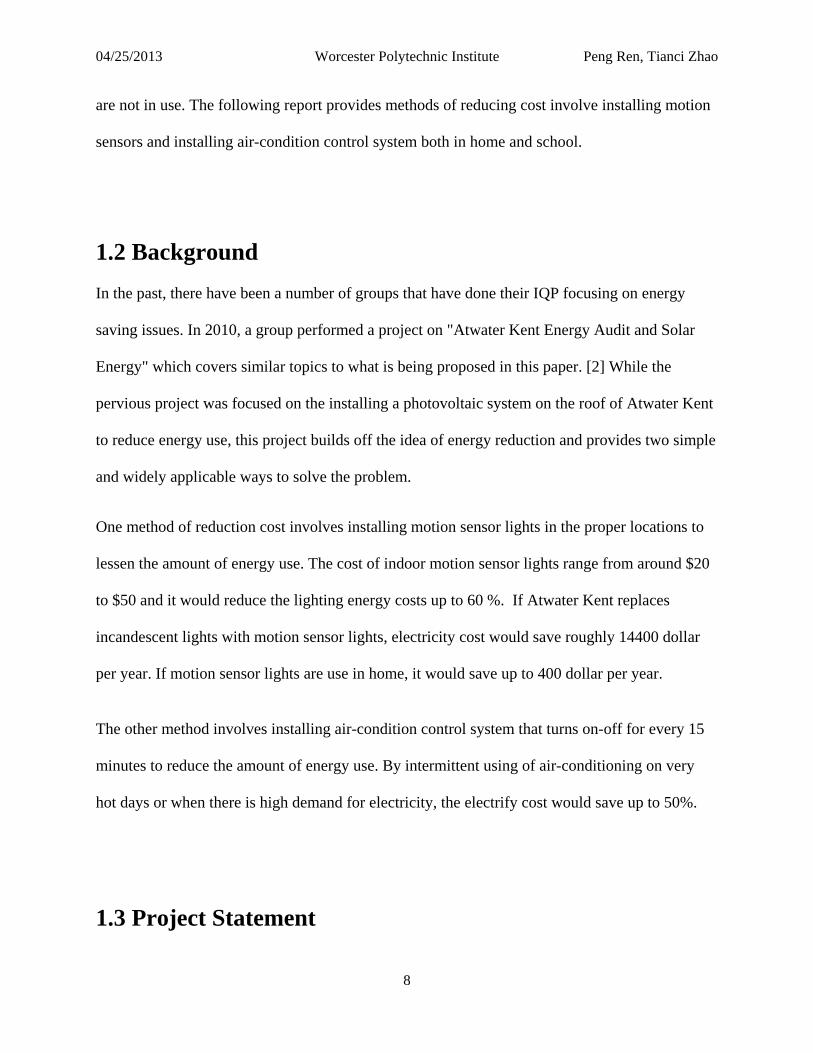
are not in use. The following report provides methods of reducing cost involve installing motion
sensors and installing air-condition control system both in home and school.
1.2 Background In the past, there have been a number of groups that have done their IQP focusing on energy
saving issues. In 2010, a group performed a project on "Atwater Kent Energy Audit and Solar
Energy" which covers similar topics to what is being proposed in this paper. [2] While the
pervious project was focused on the installing a photovoltaic system on the roof of Atwater Kent
to reduce energy use, this project builds off the idea of energy reduction and provides two simple
and widely applicable ways to solve the problem.
One method of reduction cost involves installing motion sensor lights in the proper locations to
lessen the amount of energy use. The cost of indoor motion sensor lights range from around $20
to $50 and it would reduce the lighting energy costs up to 60 %. If Atwater Kent replaces
incandescent lights with motion sensor lights, electricity cost would save roughly 14400 dollar
per year. If motion sensor lights are use in home, it would save up to 400 dollar per year.
The other method involves installing air-condition control system that turns on-off for every 15
minutes to reduce the amount of energy use. By intermittent using of air-conditioning on very
hot days or when there is high demand for electricity, the electrify cost would save up to 50%.
1.3 Project Statement

04/25/2013 Worcester Polytechnic Institute Peng Ren, Tianci Zhao
9
The purpose of this project was to reduce the amount of money spent on electric energy both in
school and home. In order to achieve this goal, energy consumption must be lowered. This
project explored two solutions to reduce the amount of power used and social attitudes towards
these solutions are also collected.
1.4 Methods To calculate the lighting energy use in Atwater Kent we determined the power use of the 60W
fluorescent light bulbs. The breakdown of lighting energy consumption in Atwater Kent can be
seen below in Table 1.1.
Table1.1-Energy consumption of Atwater Kent without motion sensor on kWh per day basis

04/25/2013 Worcester Polytechnic Institute Peng Ren, Tianci Zhao
10
By calculating the total lighting energy consumption of Atwater Kent, the group was able to
determine how much of an impact in school would installing motion sensors have. The result
could be seen in Chapter 2 Table 2.1.
To calculate the electric energy use in a 3 bedrooms apartment we determined the power use of
the 60W fluorescent light bulbs. The breakdown of electric energy consumption can be seen
below in Table 1.2 and Table 1.3. Table 1.2 shows the electric energy consumption on weekdays,
and Table 1.3 shows the electric energy consumption on weekends.
Table1.2-Energy consumption of apartment on weekdays on kWh per day basis
Table1.3-Energy consumption of apartment on weekends on kWh per day basis

04/25/2013 Worcester Polytechnic Institute Peng Ren, Tianci Zhao
11
By calculating the total electric energy consumption of a three bedroom apartment, the group
was able to determine how much of an impact in home would installing motion sensors have.
The result could be seen in Chapter 2 Table 2.2 and Table 2.3.
A survey is made to understand social attitude towards motion sensors both in school and home.
The main target of the survey is the undergraduate on campus. In the survey, the following
questions are asked:
(1) Does the student know there are motion sensors in school?
(2) Does he or she think the motion sensor is a good way to save energy?
(3) Does the student willing to install the motion sensor in his or her apartment?
(4) Where would the student install motion sensor?
The questioner is shown in Appendix and the analysis based on responses is shown in Chapter 2.
This survey helped us understand the social concern of installing motion sensors.

04/25/2013 Worcester Polytechnic Institute Peng Ren, Tianci Zhao
12
Chapter 2: Background
2.1 Introduction Electricity is an important part in our daily life. It lights up our home, runs appliances, powers
our phones and computers. Some electricity are generate from renewable energy, like solar, wind
and hydro. These types of energy can be restored or renewed. But lots of electricity are generate
from energy that are not being replenished. Fossil fuels took millions of years to create, and there
are limit amount of fossil source. That means once they are gone they cannot be used again. So it
is important to save energy as much as we can. However, most people do not think much about
electricity until they received a high electricity bill or face a power outage. In 2011, Electricity
consumption totaled nearly 3865 Billion Kilowatt-hours. U.S electricity use in 2011 was more
than 13 times greater than electricity use in 1950[3]. In hot summer days, as the demand for
electricity increasing, the cost to utility is also rising dramatically. (Shown in Figure 2.1.1:
temperature and electricity consumption)

04/25/2013 Worcester Polytechnic Institute Peng Ren, Tianci Zhao
13
Figure 2.1.1: temperature and electricity consumption [4]
From U.S. Energy Information Administration, our group finds out that most of the electricity
used is for air conditioning and lighting. (Shown in Figure 2.1.2)

04/25/2013 Worcester Polytechnic Institute Peng Ren, Tianci Zhao
14
Figure 2.1.2[5]
To reduce the utility of electricity, a better way of energy management need to be found. This
IQP project provides two solutions to solve the problem. Install motion sensors in the proper
locations could provide a new economic model for lighting electricity used. Install automatic
control system in air-condition could reduce 50 percent of energy cost.
In this section information pertinent to the discussion later in the report is presented. Such
information helps reader to understand later discussion topic such as cost and feasibility. Topics
in the background section include description of lighting standard, types of lighting that are
commonly used, and types of motion sensor.

04/25/2013 Worcester Polytechnic Institute Peng Ren, Tianci Zhao
15
2.2 Types of Lighting The types of lights in WPI vary from classroom to classroom in order for rooms with different
lighting extents to gain the same visibility. For these reasons, the types and load of the lights
therefore are different from one to another, which potentially causes some kind of difficulty for
our group to collect data and do the calculation. For example, in Atwater Kent Lab, the
fluorescent LED tubes are the dominant light providers. With the load of 30 watts, these light
generators produce satisfactory visibility and maintains for a long time. Actually, these LED
lighting tubes, with highly maintainability and fluorescent strength, actually could help saving
more than 90% energy than the traditional incandescent light bulbs, not to mention lasting about
10 times longer than incandescent light bulbs. Moreover, a 1-watt LED bulb could generate the
same amount of light output as a 15-watt incandescent light bulbs do. Even though with all these
benefit, LED lights, as one of the modern invented technology, generally cost four times more
money than the conventional incandescent technology. Please see the figure 2.2.1[6] to check the
comparison between the traditional incandescent light bulbs and fluorescent LED lights.
Figure 2.2.1[9]

04/25/2013 Worcester Polytechnic Institute Peng Ren, Tianci Zhao
16
Other types of lights could also be found in the AK lab, such as spotlight, T9 light LED, U-
Shape LED tubes and so on. However, as the total number these types of lights are small and
therefore don't have as much effect as the fluorescent LED lights have, we just ignore the
variability in these case for convenient reasons and the side-effect by doing so should be so
negligible that cannot influence greatly on our final result. The figure 2.2.2[7] is a sample of LED
T8 Fluorescent Light Bulb.
Figure 2.2.2[10]
2.3 Standards of Lighting Usually, in order to get a satisfactory visibility in the school for educational reasons, the
classrooms or labs require good quality of lighting. The good performance of lights therefore

04/25/2013 Worcester Polytechnic Institute Peng Ren, Tianci Zhao
17
plays a crucial role in keeping the psychological and biological healthy of the students. Besides
the consideration for the students' visual and physical conditions, schools also need to think
about the energy cost of the electric lights. In this case, the maintainability, duration and power
load of the lights become the important part in choosing the luminance generators.
In addition to the conditions of lights, the physical situation of room, windows number and room
direction should be taken into account. For examples, some room could achieves high visibility
during the daylight time and thus require no extra radiance by lights, while some others, due to
the few number of windows, require a lot more lighting provided by lights. Also, knowledge of
the task usually done in the room is also important when people try to determine the lights to be
installed in the room. The table 2.3.1[8] is the overview of classrooms' requirement for lighting
due to their different tasks.
Table 2.3.1[11]

04/25/2013 Worcester Polytechnic Institute Peng Ren, Tianci Zhao
18
2.4 Usage of Motion Sensor The use of motion sensors could be found almost everywhere in WPI. When there is no one in
the bathroom for a while, the lights in the bathroom will automatically be turned off. Also, in the
library, the motion sensor system would assist in shutting down lights in the area without people
activities. Even in the classroom or labs, people sometimes just find the lights are magically
being turned off as they were all in a motionless state for a long time. The installation of the
motion sensor plays a significant way in saving electric energy cost in the whole school by
reducing the useless usage lighting equipment.
The types of motion sensor used in WPI also vary according to the room's physical condition and
the task of the room. For instance, the big classroom such as AK 116 is usually being installed
with motion sensor of large sensor area and less sensibility to motions. On the contrary, the
motion sensor installed in the bathroom is often with small area detector but higher sensibility.
All these factors depend on the physical situation of room and the activities frequently hold in
the room. The table 2.4.1 below lists motion detectors that are mostly often used current days.
Motion Sensor Information Table
Manufactor Trade Name Catalog Number Maxinum Coverage Area(ft2)
Time Delay Range
Mininum Load Requirement(W)
Bryant Electric Inc. Motion Switch
MSFL 1200I 1200 1 to 20 mins 25
MSWS 1277 1200 0sec to 20min 120
Honeywell Inc. H-MOSS Wall Switch WSS 1200 1200 1 to 20 mins 50
Hubell Inc. Hubell EL2650 B 1066 1200 45sec to 15mins 25 EL2650 B 1025 2500 45sec to 15mins 55

04/25/2013 Worcester Polytechnic Institute Peng Ren, Tianci Zhao
19
Leviton Manufactoring
Company Decora 6755 2500 0 to 30mins 55
Lighttoller Controls INSIGHT
152 600VA 750 2 to 15mins 70 IH52 1000VA 750 15mins 5 153 600VA 750 2 to 15mins 15
IH53 1000VA 750 15mins 55 152 IKVA 277 750 2 to 15mins 50 Ih52 IKVA 277 750 15mins 5 I53 IKVA 277 750 2 to 15mins 50
IH53 IKVA 277 750 15mins 15 Lithonala lighting Lithonric LIRW 1000 30sec to 30mins 50
Mytech LowPro2 LP 2 900 0 to 20mins 70 Pass &
Syemolesguard N/A WS 3000 900 30sec to 30mins 50
RAB Electric Manufactoring Light Alert
LOS 300 300 0sec to 15mins 55
LOS 900 1500 9 to 11mins 25 LOS 1000 1000 0 to 30mins 70
Table 2.4.1
04/25/2013 Worcester Polytechnic Institute Peng Ren, Tianci Zhao
20
Chapter 3 Method of Motion Sensor
3.1 Introduction This chapter explains how each topic area was approached from a scientific point of view. Such
topics include physical condition influence, light type influence, and lighting consumption
calculations for Atwater Kent.
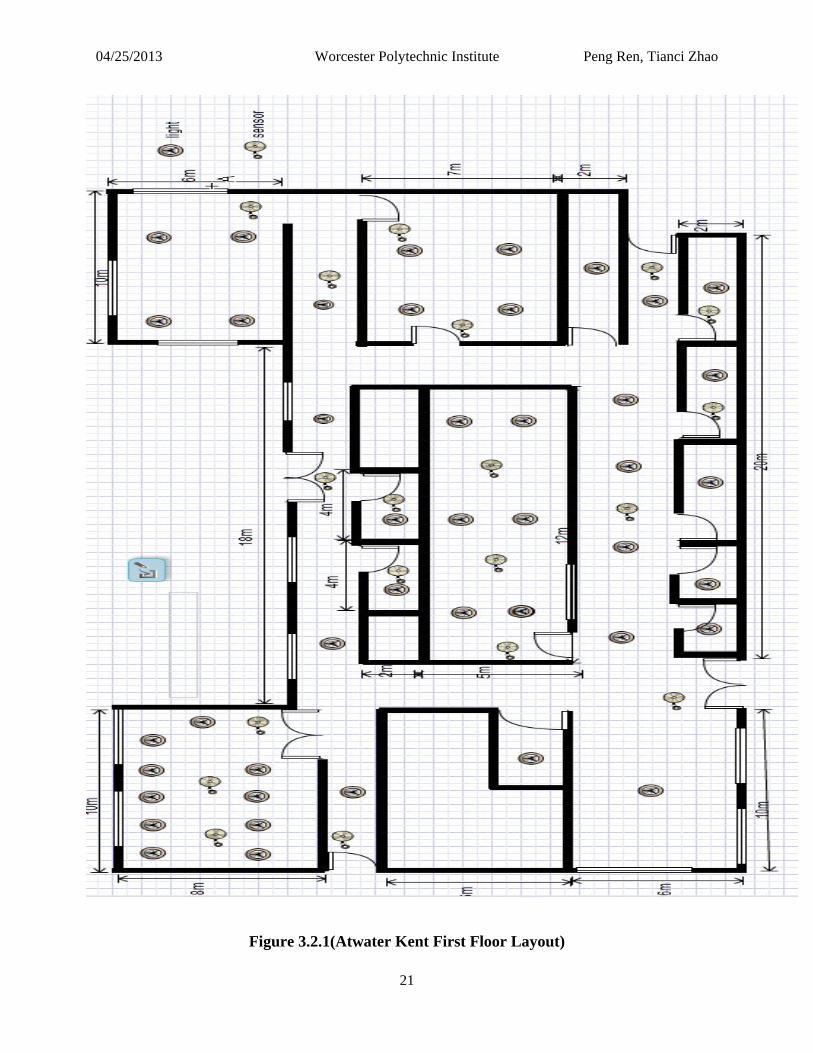
3.2 Physical Condition Influence To determine the energy saving and cost resulted in motion sensor on the first floor of Atwater
Kent, a layout of the floor was provided to show all locations of lights. The Atwater Kent Lab
First Floor Layout (Figure 3.2.1) can not only enable the reader to identify with the space, but
also serve as the guideline to install the motion sensor. In order to take advantage of the benefit
that comes from installing motion, it is important to determine the installation location according
to the physical condition of the building and lights condition. For example, there should be more
motion sensors installed in large lecture halls since there usually be more space and more lights
in these rooms. From the layout of the first floor of Atwater Kent, it is obvious that motion
sensors are evenly distributed according to the area of the rooms. The Newer Hall (AK116) gets
more motion sensors than the other rooms since it has the largest area. Bathrooms and elevate,
according to their limited space, only gain one motion sensor. Length and wide were measured to
calculate the area of each room. Number of motion sensor was determined in proportion of room
space. Calculation and result are provided in section 3.5.
04/25/2013 Worcester Polytechnic Institute Peng Ren, Tianci Zhao
21
Figure 3.2.1(Atwater Kent First Floor Layout)

04/25/2013 Worcester Polytechnic Institute Peng Ren, Tianci Zhao
22
3.3 Light Type Influence In order to determine the lighting consumption of Atwater Kent it was necessary to compare
light load, unit price and life time of different light types. Different lights have different loads,
thereby consuming different amount of energy per hour. Also, as the lights prices vary from on
to another, the cost of the total saving would be influenced by the difference of prices. Except
these obvious factors that matter, factors such as average usage hour should also be taken into
account.
Figure 3.3.1
According to the group research on the first floor of Atwater Kent Lab, the team finds the
dominant light types are the LED tubes with the load around 30 Watts per hours. The light
information is listed in the table below. (Table 3.3.1)

04/25/2013 Worcester Polytechnic Institute Peng Ren, Tianci Zhao
23
Light Information Table
Model Series Watts Description Average Usage Hour Unit Price
S11871 32 cool light 20000 $99
S19055 34 cool light 20000 $82
S11872 32 warm light 20000 $99
S11874 34 warm light 20000 $105
Table 3.3.1 (Light Type Table)
In the table provided above, there are cool and warm two different light type served by these
bulbs. The warm light is more widely used than cold lights. This situation is corresponding to the
condition of first floor of AK labs, where lights are dominantly warm lights. However, cool
lights are use in lab classroom and large lecture rooms, where sometimes more strong light need
to be provided. This factor could be ignored since the average usage hours of lights are the same.
The average price of the lights is approximately 100 USD and it was used in later calculation.
3.4 Motion Sensor Type Influence The type of motion sensor is one of the main factors to be considered in this research. However,
as the aim of the project is focusing on the relationship between motion sensor and their
assistance on saving money and energy, the team chooses to focus on cheap, durable and saving-
efficient motion sensor. After some market research, the team enumerates some competitive

04/25/2013 Worcester Polytechnic Institute Peng Ren, Tianci Zhao
24
motion sensors that could be used in the first floor of AK Lab to help save lighting consumption.
The motion sensor information is list in the table (Table 3.3.2) below.
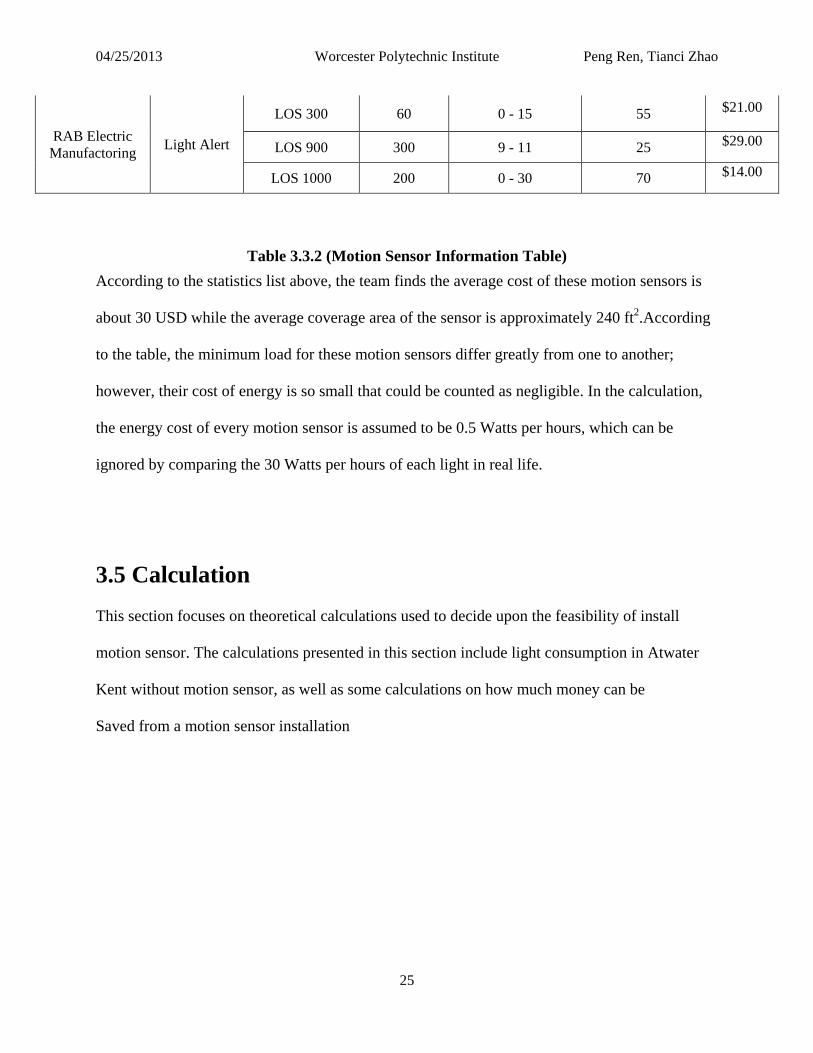
Motion Sensor Information Table
Manufactory Trade Name Catalog Number Maximum Coverage Area(ft2)
Time Delay Range(min)
Minimum Load
Requirement(W) $35.00
Bryant Electric
Inc.
Motion Switch
MSFL 1200I 260 1 - 20 25 $55.00
MSWS 1277 250 0 - 20 120 $24.00
Honeywell Inc.
H-MOSS Wall Switch WSS 1200 250 1 - 20 50 $24.00
Hubell Inc. Hubell EL2650 B 1066 280 1 - 15 25 $21.00
EL2650 B 1025 500 1 - 15 55 $29.00
Leviton Manufactoring
Company Decora 6755 500 0 - 30 55 $14.00
Lighttoller Controls INSIGHT
152 600VA 150 2 - 15 70 $32.00
IH52 1000VA 150 15 5 $25.00
153 600VA 150 2 - 15 15 $42.00
IH53 1000VA 150 15 55 $19.00
152 IKVA 277 150 2 - 15 50 $40.00
Ih52 IKVA 277 150 15 5 $25.00
I53 IKVA 277 150 2 - 15 50 $35.00
IH53 IKVA 277 150 15 15 $35.00
Lithonala lighting Lithonric LIRW 200 1 - 30 50 $55.00
Mytech LowPro2 LP 2 160 0 - 20 70 $24.00
Pass & Syemolesguard N/A WS 3000 160 30 - 30 50 $24.00
04/25/2013 Worcester Polytechnic Institute Peng Ren, Tianci Zhao
25
Table 3.3.2 (Motion Sensor Information Table) According to the statistics list above, the team finds the average cost of these motion sensors is
about 30 USD while the average coverage area of the sensor is approximately 240 ft2.According
to the table, the minimum load for these motion sensors differ greatly from one to another;
however, their cost of energy is so small that could be counted as negligible. In the calculation,
the energy cost of every motion sensor is assumed to be 0.5 Watts per hours, which can be
ignored by comparing the 30 Watts per hours of each light in real life.
3.5 Calculation This section focuses on theoretical calculations used to decide upon the feasibility of install
motion sensor. The calculations presented in this section include light consumption in Atwater
Kent without motion sensor, as well as some calculations on how much money can be
Saved from a motion sensor installation
RAB Electric Manufactoring Light Alert
LOS 300 60 0 - 15 55 $21.00
LOS 900 300 9 - 11 25 $29.00
LOS 1000 200 0 - 30 70 $14.00

04/25/2013 Worcester Polytechnic Institute Peng Ren, Tianci Zhao
26
3.5.1 Calculation with Motion Sensor
In table 3.5.1, the first column on the left lists all the room in the AK Lab first floor. Accordingly,
AK First Floor Lights Energy Consumption And Cost Table Without Motion Sensor
Area Space
(m2)
Number of
Lights
Light Load
(W/Light)
AOT[1] Without
MS[2](hour)
Daily Energy
Consumption
(kWh)
Electric Fee
(USD/kWh)
Daily Cost
(USD)
AK116 200 50 32 8 12.8 0.12 1.536
AK113 50 20 32 16 10.24 0.12 1.2288
Bathroom(male) 10 3 32 16 1.536 0.12 0.18432
Bathroom(female) 10 3 32 16 1.536 0.12 0.18432
Elevator 2 1 32 0.5 0.016 0.12 0.00192
RBE LAB 80 20 32 18 11.52 0.12 1.3824
Department Office 50 10 32 10 3.2 0.12 0.384
Hallways 150 30 32 24 23.04 0.12 2.7648
AK111 30 10 32 14 4.48 0.12 0.5376
classroom 20 4 32 8 1.024 0.12 0.12288
storeroom 10 2 32 1 0.064 0.12 0.00768
common room 10 2 32 8 0.512 0.12 0.06144
Average 51.833333 12.916667 32 11.625 5.830666667 0.12 0.69968
Sum 622 155 N/A 139.5 69.968 N/A 8.39616
Note: 1.AUT: Average Occupied Time
2.MS: Motion Sensor

04/25/2013 Worcester Polytechnic Institute Peng Ren, Tianci Zhao
27
Table 3.5.1(AK First Floor Light Energy Cost Table without Motion Sensor)
the second column gives the space occupied by the rooms. The light number in each room is
assumed to be proportional to the space of the room occupied, which is listed in the third column.
The light load in this case is 32 Watt, which is gained by the light type table (Table 3.3.1) in
pervious section. The average occupied time of each room and electric fee are also providing
above.
3.5.2 Calculation with Motion Sensor
Table 3.5.2(AK First Floor Light Energy Cost Table with Motion Sensor)

04/25/2013 Worcester Polytechnic Institute Peng Ren, Tianci Zhao
28
According to the table, the saving is not as much as expect. After analysis, the group finds the
saving is actually inversely related to the occupied time of the room. For example, if the room is
only be occupied a very small amount of time, the motion sensor would help shut down light
when there is no one using the room, thus cut the light energy consumption a lot. However, if the
room is occupied by people for a long time, then the motion sensor and the lights are both
working at the same time, which basically increase the energy consumption of the room.
However, because the consumption of energy by motion sensible is too small to be taken into
account, it is not the real factor. The real reason is that if a room is occupied a lot of time, then
the percentage of shut-down time by motion sensor is reduced, so the saving energy and money
is reduced.
Other information provided in the table is based on the fact that motion sensor is installed every
10m2, which is concluded from the average coverage area in the motion sensor list table(Table
3.3.2). According to the same table with field study on the AK Lab first floor, the average light-
on time saved by motion sensor is assumed to be 25% per day. With this assumption, if the lights
of a room is previously used 10 hours a day, then after installing the motion sensor, the light-on
time becomes 7.5 hours a day (25% saving). The motion sensor number installed in each room is
also according to the room space; moreover, it also depends on the light number. The proportion
of light number and motion sensor number was assumed to be 5:2. In the table, there are 50
lights in AK 116 and therefore there are 20 motion sensors would be installed. One thing to be
noticed, both of light number and motion sensor number are proportional to the space that the
room occupied.

04/25/2013 Worcester Polytechnic Institute Peng Ren, Tianci Zhao
29
3.5.3 Calculation of Daily Cost Saved by Motion Sensor in AK116
Unknown:
Daily Cost Saved By Motion Sensors --> Sdaily ($)
Variables:
Light Load ---> Lload = 32 (Watt per hour)
Light Number ---> Lnum = 50
Light-On-Time ---> Ton = 8 (hour)
Percent Time Reduced By Motion Sensor ---> Tsaved = 25%
Sensor Number ---> Snum = 20
Sensor Load ---> Sload = 0.5 (Watt per hour)
Electric Price ---> Peletrc = 0.12 (kWh/$)
Equation:
Sdaily = (Lload × Lnum × (Ton × Tsaved) - (Snum × Sload × 24))/1000 × Peletrc
Replace Variables With Data:
Sdaily = (32 × 50 × (8 × 25%) - (20 × 32 × 24))/1000 × 0.12 = 0.3552 ($)
According to the data given by table, the team calculated the daily money saved on AK116 is
0.3552USD, which is lower than expectation, but still, reasonable. Using the same method, the
daily cost saved by motion sensor for each room was calculated and result is provided in Table
1.1.5. From the calculation, the team found the total saving for the AK First Floor with motion
sensor is 1.85424 USD a day.
However, there are also many other variables that could influence the effect of the motion sensor
to save money, such as light-on time, light number and light load. For instance, if the light-On

04/25/2013 Worcester Polytechnic Institute Peng Ren, Tianci Zhao
30
time is changed, certainly there will be a change correspondingly in the daily money saved. For
this situation, the table below (Table 3.6.1) gives a detailed relationship between AK first floor
daily light energy cost and changes in light-on time.
3.6 Relationship between Daily Money Saved and Variables
Table 3.6.1 (Relationship Between AK First Floor Daily Lights Energy Cost With Changes in Light-On Time)
According this table and the equation used for calculating the daily energy saving, a proportional
linear relationship between light-On time and daily money saved by motion sensor is clearly
displayed by the table. The money saved daily of Average 10 hours light-On in this case is
1.8624 USD, compared to -0.028 USD of 0 hour light-One. The difference is obvious in this case.
The linear graph below illustrates a clearer concept about cost and light-on time relationship.
(Figure 3.6.1)

04/25/2013 Worcester Polytechnic Institute Peng Ren, Tianci Zhao
31
Figure 3.6.1(Curve Graph of Relationship Between AK First Floor Daily Lights Energy Cost With Changes in Light-On Time)
The relationship between the daily cost saved by motion sensor and the changes in light number
and light load can be gotten by using the same method as used above. After calculation, the
conclusion and results are clearly listed in Table 3.6.2 and Table 3.6.4, while the linear graphs
3.6.3 and 3.6.5 offers linear graphic relationships between variables and daily cost saved on AK
first floor daily.

04/25/2013 Worcester Polytechnic Institute Peng Ren, Tianci Zhao
32
Table 3.6.2 (Relationship Between AK First Floor Daily Lights Energy Cost With Changes in Light Number)
Figure 3.6.3(Curve Graph of Relationship Between AK First Floor Daily Lights Energy Cost With Changes in Light Number)

04/25/2013 Worcester Polytechnic Institute Peng Ren, Tianci Zhao
33
Table 3.6.4(Relationship Between AK First Floor Daily Lights Energy Cost With Changes in Light Load)
Figure 3.6.5 (Curve Graph of Relationship Between AK First Floor Daily Lights Energy Cost With Changes in Light Load)

04/25/2013 Worcester Polytechnic Institute Peng Ren, Tianci Zhao
34
Conclusion: The analysis of all these relationships between daily cost saved and different variables (Average
Light-On Hour, Light Number, Light Load) offers a clue about how the motion sensor would
save cost more efficiently. More specifically speaking, with more light-on time, larger amount of
light numbers and larger light loads, the motion sensor will do the money saving job more
effectively.
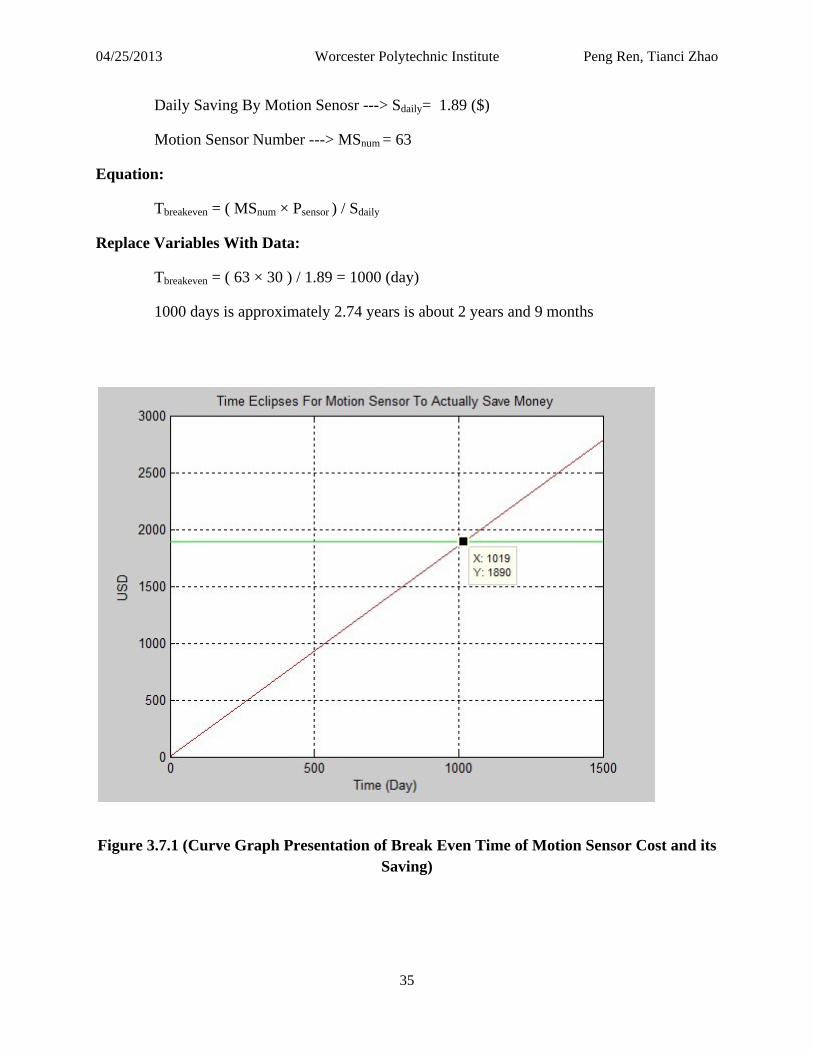
As to the breakeven time between when people start using motion sensor and when they can
actually get the money back, it is largely depends on the price of the motion sensor that people
choose to use. Taken AK first floor as an example, according to the motion sensor information
table (Table 3.3.2), the average motion sensor price is 30 USD. Define X to be the time elapsing
when the money saved by motion sensors is equal to their costs. With conclusion from table
3.6.1, the daily saved money is 1.86 USD by motion sensors on AK first floor. And the table also
articulates that there are 63 motion sensors. So according to all these information, the breakeven
time X can be gotten from the equation X×1.85 = 63×30. After the calculation, breakeven time
between starting using motion sensor and getting money back is about 1019 days, which means
that people need to wait about 2 year 9 months to let the motion sensor actually save their money.
(Figure 3.7.1 gives more clear relationship of this.)
3.7 Calculation: Unknown:
Motion Sensor Cost and Saving Break Even Time ---> Tbreakeven (day)
Variables:
Motion Sensor Price ---> Psensor = 30 ($)
04/25/2013 Worcester Polytechnic Institute Peng Ren, Tianci Zhao
35
Daily Saving By Motion Senosr ---> Sdaily= 1.89 ($)
Motion Sensor Number ---> MSnum = 63
Equation:
Tbreakeven = ( MSnum × Psensor ) / Sdaily
Replace Variables With Data:
Tbreakeven = ( 63 × 30 ) / 1.89 = 1000 (day)
1000 days is approximately 2.74 years is about 2 years and 9 months
Figure 3.7.1 (Curve Graph Presentation of Break Even Time of Motion Sensor Cost and its Saving)

04/25/2013 Worcester Polytechnic Institute Peng Ren, Tianci Zhao
36
Chapter 4
Feasibility Analysis On Remote AC Intermittent
Operation Controller
4.1 Introduction
Figure 4.1.1(Typical Air-Conditioners)

04/25/2013 Worcester Polytechnic Institute Peng Ren, Tianci Zhao
37
The second method that is used to save electric energy is the smart usage of air-conditioner. In the
hot summer days, people usually prefer to keep the air-conditioners on all day long. However, it is
not necessary for people to turn on air-conditioner consistently to achieve their body comfort.
Sometimes, the overuse of air-conditioner will make the room too chilly to stay. People's
preferences differ from one to another so that there is not a fixed temperature that is suitable for
everyone to get thermal comfort. However, according to research by World Health Organization,
22 to 26 centigrade is the range of temperature that people feel most comfortable. Therefore, as
long as the air-conditioner keeps the temperature in that range, it does not matter how it does. A
smart, energy-saving way of inttermittently operating AC can beat the traditional consistent usage
of AC.
4.2 Methodology The intermittent operation of air-conditioner is not a complex method that is not feasible for the
typical household to apply. On the contrary, the application of the method is very easy that only a
remote air-conditioner controller would handle all the job. The underline principle for this method
is also very easy to understand. In a room with perfect insulation capability, people could turn off
the air-conditioner as long as the temperature in the room has been lowered to the prefered level.
And because the room is prefect insulated, the temperature would keep in that level consistently.
In this case, the opening time of the air-conditioner will be reduced to very small. However, in real
world, there is no perfect insulated room, so the temperature will re-increase if people just turn off
the air-conditioner. The apporiate way to both save energy and keep the room cool is to
04/25/2013 Worcester Polytechnic Institute Peng Ren, Tianci Zhao
38
periodically open the air-conditioner. For example, if the air-conditioner is on for 15 minutes, just
turn it off for another 15 minutes and then iterate the procedure. In this way, the temperatuer in the
room would be controller in a prefered range; moreover, due to the intermittent turning off AC,
the electric energy consumption wil lbe reduced by half.
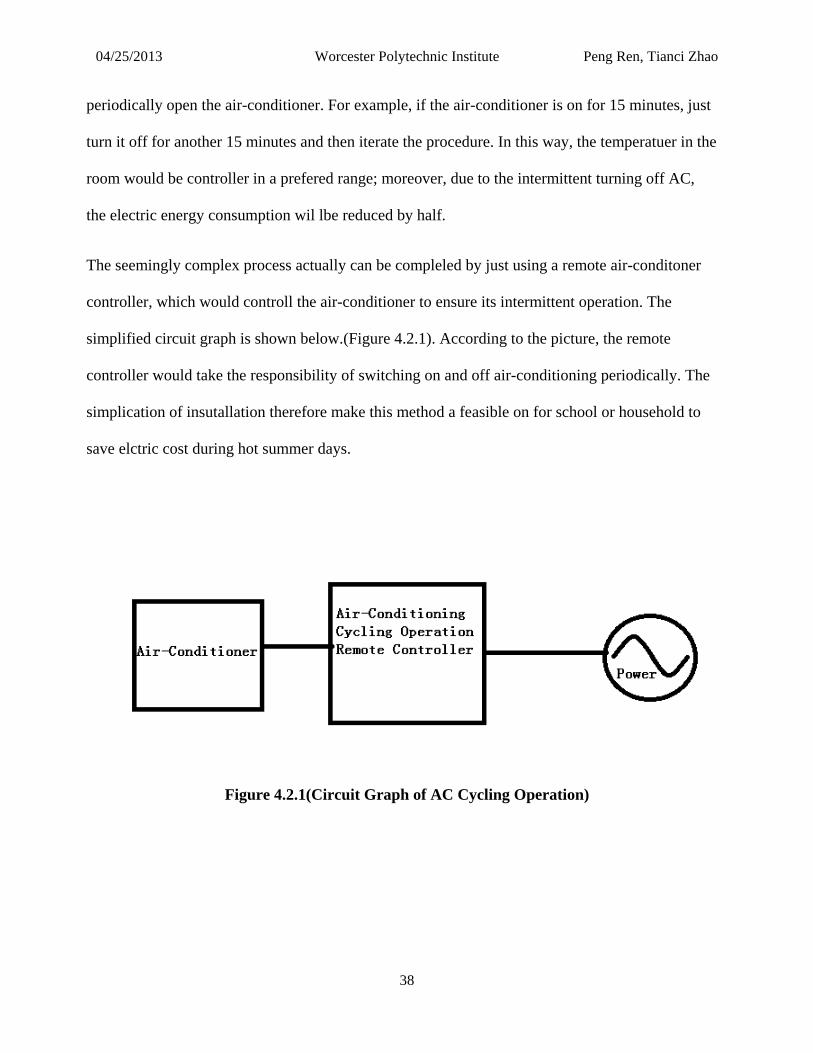
The seemingly complex process actually can be compleled by just using a remote air-conditoner
controller, which would controll the air-conditioner to ensure its intermittent operation. The
simplified circuit graph is shown below.(Figure 4.2.1). According to the picture, the remote
controller would take the responsibility of switching on and off air-conditioning periodically. The
simplication of insutallation therefore make this method a feasible on for school or household to
save elctric cost during hot summer days.
Figure 4.2.1(Circuit Graph of AC Cycling Operation)

04/25/2013 Worcester Polytechnic Institute Peng Ren, Tianci Zhao
39
4.3 Physical Factors However, only simply installation cannot garantee the feasibility of this plan. The price and real
benefit also matter a lot. If the price people need to pay for the remote air-conditioner controller is
very hight, then nobody would buy it. The product would be unvaluable if the market doesn't like
it, even though it may have a slogan of saving electric energy. Simiarly, it the benefit resulted in
by this plan is trivial, it is then not a very good way for people to save money. Typically, when a
custumer chooses to buy a long-time benefit product instead of traditional one, he or she wants to
get the money back as soon as possible. Nobody want to wait more than 10 years to get start
recieve benefit from the investment made before. So the breakeven time of retrieving the money
of the remote AC controller by using it would be a key factor to determine if the plan is feasible or
not.
To test the practicablity of the intermittent operation on air-conditioning. The group did the
caclcualation based on physical environment of Atwater Kent lab first floor. According to the air-
conditioner number in the floor, the group smiulated a model that would use the corresponding
number of air-conditioning controllers to save energy during summer days. This simulation would
helpe us to caluclate the price of air-conditioner controller. If the final price of the controller is
very high, the feasiblity of the cycling operation plan will be low. On the other hand, if the
calcualted price is low or acceptable, the plan then is deserved to be used at least.
The process of the calculation is very simple. To find the price of remote AC controller, some
vaiables will be used in the process of calucation. They are Number of Air-conditioners in the first
floor of AK, number of air-conditioner controller, air-conditioning load, number of days using AC

04/25/2013 Worcester Polytechnic Institute Peng Ren, Tianci Zhao
40
anually, daily AC operation hour, percent of operation time saved by controller and electic price of
the electric energy in the area.
4.4 Feasibility Analysis Calculation
Firstly, the average price and energy load could be gain by checking the table of commonly used air-conditioners(Table 4.4.1).
Table 4.4.1(Common Air-Conditioner Info Table)
By counting, the group finds the number of air-conditioner in the AK first floor is about 20. And
correspondingly, the remote controller should be 5. After assuming the days of using air-
conditioning and the daily hours, we did the detailed calculation below.
Calculation Unknown:
Feasible AC Remote Controller Price ---> PC ($)

04/25/2013 Worcester Polytechnic Institute Peng Ren, Tianci Zhao
41
Variables:
Number Of Air-Conditioning Controller ---> Cnum = 5
Number Of Air-Conditioning ---> ACnum = 20
Air-Conditioning Load ---> ACload = 1147.8(W)
Air-Conditioning Operation Days Per Year ---> Don = 120(days/year)
Air-Conditioning Operation Time Per Day ---> Hon = 10(hours/day)
Percent of Shutting down Time Using Intermittent Operation ---> Percoff = 50%
(Intermittently shut down and open air-conditioners every 15 minutes)
Electric Energy Price ---> Peletrc = 0.12 (kWh/$)
Equation:
PC × Cnum = ((ACload × ACnum × Don × Percoff × Hon)/1000 × Peletrc)
PC = ((ACload × ACnum × Don × Percoff × Hon)/1000 × Peletrc) / Cnum
Replace Variables With Data:
PC = ((1147.8 × 20 × 120 × 50% × 10)/1000 × 0.12)/5
PC = 330.5 ($) for one year
In real world, 5 years is a reasonable time to be considered as break even time

04/25/2013 Worcester Polytechnic Institute Peng Ren, Tianci Zhao
42
So PC × 5 = 1652.8 ($)
Conclusion If the price of the AC Cycling Operation Controller is not greater than 1652.8 $, then people
could get our money back in 5 years by using the AC cycling operation controller. The figure we
got above indicates that the cycling operation of AC is really a feasible way to save energy. Due
to 1652.8 is really a big amount of money, it is not possible that the price for installation of a
remote air-conditioner controller would reach that high price. Therefore, as long as the people
spend less money than 1652.8$ on the remote AC controller, the plan could be served as a good
way to save electric energy and money.
4.5 Insulation Influence The calculation the group did above is based upon an assumption that the rooms are well
insulated; however, if the rooms are not insulated, then to ensure people in the rooms to gain
similar body comfort, the time break between shutting down the AC should be reduced, thereby
decreasing the Percent of Shutting down Time Using Intermittent Operation (Percoff)). The table
below gives the changes in PC with different room Insulations.
AC Controller Price Limit To Save Money In A Year With Changes of Room Insulation
Insulation
Extent Cnum ACnum ACload(W) Don
(Day/Year) Hon
(Hour/Day) Peletrc ($)
Percoff (%) PC ($)

04/25/2013 Worcester Polytechnic Institute Peng Ren, Tianci Zhao
43
Perfect 5 20 1147.8 120 10 0.12 100.00% 661.13
Good 5 20 1147.8 120 10 0.12 80.00% 528.91
Fine 5 20 1147.8 120 10 0.12 50.00% 330.57
So-so 5 20 1147.8 120 10 0.12 30.00% 198.34
Bad 5 20 1147.8 120 10 0.12 20.00% 132.23
Not At All 5 20 1147.8 120 10 0.12 0.00% 0.00
Table 4.5.1(AC Controller Price Limit with Changes In Room Insulation)
4.6 Central Air-Conditioner Analysis Nowadays, more and more buildings and rooms use central air-conditioner to cool down the
temperature during the hot summer days. In schools or mansions, the central air-conditioner
gradually replaces the traditional AC and becomes the most important method to control thermal
extent in the rooms. This is because for large rooms and buildings, the central air-conditioner
could lower the temperature more efficiently than the typical ones while using the same amount
of energy. Moreover, once being installed, the central air-conditioner could control the

04/25/2013 Worcester Polytechnic Institute Peng Ren, Tianci Zhao
44
temperature with much larger area coverage than the traditional ones. With these advantages, it is
now widely used in the world.
If the remote AC controller can work well with the central air-conditioner, the energy and money
saved may outweigh those saved by controlling traditional AC. Therefore, the calculation below
is focused on figuring out the feasibility to use remote AC controller for central air-conditioner.
Again, the physical environment is assumed to be Atwater Kent Lab first floor.
Figure 4.6.1(Air Duct for Central Air Conditioner)
04/25/2013 Worcester Polytechnic Institute Peng Ren, Tianci Zhao
45
Similar to what the group did for the traditional air-conditioner controller, the calculation is
aimed to figure out the breakeven price for remote AC controller price and the money saved by it
in 5 years.
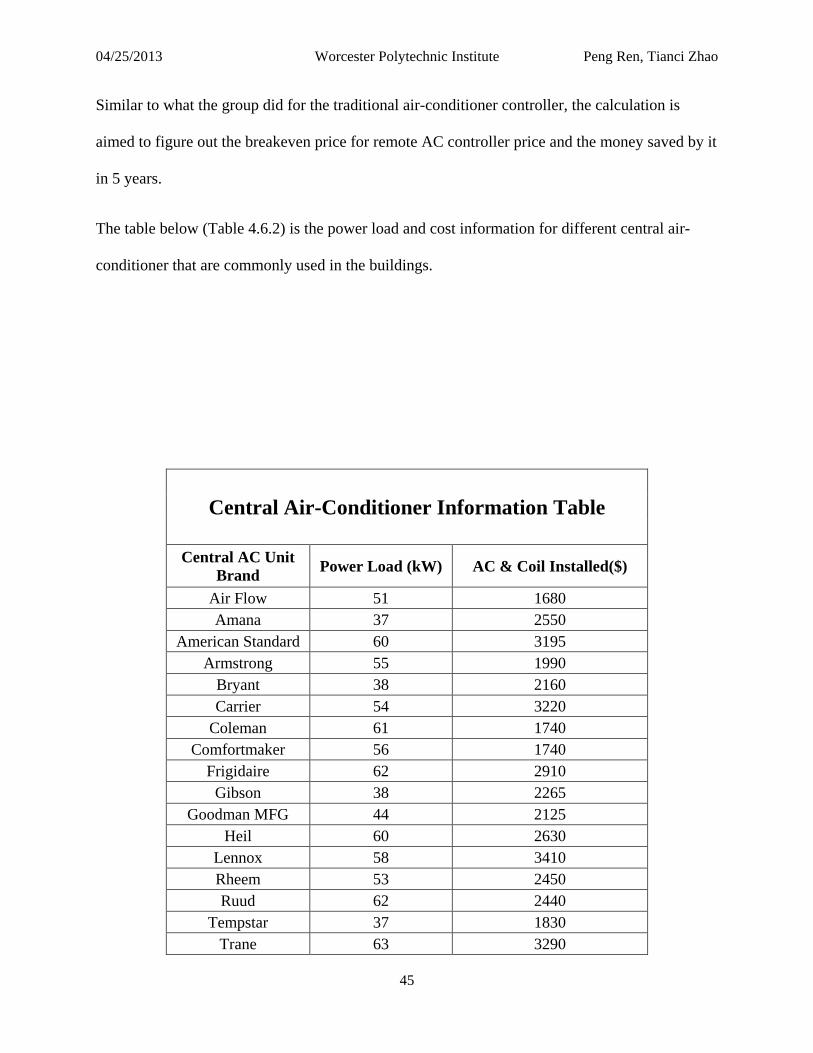
The table below (Table 4.6.2) is the power load and cost information for different central air-
conditioner that are commonly used in the buildings.
Central Air-Conditioner Information Table
Central AC Unit Brand Power Load (kW) AC & Coil Installed($)
Air Flow 51 1680 Amana 37 2550
American Standard 60 3195 Armstrong 55 1990
Bryant 38 2160 Carrier 54 3220
Coleman 61 1740 Comfortmaker 56 1740
Frigidaire 62 2910 Gibson 38 2265
Goodman MFG 44 2125 Heil 60 2630
Lennox 58 3410 Rheem 53 2450 Ruud 62 2440
Tempstar 37 1830 Trane 63 3290

04/25/2013 Worcester Polytechnic Institute Peng Ren, Tianci Zhao
46
Whirlpool 57 1910 York 46 2770
Average 52.21052632 2437.105263
Table 4.6.2(Central Air-Conditioner Info Table)
4.7 Feasibility Analysis Calculation
Calculation:
Unknown:
Feasible Central Air-Conditioning Remote Controller Price ---> PC ($)
Variables:
Number Of Air-Conditioning Controller ---> Cnum = 3
Number Of Air-Conditioning ---> ACnum = 3
Air-Conditioning Load ---> CACload = 52210.5(W)
Air-Conditioning Operation Days Per Year ---> Don = 120(days/year)
Air-Conditioning Operation Time Per Day ---> Hon = 10(hours/day)
Percent of Shutting down Time Using Intermittent Operation ---> Percoff = 50%
(Intermittently shut down and open air-conditioners every 15 minutes)
Electric Energy Price ---> Peletrc = 0.12 (kWh/$)

04/25/2013 Worcester Polytechnic Institute Peng Ren, Tianci Zhao
47
Equation:
PC × Cnum = ((CACload × CACnum × Don × Percoff × Hon)/1000 × Peletrc)
PC = ((CACload × CACnum × Don × Percoff × Hon)/1000 × Peletrc) / Cnum
Replace Variables With Data:
PAC = ((52210.5 × 3 × 120 × 50% × 10)/1000 × 0.12)/3
PAC = 3759.1($)
In real world, 5 years is a reasonable time to be considered as break even time
So PC × 5 = 18795.7 ($)
Conclusion:
If the price of the AC Cycling Operation Controller is not greater than 18795.7 $, then it is
possible to get money back in 5 years by using the AC cycling operation controller. Obviously,
18795.7 is a very large number so that it is very likely that the real cost of the central air-
conditioner controller would not reach that higher. For this reason, it is reasonable to conclude
from the calculation that the remote central AC controlling plan is feasible in this case.
Using the same methodology provided above, the table for the changes in PC with different room
is shown in Table 4.7.1.

04/25/2013 Worcester Polytechnic Institute Peng Ren, Tianci Zhao
48
Central AC Controller Price Limit To Save Money In A Year With Changes of Room Insulation
Insulation
Extent Cnum CACnum ACload(W) Don
(Day/Year) Hon
(Hour/Day) Peletrc ($)
Percoff (%) PC ($)
Perfect 3 3 52210.5 120 10 0.12 100.00% 7518.31
Good 3 3 52210.5 120 10 0.12 80.00% 6014.65
Fine 3 3 52210.5 120 10 0.12 50.00% 3759.16
So-so 3 3 52210.5 120 10 0.12 30.00% 2255.49
Bad 3 3 52210.5 120 10 0.12 20.00% 1503.66
Not At All 3 3 52210.5 120 10 0.12 0.00% 0.00
Table 4.7.1(Central AC Controller Price Limit with Changes in Room Insulation)
04/25/2013 Worcester Polytechnic Institute Peng Ren, Tianci Zhao
49
4.8 Circuit Method
Most of people experience large changes in temperature from season to season, but human
comfort demands a constant temperature in homes through the year. In winter, this means
preventing heat from escaping to the outside. In summer, this means preventing heat from
entering the house. House insulation helps maintain the desire temperature by blocking heat
flow. However, some materials are more effective than others. In order to determine the
relationship between house insulation and indoor temperature, an RC circuit was used to
simulate calculate the result. The following sections will provide methodology, calculation and
result of this method.
House insulation helps maintain human comfort by blocking heat flow. Figure 4.8.1 shows how
the house insulation works in winter time.
Figure 4.8.1

04/25/2013 Worcester Polytechnic Institute Peng Ren, Tianci Zhao
50
It is obvious from the graph that the indoor temperature (T1) higher than the outdoor temperature
(T2). There is a temperature drop at the wall area, which shows heat flow from inside to outside.
The relationship of power, temperature and house insulation can be representing in the following
equations:
ΔT = T1 - T2
ΔT = P × RT (1)
Where
T1 is the indoor temperature;
T2 is the outdoor temperature;
ΔT is the temperature difference between indoor and outdoor;
P is the power, which means how fast energy flows;
R T is the house insulation constant.
The above equation works similar as Ohm's law, which implies the temperature and house
insulation relation can be represent into a circuit. Figure 4.8.2 shows the circuit representation of
temperature and house insulation.

04/25/2013 Worcester Polytechnic Institute Peng Ren, Tianci Zhao
51
Figure 4.8.2 V=I × R (2)
Z=R × C (3)
Where
V0 represents the outdoor temperature T2
I represents the power P
R represents the house insulation constant R T
C represents energy store in the wall
Z represents thermal time constant, which show how fast does indoor temperature change.

04/25/2013 Worcester Polytechnic Institute Peng Ren, Tianci Zhao
52
By using the information provided above, the relationship of indoor temperature and house
insulation can be determined. To explain this idea more clearly, an example is provide below.
Assume in hot weather the outdoor temperature is 100 °F, air-conditioning power is 600W,
house insulation constant is 809hW/°F and T is indoor temperature. Figure 4.8.3 shows the
circuit representation for this condition.
Figure 4.8.3 Form Figure 4.8.4, the average power of air-conditioning is 300W when it turns on-off for every
15minutes.

04/25/2013 Worcester Polytechnic Institute Peng Ren, Tianci Zhao
53
Figure 4.8.4
From equation (3), R could be written as R= Z/C = Z/809
By applying Kirchhoff's voltage law, the directed sum of the voltage around any closed network
is zero.
T = 100 - 300R
= 100 - 300 × (Z/809) (4)
Equation 4 represents the relationship between house insulation constant, indoor temperature and
thermal time constant. Mat lab was used to graph corresponding indoor temperature and thermal
time constant due to the change of house insulation constant and it is shown in Figure 4.8.5.
Table 4.8.1 shows corresponding indoor temperature and thermal time constant due to the
change of house insulation constant.

04/25/2013 Worcester Polytechnic Institute Peng Ren, Tianci Zhao
54
Figure 4.8.5
Table 4.8.1
From Figure 4.8.5 and Table 4.8.1, it is clear that the house insulation is the key factor to keep
the house in a desired temperature. The better house insulation, the higher temperate keeps in
indoor and house would also keep warm for longer time.
4.9 Social Implication From the conclusion calculated above, some social implications could be gotten from here. The
house insulation is very important to people’s body comfort than most people’s imagination.
Living a house with good thermal insulation, people could definitely enjoy the life—easily cool

04/25/2013 Worcester Polytechnic Institute Peng Ren, Tianci Zhao
55
down the room temperature in summer with less power while keep the room warm during the
winter. In this case, people could achieve their psychological comfort with less energy
consumption. However, they need to pay price when you took their houses with good insulation
walls, which are too expensive to be afforded by ordinary people. Therefore, for those of forks
who cannot live in a house with well insulation, they must face the severity of harsh weather. To
gain the body comfort, these people have to spend more money on the electric device such as air-
conditioners or radiators. Worse more, if they cannot even afford that expenditure, the harsh
temperature may become a vital threat to their health and even life. This is why millions of
people die each year from suffering extremely hot or cold weather in either tropical areas or
polar regions.

04/25/2013 Worcester Polytechnic Institute Peng Ren, Tianci Zhao
56
Reference
[1] http://www.wpi.edu/Images/CMS/UGP/Atwater_Kent_Efficiency_Plan.pdf
[2] Erik Newman, Andrew Laflash, and Nicholas Granata-Cappabianca, Atwater Kent Energy
Audit and Solar Energy. 2010.
[3] http://www.eia.gov/energyexplained/index.cfm?page=electricity_use
[4] http://blog.opower.com/2012/09/hot-and-heavy-energy-usage-how-the-demand-and-price-
for-electricity-skyrocketed-on-a-100-day/
[5] U.S. Energy Information Administration, Annual Energy Outlook 2012, Early Release, Table
[6] http://www.wpi.edu/Images/CMS/UGP/Atwater_Kent_Efficiency_Plan.pdf, Table
[7] http://www.buylightfixtures.com/images/view.aspx?productId=842
[8] http://lightinglab.fi/IEAAnnex45/publications/Technical_reports/lighting_in_schools.pdf
[9] http://www.wpi.edu/Images/CMS/UGP/Atwater_Kent_Efficiency_Plan.pdf
[10] http://www.buylightfixtures.com/images/view.aspx?productId=842
[11] http://lightinglab.fi/IEAAnnex45/publications/Technical_reports/lighting_in_schools.pdf

04/25/2013 Worcester Polytechnic Institute Peng Ren, Tianci Zhao
57
Appendices
A-1 Survey On Opinions About Installation Motion Sensor In Household

04/25/2013 Worcester Polytechnic Institute Peng Ren, Tianci Zhao
58

04/25/2013 Worcester Polytechnic Institute Peng Ren, Tianci Zhao
59
A-2 Survey About Air-conditioning Control Method For International Students
Q1 1. On hot summer days, do you ever feel cold when you are in a classroom with air-conditioning working?
Yes
No Q2 2. In the same condition described above, do you still feel hot?
04/25/2013 Worcester Polytechnic Institute Peng Ren, Tianci Zhao
60
Yes
No Q3 3. During summer, do you always let the air-conditioning open when you are home?
Yes
No Q4 4. Do you always leave the air-conditioning on when you are out?
Yes
No Q5 5. Do you always let the air-conditioning on when you are sleeping on summer?
Yes
No Q6 6. What temperature do you usually set for the air-conditioning on summer?
50-55℉
56-60℉
61-65℉
66-70℉
71-75℉
76-80℉
81-85℉
86-90℉
Other (please specify)

04/25/2013 Worcester Polytechnic Institute Peng Ren, Tianci Zhao
61
Q7 7. Do you ever used the timing shutdown function of air-conditioning to shut it down automatically after certain duration of time?
Yes
No Could you give the reason for using or not using?
Q8 8. If there is a policy to force every air-conditioning to shut down for 15 minutes after being used the same amount of time, would you back or against this law?
I would support it
I would against it
I don't care Could you give the reason?
Q9 9. If instead of 15 minutes, you could make a break time for the air-conditioning, how long would it be?
less than 15 minutes
less than 30 minutes
more than 1 hour
Other (please specify) Q10 10. Do you think intermittent utilization of air-conditioning is a good tradeoff between human comfort and energy saving?
Yes, It is a good tradeoff method
No, it is good for energy saving but sacrificing too much comfort
Absolutely no, due to inefficient energy saving and less comfort
Other (please specify)

04/25/2013 Worcester Polytechnic Institute Peng Ren, Tianci Zhao
62
A-3 Survey About Air-conditioning Control Method For American Students
Q1 1. On hot summer days, do you ever feel cold when you are in a classroom with air-conditioning working?
Yes
No Q2 2. In the same condition described above, do you still feel hot?
Yes
No Q3 3. During summer, do you always let the air-conditioning open when you are home?
Yes
No Q4 4. Do you always leave the air-conditioning on when you are out?
Yes
No Q5 5. Do you always let the air-conditioning on when you are sleeping on summer?
Yes
No Q6 6. What temperature do you usually set for the air-conditioning on summer?
50-55℉
56-60℉
61-65℉
66-70℉

04/25/2013 Worcester Polytechnic Institute Peng Ren, Tianci Zhao
63
71-75℉
76-80℉
81-85℉
86-90℉
Other (please specify) Q7 7. Do you ever used the timing shutdown function of air-conditioning to shut it down automatically after certain duration of time?
Yes
No Could you give the reason for using or not using?
Q8 8. If there is a policy to force every air-conditioning to shut down for 15 minutes after being used the same amount of time, would you back or against this law?
I would support it
I would against it
I don't care Could you give the reason?
Q9 9. If instead of 15 minutes, you could make a break time for the air-conditioning, how long would it be?
less than 15 minutes
less than 30 minutes
more than 1 hour
Other (please specify) Q10 10. Do you think intermittent utilization of air-conditioning is a good tradeoff between human comfort and energy saving?

04/25/2013 Worcester Polytechnic Institute Peng Ren, Tianci Zhao
64
Yes, It is a good tradeoff method
No, it is good for energy saving but sacrificing too much comfort
Absolutely no, due to inefficient energy saving and less comfort
Other (please specify)