FDOT System Setup - FSUTMSOnline · FDOT System Setup •Model implemented ... FDOT Machine...
148
-
Upload
phunghuong -
Category
Documents
-
view
238 -
download
0
Transcript of FDOT System Setup - FSUTMSOnline · FDOT System Setup •Model implemented ... FDOT Machine...

FDOT System Setup
FDOT System Setup
bull Model implemented on three servers running independently of each other ndash dotsd4hqmodel1d4bstateflus
ndash dotsd4hqmodel2d4bstateflus
ndash dotsd4hqmodel3d4bstateflus
bull Remote access via FDOT VPN ndash At this time access to FDOT cluster is limited to teams working on
LRTP
FDOT Machine Specifications
Unit Brand and Model
CPU Speed amp of Logical Cores RAM Hard Drive
D4 Model Server 1
Dell PowerEdge
R710
Intel Xeon X5690 347GHz 2 processors 12 cores 24 threads
192 GB 135 GB
D4 Model Server 2
Dell PowerEdge
R710
Intel Xeon X5690 347GHz 2 processors 12 cores 24 threads
192 GB 930 GB
D4 Model Server 3
Dell PowerEdge
R720
Intel Xeon E5-2650 200GHz 2 processors 16 cores 32 threads
256 GB 465 GB amp 363 TB
D4 Model WorkStation
Dell Precision WorkStation
T7500
Intel Xeon W5580 320GHz 2 processors 4 cores 8 threads
100 GB 279 GB amp 136 TB
FDOT System Setup
Open the catalog to access the model
Cube User Interface Modeling Platform
Running SERPM7 ndash Existing Scenario
bull Step 1 -- Select a scenario bull Available scenarios ndash 2010 Base Year Validation
ndash 2040 LRTP Existing plus Committed Scenario
ndash 2040 LRTP Needs Plan Scenario
bull Scenario data are stored in the input and output folders
Running SERPM7
bull Step 2 ndash Update the catalog keys to point to the selected scenario folders and scenario input file names
Catalog Key Description
DESC Scenario descriptive label (used in reports)
ALT Scenario identifier (one letter)
year Year
DATADIR Input folder (full path name)
OUTDIR Output folder (full path name)
Input Hwy Net Input highway network layer (full path name)
TLines Input transit route layer (full path name)
Running SERPM7
bull Step 3 (Optional) ndash Update HEVAL catalog keys with appropriate values for the run Default values in parenthesis
Catalog Key Description
AnalysisYr_TTV_VOC Analysis Year (2010)
BaseYr_TTV_VOC Base Year (2010)
Inflation_TTV Value of time inflation rate (0)
Inflation_VOC Auto operating cost inflation rate (0)
Running SERPM7
bull Step 4 -- Set the population sampling rates
bull Example ndash samplerate = 05 hellip 1 out of every 2 households is simulated
ndash samplerate = 01 hellip 1 out of every 10 households is simulated
ndash vsamplerate = 025 hellip 1 out of every 4 visitor parties is simulated
Catalog Key Description
SAMPLERATE Sampling rate for the resident population
VSAMPLERATE Sampling rate for the visitor population
Running SERPM7
bull Step 5 (Optional) ndash Update the number of feedback iterations ndash Default settings
bull Run until travel time convergence (01 RMSE)
bull Maximum 5 feedback loops
Set the loop counter can be more or less than 5
Running SERPM7
bull Step 6 ndash Press Run
Running SERPM7
bull All model steps except CT-RAMP and Visitor Model are implemented in Cube Script ndash Highway Network Building
ndash Transit Network Building
ndash Non-ABM Trip Generation and Trip Distribution
ndash Highway and Transit Assignment
ndash Highway Evaluation Reports
bull CT-RAMP and Visitor Model are implemented in Java they are run by Cube using DOS prompt commands
Running SERPM7
Running SERPM7
RunCTRAMP Pilot Script
rmdir OUTDIRABMTEMP S Q rmdir DATADIRABMTEMP S Q xcopy OUTDIR OUTDIRABMTEMP E I Y xcopy DATADIR DATADIRABMTEMP E I Y if(fbi=1) need to run only the first time through - kdk CUBEctramprunCreateAccessFilescmd endif mkdir logFiles taskkill im javaexe F start CUBEctramprunHhMgrcmd JDK64 HOST_IP start CUBEctramprunMtxMgrcmd HOST_IP JDK64 rem start CUBEctrampconfigrunDrivercmd copy CUBEctrampserpm_abmproperties serpm_abmproperties Y ping -n 11 127001 gt nul CUBEctramprunSERPMAbmcmd SAMPLERATE VSAMPLERATE JDK64 CUBEctramprunCreateDemandMatricescmd SAMPLERATE VSAMPLERATE JDK64 taskkill im javaexe F rmdir OUTDIRctramp S Q rmdir DATADIRctramp S Q xcopy OUTDIRABMTEMPctramp OUTDIRctramp E I Y xcopy DATADIRABMTEMPctramp DATADIRctramp E I Y
Run CT-RAMP Pilot Script
Step 1 ndash Create access files
rmdir OUTDIRABMTEMP S Q rmdir DATADIRABMTEMP S Q xcopy OUTDIR OUTDIRABMTEMP E I Y xcopy DATADIR DATADIRABMTEMP E I Y if(fbi=1) need to run only the first time through - kdk CUBEctramprunCreateAccessFilescmd endif mkdir logFiles taskkill im javaexe F start CUBEctramprunHhMgrcmd JDK64 HOST_IP start CUBEctramprunMtxMgrcmd HOST_IP JDK64 rem start CUBEctrampconfigrunDrivercmd copy CUBEctrampserpm_abmproperties serpm_abmproperties Y ping -n 11 127001 gt nul CUBEctramprunSERPMAbmcmd SAMPLERATE VSAMPLERATE JDK64 CUBEctramprunCreateDemandMatricescmd SAMPLERATE VSAMPLERATE JDK64 taskkill im javaexe F rmdir OUTDIRctramp S Q rmdir DATADIRctramp S Q xcopy OUTDIRABMTEMPctramp OUTDIRctramp E I Y xcopy DATADIRABMTEMPctramp DATADIRctramp E I Y
Run CT-RAMP Pilot Script
bull Step 1 ndash runCreateAccessFilescmd ndash Creates the walk and transit access amp egress connectors
bull MAZ to MAZ connectors
bull MAZ to TAP walk connectors
bull TAZ to TAP drive connectors
ndash Fully implemented in Cube script
ndash Runs only during the initial feedback loop
rem Set location of Voyager for running Cube scripts set VOYAGER=CProgram Files (x86)CitilabsCubeVoyagerVoyagerexe rem create CT-RAMP maz impedances and maz densities VOYAGER Cserpm7ctrampapplicationsave_maz_dbfs Start VOYAGER Cserpm7ctrampapplicationabm_access_filess Start VOYAGER Cserpm7ctrampapplicationmaz_densitiess Start
Run CT-RAMP Pilot Script
Step 2 ndash Start Household amp Matrix Managers
rmdir OUTDIRABMTEMP S Q rmdir DATADIRABMTEMP S Q xcopy OUTDIR OUTDIRABMTEMP E I Y xcopy DATADIR DATADIRABMTEMP E I Y if(fbi=1) need to run only the first time through - kdk CUBEctramprunCreateAccessFilescmd endif mkdir logFiles taskkill im javaexe F start CUBEctramprunHhMgrcmd JDK64 HOST_IP start CUBEctramprunMtxMgrcmd HOST_IP JDK64 rem start CUBEctrampconfigrunDrivercmd copy CUBEctrampserpm_abmproperties serpm_abmproperties Y ping -n 11 127001 gt nul CUBEctramprunSERPMAbmcmd SAMPLERATE VSAMPLERATE JDK64 CUBEctramprunCreateDemandMatricescmd SAMPLERATE VSAMPLERATE JDK64 taskkill im javaexe F rmdir OUTDIRctramp S Q rmdir DATADIRctramp S Q xcopy OUTDIRABMTEMPctramp OUTDIRctramp E I Y xcopy DATADIRABMTEMPctramp DATADIRctramp E I Y
Run CT-RAMP Pilot Script
bull Step 2 ndash Start Household and Matrix Managers ndash Java applications used by the ABM software to readwrite Cube
matrices and for distributing household ldquojobsrdquo to computer threads
Run CT-RAMP Pilot Script
Step 3 ndash Run SERPM ABM and Visitor Model
rmdir OUTDIRABMTEMP S Q rmdir DATADIRABMTEMP S Q xcopy OUTDIR OUTDIRABMTEMP E I Y xcopy DATADIR DATADIRABMTEMP E I Y if(fbi=1) need to run only the first time through - kdk CUBEctramprunCreateAccessFilescmd endif mkdir logFiles taskkill im javaexe F start CUBEctramprunHhMgrcmd JDK64 HOST_IP start CUBEctramprunMtxMgrcmd HOST_IP JDK64 rem start CUBEctrampconfigrunDrivercmd copy CUBEctrampserpm_abmproperties serpm_abmproperties Y ping -n 11 127001 gt nul CUBEctramprunSERPMAbmcmd SAMPLERATE VSAMPLERATE JDK64 CUBEctramprunCreateDemandMatricescmd SAMPLERATE VSAMPLERATE JDK64 taskkill im javaexe F rmdir OUTDIRctramp S Q rmdir DATADIRctramp S Q xcopy OUTDIRABMTEMPctramp OUTDIRctramp E I Y xcopy DATADIRABMTEMPctramp DATADIRctramp E I Y
Run CT-RAMP Pilot Script
bull Step 3 ndash Run SERPM ABM and Visitor Models ndash Sets and runs SERPM ABM (runSERPMABMcmd)
bull Sets environment variables
bull Gets sampling rates project folders and other run-time variables
bull Sets the ABM properties file
bull Calls SERPM ABM and Visitor Model JARS (executables)
Run CT-RAMP Pilot Script
Step 4 ndash Create Trip Tables for Assignment
rmdir OUTDIRABMTEMP S Q rmdir DATADIRABMTEMP S Q xcopy OUTDIR OUTDIRABMTEMP E I Y xcopy DATADIR DATADIRABMTEMP E I Y if(fbi=1) need to run only the first time through - kdk CUBEctramprunCreateAccessFilescmd endif mkdir logFiles taskkill im javaexe F start CUBEctramprunHhMgrcmd JDK64 HOST_IP start CUBEctramprunMtxMgrcmd HOST_IP JDK64 rem start CUBEctrampconfigrunDrivercmd copy CUBEctrampserpm_abmproperties serpm_abmproperties Y ping -n 11 127001 gt nul CUBEctramprunSERPMAbmcmd SAMPLERATE VSAMPLERATE JDK64 CUBEctramprunCreateDemandMatricescmd SAMPLERATE VSAMPLERATE JDK64 taskkill im javaexe F rmdir OUTDIRctramp S Q rmdir DATADIRctramp S Q xcopy OUTDIRABMTEMPctramp OUTDIRctramp E I Y xcopy DATADIRABMTEMPctramp DATADIRctramp E I Y
Run CT-RAMP Pilot Script
bull Step 4 ndash createDemandMatricescmd ndash Creates Cube format trip tables for highway and transit assignment
ndash Translates the ABM amp Visitor Model list of trips into matrix format
ndash Three sets of demand matrices
bull Resident trips
bull Visitor trips
bull Resident + Visitor trips
ndash This step is implemented in Cube Script
The CT-RAMP Properties File
bull A settings file is used to control the ABM software ndash ctrampserpm_abmproperties
bull The majority of the properties (settings) in this file are set during model installation and do not need to be changed for a typical model run
bull Properties are described in the User Guide bull Example properties ndash Settings to control trace calculations
ndash System environment properties
ndash Input and output filenames
ndash Settings that specify how to read the utility expression calculators (UECs)
The CT-RAMP Properties File
bull Exhibit serpmabmproperties
Monitoring Run StatusProgress
bull Cube scripted components progress is tracked by Cubersquos Task Monitor
Monitoring Run Status
bull Java components status is reported to the log files ndash CubelogFileseventlog
ndash CubelogFiles
bull The log files are text files that can be opened with any text editor (Notepad Wordpad Ultraedit etc)
bull What is reported ndash Step being executed
ndash A few model output summaries
ndash Errors
ndash Trace calculations
bull While Java components are running status of Task Monitor does not change
Monitoring Run Status
bull Exhibit cubeeventlog
Running SERPM7 ndash New Scenario
bull Step 1 ndash Create input and output scenario folders ndash Suggested scenario naming convention
bull inputIN-YEARALT
bull outputOUT-YEARALT
bull Copy all input files from an existing scenario including all subfolders
bull Update new scenario-specific files ndash Highway transit networks
ndash Household person synthetic population
ndash Land use data
bull Proceed with Steps 2 thru 6 for running an existing scenario
FDOT Servers Run Times
Feedback Loop End Time Runtime (HHMM)
RMSE (AM amp PM)
1 945 1045 1226 amp 1363
2 1648 703 060 amp 058
3 119 831 023 amp 020
4 806 647 012 amp 009
5 1458 652 008 amp 006
Total ~40 hrs
Model Server 3 20 Sample
FDOT WorkStation Run Times
Machine Sample Size Run Time (HHMM)
Model WorkStation
1 048
5 240
10 503
20 949
Model Server 3 20 400
CT-RAMP Only
Model Installation
SERPM7 Installation
bull Installation package and User Guide available from Florida DOT via FSUTMS Online
bull Hardware and software requirements and installation instructions described in User Guide
bull Sample model output available from Florida DOT
SERPM7 Installation
bull Hardware Requirements ndash 64-bit Operating System
ndash Intel Xeon X5690 347 GHz 6 core processors or similar
ndash Minimum 96 GB RAM
ndash Minimum 1 TB space for storing model output
bull Software ndash Cube 61 wcluster license
ndash SQL SQL Express
ndash Java
ndash Microsoft Excel (optional)
SERPM7 Installation
bull Step 1 ndash Create the Project Folder ndash Set user permission level to lsquoEveryonersquo
bull Step 2 ndash Configure the machines ndash Set environment variables
ndash Install Java and set its environment variables
ndash Verifyinstall Cube 64-bit matrix IO DLL
ndash Other hellip
bull Step 3 ndash Configure the JPPF services bull Step 4 ndash Configure the ldquoRunrdquo component files bull Step 5 ndash Configure SERPM7 in Application Manager bull Step 6 ndash Create the seed skims
Application 1 Working with a Population Sample
Working with a Population Sample
bull A simulation of the entire population is not required for every single application ndash Small sample sizes are sufficiently accurate for forecasting aggregate
region or county-wide statistics
ndash Small sample sizes save run time during model calibration and when testing initial versions of new networks and other input data
Working with a Population Sample
bull Developing a region-wide forecast using travel outcomes for a sample of the population is analogous to estimating region-wide travel statistics using a survey sample
Survey Simulation
Gathers trip diary information for a sample of households
Simulates trips for a sample of households
Typical sampling rate 020 - 025
Typical sampling rate 5 - 50
Estimates travel patterns for entire population by multiplying each surveyed trip record by an
expansion factor
Estimates travel patterns for entire population by multiplying each simulated trip record by an
expansion factor
Typical expansion factors 100 - 1000
Typical expansion factors 2 - 20
Working with a Population Sample
bull The ABM assumes that each household makes travel decisions independently of the decisions made by all other households
bull Households are simulated independently of each other bull The ABM samples randomly from the list of households to
select the ones it simulates bull It is prudent to verify that the selected population sample is
unbiased ndash A very small (1 or less) simple random sample is likely to be biased
for example it will likely mis-represent households that are found infrequently in the population
ndash Samples of 10 or more are typically sufficiently unbiased for travel demand forecasting applications
Working with a Population Sample
bull How big a sample to use ndash The more localized the expected impact of a project the larger the
required sample
bull Some recommendations ndash For model calibration and validation 10-25 is typically sufficient
ndash For comparing aggregate county-wide and sub-county average travel statistics 10 - 25
ndash For estimating daily traffic volumes on high capacity facilities and high capacity transit 25 - 50
ndash For traffic impact studies 50 - 100
bull hellip but testing highly encouraged
Working with a Population Sample
bull A sample expansion factor is applied when creating the trip tables for assignment
bull Expansion factor = 1samplingRate bull Loads on highway and transit networks are representative
of the entire population bull Summaries produced from the ABM list output need to be
expanded to be representative of the entire population
Running SERPM7 with a Population Sample
bull Setting the run ndash Set the sampling rate for residents and visitors in Cube
ndash All other model settings can remain unchanged
bull The same sampling rate is used on all feedback loops
Catalog Key Description
SAMPLERATE Sampling rate for the resident population
VSAMPLERATE Sampling rate for the visitor population
Running SERPM7 with a Population Sample
bull When working with a ldquoless than 100rdquo model run each record in the output list files has to be expanded by 1samplingRate ndash householdData_v1csv
ndash personData_v1csv
ndash indivTourFile_v1csv
ndash jointTourFile_v1csv
ndash indivTripFile_v1csv
ndash jointTripFile_v1csv
bull Trip tables are already expanded ndash TAZ_Demand_tmat
ndash TAP_Demand_tmat
Running SERPM7 with a Population Sample
bull Sample Output ndash County-wide highway assignment statistics
Screenline 25
Sample 50
Sample Diff ()
BOEW Northern SL along Pompano Canal 842418 843591 -01
BOEW Middle SL along Oakland Park Blvd 1187251 1183529 03
BOEW Southern SL along River Canal 881601 879618 02
BONS Western SL between I75 and TPK 586412 587353 -02
BONS Middle SL along TPK 1441311 1437065 03
BONS Eastern SL along Intracostal Wway 328855 326298 08
BOEW SL BOPB County Line 648960 648771 00
BOEW SL BOMD County Line 979327 976276 03
BOWestern Ext CL Collier County Line 31059 31059 00
BONS I-95 CL from Miami-Dade to I-595 510207 509537 01
BONS Western CL along SR897 frm PB-SR816 494591 495547 -02
Running SERPM7 with a Population Sample
Running SERPM7 with a Population Sample
Running SERPM7 with a Population Sample
bull Sample Output ndash Individual Route Boardings
Running SERPM7 with a Population Sample
bull Sample Output ndash Individual Route Boardings
Running SERPM7 with a Population Sample
bull Sample Output ndash Regionwide Household Income Profile
Household Income 25 Sample 100 Sample
Less than $10000 1015 1021
$10000 to $15000 470 468
$15000 - $20000 566 564
$20000 to $25000 519 516
$25000 to $30000 493 494
$30000 to $35000 475 477
$35000 to $40000 387 387
$40000 to $45000 343 345
$45000 to $50000 348 348
$50000 to $75000 1754 1747
$75000 to $100000 1432 1433
$100000 or More 2198 2200
Application 2 Population Synthesis
Population Synthesis
bull Each SERPM7 scenario requires a synthetic population ndash List of households -- hhFilecsv
ndash List of persons that make up the households -- personFilecsv
bull Two synthetic populations have been developed to date ndash 2010 base year population
ndash 2040 long range transportation plan population
Population Synthesis
bull New synthetic populations will be required for ndash Other regional scenario years (eg 2020 2025 2045)
ndash To test population and land use scenarios such as
bull Traffic impact study for a new housing or commercial development
bull Impact of aging population
bull Impact of rising sea levels (because some neighborhoods will no
longer be inhabitable)
bull Refinements to the 2010 and 2040 populations
Population Synthesis
bull The population synthesizer (PopSynII) does not run normally as part of SERPM7 ndash SERPM7 expects input population files in the input folder
ndash User is responsible for running PopSynII to generate the required population files and place them in the scenario folders prior to a SERPM7 run
bull Why ndash Because a new synthetic population is not required for every run
PopSyn II Setup
bull PopSynII is already configured to run on the FDOT servers bull Java application using SQL data storage
PopSynII installed in the main ctramp folder
PopSynII Setup
bull The ctramppopsyn folder
Filename Description
runAllPopsynbat Batch file that controls the execution of PopSynII
controls SQL settings file that specifies the population attributes used as controls
1_importCSVsql 2_createTargetssql 3_createSynHHPerFilessql
SQL scripts that run the PopSynII software
2010_TAZ_Datacsv TAZ input control data
2010_MAZ_Datacsv MAZ input control data
Developing a New Synthetic Population
bull Step 1 ndash Prepare the input files ndash TAZ controls 2010_taz_datacsv
ndash MAZ controls 2010_maz_datacsv
Developing a New Synthetic Population
bull MAZ Control input file eg 2010_maz_datacsv ndash Estimates of total households and persons living in group quarters
bull Total households
bull Total group quarter population
ndash One record for each MAZ
Developing a New Synthetic Population
bull TAZ Controls input file -- eg 2010_taz_datacsv ndash Estimates of number of households or population for each SERPM7
controlled attribute
bull Household size
bull Household income
bull Household workers
bull Type of dwelling unit
bull Presence of children in the household
bull Population age group
bull Gender
bull Raceethnicity
bull Population in group quarters
ndash One record per TAZ
Analogous to the TAZ SE data file in the trip-
based model
Developing a New Synthetic Population
When preparing TAZ and MAZ control data it is critically important to
maintain internal data consistency
Developing a New Synthetic Population
bull Some data checks to perform and problems to look out for ndash The household and person marginals pertain to household residents
only except for the group quarter controls
ndash All household-based marginals add up to the same total households for each TAZ
ndash All person-based marginals add up to the same total persons for each TAZ
ndash The total number of persons implied by the household size marginal is consistent with the sum total of the person marginals
ndash The total number of children obtained from the age marginal is consistent with the marginal of households by presence of children
ndash Large deviations from 5050 split of persons by gender is suspect
ndash The household income distribution is consistency with the workers-in-household distribution
Developing a New Synthetic Population
bull More data checks ndash The MAZ and TAZ controls should add up
bull to the same number of households by TAZ
bull to the same number of persons in group quarters by TAZ
Developing a New Synthetic Population
bull Exhibit ndash SERPM7 2010 TAZ control file
Example ndash Minto West Palm Beach Co
Example ndash Minto West
bull Mixed-use development in a agricultural area adjacent to an existing housing development
bull Information available from proposedapproved plans ndash Single-family dwelling units ndash 5050
ndash Multi-family dwelling units ndash 1040
ndash Total population ndash 14 535 persons
ndash Spatial location of dwelling units by type
bull Other PopSyn required data not available from plans (income distribution age distribution etc) ndash Estimateassert it based on similar existing developments
surrounding neighborhood
Example ndash Minto West
bull Adding householdspersons to a TAZ
bull Adding TAZs or MAZs to SERPM7 should be a rare occurrence ndash Households are ultimately allocated to MAZs and therersquos already
12000 of them
ndash Households are represented individually so the zone attributes are derived from them
Trip-Based Model Modify the input zonal data file
Activity-Based Model Modify the population synthesis control file
Running PopSynII
bull Step 2 ndash Modify the PopSyn settings file for this run ndash Update TAZ and MAZ control filenames in runAll_popsynbat
REM BATCH FILE TO SETUP POPSYN RUN RUN POPSYNII AND OUTPUT CSV FILES REM SETUP REM PLEASE SET PATH NAMES FOR WORKING FOLDER AND CSV FILE LOCATIONS SET SERVERNAME=W-AMSTL-D-00052SQLEXPRESS SET DATABASENAME=popSyn SET ARCPATH=Cpopsyn SET CSVPATH_CONTROLS=Cpopsyninputscontrolscsv SET CSVPATH_MAZ=Cpopsyninputs2010_MAZ_Data_20120207csv SET CSVPATH_TAZ=Cpopsyninputs2010_TAZ_Data_20120207csv REM MAIN SCRIPT REM MAKE FILENAMES TABLE REM sqlcmd -S SERVER NAME -E -i INPUT FILE PATH (SCRIPT) -o OUTPUT LOG REM -E means to use Windows authentication for the user that is running the batch file SQLCMD -S SERVERNAME -d DATABASENAME -E -Q IF OBJECT_ID(dbocsv_filenames) IS NOT NULL DROP TABLE csv_filenames -o ARCPATHResultLogtxt
hellip hellip
Running PopSynII
bull Other PopSyn settings ndash rarely used in a production run ndash Change the control attributes
ndash Change the priority of control attributes
Running PopSynII
bull Step 3 ndash Run PopSynII -- runAll_popsynbat
Running PopSynII
bull Step 4 ndash Review Output amp Check Fit to Controls
Output File Description
hhFilecsv List of households
personFilecsv List of persons
ZoneResultscsv Comparisons of synthetized households to controlled and uncontrolled attributes
BalanceDetailscsv
ValidationStatscsv
ValidationStatsByPumacsv
Reviewing PopSyn Output
bull Zone_Resultscsv bull Comparison of synthesized totals to target totals for each
TAZ and controlled attribute
TOTAL_HOUSEHOLDS
ZONE TARGET SYNTHESIZED DIFFERENCE PCTDIFF
1 715 715 0 0
2 811 811 0 0
3 878 878 0 0
4 826 826 0 0
5 1181 1181 0 0
6 212 212 0 0
7 459 459 0 0
8 253 253 0 0
Reviewing PopSyn Output
bull Balance_Detailscsv bull Same output as Zone_Results different format
Zone Control ID ControlCat Target PUMSVal ConStat
1989 109 TOTAL_HOUSEHOLDS 1508 1508 yes
1989 249 INCOME_25K 273 271 no
1989 19 HHSIZE_4PLUS 467 467 yes
1989 160 FEMALE 2196 2108 no
1989 55 INCOME_100K 258 257 yes
1989 67 MULTI_UNIT 423 407 no
1989 31 WORKERS_3PLUS 164 166 no
Reviewing PopSyn Output
bull Validation_Statscsv ndash Comparison of synthesized attributes to input Census data (5 PUMS)
ndash Includes uncontrolled attributes
Description popSynSum censusSum meanDiff stdDev minDiff maxDiff Universe 1 number of households 2085375 1964881 17 61 -97 331
family 67 65 3 17 -26 48
non family 33 35 0 34 -58 111
size 1 27 28 0 36 -59 111
size 2 31 32 -3 14 -30 30
size 3 17 17 1 22 -37 53
size 4 25 23 18 50 -46 160
Reviewing PopSyn Output
bull Validation_StatsByPumacsv ndash Same as validation_stats but for each PUMA
bull Note that synthesized population may differ from 5 Census population by design
Application 3 ndash Highway Project
Highway Project
Example Projects ndashToll road extension ndashReversible lanes ndashManaged lanes
Overview
How to use SERPM7 to perform a model run and do some standard analysis ndash Option 1 -- Code the project directly on the geodatabase
bull Roadway links
bull Node links
bull Turn penalties
bull [assume no change to transit]
ndash Option 2 --Code the project on net files and then build the geodatabase
bull Use flowchart script to build the geodatabase
ndash Coding is very similar to earlier versions of SERPM
bull Facility types are the same
SERPM Facility Types (not new)
Editing the Highway Network
bull SERPM 7 requires a geodatabase bull Editing can be done either to a net file or directly on the
geodatabase bull The user can use utilities in the model flowchart to write a
net file from the geodatabase edit the net and then write it to the geodatabase
bull The geodatabase must exist to run the model
Editing in the Geodatabase
bull Simplest and most direct method bull Requires an understanding of the CubeArcGIS tools
Export geodatabase and edit as a net
bull Start Data Manager bull Open geodatabase (SERPM_NETSMDB) bull Double click on the network Input Hwy Net and specify an
output file (maybe ldquoeditnetrdquo) bull Open from Cube and edit as usual bull Use ldquoPrepare for Model Run and Trap Errorsrdquo (2) utilities to
write back to geodatabase ndash Reload geodatabase from Cube files ndash Cull and sort
ndash Write to geodatabase
Edit as a net
Export Edit in Cube
Change to point to edited network
Input Hwy Net
Toll Road Extension
bull Short Cut ndash copy an existing toll link bull No special NODE attributes bull Only new attribute is ISTOLL=1 for all links that could not be
used unless a toll were paid bull Toll Mainline FTC2=91 ISTOLL=1 DIRCODE=1 bull Plaza (gantry) ndash assume all will be electronic collection ndash TOLL=1 DIRCODE=1
ndash TOLLTYPE=3 CARTOLL=toll in dollars
ndash FTC2=95
ndash ISTOLL=1
ndash SVCSECONDS=001
ndash DELCODE=1 ACCELCODE=1 AVILANES=2
Toll Road Extension
Not much different from earlier versions of SERPM
Reversible Lanes
bull Control by the link attribute REVERSIBLE ndash REVERSIBLE=1 means AM operation only
ndash REVERSIBLE=2 means PM operation only
ndash I-595 example
Managed Lanes (typically Express)
bull HOT=1 ndash 98 (99 makes the link a dummy) bull FTC2 most likely=91 but other types permitted bull TOLL=0 ISTOLL=0 bull Tolls set by HOTTOLLdbf
HOT Lanes Tolls
bull Set as a function of the VC bull Updated in the travel time feedback loop bull Affects the TollFree split in mode choice bull Column HOT_x were x=HOT link attribute bull HOT_1 is the current 95 Express rate HOT_2 is a placeholder
Common Errors
bull Errors to watch out for ndash If network steps fail look for missing attributes
ndash Update transit routes as needed due to changes to underlying highway network
ndash Check for dangling links and unconnected zones
ndash Verify that all TAZs are connected to lsquofreersquo roads
bull Special procedures required for TAZs that have toll-only access must
include the attribute ISRCTOLLINK=1 (currently used for the
Rickenbacker Causeway)
ndash Some CT-RAMP errors caused by network coding errors may not be apparent until feedback loop 2 because in loop 1 CT-RAMP uses seed skims
bull Use small sample size when testing a new network
Was the Run Successful
bull Did the run converge ndash AM and PM travel time RMSE values reported to
OUTDIRfeedbacklogprn
ndash Run stops when RMSE is less than 01
ndash 2010 Scenario converges in 5 loops
bull What to do if it didnrsquot converge ndash Look for obvious errors
ndash Run more iterations (future year might require more)
bull Are the top-level results comparable to a similar run ndash Use HEVAL reports
ndash Examine screenlines (RMSE reports)
ndash Spot check link loads
Tools for Analysis
bull Analysis ndash perform standard highway project type analyses
bull Usual analysis similar to trip-based model ndash Total daily and period-specific roadway volumes and speeds by
vehicle class
ndash Vehicle trip OD matrices
bull Standard FSUTMS HEVAL and RMSE reports are still available ndash Day and period assignments
ndash By County
ndash Truck assignment
Tools for Analysis
bull Potential for customized assignment classes to address
specific project questions ndash Does the manage lane serve primarily high income users
bull Stratify vehicle classes by lowhigh income to understand facility
usage by income level
bull Stratify vehicle classes by disadvantaged population cohorts
bull Trip and person tabulations built from ABM output ndash Trip mode shares for many different population cohorts subareas
ndash For example toll vs non-toll shares by value of time or fine-graded income levels
ndash Many other possibilities
Application 4 ndash Mobility Project
Mobility Project ndash SUNPASS Market Share
bull Persons in households that own a SUNPASS transponder respond differently to managed lane and toll road policies ndash Pay lower tolls than cash users
ndash Have access to I-95 managed lanes
bull Policy questions ndash How does projected toll traffic and revenue vary with the SUNPASS
penetration rate and toll discount
ndash How will SUNPASS penetration rate vary as more managed lane facilities are built in the region
Mobility Project ndash SUNPASS Market Share
bull Question 1 -- How does projected toll traffic and revenue vary with the SUNPASS penetration rate and toll discount
bull Procedure ndash Step1 ndash Assume a SUNPASS market share by modifying the toll
transponder model
ndash Step 2 ndash Run SERPM7 to produce traffic volumes
ndash Step 3 ndash Estimate toll traffic revenue
Modifying the Toll Transponder Ownership Model
bull Model specification is contained in TransponderOwnershipxls and can be edited with Microsoft Excel
Utility Variable Coefficient
Expected time savings up to 644 min 00631
Distance less than 5 miles -00304
Distance between 5 and 10 miles -00648
Distance 10 miles or more -00648
Constant 04877
Modifying the Toll Transponder Ownership Model
Utility Variable Coefficient
Expected time savings up to 644 min 00631
Distance less than 5 miles -00304
Distance between 5 and 10 miles -00648
Distance 10 miles or more -00648
Constant 04877
Increasing the constant will increase the number of households equipped with transponders
TransponderOwnershipxls
Modifying the Toll Transponder Model
bull Increase the constant by how much ndash Process is akin to model calibration
ndash Several runs of the transponder model required to estimate the constant that yields the desired market share
ndash 2010 market share is approximately 65
ndash Use a small sample (5 or 10) to save run-time while establishing the right constant
Modifying the Toll Transponder Model
bull Variation ndash Add terms to the model so that certain types of households are more
likely to exhibit a SUNPASS market share increase
bull Highlow income households
bull Multi-car households
bull Miami-Dade households
Modifying the Toll Transponder Model
bull Exhibit TransponderOwnershipxls
Mobility Project ndash SUNPASS Market Share
bull Question 2 -- How will SUNPASS penetration rate vary as more managed lane facilities are built in the region
bull Procedure ndash Step 1 ndash Code the manage lane facilities
ndash Step 2 ndash Run SERPM7 to forecast transponder ownership
ndash Step 3 ndash Analyze the forecast household data for changes in the profile of households equipped with transponders
Application 5 ndash Land Use Project
Land Use Project
bull Transportation projects comprise not only network scenarios but also land use scenarios
bull Land use scenarios can be ndash Very large scale (substantial changes to housing and employment
estimates throughout the region) or
ndash Small scale (localized changes for example for a traffic impact study)
bull For both large scale and small scale land use updates the
general procedure for updating the input data and running the model is the same
Land Use Project
bull The land use data in SERPM7 consists of ndash Synthetic population and derived input files
ndash Employment data
ndash School enrollment data
ndash Parking costs and parking spaces
ndash Regional shopping mall special generators
ndash Beach special generators
ndash Hotel and motel room data
Land Use Project
bull The land use data reside in different input files
Data Item Input File
Synthetic Population hhFilecsv personFilecsv ctramppopsynTAZDatacsv ctramppopsynMAZDatacsv
Employment School Enrollment Parking Supply Data Special Generators Hotel and Motel Rooms
inputsIN-2010Rmaz_datacsv
Land Use Project
bull As demonstrated earlier SERPM 7 requires significantly more comprehensive socio-economic inputs as compared to previous versions ndash Greater spatial detail
ndash More categoriestypes of land uses
bull These inputs require additional preparation when
performing land use model runs
Land Use Project
Data Required and examples bull Population
bull Age distribution of the population expected to live in the
development
bull Income profile
bull Type of dwelling unit (single-family vs multi-family)
ndash The input data need to be internally consistent (distribution of households by presence of children needs to be consistent with population age distribution for example)
Land Use Project
Data Required bull Employment classification ndash Previous models had three
employment classifications
ndash In SERPM 7 there are 16 employment categories to better differentiate type of land use and improve the relationship between land use and activity purpose
Land Use Project
Data Required bull School enrollment ndash note that it differentiates by grade level
(K-8 high-school collegepost-secondary) ndash Donrsquot forget to include school faculty and staff in employment
Land Use Project
Data Required bull Parking supply and
parking costs ndash Parking spaces may
reflect use restrictions
bull Monthly
bull Daily
bull Hourly
ndash Parking costs consistent with type of use
Land Use Project
bull Park Area 1 (pink) ndash May park in MAZ other
than destination MAZ
ndash Parking cost applies
bull Park Area 2 (gree) ndash Parks at destination MAZ
ndash Parking cost applies
Land Use Project
Data Required bull Visitor Model ndash Number of hotel and motel rooms
bull Special Generators ndash Regional shopping malls
ndash Beach recreation areas
Land Use Project
The Gardens Mall Aventura Mall
Boynton Mall Dolphin Mall
Delray Community Mall Dadeland Mall
Towncenter Mall The Falls Shopping Center
Wellington Greens Mall Cutler Ridge Mall
Coral Square Mall Bal Harbour Shops
Pompano Citi Centre CocoWalk
Sawgrass Mills Mall The Mall at 163rd Street
Broward Mall Mall of the Americas
Galleria Mall Mary Brickell Village
Pembroke Lakes Mall Miami International Mall
Lakes Mall Miracle Marketplace
Oakwood Plaza Village of Merrick Park
The Promenade at Coconut Creek Westland Mall
Regional Shopping Mall Special Generators
Land Use Project
Deerfield Beach
Pompano Beach
Fort Lauderdale Beach
Fort Lauderdale Beach
Hollywood Beach
South Beach
Haulover Beach
Crandon Park
Dania Beach
Bill Baggs State Park
Beach Special Generators
Land Use Project
Sample Problem
bull MINTO West Example - a mixed residentialcommercial development ndash 6500 singlemulti-family residential units in multiple TAZs
ndash 14 million square feet of non-residential space
ndash 150 room hotel
ndash 3000 student college campus
Land Use Project
MINTO WEST
Land Use Project
TAZsMAZs representing MINTO West Development
Land Use Project
Need to translate population household and employment information from developer into model input data ndash As discussed in the Population Synthesis presentation population and
household attribute estimates can be taken from other known nearby neighborhoods
bull In this sample problem first start by allocating percentages of total
households into individual MAZs within the development area
bull Keep in mind household density when estimating the number of
households in each MAZ
Land Use Project
bull In this sample employment can be assumed to include bull Retail
bull RestaurantsBars
bull Offices
bull Health services
bull Hotelmotel employment and
bull Educational employment
ndash As with households yoursquoll need to apportion the employment areas to individual MAZs while keeping in mind the types of employment expected in those locations
Land Use Project
bull Employment data is usually estimated by converting floor space available to individual types of employment through conversion factors
bull ie ndash (3000 sqft office space)(20 sqft per office employee) =
150 office employees
Land Use Project
bull Once population household and employment figures are estimated they are entered into the appropriate model input file
bull Population ndash TAZ synthetic population control file
bull Household ndash TAZ synthetic population control file
bull Employment School Parking and Special Gen ndash maz_datacsv
bull Ensure that population household and employment figures
are the same in each file
bull Prior to performing model run PopSyn must be run and user must copy output files to SERPM7 input folders
Application 6 ndashTransit Project
Transit Project ndash MetroRail North Corridor
SERPM Transit Modes
Transit Mode Tour and Trip
Mode TAP Transit Skim Mode
Tri-Rail Commuter Rail Premium
Metrorail Urban Rail Premium
I-95 Inter-County Express I-95X I-95E
Express Bus Premium
Busway BRT Premium
MDT Express Express Bus Premium
Metromover Local Bus Local Bus
MDT Local BCT Local
Palm Tran Local Local Bus Local Bus
Breeze Local Bus Local Bus
Tri-Rail Shuttles Local Bus Local Bus
SERPM Transit Modes
Transit Mode Tour and Trip
Mode TAP Transit Skim
Mode
Mode coded on the route ldquocardsrdquo
Used to specify boarding and transfer penalties for transit
path building
(most disaggregate)
Line-haul choices in the tour and trip mode choice
models
Used to create sets of TAP to TAP levels of service
(most aggregate)
Similar to SERPM 67 SERPM 7 ABM
SERPM Transit Modes S67 Mode Local (L) S7
Mode Mode Name Operator amp Name UserA4 Name Prem (P) MODE
15 Tri-Rail 11 Tri-Rail 15 Commuter P 111
14 Metrorail 25 Metrorail 14 Urban Rail P 121
X Regional LRT Regional LRT 14 LRT P 131
16 Inter-County Express Bus 33 I-95 Inter-County Express 16 Express P 151
12 Exclusive ROW Cir-Reg 13 Exclusive ROW Cir-Reg 12 Mover L 181
11 TrolleysShuttles-Reg 12 Tri-Rail Shuttles 11 Local L 191
11 TrolleysShuttles-Reg 12 Tri-Rail Shuttles 33 Local L 192
X LRT- MDT 25 MDT LRT 14 LRT P 231
16 Buses (localexpress) - MDT 27 MDT Busway Flyers 27 BRT P 241
23 Buses (localexpress) - MDT 27 MDT MAXKATBusway Local 27 BRT P 242
24 BRT - MDT 28 MDT BRTLRT 28 BRT P 243
23 Buses (localexpress) - MDT 22 MDT Express 24 Express P 251
16 Buses (localexpress) - MDT 24 MDT I-95 Exp 26 Express P 252
16 Inter-County Express Bus 24 I-95 Inter-County Express 16 Express P 253
22 Exclusive ROW Cir-MDT 26 Metromover 22 Mover L 281
21 TrolleysShuttles-MDT 21 MDT TrolleysShuttles 21 Local L 291
23 Buses (localexpress) - MDT 21 MDT Local 23 Local L 292
23 Buses (localexpress) - MDT 23 MDT Shuttle 25 Local L 293
X LRT - BCT 35 BCT LRT 37 LRT P 331
34 BCT Rapid Bus BRT 34 BCT Rapid Bus 36 BRT P 341
34 BCT Fixed-guideway BRT 35 BCT BRT 37 BRT P 342
33 Buses (localexpress) - BCT 32 BCT Breeze 34 Express P 351
33 Buses (localexpress) - BCT 33 BCT Express 35 Express P 352
32 Exclusive ROW Cir-BCT 31 BCT Exclusive ROW Cir 32 Mover L 381
31 TrolleysShuttles-BCT 31 BCT TrolleysShuttles 31 Local L 393
33 Buses (localexpress) - BCT 31 BCT Local 27 Local L 391
33 Buses (localexpress) - BCT 31 BCT Local 33 Local L 392
X LRT - Palm Tran 43 Palm Tran LRT 44 LRT P 431
44 BRT - Palm Tran 43 Palm Tran BRT 44 BRT P 441
43 Buses (localexpress) - Ptran 42 Palm Tran Exp 44 Express P 451
42 Exclusive ROW Cir-PTran 41 Palm Tran Exclusive ROW Cir 42 Mover L 481
41 TrolleysShuttles-Ptran 41 Palm Tran TrolleysShuttles 41 Local L 491
43 Buses (localexpress) - Ptran 41 Palm Tran Local 43 Local L 492
Modes Not in the 2010 Network
SERPM7 Transit Network Building
bull Typically bus routes are coded on top of existing highway links
bull SERPM7 reserves some facility type codes for transit-only use helpful to more accurately represent route ndash Caution -- make sure network integrity is preserved once transit only
links are removed
bull Rail routes require coding first fixed-guideway links
SERPM7 Transit Network Building
bull Route Attributes -- User Coded ndash Name
ndash Long Name
ndash Mode
ndash Operator
ndash Headway[1] ndash AM Peak
ndash Headway[2] ndash Midday
ndash Headway[3] ndash PM Peak
ndash UserA4 (stop dwell time)
SERPM7 Transit Network Building
bull PNR Node Attributes ndash User Coded ndash Parking Spaces
ndash Parking Cost AM
ndash Parking Cost MD
ndash Terminal Time PNR
ndash Terminal Time KNR
bull At this time parking spaces is used only to identify park-n-ride locations (parking spaces gt 0)
SERPM7 Transit Network Building
bull Transit Access Points -- Created by Cube for the ABM ndash One TAP for each stop on premium routes
bull Tri-Rail Metrorail Express Bus BRT
ndash One TAP for each Local Bus park-n-ride node
ndash Synthesized TAPs to represent access to local bus stops
bull Transit Access Point Attributes ndash TAP Mode
ndash Inherit PNR node data
Sample Highway Network with TAPs
TAPs become part of the highway network and replace the TAZ centroids when building transit skims
Transit Access Points and ldquoon the flyrdquo Path Building
bull Transit skims are built TAP to TAP
Matrix origins and destinations are TAPS
Transit Access Points and ldquoon the flyrdquo Path Building
Trip Origins and
Destinations
MAZ to MAZ
Auto Skims
TAZ to TAZ
Transit Skims
TAP to TAP
The three spatial systems are put together by the mode choice model
ldquoOn the Flyrdquo Path Building
bull TAZs TAPs and MAZs are linked via drive and access connectors prior to running CT-RAMP
rmdir OUTDIRABMTEMP S Q rmdir DATADIRABMTEMP S Q xcopy OUTDIR OUTDIRABMTEMP E I Y xcopy DATADIR DATADIRABMTEMP E I Y if(fbi=1) need to run only the first time through - kdk CUBEctramprunCreateAccessFilescmd endif mkdir logFiles taskkill im javaexe F start CUBEctramprunHhMgrcmd JDK64 HOST_IP start CUBEctramprunMtxMgrcmd HOST_IP JDK64 rem start CUBEctrampconfigrunDrivercmd copy CUBEctrampserpm_abmproperties serpm_abmproperties Y ping -n 11 127001 gt nul CUBEctramprunSERPMAbmcmd SAMPLERATE VSAMPLERATE JDK64 CUBEctramprunCreateDemandMatricescmd SAMPLERATE VSAMPLERATE JDK64 taskkill im javaexe F rmdir OUTDIRctramp S Q rmdir DATADIRctramp S Q xcopy OUTDIRABMTEMPctramp OUTDIRctramp E I Y xcopy DATADIRABMTEMPctramp DATADIRctramp E I Y
ldquoOn the Flyrdquo Path Building
MAZ to MAZ Connectors
Created by finding shortest distance paths over an all-streets network Connects all MAZs within 15 mi
Used to represent walk mode distance and time
MAZ to TAP Connectors
Created by finding shortest distance paths over an all-streets network Connects each MAZ to all TAPs within 10 mi
Used to represent transit walk access and walk egress distance and time
TAZ to TAP Connectors
Connects each TAZ to all TAPs within the TAP maximum drive distance bull Bus TAPs ndash 4 miles bull Rail TAPs ndash 15 miles
Used to represent transit drive access and egress distance and time
ldquoOn the Flyrdquo Path Building
bull No actual links created on the network bull Connectivity is expressed in table format
ldquoOn the Flyrdquo Path Building
bull Once the access and walk connectors are created the mode choice model builds complete paths MAZ to MAZ transit paths
bull Local-only paths are built using the ldquolocalrdquo transit skim bull Express BRT Urban Rail and Commuter rail paths are all
built at the same time using the ldquopremiumrdquo transit skim bull For each MAZ to MAZ pair CT-RAMP keeps the shortest
generalized cost path for each available premium mode bull Even though only one ldquopremiumrdquo skim is built CT-RAMP
may find competing premium paths It may also find that the best path is a combination of two premium modes or a premium mode and local bus
Tour Mode Choice Model
Choice
Auto
Drive alone
GP(1)
Pay(2)
Shared ride 2
GP(3)
HOV(4)
Pay(5)
Shared ride 3+
GP(6)
HOV(7)
Pay(8)
Non-motorized
Walk(9)
Bike(10)
Transit
Walk access
Local bus(11)
Express bus(12)
BRT(13)
Urban rail(14)
Commuter rail(15)
PNR access
Local bus(16)
Express bus(17)
BRT(18)
Urban rail(19)
Commuter rail(20)
KNR access
Local bus(21)
Express bus(22)
BRT(23)
Urban rail(24)
Commuter rail(25)
School Bus(26)
Trip Mode Choice Model
bull Same nesting structure as the tour mode choice but conditional on the tour mode
bull Some trip modes may be unavailable depending on the tour mode
DA SR2 SR3+ Walk Wlk-Trn PNR-Trn KNR-Trn
DA Must - - - - - -
SR2 Can Can - Can - - -
SR3+ Can Can Can Can - - -
Walk - - - Must - - -
Wlk-Trn - Can Can Can Can - -
PNR-Trn Can Can Can Can Can Can
KNR-Trn - Can Can Can Can - Can
Trip Switching Rules Simplified
Transit Trip Reporting
bull In SERPM7 the transit boarding and alighting location can be reported in two ways ndash Trip list files (ABM output) -- Boarding TAP Alighting TAP
ndash Transit assignment (Cube output) ndash Route nodes
bull Each type of reporting has its strengths ndash Trip list file allows building detailed transit trip patterns for
population cohorts and time periods
bull Mode split reports
bull Transit trip distance frequency distributions access distance TLFDs
bull Mode to mode transfers
ndash Note ABM reports only the first boarding TAP and the last alighting TAP regardless of mode
ndash Cube output gives aggregate link volumes station to station boardings etc
User Benefit Files
bull SERPM7 can produce FTA User Benefit files for input to SUMMIT
bull User benefits remain a useful analysis tool bull Steps to produce user benefit files require some manual
intervention ndash see User Guide
SERPM ABM Reports
bull Stores ABM inputs and outputs in a relational database to generate some standard model reports
bull Consistent reporting framework to be used for analysis across model runs
bull SERPM7 user community can easily share the scripts that create the reports
bull Reports take the form of Excel workbooks bull Foundation for future development of a visualization
dashboard
Reporting Database Components
Reporting Database Components
bull Reporting ETL (extract transform and load) program ndash Loads all Cube and CT-RAMP Java model outputs into the database
ndash Written in Cube scripts and Java
bull Database ndash Stores all data used in reporting including select network skims
household person tour and trip data zonal data etc
ndash Implemented with SQL Server
bull Report scripts to generate reports ndash Written in T-SQL
bull Report packaging program ndash Generates Excel workbooks with one report per worksheet
ndash Written in Java
Reporting Database Components
bull Run time required to build database and generate reports varies with sample size and type of report ndash Several hours required to build the database for a 100 sample
ndash ~ 30 minutes to produce reports for a 10 sample
bull Report step is optional not part of a standard model run bull Report production is transparent to the user
bull hellip but users can contribute reports bull hellip and choose which reports to build at any one time
Running SERPM ABM Reports
bull Report queries reside in ctrampreports_sql time_spent_travelingsql Total weekday travel time by person type
and income group
total_trips_typesql Trips by trip mode person type county of residence and tour purpose
total_tours_typesql Tours by trip mode person type county of residence and tour purpose
tours_districtssql Tours by tour purpose and tour origin and destination districts
transit_access_time+distsql Drive to transit trip list with many trip details
hellip
Running SERPM ABM Reports
bull List of reports to run is specified in properties file ndash ctrampserpm_reportsproperties
sqlscriptsdirectory = Cserpm7ctrampreports_sql sqlscriptsschemakey = SCHEMA sqlscripts=cleanupsqltransit_access_time+distsql worksheettables=temptransittrips worksheetnames=TransitTrips workbookname = Cserpm7ctrampreports_sqlSERPM_REPORTXLS databaseschema = 2010R databaseipaddress = w-ampdx-d-sag10 databaseinstance = databaseport = 1433 databasename=SERPMABM databaseusername=serpm databasepassword=s3rpm
Adding Reports
bull Step 1 --Write report query ndash T-SQL
ndash User Guide includes a database data dictionary
bull Step 2 ndash Add query to ctrampreports_sql ndash Each query is contained in a single text file
ndash Drop file in reports folder
bull Step 3 ndash Add the query to the properties file sqlquery = Query file name
Worksheettables = Query output
Worksheetnames = Name for the report worksheet
Sample SERPM ABM Reports
bull Exhibit ctrampreports_sqlserpm_reportsxls
More information Shi-Chiang Li | shi-chianglidotstateflus |954 777 4655 Rosella Picado | picadopbworldcom | 206 382 5227 Ken Kaltenbach |kkaltenbachcorradinocom |502 587 7221

FDOT System Setup
bull Model implemented on three servers running independently of each other ndash dotsd4hqmodel1d4bstateflus
ndash dotsd4hqmodel2d4bstateflus
ndash dotsd4hqmodel3d4bstateflus
bull Remote access via FDOT VPN ndash At this time access to FDOT cluster is limited to teams working on
LRTP
FDOT Machine Specifications
Unit Brand and Model
CPU Speed amp of Logical Cores RAM Hard Drive
D4 Model Server 1
Dell PowerEdge
R710
Intel Xeon X5690 347GHz 2 processors 12 cores 24 threads
192 GB 135 GB
D4 Model Server 2
Dell PowerEdge
R710
Intel Xeon X5690 347GHz 2 processors 12 cores 24 threads
192 GB 930 GB
D4 Model Server 3
Dell PowerEdge
R720
Intel Xeon E5-2650 200GHz 2 processors 16 cores 32 threads
256 GB 465 GB amp 363 TB
D4 Model WorkStation
Dell Precision WorkStation
T7500
Intel Xeon W5580 320GHz 2 processors 4 cores 8 threads
100 GB 279 GB amp 136 TB
FDOT System Setup
Open the catalog to access the model
Cube User Interface Modeling Platform
Running SERPM7 ndash Existing Scenario
bull Step 1 -- Select a scenario bull Available scenarios ndash 2010 Base Year Validation
ndash 2040 LRTP Existing plus Committed Scenario
ndash 2040 LRTP Needs Plan Scenario
bull Scenario data are stored in the input and output folders
Running SERPM7
bull Step 2 ndash Update the catalog keys to point to the selected scenario folders and scenario input file names
Catalog Key Description
DESC Scenario descriptive label (used in reports)
ALT Scenario identifier (one letter)
year Year
DATADIR Input folder (full path name)
OUTDIR Output folder (full path name)
Input Hwy Net Input highway network layer (full path name)
TLines Input transit route layer (full path name)
Running SERPM7
bull Step 3 (Optional) ndash Update HEVAL catalog keys with appropriate values for the run Default values in parenthesis
Catalog Key Description
AnalysisYr_TTV_VOC Analysis Year (2010)
BaseYr_TTV_VOC Base Year (2010)
Inflation_TTV Value of time inflation rate (0)
Inflation_VOC Auto operating cost inflation rate (0)
Running SERPM7
bull Step 4 -- Set the population sampling rates
bull Example ndash samplerate = 05 hellip 1 out of every 2 households is simulated
ndash samplerate = 01 hellip 1 out of every 10 households is simulated
ndash vsamplerate = 025 hellip 1 out of every 4 visitor parties is simulated
Catalog Key Description
SAMPLERATE Sampling rate for the resident population
VSAMPLERATE Sampling rate for the visitor population
Running SERPM7
bull Step 5 (Optional) ndash Update the number of feedback iterations ndash Default settings
bull Run until travel time convergence (01 RMSE)
bull Maximum 5 feedback loops
Set the loop counter can be more or less than 5
Running SERPM7
bull Step 6 ndash Press Run
Running SERPM7
bull All model steps except CT-RAMP and Visitor Model are implemented in Cube Script ndash Highway Network Building
ndash Transit Network Building
ndash Non-ABM Trip Generation and Trip Distribution
ndash Highway and Transit Assignment
ndash Highway Evaluation Reports
bull CT-RAMP and Visitor Model are implemented in Java they are run by Cube using DOS prompt commands
Running SERPM7
Running SERPM7
RunCTRAMP Pilot Script
rmdir OUTDIRABMTEMP S Q rmdir DATADIRABMTEMP S Q xcopy OUTDIR OUTDIRABMTEMP E I Y xcopy DATADIR DATADIRABMTEMP E I Y if(fbi=1) need to run only the first time through - kdk CUBEctramprunCreateAccessFilescmd endif mkdir logFiles taskkill im javaexe F start CUBEctramprunHhMgrcmd JDK64 HOST_IP start CUBEctramprunMtxMgrcmd HOST_IP JDK64 rem start CUBEctrampconfigrunDrivercmd copy CUBEctrampserpm_abmproperties serpm_abmproperties Y ping -n 11 127001 gt nul CUBEctramprunSERPMAbmcmd SAMPLERATE VSAMPLERATE JDK64 CUBEctramprunCreateDemandMatricescmd SAMPLERATE VSAMPLERATE JDK64 taskkill im javaexe F rmdir OUTDIRctramp S Q rmdir DATADIRctramp S Q xcopy OUTDIRABMTEMPctramp OUTDIRctramp E I Y xcopy DATADIRABMTEMPctramp DATADIRctramp E I Y
Run CT-RAMP Pilot Script
Step 1 ndash Create access files
rmdir OUTDIRABMTEMP S Q rmdir DATADIRABMTEMP S Q xcopy OUTDIR OUTDIRABMTEMP E I Y xcopy DATADIR DATADIRABMTEMP E I Y if(fbi=1) need to run only the first time through - kdk CUBEctramprunCreateAccessFilescmd endif mkdir logFiles taskkill im javaexe F start CUBEctramprunHhMgrcmd JDK64 HOST_IP start CUBEctramprunMtxMgrcmd HOST_IP JDK64 rem start CUBEctrampconfigrunDrivercmd copy CUBEctrampserpm_abmproperties serpm_abmproperties Y ping -n 11 127001 gt nul CUBEctramprunSERPMAbmcmd SAMPLERATE VSAMPLERATE JDK64 CUBEctramprunCreateDemandMatricescmd SAMPLERATE VSAMPLERATE JDK64 taskkill im javaexe F rmdir OUTDIRctramp S Q rmdir DATADIRctramp S Q xcopy OUTDIRABMTEMPctramp OUTDIRctramp E I Y xcopy DATADIRABMTEMPctramp DATADIRctramp E I Y
Run CT-RAMP Pilot Script
bull Step 1 ndash runCreateAccessFilescmd ndash Creates the walk and transit access amp egress connectors
bull MAZ to MAZ connectors
bull MAZ to TAP walk connectors
bull TAZ to TAP drive connectors
ndash Fully implemented in Cube script
ndash Runs only during the initial feedback loop
rem Set location of Voyager for running Cube scripts set VOYAGER=CProgram Files (x86)CitilabsCubeVoyagerVoyagerexe rem create CT-RAMP maz impedances and maz densities VOYAGER Cserpm7ctrampapplicationsave_maz_dbfs Start VOYAGER Cserpm7ctrampapplicationabm_access_filess Start VOYAGER Cserpm7ctrampapplicationmaz_densitiess Start
Run CT-RAMP Pilot Script
Step 2 ndash Start Household amp Matrix Managers
rmdir OUTDIRABMTEMP S Q rmdir DATADIRABMTEMP S Q xcopy OUTDIR OUTDIRABMTEMP E I Y xcopy DATADIR DATADIRABMTEMP E I Y if(fbi=1) need to run only the first time through - kdk CUBEctramprunCreateAccessFilescmd endif mkdir logFiles taskkill im javaexe F start CUBEctramprunHhMgrcmd JDK64 HOST_IP start CUBEctramprunMtxMgrcmd HOST_IP JDK64 rem start CUBEctrampconfigrunDrivercmd copy CUBEctrampserpm_abmproperties serpm_abmproperties Y ping -n 11 127001 gt nul CUBEctramprunSERPMAbmcmd SAMPLERATE VSAMPLERATE JDK64 CUBEctramprunCreateDemandMatricescmd SAMPLERATE VSAMPLERATE JDK64 taskkill im javaexe F rmdir OUTDIRctramp S Q rmdir DATADIRctramp S Q xcopy OUTDIRABMTEMPctramp OUTDIRctramp E I Y xcopy DATADIRABMTEMPctramp DATADIRctramp E I Y
Run CT-RAMP Pilot Script
bull Step 2 ndash Start Household and Matrix Managers ndash Java applications used by the ABM software to readwrite Cube
matrices and for distributing household ldquojobsrdquo to computer threads
Run CT-RAMP Pilot Script
Step 3 ndash Run SERPM ABM and Visitor Model
rmdir OUTDIRABMTEMP S Q rmdir DATADIRABMTEMP S Q xcopy OUTDIR OUTDIRABMTEMP E I Y xcopy DATADIR DATADIRABMTEMP E I Y if(fbi=1) need to run only the first time through - kdk CUBEctramprunCreateAccessFilescmd endif mkdir logFiles taskkill im javaexe F start CUBEctramprunHhMgrcmd JDK64 HOST_IP start CUBEctramprunMtxMgrcmd HOST_IP JDK64 rem start CUBEctrampconfigrunDrivercmd copy CUBEctrampserpm_abmproperties serpm_abmproperties Y ping -n 11 127001 gt nul CUBEctramprunSERPMAbmcmd SAMPLERATE VSAMPLERATE JDK64 CUBEctramprunCreateDemandMatricescmd SAMPLERATE VSAMPLERATE JDK64 taskkill im javaexe F rmdir OUTDIRctramp S Q rmdir DATADIRctramp S Q xcopy OUTDIRABMTEMPctramp OUTDIRctramp E I Y xcopy DATADIRABMTEMPctramp DATADIRctramp E I Y
Run CT-RAMP Pilot Script
bull Step 3 ndash Run SERPM ABM and Visitor Models ndash Sets and runs SERPM ABM (runSERPMABMcmd)
bull Sets environment variables
bull Gets sampling rates project folders and other run-time variables
bull Sets the ABM properties file
bull Calls SERPM ABM and Visitor Model JARS (executables)
Run CT-RAMP Pilot Script
Step 4 ndash Create Trip Tables for Assignment
rmdir OUTDIRABMTEMP S Q rmdir DATADIRABMTEMP S Q xcopy OUTDIR OUTDIRABMTEMP E I Y xcopy DATADIR DATADIRABMTEMP E I Y if(fbi=1) need to run only the first time through - kdk CUBEctramprunCreateAccessFilescmd endif mkdir logFiles taskkill im javaexe F start CUBEctramprunHhMgrcmd JDK64 HOST_IP start CUBEctramprunMtxMgrcmd HOST_IP JDK64 rem start CUBEctrampconfigrunDrivercmd copy CUBEctrampserpm_abmproperties serpm_abmproperties Y ping -n 11 127001 gt nul CUBEctramprunSERPMAbmcmd SAMPLERATE VSAMPLERATE JDK64 CUBEctramprunCreateDemandMatricescmd SAMPLERATE VSAMPLERATE JDK64 taskkill im javaexe F rmdir OUTDIRctramp S Q rmdir DATADIRctramp S Q xcopy OUTDIRABMTEMPctramp OUTDIRctramp E I Y xcopy DATADIRABMTEMPctramp DATADIRctramp E I Y
Run CT-RAMP Pilot Script
bull Step 4 ndash createDemandMatricescmd ndash Creates Cube format trip tables for highway and transit assignment
ndash Translates the ABM amp Visitor Model list of trips into matrix format
ndash Three sets of demand matrices
bull Resident trips
bull Visitor trips
bull Resident + Visitor trips
ndash This step is implemented in Cube Script
The CT-RAMP Properties File
bull A settings file is used to control the ABM software ndash ctrampserpm_abmproperties
bull The majority of the properties (settings) in this file are set during model installation and do not need to be changed for a typical model run
bull Properties are described in the User Guide bull Example properties ndash Settings to control trace calculations
ndash System environment properties
ndash Input and output filenames
ndash Settings that specify how to read the utility expression calculators (UECs)
The CT-RAMP Properties File
bull Exhibit serpmabmproperties
Monitoring Run StatusProgress
bull Cube scripted components progress is tracked by Cubersquos Task Monitor
Monitoring Run Status
bull Java components status is reported to the log files ndash CubelogFileseventlog
ndash CubelogFiles
bull The log files are text files that can be opened with any text editor (Notepad Wordpad Ultraedit etc)
bull What is reported ndash Step being executed
ndash A few model output summaries
ndash Errors
ndash Trace calculations
bull While Java components are running status of Task Monitor does not change
Monitoring Run Status
bull Exhibit cubeeventlog
Running SERPM7 ndash New Scenario
bull Step 1 ndash Create input and output scenario folders ndash Suggested scenario naming convention
bull inputIN-YEARALT
bull outputOUT-YEARALT
bull Copy all input files from an existing scenario including all subfolders
bull Update new scenario-specific files ndash Highway transit networks
ndash Household person synthetic population
ndash Land use data
bull Proceed with Steps 2 thru 6 for running an existing scenario
FDOT Servers Run Times
Feedback Loop End Time Runtime (HHMM)
RMSE (AM amp PM)
1 945 1045 1226 amp 1363
2 1648 703 060 amp 058
3 119 831 023 amp 020
4 806 647 012 amp 009
5 1458 652 008 amp 006
Total ~40 hrs
Model Server 3 20 Sample
FDOT WorkStation Run Times
Machine Sample Size Run Time (HHMM)
Model WorkStation
1 048
5 240
10 503
20 949
Model Server 3 20 400
CT-RAMP Only
Model Installation
SERPM7 Installation
bull Installation package and User Guide available from Florida DOT via FSUTMS Online
bull Hardware and software requirements and installation instructions described in User Guide
bull Sample model output available from Florida DOT
SERPM7 Installation
bull Hardware Requirements ndash 64-bit Operating System
ndash Intel Xeon X5690 347 GHz 6 core processors or similar
ndash Minimum 96 GB RAM
ndash Minimum 1 TB space for storing model output
bull Software ndash Cube 61 wcluster license
ndash SQL SQL Express
ndash Java
ndash Microsoft Excel (optional)
SERPM7 Installation
bull Step 1 ndash Create the Project Folder ndash Set user permission level to lsquoEveryonersquo
bull Step 2 ndash Configure the machines ndash Set environment variables
ndash Install Java and set its environment variables
ndash Verifyinstall Cube 64-bit matrix IO DLL
ndash Other hellip
bull Step 3 ndash Configure the JPPF services bull Step 4 ndash Configure the ldquoRunrdquo component files bull Step 5 ndash Configure SERPM7 in Application Manager bull Step 6 ndash Create the seed skims
Application 1 Working with a Population Sample
Working with a Population Sample
bull A simulation of the entire population is not required for every single application ndash Small sample sizes are sufficiently accurate for forecasting aggregate
region or county-wide statistics
ndash Small sample sizes save run time during model calibration and when testing initial versions of new networks and other input data
Working with a Population Sample
bull Developing a region-wide forecast using travel outcomes for a sample of the population is analogous to estimating region-wide travel statistics using a survey sample
Survey Simulation
Gathers trip diary information for a sample of households
Simulates trips for a sample of households
Typical sampling rate 020 - 025
Typical sampling rate 5 - 50
Estimates travel patterns for entire population by multiplying each surveyed trip record by an
expansion factor
Estimates travel patterns for entire population by multiplying each simulated trip record by an
expansion factor
Typical expansion factors 100 - 1000
Typical expansion factors 2 - 20
Working with a Population Sample
bull The ABM assumes that each household makes travel decisions independently of the decisions made by all other households
bull Households are simulated independently of each other bull The ABM samples randomly from the list of households to
select the ones it simulates bull It is prudent to verify that the selected population sample is
unbiased ndash A very small (1 or less) simple random sample is likely to be biased
for example it will likely mis-represent households that are found infrequently in the population
ndash Samples of 10 or more are typically sufficiently unbiased for travel demand forecasting applications
Working with a Population Sample
bull How big a sample to use ndash The more localized the expected impact of a project the larger the
required sample
bull Some recommendations ndash For model calibration and validation 10-25 is typically sufficient
ndash For comparing aggregate county-wide and sub-county average travel statistics 10 - 25
ndash For estimating daily traffic volumes on high capacity facilities and high capacity transit 25 - 50
ndash For traffic impact studies 50 - 100
bull hellip but testing highly encouraged
Working with a Population Sample
bull A sample expansion factor is applied when creating the trip tables for assignment
bull Expansion factor = 1samplingRate bull Loads on highway and transit networks are representative
of the entire population bull Summaries produced from the ABM list output need to be
expanded to be representative of the entire population
Running SERPM7 with a Population Sample
bull Setting the run ndash Set the sampling rate for residents and visitors in Cube
ndash All other model settings can remain unchanged
bull The same sampling rate is used on all feedback loops
Catalog Key Description
SAMPLERATE Sampling rate for the resident population
VSAMPLERATE Sampling rate for the visitor population
Running SERPM7 with a Population Sample
bull When working with a ldquoless than 100rdquo model run each record in the output list files has to be expanded by 1samplingRate ndash householdData_v1csv
ndash personData_v1csv
ndash indivTourFile_v1csv
ndash jointTourFile_v1csv
ndash indivTripFile_v1csv
ndash jointTripFile_v1csv
bull Trip tables are already expanded ndash TAZ_Demand_tmat
ndash TAP_Demand_tmat
Running SERPM7 with a Population Sample
bull Sample Output ndash County-wide highway assignment statistics
Screenline 25
Sample 50
Sample Diff ()
BOEW Northern SL along Pompano Canal 842418 843591 -01
BOEW Middle SL along Oakland Park Blvd 1187251 1183529 03
BOEW Southern SL along River Canal 881601 879618 02
BONS Western SL between I75 and TPK 586412 587353 -02
BONS Middle SL along TPK 1441311 1437065 03
BONS Eastern SL along Intracostal Wway 328855 326298 08
BOEW SL BOPB County Line 648960 648771 00
BOEW SL BOMD County Line 979327 976276 03
BOWestern Ext CL Collier County Line 31059 31059 00
BONS I-95 CL from Miami-Dade to I-595 510207 509537 01
BONS Western CL along SR897 frm PB-SR816 494591 495547 -02
Running SERPM7 with a Population Sample
Running SERPM7 with a Population Sample
Running SERPM7 with a Population Sample
bull Sample Output ndash Individual Route Boardings
Running SERPM7 with a Population Sample
bull Sample Output ndash Individual Route Boardings
Running SERPM7 with a Population Sample
bull Sample Output ndash Regionwide Household Income Profile
Household Income 25 Sample 100 Sample
Less than $10000 1015 1021
$10000 to $15000 470 468
$15000 - $20000 566 564
$20000 to $25000 519 516
$25000 to $30000 493 494
$30000 to $35000 475 477
$35000 to $40000 387 387
$40000 to $45000 343 345
$45000 to $50000 348 348
$50000 to $75000 1754 1747
$75000 to $100000 1432 1433
$100000 or More 2198 2200
Application 2 Population Synthesis
Population Synthesis
bull Each SERPM7 scenario requires a synthetic population ndash List of households -- hhFilecsv
ndash List of persons that make up the households -- personFilecsv
bull Two synthetic populations have been developed to date ndash 2010 base year population
ndash 2040 long range transportation plan population
Population Synthesis
bull New synthetic populations will be required for ndash Other regional scenario years (eg 2020 2025 2045)
ndash To test population and land use scenarios such as
bull Traffic impact study for a new housing or commercial development
bull Impact of aging population
bull Impact of rising sea levels (because some neighborhoods will no
longer be inhabitable)
bull Refinements to the 2010 and 2040 populations
Population Synthesis
bull The population synthesizer (PopSynII) does not run normally as part of SERPM7 ndash SERPM7 expects input population files in the input folder
ndash User is responsible for running PopSynII to generate the required population files and place them in the scenario folders prior to a SERPM7 run
bull Why ndash Because a new synthetic population is not required for every run
PopSyn II Setup
bull PopSynII is already configured to run on the FDOT servers bull Java application using SQL data storage
PopSynII installed in the main ctramp folder
PopSynII Setup
bull The ctramppopsyn folder
Filename Description
runAllPopsynbat Batch file that controls the execution of PopSynII
controls SQL settings file that specifies the population attributes used as controls
1_importCSVsql 2_createTargetssql 3_createSynHHPerFilessql
SQL scripts that run the PopSynII software
2010_TAZ_Datacsv TAZ input control data
2010_MAZ_Datacsv MAZ input control data
Developing a New Synthetic Population
bull Step 1 ndash Prepare the input files ndash TAZ controls 2010_taz_datacsv
ndash MAZ controls 2010_maz_datacsv
Developing a New Synthetic Population
bull MAZ Control input file eg 2010_maz_datacsv ndash Estimates of total households and persons living in group quarters
bull Total households
bull Total group quarter population
ndash One record for each MAZ
Developing a New Synthetic Population
bull TAZ Controls input file -- eg 2010_taz_datacsv ndash Estimates of number of households or population for each SERPM7
controlled attribute
bull Household size
bull Household income
bull Household workers
bull Type of dwelling unit
bull Presence of children in the household
bull Population age group
bull Gender
bull Raceethnicity
bull Population in group quarters
ndash One record per TAZ
Analogous to the TAZ SE data file in the trip-
based model
Developing a New Synthetic Population
When preparing TAZ and MAZ control data it is critically important to
maintain internal data consistency
Developing a New Synthetic Population
bull Some data checks to perform and problems to look out for ndash The household and person marginals pertain to household residents
only except for the group quarter controls
ndash All household-based marginals add up to the same total households for each TAZ
ndash All person-based marginals add up to the same total persons for each TAZ
ndash The total number of persons implied by the household size marginal is consistent with the sum total of the person marginals
ndash The total number of children obtained from the age marginal is consistent with the marginal of households by presence of children
ndash Large deviations from 5050 split of persons by gender is suspect
ndash The household income distribution is consistency with the workers-in-household distribution
Developing a New Synthetic Population
bull More data checks ndash The MAZ and TAZ controls should add up
bull to the same number of households by TAZ
bull to the same number of persons in group quarters by TAZ
Developing a New Synthetic Population
bull Exhibit ndash SERPM7 2010 TAZ control file
Example ndash Minto West Palm Beach Co
Example ndash Minto West
bull Mixed-use development in a agricultural area adjacent to an existing housing development
bull Information available from proposedapproved plans ndash Single-family dwelling units ndash 5050
ndash Multi-family dwelling units ndash 1040
ndash Total population ndash 14 535 persons
ndash Spatial location of dwelling units by type
bull Other PopSyn required data not available from plans (income distribution age distribution etc) ndash Estimateassert it based on similar existing developments
surrounding neighborhood
Example ndash Minto West
bull Adding householdspersons to a TAZ
bull Adding TAZs or MAZs to SERPM7 should be a rare occurrence ndash Households are ultimately allocated to MAZs and therersquos already
12000 of them
ndash Households are represented individually so the zone attributes are derived from them
Trip-Based Model Modify the input zonal data file
Activity-Based Model Modify the population synthesis control file
Running PopSynII
bull Step 2 ndash Modify the PopSyn settings file for this run ndash Update TAZ and MAZ control filenames in runAll_popsynbat
REM BATCH FILE TO SETUP POPSYN RUN RUN POPSYNII AND OUTPUT CSV FILES REM SETUP REM PLEASE SET PATH NAMES FOR WORKING FOLDER AND CSV FILE LOCATIONS SET SERVERNAME=W-AMSTL-D-00052SQLEXPRESS SET DATABASENAME=popSyn SET ARCPATH=Cpopsyn SET CSVPATH_CONTROLS=Cpopsyninputscontrolscsv SET CSVPATH_MAZ=Cpopsyninputs2010_MAZ_Data_20120207csv SET CSVPATH_TAZ=Cpopsyninputs2010_TAZ_Data_20120207csv REM MAIN SCRIPT REM MAKE FILENAMES TABLE REM sqlcmd -S SERVER NAME -E -i INPUT FILE PATH (SCRIPT) -o OUTPUT LOG REM -E means to use Windows authentication for the user that is running the batch file SQLCMD -S SERVERNAME -d DATABASENAME -E -Q IF OBJECT_ID(dbocsv_filenames) IS NOT NULL DROP TABLE csv_filenames -o ARCPATHResultLogtxt
hellip hellip
Running PopSynII
bull Other PopSyn settings ndash rarely used in a production run ndash Change the control attributes
ndash Change the priority of control attributes
Running PopSynII
bull Step 3 ndash Run PopSynII -- runAll_popsynbat
Running PopSynII
bull Step 4 ndash Review Output amp Check Fit to Controls
Output File Description
hhFilecsv List of households
personFilecsv List of persons
ZoneResultscsv Comparisons of synthetized households to controlled and uncontrolled attributes
BalanceDetailscsv
ValidationStatscsv
ValidationStatsByPumacsv
Reviewing PopSyn Output
bull Zone_Resultscsv bull Comparison of synthesized totals to target totals for each
TAZ and controlled attribute
TOTAL_HOUSEHOLDS
ZONE TARGET SYNTHESIZED DIFFERENCE PCTDIFF
1 715 715 0 0
2 811 811 0 0
3 878 878 0 0
4 826 826 0 0
5 1181 1181 0 0
6 212 212 0 0
7 459 459 0 0
8 253 253 0 0
Reviewing PopSyn Output
bull Balance_Detailscsv bull Same output as Zone_Results different format
Zone Control ID ControlCat Target PUMSVal ConStat
1989 109 TOTAL_HOUSEHOLDS 1508 1508 yes
1989 249 INCOME_25K 273 271 no
1989 19 HHSIZE_4PLUS 467 467 yes
1989 160 FEMALE 2196 2108 no
1989 55 INCOME_100K 258 257 yes
1989 67 MULTI_UNIT 423 407 no
1989 31 WORKERS_3PLUS 164 166 no
Reviewing PopSyn Output
bull Validation_Statscsv ndash Comparison of synthesized attributes to input Census data (5 PUMS)
ndash Includes uncontrolled attributes
Description popSynSum censusSum meanDiff stdDev minDiff maxDiff Universe 1 number of households 2085375 1964881 17 61 -97 331
family 67 65 3 17 -26 48
non family 33 35 0 34 -58 111
size 1 27 28 0 36 -59 111
size 2 31 32 -3 14 -30 30
size 3 17 17 1 22 -37 53
size 4 25 23 18 50 -46 160
Reviewing PopSyn Output
bull Validation_StatsByPumacsv ndash Same as validation_stats but for each PUMA
bull Note that synthesized population may differ from 5 Census population by design
Application 3 ndash Highway Project
Highway Project
Example Projects ndashToll road extension ndashReversible lanes ndashManaged lanes
Overview
How to use SERPM7 to perform a model run and do some standard analysis ndash Option 1 -- Code the project directly on the geodatabase
bull Roadway links
bull Node links
bull Turn penalties
bull [assume no change to transit]
ndash Option 2 --Code the project on net files and then build the geodatabase
bull Use flowchart script to build the geodatabase
ndash Coding is very similar to earlier versions of SERPM
bull Facility types are the same
SERPM Facility Types (not new)
Editing the Highway Network
bull SERPM 7 requires a geodatabase bull Editing can be done either to a net file or directly on the
geodatabase bull The user can use utilities in the model flowchart to write a
net file from the geodatabase edit the net and then write it to the geodatabase
bull The geodatabase must exist to run the model
Editing in the Geodatabase
bull Simplest and most direct method bull Requires an understanding of the CubeArcGIS tools
Export geodatabase and edit as a net
bull Start Data Manager bull Open geodatabase (SERPM_NETSMDB) bull Double click on the network Input Hwy Net and specify an
output file (maybe ldquoeditnetrdquo) bull Open from Cube and edit as usual bull Use ldquoPrepare for Model Run and Trap Errorsrdquo (2) utilities to
write back to geodatabase ndash Reload geodatabase from Cube files ndash Cull and sort
ndash Write to geodatabase
Edit as a net
Export Edit in Cube
Change to point to edited network
Input Hwy Net
Toll Road Extension
bull Short Cut ndash copy an existing toll link bull No special NODE attributes bull Only new attribute is ISTOLL=1 for all links that could not be
used unless a toll were paid bull Toll Mainline FTC2=91 ISTOLL=1 DIRCODE=1 bull Plaza (gantry) ndash assume all will be electronic collection ndash TOLL=1 DIRCODE=1
ndash TOLLTYPE=3 CARTOLL=toll in dollars
ndash FTC2=95
ndash ISTOLL=1
ndash SVCSECONDS=001
ndash DELCODE=1 ACCELCODE=1 AVILANES=2
Toll Road Extension
Not much different from earlier versions of SERPM
Reversible Lanes
bull Control by the link attribute REVERSIBLE ndash REVERSIBLE=1 means AM operation only
ndash REVERSIBLE=2 means PM operation only
ndash I-595 example
Managed Lanes (typically Express)
bull HOT=1 ndash 98 (99 makes the link a dummy) bull FTC2 most likely=91 but other types permitted bull TOLL=0 ISTOLL=0 bull Tolls set by HOTTOLLdbf
HOT Lanes Tolls
bull Set as a function of the VC bull Updated in the travel time feedback loop bull Affects the TollFree split in mode choice bull Column HOT_x were x=HOT link attribute bull HOT_1 is the current 95 Express rate HOT_2 is a placeholder
Common Errors
bull Errors to watch out for ndash If network steps fail look for missing attributes
ndash Update transit routes as needed due to changes to underlying highway network
ndash Check for dangling links and unconnected zones
ndash Verify that all TAZs are connected to lsquofreersquo roads
bull Special procedures required for TAZs that have toll-only access must
include the attribute ISRCTOLLINK=1 (currently used for the
Rickenbacker Causeway)
ndash Some CT-RAMP errors caused by network coding errors may not be apparent until feedback loop 2 because in loop 1 CT-RAMP uses seed skims
bull Use small sample size when testing a new network
Was the Run Successful
bull Did the run converge ndash AM and PM travel time RMSE values reported to
OUTDIRfeedbacklogprn
ndash Run stops when RMSE is less than 01
ndash 2010 Scenario converges in 5 loops
bull What to do if it didnrsquot converge ndash Look for obvious errors
ndash Run more iterations (future year might require more)
bull Are the top-level results comparable to a similar run ndash Use HEVAL reports
ndash Examine screenlines (RMSE reports)
ndash Spot check link loads
Tools for Analysis
bull Analysis ndash perform standard highway project type analyses
bull Usual analysis similar to trip-based model ndash Total daily and period-specific roadway volumes and speeds by
vehicle class
ndash Vehicle trip OD matrices
bull Standard FSUTMS HEVAL and RMSE reports are still available ndash Day and period assignments
ndash By County
ndash Truck assignment
Tools for Analysis
bull Potential for customized assignment classes to address
specific project questions ndash Does the manage lane serve primarily high income users
bull Stratify vehicle classes by lowhigh income to understand facility
usage by income level
bull Stratify vehicle classes by disadvantaged population cohorts
bull Trip and person tabulations built from ABM output ndash Trip mode shares for many different population cohorts subareas
ndash For example toll vs non-toll shares by value of time or fine-graded income levels
ndash Many other possibilities
Application 4 ndash Mobility Project
Mobility Project ndash SUNPASS Market Share
bull Persons in households that own a SUNPASS transponder respond differently to managed lane and toll road policies ndash Pay lower tolls than cash users
ndash Have access to I-95 managed lanes
bull Policy questions ndash How does projected toll traffic and revenue vary with the SUNPASS
penetration rate and toll discount
ndash How will SUNPASS penetration rate vary as more managed lane facilities are built in the region
Mobility Project ndash SUNPASS Market Share
bull Question 1 -- How does projected toll traffic and revenue vary with the SUNPASS penetration rate and toll discount
bull Procedure ndash Step1 ndash Assume a SUNPASS market share by modifying the toll
transponder model
ndash Step 2 ndash Run SERPM7 to produce traffic volumes
ndash Step 3 ndash Estimate toll traffic revenue
Modifying the Toll Transponder Ownership Model
bull Model specification is contained in TransponderOwnershipxls and can be edited with Microsoft Excel
Utility Variable Coefficient
Expected time savings up to 644 min 00631
Distance less than 5 miles -00304
Distance between 5 and 10 miles -00648
Distance 10 miles or more -00648
Constant 04877
Modifying the Toll Transponder Ownership Model
Utility Variable Coefficient
Expected time savings up to 644 min 00631
Distance less than 5 miles -00304
Distance between 5 and 10 miles -00648
Distance 10 miles or more -00648
Constant 04877
Increasing the constant will increase the number of households equipped with transponders
TransponderOwnershipxls
Modifying the Toll Transponder Model
bull Increase the constant by how much ndash Process is akin to model calibration
ndash Several runs of the transponder model required to estimate the constant that yields the desired market share
ndash 2010 market share is approximately 65
ndash Use a small sample (5 or 10) to save run-time while establishing the right constant
Modifying the Toll Transponder Model
bull Variation ndash Add terms to the model so that certain types of households are more
likely to exhibit a SUNPASS market share increase
bull Highlow income households
bull Multi-car households
bull Miami-Dade households
Modifying the Toll Transponder Model
bull Exhibit TransponderOwnershipxls
Mobility Project ndash SUNPASS Market Share
bull Question 2 -- How will SUNPASS penetration rate vary as more managed lane facilities are built in the region
bull Procedure ndash Step 1 ndash Code the manage lane facilities
ndash Step 2 ndash Run SERPM7 to forecast transponder ownership
ndash Step 3 ndash Analyze the forecast household data for changes in the profile of households equipped with transponders
Application 5 ndash Land Use Project
Land Use Project
bull Transportation projects comprise not only network scenarios but also land use scenarios
bull Land use scenarios can be ndash Very large scale (substantial changes to housing and employment
estimates throughout the region) or
ndash Small scale (localized changes for example for a traffic impact study)
bull For both large scale and small scale land use updates the
general procedure for updating the input data and running the model is the same
Land Use Project
bull The land use data in SERPM7 consists of ndash Synthetic population and derived input files
ndash Employment data
ndash School enrollment data
ndash Parking costs and parking spaces
ndash Regional shopping mall special generators
ndash Beach special generators
ndash Hotel and motel room data
Land Use Project
bull The land use data reside in different input files
Data Item Input File
Synthetic Population hhFilecsv personFilecsv ctramppopsynTAZDatacsv ctramppopsynMAZDatacsv
Employment School Enrollment Parking Supply Data Special Generators Hotel and Motel Rooms
inputsIN-2010Rmaz_datacsv
Land Use Project
bull As demonstrated earlier SERPM 7 requires significantly more comprehensive socio-economic inputs as compared to previous versions ndash Greater spatial detail
ndash More categoriestypes of land uses
bull These inputs require additional preparation when
performing land use model runs
Land Use Project
Data Required and examples bull Population
bull Age distribution of the population expected to live in the
development
bull Income profile
bull Type of dwelling unit (single-family vs multi-family)
ndash The input data need to be internally consistent (distribution of households by presence of children needs to be consistent with population age distribution for example)
Land Use Project
Data Required bull Employment classification ndash Previous models had three
employment classifications
ndash In SERPM 7 there are 16 employment categories to better differentiate type of land use and improve the relationship between land use and activity purpose
Land Use Project
Data Required bull School enrollment ndash note that it differentiates by grade level
(K-8 high-school collegepost-secondary) ndash Donrsquot forget to include school faculty and staff in employment
Land Use Project
Data Required bull Parking supply and
parking costs ndash Parking spaces may
reflect use restrictions
bull Monthly
bull Daily
bull Hourly
ndash Parking costs consistent with type of use
Land Use Project
bull Park Area 1 (pink) ndash May park in MAZ other
than destination MAZ
ndash Parking cost applies
bull Park Area 2 (gree) ndash Parks at destination MAZ
ndash Parking cost applies
Land Use Project
Data Required bull Visitor Model ndash Number of hotel and motel rooms
bull Special Generators ndash Regional shopping malls
ndash Beach recreation areas
Land Use Project
The Gardens Mall Aventura Mall
Boynton Mall Dolphin Mall
Delray Community Mall Dadeland Mall
Towncenter Mall The Falls Shopping Center
Wellington Greens Mall Cutler Ridge Mall
Coral Square Mall Bal Harbour Shops
Pompano Citi Centre CocoWalk
Sawgrass Mills Mall The Mall at 163rd Street
Broward Mall Mall of the Americas
Galleria Mall Mary Brickell Village
Pembroke Lakes Mall Miami International Mall
Lakes Mall Miracle Marketplace
Oakwood Plaza Village of Merrick Park
The Promenade at Coconut Creek Westland Mall
Regional Shopping Mall Special Generators
Land Use Project
Deerfield Beach
Pompano Beach
Fort Lauderdale Beach
Fort Lauderdale Beach
Hollywood Beach
South Beach
Haulover Beach
Crandon Park
Dania Beach
Bill Baggs State Park
Beach Special Generators
Land Use Project
Sample Problem
bull MINTO West Example - a mixed residentialcommercial development ndash 6500 singlemulti-family residential units in multiple TAZs
ndash 14 million square feet of non-residential space
ndash 150 room hotel
ndash 3000 student college campus
Land Use Project
MINTO WEST
Land Use Project
TAZsMAZs representing MINTO West Development
Land Use Project
Need to translate population household and employment information from developer into model input data ndash As discussed in the Population Synthesis presentation population and
household attribute estimates can be taken from other known nearby neighborhoods
bull In this sample problem first start by allocating percentages of total
households into individual MAZs within the development area
bull Keep in mind household density when estimating the number of
households in each MAZ
Land Use Project
bull In this sample employment can be assumed to include bull Retail
bull RestaurantsBars
bull Offices
bull Health services
bull Hotelmotel employment and
bull Educational employment
ndash As with households yoursquoll need to apportion the employment areas to individual MAZs while keeping in mind the types of employment expected in those locations
Land Use Project
bull Employment data is usually estimated by converting floor space available to individual types of employment through conversion factors
bull ie ndash (3000 sqft office space)(20 sqft per office employee) =
150 office employees
Land Use Project
bull Once population household and employment figures are estimated they are entered into the appropriate model input file
bull Population ndash TAZ synthetic population control file
bull Household ndash TAZ synthetic population control file
bull Employment School Parking and Special Gen ndash maz_datacsv
bull Ensure that population household and employment figures
are the same in each file
bull Prior to performing model run PopSyn must be run and user must copy output files to SERPM7 input folders
Application 6 ndashTransit Project
Transit Project ndash MetroRail North Corridor
SERPM Transit Modes
Transit Mode Tour and Trip
Mode TAP Transit Skim Mode
Tri-Rail Commuter Rail Premium
Metrorail Urban Rail Premium
I-95 Inter-County Express I-95X I-95E
Express Bus Premium
Busway BRT Premium
MDT Express Express Bus Premium
Metromover Local Bus Local Bus
MDT Local BCT Local
Palm Tran Local Local Bus Local Bus
Breeze Local Bus Local Bus
Tri-Rail Shuttles Local Bus Local Bus
SERPM Transit Modes
Transit Mode Tour and Trip
Mode TAP Transit Skim
Mode
Mode coded on the route ldquocardsrdquo
Used to specify boarding and transfer penalties for transit
path building
(most disaggregate)
Line-haul choices in the tour and trip mode choice
models
Used to create sets of TAP to TAP levels of service
(most aggregate)
Similar to SERPM 67 SERPM 7 ABM
SERPM Transit Modes S67 Mode Local (L) S7
Mode Mode Name Operator amp Name UserA4 Name Prem (P) MODE
15 Tri-Rail 11 Tri-Rail 15 Commuter P 111
14 Metrorail 25 Metrorail 14 Urban Rail P 121
X Regional LRT Regional LRT 14 LRT P 131
16 Inter-County Express Bus 33 I-95 Inter-County Express 16 Express P 151
12 Exclusive ROW Cir-Reg 13 Exclusive ROW Cir-Reg 12 Mover L 181
11 TrolleysShuttles-Reg 12 Tri-Rail Shuttles 11 Local L 191
11 TrolleysShuttles-Reg 12 Tri-Rail Shuttles 33 Local L 192
X LRT- MDT 25 MDT LRT 14 LRT P 231
16 Buses (localexpress) - MDT 27 MDT Busway Flyers 27 BRT P 241
23 Buses (localexpress) - MDT 27 MDT MAXKATBusway Local 27 BRT P 242
24 BRT - MDT 28 MDT BRTLRT 28 BRT P 243
23 Buses (localexpress) - MDT 22 MDT Express 24 Express P 251
16 Buses (localexpress) - MDT 24 MDT I-95 Exp 26 Express P 252
16 Inter-County Express Bus 24 I-95 Inter-County Express 16 Express P 253
22 Exclusive ROW Cir-MDT 26 Metromover 22 Mover L 281
21 TrolleysShuttles-MDT 21 MDT TrolleysShuttles 21 Local L 291
23 Buses (localexpress) - MDT 21 MDT Local 23 Local L 292
23 Buses (localexpress) - MDT 23 MDT Shuttle 25 Local L 293
X LRT - BCT 35 BCT LRT 37 LRT P 331
34 BCT Rapid Bus BRT 34 BCT Rapid Bus 36 BRT P 341
34 BCT Fixed-guideway BRT 35 BCT BRT 37 BRT P 342
33 Buses (localexpress) - BCT 32 BCT Breeze 34 Express P 351
33 Buses (localexpress) - BCT 33 BCT Express 35 Express P 352
32 Exclusive ROW Cir-BCT 31 BCT Exclusive ROW Cir 32 Mover L 381
31 TrolleysShuttles-BCT 31 BCT TrolleysShuttles 31 Local L 393
33 Buses (localexpress) - BCT 31 BCT Local 27 Local L 391
33 Buses (localexpress) - BCT 31 BCT Local 33 Local L 392
X LRT - Palm Tran 43 Palm Tran LRT 44 LRT P 431
44 BRT - Palm Tran 43 Palm Tran BRT 44 BRT P 441
43 Buses (localexpress) - Ptran 42 Palm Tran Exp 44 Express P 451
42 Exclusive ROW Cir-PTran 41 Palm Tran Exclusive ROW Cir 42 Mover L 481
41 TrolleysShuttles-Ptran 41 Palm Tran TrolleysShuttles 41 Local L 491
43 Buses (localexpress) - Ptran 41 Palm Tran Local 43 Local L 492
Modes Not in the 2010 Network
SERPM7 Transit Network Building
bull Typically bus routes are coded on top of existing highway links
bull SERPM7 reserves some facility type codes for transit-only use helpful to more accurately represent route ndash Caution -- make sure network integrity is preserved once transit only
links are removed
bull Rail routes require coding first fixed-guideway links
SERPM7 Transit Network Building
bull Route Attributes -- User Coded ndash Name
ndash Long Name
ndash Mode
ndash Operator
ndash Headway[1] ndash AM Peak
ndash Headway[2] ndash Midday
ndash Headway[3] ndash PM Peak
ndash UserA4 (stop dwell time)
SERPM7 Transit Network Building
bull PNR Node Attributes ndash User Coded ndash Parking Spaces
ndash Parking Cost AM
ndash Parking Cost MD
ndash Terminal Time PNR
ndash Terminal Time KNR
bull At this time parking spaces is used only to identify park-n-ride locations (parking spaces gt 0)
SERPM7 Transit Network Building
bull Transit Access Points -- Created by Cube for the ABM ndash One TAP for each stop on premium routes
bull Tri-Rail Metrorail Express Bus BRT
ndash One TAP for each Local Bus park-n-ride node
ndash Synthesized TAPs to represent access to local bus stops
bull Transit Access Point Attributes ndash TAP Mode
ndash Inherit PNR node data
Sample Highway Network with TAPs
TAPs become part of the highway network and replace the TAZ centroids when building transit skims
Transit Access Points and ldquoon the flyrdquo Path Building
bull Transit skims are built TAP to TAP
Matrix origins and destinations are TAPS
Transit Access Points and ldquoon the flyrdquo Path Building
Trip Origins and
Destinations
MAZ to MAZ
Auto Skims
TAZ to TAZ
Transit Skims
TAP to TAP
The three spatial systems are put together by the mode choice model
ldquoOn the Flyrdquo Path Building
bull TAZs TAPs and MAZs are linked via drive and access connectors prior to running CT-RAMP
rmdir OUTDIRABMTEMP S Q rmdir DATADIRABMTEMP S Q xcopy OUTDIR OUTDIRABMTEMP E I Y xcopy DATADIR DATADIRABMTEMP E I Y if(fbi=1) need to run only the first time through - kdk CUBEctramprunCreateAccessFilescmd endif mkdir logFiles taskkill im javaexe F start CUBEctramprunHhMgrcmd JDK64 HOST_IP start CUBEctramprunMtxMgrcmd HOST_IP JDK64 rem start CUBEctrampconfigrunDrivercmd copy CUBEctrampserpm_abmproperties serpm_abmproperties Y ping -n 11 127001 gt nul CUBEctramprunSERPMAbmcmd SAMPLERATE VSAMPLERATE JDK64 CUBEctramprunCreateDemandMatricescmd SAMPLERATE VSAMPLERATE JDK64 taskkill im javaexe F rmdir OUTDIRctramp S Q rmdir DATADIRctramp S Q xcopy OUTDIRABMTEMPctramp OUTDIRctramp E I Y xcopy DATADIRABMTEMPctramp DATADIRctramp E I Y
ldquoOn the Flyrdquo Path Building
MAZ to MAZ Connectors
Created by finding shortest distance paths over an all-streets network Connects all MAZs within 15 mi
Used to represent walk mode distance and time
MAZ to TAP Connectors
Created by finding shortest distance paths over an all-streets network Connects each MAZ to all TAPs within 10 mi
Used to represent transit walk access and walk egress distance and time
TAZ to TAP Connectors
Connects each TAZ to all TAPs within the TAP maximum drive distance bull Bus TAPs ndash 4 miles bull Rail TAPs ndash 15 miles
Used to represent transit drive access and egress distance and time
ldquoOn the Flyrdquo Path Building
bull No actual links created on the network bull Connectivity is expressed in table format
ldquoOn the Flyrdquo Path Building
bull Once the access and walk connectors are created the mode choice model builds complete paths MAZ to MAZ transit paths
bull Local-only paths are built using the ldquolocalrdquo transit skim bull Express BRT Urban Rail and Commuter rail paths are all
built at the same time using the ldquopremiumrdquo transit skim bull For each MAZ to MAZ pair CT-RAMP keeps the shortest
generalized cost path for each available premium mode bull Even though only one ldquopremiumrdquo skim is built CT-RAMP
may find competing premium paths It may also find that the best path is a combination of two premium modes or a premium mode and local bus
Tour Mode Choice Model
Choice
Auto
Drive alone
GP(1)
Pay(2)
Shared ride 2
GP(3)
HOV(4)
Pay(5)
Shared ride 3+
GP(6)
HOV(7)
Pay(8)
Non-motorized
Walk(9)
Bike(10)
Transit
Walk access
Local bus(11)
Express bus(12)
BRT(13)
Urban rail(14)
Commuter rail(15)
PNR access
Local bus(16)
Express bus(17)
BRT(18)
Urban rail(19)
Commuter rail(20)
KNR access
Local bus(21)
Express bus(22)
BRT(23)
Urban rail(24)
Commuter rail(25)
School Bus(26)
Trip Mode Choice Model
bull Same nesting structure as the tour mode choice but conditional on the tour mode
bull Some trip modes may be unavailable depending on the tour mode
DA SR2 SR3+ Walk Wlk-Trn PNR-Trn KNR-Trn
DA Must - - - - - -
SR2 Can Can - Can - - -
SR3+ Can Can Can Can - - -
Walk - - - Must - - -
Wlk-Trn - Can Can Can Can - -
PNR-Trn Can Can Can Can Can Can
KNR-Trn - Can Can Can Can - Can
Trip Switching Rules Simplified
Transit Trip Reporting
bull In SERPM7 the transit boarding and alighting location can be reported in two ways ndash Trip list files (ABM output) -- Boarding TAP Alighting TAP
ndash Transit assignment (Cube output) ndash Route nodes
bull Each type of reporting has its strengths ndash Trip list file allows building detailed transit trip patterns for
population cohorts and time periods
bull Mode split reports
bull Transit trip distance frequency distributions access distance TLFDs
bull Mode to mode transfers
ndash Note ABM reports only the first boarding TAP and the last alighting TAP regardless of mode
ndash Cube output gives aggregate link volumes station to station boardings etc
User Benefit Files
bull SERPM7 can produce FTA User Benefit files for input to SUMMIT
bull User benefits remain a useful analysis tool bull Steps to produce user benefit files require some manual
intervention ndash see User Guide
SERPM ABM Reports
bull Stores ABM inputs and outputs in a relational database to generate some standard model reports
bull Consistent reporting framework to be used for analysis across model runs
bull SERPM7 user community can easily share the scripts that create the reports
bull Reports take the form of Excel workbooks bull Foundation for future development of a visualization
dashboard
Reporting Database Components
Reporting Database Components
bull Reporting ETL (extract transform and load) program ndash Loads all Cube and CT-RAMP Java model outputs into the database
ndash Written in Cube scripts and Java
bull Database ndash Stores all data used in reporting including select network skims
household person tour and trip data zonal data etc
ndash Implemented with SQL Server
bull Report scripts to generate reports ndash Written in T-SQL
bull Report packaging program ndash Generates Excel workbooks with one report per worksheet
ndash Written in Java
Reporting Database Components
bull Run time required to build database and generate reports varies with sample size and type of report ndash Several hours required to build the database for a 100 sample
ndash ~ 30 minutes to produce reports for a 10 sample
bull Report step is optional not part of a standard model run bull Report production is transparent to the user
bull hellip but users can contribute reports bull hellip and choose which reports to build at any one time
Running SERPM ABM Reports
bull Report queries reside in ctrampreports_sql time_spent_travelingsql Total weekday travel time by person type
and income group
total_trips_typesql Trips by trip mode person type county of residence and tour purpose
total_tours_typesql Tours by trip mode person type county of residence and tour purpose
tours_districtssql Tours by tour purpose and tour origin and destination districts
transit_access_time+distsql Drive to transit trip list with many trip details
hellip
Running SERPM ABM Reports
bull List of reports to run is specified in properties file ndash ctrampserpm_reportsproperties
sqlscriptsdirectory = Cserpm7ctrampreports_sql sqlscriptsschemakey = SCHEMA sqlscripts=cleanupsqltransit_access_time+distsql worksheettables=temptransittrips worksheetnames=TransitTrips workbookname = Cserpm7ctrampreports_sqlSERPM_REPORTXLS databaseschema = 2010R databaseipaddress = w-ampdx-d-sag10 databaseinstance = databaseport = 1433 databasename=SERPMABM databaseusername=serpm databasepassword=s3rpm
Adding Reports
bull Step 1 --Write report query ndash T-SQL
ndash User Guide includes a database data dictionary
bull Step 2 ndash Add query to ctrampreports_sql ndash Each query is contained in a single text file
ndash Drop file in reports folder
bull Step 3 ndash Add the query to the properties file sqlquery = Query file name
Worksheettables = Query output
Worksheetnames = Name for the report worksheet
Sample SERPM ABM Reports
bull Exhibit ctrampreports_sqlserpm_reportsxls
More information Shi-Chiang Li | shi-chianglidotstateflus |954 777 4655 Rosella Picado | picadopbworldcom | 206 382 5227 Ken Kaltenbach |kkaltenbachcorradinocom |502 587 7221

Running SERPM7
Running SERPM7
RunCTRAMP Pilot Script
rmdir OUTDIRABMTEMP S Q rmdir DATADIRABMTEMP S Q xcopy OUTDIR OUTDIRABMTEMP E I Y xcopy DATADIR DATADIRABMTEMP E I Y if(fbi=1) need to run only the first time through - kdk CUBEctramprunCreateAccessFilescmd endif mkdir logFiles taskkill im javaexe F start CUBEctramprunHhMgrcmd JDK64 HOST_IP start CUBEctramprunMtxMgrcmd HOST_IP JDK64 rem start CUBEctrampconfigrunDrivercmd copy CUBEctrampserpm_abmproperties serpm_abmproperties Y ping -n 11 127001 gt nul CUBEctramprunSERPMAbmcmd SAMPLERATE VSAMPLERATE JDK64 CUBEctramprunCreateDemandMatricescmd SAMPLERATE VSAMPLERATE JDK64 taskkill im javaexe F rmdir OUTDIRctramp S Q rmdir DATADIRctramp S Q xcopy OUTDIRABMTEMPctramp OUTDIRctramp E I Y xcopy DATADIRABMTEMPctramp DATADIRctramp E I Y
Run CT-RAMP Pilot Script
Step 1 ndash Create access files
rmdir OUTDIRABMTEMP S Q rmdir DATADIRABMTEMP S Q xcopy OUTDIR OUTDIRABMTEMP E I Y xcopy DATADIR DATADIRABMTEMP E I Y if(fbi=1) need to run only the first time through - kdk CUBEctramprunCreateAccessFilescmd endif mkdir logFiles taskkill im javaexe F start CUBEctramprunHhMgrcmd JDK64 HOST_IP start CUBEctramprunMtxMgrcmd HOST_IP JDK64 rem start CUBEctrampconfigrunDrivercmd copy CUBEctrampserpm_abmproperties serpm_abmproperties Y ping -n 11 127001 gt nul CUBEctramprunSERPMAbmcmd SAMPLERATE VSAMPLERATE JDK64 CUBEctramprunCreateDemandMatricescmd SAMPLERATE VSAMPLERATE JDK64 taskkill im javaexe F rmdir OUTDIRctramp S Q rmdir DATADIRctramp S Q xcopy OUTDIRABMTEMPctramp OUTDIRctramp E I Y xcopy DATADIRABMTEMPctramp DATADIRctramp E I Y
Run CT-RAMP Pilot Script
bull Step 1 ndash runCreateAccessFilescmd ndash Creates the walk and transit access amp egress connectors
bull MAZ to MAZ connectors
bull MAZ to TAP walk connectors
bull TAZ to TAP drive connectors
ndash Fully implemented in Cube script
ndash Runs only during the initial feedback loop
rem Set location of Voyager for running Cube scripts set VOYAGER=CProgram Files (x86)CitilabsCubeVoyagerVoyagerexe rem create CT-RAMP maz impedances and maz densities VOYAGER Cserpm7ctrampapplicationsave_maz_dbfs Start VOYAGER Cserpm7ctrampapplicationabm_access_filess Start VOYAGER Cserpm7ctrampapplicationmaz_densitiess Start
Run CT-RAMP Pilot Script
Step 2 ndash Start Household amp Matrix Managers
rmdir OUTDIRABMTEMP S Q rmdir DATADIRABMTEMP S Q xcopy OUTDIR OUTDIRABMTEMP E I Y xcopy DATADIR DATADIRABMTEMP E I Y if(fbi=1) need to run only the first time through - kdk CUBEctramprunCreateAccessFilescmd endif mkdir logFiles taskkill im javaexe F start CUBEctramprunHhMgrcmd JDK64 HOST_IP start CUBEctramprunMtxMgrcmd HOST_IP JDK64 rem start CUBEctrampconfigrunDrivercmd copy CUBEctrampserpm_abmproperties serpm_abmproperties Y ping -n 11 127001 gt nul CUBEctramprunSERPMAbmcmd SAMPLERATE VSAMPLERATE JDK64 CUBEctramprunCreateDemandMatricescmd SAMPLERATE VSAMPLERATE JDK64 taskkill im javaexe F rmdir OUTDIRctramp S Q rmdir DATADIRctramp S Q xcopy OUTDIRABMTEMPctramp OUTDIRctramp E I Y xcopy DATADIRABMTEMPctramp DATADIRctramp E I Y
Run CT-RAMP Pilot Script
bull Step 2 ndash Start Household and Matrix Managers ndash Java applications used by the ABM software to readwrite Cube
matrices and for distributing household ldquojobsrdquo to computer threads
Run CT-RAMP Pilot Script
Step 3 ndash Run SERPM ABM and Visitor Model
rmdir OUTDIRABMTEMP S Q rmdir DATADIRABMTEMP S Q xcopy OUTDIR OUTDIRABMTEMP E I Y xcopy DATADIR DATADIRABMTEMP E I Y if(fbi=1) need to run only the first time through - kdk CUBEctramprunCreateAccessFilescmd endif mkdir logFiles taskkill im javaexe F start CUBEctramprunHhMgrcmd JDK64 HOST_IP start CUBEctramprunMtxMgrcmd HOST_IP JDK64 rem start CUBEctrampconfigrunDrivercmd copy CUBEctrampserpm_abmproperties serpm_abmproperties Y ping -n 11 127001 gt nul CUBEctramprunSERPMAbmcmd SAMPLERATE VSAMPLERATE JDK64 CUBEctramprunCreateDemandMatricescmd SAMPLERATE VSAMPLERATE JDK64 taskkill im javaexe F rmdir OUTDIRctramp S Q rmdir DATADIRctramp S Q xcopy OUTDIRABMTEMPctramp OUTDIRctramp E I Y xcopy DATADIRABMTEMPctramp DATADIRctramp E I Y
Run CT-RAMP Pilot Script
bull Step 3 ndash Run SERPM ABM and Visitor Models ndash Sets and runs SERPM ABM (runSERPMABMcmd)
bull Sets environment variables
bull Gets sampling rates project folders and other run-time variables
bull Sets the ABM properties file
bull Calls SERPM ABM and Visitor Model JARS (executables)
Run CT-RAMP Pilot Script
Step 4 ndash Create Trip Tables for Assignment
rmdir OUTDIRABMTEMP S Q rmdir DATADIRABMTEMP S Q xcopy OUTDIR OUTDIRABMTEMP E I Y xcopy DATADIR DATADIRABMTEMP E I Y if(fbi=1) need to run only the first time through - kdk CUBEctramprunCreateAccessFilescmd endif mkdir logFiles taskkill im javaexe F start CUBEctramprunHhMgrcmd JDK64 HOST_IP start CUBEctramprunMtxMgrcmd HOST_IP JDK64 rem start CUBEctrampconfigrunDrivercmd copy CUBEctrampserpm_abmproperties serpm_abmproperties Y ping -n 11 127001 gt nul CUBEctramprunSERPMAbmcmd SAMPLERATE VSAMPLERATE JDK64 CUBEctramprunCreateDemandMatricescmd SAMPLERATE VSAMPLERATE JDK64 taskkill im javaexe F rmdir OUTDIRctramp S Q rmdir DATADIRctramp S Q xcopy OUTDIRABMTEMPctramp OUTDIRctramp E I Y xcopy DATADIRABMTEMPctramp DATADIRctramp E I Y
Run CT-RAMP Pilot Script
bull Step 4 ndash createDemandMatricescmd ndash Creates Cube format trip tables for highway and transit assignment
ndash Translates the ABM amp Visitor Model list of trips into matrix format
ndash Three sets of demand matrices
bull Resident trips
bull Visitor trips
bull Resident + Visitor trips
ndash This step is implemented in Cube Script
The CT-RAMP Properties File
bull A settings file is used to control the ABM software ndash ctrampserpm_abmproperties
bull The majority of the properties (settings) in this file are set during model installation and do not need to be changed for a typical model run
bull Properties are described in the User Guide bull Example properties ndash Settings to control trace calculations
ndash System environment properties
ndash Input and output filenames
ndash Settings that specify how to read the utility expression calculators (UECs)
The CT-RAMP Properties File
bull Exhibit serpmabmproperties
Monitoring Run StatusProgress
bull Cube scripted components progress is tracked by Cubersquos Task Monitor
Monitoring Run Status
bull Java components status is reported to the log files ndash CubelogFileseventlog
ndash CubelogFiles
bull The log files are text files that can be opened with any text editor (Notepad Wordpad Ultraedit etc)
bull What is reported ndash Step being executed
ndash A few model output summaries
ndash Errors
ndash Trace calculations
bull While Java components are running status of Task Monitor does not change
Monitoring Run Status
bull Exhibit cubeeventlog
Running SERPM7 ndash New Scenario
bull Step 1 ndash Create input and output scenario folders ndash Suggested scenario naming convention
bull inputIN-YEARALT
bull outputOUT-YEARALT
bull Copy all input files from an existing scenario including all subfolders
bull Update new scenario-specific files ndash Highway transit networks
ndash Household person synthetic population
ndash Land use data
bull Proceed with Steps 2 thru 6 for running an existing scenario
FDOT Servers Run Times
Feedback Loop End Time Runtime (HHMM)
RMSE (AM amp PM)
1 945 1045 1226 amp 1363
2 1648 703 060 amp 058
3 119 831 023 amp 020
4 806 647 012 amp 009
5 1458 652 008 amp 006
Total ~40 hrs
Model Server 3 20 Sample
FDOT WorkStation Run Times
Machine Sample Size Run Time (HHMM)
Model WorkStation
1 048
5 240
10 503
20 949
Model Server 3 20 400
CT-RAMP Only
Model Installation
SERPM7 Installation
bull Installation package and User Guide available from Florida DOT via FSUTMS Online
bull Hardware and software requirements and installation instructions described in User Guide
bull Sample model output available from Florida DOT
SERPM7 Installation
bull Hardware Requirements ndash 64-bit Operating System
ndash Intel Xeon X5690 347 GHz 6 core processors or similar
ndash Minimum 96 GB RAM
ndash Minimum 1 TB space for storing model output
bull Software ndash Cube 61 wcluster license
ndash SQL SQL Express
ndash Java
ndash Microsoft Excel (optional)
SERPM7 Installation
bull Step 1 ndash Create the Project Folder ndash Set user permission level to lsquoEveryonersquo
bull Step 2 ndash Configure the machines ndash Set environment variables
ndash Install Java and set its environment variables
ndash Verifyinstall Cube 64-bit matrix IO DLL
ndash Other hellip
bull Step 3 ndash Configure the JPPF services bull Step 4 ndash Configure the ldquoRunrdquo component files bull Step 5 ndash Configure SERPM7 in Application Manager bull Step 6 ndash Create the seed skims
Application 1 Working with a Population Sample
Working with a Population Sample
bull A simulation of the entire population is not required for every single application ndash Small sample sizes are sufficiently accurate for forecasting aggregate
region or county-wide statistics
ndash Small sample sizes save run time during model calibration and when testing initial versions of new networks and other input data
Working with a Population Sample
bull Developing a region-wide forecast using travel outcomes for a sample of the population is analogous to estimating region-wide travel statistics using a survey sample
Survey Simulation
Gathers trip diary information for a sample of households
Simulates trips for a sample of households
Typical sampling rate 020 - 025
Typical sampling rate 5 - 50
Estimates travel patterns for entire population by multiplying each surveyed trip record by an
expansion factor
Estimates travel patterns for entire population by multiplying each simulated trip record by an
expansion factor
Typical expansion factors 100 - 1000
Typical expansion factors 2 - 20
Working with a Population Sample
bull The ABM assumes that each household makes travel decisions independently of the decisions made by all other households
bull Households are simulated independently of each other bull The ABM samples randomly from the list of households to
select the ones it simulates bull It is prudent to verify that the selected population sample is
unbiased ndash A very small (1 or less) simple random sample is likely to be biased
for example it will likely mis-represent households that are found infrequently in the population
ndash Samples of 10 or more are typically sufficiently unbiased for travel demand forecasting applications
Working with a Population Sample
bull How big a sample to use ndash The more localized the expected impact of a project the larger the
required sample
bull Some recommendations ndash For model calibration and validation 10-25 is typically sufficient
ndash For comparing aggregate county-wide and sub-county average travel statistics 10 - 25
ndash For estimating daily traffic volumes on high capacity facilities and high capacity transit 25 - 50
ndash For traffic impact studies 50 - 100
bull hellip but testing highly encouraged
Working with a Population Sample
bull A sample expansion factor is applied when creating the trip tables for assignment
bull Expansion factor = 1samplingRate bull Loads on highway and transit networks are representative
of the entire population bull Summaries produced from the ABM list output need to be
expanded to be representative of the entire population
Running SERPM7 with a Population Sample
bull Setting the run ndash Set the sampling rate for residents and visitors in Cube
ndash All other model settings can remain unchanged
bull The same sampling rate is used on all feedback loops
Catalog Key Description
SAMPLERATE Sampling rate for the resident population
VSAMPLERATE Sampling rate for the visitor population
Running SERPM7 with a Population Sample
bull When working with a ldquoless than 100rdquo model run each record in the output list files has to be expanded by 1samplingRate ndash householdData_v1csv
ndash personData_v1csv
ndash indivTourFile_v1csv
ndash jointTourFile_v1csv
ndash indivTripFile_v1csv
ndash jointTripFile_v1csv
bull Trip tables are already expanded ndash TAZ_Demand_tmat
ndash TAP_Demand_tmat
Running SERPM7 with a Population Sample
bull Sample Output ndash County-wide highway assignment statistics
Screenline 25
Sample 50
Sample Diff ()
BOEW Northern SL along Pompano Canal 842418 843591 -01
BOEW Middle SL along Oakland Park Blvd 1187251 1183529 03
BOEW Southern SL along River Canal 881601 879618 02
BONS Western SL between I75 and TPK 586412 587353 -02
BONS Middle SL along TPK 1441311 1437065 03
BONS Eastern SL along Intracostal Wway 328855 326298 08
BOEW SL BOPB County Line 648960 648771 00
BOEW SL BOMD County Line 979327 976276 03
BOWestern Ext CL Collier County Line 31059 31059 00
BONS I-95 CL from Miami-Dade to I-595 510207 509537 01
BONS Western CL along SR897 frm PB-SR816 494591 495547 -02
Running SERPM7 with a Population Sample
Running SERPM7 with a Population Sample
Running SERPM7 with a Population Sample
bull Sample Output ndash Individual Route Boardings
Running SERPM7 with a Population Sample
bull Sample Output ndash Individual Route Boardings
Running SERPM7 with a Population Sample
bull Sample Output ndash Regionwide Household Income Profile
Household Income 25 Sample 100 Sample
Less than $10000 1015 1021
$10000 to $15000 470 468
$15000 - $20000 566 564
$20000 to $25000 519 516
$25000 to $30000 493 494
$30000 to $35000 475 477
$35000 to $40000 387 387
$40000 to $45000 343 345
$45000 to $50000 348 348
$50000 to $75000 1754 1747
$75000 to $100000 1432 1433
$100000 or More 2198 2200
Application 2 Population Synthesis
Population Synthesis
bull Each SERPM7 scenario requires a synthetic population ndash List of households -- hhFilecsv
ndash List of persons that make up the households -- personFilecsv
bull Two synthetic populations have been developed to date ndash 2010 base year population
ndash 2040 long range transportation plan population
Population Synthesis
bull New synthetic populations will be required for ndash Other regional scenario years (eg 2020 2025 2045)
ndash To test population and land use scenarios such as
bull Traffic impact study for a new housing or commercial development
bull Impact of aging population
bull Impact of rising sea levels (because some neighborhoods will no
longer be inhabitable)
bull Refinements to the 2010 and 2040 populations
Population Synthesis
bull The population synthesizer (PopSynII) does not run normally as part of SERPM7 ndash SERPM7 expects input population files in the input folder
ndash User is responsible for running PopSynII to generate the required population files and place them in the scenario folders prior to a SERPM7 run
bull Why ndash Because a new synthetic population is not required for every run
PopSyn II Setup
bull PopSynII is already configured to run on the FDOT servers bull Java application using SQL data storage
PopSynII installed in the main ctramp folder
PopSynII Setup
bull The ctramppopsyn folder
Filename Description
runAllPopsynbat Batch file that controls the execution of PopSynII
controls SQL settings file that specifies the population attributes used as controls
1_importCSVsql 2_createTargetssql 3_createSynHHPerFilessql
SQL scripts that run the PopSynII software
2010_TAZ_Datacsv TAZ input control data
2010_MAZ_Datacsv MAZ input control data
Developing a New Synthetic Population
bull Step 1 ndash Prepare the input files ndash TAZ controls 2010_taz_datacsv
ndash MAZ controls 2010_maz_datacsv
Developing a New Synthetic Population
bull MAZ Control input file eg 2010_maz_datacsv ndash Estimates of total households and persons living in group quarters
bull Total households
bull Total group quarter population
ndash One record for each MAZ
Developing a New Synthetic Population
bull TAZ Controls input file -- eg 2010_taz_datacsv ndash Estimates of number of households or population for each SERPM7
controlled attribute
bull Household size
bull Household income
bull Household workers
bull Type of dwelling unit
bull Presence of children in the household
bull Population age group
bull Gender
bull Raceethnicity
bull Population in group quarters
ndash One record per TAZ
Analogous to the TAZ SE data file in the trip-
based model
Developing a New Synthetic Population
When preparing TAZ and MAZ control data it is critically important to
maintain internal data consistency
Developing a New Synthetic Population
bull Some data checks to perform and problems to look out for ndash The household and person marginals pertain to household residents
only except for the group quarter controls
ndash All household-based marginals add up to the same total households for each TAZ
ndash All person-based marginals add up to the same total persons for each TAZ
ndash The total number of persons implied by the household size marginal is consistent with the sum total of the person marginals
ndash The total number of children obtained from the age marginal is consistent with the marginal of households by presence of children
ndash Large deviations from 5050 split of persons by gender is suspect
ndash The household income distribution is consistency with the workers-in-household distribution
Developing a New Synthetic Population
bull More data checks ndash The MAZ and TAZ controls should add up
bull to the same number of households by TAZ
bull to the same number of persons in group quarters by TAZ
Developing a New Synthetic Population
bull Exhibit ndash SERPM7 2010 TAZ control file
Example ndash Minto West Palm Beach Co
Example ndash Minto West
bull Mixed-use development in a agricultural area adjacent to an existing housing development
bull Information available from proposedapproved plans ndash Single-family dwelling units ndash 5050
ndash Multi-family dwelling units ndash 1040
ndash Total population ndash 14 535 persons
ndash Spatial location of dwelling units by type
bull Other PopSyn required data not available from plans (income distribution age distribution etc) ndash Estimateassert it based on similar existing developments
surrounding neighborhood
Example ndash Minto West
bull Adding householdspersons to a TAZ
bull Adding TAZs or MAZs to SERPM7 should be a rare occurrence ndash Households are ultimately allocated to MAZs and therersquos already
12000 of them
ndash Households are represented individually so the zone attributes are derived from them
Trip-Based Model Modify the input zonal data file
Activity-Based Model Modify the population synthesis control file
Running PopSynII
bull Step 2 ndash Modify the PopSyn settings file for this run ndash Update TAZ and MAZ control filenames in runAll_popsynbat
REM BATCH FILE TO SETUP POPSYN RUN RUN POPSYNII AND OUTPUT CSV FILES REM SETUP REM PLEASE SET PATH NAMES FOR WORKING FOLDER AND CSV FILE LOCATIONS SET SERVERNAME=W-AMSTL-D-00052SQLEXPRESS SET DATABASENAME=popSyn SET ARCPATH=Cpopsyn SET CSVPATH_CONTROLS=Cpopsyninputscontrolscsv SET CSVPATH_MAZ=Cpopsyninputs2010_MAZ_Data_20120207csv SET CSVPATH_TAZ=Cpopsyninputs2010_TAZ_Data_20120207csv REM MAIN SCRIPT REM MAKE FILENAMES TABLE REM sqlcmd -S SERVER NAME -E -i INPUT FILE PATH (SCRIPT) -o OUTPUT LOG REM -E means to use Windows authentication for the user that is running the batch file SQLCMD -S SERVERNAME -d DATABASENAME -E -Q IF OBJECT_ID(dbocsv_filenames) IS NOT NULL DROP TABLE csv_filenames -o ARCPATHResultLogtxt
hellip hellip
Running PopSynII
bull Other PopSyn settings ndash rarely used in a production run ndash Change the control attributes
ndash Change the priority of control attributes
Running PopSynII
bull Step 3 ndash Run PopSynII -- runAll_popsynbat
Running PopSynII
bull Step 4 ndash Review Output amp Check Fit to Controls
Output File Description
hhFilecsv List of households
personFilecsv List of persons
ZoneResultscsv Comparisons of synthetized households to controlled and uncontrolled attributes
BalanceDetailscsv
ValidationStatscsv
ValidationStatsByPumacsv
Reviewing PopSyn Output
bull Zone_Resultscsv bull Comparison of synthesized totals to target totals for each
TAZ and controlled attribute
TOTAL_HOUSEHOLDS
ZONE TARGET SYNTHESIZED DIFFERENCE PCTDIFF
1 715 715 0 0
2 811 811 0 0
3 878 878 0 0
4 826 826 0 0
5 1181 1181 0 0
6 212 212 0 0
7 459 459 0 0
8 253 253 0 0
Reviewing PopSyn Output
bull Balance_Detailscsv bull Same output as Zone_Results different format
Zone Control ID ControlCat Target PUMSVal ConStat
1989 109 TOTAL_HOUSEHOLDS 1508 1508 yes
1989 249 INCOME_25K 273 271 no
1989 19 HHSIZE_4PLUS 467 467 yes
1989 160 FEMALE 2196 2108 no
1989 55 INCOME_100K 258 257 yes
1989 67 MULTI_UNIT 423 407 no
1989 31 WORKERS_3PLUS 164 166 no
Reviewing PopSyn Output
bull Validation_Statscsv ndash Comparison of synthesized attributes to input Census data (5 PUMS)
ndash Includes uncontrolled attributes
Description popSynSum censusSum meanDiff stdDev minDiff maxDiff Universe 1 number of households 2085375 1964881 17 61 -97 331
family 67 65 3 17 -26 48
non family 33 35 0 34 -58 111
size 1 27 28 0 36 -59 111
size 2 31 32 -3 14 -30 30
size 3 17 17 1 22 -37 53
size 4 25 23 18 50 -46 160
Reviewing PopSyn Output
bull Validation_StatsByPumacsv ndash Same as validation_stats but for each PUMA
bull Note that synthesized population may differ from 5 Census population by design
Application 3 ndash Highway Project
Highway Project
Example Projects ndashToll road extension ndashReversible lanes ndashManaged lanes
Overview
How to use SERPM7 to perform a model run and do some standard analysis ndash Option 1 -- Code the project directly on the geodatabase
bull Roadway links
bull Node links
bull Turn penalties
bull [assume no change to transit]
ndash Option 2 --Code the project on net files and then build the geodatabase
bull Use flowchart script to build the geodatabase
ndash Coding is very similar to earlier versions of SERPM
bull Facility types are the same
SERPM Facility Types (not new)
Editing the Highway Network
bull SERPM 7 requires a geodatabase bull Editing can be done either to a net file or directly on the
geodatabase bull The user can use utilities in the model flowchart to write a
net file from the geodatabase edit the net and then write it to the geodatabase
bull The geodatabase must exist to run the model
Editing in the Geodatabase
bull Simplest and most direct method bull Requires an understanding of the CubeArcGIS tools
Export geodatabase and edit as a net
bull Start Data Manager bull Open geodatabase (SERPM_NETSMDB) bull Double click on the network Input Hwy Net and specify an
output file (maybe ldquoeditnetrdquo) bull Open from Cube and edit as usual bull Use ldquoPrepare for Model Run and Trap Errorsrdquo (2) utilities to
write back to geodatabase ndash Reload geodatabase from Cube files ndash Cull and sort
ndash Write to geodatabase
Edit as a net
Export Edit in Cube
Change to point to edited network
Input Hwy Net
Toll Road Extension
bull Short Cut ndash copy an existing toll link bull No special NODE attributes bull Only new attribute is ISTOLL=1 for all links that could not be
used unless a toll were paid bull Toll Mainline FTC2=91 ISTOLL=1 DIRCODE=1 bull Plaza (gantry) ndash assume all will be electronic collection ndash TOLL=1 DIRCODE=1
ndash TOLLTYPE=3 CARTOLL=toll in dollars
ndash FTC2=95
ndash ISTOLL=1
ndash SVCSECONDS=001
ndash DELCODE=1 ACCELCODE=1 AVILANES=2
Toll Road Extension
Not much different from earlier versions of SERPM
Reversible Lanes
bull Control by the link attribute REVERSIBLE ndash REVERSIBLE=1 means AM operation only
ndash REVERSIBLE=2 means PM operation only
ndash I-595 example
Managed Lanes (typically Express)
bull HOT=1 ndash 98 (99 makes the link a dummy) bull FTC2 most likely=91 but other types permitted bull TOLL=0 ISTOLL=0 bull Tolls set by HOTTOLLdbf
HOT Lanes Tolls
bull Set as a function of the VC bull Updated in the travel time feedback loop bull Affects the TollFree split in mode choice bull Column HOT_x were x=HOT link attribute bull HOT_1 is the current 95 Express rate HOT_2 is a placeholder
Common Errors
bull Errors to watch out for ndash If network steps fail look for missing attributes
ndash Update transit routes as needed due to changes to underlying highway network
ndash Check for dangling links and unconnected zones
ndash Verify that all TAZs are connected to lsquofreersquo roads
bull Special procedures required for TAZs that have toll-only access must
include the attribute ISRCTOLLINK=1 (currently used for the
Rickenbacker Causeway)
ndash Some CT-RAMP errors caused by network coding errors may not be apparent until feedback loop 2 because in loop 1 CT-RAMP uses seed skims
bull Use small sample size when testing a new network
Was the Run Successful
bull Did the run converge ndash AM and PM travel time RMSE values reported to
OUTDIRfeedbacklogprn
ndash Run stops when RMSE is less than 01
ndash 2010 Scenario converges in 5 loops
bull What to do if it didnrsquot converge ndash Look for obvious errors
ndash Run more iterations (future year might require more)
bull Are the top-level results comparable to a similar run ndash Use HEVAL reports
ndash Examine screenlines (RMSE reports)
ndash Spot check link loads
Tools for Analysis
bull Analysis ndash perform standard highway project type analyses
bull Usual analysis similar to trip-based model ndash Total daily and period-specific roadway volumes and speeds by
vehicle class
ndash Vehicle trip OD matrices
bull Standard FSUTMS HEVAL and RMSE reports are still available ndash Day and period assignments
ndash By County
ndash Truck assignment
Tools for Analysis
bull Potential for customized assignment classes to address
specific project questions ndash Does the manage lane serve primarily high income users
bull Stratify vehicle classes by lowhigh income to understand facility
usage by income level
bull Stratify vehicle classes by disadvantaged population cohorts
bull Trip and person tabulations built from ABM output ndash Trip mode shares for many different population cohorts subareas
ndash For example toll vs non-toll shares by value of time or fine-graded income levels
ndash Many other possibilities
Application 4 ndash Mobility Project
Mobility Project ndash SUNPASS Market Share
bull Persons in households that own a SUNPASS transponder respond differently to managed lane and toll road policies ndash Pay lower tolls than cash users
ndash Have access to I-95 managed lanes
bull Policy questions ndash How does projected toll traffic and revenue vary with the SUNPASS
penetration rate and toll discount
ndash How will SUNPASS penetration rate vary as more managed lane facilities are built in the region
Mobility Project ndash SUNPASS Market Share
bull Question 1 -- How does projected toll traffic and revenue vary with the SUNPASS penetration rate and toll discount
bull Procedure ndash Step1 ndash Assume a SUNPASS market share by modifying the toll
transponder model
ndash Step 2 ndash Run SERPM7 to produce traffic volumes
ndash Step 3 ndash Estimate toll traffic revenue
Modifying the Toll Transponder Ownership Model
bull Model specification is contained in TransponderOwnershipxls and can be edited with Microsoft Excel
Utility Variable Coefficient
Expected time savings up to 644 min 00631
Distance less than 5 miles -00304
Distance between 5 and 10 miles -00648
Distance 10 miles or more -00648
Constant 04877
Modifying the Toll Transponder Ownership Model
Utility Variable Coefficient
Expected time savings up to 644 min 00631
Distance less than 5 miles -00304
Distance between 5 and 10 miles -00648
Distance 10 miles or more -00648
Constant 04877
Increasing the constant will increase the number of households equipped with transponders
TransponderOwnershipxls
Modifying the Toll Transponder Model
bull Increase the constant by how much ndash Process is akin to model calibration
ndash Several runs of the transponder model required to estimate the constant that yields the desired market share
ndash 2010 market share is approximately 65
ndash Use a small sample (5 or 10) to save run-time while establishing the right constant
Modifying the Toll Transponder Model
bull Variation ndash Add terms to the model so that certain types of households are more
likely to exhibit a SUNPASS market share increase
bull Highlow income households
bull Multi-car households
bull Miami-Dade households
Modifying the Toll Transponder Model
bull Exhibit TransponderOwnershipxls
Mobility Project ndash SUNPASS Market Share
bull Question 2 -- How will SUNPASS penetration rate vary as more managed lane facilities are built in the region
bull Procedure ndash Step 1 ndash Code the manage lane facilities
ndash Step 2 ndash Run SERPM7 to forecast transponder ownership
ndash Step 3 ndash Analyze the forecast household data for changes in the profile of households equipped with transponders
Application 5 ndash Land Use Project
Land Use Project
bull Transportation projects comprise not only network scenarios but also land use scenarios
bull Land use scenarios can be ndash Very large scale (substantial changes to housing and employment
estimates throughout the region) or
ndash Small scale (localized changes for example for a traffic impact study)
bull For both large scale and small scale land use updates the
general procedure for updating the input data and running the model is the same
Land Use Project
bull The land use data in SERPM7 consists of ndash Synthetic population and derived input files
ndash Employment data
ndash School enrollment data
ndash Parking costs and parking spaces
ndash Regional shopping mall special generators
ndash Beach special generators
ndash Hotel and motel room data
Land Use Project
bull The land use data reside in different input files
Data Item Input File
Synthetic Population hhFilecsv personFilecsv ctramppopsynTAZDatacsv ctramppopsynMAZDatacsv
Employment School Enrollment Parking Supply Data Special Generators Hotel and Motel Rooms
inputsIN-2010Rmaz_datacsv
Land Use Project
bull As demonstrated earlier SERPM 7 requires significantly more comprehensive socio-economic inputs as compared to previous versions ndash Greater spatial detail
ndash More categoriestypes of land uses
bull These inputs require additional preparation when
performing land use model runs
Land Use Project
Data Required and examples bull Population
bull Age distribution of the population expected to live in the
development
bull Income profile
bull Type of dwelling unit (single-family vs multi-family)
ndash The input data need to be internally consistent (distribution of households by presence of children needs to be consistent with population age distribution for example)
Land Use Project
Data Required bull Employment classification ndash Previous models had three
employment classifications
ndash In SERPM 7 there are 16 employment categories to better differentiate type of land use and improve the relationship between land use and activity purpose
Land Use Project
Data Required bull School enrollment ndash note that it differentiates by grade level
(K-8 high-school collegepost-secondary) ndash Donrsquot forget to include school faculty and staff in employment
Land Use Project
Data Required bull Parking supply and
parking costs ndash Parking spaces may
reflect use restrictions
bull Monthly
bull Daily
bull Hourly
ndash Parking costs consistent with type of use
Land Use Project
bull Park Area 1 (pink) ndash May park in MAZ other
than destination MAZ
ndash Parking cost applies
bull Park Area 2 (gree) ndash Parks at destination MAZ
ndash Parking cost applies
Land Use Project
Data Required bull Visitor Model ndash Number of hotel and motel rooms
bull Special Generators ndash Regional shopping malls
ndash Beach recreation areas
Land Use Project
The Gardens Mall Aventura Mall
Boynton Mall Dolphin Mall
Delray Community Mall Dadeland Mall
Towncenter Mall The Falls Shopping Center
Wellington Greens Mall Cutler Ridge Mall
Coral Square Mall Bal Harbour Shops
Pompano Citi Centre CocoWalk
Sawgrass Mills Mall The Mall at 163rd Street
Broward Mall Mall of the Americas
Galleria Mall Mary Brickell Village
Pembroke Lakes Mall Miami International Mall
Lakes Mall Miracle Marketplace
Oakwood Plaza Village of Merrick Park
The Promenade at Coconut Creek Westland Mall
Regional Shopping Mall Special Generators
Land Use Project
Deerfield Beach
Pompano Beach
Fort Lauderdale Beach
Fort Lauderdale Beach
Hollywood Beach
South Beach
Haulover Beach
Crandon Park
Dania Beach
Bill Baggs State Park
Beach Special Generators
Land Use Project
Sample Problem
bull MINTO West Example - a mixed residentialcommercial development ndash 6500 singlemulti-family residential units in multiple TAZs
ndash 14 million square feet of non-residential space
ndash 150 room hotel
ndash 3000 student college campus
Land Use Project
MINTO WEST
Land Use Project
TAZsMAZs representing MINTO West Development
Land Use Project
Need to translate population household and employment information from developer into model input data ndash As discussed in the Population Synthesis presentation population and
household attribute estimates can be taken from other known nearby neighborhoods
bull In this sample problem first start by allocating percentages of total
households into individual MAZs within the development area
bull Keep in mind household density when estimating the number of
households in each MAZ
Land Use Project
bull In this sample employment can be assumed to include bull Retail
bull RestaurantsBars
bull Offices
bull Health services
bull Hotelmotel employment and
bull Educational employment
ndash As with households yoursquoll need to apportion the employment areas to individual MAZs while keeping in mind the types of employment expected in those locations
Land Use Project
bull Employment data is usually estimated by converting floor space available to individual types of employment through conversion factors
bull ie ndash (3000 sqft office space)(20 sqft per office employee) =
150 office employees
Land Use Project
bull Once population household and employment figures are estimated they are entered into the appropriate model input file
bull Population ndash TAZ synthetic population control file
bull Household ndash TAZ synthetic population control file
bull Employment School Parking and Special Gen ndash maz_datacsv
bull Ensure that population household and employment figures
are the same in each file
bull Prior to performing model run PopSyn must be run and user must copy output files to SERPM7 input folders
Application 6 ndashTransit Project
Transit Project ndash MetroRail North Corridor
SERPM Transit Modes
Transit Mode Tour and Trip
Mode TAP Transit Skim Mode
Tri-Rail Commuter Rail Premium
Metrorail Urban Rail Premium
I-95 Inter-County Express I-95X I-95E
Express Bus Premium
Busway BRT Premium
MDT Express Express Bus Premium
Metromover Local Bus Local Bus
MDT Local BCT Local
Palm Tran Local Local Bus Local Bus
Breeze Local Bus Local Bus
Tri-Rail Shuttles Local Bus Local Bus
SERPM Transit Modes
Transit Mode Tour and Trip
Mode TAP Transit Skim
Mode
Mode coded on the route ldquocardsrdquo
Used to specify boarding and transfer penalties for transit
path building
(most disaggregate)
Line-haul choices in the tour and trip mode choice
models
Used to create sets of TAP to TAP levels of service
(most aggregate)
Similar to SERPM 67 SERPM 7 ABM
SERPM Transit Modes S67 Mode Local (L) S7
Mode Mode Name Operator amp Name UserA4 Name Prem (P) MODE
15 Tri-Rail 11 Tri-Rail 15 Commuter P 111
14 Metrorail 25 Metrorail 14 Urban Rail P 121
X Regional LRT Regional LRT 14 LRT P 131
16 Inter-County Express Bus 33 I-95 Inter-County Express 16 Express P 151
12 Exclusive ROW Cir-Reg 13 Exclusive ROW Cir-Reg 12 Mover L 181
11 TrolleysShuttles-Reg 12 Tri-Rail Shuttles 11 Local L 191
11 TrolleysShuttles-Reg 12 Tri-Rail Shuttles 33 Local L 192
X LRT- MDT 25 MDT LRT 14 LRT P 231
16 Buses (localexpress) - MDT 27 MDT Busway Flyers 27 BRT P 241
23 Buses (localexpress) - MDT 27 MDT MAXKATBusway Local 27 BRT P 242
24 BRT - MDT 28 MDT BRTLRT 28 BRT P 243
23 Buses (localexpress) - MDT 22 MDT Express 24 Express P 251
16 Buses (localexpress) - MDT 24 MDT I-95 Exp 26 Express P 252
16 Inter-County Express Bus 24 I-95 Inter-County Express 16 Express P 253
22 Exclusive ROW Cir-MDT 26 Metromover 22 Mover L 281
21 TrolleysShuttles-MDT 21 MDT TrolleysShuttles 21 Local L 291
23 Buses (localexpress) - MDT 21 MDT Local 23 Local L 292
23 Buses (localexpress) - MDT 23 MDT Shuttle 25 Local L 293
X LRT - BCT 35 BCT LRT 37 LRT P 331
34 BCT Rapid Bus BRT 34 BCT Rapid Bus 36 BRT P 341
34 BCT Fixed-guideway BRT 35 BCT BRT 37 BRT P 342
33 Buses (localexpress) - BCT 32 BCT Breeze 34 Express P 351
33 Buses (localexpress) - BCT 33 BCT Express 35 Express P 352
32 Exclusive ROW Cir-BCT 31 BCT Exclusive ROW Cir 32 Mover L 381
31 TrolleysShuttles-BCT 31 BCT TrolleysShuttles 31 Local L 393
33 Buses (localexpress) - BCT 31 BCT Local 27 Local L 391
33 Buses (localexpress) - BCT 31 BCT Local 33 Local L 392
X LRT - Palm Tran 43 Palm Tran LRT 44 LRT P 431
44 BRT - Palm Tran 43 Palm Tran BRT 44 BRT P 441
43 Buses (localexpress) - Ptran 42 Palm Tran Exp 44 Express P 451
42 Exclusive ROW Cir-PTran 41 Palm Tran Exclusive ROW Cir 42 Mover L 481
41 TrolleysShuttles-Ptran 41 Palm Tran TrolleysShuttles 41 Local L 491
43 Buses (localexpress) - Ptran 41 Palm Tran Local 43 Local L 492
Modes Not in the 2010 Network
SERPM7 Transit Network Building
bull Typically bus routes are coded on top of existing highway links
bull SERPM7 reserves some facility type codes for transit-only use helpful to more accurately represent route ndash Caution -- make sure network integrity is preserved once transit only
links are removed
bull Rail routes require coding first fixed-guideway links
SERPM7 Transit Network Building
bull Route Attributes -- User Coded ndash Name
ndash Long Name
ndash Mode
ndash Operator
ndash Headway[1] ndash AM Peak
ndash Headway[2] ndash Midday
ndash Headway[3] ndash PM Peak
ndash UserA4 (stop dwell time)
SERPM7 Transit Network Building
bull PNR Node Attributes ndash User Coded ndash Parking Spaces
ndash Parking Cost AM
ndash Parking Cost MD
ndash Terminal Time PNR
ndash Terminal Time KNR
bull At this time parking spaces is used only to identify park-n-ride locations (parking spaces gt 0)
SERPM7 Transit Network Building
bull Transit Access Points -- Created by Cube for the ABM ndash One TAP for each stop on premium routes
bull Tri-Rail Metrorail Express Bus BRT
ndash One TAP for each Local Bus park-n-ride node
ndash Synthesized TAPs to represent access to local bus stops
bull Transit Access Point Attributes ndash TAP Mode
ndash Inherit PNR node data
Sample Highway Network with TAPs
TAPs become part of the highway network and replace the TAZ centroids when building transit skims
Transit Access Points and ldquoon the flyrdquo Path Building
bull Transit skims are built TAP to TAP
Matrix origins and destinations are TAPS
Transit Access Points and ldquoon the flyrdquo Path Building
Trip Origins and
Destinations
MAZ to MAZ
Auto Skims
TAZ to TAZ
Transit Skims
TAP to TAP
The three spatial systems are put together by the mode choice model
ldquoOn the Flyrdquo Path Building
bull TAZs TAPs and MAZs are linked via drive and access connectors prior to running CT-RAMP
rmdir OUTDIRABMTEMP S Q rmdir DATADIRABMTEMP S Q xcopy OUTDIR OUTDIRABMTEMP E I Y xcopy DATADIR DATADIRABMTEMP E I Y if(fbi=1) need to run only the first time through - kdk CUBEctramprunCreateAccessFilescmd endif mkdir logFiles taskkill im javaexe F start CUBEctramprunHhMgrcmd JDK64 HOST_IP start CUBEctramprunMtxMgrcmd HOST_IP JDK64 rem start CUBEctrampconfigrunDrivercmd copy CUBEctrampserpm_abmproperties serpm_abmproperties Y ping -n 11 127001 gt nul CUBEctramprunSERPMAbmcmd SAMPLERATE VSAMPLERATE JDK64 CUBEctramprunCreateDemandMatricescmd SAMPLERATE VSAMPLERATE JDK64 taskkill im javaexe F rmdir OUTDIRctramp S Q rmdir DATADIRctramp S Q xcopy OUTDIRABMTEMPctramp OUTDIRctramp E I Y xcopy DATADIRABMTEMPctramp DATADIRctramp E I Y
ldquoOn the Flyrdquo Path Building
MAZ to MAZ Connectors
Created by finding shortest distance paths over an all-streets network Connects all MAZs within 15 mi
Used to represent walk mode distance and time
MAZ to TAP Connectors
Created by finding shortest distance paths over an all-streets network Connects each MAZ to all TAPs within 10 mi
Used to represent transit walk access and walk egress distance and time
TAZ to TAP Connectors
Connects each TAZ to all TAPs within the TAP maximum drive distance bull Bus TAPs ndash 4 miles bull Rail TAPs ndash 15 miles
Used to represent transit drive access and egress distance and time
ldquoOn the Flyrdquo Path Building
bull No actual links created on the network bull Connectivity is expressed in table format
ldquoOn the Flyrdquo Path Building
bull Once the access and walk connectors are created the mode choice model builds complete paths MAZ to MAZ transit paths
bull Local-only paths are built using the ldquolocalrdquo transit skim bull Express BRT Urban Rail and Commuter rail paths are all
built at the same time using the ldquopremiumrdquo transit skim bull For each MAZ to MAZ pair CT-RAMP keeps the shortest
generalized cost path for each available premium mode bull Even though only one ldquopremiumrdquo skim is built CT-RAMP
may find competing premium paths It may also find that the best path is a combination of two premium modes or a premium mode and local bus
Tour Mode Choice Model
Choice
Auto
Drive alone
GP(1)
Pay(2)
Shared ride 2
GP(3)
HOV(4)
Pay(5)
Shared ride 3+
GP(6)
HOV(7)
Pay(8)
Non-motorized
Walk(9)
Bike(10)
Transit
Walk access
Local bus(11)
Express bus(12)
BRT(13)
Urban rail(14)
Commuter rail(15)
PNR access
Local bus(16)
Express bus(17)
BRT(18)
Urban rail(19)
Commuter rail(20)
KNR access
Local bus(21)
Express bus(22)
BRT(23)
Urban rail(24)
Commuter rail(25)
School Bus(26)
Trip Mode Choice Model
bull Same nesting structure as the tour mode choice but conditional on the tour mode
bull Some trip modes may be unavailable depending on the tour mode
DA SR2 SR3+ Walk Wlk-Trn PNR-Trn KNR-Trn
DA Must - - - - - -
SR2 Can Can - Can - - -
SR3+ Can Can Can Can - - -
Walk - - - Must - - -
Wlk-Trn - Can Can Can Can - -
PNR-Trn Can Can Can Can Can Can
KNR-Trn - Can Can Can Can - Can
Trip Switching Rules Simplified
Transit Trip Reporting
bull In SERPM7 the transit boarding and alighting location can be reported in two ways ndash Trip list files (ABM output) -- Boarding TAP Alighting TAP
ndash Transit assignment (Cube output) ndash Route nodes
bull Each type of reporting has its strengths ndash Trip list file allows building detailed transit trip patterns for
population cohorts and time periods
bull Mode split reports
bull Transit trip distance frequency distributions access distance TLFDs
bull Mode to mode transfers
ndash Note ABM reports only the first boarding TAP and the last alighting TAP regardless of mode
ndash Cube output gives aggregate link volumes station to station boardings etc
User Benefit Files
bull SERPM7 can produce FTA User Benefit files for input to SUMMIT
bull User benefits remain a useful analysis tool bull Steps to produce user benefit files require some manual
intervention ndash see User Guide
SERPM ABM Reports
bull Stores ABM inputs and outputs in a relational database to generate some standard model reports
bull Consistent reporting framework to be used for analysis across model runs
bull SERPM7 user community can easily share the scripts that create the reports
bull Reports take the form of Excel workbooks bull Foundation for future development of a visualization
dashboard
Reporting Database Components
Reporting Database Components
bull Reporting ETL (extract transform and load) program ndash Loads all Cube and CT-RAMP Java model outputs into the database
ndash Written in Cube scripts and Java
bull Database ndash Stores all data used in reporting including select network skims
household person tour and trip data zonal data etc
ndash Implemented with SQL Server
bull Report scripts to generate reports ndash Written in T-SQL
bull Report packaging program ndash Generates Excel workbooks with one report per worksheet
ndash Written in Java
Reporting Database Components
bull Run time required to build database and generate reports varies with sample size and type of report ndash Several hours required to build the database for a 100 sample
ndash ~ 30 minutes to produce reports for a 10 sample
bull Report step is optional not part of a standard model run bull Report production is transparent to the user
bull hellip but users can contribute reports bull hellip and choose which reports to build at any one time
Running SERPM ABM Reports
bull Report queries reside in ctrampreports_sql time_spent_travelingsql Total weekday travel time by person type
and income group
total_trips_typesql Trips by trip mode person type county of residence and tour purpose
total_tours_typesql Tours by trip mode person type county of residence and tour purpose
tours_districtssql Tours by tour purpose and tour origin and destination districts
transit_access_time+distsql Drive to transit trip list with many trip details
hellip
Running SERPM ABM Reports
bull List of reports to run is specified in properties file ndash ctrampserpm_reportsproperties
sqlscriptsdirectory = Cserpm7ctrampreports_sql sqlscriptsschemakey = SCHEMA sqlscripts=cleanupsqltransit_access_time+distsql worksheettables=temptransittrips worksheetnames=TransitTrips workbookname = Cserpm7ctrampreports_sqlSERPM_REPORTXLS databaseschema = 2010R databaseipaddress = w-ampdx-d-sag10 databaseinstance = databaseport = 1433 databasename=SERPMABM databaseusername=serpm databasepassword=s3rpm
Adding Reports
bull Step 1 --Write report query ndash T-SQL
ndash User Guide includes a database data dictionary
bull Step 2 ndash Add query to ctrampreports_sql ndash Each query is contained in a single text file
ndash Drop file in reports folder
bull Step 3 ndash Add the query to the properties file sqlquery = Query file name
Worksheettables = Query output
Worksheetnames = Name for the report worksheet
Sample SERPM ABM Reports
bull Exhibit ctrampreports_sqlserpm_reportsxls
More information Shi-Chiang Li | shi-chianglidotstateflus |954 777 4655 Rosella Picado | picadopbworldcom | 206 382 5227 Ken Kaltenbach |kkaltenbachcorradinocom |502 587 7221

Running SERPM7
RunCTRAMP Pilot Script
rmdir OUTDIRABMTEMP S Q rmdir DATADIRABMTEMP S Q xcopy OUTDIR OUTDIRABMTEMP E I Y xcopy DATADIR DATADIRABMTEMP E I Y if(fbi=1) need to run only the first time through - kdk CUBEctramprunCreateAccessFilescmd endif mkdir logFiles taskkill im javaexe F start CUBEctramprunHhMgrcmd JDK64 HOST_IP start CUBEctramprunMtxMgrcmd HOST_IP JDK64 rem start CUBEctrampconfigrunDrivercmd copy CUBEctrampserpm_abmproperties serpm_abmproperties Y ping -n 11 127001 gt nul CUBEctramprunSERPMAbmcmd SAMPLERATE VSAMPLERATE JDK64 CUBEctramprunCreateDemandMatricescmd SAMPLERATE VSAMPLERATE JDK64 taskkill im javaexe F rmdir OUTDIRctramp S Q rmdir DATADIRctramp S Q xcopy OUTDIRABMTEMPctramp OUTDIRctramp E I Y xcopy DATADIRABMTEMPctramp DATADIRctramp E I Y
Run CT-RAMP Pilot Script
Step 1 ndash Create access files
rmdir OUTDIRABMTEMP S Q rmdir DATADIRABMTEMP S Q xcopy OUTDIR OUTDIRABMTEMP E I Y xcopy DATADIR DATADIRABMTEMP E I Y if(fbi=1) need to run only the first time through - kdk CUBEctramprunCreateAccessFilescmd endif mkdir logFiles taskkill im javaexe F start CUBEctramprunHhMgrcmd JDK64 HOST_IP start CUBEctramprunMtxMgrcmd HOST_IP JDK64 rem start CUBEctrampconfigrunDrivercmd copy CUBEctrampserpm_abmproperties serpm_abmproperties Y ping -n 11 127001 gt nul CUBEctramprunSERPMAbmcmd SAMPLERATE VSAMPLERATE JDK64 CUBEctramprunCreateDemandMatricescmd SAMPLERATE VSAMPLERATE JDK64 taskkill im javaexe F rmdir OUTDIRctramp S Q rmdir DATADIRctramp S Q xcopy OUTDIRABMTEMPctramp OUTDIRctramp E I Y xcopy DATADIRABMTEMPctramp DATADIRctramp E I Y
Run CT-RAMP Pilot Script
bull Step 1 ndash runCreateAccessFilescmd ndash Creates the walk and transit access amp egress connectors
bull MAZ to MAZ connectors
bull MAZ to TAP walk connectors
bull TAZ to TAP drive connectors
ndash Fully implemented in Cube script
ndash Runs only during the initial feedback loop
rem Set location of Voyager for running Cube scripts set VOYAGER=CProgram Files (x86)CitilabsCubeVoyagerVoyagerexe rem create CT-RAMP maz impedances and maz densities VOYAGER Cserpm7ctrampapplicationsave_maz_dbfs Start VOYAGER Cserpm7ctrampapplicationabm_access_filess Start VOYAGER Cserpm7ctrampapplicationmaz_densitiess Start
Run CT-RAMP Pilot Script
Step 2 ndash Start Household amp Matrix Managers
rmdir OUTDIRABMTEMP S Q rmdir DATADIRABMTEMP S Q xcopy OUTDIR OUTDIRABMTEMP E I Y xcopy DATADIR DATADIRABMTEMP E I Y if(fbi=1) need to run only the first time through - kdk CUBEctramprunCreateAccessFilescmd endif mkdir logFiles taskkill im javaexe F start CUBEctramprunHhMgrcmd JDK64 HOST_IP start CUBEctramprunMtxMgrcmd HOST_IP JDK64 rem start CUBEctrampconfigrunDrivercmd copy CUBEctrampserpm_abmproperties serpm_abmproperties Y ping -n 11 127001 gt nul CUBEctramprunSERPMAbmcmd SAMPLERATE VSAMPLERATE JDK64 CUBEctramprunCreateDemandMatricescmd SAMPLERATE VSAMPLERATE JDK64 taskkill im javaexe F rmdir OUTDIRctramp S Q rmdir DATADIRctramp S Q xcopy OUTDIRABMTEMPctramp OUTDIRctramp E I Y xcopy DATADIRABMTEMPctramp DATADIRctramp E I Y
Run CT-RAMP Pilot Script
bull Step 2 ndash Start Household and Matrix Managers ndash Java applications used by the ABM software to readwrite Cube
matrices and for distributing household ldquojobsrdquo to computer threads
Run CT-RAMP Pilot Script
Step 3 ndash Run SERPM ABM and Visitor Model
rmdir OUTDIRABMTEMP S Q rmdir DATADIRABMTEMP S Q xcopy OUTDIR OUTDIRABMTEMP E I Y xcopy DATADIR DATADIRABMTEMP E I Y if(fbi=1) need to run only the first time through - kdk CUBEctramprunCreateAccessFilescmd endif mkdir logFiles taskkill im javaexe F start CUBEctramprunHhMgrcmd JDK64 HOST_IP start CUBEctramprunMtxMgrcmd HOST_IP JDK64 rem start CUBEctrampconfigrunDrivercmd copy CUBEctrampserpm_abmproperties serpm_abmproperties Y ping -n 11 127001 gt nul CUBEctramprunSERPMAbmcmd SAMPLERATE VSAMPLERATE JDK64 CUBEctramprunCreateDemandMatricescmd SAMPLERATE VSAMPLERATE JDK64 taskkill im javaexe F rmdir OUTDIRctramp S Q rmdir DATADIRctramp S Q xcopy OUTDIRABMTEMPctramp OUTDIRctramp E I Y xcopy DATADIRABMTEMPctramp DATADIRctramp E I Y
Run CT-RAMP Pilot Script
bull Step 3 ndash Run SERPM ABM and Visitor Models ndash Sets and runs SERPM ABM (runSERPMABMcmd)
bull Sets environment variables
bull Gets sampling rates project folders and other run-time variables
bull Sets the ABM properties file
bull Calls SERPM ABM and Visitor Model JARS (executables)
Run CT-RAMP Pilot Script
Step 4 ndash Create Trip Tables for Assignment
rmdir OUTDIRABMTEMP S Q rmdir DATADIRABMTEMP S Q xcopy OUTDIR OUTDIRABMTEMP E I Y xcopy DATADIR DATADIRABMTEMP E I Y if(fbi=1) need to run only the first time through - kdk CUBEctramprunCreateAccessFilescmd endif mkdir logFiles taskkill im javaexe F start CUBEctramprunHhMgrcmd JDK64 HOST_IP start CUBEctramprunMtxMgrcmd HOST_IP JDK64 rem start CUBEctrampconfigrunDrivercmd copy CUBEctrampserpm_abmproperties serpm_abmproperties Y ping -n 11 127001 gt nul CUBEctramprunSERPMAbmcmd SAMPLERATE VSAMPLERATE JDK64 CUBEctramprunCreateDemandMatricescmd SAMPLERATE VSAMPLERATE JDK64 taskkill im javaexe F rmdir OUTDIRctramp S Q rmdir DATADIRctramp S Q xcopy OUTDIRABMTEMPctramp OUTDIRctramp E I Y xcopy DATADIRABMTEMPctramp DATADIRctramp E I Y
Run CT-RAMP Pilot Script
bull Step 4 ndash createDemandMatricescmd ndash Creates Cube format trip tables for highway and transit assignment
ndash Translates the ABM amp Visitor Model list of trips into matrix format
ndash Three sets of demand matrices
bull Resident trips
bull Visitor trips
bull Resident + Visitor trips
ndash This step is implemented in Cube Script
The CT-RAMP Properties File
bull A settings file is used to control the ABM software ndash ctrampserpm_abmproperties
bull The majority of the properties (settings) in this file are set during model installation and do not need to be changed for a typical model run
bull Properties are described in the User Guide bull Example properties ndash Settings to control trace calculations
ndash System environment properties
ndash Input and output filenames
ndash Settings that specify how to read the utility expression calculators (UECs)
The CT-RAMP Properties File
bull Exhibit serpmabmproperties
Monitoring Run StatusProgress
bull Cube scripted components progress is tracked by Cubersquos Task Monitor
Monitoring Run Status
bull Java components status is reported to the log files ndash CubelogFileseventlog
ndash CubelogFiles
bull The log files are text files that can be opened with any text editor (Notepad Wordpad Ultraedit etc)
bull What is reported ndash Step being executed
ndash A few model output summaries
ndash Errors
ndash Trace calculations
bull While Java components are running status of Task Monitor does not change
Monitoring Run Status
bull Exhibit cubeeventlog
Running SERPM7 ndash New Scenario
bull Step 1 ndash Create input and output scenario folders ndash Suggested scenario naming convention
bull inputIN-YEARALT
bull outputOUT-YEARALT
bull Copy all input files from an existing scenario including all subfolders
bull Update new scenario-specific files ndash Highway transit networks
ndash Household person synthetic population
ndash Land use data
bull Proceed with Steps 2 thru 6 for running an existing scenario
FDOT Servers Run Times
Feedback Loop End Time Runtime (HHMM)
RMSE (AM amp PM)
1 945 1045 1226 amp 1363
2 1648 703 060 amp 058
3 119 831 023 amp 020
4 806 647 012 amp 009
5 1458 652 008 amp 006
Total ~40 hrs
Model Server 3 20 Sample
FDOT WorkStation Run Times
Machine Sample Size Run Time (HHMM)
Model WorkStation
1 048
5 240
10 503
20 949
Model Server 3 20 400
CT-RAMP Only
Model Installation
SERPM7 Installation
bull Installation package and User Guide available from Florida DOT via FSUTMS Online
bull Hardware and software requirements and installation instructions described in User Guide
bull Sample model output available from Florida DOT
SERPM7 Installation
bull Hardware Requirements ndash 64-bit Operating System
ndash Intel Xeon X5690 347 GHz 6 core processors or similar
ndash Minimum 96 GB RAM
ndash Minimum 1 TB space for storing model output
bull Software ndash Cube 61 wcluster license
ndash SQL SQL Express
ndash Java
ndash Microsoft Excel (optional)
SERPM7 Installation
bull Step 1 ndash Create the Project Folder ndash Set user permission level to lsquoEveryonersquo
bull Step 2 ndash Configure the machines ndash Set environment variables
ndash Install Java and set its environment variables
ndash Verifyinstall Cube 64-bit matrix IO DLL
ndash Other hellip
bull Step 3 ndash Configure the JPPF services bull Step 4 ndash Configure the ldquoRunrdquo component files bull Step 5 ndash Configure SERPM7 in Application Manager bull Step 6 ndash Create the seed skims
Application 1 Working with a Population Sample
Working with a Population Sample
bull A simulation of the entire population is not required for every single application ndash Small sample sizes are sufficiently accurate for forecasting aggregate
region or county-wide statistics
ndash Small sample sizes save run time during model calibration and when testing initial versions of new networks and other input data
Working with a Population Sample
bull Developing a region-wide forecast using travel outcomes for a sample of the population is analogous to estimating region-wide travel statistics using a survey sample
Survey Simulation
Gathers trip diary information for a sample of households
Simulates trips for a sample of households
Typical sampling rate 020 - 025
Typical sampling rate 5 - 50
Estimates travel patterns for entire population by multiplying each surveyed trip record by an
expansion factor
Estimates travel patterns for entire population by multiplying each simulated trip record by an
expansion factor
Typical expansion factors 100 - 1000
Typical expansion factors 2 - 20
Working with a Population Sample
bull The ABM assumes that each household makes travel decisions independently of the decisions made by all other households
bull Households are simulated independently of each other bull The ABM samples randomly from the list of households to
select the ones it simulates bull It is prudent to verify that the selected population sample is
unbiased ndash A very small (1 or less) simple random sample is likely to be biased
for example it will likely mis-represent households that are found infrequently in the population
ndash Samples of 10 or more are typically sufficiently unbiased for travel demand forecasting applications
Working with a Population Sample
bull How big a sample to use ndash The more localized the expected impact of a project the larger the
required sample
bull Some recommendations ndash For model calibration and validation 10-25 is typically sufficient
ndash For comparing aggregate county-wide and sub-county average travel statistics 10 - 25
ndash For estimating daily traffic volumes on high capacity facilities and high capacity transit 25 - 50
ndash For traffic impact studies 50 - 100
bull hellip but testing highly encouraged
Working with a Population Sample
bull A sample expansion factor is applied when creating the trip tables for assignment
bull Expansion factor = 1samplingRate bull Loads on highway and transit networks are representative
of the entire population bull Summaries produced from the ABM list output need to be
expanded to be representative of the entire population
Running SERPM7 with a Population Sample
bull Setting the run ndash Set the sampling rate for residents and visitors in Cube
ndash All other model settings can remain unchanged
bull The same sampling rate is used on all feedback loops
Catalog Key Description
SAMPLERATE Sampling rate for the resident population
VSAMPLERATE Sampling rate for the visitor population
Running SERPM7 with a Population Sample
bull When working with a ldquoless than 100rdquo model run each record in the output list files has to be expanded by 1samplingRate ndash householdData_v1csv
ndash personData_v1csv
ndash indivTourFile_v1csv
ndash jointTourFile_v1csv
ndash indivTripFile_v1csv
ndash jointTripFile_v1csv
bull Trip tables are already expanded ndash TAZ_Demand_tmat
ndash TAP_Demand_tmat
Running SERPM7 with a Population Sample
bull Sample Output ndash County-wide highway assignment statistics
Screenline 25
Sample 50
Sample Diff ()
BOEW Northern SL along Pompano Canal 842418 843591 -01
BOEW Middle SL along Oakland Park Blvd 1187251 1183529 03
BOEW Southern SL along River Canal 881601 879618 02
BONS Western SL between I75 and TPK 586412 587353 -02
BONS Middle SL along TPK 1441311 1437065 03
BONS Eastern SL along Intracostal Wway 328855 326298 08
BOEW SL BOPB County Line 648960 648771 00
BOEW SL BOMD County Line 979327 976276 03
BOWestern Ext CL Collier County Line 31059 31059 00
BONS I-95 CL from Miami-Dade to I-595 510207 509537 01
BONS Western CL along SR897 frm PB-SR816 494591 495547 -02
Running SERPM7 with a Population Sample
Running SERPM7 with a Population Sample
Running SERPM7 with a Population Sample
bull Sample Output ndash Individual Route Boardings
Running SERPM7 with a Population Sample
bull Sample Output ndash Individual Route Boardings
Running SERPM7 with a Population Sample
bull Sample Output ndash Regionwide Household Income Profile
Household Income 25 Sample 100 Sample
Less than $10000 1015 1021
$10000 to $15000 470 468
$15000 - $20000 566 564
$20000 to $25000 519 516
$25000 to $30000 493 494
$30000 to $35000 475 477
$35000 to $40000 387 387
$40000 to $45000 343 345
$45000 to $50000 348 348
$50000 to $75000 1754 1747
$75000 to $100000 1432 1433
$100000 or More 2198 2200
Application 2 Population Synthesis
Population Synthesis
bull Each SERPM7 scenario requires a synthetic population ndash List of households -- hhFilecsv
ndash List of persons that make up the households -- personFilecsv
bull Two synthetic populations have been developed to date ndash 2010 base year population
ndash 2040 long range transportation plan population
Population Synthesis
bull New synthetic populations will be required for ndash Other regional scenario years (eg 2020 2025 2045)
ndash To test population and land use scenarios such as
bull Traffic impact study for a new housing or commercial development
bull Impact of aging population
bull Impact of rising sea levels (because some neighborhoods will no
longer be inhabitable)
bull Refinements to the 2010 and 2040 populations
Population Synthesis
bull The population synthesizer (PopSynII) does not run normally as part of SERPM7 ndash SERPM7 expects input population files in the input folder
ndash User is responsible for running PopSynII to generate the required population files and place them in the scenario folders prior to a SERPM7 run
bull Why ndash Because a new synthetic population is not required for every run
PopSyn II Setup
bull PopSynII is already configured to run on the FDOT servers bull Java application using SQL data storage
PopSynII installed in the main ctramp folder
PopSynII Setup
bull The ctramppopsyn folder
Filename Description
runAllPopsynbat Batch file that controls the execution of PopSynII
controls SQL settings file that specifies the population attributes used as controls
1_importCSVsql 2_createTargetssql 3_createSynHHPerFilessql
SQL scripts that run the PopSynII software
2010_TAZ_Datacsv TAZ input control data
2010_MAZ_Datacsv MAZ input control data
Developing a New Synthetic Population
bull Step 1 ndash Prepare the input files ndash TAZ controls 2010_taz_datacsv
ndash MAZ controls 2010_maz_datacsv
Developing a New Synthetic Population
bull MAZ Control input file eg 2010_maz_datacsv ndash Estimates of total households and persons living in group quarters
bull Total households
bull Total group quarter population
ndash One record for each MAZ
Developing a New Synthetic Population
bull TAZ Controls input file -- eg 2010_taz_datacsv ndash Estimates of number of households or population for each SERPM7
controlled attribute
bull Household size
bull Household income
bull Household workers
bull Type of dwelling unit
bull Presence of children in the household
bull Population age group
bull Gender
bull Raceethnicity
bull Population in group quarters
ndash One record per TAZ
Analogous to the TAZ SE data file in the trip-
based model
Developing a New Synthetic Population
When preparing TAZ and MAZ control data it is critically important to
maintain internal data consistency
Developing a New Synthetic Population
bull Some data checks to perform and problems to look out for ndash The household and person marginals pertain to household residents
only except for the group quarter controls
ndash All household-based marginals add up to the same total households for each TAZ
ndash All person-based marginals add up to the same total persons for each TAZ
ndash The total number of persons implied by the household size marginal is consistent with the sum total of the person marginals
ndash The total number of children obtained from the age marginal is consistent with the marginal of households by presence of children
ndash Large deviations from 5050 split of persons by gender is suspect
ndash The household income distribution is consistency with the workers-in-household distribution
Developing a New Synthetic Population
bull More data checks ndash The MAZ and TAZ controls should add up
bull to the same number of households by TAZ
bull to the same number of persons in group quarters by TAZ
Developing a New Synthetic Population
bull Exhibit ndash SERPM7 2010 TAZ control file
Example ndash Minto West Palm Beach Co
Example ndash Minto West
bull Mixed-use development in a agricultural area adjacent to an existing housing development
bull Information available from proposedapproved plans ndash Single-family dwelling units ndash 5050
ndash Multi-family dwelling units ndash 1040
ndash Total population ndash 14 535 persons
ndash Spatial location of dwelling units by type
bull Other PopSyn required data not available from plans (income distribution age distribution etc) ndash Estimateassert it based on similar existing developments
surrounding neighborhood
Example ndash Minto West
bull Adding householdspersons to a TAZ
bull Adding TAZs or MAZs to SERPM7 should be a rare occurrence ndash Households are ultimately allocated to MAZs and therersquos already
12000 of them
ndash Households are represented individually so the zone attributes are derived from them
Trip-Based Model Modify the input zonal data file
Activity-Based Model Modify the population synthesis control file
Running PopSynII
bull Step 2 ndash Modify the PopSyn settings file for this run ndash Update TAZ and MAZ control filenames in runAll_popsynbat
REM BATCH FILE TO SETUP POPSYN RUN RUN POPSYNII AND OUTPUT CSV FILES REM SETUP REM PLEASE SET PATH NAMES FOR WORKING FOLDER AND CSV FILE LOCATIONS SET SERVERNAME=W-AMSTL-D-00052SQLEXPRESS SET DATABASENAME=popSyn SET ARCPATH=Cpopsyn SET CSVPATH_CONTROLS=Cpopsyninputscontrolscsv SET CSVPATH_MAZ=Cpopsyninputs2010_MAZ_Data_20120207csv SET CSVPATH_TAZ=Cpopsyninputs2010_TAZ_Data_20120207csv REM MAIN SCRIPT REM MAKE FILENAMES TABLE REM sqlcmd -S SERVER NAME -E -i INPUT FILE PATH (SCRIPT) -o OUTPUT LOG REM -E means to use Windows authentication for the user that is running the batch file SQLCMD -S SERVERNAME -d DATABASENAME -E -Q IF OBJECT_ID(dbocsv_filenames) IS NOT NULL DROP TABLE csv_filenames -o ARCPATHResultLogtxt
hellip hellip
Running PopSynII
bull Other PopSyn settings ndash rarely used in a production run ndash Change the control attributes
ndash Change the priority of control attributes
Running PopSynII
bull Step 3 ndash Run PopSynII -- runAll_popsynbat
Running PopSynII
bull Step 4 ndash Review Output amp Check Fit to Controls
Output File Description
hhFilecsv List of households
personFilecsv List of persons
ZoneResultscsv Comparisons of synthetized households to controlled and uncontrolled attributes
BalanceDetailscsv
ValidationStatscsv
ValidationStatsByPumacsv
Reviewing PopSyn Output
bull Zone_Resultscsv bull Comparison of synthesized totals to target totals for each
TAZ and controlled attribute
TOTAL_HOUSEHOLDS
ZONE TARGET SYNTHESIZED DIFFERENCE PCTDIFF
1 715 715 0 0
2 811 811 0 0
3 878 878 0 0
4 826 826 0 0
5 1181 1181 0 0
6 212 212 0 0
7 459 459 0 0
8 253 253 0 0
Reviewing PopSyn Output
bull Balance_Detailscsv bull Same output as Zone_Results different format
Zone Control ID ControlCat Target PUMSVal ConStat
1989 109 TOTAL_HOUSEHOLDS 1508 1508 yes
1989 249 INCOME_25K 273 271 no
1989 19 HHSIZE_4PLUS 467 467 yes
1989 160 FEMALE 2196 2108 no
1989 55 INCOME_100K 258 257 yes
1989 67 MULTI_UNIT 423 407 no
1989 31 WORKERS_3PLUS 164 166 no
Reviewing PopSyn Output
bull Validation_Statscsv ndash Comparison of synthesized attributes to input Census data (5 PUMS)
ndash Includes uncontrolled attributes
Description popSynSum censusSum meanDiff stdDev minDiff maxDiff Universe 1 number of households 2085375 1964881 17 61 -97 331
family 67 65 3 17 -26 48
non family 33 35 0 34 -58 111
size 1 27 28 0 36 -59 111
size 2 31 32 -3 14 -30 30
size 3 17 17 1 22 -37 53
size 4 25 23 18 50 -46 160
Reviewing PopSyn Output
bull Validation_StatsByPumacsv ndash Same as validation_stats but for each PUMA
bull Note that synthesized population may differ from 5 Census population by design
Application 3 ndash Highway Project
Highway Project
Example Projects ndashToll road extension ndashReversible lanes ndashManaged lanes
Overview
How to use SERPM7 to perform a model run and do some standard analysis ndash Option 1 -- Code the project directly on the geodatabase
bull Roadway links
bull Node links
bull Turn penalties
bull [assume no change to transit]
ndash Option 2 --Code the project on net files and then build the geodatabase
bull Use flowchart script to build the geodatabase
ndash Coding is very similar to earlier versions of SERPM
bull Facility types are the same
SERPM Facility Types (not new)
Editing the Highway Network
bull SERPM 7 requires a geodatabase bull Editing can be done either to a net file or directly on the
geodatabase bull The user can use utilities in the model flowchart to write a
net file from the geodatabase edit the net and then write it to the geodatabase
bull The geodatabase must exist to run the model
Editing in the Geodatabase
bull Simplest and most direct method bull Requires an understanding of the CubeArcGIS tools
Export geodatabase and edit as a net
bull Start Data Manager bull Open geodatabase (SERPM_NETSMDB) bull Double click on the network Input Hwy Net and specify an
output file (maybe ldquoeditnetrdquo) bull Open from Cube and edit as usual bull Use ldquoPrepare for Model Run and Trap Errorsrdquo (2) utilities to
write back to geodatabase ndash Reload geodatabase from Cube files ndash Cull and sort
ndash Write to geodatabase
Edit as a net
Export Edit in Cube
Change to point to edited network
Input Hwy Net
Toll Road Extension
bull Short Cut ndash copy an existing toll link bull No special NODE attributes bull Only new attribute is ISTOLL=1 for all links that could not be
used unless a toll were paid bull Toll Mainline FTC2=91 ISTOLL=1 DIRCODE=1 bull Plaza (gantry) ndash assume all will be electronic collection ndash TOLL=1 DIRCODE=1
ndash TOLLTYPE=3 CARTOLL=toll in dollars
ndash FTC2=95
ndash ISTOLL=1
ndash SVCSECONDS=001
ndash DELCODE=1 ACCELCODE=1 AVILANES=2
Toll Road Extension
Not much different from earlier versions of SERPM
Reversible Lanes
bull Control by the link attribute REVERSIBLE ndash REVERSIBLE=1 means AM operation only
ndash REVERSIBLE=2 means PM operation only
ndash I-595 example
Managed Lanes (typically Express)
bull HOT=1 ndash 98 (99 makes the link a dummy) bull FTC2 most likely=91 but other types permitted bull TOLL=0 ISTOLL=0 bull Tolls set by HOTTOLLdbf
HOT Lanes Tolls
bull Set as a function of the VC bull Updated in the travel time feedback loop bull Affects the TollFree split in mode choice bull Column HOT_x were x=HOT link attribute bull HOT_1 is the current 95 Express rate HOT_2 is a placeholder
Common Errors
bull Errors to watch out for ndash If network steps fail look for missing attributes
ndash Update transit routes as needed due to changes to underlying highway network
ndash Check for dangling links and unconnected zones
ndash Verify that all TAZs are connected to lsquofreersquo roads
bull Special procedures required for TAZs that have toll-only access must
include the attribute ISRCTOLLINK=1 (currently used for the
Rickenbacker Causeway)
ndash Some CT-RAMP errors caused by network coding errors may not be apparent until feedback loop 2 because in loop 1 CT-RAMP uses seed skims
bull Use small sample size when testing a new network
Was the Run Successful
bull Did the run converge ndash AM and PM travel time RMSE values reported to
OUTDIRfeedbacklogprn
ndash Run stops when RMSE is less than 01
ndash 2010 Scenario converges in 5 loops
bull What to do if it didnrsquot converge ndash Look for obvious errors
ndash Run more iterations (future year might require more)
bull Are the top-level results comparable to a similar run ndash Use HEVAL reports
ndash Examine screenlines (RMSE reports)
ndash Spot check link loads
Tools for Analysis
bull Analysis ndash perform standard highway project type analyses
bull Usual analysis similar to trip-based model ndash Total daily and period-specific roadway volumes and speeds by
vehicle class
ndash Vehicle trip OD matrices
bull Standard FSUTMS HEVAL and RMSE reports are still available ndash Day and period assignments
ndash By County
ndash Truck assignment
Tools for Analysis
bull Potential for customized assignment classes to address
specific project questions ndash Does the manage lane serve primarily high income users
bull Stratify vehicle classes by lowhigh income to understand facility
usage by income level
bull Stratify vehicle classes by disadvantaged population cohorts
bull Trip and person tabulations built from ABM output ndash Trip mode shares for many different population cohorts subareas
ndash For example toll vs non-toll shares by value of time or fine-graded income levels
ndash Many other possibilities
Application 4 ndash Mobility Project
Mobility Project ndash SUNPASS Market Share
bull Persons in households that own a SUNPASS transponder respond differently to managed lane and toll road policies ndash Pay lower tolls than cash users
ndash Have access to I-95 managed lanes
bull Policy questions ndash How does projected toll traffic and revenue vary with the SUNPASS
penetration rate and toll discount
ndash How will SUNPASS penetration rate vary as more managed lane facilities are built in the region
Mobility Project ndash SUNPASS Market Share
bull Question 1 -- How does projected toll traffic and revenue vary with the SUNPASS penetration rate and toll discount
bull Procedure ndash Step1 ndash Assume a SUNPASS market share by modifying the toll
transponder model
ndash Step 2 ndash Run SERPM7 to produce traffic volumes
ndash Step 3 ndash Estimate toll traffic revenue
Modifying the Toll Transponder Ownership Model
bull Model specification is contained in TransponderOwnershipxls and can be edited with Microsoft Excel
Utility Variable Coefficient
Expected time savings up to 644 min 00631
Distance less than 5 miles -00304
Distance between 5 and 10 miles -00648
Distance 10 miles or more -00648
Constant 04877
Modifying the Toll Transponder Ownership Model
Utility Variable Coefficient
Expected time savings up to 644 min 00631
Distance less than 5 miles -00304
Distance between 5 and 10 miles -00648
Distance 10 miles or more -00648
Constant 04877
Increasing the constant will increase the number of households equipped with transponders
TransponderOwnershipxls
Modifying the Toll Transponder Model
bull Increase the constant by how much ndash Process is akin to model calibration
ndash Several runs of the transponder model required to estimate the constant that yields the desired market share
ndash 2010 market share is approximately 65
ndash Use a small sample (5 or 10) to save run-time while establishing the right constant
Modifying the Toll Transponder Model
bull Variation ndash Add terms to the model so that certain types of households are more
likely to exhibit a SUNPASS market share increase
bull Highlow income households
bull Multi-car households
bull Miami-Dade households
Modifying the Toll Transponder Model
bull Exhibit TransponderOwnershipxls
Mobility Project ndash SUNPASS Market Share
bull Question 2 -- How will SUNPASS penetration rate vary as more managed lane facilities are built in the region
bull Procedure ndash Step 1 ndash Code the manage lane facilities
ndash Step 2 ndash Run SERPM7 to forecast transponder ownership
ndash Step 3 ndash Analyze the forecast household data for changes in the profile of households equipped with transponders
Application 5 ndash Land Use Project
Land Use Project
bull Transportation projects comprise not only network scenarios but also land use scenarios
bull Land use scenarios can be ndash Very large scale (substantial changes to housing and employment
estimates throughout the region) or
ndash Small scale (localized changes for example for a traffic impact study)
bull For both large scale and small scale land use updates the
general procedure for updating the input data and running the model is the same
Land Use Project
bull The land use data in SERPM7 consists of ndash Synthetic population and derived input files
ndash Employment data
ndash School enrollment data
ndash Parking costs and parking spaces
ndash Regional shopping mall special generators
ndash Beach special generators
ndash Hotel and motel room data
Land Use Project
bull The land use data reside in different input files
Data Item Input File
Synthetic Population hhFilecsv personFilecsv ctramppopsynTAZDatacsv ctramppopsynMAZDatacsv
Employment School Enrollment Parking Supply Data Special Generators Hotel and Motel Rooms
inputsIN-2010Rmaz_datacsv
Land Use Project
bull As demonstrated earlier SERPM 7 requires significantly more comprehensive socio-economic inputs as compared to previous versions ndash Greater spatial detail
ndash More categoriestypes of land uses
bull These inputs require additional preparation when
performing land use model runs
Land Use Project
Data Required and examples bull Population
bull Age distribution of the population expected to live in the
development
bull Income profile
bull Type of dwelling unit (single-family vs multi-family)
ndash The input data need to be internally consistent (distribution of households by presence of children needs to be consistent with population age distribution for example)
Land Use Project
Data Required bull Employment classification ndash Previous models had three
employment classifications
ndash In SERPM 7 there are 16 employment categories to better differentiate type of land use and improve the relationship between land use and activity purpose
Land Use Project
Data Required bull School enrollment ndash note that it differentiates by grade level
(K-8 high-school collegepost-secondary) ndash Donrsquot forget to include school faculty and staff in employment
Land Use Project
Data Required bull Parking supply and
parking costs ndash Parking spaces may
reflect use restrictions
bull Monthly
bull Daily
bull Hourly
ndash Parking costs consistent with type of use
Land Use Project
bull Park Area 1 (pink) ndash May park in MAZ other
than destination MAZ
ndash Parking cost applies
bull Park Area 2 (gree) ndash Parks at destination MAZ
ndash Parking cost applies
Land Use Project
Data Required bull Visitor Model ndash Number of hotel and motel rooms
bull Special Generators ndash Regional shopping malls
ndash Beach recreation areas
Land Use Project
The Gardens Mall Aventura Mall
Boynton Mall Dolphin Mall
Delray Community Mall Dadeland Mall
Towncenter Mall The Falls Shopping Center
Wellington Greens Mall Cutler Ridge Mall
Coral Square Mall Bal Harbour Shops
Pompano Citi Centre CocoWalk
Sawgrass Mills Mall The Mall at 163rd Street
Broward Mall Mall of the Americas
Galleria Mall Mary Brickell Village
Pembroke Lakes Mall Miami International Mall
Lakes Mall Miracle Marketplace
Oakwood Plaza Village of Merrick Park
The Promenade at Coconut Creek Westland Mall
Regional Shopping Mall Special Generators
Land Use Project
Deerfield Beach
Pompano Beach
Fort Lauderdale Beach
Fort Lauderdale Beach
Hollywood Beach
South Beach
Haulover Beach
Crandon Park
Dania Beach
Bill Baggs State Park
Beach Special Generators
Land Use Project
Sample Problem
bull MINTO West Example - a mixed residentialcommercial development ndash 6500 singlemulti-family residential units in multiple TAZs
ndash 14 million square feet of non-residential space
ndash 150 room hotel
ndash 3000 student college campus
Land Use Project
MINTO WEST
Land Use Project
TAZsMAZs representing MINTO West Development
Land Use Project
Need to translate population household and employment information from developer into model input data ndash As discussed in the Population Synthesis presentation population and
household attribute estimates can be taken from other known nearby neighborhoods
bull In this sample problem first start by allocating percentages of total
households into individual MAZs within the development area
bull Keep in mind household density when estimating the number of
households in each MAZ
Land Use Project
bull In this sample employment can be assumed to include bull Retail
bull RestaurantsBars
bull Offices
bull Health services
bull Hotelmotel employment and
bull Educational employment
ndash As with households yoursquoll need to apportion the employment areas to individual MAZs while keeping in mind the types of employment expected in those locations
Land Use Project
bull Employment data is usually estimated by converting floor space available to individual types of employment through conversion factors
bull ie ndash (3000 sqft office space)(20 sqft per office employee) =
150 office employees
Land Use Project
bull Once population household and employment figures are estimated they are entered into the appropriate model input file
bull Population ndash TAZ synthetic population control file
bull Household ndash TAZ synthetic population control file
bull Employment School Parking and Special Gen ndash maz_datacsv
bull Ensure that population household and employment figures
are the same in each file
bull Prior to performing model run PopSyn must be run and user must copy output files to SERPM7 input folders
Application 6 ndashTransit Project
Transit Project ndash MetroRail North Corridor
SERPM Transit Modes
Transit Mode Tour and Trip
Mode TAP Transit Skim Mode
Tri-Rail Commuter Rail Premium
Metrorail Urban Rail Premium
I-95 Inter-County Express I-95X I-95E
Express Bus Premium
Busway BRT Premium
MDT Express Express Bus Premium
Metromover Local Bus Local Bus
MDT Local BCT Local
Palm Tran Local Local Bus Local Bus
Breeze Local Bus Local Bus
Tri-Rail Shuttles Local Bus Local Bus
SERPM Transit Modes
Transit Mode Tour and Trip
Mode TAP Transit Skim
Mode
Mode coded on the route ldquocardsrdquo
Used to specify boarding and transfer penalties for transit
path building
(most disaggregate)
Line-haul choices in the tour and trip mode choice
models
Used to create sets of TAP to TAP levels of service
(most aggregate)
Similar to SERPM 67 SERPM 7 ABM
SERPM Transit Modes S67 Mode Local (L) S7
Mode Mode Name Operator amp Name UserA4 Name Prem (P) MODE
15 Tri-Rail 11 Tri-Rail 15 Commuter P 111
14 Metrorail 25 Metrorail 14 Urban Rail P 121
X Regional LRT Regional LRT 14 LRT P 131
16 Inter-County Express Bus 33 I-95 Inter-County Express 16 Express P 151
12 Exclusive ROW Cir-Reg 13 Exclusive ROW Cir-Reg 12 Mover L 181
11 TrolleysShuttles-Reg 12 Tri-Rail Shuttles 11 Local L 191
11 TrolleysShuttles-Reg 12 Tri-Rail Shuttles 33 Local L 192
X LRT- MDT 25 MDT LRT 14 LRT P 231
16 Buses (localexpress) - MDT 27 MDT Busway Flyers 27 BRT P 241
23 Buses (localexpress) - MDT 27 MDT MAXKATBusway Local 27 BRT P 242
24 BRT - MDT 28 MDT BRTLRT 28 BRT P 243
23 Buses (localexpress) - MDT 22 MDT Express 24 Express P 251
16 Buses (localexpress) - MDT 24 MDT I-95 Exp 26 Express P 252
16 Inter-County Express Bus 24 I-95 Inter-County Express 16 Express P 253
22 Exclusive ROW Cir-MDT 26 Metromover 22 Mover L 281
21 TrolleysShuttles-MDT 21 MDT TrolleysShuttles 21 Local L 291
23 Buses (localexpress) - MDT 21 MDT Local 23 Local L 292
23 Buses (localexpress) - MDT 23 MDT Shuttle 25 Local L 293
X LRT - BCT 35 BCT LRT 37 LRT P 331
34 BCT Rapid Bus BRT 34 BCT Rapid Bus 36 BRT P 341
34 BCT Fixed-guideway BRT 35 BCT BRT 37 BRT P 342
33 Buses (localexpress) - BCT 32 BCT Breeze 34 Express P 351
33 Buses (localexpress) - BCT 33 BCT Express 35 Express P 352
32 Exclusive ROW Cir-BCT 31 BCT Exclusive ROW Cir 32 Mover L 381
31 TrolleysShuttles-BCT 31 BCT TrolleysShuttles 31 Local L 393
33 Buses (localexpress) - BCT 31 BCT Local 27 Local L 391
33 Buses (localexpress) - BCT 31 BCT Local 33 Local L 392
X LRT - Palm Tran 43 Palm Tran LRT 44 LRT P 431
44 BRT - Palm Tran 43 Palm Tran BRT 44 BRT P 441
43 Buses (localexpress) - Ptran 42 Palm Tran Exp 44 Express P 451
42 Exclusive ROW Cir-PTran 41 Palm Tran Exclusive ROW Cir 42 Mover L 481
41 TrolleysShuttles-Ptran 41 Palm Tran TrolleysShuttles 41 Local L 491
43 Buses (localexpress) - Ptran 41 Palm Tran Local 43 Local L 492
Modes Not in the 2010 Network
SERPM7 Transit Network Building
bull Typically bus routes are coded on top of existing highway links
bull SERPM7 reserves some facility type codes for transit-only use helpful to more accurately represent route ndash Caution -- make sure network integrity is preserved once transit only
links are removed
bull Rail routes require coding first fixed-guideway links
SERPM7 Transit Network Building
bull Route Attributes -- User Coded ndash Name
ndash Long Name
ndash Mode
ndash Operator
ndash Headway[1] ndash AM Peak
ndash Headway[2] ndash Midday
ndash Headway[3] ndash PM Peak
ndash UserA4 (stop dwell time)
SERPM7 Transit Network Building
bull PNR Node Attributes ndash User Coded ndash Parking Spaces
ndash Parking Cost AM
ndash Parking Cost MD
ndash Terminal Time PNR
ndash Terminal Time KNR
bull At this time parking spaces is used only to identify park-n-ride locations (parking spaces gt 0)
SERPM7 Transit Network Building
bull Transit Access Points -- Created by Cube for the ABM ndash One TAP for each stop on premium routes
bull Tri-Rail Metrorail Express Bus BRT
ndash One TAP for each Local Bus park-n-ride node
ndash Synthesized TAPs to represent access to local bus stops
bull Transit Access Point Attributes ndash TAP Mode
ndash Inherit PNR node data
Sample Highway Network with TAPs
TAPs become part of the highway network and replace the TAZ centroids when building transit skims
Transit Access Points and ldquoon the flyrdquo Path Building
bull Transit skims are built TAP to TAP
Matrix origins and destinations are TAPS
Transit Access Points and ldquoon the flyrdquo Path Building
Trip Origins and
Destinations
MAZ to MAZ
Auto Skims
TAZ to TAZ
Transit Skims
TAP to TAP
The three spatial systems are put together by the mode choice model
ldquoOn the Flyrdquo Path Building
bull TAZs TAPs and MAZs are linked via drive and access connectors prior to running CT-RAMP
rmdir OUTDIRABMTEMP S Q rmdir DATADIRABMTEMP S Q xcopy OUTDIR OUTDIRABMTEMP E I Y xcopy DATADIR DATADIRABMTEMP E I Y if(fbi=1) need to run only the first time through - kdk CUBEctramprunCreateAccessFilescmd endif mkdir logFiles taskkill im javaexe F start CUBEctramprunHhMgrcmd JDK64 HOST_IP start CUBEctramprunMtxMgrcmd HOST_IP JDK64 rem start CUBEctrampconfigrunDrivercmd copy CUBEctrampserpm_abmproperties serpm_abmproperties Y ping -n 11 127001 gt nul CUBEctramprunSERPMAbmcmd SAMPLERATE VSAMPLERATE JDK64 CUBEctramprunCreateDemandMatricescmd SAMPLERATE VSAMPLERATE JDK64 taskkill im javaexe F rmdir OUTDIRctramp S Q rmdir DATADIRctramp S Q xcopy OUTDIRABMTEMPctramp OUTDIRctramp E I Y xcopy DATADIRABMTEMPctramp DATADIRctramp E I Y
ldquoOn the Flyrdquo Path Building
MAZ to MAZ Connectors
Created by finding shortest distance paths over an all-streets network Connects all MAZs within 15 mi
Used to represent walk mode distance and time
MAZ to TAP Connectors
Created by finding shortest distance paths over an all-streets network Connects each MAZ to all TAPs within 10 mi
Used to represent transit walk access and walk egress distance and time
TAZ to TAP Connectors
Connects each TAZ to all TAPs within the TAP maximum drive distance bull Bus TAPs ndash 4 miles bull Rail TAPs ndash 15 miles
Used to represent transit drive access and egress distance and time
ldquoOn the Flyrdquo Path Building
bull No actual links created on the network bull Connectivity is expressed in table format
ldquoOn the Flyrdquo Path Building
bull Once the access and walk connectors are created the mode choice model builds complete paths MAZ to MAZ transit paths
bull Local-only paths are built using the ldquolocalrdquo transit skim bull Express BRT Urban Rail and Commuter rail paths are all
built at the same time using the ldquopremiumrdquo transit skim bull For each MAZ to MAZ pair CT-RAMP keeps the shortest
generalized cost path for each available premium mode bull Even though only one ldquopremiumrdquo skim is built CT-RAMP
may find competing premium paths It may also find that the best path is a combination of two premium modes or a premium mode and local bus
Tour Mode Choice Model
Choice
Auto
Drive alone
GP(1)
Pay(2)
Shared ride 2
GP(3)
HOV(4)
Pay(5)
Shared ride 3+
GP(6)
HOV(7)
Pay(8)
Non-motorized
Walk(9)
Bike(10)
Transit
Walk access
Local bus(11)
Express bus(12)
BRT(13)
Urban rail(14)
Commuter rail(15)
PNR access
Local bus(16)
Express bus(17)
BRT(18)
Urban rail(19)
Commuter rail(20)
KNR access
Local bus(21)
Express bus(22)
BRT(23)
Urban rail(24)
Commuter rail(25)
School Bus(26)
Trip Mode Choice Model
bull Same nesting structure as the tour mode choice but conditional on the tour mode
bull Some trip modes may be unavailable depending on the tour mode
DA SR2 SR3+ Walk Wlk-Trn PNR-Trn KNR-Trn
DA Must - - - - - -
SR2 Can Can - Can - - -
SR3+ Can Can Can Can - - -
Walk - - - Must - - -
Wlk-Trn - Can Can Can Can - -
PNR-Trn Can Can Can Can Can Can
KNR-Trn - Can Can Can Can - Can
Trip Switching Rules Simplified
Transit Trip Reporting
bull In SERPM7 the transit boarding and alighting location can be reported in two ways ndash Trip list files (ABM output) -- Boarding TAP Alighting TAP
ndash Transit assignment (Cube output) ndash Route nodes
bull Each type of reporting has its strengths ndash Trip list file allows building detailed transit trip patterns for
population cohorts and time periods
bull Mode split reports
bull Transit trip distance frequency distributions access distance TLFDs
bull Mode to mode transfers
ndash Note ABM reports only the first boarding TAP and the last alighting TAP regardless of mode
ndash Cube output gives aggregate link volumes station to station boardings etc
User Benefit Files
bull SERPM7 can produce FTA User Benefit files for input to SUMMIT
bull User benefits remain a useful analysis tool bull Steps to produce user benefit files require some manual
intervention ndash see User Guide
SERPM ABM Reports
bull Stores ABM inputs and outputs in a relational database to generate some standard model reports
bull Consistent reporting framework to be used for analysis across model runs
bull SERPM7 user community can easily share the scripts that create the reports
bull Reports take the form of Excel workbooks bull Foundation for future development of a visualization
dashboard
Reporting Database Components
Reporting Database Components
bull Reporting ETL (extract transform and load) program ndash Loads all Cube and CT-RAMP Java model outputs into the database
ndash Written in Cube scripts and Java
bull Database ndash Stores all data used in reporting including select network skims
household person tour and trip data zonal data etc
ndash Implemented with SQL Server
bull Report scripts to generate reports ndash Written in T-SQL
bull Report packaging program ndash Generates Excel workbooks with one report per worksheet
ndash Written in Java
Reporting Database Components
bull Run time required to build database and generate reports varies with sample size and type of report ndash Several hours required to build the database for a 100 sample
ndash ~ 30 minutes to produce reports for a 10 sample
bull Report step is optional not part of a standard model run bull Report production is transparent to the user
bull hellip but users can contribute reports bull hellip and choose which reports to build at any one time
Running SERPM ABM Reports
bull Report queries reside in ctrampreports_sql time_spent_travelingsql Total weekday travel time by person type
and income group
total_trips_typesql Trips by trip mode person type county of residence and tour purpose
total_tours_typesql Tours by trip mode person type county of residence and tour purpose
tours_districtssql Tours by tour purpose and tour origin and destination districts
transit_access_time+distsql Drive to transit trip list with many trip details
hellip
Running SERPM ABM Reports
bull List of reports to run is specified in properties file ndash ctrampserpm_reportsproperties
sqlscriptsdirectory = Cserpm7ctrampreports_sql sqlscriptsschemakey = SCHEMA sqlscripts=cleanupsqltransit_access_time+distsql worksheettables=temptransittrips worksheetnames=TransitTrips workbookname = Cserpm7ctrampreports_sqlSERPM_REPORTXLS databaseschema = 2010R databaseipaddress = w-ampdx-d-sag10 databaseinstance = databaseport = 1433 databasename=SERPMABM databaseusername=serpm databasepassword=s3rpm
Adding Reports
bull Step 1 --Write report query ndash T-SQL
ndash User Guide includes a database data dictionary
bull Step 2 ndash Add query to ctrampreports_sql ndash Each query is contained in a single text file
ndash Drop file in reports folder
bull Step 3 ndash Add the query to the properties file sqlquery = Query file name
Worksheettables = Query output
Worksheetnames = Name for the report worksheet
Sample SERPM ABM Reports
bull Exhibit ctrampreports_sqlserpm_reportsxls
More information Shi-Chiang Li | shi-chianglidotstateflus |954 777 4655 Rosella Picado | picadopbworldcom | 206 382 5227 Ken Kaltenbach |kkaltenbachcorradinocom |502 587 7221

Run CT-RAMP Pilot Script
bull Step 4 ndash createDemandMatricescmd ndash Creates Cube format trip tables for highway and transit assignment
ndash Translates the ABM amp Visitor Model list of trips into matrix format
ndash Three sets of demand matrices
bull Resident trips
bull Visitor trips
bull Resident + Visitor trips
ndash This step is implemented in Cube Script
The CT-RAMP Properties File
bull A settings file is used to control the ABM software ndash ctrampserpm_abmproperties
bull The majority of the properties (settings) in this file are set during model installation and do not need to be changed for a typical model run
bull Properties are described in the User Guide bull Example properties ndash Settings to control trace calculations
ndash System environment properties
ndash Input and output filenames
ndash Settings that specify how to read the utility expression calculators (UECs)
The CT-RAMP Properties File
bull Exhibit serpmabmproperties
Monitoring Run StatusProgress
bull Cube scripted components progress is tracked by Cubersquos Task Monitor
Monitoring Run Status
bull Java components status is reported to the log files ndash CubelogFileseventlog
ndash CubelogFiles
bull The log files are text files that can be opened with any text editor (Notepad Wordpad Ultraedit etc)
bull What is reported ndash Step being executed
ndash A few model output summaries
ndash Errors
ndash Trace calculations
bull While Java components are running status of Task Monitor does not change
Monitoring Run Status
bull Exhibit cubeeventlog
Running SERPM7 ndash New Scenario
bull Step 1 ndash Create input and output scenario folders ndash Suggested scenario naming convention
bull inputIN-YEARALT
bull outputOUT-YEARALT
bull Copy all input files from an existing scenario including all subfolders
bull Update new scenario-specific files ndash Highway transit networks
ndash Household person synthetic population
ndash Land use data
bull Proceed with Steps 2 thru 6 for running an existing scenario
FDOT Servers Run Times
Feedback Loop End Time Runtime (HHMM)
RMSE (AM amp PM)
1 945 1045 1226 amp 1363
2 1648 703 060 amp 058
3 119 831 023 amp 020
4 806 647 012 amp 009
5 1458 652 008 amp 006
Total ~40 hrs
Model Server 3 20 Sample
FDOT WorkStation Run Times
Machine Sample Size Run Time (HHMM)
Model WorkStation
1 048
5 240
10 503
20 949
Model Server 3 20 400
CT-RAMP Only
Model Installation
SERPM7 Installation
bull Installation package and User Guide available from Florida DOT via FSUTMS Online
bull Hardware and software requirements and installation instructions described in User Guide
bull Sample model output available from Florida DOT
SERPM7 Installation
bull Hardware Requirements ndash 64-bit Operating System
ndash Intel Xeon X5690 347 GHz 6 core processors or similar
ndash Minimum 96 GB RAM
ndash Minimum 1 TB space for storing model output
bull Software ndash Cube 61 wcluster license
ndash SQL SQL Express
ndash Java
ndash Microsoft Excel (optional)
SERPM7 Installation
bull Step 1 ndash Create the Project Folder ndash Set user permission level to lsquoEveryonersquo
bull Step 2 ndash Configure the machines ndash Set environment variables
ndash Install Java and set its environment variables
ndash Verifyinstall Cube 64-bit matrix IO DLL
ndash Other hellip
bull Step 3 ndash Configure the JPPF services bull Step 4 ndash Configure the ldquoRunrdquo component files bull Step 5 ndash Configure SERPM7 in Application Manager bull Step 6 ndash Create the seed skims
Application 1 Working with a Population Sample
Working with a Population Sample
bull A simulation of the entire population is not required for every single application ndash Small sample sizes are sufficiently accurate for forecasting aggregate
region or county-wide statistics
ndash Small sample sizes save run time during model calibration and when testing initial versions of new networks and other input data
Working with a Population Sample
bull Developing a region-wide forecast using travel outcomes for a sample of the population is analogous to estimating region-wide travel statistics using a survey sample
Survey Simulation
Gathers trip diary information for a sample of households
Simulates trips for a sample of households
Typical sampling rate 020 - 025
Typical sampling rate 5 - 50
Estimates travel patterns for entire population by multiplying each surveyed trip record by an
expansion factor
Estimates travel patterns for entire population by multiplying each simulated trip record by an
expansion factor
Typical expansion factors 100 - 1000
Typical expansion factors 2 - 20
Working with a Population Sample
bull The ABM assumes that each household makes travel decisions independently of the decisions made by all other households
bull Households are simulated independently of each other bull The ABM samples randomly from the list of households to
select the ones it simulates bull It is prudent to verify that the selected population sample is
unbiased ndash A very small (1 or less) simple random sample is likely to be biased
for example it will likely mis-represent households that are found infrequently in the population
ndash Samples of 10 or more are typically sufficiently unbiased for travel demand forecasting applications
Working with a Population Sample
bull How big a sample to use ndash The more localized the expected impact of a project the larger the
required sample
bull Some recommendations ndash For model calibration and validation 10-25 is typically sufficient
ndash For comparing aggregate county-wide and sub-county average travel statistics 10 - 25
ndash For estimating daily traffic volumes on high capacity facilities and high capacity transit 25 - 50
ndash For traffic impact studies 50 - 100
bull hellip but testing highly encouraged
Working with a Population Sample
bull A sample expansion factor is applied when creating the trip tables for assignment
bull Expansion factor = 1samplingRate bull Loads on highway and transit networks are representative
of the entire population bull Summaries produced from the ABM list output need to be
expanded to be representative of the entire population
Running SERPM7 with a Population Sample
bull Setting the run ndash Set the sampling rate for residents and visitors in Cube
ndash All other model settings can remain unchanged
bull The same sampling rate is used on all feedback loops
Catalog Key Description
SAMPLERATE Sampling rate for the resident population
VSAMPLERATE Sampling rate for the visitor population
Running SERPM7 with a Population Sample
bull When working with a ldquoless than 100rdquo model run each record in the output list files has to be expanded by 1samplingRate ndash householdData_v1csv
ndash personData_v1csv
ndash indivTourFile_v1csv
ndash jointTourFile_v1csv
ndash indivTripFile_v1csv
ndash jointTripFile_v1csv
bull Trip tables are already expanded ndash TAZ_Demand_tmat
ndash TAP_Demand_tmat
Running SERPM7 with a Population Sample
bull Sample Output ndash County-wide highway assignment statistics
Screenline 25
Sample 50
Sample Diff ()
BOEW Northern SL along Pompano Canal 842418 843591 -01
BOEW Middle SL along Oakland Park Blvd 1187251 1183529 03
BOEW Southern SL along River Canal 881601 879618 02
BONS Western SL between I75 and TPK 586412 587353 -02
BONS Middle SL along TPK 1441311 1437065 03
BONS Eastern SL along Intracostal Wway 328855 326298 08
BOEW SL BOPB County Line 648960 648771 00
BOEW SL BOMD County Line 979327 976276 03
BOWestern Ext CL Collier County Line 31059 31059 00
BONS I-95 CL from Miami-Dade to I-595 510207 509537 01
BONS Western CL along SR897 frm PB-SR816 494591 495547 -02
Running SERPM7 with a Population Sample
Running SERPM7 with a Population Sample
Running SERPM7 with a Population Sample
bull Sample Output ndash Individual Route Boardings
Running SERPM7 with a Population Sample
bull Sample Output ndash Individual Route Boardings
Running SERPM7 with a Population Sample
bull Sample Output ndash Regionwide Household Income Profile
Household Income 25 Sample 100 Sample
Less than $10000 1015 1021
$10000 to $15000 470 468
$15000 - $20000 566 564
$20000 to $25000 519 516
$25000 to $30000 493 494
$30000 to $35000 475 477
$35000 to $40000 387 387
$40000 to $45000 343 345
$45000 to $50000 348 348
$50000 to $75000 1754 1747
$75000 to $100000 1432 1433
$100000 or More 2198 2200
Application 2 Population Synthesis
Population Synthesis
bull Each SERPM7 scenario requires a synthetic population ndash List of households -- hhFilecsv
ndash List of persons that make up the households -- personFilecsv
bull Two synthetic populations have been developed to date ndash 2010 base year population
ndash 2040 long range transportation plan population
Population Synthesis
bull New synthetic populations will be required for ndash Other regional scenario years (eg 2020 2025 2045)
ndash To test population and land use scenarios such as
bull Traffic impact study for a new housing or commercial development
bull Impact of aging population
bull Impact of rising sea levels (because some neighborhoods will no
longer be inhabitable)
bull Refinements to the 2010 and 2040 populations
Population Synthesis
bull The population synthesizer (PopSynII) does not run normally as part of SERPM7 ndash SERPM7 expects input population files in the input folder
ndash User is responsible for running PopSynII to generate the required population files and place them in the scenario folders prior to a SERPM7 run
bull Why ndash Because a new synthetic population is not required for every run
PopSyn II Setup
bull PopSynII is already configured to run on the FDOT servers bull Java application using SQL data storage
PopSynII installed in the main ctramp folder
PopSynII Setup
bull The ctramppopsyn folder
Filename Description
runAllPopsynbat Batch file that controls the execution of PopSynII
controls SQL settings file that specifies the population attributes used as controls
1_importCSVsql 2_createTargetssql 3_createSynHHPerFilessql
SQL scripts that run the PopSynII software
2010_TAZ_Datacsv TAZ input control data
2010_MAZ_Datacsv MAZ input control data
Developing a New Synthetic Population
bull Step 1 ndash Prepare the input files ndash TAZ controls 2010_taz_datacsv
ndash MAZ controls 2010_maz_datacsv
Developing a New Synthetic Population
bull MAZ Control input file eg 2010_maz_datacsv ndash Estimates of total households and persons living in group quarters
bull Total households
bull Total group quarter population
ndash One record for each MAZ
Developing a New Synthetic Population
bull TAZ Controls input file -- eg 2010_taz_datacsv ndash Estimates of number of households or population for each SERPM7
controlled attribute
bull Household size
bull Household income
bull Household workers
bull Type of dwelling unit
bull Presence of children in the household
bull Population age group
bull Gender
bull Raceethnicity
bull Population in group quarters
ndash One record per TAZ
Analogous to the TAZ SE data file in the trip-
based model
Developing a New Synthetic Population
When preparing TAZ and MAZ control data it is critically important to
maintain internal data consistency
Developing a New Synthetic Population
bull Some data checks to perform and problems to look out for ndash The household and person marginals pertain to household residents
only except for the group quarter controls
ndash All household-based marginals add up to the same total households for each TAZ
ndash All person-based marginals add up to the same total persons for each TAZ
ndash The total number of persons implied by the household size marginal is consistent with the sum total of the person marginals
ndash The total number of children obtained from the age marginal is consistent with the marginal of households by presence of children
ndash Large deviations from 5050 split of persons by gender is suspect
ndash The household income distribution is consistency with the workers-in-household distribution
Developing a New Synthetic Population
bull More data checks ndash The MAZ and TAZ controls should add up
bull to the same number of households by TAZ
bull to the same number of persons in group quarters by TAZ
Developing a New Synthetic Population
bull Exhibit ndash SERPM7 2010 TAZ control file
Example ndash Minto West Palm Beach Co
Example ndash Minto West
bull Mixed-use development in a agricultural area adjacent to an existing housing development
bull Information available from proposedapproved plans ndash Single-family dwelling units ndash 5050
ndash Multi-family dwelling units ndash 1040
ndash Total population ndash 14 535 persons
ndash Spatial location of dwelling units by type
bull Other PopSyn required data not available from plans (income distribution age distribution etc) ndash Estimateassert it based on similar existing developments
surrounding neighborhood
Example ndash Minto West
bull Adding householdspersons to a TAZ
bull Adding TAZs or MAZs to SERPM7 should be a rare occurrence ndash Households are ultimately allocated to MAZs and therersquos already
12000 of them
ndash Households are represented individually so the zone attributes are derived from them
Trip-Based Model Modify the input zonal data file
Activity-Based Model Modify the population synthesis control file
Running PopSynII
bull Step 2 ndash Modify the PopSyn settings file for this run ndash Update TAZ and MAZ control filenames in runAll_popsynbat
REM BATCH FILE TO SETUP POPSYN RUN RUN POPSYNII AND OUTPUT CSV FILES REM SETUP REM PLEASE SET PATH NAMES FOR WORKING FOLDER AND CSV FILE LOCATIONS SET SERVERNAME=W-AMSTL-D-00052SQLEXPRESS SET DATABASENAME=popSyn SET ARCPATH=Cpopsyn SET CSVPATH_CONTROLS=Cpopsyninputscontrolscsv SET CSVPATH_MAZ=Cpopsyninputs2010_MAZ_Data_20120207csv SET CSVPATH_TAZ=Cpopsyninputs2010_TAZ_Data_20120207csv REM MAIN SCRIPT REM MAKE FILENAMES TABLE REM sqlcmd -S SERVER NAME -E -i INPUT FILE PATH (SCRIPT) -o OUTPUT LOG REM -E means to use Windows authentication for the user that is running the batch file SQLCMD -S SERVERNAME -d DATABASENAME -E -Q IF OBJECT_ID(dbocsv_filenames) IS NOT NULL DROP TABLE csv_filenames -o ARCPATHResultLogtxt
hellip hellip
Running PopSynII
bull Other PopSyn settings ndash rarely used in a production run ndash Change the control attributes
ndash Change the priority of control attributes
Running PopSynII
bull Step 3 ndash Run PopSynII -- runAll_popsynbat
Running PopSynII
bull Step 4 ndash Review Output amp Check Fit to Controls
Output File Description
hhFilecsv List of households
personFilecsv List of persons
ZoneResultscsv Comparisons of synthetized households to controlled and uncontrolled attributes
BalanceDetailscsv
ValidationStatscsv
ValidationStatsByPumacsv
Reviewing PopSyn Output
bull Zone_Resultscsv bull Comparison of synthesized totals to target totals for each
TAZ and controlled attribute
TOTAL_HOUSEHOLDS
ZONE TARGET SYNTHESIZED DIFFERENCE PCTDIFF
1 715 715 0 0
2 811 811 0 0
3 878 878 0 0
4 826 826 0 0
5 1181 1181 0 0
6 212 212 0 0
7 459 459 0 0
8 253 253 0 0
Reviewing PopSyn Output
bull Balance_Detailscsv bull Same output as Zone_Results different format
Zone Control ID ControlCat Target PUMSVal ConStat
1989 109 TOTAL_HOUSEHOLDS 1508 1508 yes
1989 249 INCOME_25K 273 271 no
1989 19 HHSIZE_4PLUS 467 467 yes
1989 160 FEMALE 2196 2108 no
1989 55 INCOME_100K 258 257 yes
1989 67 MULTI_UNIT 423 407 no
1989 31 WORKERS_3PLUS 164 166 no
Reviewing PopSyn Output
bull Validation_Statscsv ndash Comparison of synthesized attributes to input Census data (5 PUMS)
ndash Includes uncontrolled attributes
Description popSynSum censusSum meanDiff stdDev minDiff maxDiff Universe 1 number of households 2085375 1964881 17 61 -97 331
family 67 65 3 17 -26 48
non family 33 35 0 34 -58 111
size 1 27 28 0 36 -59 111
size 2 31 32 -3 14 -30 30
size 3 17 17 1 22 -37 53
size 4 25 23 18 50 -46 160
Reviewing PopSyn Output
bull Validation_StatsByPumacsv ndash Same as validation_stats but for each PUMA
bull Note that synthesized population may differ from 5 Census population by design
Application 3 ndash Highway Project
Highway Project
Example Projects ndashToll road extension ndashReversible lanes ndashManaged lanes
Overview
How to use SERPM7 to perform a model run and do some standard analysis ndash Option 1 -- Code the project directly on the geodatabase
bull Roadway links
bull Node links
bull Turn penalties
bull [assume no change to transit]
ndash Option 2 --Code the project on net files and then build the geodatabase
bull Use flowchart script to build the geodatabase
ndash Coding is very similar to earlier versions of SERPM
bull Facility types are the same
SERPM Facility Types (not new)
Editing the Highway Network
bull SERPM 7 requires a geodatabase bull Editing can be done either to a net file or directly on the
geodatabase bull The user can use utilities in the model flowchart to write a
net file from the geodatabase edit the net and then write it to the geodatabase
bull The geodatabase must exist to run the model
Editing in the Geodatabase
bull Simplest and most direct method bull Requires an understanding of the CubeArcGIS tools
Export geodatabase and edit as a net
bull Start Data Manager bull Open geodatabase (SERPM_NETSMDB) bull Double click on the network Input Hwy Net and specify an
output file (maybe ldquoeditnetrdquo) bull Open from Cube and edit as usual bull Use ldquoPrepare for Model Run and Trap Errorsrdquo (2) utilities to
write back to geodatabase ndash Reload geodatabase from Cube files ndash Cull and sort
ndash Write to geodatabase
Edit as a net
Export Edit in Cube
Change to point to edited network
Input Hwy Net
Toll Road Extension
bull Short Cut ndash copy an existing toll link bull No special NODE attributes bull Only new attribute is ISTOLL=1 for all links that could not be
used unless a toll were paid bull Toll Mainline FTC2=91 ISTOLL=1 DIRCODE=1 bull Plaza (gantry) ndash assume all will be electronic collection ndash TOLL=1 DIRCODE=1
ndash TOLLTYPE=3 CARTOLL=toll in dollars
ndash FTC2=95
ndash ISTOLL=1
ndash SVCSECONDS=001
ndash DELCODE=1 ACCELCODE=1 AVILANES=2
Toll Road Extension
Not much different from earlier versions of SERPM
Reversible Lanes
bull Control by the link attribute REVERSIBLE ndash REVERSIBLE=1 means AM operation only
ndash REVERSIBLE=2 means PM operation only
ndash I-595 example
Managed Lanes (typically Express)
bull HOT=1 ndash 98 (99 makes the link a dummy) bull FTC2 most likely=91 but other types permitted bull TOLL=0 ISTOLL=0 bull Tolls set by HOTTOLLdbf
HOT Lanes Tolls
bull Set as a function of the VC bull Updated in the travel time feedback loop bull Affects the TollFree split in mode choice bull Column HOT_x were x=HOT link attribute bull HOT_1 is the current 95 Express rate HOT_2 is a placeholder
Common Errors
bull Errors to watch out for ndash If network steps fail look for missing attributes
ndash Update transit routes as needed due to changes to underlying highway network
ndash Check for dangling links and unconnected zones
ndash Verify that all TAZs are connected to lsquofreersquo roads
bull Special procedures required for TAZs that have toll-only access must
include the attribute ISRCTOLLINK=1 (currently used for the
Rickenbacker Causeway)
ndash Some CT-RAMP errors caused by network coding errors may not be apparent until feedback loop 2 because in loop 1 CT-RAMP uses seed skims
bull Use small sample size when testing a new network
Was the Run Successful
bull Did the run converge ndash AM and PM travel time RMSE values reported to
OUTDIRfeedbacklogprn
ndash Run stops when RMSE is less than 01
ndash 2010 Scenario converges in 5 loops
bull What to do if it didnrsquot converge ndash Look for obvious errors
ndash Run more iterations (future year might require more)
bull Are the top-level results comparable to a similar run ndash Use HEVAL reports
ndash Examine screenlines (RMSE reports)
ndash Spot check link loads
Tools for Analysis
bull Analysis ndash perform standard highway project type analyses
bull Usual analysis similar to trip-based model ndash Total daily and period-specific roadway volumes and speeds by
vehicle class
ndash Vehicle trip OD matrices
bull Standard FSUTMS HEVAL and RMSE reports are still available ndash Day and period assignments
ndash By County
ndash Truck assignment
Tools for Analysis
bull Potential for customized assignment classes to address
specific project questions ndash Does the manage lane serve primarily high income users
bull Stratify vehicle classes by lowhigh income to understand facility
usage by income level
bull Stratify vehicle classes by disadvantaged population cohorts
bull Trip and person tabulations built from ABM output ndash Trip mode shares for many different population cohorts subareas
ndash For example toll vs non-toll shares by value of time or fine-graded income levels
ndash Many other possibilities
Application 4 ndash Mobility Project
Mobility Project ndash SUNPASS Market Share
bull Persons in households that own a SUNPASS transponder respond differently to managed lane and toll road policies ndash Pay lower tolls than cash users
ndash Have access to I-95 managed lanes
bull Policy questions ndash How does projected toll traffic and revenue vary with the SUNPASS
penetration rate and toll discount
ndash How will SUNPASS penetration rate vary as more managed lane facilities are built in the region
Mobility Project ndash SUNPASS Market Share
bull Question 1 -- How does projected toll traffic and revenue vary with the SUNPASS penetration rate and toll discount
bull Procedure ndash Step1 ndash Assume a SUNPASS market share by modifying the toll
transponder model
ndash Step 2 ndash Run SERPM7 to produce traffic volumes
ndash Step 3 ndash Estimate toll traffic revenue
Modifying the Toll Transponder Ownership Model
bull Model specification is contained in TransponderOwnershipxls and can be edited with Microsoft Excel
Utility Variable Coefficient
Expected time savings up to 644 min 00631
Distance less than 5 miles -00304
Distance between 5 and 10 miles -00648
Distance 10 miles or more -00648
Constant 04877
Modifying the Toll Transponder Ownership Model
Utility Variable Coefficient
Expected time savings up to 644 min 00631
Distance less than 5 miles -00304
Distance between 5 and 10 miles -00648
Distance 10 miles or more -00648
Constant 04877
Increasing the constant will increase the number of households equipped with transponders
TransponderOwnershipxls
Modifying the Toll Transponder Model
bull Increase the constant by how much ndash Process is akin to model calibration
ndash Several runs of the transponder model required to estimate the constant that yields the desired market share
ndash 2010 market share is approximately 65
ndash Use a small sample (5 or 10) to save run-time while establishing the right constant
Modifying the Toll Transponder Model
bull Variation ndash Add terms to the model so that certain types of households are more
likely to exhibit a SUNPASS market share increase
bull Highlow income households
bull Multi-car households
bull Miami-Dade households
Modifying the Toll Transponder Model
bull Exhibit TransponderOwnershipxls
Mobility Project ndash SUNPASS Market Share
bull Question 2 -- How will SUNPASS penetration rate vary as more managed lane facilities are built in the region
bull Procedure ndash Step 1 ndash Code the manage lane facilities
ndash Step 2 ndash Run SERPM7 to forecast transponder ownership
ndash Step 3 ndash Analyze the forecast household data for changes in the profile of households equipped with transponders
Application 5 ndash Land Use Project
Land Use Project
bull Transportation projects comprise not only network scenarios but also land use scenarios
bull Land use scenarios can be ndash Very large scale (substantial changes to housing and employment
estimates throughout the region) or
ndash Small scale (localized changes for example for a traffic impact study)
bull For both large scale and small scale land use updates the
general procedure for updating the input data and running the model is the same
Land Use Project
bull The land use data in SERPM7 consists of ndash Synthetic population and derived input files
ndash Employment data
ndash School enrollment data
ndash Parking costs and parking spaces
ndash Regional shopping mall special generators
ndash Beach special generators
ndash Hotel and motel room data
Land Use Project
bull The land use data reside in different input files
Data Item Input File
Synthetic Population hhFilecsv personFilecsv ctramppopsynTAZDatacsv ctramppopsynMAZDatacsv
Employment School Enrollment Parking Supply Data Special Generators Hotel and Motel Rooms
inputsIN-2010Rmaz_datacsv
Land Use Project
bull As demonstrated earlier SERPM 7 requires significantly more comprehensive socio-economic inputs as compared to previous versions ndash Greater spatial detail
ndash More categoriestypes of land uses
bull These inputs require additional preparation when
performing land use model runs
Land Use Project
Data Required and examples bull Population
bull Age distribution of the population expected to live in the
development
bull Income profile
bull Type of dwelling unit (single-family vs multi-family)
ndash The input data need to be internally consistent (distribution of households by presence of children needs to be consistent with population age distribution for example)
Land Use Project
Data Required bull Employment classification ndash Previous models had three
employment classifications
ndash In SERPM 7 there are 16 employment categories to better differentiate type of land use and improve the relationship between land use and activity purpose
Land Use Project
Data Required bull School enrollment ndash note that it differentiates by grade level
(K-8 high-school collegepost-secondary) ndash Donrsquot forget to include school faculty and staff in employment
Land Use Project
Data Required bull Parking supply and
parking costs ndash Parking spaces may
reflect use restrictions
bull Monthly
bull Daily
bull Hourly
ndash Parking costs consistent with type of use
Land Use Project
bull Park Area 1 (pink) ndash May park in MAZ other
than destination MAZ
ndash Parking cost applies
bull Park Area 2 (gree) ndash Parks at destination MAZ
ndash Parking cost applies
Land Use Project
Data Required bull Visitor Model ndash Number of hotel and motel rooms
bull Special Generators ndash Regional shopping malls
ndash Beach recreation areas
Land Use Project
The Gardens Mall Aventura Mall
Boynton Mall Dolphin Mall
Delray Community Mall Dadeland Mall
Towncenter Mall The Falls Shopping Center
Wellington Greens Mall Cutler Ridge Mall
Coral Square Mall Bal Harbour Shops
Pompano Citi Centre CocoWalk
Sawgrass Mills Mall The Mall at 163rd Street
Broward Mall Mall of the Americas
Galleria Mall Mary Brickell Village
Pembroke Lakes Mall Miami International Mall
Lakes Mall Miracle Marketplace
Oakwood Plaza Village of Merrick Park
The Promenade at Coconut Creek Westland Mall
Regional Shopping Mall Special Generators
Land Use Project
Deerfield Beach
Pompano Beach
Fort Lauderdale Beach
Fort Lauderdale Beach
Hollywood Beach
South Beach
Haulover Beach
Crandon Park
Dania Beach
Bill Baggs State Park
Beach Special Generators
Land Use Project
Sample Problem
bull MINTO West Example - a mixed residentialcommercial development ndash 6500 singlemulti-family residential units in multiple TAZs
ndash 14 million square feet of non-residential space
ndash 150 room hotel
ndash 3000 student college campus
Land Use Project
MINTO WEST
Land Use Project
TAZsMAZs representing MINTO West Development
Land Use Project
Need to translate population household and employment information from developer into model input data ndash As discussed in the Population Synthesis presentation population and
household attribute estimates can be taken from other known nearby neighborhoods
bull In this sample problem first start by allocating percentages of total
households into individual MAZs within the development area
bull Keep in mind household density when estimating the number of
households in each MAZ
Land Use Project
bull In this sample employment can be assumed to include bull Retail
bull RestaurantsBars
bull Offices
bull Health services
bull Hotelmotel employment and
bull Educational employment
ndash As with households yoursquoll need to apportion the employment areas to individual MAZs while keeping in mind the types of employment expected in those locations
Land Use Project
bull Employment data is usually estimated by converting floor space available to individual types of employment through conversion factors
bull ie ndash (3000 sqft office space)(20 sqft per office employee) =
150 office employees
Land Use Project
bull Once population household and employment figures are estimated they are entered into the appropriate model input file
bull Population ndash TAZ synthetic population control file
bull Household ndash TAZ synthetic population control file
bull Employment School Parking and Special Gen ndash maz_datacsv
bull Ensure that population household and employment figures
are the same in each file
bull Prior to performing model run PopSyn must be run and user must copy output files to SERPM7 input folders
Application 6 ndashTransit Project
Transit Project ndash MetroRail North Corridor
SERPM Transit Modes
Transit Mode Tour and Trip
Mode TAP Transit Skim Mode
Tri-Rail Commuter Rail Premium
Metrorail Urban Rail Premium
I-95 Inter-County Express I-95X I-95E
Express Bus Premium
Busway BRT Premium
MDT Express Express Bus Premium
Metromover Local Bus Local Bus
MDT Local BCT Local
Palm Tran Local Local Bus Local Bus
Breeze Local Bus Local Bus
Tri-Rail Shuttles Local Bus Local Bus
SERPM Transit Modes
Transit Mode Tour and Trip
Mode TAP Transit Skim
Mode
Mode coded on the route ldquocardsrdquo
Used to specify boarding and transfer penalties for transit
path building
(most disaggregate)
Line-haul choices in the tour and trip mode choice
models
Used to create sets of TAP to TAP levels of service
(most aggregate)
Similar to SERPM 67 SERPM 7 ABM
SERPM Transit Modes S67 Mode Local (L) S7
Mode Mode Name Operator amp Name UserA4 Name Prem (P) MODE
15 Tri-Rail 11 Tri-Rail 15 Commuter P 111
14 Metrorail 25 Metrorail 14 Urban Rail P 121
X Regional LRT Regional LRT 14 LRT P 131
16 Inter-County Express Bus 33 I-95 Inter-County Express 16 Express P 151
12 Exclusive ROW Cir-Reg 13 Exclusive ROW Cir-Reg 12 Mover L 181
11 TrolleysShuttles-Reg 12 Tri-Rail Shuttles 11 Local L 191
11 TrolleysShuttles-Reg 12 Tri-Rail Shuttles 33 Local L 192
X LRT- MDT 25 MDT LRT 14 LRT P 231
16 Buses (localexpress) - MDT 27 MDT Busway Flyers 27 BRT P 241
23 Buses (localexpress) - MDT 27 MDT MAXKATBusway Local 27 BRT P 242
24 BRT - MDT 28 MDT BRTLRT 28 BRT P 243
23 Buses (localexpress) - MDT 22 MDT Express 24 Express P 251
16 Buses (localexpress) - MDT 24 MDT I-95 Exp 26 Express P 252
16 Inter-County Express Bus 24 I-95 Inter-County Express 16 Express P 253
22 Exclusive ROW Cir-MDT 26 Metromover 22 Mover L 281
21 TrolleysShuttles-MDT 21 MDT TrolleysShuttles 21 Local L 291
23 Buses (localexpress) - MDT 21 MDT Local 23 Local L 292
23 Buses (localexpress) - MDT 23 MDT Shuttle 25 Local L 293
X LRT - BCT 35 BCT LRT 37 LRT P 331
34 BCT Rapid Bus BRT 34 BCT Rapid Bus 36 BRT P 341
34 BCT Fixed-guideway BRT 35 BCT BRT 37 BRT P 342
33 Buses (localexpress) - BCT 32 BCT Breeze 34 Express P 351
33 Buses (localexpress) - BCT 33 BCT Express 35 Express P 352
32 Exclusive ROW Cir-BCT 31 BCT Exclusive ROW Cir 32 Mover L 381
31 TrolleysShuttles-BCT 31 BCT TrolleysShuttles 31 Local L 393
33 Buses (localexpress) - BCT 31 BCT Local 27 Local L 391
33 Buses (localexpress) - BCT 31 BCT Local 33 Local L 392
X LRT - Palm Tran 43 Palm Tran LRT 44 LRT P 431
44 BRT - Palm Tran 43 Palm Tran BRT 44 BRT P 441
43 Buses (localexpress) - Ptran 42 Palm Tran Exp 44 Express P 451
42 Exclusive ROW Cir-PTran 41 Palm Tran Exclusive ROW Cir 42 Mover L 481
41 TrolleysShuttles-Ptran 41 Palm Tran TrolleysShuttles 41 Local L 491
43 Buses (localexpress) - Ptran 41 Palm Tran Local 43 Local L 492
Modes Not in the 2010 Network
SERPM7 Transit Network Building
bull Typically bus routes are coded on top of existing highway links
bull SERPM7 reserves some facility type codes for transit-only use helpful to more accurately represent route ndash Caution -- make sure network integrity is preserved once transit only
links are removed
bull Rail routes require coding first fixed-guideway links
SERPM7 Transit Network Building
bull Route Attributes -- User Coded ndash Name
ndash Long Name
ndash Mode
ndash Operator
ndash Headway[1] ndash AM Peak
ndash Headway[2] ndash Midday
ndash Headway[3] ndash PM Peak
ndash UserA4 (stop dwell time)
SERPM7 Transit Network Building
bull PNR Node Attributes ndash User Coded ndash Parking Spaces
ndash Parking Cost AM
ndash Parking Cost MD
ndash Terminal Time PNR
ndash Terminal Time KNR
bull At this time parking spaces is used only to identify park-n-ride locations (parking spaces gt 0)
SERPM7 Transit Network Building
bull Transit Access Points -- Created by Cube for the ABM ndash One TAP for each stop on premium routes
bull Tri-Rail Metrorail Express Bus BRT
ndash One TAP for each Local Bus park-n-ride node
ndash Synthesized TAPs to represent access to local bus stops
bull Transit Access Point Attributes ndash TAP Mode
ndash Inherit PNR node data
Sample Highway Network with TAPs
TAPs become part of the highway network and replace the TAZ centroids when building transit skims
Transit Access Points and ldquoon the flyrdquo Path Building
bull Transit skims are built TAP to TAP
Matrix origins and destinations are TAPS
Transit Access Points and ldquoon the flyrdquo Path Building
Trip Origins and
Destinations
MAZ to MAZ
Auto Skims
TAZ to TAZ
Transit Skims
TAP to TAP
The three spatial systems are put together by the mode choice model
ldquoOn the Flyrdquo Path Building
bull TAZs TAPs and MAZs are linked via drive and access connectors prior to running CT-RAMP
rmdir OUTDIRABMTEMP S Q rmdir DATADIRABMTEMP S Q xcopy OUTDIR OUTDIRABMTEMP E I Y xcopy DATADIR DATADIRABMTEMP E I Y if(fbi=1) need to run only the first time through - kdk CUBEctramprunCreateAccessFilescmd endif mkdir logFiles taskkill im javaexe F start CUBEctramprunHhMgrcmd JDK64 HOST_IP start CUBEctramprunMtxMgrcmd HOST_IP JDK64 rem start CUBEctrampconfigrunDrivercmd copy CUBEctrampserpm_abmproperties serpm_abmproperties Y ping -n 11 127001 gt nul CUBEctramprunSERPMAbmcmd SAMPLERATE VSAMPLERATE JDK64 CUBEctramprunCreateDemandMatricescmd SAMPLERATE VSAMPLERATE JDK64 taskkill im javaexe F rmdir OUTDIRctramp S Q rmdir DATADIRctramp S Q xcopy OUTDIRABMTEMPctramp OUTDIRctramp E I Y xcopy DATADIRABMTEMPctramp DATADIRctramp E I Y
ldquoOn the Flyrdquo Path Building
MAZ to MAZ Connectors
Created by finding shortest distance paths over an all-streets network Connects all MAZs within 15 mi
Used to represent walk mode distance and time
MAZ to TAP Connectors
Created by finding shortest distance paths over an all-streets network Connects each MAZ to all TAPs within 10 mi
Used to represent transit walk access and walk egress distance and time
TAZ to TAP Connectors
Connects each TAZ to all TAPs within the TAP maximum drive distance bull Bus TAPs ndash 4 miles bull Rail TAPs ndash 15 miles
Used to represent transit drive access and egress distance and time
ldquoOn the Flyrdquo Path Building
bull No actual links created on the network bull Connectivity is expressed in table format
ldquoOn the Flyrdquo Path Building
bull Once the access and walk connectors are created the mode choice model builds complete paths MAZ to MAZ transit paths
bull Local-only paths are built using the ldquolocalrdquo transit skim bull Express BRT Urban Rail and Commuter rail paths are all
built at the same time using the ldquopremiumrdquo transit skim bull For each MAZ to MAZ pair CT-RAMP keeps the shortest
generalized cost path for each available premium mode bull Even though only one ldquopremiumrdquo skim is built CT-RAMP
may find competing premium paths It may also find that the best path is a combination of two premium modes or a premium mode and local bus
Tour Mode Choice Model
Choice
Auto
Drive alone
GP(1)
Pay(2)
Shared ride 2
GP(3)
HOV(4)
Pay(5)
Shared ride 3+
GP(6)
HOV(7)
Pay(8)
Non-motorized
Walk(9)
Bike(10)
Transit
Walk access
Local bus(11)
Express bus(12)
BRT(13)
Urban rail(14)
Commuter rail(15)
PNR access
Local bus(16)
Express bus(17)
BRT(18)
Urban rail(19)
Commuter rail(20)
KNR access
Local bus(21)
Express bus(22)
BRT(23)
Urban rail(24)
Commuter rail(25)
School Bus(26)
Trip Mode Choice Model
bull Same nesting structure as the tour mode choice but conditional on the tour mode
bull Some trip modes may be unavailable depending on the tour mode
DA SR2 SR3+ Walk Wlk-Trn PNR-Trn KNR-Trn
DA Must - - - - - -
SR2 Can Can - Can - - -
SR3+ Can Can Can Can - - -
Walk - - - Must - - -
Wlk-Trn - Can Can Can Can - -
PNR-Trn Can Can Can Can Can Can
KNR-Trn - Can Can Can Can - Can
Trip Switching Rules Simplified
Transit Trip Reporting
bull In SERPM7 the transit boarding and alighting location can be reported in two ways ndash Trip list files (ABM output) -- Boarding TAP Alighting TAP
ndash Transit assignment (Cube output) ndash Route nodes
bull Each type of reporting has its strengths ndash Trip list file allows building detailed transit trip patterns for
population cohorts and time periods
bull Mode split reports
bull Transit trip distance frequency distributions access distance TLFDs
bull Mode to mode transfers
ndash Note ABM reports only the first boarding TAP and the last alighting TAP regardless of mode
ndash Cube output gives aggregate link volumes station to station boardings etc
User Benefit Files
bull SERPM7 can produce FTA User Benefit files for input to SUMMIT
bull User benefits remain a useful analysis tool bull Steps to produce user benefit files require some manual
intervention ndash see User Guide
SERPM ABM Reports
bull Stores ABM inputs and outputs in a relational database to generate some standard model reports
bull Consistent reporting framework to be used for analysis across model runs
bull SERPM7 user community can easily share the scripts that create the reports
bull Reports take the form of Excel workbooks bull Foundation for future development of a visualization
dashboard
Reporting Database Components
Reporting Database Components
bull Reporting ETL (extract transform and load) program ndash Loads all Cube and CT-RAMP Java model outputs into the database
ndash Written in Cube scripts and Java
bull Database ndash Stores all data used in reporting including select network skims
household person tour and trip data zonal data etc
ndash Implemented with SQL Server
bull Report scripts to generate reports ndash Written in T-SQL
bull Report packaging program ndash Generates Excel workbooks with one report per worksheet
ndash Written in Java
Reporting Database Components
bull Run time required to build database and generate reports varies with sample size and type of report ndash Several hours required to build the database for a 100 sample
ndash ~ 30 minutes to produce reports for a 10 sample
bull Report step is optional not part of a standard model run bull Report production is transparent to the user
bull hellip but users can contribute reports bull hellip and choose which reports to build at any one time
Running SERPM ABM Reports
bull Report queries reside in ctrampreports_sql time_spent_travelingsql Total weekday travel time by person type
and income group
total_trips_typesql Trips by trip mode person type county of residence and tour purpose
total_tours_typesql Tours by trip mode person type county of residence and tour purpose
tours_districtssql Tours by tour purpose and tour origin and destination districts
transit_access_time+distsql Drive to transit trip list with many trip details
hellip
Running SERPM ABM Reports
bull List of reports to run is specified in properties file ndash ctrampserpm_reportsproperties
sqlscriptsdirectory = Cserpm7ctrampreports_sql sqlscriptsschemakey = SCHEMA sqlscripts=cleanupsqltransit_access_time+distsql worksheettables=temptransittrips worksheetnames=TransitTrips workbookname = Cserpm7ctrampreports_sqlSERPM_REPORTXLS databaseschema = 2010R databaseipaddress = w-ampdx-d-sag10 databaseinstance = databaseport = 1433 databasename=SERPMABM databaseusername=serpm databasepassword=s3rpm
Adding Reports
bull Step 1 --Write report query ndash T-SQL
ndash User Guide includes a database data dictionary
bull Step 2 ndash Add query to ctrampreports_sql ndash Each query is contained in a single text file
ndash Drop file in reports folder
bull Step 3 ndash Add the query to the properties file sqlquery = Query file name
Worksheettables = Query output
Worksheetnames = Name for the report worksheet
Sample SERPM ABM Reports
bull Exhibit ctrampreports_sqlserpm_reportsxls
More information Shi-Chiang Li | shi-chianglidotstateflus |954 777 4655 Rosella Picado | picadopbworldcom | 206 382 5227 Ken Kaltenbach |kkaltenbachcorradinocom |502 587 7221

The CT-RAMP Properties File
bull Exhibit serpmabmproperties
Monitoring Run StatusProgress
bull Cube scripted components progress is tracked by Cubersquos Task Monitor
Monitoring Run Status
bull Java components status is reported to the log files ndash CubelogFileseventlog
ndash CubelogFiles
bull The log files are text files that can be opened with any text editor (Notepad Wordpad Ultraedit etc)
bull What is reported ndash Step being executed
ndash A few model output summaries
ndash Errors
ndash Trace calculations
bull While Java components are running status of Task Monitor does not change
Monitoring Run Status
bull Exhibit cubeeventlog
Running SERPM7 ndash New Scenario
bull Step 1 ndash Create input and output scenario folders ndash Suggested scenario naming convention
bull inputIN-YEARALT
bull outputOUT-YEARALT
bull Copy all input files from an existing scenario including all subfolders
bull Update new scenario-specific files ndash Highway transit networks
ndash Household person synthetic population
ndash Land use data
bull Proceed with Steps 2 thru 6 for running an existing scenario
FDOT Servers Run Times
Feedback Loop End Time Runtime (HHMM)
RMSE (AM amp PM)
1 945 1045 1226 amp 1363
2 1648 703 060 amp 058
3 119 831 023 amp 020
4 806 647 012 amp 009
5 1458 652 008 amp 006
Total ~40 hrs
Model Server 3 20 Sample
FDOT WorkStation Run Times
Machine Sample Size Run Time (HHMM)
Model WorkStation
1 048
5 240
10 503
20 949
Model Server 3 20 400
CT-RAMP Only
Model Installation
SERPM7 Installation
bull Installation package and User Guide available from Florida DOT via FSUTMS Online
bull Hardware and software requirements and installation instructions described in User Guide
bull Sample model output available from Florida DOT
SERPM7 Installation
bull Hardware Requirements ndash 64-bit Operating System
ndash Intel Xeon X5690 347 GHz 6 core processors or similar
ndash Minimum 96 GB RAM
ndash Minimum 1 TB space for storing model output
bull Software ndash Cube 61 wcluster license
ndash SQL SQL Express
ndash Java
ndash Microsoft Excel (optional)
SERPM7 Installation
bull Step 1 ndash Create the Project Folder ndash Set user permission level to lsquoEveryonersquo
bull Step 2 ndash Configure the machines ndash Set environment variables
ndash Install Java and set its environment variables
ndash Verifyinstall Cube 64-bit matrix IO DLL
ndash Other hellip
bull Step 3 ndash Configure the JPPF services bull Step 4 ndash Configure the ldquoRunrdquo component files bull Step 5 ndash Configure SERPM7 in Application Manager bull Step 6 ndash Create the seed skims
Application 1 Working with a Population Sample
Working with a Population Sample
bull A simulation of the entire population is not required for every single application ndash Small sample sizes are sufficiently accurate for forecasting aggregate
region or county-wide statistics
ndash Small sample sizes save run time during model calibration and when testing initial versions of new networks and other input data
Working with a Population Sample
bull Developing a region-wide forecast using travel outcomes for a sample of the population is analogous to estimating region-wide travel statistics using a survey sample
Survey Simulation
Gathers trip diary information for a sample of households
Simulates trips for a sample of households
Typical sampling rate 020 - 025
Typical sampling rate 5 - 50
Estimates travel patterns for entire population by multiplying each surveyed trip record by an
expansion factor
Estimates travel patterns for entire population by multiplying each simulated trip record by an
expansion factor
Typical expansion factors 100 - 1000
Typical expansion factors 2 - 20
Working with a Population Sample
bull The ABM assumes that each household makes travel decisions independently of the decisions made by all other households
bull Households are simulated independently of each other bull The ABM samples randomly from the list of households to
select the ones it simulates bull It is prudent to verify that the selected population sample is
unbiased ndash A very small (1 or less) simple random sample is likely to be biased
for example it will likely mis-represent households that are found infrequently in the population
ndash Samples of 10 or more are typically sufficiently unbiased for travel demand forecasting applications
Working with a Population Sample
bull How big a sample to use ndash The more localized the expected impact of a project the larger the
required sample
bull Some recommendations ndash For model calibration and validation 10-25 is typically sufficient
ndash For comparing aggregate county-wide and sub-county average travel statistics 10 - 25
ndash For estimating daily traffic volumes on high capacity facilities and high capacity transit 25 - 50
ndash For traffic impact studies 50 - 100
bull hellip but testing highly encouraged
Working with a Population Sample
bull A sample expansion factor is applied when creating the trip tables for assignment
bull Expansion factor = 1samplingRate bull Loads on highway and transit networks are representative
of the entire population bull Summaries produced from the ABM list output need to be
expanded to be representative of the entire population
Running SERPM7 with a Population Sample
bull Setting the run ndash Set the sampling rate for residents and visitors in Cube
ndash All other model settings can remain unchanged
bull The same sampling rate is used on all feedback loops
Catalog Key Description
SAMPLERATE Sampling rate for the resident population
VSAMPLERATE Sampling rate for the visitor population
Running SERPM7 with a Population Sample
bull When working with a ldquoless than 100rdquo model run each record in the output list files has to be expanded by 1samplingRate ndash householdData_v1csv
ndash personData_v1csv
ndash indivTourFile_v1csv
ndash jointTourFile_v1csv
ndash indivTripFile_v1csv
ndash jointTripFile_v1csv
bull Trip tables are already expanded ndash TAZ_Demand_tmat
ndash TAP_Demand_tmat
Running SERPM7 with a Population Sample
bull Sample Output ndash County-wide highway assignment statistics
Screenline 25
Sample 50
Sample Diff ()
BOEW Northern SL along Pompano Canal 842418 843591 -01
BOEW Middle SL along Oakland Park Blvd 1187251 1183529 03
BOEW Southern SL along River Canal 881601 879618 02
BONS Western SL between I75 and TPK 586412 587353 -02
BONS Middle SL along TPK 1441311 1437065 03
BONS Eastern SL along Intracostal Wway 328855 326298 08
BOEW SL BOPB County Line 648960 648771 00
BOEW SL BOMD County Line 979327 976276 03
BOWestern Ext CL Collier County Line 31059 31059 00
BONS I-95 CL from Miami-Dade to I-595 510207 509537 01
BONS Western CL along SR897 frm PB-SR816 494591 495547 -02
Running SERPM7 with a Population Sample
Running SERPM7 with a Population Sample
Running SERPM7 with a Population Sample
bull Sample Output ndash Individual Route Boardings
Running SERPM7 with a Population Sample
bull Sample Output ndash Individual Route Boardings
Running SERPM7 with a Population Sample
bull Sample Output ndash Regionwide Household Income Profile
Household Income 25 Sample 100 Sample
Less than $10000 1015 1021
$10000 to $15000 470 468
$15000 - $20000 566 564
$20000 to $25000 519 516
$25000 to $30000 493 494
$30000 to $35000 475 477
$35000 to $40000 387 387
$40000 to $45000 343 345
$45000 to $50000 348 348
$50000 to $75000 1754 1747
$75000 to $100000 1432 1433
$100000 or More 2198 2200
Application 2 Population Synthesis
Population Synthesis
bull Each SERPM7 scenario requires a synthetic population ndash List of households -- hhFilecsv
ndash List of persons that make up the households -- personFilecsv
bull Two synthetic populations have been developed to date ndash 2010 base year population
ndash 2040 long range transportation plan population
Population Synthesis
bull New synthetic populations will be required for ndash Other regional scenario years (eg 2020 2025 2045)
ndash To test population and land use scenarios such as
bull Traffic impact study for a new housing or commercial development
bull Impact of aging population
bull Impact of rising sea levels (because some neighborhoods will no
longer be inhabitable)
bull Refinements to the 2010 and 2040 populations
Population Synthesis
bull The population synthesizer (PopSynII) does not run normally as part of SERPM7 ndash SERPM7 expects input population files in the input folder
ndash User is responsible for running PopSynII to generate the required population files and place them in the scenario folders prior to a SERPM7 run
bull Why ndash Because a new synthetic population is not required for every run
PopSyn II Setup
bull PopSynII is already configured to run on the FDOT servers bull Java application using SQL data storage
PopSynII installed in the main ctramp folder
PopSynII Setup
bull The ctramppopsyn folder
Filename Description
runAllPopsynbat Batch file that controls the execution of PopSynII
controls SQL settings file that specifies the population attributes used as controls
1_importCSVsql 2_createTargetssql 3_createSynHHPerFilessql
SQL scripts that run the PopSynII software
2010_TAZ_Datacsv TAZ input control data
2010_MAZ_Datacsv MAZ input control data
Developing a New Synthetic Population
bull Step 1 ndash Prepare the input files ndash TAZ controls 2010_taz_datacsv
ndash MAZ controls 2010_maz_datacsv
Developing a New Synthetic Population
bull MAZ Control input file eg 2010_maz_datacsv ndash Estimates of total households and persons living in group quarters
bull Total households
bull Total group quarter population
ndash One record for each MAZ
Developing a New Synthetic Population
bull TAZ Controls input file -- eg 2010_taz_datacsv ndash Estimates of number of households or population for each SERPM7
controlled attribute
bull Household size
bull Household income
bull Household workers
bull Type of dwelling unit
bull Presence of children in the household
bull Population age group
bull Gender
bull Raceethnicity
bull Population in group quarters
ndash One record per TAZ
Analogous to the TAZ SE data file in the trip-
based model
Developing a New Synthetic Population
When preparing TAZ and MAZ control data it is critically important to
maintain internal data consistency
Developing a New Synthetic Population
bull Some data checks to perform and problems to look out for ndash The household and person marginals pertain to household residents
only except for the group quarter controls
ndash All household-based marginals add up to the same total households for each TAZ
ndash All person-based marginals add up to the same total persons for each TAZ
ndash The total number of persons implied by the household size marginal is consistent with the sum total of the person marginals
ndash The total number of children obtained from the age marginal is consistent with the marginal of households by presence of children
ndash Large deviations from 5050 split of persons by gender is suspect
ndash The household income distribution is consistency with the workers-in-household distribution
Developing a New Synthetic Population
bull More data checks ndash The MAZ and TAZ controls should add up
bull to the same number of households by TAZ
bull to the same number of persons in group quarters by TAZ
Developing a New Synthetic Population
bull Exhibit ndash SERPM7 2010 TAZ control file
Example ndash Minto West Palm Beach Co
Example ndash Minto West
bull Mixed-use development in a agricultural area adjacent to an existing housing development
bull Information available from proposedapproved plans ndash Single-family dwelling units ndash 5050
ndash Multi-family dwelling units ndash 1040
ndash Total population ndash 14 535 persons
ndash Spatial location of dwelling units by type
bull Other PopSyn required data not available from plans (income distribution age distribution etc) ndash Estimateassert it based on similar existing developments
surrounding neighborhood
Example ndash Minto West
bull Adding householdspersons to a TAZ
bull Adding TAZs or MAZs to SERPM7 should be a rare occurrence ndash Households are ultimately allocated to MAZs and therersquos already
12000 of them
ndash Households are represented individually so the zone attributes are derived from them
Trip-Based Model Modify the input zonal data file
Activity-Based Model Modify the population synthesis control file
Running PopSynII
bull Step 2 ndash Modify the PopSyn settings file for this run ndash Update TAZ and MAZ control filenames in runAll_popsynbat
REM BATCH FILE TO SETUP POPSYN RUN RUN POPSYNII AND OUTPUT CSV FILES REM SETUP REM PLEASE SET PATH NAMES FOR WORKING FOLDER AND CSV FILE LOCATIONS SET SERVERNAME=W-AMSTL-D-00052SQLEXPRESS SET DATABASENAME=popSyn SET ARCPATH=Cpopsyn SET CSVPATH_CONTROLS=Cpopsyninputscontrolscsv SET CSVPATH_MAZ=Cpopsyninputs2010_MAZ_Data_20120207csv SET CSVPATH_TAZ=Cpopsyninputs2010_TAZ_Data_20120207csv REM MAIN SCRIPT REM MAKE FILENAMES TABLE REM sqlcmd -S SERVER NAME -E -i INPUT FILE PATH (SCRIPT) -o OUTPUT LOG REM -E means to use Windows authentication for the user that is running the batch file SQLCMD -S SERVERNAME -d DATABASENAME -E -Q IF OBJECT_ID(dbocsv_filenames) IS NOT NULL DROP TABLE csv_filenames -o ARCPATHResultLogtxt
hellip hellip
Running PopSynII
bull Other PopSyn settings ndash rarely used in a production run ndash Change the control attributes
ndash Change the priority of control attributes
Running PopSynII
bull Step 3 ndash Run PopSynII -- runAll_popsynbat
Running PopSynII
bull Step 4 ndash Review Output amp Check Fit to Controls
Output File Description
hhFilecsv List of households
personFilecsv List of persons
ZoneResultscsv Comparisons of synthetized households to controlled and uncontrolled attributes
BalanceDetailscsv
ValidationStatscsv
ValidationStatsByPumacsv
Reviewing PopSyn Output
bull Zone_Resultscsv bull Comparison of synthesized totals to target totals for each
TAZ and controlled attribute
TOTAL_HOUSEHOLDS
ZONE TARGET SYNTHESIZED DIFFERENCE PCTDIFF
1 715 715 0 0
2 811 811 0 0
3 878 878 0 0
4 826 826 0 0
5 1181 1181 0 0
6 212 212 0 0
7 459 459 0 0
8 253 253 0 0
Reviewing PopSyn Output
bull Balance_Detailscsv bull Same output as Zone_Results different format
Zone Control ID ControlCat Target PUMSVal ConStat
1989 109 TOTAL_HOUSEHOLDS 1508 1508 yes
1989 249 INCOME_25K 273 271 no
1989 19 HHSIZE_4PLUS 467 467 yes
1989 160 FEMALE 2196 2108 no
1989 55 INCOME_100K 258 257 yes
1989 67 MULTI_UNIT 423 407 no
1989 31 WORKERS_3PLUS 164 166 no
Reviewing PopSyn Output
bull Validation_Statscsv ndash Comparison of synthesized attributes to input Census data (5 PUMS)
ndash Includes uncontrolled attributes
Description popSynSum censusSum meanDiff stdDev minDiff maxDiff Universe 1 number of households 2085375 1964881 17 61 -97 331
family 67 65 3 17 -26 48
non family 33 35 0 34 -58 111
size 1 27 28 0 36 -59 111
size 2 31 32 -3 14 -30 30
size 3 17 17 1 22 -37 53
size 4 25 23 18 50 -46 160
Reviewing PopSyn Output
bull Validation_StatsByPumacsv ndash Same as validation_stats but for each PUMA
bull Note that synthesized population may differ from 5 Census population by design
Application 3 ndash Highway Project
Highway Project
Example Projects ndashToll road extension ndashReversible lanes ndashManaged lanes
Overview
How to use SERPM7 to perform a model run and do some standard analysis ndash Option 1 -- Code the project directly on the geodatabase
bull Roadway links
bull Node links
bull Turn penalties
bull [assume no change to transit]
ndash Option 2 --Code the project on net files and then build the geodatabase
bull Use flowchart script to build the geodatabase
ndash Coding is very similar to earlier versions of SERPM
bull Facility types are the same
SERPM Facility Types (not new)
Editing the Highway Network
bull SERPM 7 requires a geodatabase bull Editing can be done either to a net file or directly on the
geodatabase bull The user can use utilities in the model flowchart to write a
net file from the geodatabase edit the net and then write it to the geodatabase
bull The geodatabase must exist to run the model
Editing in the Geodatabase
bull Simplest and most direct method bull Requires an understanding of the CubeArcGIS tools
Export geodatabase and edit as a net
bull Start Data Manager bull Open geodatabase (SERPM_NETSMDB) bull Double click on the network Input Hwy Net and specify an
output file (maybe ldquoeditnetrdquo) bull Open from Cube and edit as usual bull Use ldquoPrepare for Model Run and Trap Errorsrdquo (2) utilities to
write back to geodatabase ndash Reload geodatabase from Cube files ndash Cull and sort
ndash Write to geodatabase
Edit as a net
Export Edit in Cube
Change to point to edited network
Input Hwy Net
Toll Road Extension
bull Short Cut ndash copy an existing toll link bull No special NODE attributes bull Only new attribute is ISTOLL=1 for all links that could not be
used unless a toll were paid bull Toll Mainline FTC2=91 ISTOLL=1 DIRCODE=1 bull Plaza (gantry) ndash assume all will be electronic collection ndash TOLL=1 DIRCODE=1
ndash TOLLTYPE=3 CARTOLL=toll in dollars
ndash FTC2=95
ndash ISTOLL=1
ndash SVCSECONDS=001
ndash DELCODE=1 ACCELCODE=1 AVILANES=2
Toll Road Extension
Not much different from earlier versions of SERPM
Reversible Lanes
bull Control by the link attribute REVERSIBLE ndash REVERSIBLE=1 means AM operation only
ndash REVERSIBLE=2 means PM operation only
ndash I-595 example
Managed Lanes (typically Express)
bull HOT=1 ndash 98 (99 makes the link a dummy) bull FTC2 most likely=91 but other types permitted bull TOLL=0 ISTOLL=0 bull Tolls set by HOTTOLLdbf
HOT Lanes Tolls
bull Set as a function of the VC bull Updated in the travel time feedback loop bull Affects the TollFree split in mode choice bull Column HOT_x were x=HOT link attribute bull HOT_1 is the current 95 Express rate HOT_2 is a placeholder
Common Errors
bull Errors to watch out for ndash If network steps fail look for missing attributes
ndash Update transit routes as needed due to changes to underlying highway network
ndash Check for dangling links and unconnected zones
ndash Verify that all TAZs are connected to lsquofreersquo roads
bull Special procedures required for TAZs that have toll-only access must
include the attribute ISRCTOLLINK=1 (currently used for the
Rickenbacker Causeway)
ndash Some CT-RAMP errors caused by network coding errors may not be apparent until feedback loop 2 because in loop 1 CT-RAMP uses seed skims
bull Use small sample size when testing a new network
Was the Run Successful
bull Did the run converge ndash AM and PM travel time RMSE values reported to
OUTDIRfeedbacklogprn
ndash Run stops when RMSE is less than 01
ndash 2010 Scenario converges in 5 loops
bull What to do if it didnrsquot converge ndash Look for obvious errors
ndash Run more iterations (future year might require more)
bull Are the top-level results comparable to a similar run ndash Use HEVAL reports
ndash Examine screenlines (RMSE reports)
ndash Spot check link loads
Tools for Analysis
bull Analysis ndash perform standard highway project type analyses
bull Usual analysis similar to trip-based model ndash Total daily and period-specific roadway volumes and speeds by
vehicle class
ndash Vehicle trip OD matrices
bull Standard FSUTMS HEVAL and RMSE reports are still available ndash Day and period assignments
ndash By County
ndash Truck assignment
Tools for Analysis
bull Potential for customized assignment classes to address
specific project questions ndash Does the manage lane serve primarily high income users
bull Stratify vehicle classes by lowhigh income to understand facility
usage by income level
bull Stratify vehicle classes by disadvantaged population cohorts
bull Trip and person tabulations built from ABM output ndash Trip mode shares for many different population cohorts subareas
ndash For example toll vs non-toll shares by value of time or fine-graded income levels
ndash Many other possibilities
Application 4 ndash Mobility Project
Mobility Project ndash SUNPASS Market Share
bull Persons in households that own a SUNPASS transponder respond differently to managed lane and toll road policies ndash Pay lower tolls than cash users
ndash Have access to I-95 managed lanes
bull Policy questions ndash How does projected toll traffic and revenue vary with the SUNPASS
penetration rate and toll discount
ndash How will SUNPASS penetration rate vary as more managed lane facilities are built in the region
Mobility Project ndash SUNPASS Market Share
bull Question 1 -- How does projected toll traffic and revenue vary with the SUNPASS penetration rate and toll discount
bull Procedure ndash Step1 ndash Assume a SUNPASS market share by modifying the toll
transponder model
ndash Step 2 ndash Run SERPM7 to produce traffic volumes
ndash Step 3 ndash Estimate toll traffic revenue
Modifying the Toll Transponder Ownership Model
bull Model specification is contained in TransponderOwnershipxls and can be edited with Microsoft Excel
Utility Variable Coefficient
Expected time savings up to 644 min 00631
Distance less than 5 miles -00304
Distance between 5 and 10 miles -00648
Distance 10 miles or more -00648
Constant 04877
Modifying the Toll Transponder Ownership Model
Utility Variable Coefficient
Expected time savings up to 644 min 00631
Distance less than 5 miles -00304
Distance between 5 and 10 miles -00648
Distance 10 miles or more -00648
Constant 04877
Increasing the constant will increase the number of households equipped with transponders
TransponderOwnershipxls
Modifying the Toll Transponder Model
bull Increase the constant by how much ndash Process is akin to model calibration
ndash Several runs of the transponder model required to estimate the constant that yields the desired market share
ndash 2010 market share is approximately 65
ndash Use a small sample (5 or 10) to save run-time while establishing the right constant
Modifying the Toll Transponder Model
bull Variation ndash Add terms to the model so that certain types of households are more
likely to exhibit a SUNPASS market share increase
bull Highlow income households
bull Multi-car households
bull Miami-Dade households
Modifying the Toll Transponder Model
bull Exhibit TransponderOwnershipxls
Mobility Project ndash SUNPASS Market Share
bull Question 2 -- How will SUNPASS penetration rate vary as more managed lane facilities are built in the region
bull Procedure ndash Step 1 ndash Code the manage lane facilities
ndash Step 2 ndash Run SERPM7 to forecast transponder ownership
ndash Step 3 ndash Analyze the forecast household data for changes in the profile of households equipped with transponders
Application 5 ndash Land Use Project
Land Use Project
bull Transportation projects comprise not only network scenarios but also land use scenarios
bull Land use scenarios can be ndash Very large scale (substantial changes to housing and employment
estimates throughout the region) or
ndash Small scale (localized changes for example for a traffic impact study)
bull For both large scale and small scale land use updates the
general procedure for updating the input data and running the model is the same
Land Use Project
bull The land use data in SERPM7 consists of ndash Synthetic population and derived input files
ndash Employment data
ndash School enrollment data
ndash Parking costs and parking spaces
ndash Regional shopping mall special generators
ndash Beach special generators
ndash Hotel and motel room data
Land Use Project
bull The land use data reside in different input files
Data Item Input File
Synthetic Population hhFilecsv personFilecsv ctramppopsynTAZDatacsv ctramppopsynMAZDatacsv
Employment School Enrollment Parking Supply Data Special Generators Hotel and Motel Rooms
inputsIN-2010Rmaz_datacsv
Land Use Project
bull As demonstrated earlier SERPM 7 requires significantly more comprehensive socio-economic inputs as compared to previous versions ndash Greater spatial detail
ndash More categoriestypes of land uses
bull These inputs require additional preparation when
performing land use model runs
Land Use Project
Data Required and examples bull Population
bull Age distribution of the population expected to live in the
development
bull Income profile
bull Type of dwelling unit (single-family vs multi-family)
ndash The input data need to be internally consistent (distribution of households by presence of children needs to be consistent with population age distribution for example)
Land Use Project
Data Required bull Employment classification ndash Previous models had three
employment classifications
ndash In SERPM 7 there are 16 employment categories to better differentiate type of land use and improve the relationship between land use and activity purpose
Land Use Project
Data Required bull School enrollment ndash note that it differentiates by grade level
(K-8 high-school collegepost-secondary) ndash Donrsquot forget to include school faculty and staff in employment
Land Use Project
Data Required bull Parking supply and
parking costs ndash Parking spaces may
reflect use restrictions
bull Monthly
bull Daily
bull Hourly
ndash Parking costs consistent with type of use
Land Use Project
bull Park Area 1 (pink) ndash May park in MAZ other
than destination MAZ
ndash Parking cost applies
bull Park Area 2 (gree) ndash Parks at destination MAZ
ndash Parking cost applies
Land Use Project
Data Required bull Visitor Model ndash Number of hotel and motel rooms
bull Special Generators ndash Regional shopping malls
ndash Beach recreation areas
Land Use Project
The Gardens Mall Aventura Mall
Boynton Mall Dolphin Mall
Delray Community Mall Dadeland Mall
Towncenter Mall The Falls Shopping Center
Wellington Greens Mall Cutler Ridge Mall
Coral Square Mall Bal Harbour Shops
Pompano Citi Centre CocoWalk
Sawgrass Mills Mall The Mall at 163rd Street
Broward Mall Mall of the Americas
Galleria Mall Mary Brickell Village
Pembroke Lakes Mall Miami International Mall
Lakes Mall Miracle Marketplace
Oakwood Plaza Village of Merrick Park
The Promenade at Coconut Creek Westland Mall
Regional Shopping Mall Special Generators
Land Use Project
Deerfield Beach
Pompano Beach
Fort Lauderdale Beach
Fort Lauderdale Beach
Hollywood Beach
South Beach
Haulover Beach
Crandon Park
Dania Beach
Bill Baggs State Park
Beach Special Generators
Land Use Project
Sample Problem
bull MINTO West Example - a mixed residentialcommercial development ndash 6500 singlemulti-family residential units in multiple TAZs
ndash 14 million square feet of non-residential space
ndash 150 room hotel
ndash 3000 student college campus
Land Use Project
MINTO WEST
Land Use Project
TAZsMAZs representing MINTO West Development
Land Use Project
Need to translate population household and employment information from developer into model input data ndash As discussed in the Population Synthesis presentation population and
household attribute estimates can be taken from other known nearby neighborhoods
bull In this sample problem first start by allocating percentages of total
households into individual MAZs within the development area
bull Keep in mind household density when estimating the number of
households in each MAZ
Land Use Project
bull In this sample employment can be assumed to include bull Retail
bull RestaurantsBars
bull Offices
bull Health services
bull Hotelmotel employment and
bull Educational employment
ndash As with households yoursquoll need to apportion the employment areas to individual MAZs while keeping in mind the types of employment expected in those locations
Land Use Project
bull Employment data is usually estimated by converting floor space available to individual types of employment through conversion factors
bull ie ndash (3000 sqft office space)(20 sqft per office employee) =
150 office employees
Land Use Project
bull Once population household and employment figures are estimated they are entered into the appropriate model input file
bull Population ndash TAZ synthetic population control file
bull Household ndash TAZ synthetic population control file
bull Employment School Parking and Special Gen ndash maz_datacsv
bull Ensure that population household and employment figures
are the same in each file
bull Prior to performing model run PopSyn must be run and user must copy output files to SERPM7 input folders
Application 6 ndashTransit Project
Transit Project ndash MetroRail North Corridor
SERPM Transit Modes
Transit Mode Tour and Trip
Mode TAP Transit Skim Mode
Tri-Rail Commuter Rail Premium
Metrorail Urban Rail Premium
I-95 Inter-County Express I-95X I-95E
Express Bus Premium
Busway BRT Premium
MDT Express Express Bus Premium
Metromover Local Bus Local Bus
MDT Local BCT Local
Palm Tran Local Local Bus Local Bus
Breeze Local Bus Local Bus
Tri-Rail Shuttles Local Bus Local Bus
SERPM Transit Modes
Transit Mode Tour and Trip
Mode TAP Transit Skim
Mode
Mode coded on the route ldquocardsrdquo
Used to specify boarding and transfer penalties for transit
path building
(most disaggregate)
Line-haul choices in the tour and trip mode choice
models
Used to create sets of TAP to TAP levels of service
(most aggregate)
Similar to SERPM 67 SERPM 7 ABM
SERPM Transit Modes S67 Mode Local (L) S7
Mode Mode Name Operator amp Name UserA4 Name Prem (P) MODE
15 Tri-Rail 11 Tri-Rail 15 Commuter P 111
14 Metrorail 25 Metrorail 14 Urban Rail P 121
X Regional LRT Regional LRT 14 LRT P 131
16 Inter-County Express Bus 33 I-95 Inter-County Express 16 Express P 151
12 Exclusive ROW Cir-Reg 13 Exclusive ROW Cir-Reg 12 Mover L 181
11 TrolleysShuttles-Reg 12 Tri-Rail Shuttles 11 Local L 191
11 TrolleysShuttles-Reg 12 Tri-Rail Shuttles 33 Local L 192
X LRT- MDT 25 MDT LRT 14 LRT P 231
16 Buses (localexpress) - MDT 27 MDT Busway Flyers 27 BRT P 241
23 Buses (localexpress) - MDT 27 MDT MAXKATBusway Local 27 BRT P 242
24 BRT - MDT 28 MDT BRTLRT 28 BRT P 243
23 Buses (localexpress) - MDT 22 MDT Express 24 Express P 251
16 Buses (localexpress) - MDT 24 MDT I-95 Exp 26 Express P 252
16 Inter-County Express Bus 24 I-95 Inter-County Express 16 Express P 253
22 Exclusive ROW Cir-MDT 26 Metromover 22 Mover L 281
21 TrolleysShuttles-MDT 21 MDT TrolleysShuttles 21 Local L 291
23 Buses (localexpress) - MDT 21 MDT Local 23 Local L 292
23 Buses (localexpress) - MDT 23 MDT Shuttle 25 Local L 293
X LRT - BCT 35 BCT LRT 37 LRT P 331
34 BCT Rapid Bus BRT 34 BCT Rapid Bus 36 BRT P 341
34 BCT Fixed-guideway BRT 35 BCT BRT 37 BRT P 342
33 Buses (localexpress) - BCT 32 BCT Breeze 34 Express P 351
33 Buses (localexpress) - BCT 33 BCT Express 35 Express P 352
32 Exclusive ROW Cir-BCT 31 BCT Exclusive ROW Cir 32 Mover L 381
31 TrolleysShuttles-BCT 31 BCT TrolleysShuttles 31 Local L 393
33 Buses (localexpress) - BCT 31 BCT Local 27 Local L 391
33 Buses (localexpress) - BCT 31 BCT Local 33 Local L 392
X LRT - Palm Tran 43 Palm Tran LRT 44 LRT P 431
44 BRT - Palm Tran 43 Palm Tran BRT 44 BRT P 441
43 Buses (localexpress) - Ptran 42 Palm Tran Exp 44 Express P 451
42 Exclusive ROW Cir-PTran 41 Palm Tran Exclusive ROW Cir 42 Mover L 481
41 TrolleysShuttles-Ptran 41 Palm Tran TrolleysShuttles 41 Local L 491
43 Buses (localexpress) - Ptran 41 Palm Tran Local 43 Local L 492
Modes Not in the 2010 Network
SERPM7 Transit Network Building
bull Typically bus routes are coded on top of existing highway links
bull SERPM7 reserves some facility type codes for transit-only use helpful to more accurately represent route ndash Caution -- make sure network integrity is preserved once transit only
links are removed
bull Rail routes require coding first fixed-guideway links
SERPM7 Transit Network Building
bull Route Attributes -- User Coded ndash Name
ndash Long Name
ndash Mode
ndash Operator
ndash Headway[1] ndash AM Peak
ndash Headway[2] ndash Midday
ndash Headway[3] ndash PM Peak
ndash UserA4 (stop dwell time)
SERPM7 Transit Network Building
bull PNR Node Attributes ndash User Coded ndash Parking Spaces
ndash Parking Cost AM
ndash Parking Cost MD
ndash Terminal Time PNR
ndash Terminal Time KNR
bull At this time parking spaces is used only to identify park-n-ride locations (parking spaces gt 0)
SERPM7 Transit Network Building
bull Transit Access Points -- Created by Cube for the ABM ndash One TAP for each stop on premium routes
bull Tri-Rail Metrorail Express Bus BRT
ndash One TAP for each Local Bus park-n-ride node
ndash Synthesized TAPs to represent access to local bus stops
bull Transit Access Point Attributes ndash TAP Mode
ndash Inherit PNR node data
Sample Highway Network with TAPs
TAPs become part of the highway network and replace the TAZ centroids when building transit skims
Transit Access Points and ldquoon the flyrdquo Path Building
bull Transit skims are built TAP to TAP
Matrix origins and destinations are TAPS
Transit Access Points and ldquoon the flyrdquo Path Building
Trip Origins and
Destinations
MAZ to MAZ
Auto Skims
TAZ to TAZ
Transit Skims
TAP to TAP
The three spatial systems are put together by the mode choice model
ldquoOn the Flyrdquo Path Building
bull TAZs TAPs and MAZs are linked via drive and access connectors prior to running CT-RAMP
rmdir OUTDIRABMTEMP S Q rmdir DATADIRABMTEMP S Q xcopy OUTDIR OUTDIRABMTEMP E I Y xcopy DATADIR DATADIRABMTEMP E I Y if(fbi=1) need to run only the first time through - kdk CUBEctramprunCreateAccessFilescmd endif mkdir logFiles taskkill im javaexe F start CUBEctramprunHhMgrcmd JDK64 HOST_IP start CUBEctramprunMtxMgrcmd HOST_IP JDK64 rem start CUBEctrampconfigrunDrivercmd copy CUBEctrampserpm_abmproperties serpm_abmproperties Y ping -n 11 127001 gt nul CUBEctramprunSERPMAbmcmd SAMPLERATE VSAMPLERATE JDK64 CUBEctramprunCreateDemandMatricescmd SAMPLERATE VSAMPLERATE JDK64 taskkill im javaexe F rmdir OUTDIRctramp S Q rmdir DATADIRctramp S Q xcopy OUTDIRABMTEMPctramp OUTDIRctramp E I Y xcopy DATADIRABMTEMPctramp DATADIRctramp E I Y
ldquoOn the Flyrdquo Path Building
MAZ to MAZ Connectors
Created by finding shortest distance paths over an all-streets network Connects all MAZs within 15 mi
Used to represent walk mode distance and time
MAZ to TAP Connectors
Created by finding shortest distance paths over an all-streets network Connects each MAZ to all TAPs within 10 mi
Used to represent transit walk access and walk egress distance and time
TAZ to TAP Connectors
Connects each TAZ to all TAPs within the TAP maximum drive distance bull Bus TAPs ndash 4 miles bull Rail TAPs ndash 15 miles
Used to represent transit drive access and egress distance and time
ldquoOn the Flyrdquo Path Building
bull No actual links created on the network bull Connectivity is expressed in table format
ldquoOn the Flyrdquo Path Building
bull Once the access and walk connectors are created the mode choice model builds complete paths MAZ to MAZ transit paths
bull Local-only paths are built using the ldquolocalrdquo transit skim bull Express BRT Urban Rail and Commuter rail paths are all
built at the same time using the ldquopremiumrdquo transit skim bull For each MAZ to MAZ pair CT-RAMP keeps the shortest
generalized cost path for each available premium mode bull Even though only one ldquopremiumrdquo skim is built CT-RAMP
may find competing premium paths It may also find that the best path is a combination of two premium modes or a premium mode and local bus
Tour Mode Choice Model
Choice
Auto
Drive alone
GP(1)
Pay(2)
Shared ride 2
GP(3)
HOV(4)
Pay(5)
Shared ride 3+
GP(6)
HOV(7)
Pay(8)
Non-motorized
Walk(9)
Bike(10)
Transit
Walk access
Local bus(11)
Express bus(12)
BRT(13)
Urban rail(14)
Commuter rail(15)
PNR access
Local bus(16)
Express bus(17)
BRT(18)
Urban rail(19)
Commuter rail(20)
KNR access
Local bus(21)
Express bus(22)
BRT(23)
Urban rail(24)
Commuter rail(25)
School Bus(26)
Trip Mode Choice Model
bull Same nesting structure as the tour mode choice but conditional on the tour mode
bull Some trip modes may be unavailable depending on the tour mode
DA SR2 SR3+ Walk Wlk-Trn PNR-Trn KNR-Trn
DA Must - - - - - -
SR2 Can Can - Can - - -
SR3+ Can Can Can Can - - -
Walk - - - Must - - -
Wlk-Trn - Can Can Can Can - -
PNR-Trn Can Can Can Can Can Can
KNR-Trn - Can Can Can Can - Can
Trip Switching Rules Simplified
Transit Trip Reporting
bull In SERPM7 the transit boarding and alighting location can be reported in two ways ndash Trip list files (ABM output) -- Boarding TAP Alighting TAP
ndash Transit assignment (Cube output) ndash Route nodes
bull Each type of reporting has its strengths ndash Trip list file allows building detailed transit trip patterns for
population cohorts and time periods
bull Mode split reports
bull Transit trip distance frequency distributions access distance TLFDs
bull Mode to mode transfers
ndash Note ABM reports only the first boarding TAP and the last alighting TAP regardless of mode
ndash Cube output gives aggregate link volumes station to station boardings etc
User Benefit Files
bull SERPM7 can produce FTA User Benefit files for input to SUMMIT
bull User benefits remain a useful analysis tool bull Steps to produce user benefit files require some manual
intervention ndash see User Guide
SERPM ABM Reports
bull Stores ABM inputs and outputs in a relational database to generate some standard model reports
bull Consistent reporting framework to be used for analysis across model runs
bull SERPM7 user community can easily share the scripts that create the reports
bull Reports take the form of Excel workbooks bull Foundation for future development of a visualization
dashboard
Reporting Database Components
Reporting Database Components
bull Reporting ETL (extract transform and load) program ndash Loads all Cube and CT-RAMP Java model outputs into the database
ndash Written in Cube scripts and Java
bull Database ndash Stores all data used in reporting including select network skims
household person tour and trip data zonal data etc
ndash Implemented with SQL Server
bull Report scripts to generate reports ndash Written in T-SQL
bull Report packaging program ndash Generates Excel workbooks with one report per worksheet
ndash Written in Java
Reporting Database Components
bull Run time required to build database and generate reports varies with sample size and type of report ndash Several hours required to build the database for a 100 sample
ndash ~ 30 minutes to produce reports for a 10 sample
bull Report step is optional not part of a standard model run bull Report production is transparent to the user
bull hellip but users can contribute reports bull hellip and choose which reports to build at any one time
Running SERPM ABM Reports
bull Report queries reside in ctrampreports_sql time_spent_travelingsql Total weekday travel time by person type
and income group
total_trips_typesql Trips by trip mode person type county of residence and tour purpose
total_tours_typesql Tours by trip mode person type county of residence and tour purpose
tours_districtssql Tours by tour purpose and tour origin and destination districts
transit_access_time+distsql Drive to transit trip list with many trip details
hellip
Running SERPM ABM Reports
bull List of reports to run is specified in properties file ndash ctrampserpm_reportsproperties
sqlscriptsdirectory = Cserpm7ctrampreports_sql sqlscriptsschemakey = SCHEMA sqlscripts=cleanupsqltransit_access_time+distsql worksheettables=temptransittrips worksheetnames=TransitTrips workbookname = Cserpm7ctrampreports_sqlSERPM_REPORTXLS databaseschema = 2010R databaseipaddress = w-ampdx-d-sag10 databaseinstance = databaseport = 1433 databasename=SERPMABM databaseusername=serpm databasepassword=s3rpm
Adding Reports
bull Step 1 --Write report query ndash T-SQL
ndash User Guide includes a database data dictionary
bull Step 2 ndash Add query to ctrampreports_sql ndash Each query is contained in a single text file
ndash Drop file in reports folder
bull Step 3 ndash Add the query to the properties file sqlquery = Query file name
Worksheettables = Query output
Worksheetnames = Name for the report worksheet
Sample SERPM ABM Reports
bull Exhibit ctrampreports_sqlserpm_reportsxls
More information Shi-Chiang Li | shi-chianglidotstateflus |954 777 4655 Rosella Picado | picadopbworldcom | 206 382 5227 Ken Kaltenbach |kkaltenbachcorradinocom |502 587 7221

Monitoring Run Status
bull Exhibit cubeeventlog
Running SERPM7 ndash New Scenario
bull Step 1 ndash Create input and output scenario folders ndash Suggested scenario naming convention
bull inputIN-YEARALT
bull outputOUT-YEARALT
bull Copy all input files from an existing scenario including all subfolders
bull Update new scenario-specific files ndash Highway transit networks
ndash Household person synthetic population
ndash Land use data
bull Proceed with Steps 2 thru 6 for running an existing scenario
FDOT Servers Run Times
Feedback Loop End Time Runtime (HHMM)
RMSE (AM amp PM)
1 945 1045 1226 amp 1363
2 1648 703 060 amp 058
3 119 831 023 amp 020
4 806 647 012 amp 009
5 1458 652 008 amp 006
Total ~40 hrs
Model Server 3 20 Sample
FDOT WorkStation Run Times
Machine Sample Size Run Time (HHMM)
Model WorkStation
1 048
5 240
10 503
20 949
Model Server 3 20 400
CT-RAMP Only
Model Installation
SERPM7 Installation
bull Installation package and User Guide available from Florida DOT via FSUTMS Online
bull Hardware and software requirements and installation instructions described in User Guide
bull Sample model output available from Florida DOT
SERPM7 Installation
bull Hardware Requirements ndash 64-bit Operating System
ndash Intel Xeon X5690 347 GHz 6 core processors or similar
ndash Minimum 96 GB RAM
ndash Minimum 1 TB space for storing model output
bull Software ndash Cube 61 wcluster license
ndash SQL SQL Express
ndash Java
ndash Microsoft Excel (optional)
SERPM7 Installation
bull Step 1 ndash Create the Project Folder ndash Set user permission level to lsquoEveryonersquo
bull Step 2 ndash Configure the machines ndash Set environment variables
ndash Install Java and set its environment variables
ndash Verifyinstall Cube 64-bit matrix IO DLL
ndash Other hellip
bull Step 3 ndash Configure the JPPF services bull Step 4 ndash Configure the ldquoRunrdquo component files bull Step 5 ndash Configure SERPM7 in Application Manager bull Step 6 ndash Create the seed skims
Application 1 Working with a Population Sample
Working with a Population Sample
bull A simulation of the entire population is not required for every single application ndash Small sample sizes are sufficiently accurate for forecasting aggregate
region or county-wide statistics
ndash Small sample sizes save run time during model calibration and when testing initial versions of new networks and other input data
Working with a Population Sample
bull Developing a region-wide forecast using travel outcomes for a sample of the population is analogous to estimating region-wide travel statistics using a survey sample
Survey Simulation
Gathers trip diary information for a sample of households
Simulates trips for a sample of households
Typical sampling rate 020 - 025
Typical sampling rate 5 - 50
Estimates travel patterns for entire population by multiplying each surveyed trip record by an
expansion factor
Estimates travel patterns for entire population by multiplying each simulated trip record by an
expansion factor
Typical expansion factors 100 - 1000
Typical expansion factors 2 - 20
Working with a Population Sample
bull The ABM assumes that each household makes travel decisions independently of the decisions made by all other households
bull Households are simulated independently of each other bull The ABM samples randomly from the list of households to
select the ones it simulates bull It is prudent to verify that the selected population sample is
unbiased ndash A very small (1 or less) simple random sample is likely to be biased
for example it will likely mis-represent households that are found infrequently in the population
ndash Samples of 10 or more are typically sufficiently unbiased for travel demand forecasting applications
Working with a Population Sample
bull How big a sample to use ndash The more localized the expected impact of a project the larger the
required sample
bull Some recommendations ndash For model calibration and validation 10-25 is typically sufficient
ndash For comparing aggregate county-wide and sub-county average travel statistics 10 - 25
ndash For estimating daily traffic volumes on high capacity facilities and high capacity transit 25 - 50
ndash For traffic impact studies 50 - 100
bull hellip but testing highly encouraged
Working with a Population Sample
bull A sample expansion factor is applied when creating the trip tables for assignment
bull Expansion factor = 1samplingRate bull Loads on highway and transit networks are representative
of the entire population bull Summaries produced from the ABM list output need to be
expanded to be representative of the entire population
Running SERPM7 with a Population Sample
bull Setting the run ndash Set the sampling rate for residents and visitors in Cube
ndash All other model settings can remain unchanged
bull The same sampling rate is used on all feedback loops
Catalog Key Description
SAMPLERATE Sampling rate for the resident population
VSAMPLERATE Sampling rate for the visitor population
Running SERPM7 with a Population Sample
bull When working with a ldquoless than 100rdquo model run each record in the output list files has to be expanded by 1samplingRate ndash householdData_v1csv
ndash personData_v1csv
ndash indivTourFile_v1csv
ndash jointTourFile_v1csv
ndash indivTripFile_v1csv
ndash jointTripFile_v1csv
bull Trip tables are already expanded ndash TAZ_Demand_tmat
ndash TAP_Demand_tmat
Running SERPM7 with a Population Sample
bull Sample Output ndash County-wide highway assignment statistics
Screenline 25
Sample 50
Sample Diff ()
BOEW Northern SL along Pompano Canal 842418 843591 -01
BOEW Middle SL along Oakland Park Blvd 1187251 1183529 03
BOEW Southern SL along River Canal 881601 879618 02
BONS Western SL between I75 and TPK 586412 587353 -02
BONS Middle SL along TPK 1441311 1437065 03
BONS Eastern SL along Intracostal Wway 328855 326298 08
BOEW SL BOPB County Line 648960 648771 00
BOEW SL BOMD County Line 979327 976276 03
BOWestern Ext CL Collier County Line 31059 31059 00
BONS I-95 CL from Miami-Dade to I-595 510207 509537 01
BONS Western CL along SR897 frm PB-SR816 494591 495547 -02
Running SERPM7 with a Population Sample
Running SERPM7 with a Population Sample
Running SERPM7 with a Population Sample
bull Sample Output ndash Individual Route Boardings
Running SERPM7 with a Population Sample
bull Sample Output ndash Individual Route Boardings
Running SERPM7 with a Population Sample
bull Sample Output ndash Regionwide Household Income Profile
Household Income 25 Sample 100 Sample
Less than $10000 1015 1021
$10000 to $15000 470 468
$15000 - $20000 566 564
$20000 to $25000 519 516
$25000 to $30000 493 494
$30000 to $35000 475 477
$35000 to $40000 387 387
$40000 to $45000 343 345
$45000 to $50000 348 348
$50000 to $75000 1754 1747
$75000 to $100000 1432 1433
$100000 or More 2198 2200
Application 2 Population Synthesis
Population Synthesis
bull Each SERPM7 scenario requires a synthetic population ndash List of households -- hhFilecsv
ndash List of persons that make up the households -- personFilecsv
bull Two synthetic populations have been developed to date ndash 2010 base year population
ndash 2040 long range transportation plan population
Population Synthesis
bull New synthetic populations will be required for ndash Other regional scenario years (eg 2020 2025 2045)
ndash To test population and land use scenarios such as
bull Traffic impact study for a new housing or commercial development
bull Impact of aging population
bull Impact of rising sea levels (because some neighborhoods will no
longer be inhabitable)
bull Refinements to the 2010 and 2040 populations
Population Synthesis
bull The population synthesizer (PopSynII) does not run normally as part of SERPM7 ndash SERPM7 expects input population files in the input folder
ndash User is responsible for running PopSynII to generate the required population files and place them in the scenario folders prior to a SERPM7 run
bull Why ndash Because a new synthetic population is not required for every run
PopSyn II Setup
bull PopSynII is already configured to run on the FDOT servers bull Java application using SQL data storage
PopSynII installed in the main ctramp folder
PopSynII Setup
bull The ctramppopsyn folder
Filename Description
runAllPopsynbat Batch file that controls the execution of PopSynII
controls SQL settings file that specifies the population attributes used as controls
1_importCSVsql 2_createTargetssql 3_createSynHHPerFilessql
SQL scripts that run the PopSynII software
2010_TAZ_Datacsv TAZ input control data
2010_MAZ_Datacsv MAZ input control data
Developing a New Synthetic Population
bull Step 1 ndash Prepare the input files ndash TAZ controls 2010_taz_datacsv
ndash MAZ controls 2010_maz_datacsv
Developing a New Synthetic Population
bull MAZ Control input file eg 2010_maz_datacsv ndash Estimates of total households and persons living in group quarters
bull Total households
bull Total group quarter population
ndash One record for each MAZ
Developing a New Synthetic Population
bull TAZ Controls input file -- eg 2010_taz_datacsv ndash Estimates of number of households or population for each SERPM7
controlled attribute
bull Household size
bull Household income
bull Household workers
bull Type of dwelling unit
bull Presence of children in the household
bull Population age group
bull Gender
bull Raceethnicity
bull Population in group quarters
ndash One record per TAZ
Analogous to the TAZ SE data file in the trip-
based model
Developing a New Synthetic Population
When preparing TAZ and MAZ control data it is critically important to
maintain internal data consistency
Developing a New Synthetic Population
bull Some data checks to perform and problems to look out for ndash The household and person marginals pertain to household residents
only except for the group quarter controls
ndash All household-based marginals add up to the same total households for each TAZ
ndash All person-based marginals add up to the same total persons for each TAZ
ndash The total number of persons implied by the household size marginal is consistent with the sum total of the person marginals
ndash The total number of children obtained from the age marginal is consistent with the marginal of households by presence of children
ndash Large deviations from 5050 split of persons by gender is suspect
ndash The household income distribution is consistency with the workers-in-household distribution
Developing a New Synthetic Population
bull More data checks ndash The MAZ and TAZ controls should add up
bull to the same number of households by TAZ
bull to the same number of persons in group quarters by TAZ
Developing a New Synthetic Population
bull Exhibit ndash SERPM7 2010 TAZ control file
Example ndash Minto West Palm Beach Co
Example ndash Minto West
bull Mixed-use development in a agricultural area adjacent to an existing housing development
bull Information available from proposedapproved plans ndash Single-family dwelling units ndash 5050
ndash Multi-family dwelling units ndash 1040
ndash Total population ndash 14 535 persons
ndash Spatial location of dwelling units by type
bull Other PopSyn required data not available from plans (income distribution age distribution etc) ndash Estimateassert it based on similar existing developments
surrounding neighborhood
Example ndash Minto West
bull Adding householdspersons to a TAZ
bull Adding TAZs or MAZs to SERPM7 should be a rare occurrence ndash Households are ultimately allocated to MAZs and therersquos already
12000 of them
ndash Households are represented individually so the zone attributes are derived from them
Trip-Based Model Modify the input zonal data file
Activity-Based Model Modify the population synthesis control file
Running PopSynII
bull Step 2 ndash Modify the PopSyn settings file for this run ndash Update TAZ and MAZ control filenames in runAll_popsynbat
REM BATCH FILE TO SETUP POPSYN RUN RUN POPSYNII AND OUTPUT CSV FILES REM SETUP REM PLEASE SET PATH NAMES FOR WORKING FOLDER AND CSV FILE LOCATIONS SET SERVERNAME=W-AMSTL-D-00052SQLEXPRESS SET DATABASENAME=popSyn SET ARCPATH=Cpopsyn SET CSVPATH_CONTROLS=Cpopsyninputscontrolscsv SET CSVPATH_MAZ=Cpopsyninputs2010_MAZ_Data_20120207csv SET CSVPATH_TAZ=Cpopsyninputs2010_TAZ_Data_20120207csv REM MAIN SCRIPT REM MAKE FILENAMES TABLE REM sqlcmd -S SERVER NAME -E -i INPUT FILE PATH (SCRIPT) -o OUTPUT LOG REM -E means to use Windows authentication for the user that is running the batch file SQLCMD -S SERVERNAME -d DATABASENAME -E -Q IF OBJECT_ID(dbocsv_filenames) IS NOT NULL DROP TABLE csv_filenames -o ARCPATHResultLogtxt
hellip hellip
Running PopSynII
bull Other PopSyn settings ndash rarely used in a production run ndash Change the control attributes
ndash Change the priority of control attributes
Running PopSynII
bull Step 3 ndash Run PopSynII -- runAll_popsynbat
Running PopSynII
bull Step 4 ndash Review Output amp Check Fit to Controls
Output File Description
hhFilecsv List of households
personFilecsv List of persons
ZoneResultscsv Comparisons of synthetized households to controlled and uncontrolled attributes
BalanceDetailscsv
ValidationStatscsv
ValidationStatsByPumacsv
Reviewing PopSyn Output
bull Zone_Resultscsv bull Comparison of synthesized totals to target totals for each
TAZ and controlled attribute
TOTAL_HOUSEHOLDS
ZONE TARGET SYNTHESIZED DIFFERENCE PCTDIFF
1 715 715 0 0
2 811 811 0 0
3 878 878 0 0
4 826 826 0 0
5 1181 1181 0 0
6 212 212 0 0
7 459 459 0 0
8 253 253 0 0
Reviewing PopSyn Output
bull Balance_Detailscsv bull Same output as Zone_Results different format
Zone Control ID ControlCat Target PUMSVal ConStat
1989 109 TOTAL_HOUSEHOLDS 1508 1508 yes
1989 249 INCOME_25K 273 271 no
1989 19 HHSIZE_4PLUS 467 467 yes
1989 160 FEMALE 2196 2108 no
1989 55 INCOME_100K 258 257 yes
1989 67 MULTI_UNIT 423 407 no
1989 31 WORKERS_3PLUS 164 166 no
Reviewing PopSyn Output
bull Validation_Statscsv ndash Comparison of synthesized attributes to input Census data (5 PUMS)
ndash Includes uncontrolled attributes
Description popSynSum censusSum meanDiff stdDev minDiff maxDiff Universe 1 number of households 2085375 1964881 17 61 -97 331
family 67 65 3 17 -26 48
non family 33 35 0 34 -58 111
size 1 27 28 0 36 -59 111
size 2 31 32 -3 14 -30 30
size 3 17 17 1 22 -37 53
size 4 25 23 18 50 -46 160
Reviewing PopSyn Output
bull Validation_StatsByPumacsv ndash Same as validation_stats but for each PUMA
bull Note that synthesized population may differ from 5 Census population by design
Application 3 ndash Highway Project
Highway Project
Example Projects ndashToll road extension ndashReversible lanes ndashManaged lanes
Overview
How to use SERPM7 to perform a model run and do some standard analysis ndash Option 1 -- Code the project directly on the geodatabase
bull Roadway links
bull Node links
bull Turn penalties
bull [assume no change to transit]
ndash Option 2 --Code the project on net files and then build the geodatabase
bull Use flowchart script to build the geodatabase
ndash Coding is very similar to earlier versions of SERPM
bull Facility types are the same
SERPM Facility Types (not new)
Editing the Highway Network
bull SERPM 7 requires a geodatabase bull Editing can be done either to a net file or directly on the
geodatabase bull The user can use utilities in the model flowchart to write a
net file from the geodatabase edit the net and then write it to the geodatabase
bull The geodatabase must exist to run the model
Editing in the Geodatabase
bull Simplest and most direct method bull Requires an understanding of the CubeArcGIS tools
Export geodatabase and edit as a net
bull Start Data Manager bull Open geodatabase (SERPM_NETSMDB) bull Double click on the network Input Hwy Net and specify an
output file (maybe ldquoeditnetrdquo) bull Open from Cube and edit as usual bull Use ldquoPrepare for Model Run and Trap Errorsrdquo (2) utilities to
write back to geodatabase ndash Reload geodatabase from Cube files ndash Cull and sort
ndash Write to geodatabase
Edit as a net
Export Edit in Cube
Change to point to edited network
Input Hwy Net
Toll Road Extension
bull Short Cut ndash copy an existing toll link bull No special NODE attributes bull Only new attribute is ISTOLL=1 for all links that could not be
used unless a toll were paid bull Toll Mainline FTC2=91 ISTOLL=1 DIRCODE=1 bull Plaza (gantry) ndash assume all will be electronic collection ndash TOLL=1 DIRCODE=1
ndash TOLLTYPE=3 CARTOLL=toll in dollars
ndash FTC2=95
ndash ISTOLL=1
ndash SVCSECONDS=001
ndash DELCODE=1 ACCELCODE=1 AVILANES=2
Toll Road Extension
Not much different from earlier versions of SERPM
Reversible Lanes
bull Control by the link attribute REVERSIBLE ndash REVERSIBLE=1 means AM operation only
ndash REVERSIBLE=2 means PM operation only
ndash I-595 example
Managed Lanes (typically Express)
bull HOT=1 ndash 98 (99 makes the link a dummy) bull FTC2 most likely=91 but other types permitted bull TOLL=0 ISTOLL=0 bull Tolls set by HOTTOLLdbf
HOT Lanes Tolls
bull Set as a function of the VC bull Updated in the travel time feedback loop bull Affects the TollFree split in mode choice bull Column HOT_x were x=HOT link attribute bull HOT_1 is the current 95 Express rate HOT_2 is a placeholder
Common Errors
bull Errors to watch out for ndash If network steps fail look for missing attributes
ndash Update transit routes as needed due to changes to underlying highway network
ndash Check for dangling links and unconnected zones
ndash Verify that all TAZs are connected to lsquofreersquo roads
bull Special procedures required for TAZs that have toll-only access must
include the attribute ISRCTOLLINK=1 (currently used for the
Rickenbacker Causeway)
ndash Some CT-RAMP errors caused by network coding errors may not be apparent until feedback loop 2 because in loop 1 CT-RAMP uses seed skims
bull Use small sample size when testing a new network
Was the Run Successful
bull Did the run converge ndash AM and PM travel time RMSE values reported to
OUTDIRfeedbacklogprn
ndash Run stops when RMSE is less than 01
ndash 2010 Scenario converges in 5 loops
bull What to do if it didnrsquot converge ndash Look for obvious errors
ndash Run more iterations (future year might require more)
bull Are the top-level results comparable to a similar run ndash Use HEVAL reports
ndash Examine screenlines (RMSE reports)
ndash Spot check link loads
Tools for Analysis
bull Analysis ndash perform standard highway project type analyses
bull Usual analysis similar to trip-based model ndash Total daily and period-specific roadway volumes and speeds by
vehicle class
ndash Vehicle trip OD matrices
bull Standard FSUTMS HEVAL and RMSE reports are still available ndash Day and period assignments
ndash By County
ndash Truck assignment
Tools for Analysis
bull Potential for customized assignment classes to address
specific project questions ndash Does the manage lane serve primarily high income users
bull Stratify vehicle classes by lowhigh income to understand facility
usage by income level
bull Stratify vehicle classes by disadvantaged population cohorts
bull Trip and person tabulations built from ABM output ndash Trip mode shares for many different population cohorts subareas
ndash For example toll vs non-toll shares by value of time or fine-graded income levels
ndash Many other possibilities
Application 4 ndash Mobility Project
Mobility Project ndash SUNPASS Market Share
bull Persons in households that own a SUNPASS transponder respond differently to managed lane and toll road policies ndash Pay lower tolls than cash users
ndash Have access to I-95 managed lanes
bull Policy questions ndash How does projected toll traffic and revenue vary with the SUNPASS
penetration rate and toll discount
ndash How will SUNPASS penetration rate vary as more managed lane facilities are built in the region
Mobility Project ndash SUNPASS Market Share
bull Question 1 -- How does projected toll traffic and revenue vary with the SUNPASS penetration rate and toll discount
bull Procedure ndash Step1 ndash Assume a SUNPASS market share by modifying the toll
transponder model
ndash Step 2 ndash Run SERPM7 to produce traffic volumes
ndash Step 3 ndash Estimate toll traffic revenue
Modifying the Toll Transponder Ownership Model
bull Model specification is contained in TransponderOwnershipxls and can be edited with Microsoft Excel
Utility Variable Coefficient
Expected time savings up to 644 min 00631
Distance less than 5 miles -00304
Distance between 5 and 10 miles -00648
Distance 10 miles or more -00648
Constant 04877
Modifying the Toll Transponder Ownership Model
Utility Variable Coefficient
Expected time savings up to 644 min 00631
Distance less than 5 miles -00304
Distance between 5 and 10 miles -00648
Distance 10 miles or more -00648
Constant 04877
Increasing the constant will increase the number of households equipped with transponders
TransponderOwnershipxls
Modifying the Toll Transponder Model
bull Increase the constant by how much ndash Process is akin to model calibration
ndash Several runs of the transponder model required to estimate the constant that yields the desired market share
ndash 2010 market share is approximately 65
ndash Use a small sample (5 or 10) to save run-time while establishing the right constant
Modifying the Toll Transponder Model
bull Variation ndash Add terms to the model so that certain types of households are more
likely to exhibit a SUNPASS market share increase
bull Highlow income households
bull Multi-car households
bull Miami-Dade households
Modifying the Toll Transponder Model
bull Exhibit TransponderOwnershipxls
Mobility Project ndash SUNPASS Market Share
bull Question 2 -- How will SUNPASS penetration rate vary as more managed lane facilities are built in the region
bull Procedure ndash Step 1 ndash Code the manage lane facilities
ndash Step 2 ndash Run SERPM7 to forecast transponder ownership
ndash Step 3 ndash Analyze the forecast household data for changes in the profile of households equipped with transponders
Application 5 ndash Land Use Project
Land Use Project
bull Transportation projects comprise not only network scenarios but also land use scenarios
bull Land use scenarios can be ndash Very large scale (substantial changes to housing and employment
estimates throughout the region) or
ndash Small scale (localized changes for example for a traffic impact study)
bull For both large scale and small scale land use updates the
general procedure for updating the input data and running the model is the same
Land Use Project
bull The land use data in SERPM7 consists of ndash Synthetic population and derived input files
ndash Employment data
ndash School enrollment data
ndash Parking costs and parking spaces
ndash Regional shopping mall special generators
ndash Beach special generators
ndash Hotel and motel room data
Land Use Project
bull The land use data reside in different input files
Data Item Input File
Synthetic Population hhFilecsv personFilecsv ctramppopsynTAZDatacsv ctramppopsynMAZDatacsv
Employment School Enrollment Parking Supply Data Special Generators Hotel and Motel Rooms
inputsIN-2010Rmaz_datacsv
Land Use Project
bull As demonstrated earlier SERPM 7 requires significantly more comprehensive socio-economic inputs as compared to previous versions ndash Greater spatial detail
ndash More categoriestypes of land uses
bull These inputs require additional preparation when
performing land use model runs
Land Use Project
Data Required and examples bull Population
bull Age distribution of the population expected to live in the
development
bull Income profile
bull Type of dwelling unit (single-family vs multi-family)
ndash The input data need to be internally consistent (distribution of households by presence of children needs to be consistent with population age distribution for example)
Land Use Project
Data Required bull Employment classification ndash Previous models had three
employment classifications
ndash In SERPM 7 there are 16 employment categories to better differentiate type of land use and improve the relationship between land use and activity purpose
Land Use Project
Data Required bull School enrollment ndash note that it differentiates by grade level
(K-8 high-school collegepost-secondary) ndash Donrsquot forget to include school faculty and staff in employment
Land Use Project
Data Required bull Parking supply and
parking costs ndash Parking spaces may
reflect use restrictions
bull Monthly
bull Daily
bull Hourly
ndash Parking costs consistent with type of use
Land Use Project
bull Park Area 1 (pink) ndash May park in MAZ other
than destination MAZ
ndash Parking cost applies
bull Park Area 2 (gree) ndash Parks at destination MAZ
ndash Parking cost applies
Land Use Project
Data Required bull Visitor Model ndash Number of hotel and motel rooms
bull Special Generators ndash Regional shopping malls
ndash Beach recreation areas
Land Use Project
The Gardens Mall Aventura Mall
Boynton Mall Dolphin Mall
Delray Community Mall Dadeland Mall
Towncenter Mall The Falls Shopping Center
Wellington Greens Mall Cutler Ridge Mall
Coral Square Mall Bal Harbour Shops
Pompano Citi Centre CocoWalk
Sawgrass Mills Mall The Mall at 163rd Street
Broward Mall Mall of the Americas
Galleria Mall Mary Brickell Village
Pembroke Lakes Mall Miami International Mall
Lakes Mall Miracle Marketplace
Oakwood Plaza Village of Merrick Park
The Promenade at Coconut Creek Westland Mall
Regional Shopping Mall Special Generators
Land Use Project
Deerfield Beach
Pompano Beach
Fort Lauderdale Beach
Fort Lauderdale Beach
Hollywood Beach
South Beach
Haulover Beach
Crandon Park
Dania Beach
Bill Baggs State Park
Beach Special Generators
Land Use Project
Sample Problem
bull MINTO West Example - a mixed residentialcommercial development ndash 6500 singlemulti-family residential units in multiple TAZs
ndash 14 million square feet of non-residential space
ndash 150 room hotel
ndash 3000 student college campus
Land Use Project
MINTO WEST
Land Use Project
TAZsMAZs representing MINTO West Development
Land Use Project
Need to translate population household and employment information from developer into model input data ndash As discussed in the Population Synthesis presentation population and
household attribute estimates can be taken from other known nearby neighborhoods
bull In this sample problem first start by allocating percentages of total
households into individual MAZs within the development area
bull Keep in mind household density when estimating the number of
households in each MAZ
Land Use Project
bull In this sample employment can be assumed to include bull Retail
bull RestaurantsBars
bull Offices
bull Health services
bull Hotelmotel employment and
bull Educational employment
ndash As with households yoursquoll need to apportion the employment areas to individual MAZs while keeping in mind the types of employment expected in those locations
Land Use Project
bull Employment data is usually estimated by converting floor space available to individual types of employment through conversion factors
bull ie ndash (3000 sqft office space)(20 sqft per office employee) =
150 office employees
Land Use Project
bull Once population household and employment figures are estimated they are entered into the appropriate model input file
bull Population ndash TAZ synthetic population control file
bull Household ndash TAZ synthetic population control file
bull Employment School Parking and Special Gen ndash maz_datacsv
bull Ensure that population household and employment figures
are the same in each file
bull Prior to performing model run PopSyn must be run and user must copy output files to SERPM7 input folders
Application 6 ndashTransit Project
Transit Project ndash MetroRail North Corridor
SERPM Transit Modes
Transit Mode Tour and Trip
Mode TAP Transit Skim Mode
Tri-Rail Commuter Rail Premium
Metrorail Urban Rail Premium
I-95 Inter-County Express I-95X I-95E
Express Bus Premium
Busway BRT Premium
MDT Express Express Bus Premium
Metromover Local Bus Local Bus
MDT Local BCT Local
Palm Tran Local Local Bus Local Bus
Breeze Local Bus Local Bus
Tri-Rail Shuttles Local Bus Local Bus
SERPM Transit Modes
Transit Mode Tour and Trip
Mode TAP Transit Skim
Mode
Mode coded on the route ldquocardsrdquo
Used to specify boarding and transfer penalties for transit
path building
(most disaggregate)
Line-haul choices in the tour and trip mode choice
models
Used to create sets of TAP to TAP levels of service
(most aggregate)
Similar to SERPM 67 SERPM 7 ABM
SERPM Transit Modes S67 Mode Local (L) S7
Mode Mode Name Operator amp Name UserA4 Name Prem (P) MODE
15 Tri-Rail 11 Tri-Rail 15 Commuter P 111
14 Metrorail 25 Metrorail 14 Urban Rail P 121
X Regional LRT Regional LRT 14 LRT P 131
16 Inter-County Express Bus 33 I-95 Inter-County Express 16 Express P 151
12 Exclusive ROW Cir-Reg 13 Exclusive ROW Cir-Reg 12 Mover L 181
11 TrolleysShuttles-Reg 12 Tri-Rail Shuttles 11 Local L 191
11 TrolleysShuttles-Reg 12 Tri-Rail Shuttles 33 Local L 192
X LRT- MDT 25 MDT LRT 14 LRT P 231
16 Buses (localexpress) - MDT 27 MDT Busway Flyers 27 BRT P 241
23 Buses (localexpress) - MDT 27 MDT MAXKATBusway Local 27 BRT P 242
24 BRT - MDT 28 MDT BRTLRT 28 BRT P 243
23 Buses (localexpress) - MDT 22 MDT Express 24 Express P 251
16 Buses (localexpress) - MDT 24 MDT I-95 Exp 26 Express P 252
16 Inter-County Express Bus 24 I-95 Inter-County Express 16 Express P 253
22 Exclusive ROW Cir-MDT 26 Metromover 22 Mover L 281
21 TrolleysShuttles-MDT 21 MDT TrolleysShuttles 21 Local L 291
23 Buses (localexpress) - MDT 21 MDT Local 23 Local L 292
23 Buses (localexpress) - MDT 23 MDT Shuttle 25 Local L 293
X LRT - BCT 35 BCT LRT 37 LRT P 331
34 BCT Rapid Bus BRT 34 BCT Rapid Bus 36 BRT P 341
34 BCT Fixed-guideway BRT 35 BCT BRT 37 BRT P 342
33 Buses (localexpress) - BCT 32 BCT Breeze 34 Express P 351
33 Buses (localexpress) - BCT 33 BCT Express 35 Express P 352
32 Exclusive ROW Cir-BCT 31 BCT Exclusive ROW Cir 32 Mover L 381
31 TrolleysShuttles-BCT 31 BCT TrolleysShuttles 31 Local L 393
33 Buses (localexpress) - BCT 31 BCT Local 27 Local L 391
33 Buses (localexpress) - BCT 31 BCT Local 33 Local L 392
X LRT - Palm Tran 43 Palm Tran LRT 44 LRT P 431
44 BRT - Palm Tran 43 Palm Tran BRT 44 BRT P 441
43 Buses (localexpress) - Ptran 42 Palm Tran Exp 44 Express P 451
42 Exclusive ROW Cir-PTran 41 Palm Tran Exclusive ROW Cir 42 Mover L 481
41 TrolleysShuttles-Ptran 41 Palm Tran TrolleysShuttles 41 Local L 491
43 Buses (localexpress) - Ptran 41 Palm Tran Local 43 Local L 492
Modes Not in the 2010 Network
SERPM7 Transit Network Building
bull Typically bus routes are coded on top of existing highway links
bull SERPM7 reserves some facility type codes for transit-only use helpful to more accurately represent route ndash Caution -- make sure network integrity is preserved once transit only
links are removed
bull Rail routes require coding first fixed-guideway links
SERPM7 Transit Network Building
bull Route Attributes -- User Coded ndash Name
ndash Long Name
ndash Mode
ndash Operator
ndash Headway[1] ndash AM Peak
ndash Headway[2] ndash Midday
ndash Headway[3] ndash PM Peak
ndash UserA4 (stop dwell time)
SERPM7 Transit Network Building
bull PNR Node Attributes ndash User Coded ndash Parking Spaces
ndash Parking Cost AM
ndash Parking Cost MD
ndash Terminal Time PNR
ndash Terminal Time KNR
bull At this time parking spaces is used only to identify park-n-ride locations (parking spaces gt 0)
SERPM7 Transit Network Building
bull Transit Access Points -- Created by Cube for the ABM ndash One TAP for each stop on premium routes
bull Tri-Rail Metrorail Express Bus BRT
ndash One TAP for each Local Bus park-n-ride node
ndash Synthesized TAPs to represent access to local bus stops
bull Transit Access Point Attributes ndash TAP Mode
ndash Inherit PNR node data
Sample Highway Network with TAPs
TAPs become part of the highway network and replace the TAZ centroids when building transit skims
Transit Access Points and ldquoon the flyrdquo Path Building
bull Transit skims are built TAP to TAP
Matrix origins and destinations are TAPS
Transit Access Points and ldquoon the flyrdquo Path Building
Trip Origins and
Destinations
MAZ to MAZ
Auto Skims
TAZ to TAZ
Transit Skims
TAP to TAP
The three spatial systems are put together by the mode choice model
ldquoOn the Flyrdquo Path Building
bull TAZs TAPs and MAZs are linked via drive and access connectors prior to running CT-RAMP
rmdir OUTDIRABMTEMP S Q rmdir DATADIRABMTEMP S Q xcopy OUTDIR OUTDIRABMTEMP E I Y xcopy DATADIR DATADIRABMTEMP E I Y if(fbi=1) need to run only the first time through - kdk CUBEctramprunCreateAccessFilescmd endif mkdir logFiles taskkill im javaexe F start CUBEctramprunHhMgrcmd JDK64 HOST_IP start CUBEctramprunMtxMgrcmd HOST_IP JDK64 rem start CUBEctrampconfigrunDrivercmd copy CUBEctrampserpm_abmproperties serpm_abmproperties Y ping -n 11 127001 gt nul CUBEctramprunSERPMAbmcmd SAMPLERATE VSAMPLERATE JDK64 CUBEctramprunCreateDemandMatricescmd SAMPLERATE VSAMPLERATE JDK64 taskkill im javaexe F rmdir OUTDIRctramp S Q rmdir DATADIRctramp S Q xcopy OUTDIRABMTEMPctramp OUTDIRctramp E I Y xcopy DATADIRABMTEMPctramp DATADIRctramp E I Y
ldquoOn the Flyrdquo Path Building
MAZ to MAZ Connectors
Created by finding shortest distance paths over an all-streets network Connects all MAZs within 15 mi
Used to represent walk mode distance and time
MAZ to TAP Connectors
Created by finding shortest distance paths over an all-streets network Connects each MAZ to all TAPs within 10 mi
Used to represent transit walk access and walk egress distance and time
TAZ to TAP Connectors
Connects each TAZ to all TAPs within the TAP maximum drive distance bull Bus TAPs ndash 4 miles bull Rail TAPs ndash 15 miles
Used to represent transit drive access and egress distance and time
ldquoOn the Flyrdquo Path Building
bull No actual links created on the network bull Connectivity is expressed in table format
ldquoOn the Flyrdquo Path Building
bull Once the access and walk connectors are created the mode choice model builds complete paths MAZ to MAZ transit paths
bull Local-only paths are built using the ldquolocalrdquo transit skim bull Express BRT Urban Rail and Commuter rail paths are all
built at the same time using the ldquopremiumrdquo transit skim bull For each MAZ to MAZ pair CT-RAMP keeps the shortest
generalized cost path for each available premium mode bull Even though only one ldquopremiumrdquo skim is built CT-RAMP
may find competing premium paths It may also find that the best path is a combination of two premium modes or a premium mode and local bus
Tour Mode Choice Model
Choice
Auto
Drive alone
GP(1)
Pay(2)
Shared ride 2
GP(3)
HOV(4)
Pay(5)
Shared ride 3+
GP(6)
HOV(7)
Pay(8)
Non-motorized
Walk(9)
Bike(10)
Transit
Walk access
Local bus(11)
Express bus(12)
BRT(13)
Urban rail(14)
Commuter rail(15)
PNR access
Local bus(16)
Express bus(17)
BRT(18)
Urban rail(19)
Commuter rail(20)
KNR access
Local bus(21)
Express bus(22)
BRT(23)
Urban rail(24)
Commuter rail(25)
School Bus(26)
Trip Mode Choice Model
bull Same nesting structure as the tour mode choice but conditional on the tour mode
bull Some trip modes may be unavailable depending on the tour mode
DA SR2 SR3+ Walk Wlk-Trn PNR-Trn KNR-Trn
DA Must - - - - - -
SR2 Can Can - Can - - -
SR3+ Can Can Can Can - - -
Walk - - - Must - - -
Wlk-Trn - Can Can Can Can - -
PNR-Trn Can Can Can Can Can Can
KNR-Trn - Can Can Can Can - Can
Trip Switching Rules Simplified
Transit Trip Reporting
bull In SERPM7 the transit boarding and alighting location can be reported in two ways ndash Trip list files (ABM output) -- Boarding TAP Alighting TAP
ndash Transit assignment (Cube output) ndash Route nodes
bull Each type of reporting has its strengths ndash Trip list file allows building detailed transit trip patterns for
population cohorts and time periods
bull Mode split reports
bull Transit trip distance frequency distributions access distance TLFDs
bull Mode to mode transfers
ndash Note ABM reports only the first boarding TAP and the last alighting TAP regardless of mode
ndash Cube output gives aggregate link volumes station to station boardings etc
User Benefit Files
bull SERPM7 can produce FTA User Benefit files for input to SUMMIT
bull User benefits remain a useful analysis tool bull Steps to produce user benefit files require some manual
intervention ndash see User Guide
SERPM ABM Reports
bull Stores ABM inputs and outputs in a relational database to generate some standard model reports
bull Consistent reporting framework to be used for analysis across model runs
bull SERPM7 user community can easily share the scripts that create the reports
bull Reports take the form of Excel workbooks bull Foundation for future development of a visualization
dashboard
Reporting Database Components
Reporting Database Components
bull Reporting ETL (extract transform and load) program ndash Loads all Cube and CT-RAMP Java model outputs into the database
ndash Written in Cube scripts and Java
bull Database ndash Stores all data used in reporting including select network skims
household person tour and trip data zonal data etc
ndash Implemented with SQL Server
bull Report scripts to generate reports ndash Written in T-SQL
bull Report packaging program ndash Generates Excel workbooks with one report per worksheet
ndash Written in Java
Reporting Database Components
bull Run time required to build database and generate reports varies with sample size and type of report ndash Several hours required to build the database for a 100 sample
ndash ~ 30 minutes to produce reports for a 10 sample
bull Report step is optional not part of a standard model run bull Report production is transparent to the user
bull hellip but users can contribute reports bull hellip and choose which reports to build at any one time
Running SERPM ABM Reports
bull Report queries reside in ctrampreports_sql time_spent_travelingsql Total weekday travel time by person type
and income group
total_trips_typesql Trips by trip mode person type county of residence and tour purpose
total_tours_typesql Tours by trip mode person type county of residence and tour purpose
tours_districtssql Tours by tour purpose and tour origin and destination districts
transit_access_time+distsql Drive to transit trip list with many trip details
hellip
Running SERPM ABM Reports
bull List of reports to run is specified in properties file ndash ctrampserpm_reportsproperties
sqlscriptsdirectory = Cserpm7ctrampreports_sql sqlscriptsschemakey = SCHEMA sqlscripts=cleanupsqltransit_access_time+distsql worksheettables=temptransittrips worksheetnames=TransitTrips workbookname = Cserpm7ctrampreports_sqlSERPM_REPORTXLS databaseschema = 2010R databaseipaddress = w-ampdx-d-sag10 databaseinstance = databaseport = 1433 databasename=SERPMABM databaseusername=serpm databasepassword=s3rpm
Adding Reports
bull Step 1 --Write report query ndash T-SQL
ndash User Guide includes a database data dictionary
bull Step 2 ndash Add query to ctrampreports_sql ndash Each query is contained in a single text file
ndash Drop file in reports folder
bull Step 3 ndash Add the query to the properties file sqlquery = Query file name
Worksheettables = Query output
Worksheetnames = Name for the report worksheet
Sample SERPM ABM Reports
bull Exhibit ctrampreports_sqlserpm_reportsxls
More information Shi-Chiang Li | shi-chianglidotstateflus |954 777 4655 Rosella Picado | picadopbworldcom | 206 382 5227 Ken Kaltenbach |kkaltenbachcorradinocom |502 587 7221

SERPM7 Installation
bull Step 1 ndash Create the Project Folder ndash Set user permission level to lsquoEveryonersquo
bull Step 2 ndash Configure the machines ndash Set environment variables
ndash Install Java and set its environment variables
ndash Verifyinstall Cube 64-bit matrix IO DLL
ndash Other hellip
bull Step 3 ndash Configure the JPPF services bull Step 4 ndash Configure the ldquoRunrdquo component files bull Step 5 ndash Configure SERPM7 in Application Manager bull Step 6 ndash Create the seed skims
Application 1 Working with a Population Sample
Working with a Population Sample
bull A simulation of the entire population is not required for every single application ndash Small sample sizes are sufficiently accurate for forecasting aggregate
region or county-wide statistics
ndash Small sample sizes save run time during model calibration and when testing initial versions of new networks and other input data
Working with a Population Sample
bull Developing a region-wide forecast using travel outcomes for a sample of the population is analogous to estimating region-wide travel statistics using a survey sample
Survey Simulation
Gathers trip diary information for a sample of households
Simulates trips for a sample of households
Typical sampling rate 020 - 025
Typical sampling rate 5 - 50
Estimates travel patterns for entire population by multiplying each surveyed trip record by an
expansion factor
Estimates travel patterns for entire population by multiplying each simulated trip record by an
expansion factor
Typical expansion factors 100 - 1000
Typical expansion factors 2 - 20
Working with a Population Sample
bull The ABM assumes that each household makes travel decisions independently of the decisions made by all other households
bull Households are simulated independently of each other bull The ABM samples randomly from the list of households to
select the ones it simulates bull It is prudent to verify that the selected population sample is
unbiased ndash A very small (1 or less) simple random sample is likely to be biased
for example it will likely mis-represent households that are found infrequently in the population
ndash Samples of 10 or more are typically sufficiently unbiased for travel demand forecasting applications
Working with a Population Sample
bull How big a sample to use ndash The more localized the expected impact of a project the larger the
required sample
bull Some recommendations ndash For model calibration and validation 10-25 is typically sufficient
ndash For comparing aggregate county-wide and sub-county average travel statistics 10 - 25
ndash For estimating daily traffic volumes on high capacity facilities and high capacity transit 25 - 50
ndash For traffic impact studies 50 - 100
bull hellip but testing highly encouraged
Working with a Population Sample
bull A sample expansion factor is applied when creating the trip tables for assignment
bull Expansion factor = 1samplingRate bull Loads on highway and transit networks are representative
of the entire population bull Summaries produced from the ABM list output need to be
expanded to be representative of the entire population
Running SERPM7 with a Population Sample
bull Setting the run ndash Set the sampling rate for residents and visitors in Cube
ndash All other model settings can remain unchanged
bull The same sampling rate is used on all feedback loops
Catalog Key Description
SAMPLERATE Sampling rate for the resident population
VSAMPLERATE Sampling rate for the visitor population
Running SERPM7 with a Population Sample
bull When working with a ldquoless than 100rdquo model run each record in the output list files has to be expanded by 1samplingRate ndash householdData_v1csv
ndash personData_v1csv
ndash indivTourFile_v1csv
ndash jointTourFile_v1csv
ndash indivTripFile_v1csv
ndash jointTripFile_v1csv
bull Trip tables are already expanded ndash TAZ_Demand_tmat
ndash TAP_Demand_tmat
Running SERPM7 with a Population Sample
bull Sample Output ndash County-wide highway assignment statistics
Screenline 25
Sample 50
Sample Diff ()
BOEW Northern SL along Pompano Canal 842418 843591 -01
BOEW Middle SL along Oakland Park Blvd 1187251 1183529 03
BOEW Southern SL along River Canal 881601 879618 02
BONS Western SL between I75 and TPK 586412 587353 -02
BONS Middle SL along TPK 1441311 1437065 03
BONS Eastern SL along Intracostal Wway 328855 326298 08
BOEW SL BOPB County Line 648960 648771 00
BOEW SL BOMD County Line 979327 976276 03
BOWestern Ext CL Collier County Line 31059 31059 00
BONS I-95 CL from Miami-Dade to I-595 510207 509537 01
BONS Western CL along SR897 frm PB-SR816 494591 495547 -02
Running SERPM7 with a Population Sample
Running SERPM7 with a Population Sample
Running SERPM7 with a Population Sample
bull Sample Output ndash Individual Route Boardings
Running SERPM7 with a Population Sample
bull Sample Output ndash Individual Route Boardings
Running SERPM7 with a Population Sample
bull Sample Output ndash Regionwide Household Income Profile
Household Income 25 Sample 100 Sample
Less than $10000 1015 1021
$10000 to $15000 470 468
$15000 - $20000 566 564
$20000 to $25000 519 516
$25000 to $30000 493 494
$30000 to $35000 475 477
$35000 to $40000 387 387
$40000 to $45000 343 345
$45000 to $50000 348 348
$50000 to $75000 1754 1747
$75000 to $100000 1432 1433
$100000 or More 2198 2200
Application 2 Population Synthesis
Population Synthesis
bull Each SERPM7 scenario requires a synthetic population ndash List of households -- hhFilecsv
ndash List of persons that make up the households -- personFilecsv
bull Two synthetic populations have been developed to date ndash 2010 base year population
ndash 2040 long range transportation plan population
Population Synthesis
bull New synthetic populations will be required for ndash Other regional scenario years (eg 2020 2025 2045)
ndash To test population and land use scenarios such as
bull Traffic impact study for a new housing or commercial development
bull Impact of aging population
bull Impact of rising sea levels (because some neighborhoods will no
longer be inhabitable)
bull Refinements to the 2010 and 2040 populations
Population Synthesis
bull The population synthesizer (PopSynII) does not run normally as part of SERPM7 ndash SERPM7 expects input population files in the input folder
ndash User is responsible for running PopSynII to generate the required population files and place them in the scenario folders prior to a SERPM7 run
bull Why ndash Because a new synthetic population is not required for every run
PopSyn II Setup
bull PopSynII is already configured to run on the FDOT servers bull Java application using SQL data storage
PopSynII installed in the main ctramp folder
PopSynII Setup
bull The ctramppopsyn folder
Filename Description
runAllPopsynbat Batch file that controls the execution of PopSynII
controls SQL settings file that specifies the population attributes used as controls
1_importCSVsql 2_createTargetssql 3_createSynHHPerFilessql
SQL scripts that run the PopSynII software
2010_TAZ_Datacsv TAZ input control data
2010_MAZ_Datacsv MAZ input control data
Developing a New Synthetic Population
bull Step 1 ndash Prepare the input files ndash TAZ controls 2010_taz_datacsv
ndash MAZ controls 2010_maz_datacsv
Developing a New Synthetic Population
bull MAZ Control input file eg 2010_maz_datacsv ndash Estimates of total households and persons living in group quarters
bull Total households
bull Total group quarter population
ndash One record for each MAZ
Developing a New Synthetic Population
bull TAZ Controls input file -- eg 2010_taz_datacsv ndash Estimates of number of households or population for each SERPM7
controlled attribute
bull Household size
bull Household income
bull Household workers
bull Type of dwelling unit
bull Presence of children in the household
bull Population age group
bull Gender
bull Raceethnicity
bull Population in group quarters
ndash One record per TAZ
Analogous to the TAZ SE data file in the trip-
based model
Developing a New Synthetic Population
When preparing TAZ and MAZ control data it is critically important to
maintain internal data consistency
Developing a New Synthetic Population
bull Some data checks to perform and problems to look out for ndash The household and person marginals pertain to household residents
only except for the group quarter controls
ndash All household-based marginals add up to the same total households for each TAZ
ndash All person-based marginals add up to the same total persons for each TAZ
ndash The total number of persons implied by the household size marginal is consistent with the sum total of the person marginals
ndash The total number of children obtained from the age marginal is consistent with the marginal of households by presence of children
ndash Large deviations from 5050 split of persons by gender is suspect
ndash The household income distribution is consistency with the workers-in-household distribution
Developing a New Synthetic Population
bull More data checks ndash The MAZ and TAZ controls should add up
bull to the same number of households by TAZ
bull to the same number of persons in group quarters by TAZ
Developing a New Synthetic Population
bull Exhibit ndash SERPM7 2010 TAZ control file
Example ndash Minto West Palm Beach Co
Example ndash Minto West
bull Mixed-use development in a agricultural area adjacent to an existing housing development
bull Information available from proposedapproved plans ndash Single-family dwelling units ndash 5050
ndash Multi-family dwelling units ndash 1040
ndash Total population ndash 14 535 persons
ndash Spatial location of dwelling units by type
bull Other PopSyn required data not available from plans (income distribution age distribution etc) ndash Estimateassert it based on similar existing developments
surrounding neighborhood
Example ndash Minto West
bull Adding householdspersons to a TAZ
bull Adding TAZs or MAZs to SERPM7 should be a rare occurrence ndash Households are ultimately allocated to MAZs and therersquos already
12000 of them
ndash Households are represented individually so the zone attributes are derived from them
Trip-Based Model Modify the input zonal data file
Activity-Based Model Modify the population synthesis control file
Running PopSynII
bull Step 2 ndash Modify the PopSyn settings file for this run ndash Update TAZ and MAZ control filenames in runAll_popsynbat
REM BATCH FILE TO SETUP POPSYN RUN RUN POPSYNII AND OUTPUT CSV FILES REM SETUP REM PLEASE SET PATH NAMES FOR WORKING FOLDER AND CSV FILE LOCATIONS SET SERVERNAME=W-AMSTL-D-00052SQLEXPRESS SET DATABASENAME=popSyn SET ARCPATH=Cpopsyn SET CSVPATH_CONTROLS=Cpopsyninputscontrolscsv SET CSVPATH_MAZ=Cpopsyninputs2010_MAZ_Data_20120207csv SET CSVPATH_TAZ=Cpopsyninputs2010_TAZ_Data_20120207csv REM MAIN SCRIPT REM MAKE FILENAMES TABLE REM sqlcmd -S SERVER NAME -E -i INPUT FILE PATH (SCRIPT) -o OUTPUT LOG REM -E means to use Windows authentication for the user that is running the batch file SQLCMD -S SERVERNAME -d DATABASENAME -E -Q IF OBJECT_ID(dbocsv_filenames) IS NOT NULL DROP TABLE csv_filenames -o ARCPATHResultLogtxt
hellip hellip
Running PopSynII
bull Other PopSyn settings ndash rarely used in a production run ndash Change the control attributes
ndash Change the priority of control attributes
Running PopSynII
bull Step 3 ndash Run PopSynII -- runAll_popsynbat
Running PopSynII
bull Step 4 ndash Review Output amp Check Fit to Controls
Output File Description
hhFilecsv List of households
personFilecsv List of persons
ZoneResultscsv Comparisons of synthetized households to controlled and uncontrolled attributes
BalanceDetailscsv
ValidationStatscsv
ValidationStatsByPumacsv
Reviewing PopSyn Output
bull Zone_Resultscsv bull Comparison of synthesized totals to target totals for each
TAZ and controlled attribute
TOTAL_HOUSEHOLDS
ZONE TARGET SYNTHESIZED DIFFERENCE PCTDIFF
1 715 715 0 0
2 811 811 0 0
3 878 878 0 0
4 826 826 0 0
5 1181 1181 0 0
6 212 212 0 0
7 459 459 0 0
8 253 253 0 0
Reviewing PopSyn Output
bull Balance_Detailscsv bull Same output as Zone_Results different format
Zone Control ID ControlCat Target PUMSVal ConStat
1989 109 TOTAL_HOUSEHOLDS 1508 1508 yes
1989 249 INCOME_25K 273 271 no
1989 19 HHSIZE_4PLUS 467 467 yes
1989 160 FEMALE 2196 2108 no
1989 55 INCOME_100K 258 257 yes
1989 67 MULTI_UNIT 423 407 no
1989 31 WORKERS_3PLUS 164 166 no
Reviewing PopSyn Output
bull Validation_Statscsv ndash Comparison of synthesized attributes to input Census data (5 PUMS)
ndash Includes uncontrolled attributes
Description popSynSum censusSum meanDiff stdDev minDiff maxDiff Universe 1 number of households 2085375 1964881 17 61 -97 331
family 67 65 3 17 -26 48
non family 33 35 0 34 -58 111
size 1 27 28 0 36 -59 111
size 2 31 32 -3 14 -30 30
size 3 17 17 1 22 -37 53
size 4 25 23 18 50 -46 160
Reviewing PopSyn Output
bull Validation_StatsByPumacsv ndash Same as validation_stats but for each PUMA
bull Note that synthesized population may differ from 5 Census population by design
Application 3 ndash Highway Project
Highway Project
Example Projects ndashToll road extension ndashReversible lanes ndashManaged lanes
Overview
How to use SERPM7 to perform a model run and do some standard analysis ndash Option 1 -- Code the project directly on the geodatabase
bull Roadway links
bull Node links
bull Turn penalties
bull [assume no change to transit]
ndash Option 2 --Code the project on net files and then build the geodatabase
bull Use flowchart script to build the geodatabase
ndash Coding is very similar to earlier versions of SERPM
bull Facility types are the same
SERPM Facility Types (not new)
Editing the Highway Network
bull SERPM 7 requires a geodatabase bull Editing can be done either to a net file or directly on the
geodatabase bull The user can use utilities in the model flowchart to write a
net file from the geodatabase edit the net and then write it to the geodatabase
bull The geodatabase must exist to run the model
Editing in the Geodatabase
bull Simplest and most direct method bull Requires an understanding of the CubeArcGIS tools
Export geodatabase and edit as a net
bull Start Data Manager bull Open geodatabase (SERPM_NETSMDB) bull Double click on the network Input Hwy Net and specify an
output file (maybe ldquoeditnetrdquo) bull Open from Cube and edit as usual bull Use ldquoPrepare for Model Run and Trap Errorsrdquo (2) utilities to
write back to geodatabase ndash Reload geodatabase from Cube files ndash Cull and sort
ndash Write to geodatabase
Edit as a net
Export Edit in Cube
Change to point to edited network
Input Hwy Net
Toll Road Extension
bull Short Cut ndash copy an existing toll link bull No special NODE attributes bull Only new attribute is ISTOLL=1 for all links that could not be
used unless a toll were paid bull Toll Mainline FTC2=91 ISTOLL=1 DIRCODE=1 bull Plaza (gantry) ndash assume all will be electronic collection ndash TOLL=1 DIRCODE=1
ndash TOLLTYPE=3 CARTOLL=toll in dollars
ndash FTC2=95
ndash ISTOLL=1
ndash SVCSECONDS=001
ndash DELCODE=1 ACCELCODE=1 AVILANES=2
Toll Road Extension
Not much different from earlier versions of SERPM
Reversible Lanes
bull Control by the link attribute REVERSIBLE ndash REVERSIBLE=1 means AM operation only
ndash REVERSIBLE=2 means PM operation only
ndash I-595 example
Managed Lanes (typically Express)
bull HOT=1 ndash 98 (99 makes the link a dummy) bull FTC2 most likely=91 but other types permitted bull TOLL=0 ISTOLL=0 bull Tolls set by HOTTOLLdbf
HOT Lanes Tolls
bull Set as a function of the VC bull Updated in the travel time feedback loop bull Affects the TollFree split in mode choice bull Column HOT_x were x=HOT link attribute bull HOT_1 is the current 95 Express rate HOT_2 is a placeholder
Common Errors
bull Errors to watch out for ndash If network steps fail look for missing attributes
ndash Update transit routes as needed due to changes to underlying highway network
ndash Check for dangling links and unconnected zones
ndash Verify that all TAZs are connected to lsquofreersquo roads
bull Special procedures required for TAZs that have toll-only access must
include the attribute ISRCTOLLINK=1 (currently used for the
Rickenbacker Causeway)
ndash Some CT-RAMP errors caused by network coding errors may not be apparent until feedback loop 2 because in loop 1 CT-RAMP uses seed skims
bull Use small sample size when testing a new network
Was the Run Successful
bull Did the run converge ndash AM and PM travel time RMSE values reported to
OUTDIRfeedbacklogprn
ndash Run stops when RMSE is less than 01
ndash 2010 Scenario converges in 5 loops
bull What to do if it didnrsquot converge ndash Look for obvious errors
ndash Run more iterations (future year might require more)
bull Are the top-level results comparable to a similar run ndash Use HEVAL reports
ndash Examine screenlines (RMSE reports)
ndash Spot check link loads
Tools for Analysis
bull Analysis ndash perform standard highway project type analyses
bull Usual analysis similar to trip-based model ndash Total daily and period-specific roadway volumes and speeds by
vehicle class
ndash Vehicle trip OD matrices
bull Standard FSUTMS HEVAL and RMSE reports are still available ndash Day and period assignments
ndash By County
ndash Truck assignment
Tools for Analysis
bull Potential for customized assignment classes to address
specific project questions ndash Does the manage lane serve primarily high income users
bull Stratify vehicle classes by lowhigh income to understand facility
usage by income level
bull Stratify vehicle classes by disadvantaged population cohorts
bull Trip and person tabulations built from ABM output ndash Trip mode shares for many different population cohorts subareas
ndash For example toll vs non-toll shares by value of time or fine-graded income levels
ndash Many other possibilities
Application 4 ndash Mobility Project
Mobility Project ndash SUNPASS Market Share
bull Persons in households that own a SUNPASS transponder respond differently to managed lane and toll road policies ndash Pay lower tolls than cash users
ndash Have access to I-95 managed lanes
bull Policy questions ndash How does projected toll traffic and revenue vary with the SUNPASS
penetration rate and toll discount
ndash How will SUNPASS penetration rate vary as more managed lane facilities are built in the region
Mobility Project ndash SUNPASS Market Share
bull Question 1 -- How does projected toll traffic and revenue vary with the SUNPASS penetration rate and toll discount
bull Procedure ndash Step1 ndash Assume a SUNPASS market share by modifying the toll
transponder model
ndash Step 2 ndash Run SERPM7 to produce traffic volumes
ndash Step 3 ndash Estimate toll traffic revenue
Modifying the Toll Transponder Ownership Model
bull Model specification is contained in TransponderOwnershipxls and can be edited with Microsoft Excel
Utility Variable Coefficient
Expected time savings up to 644 min 00631
Distance less than 5 miles -00304
Distance between 5 and 10 miles -00648
Distance 10 miles or more -00648
Constant 04877
Modifying the Toll Transponder Ownership Model
Utility Variable Coefficient
Expected time savings up to 644 min 00631
Distance less than 5 miles -00304
Distance between 5 and 10 miles -00648
Distance 10 miles or more -00648
Constant 04877
Increasing the constant will increase the number of households equipped with transponders
TransponderOwnershipxls
Modifying the Toll Transponder Model
bull Increase the constant by how much ndash Process is akin to model calibration
ndash Several runs of the transponder model required to estimate the constant that yields the desired market share
ndash 2010 market share is approximately 65
ndash Use a small sample (5 or 10) to save run-time while establishing the right constant
Modifying the Toll Transponder Model
bull Variation ndash Add terms to the model so that certain types of households are more
likely to exhibit a SUNPASS market share increase
bull Highlow income households
bull Multi-car households
bull Miami-Dade households
Modifying the Toll Transponder Model
bull Exhibit TransponderOwnershipxls
Mobility Project ndash SUNPASS Market Share
bull Question 2 -- How will SUNPASS penetration rate vary as more managed lane facilities are built in the region
bull Procedure ndash Step 1 ndash Code the manage lane facilities
ndash Step 2 ndash Run SERPM7 to forecast transponder ownership
ndash Step 3 ndash Analyze the forecast household data for changes in the profile of households equipped with transponders
Application 5 ndash Land Use Project
Land Use Project
bull Transportation projects comprise not only network scenarios but also land use scenarios
bull Land use scenarios can be ndash Very large scale (substantial changes to housing and employment
estimates throughout the region) or
ndash Small scale (localized changes for example for a traffic impact study)
bull For both large scale and small scale land use updates the
general procedure for updating the input data and running the model is the same
Land Use Project
bull The land use data in SERPM7 consists of ndash Synthetic population and derived input files
ndash Employment data
ndash School enrollment data
ndash Parking costs and parking spaces
ndash Regional shopping mall special generators
ndash Beach special generators
ndash Hotel and motel room data
Land Use Project
bull The land use data reside in different input files
Data Item Input File
Synthetic Population hhFilecsv personFilecsv ctramppopsynTAZDatacsv ctramppopsynMAZDatacsv
Employment School Enrollment Parking Supply Data Special Generators Hotel and Motel Rooms
inputsIN-2010Rmaz_datacsv
Land Use Project
bull As demonstrated earlier SERPM 7 requires significantly more comprehensive socio-economic inputs as compared to previous versions ndash Greater spatial detail
ndash More categoriestypes of land uses
bull These inputs require additional preparation when
performing land use model runs
Land Use Project
Data Required and examples bull Population
bull Age distribution of the population expected to live in the
development
bull Income profile
bull Type of dwelling unit (single-family vs multi-family)
ndash The input data need to be internally consistent (distribution of households by presence of children needs to be consistent with population age distribution for example)
Land Use Project
Data Required bull Employment classification ndash Previous models had three
employment classifications
ndash In SERPM 7 there are 16 employment categories to better differentiate type of land use and improve the relationship between land use and activity purpose
Land Use Project
Data Required bull School enrollment ndash note that it differentiates by grade level
(K-8 high-school collegepost-secondary) ndash Donrsquot forget to include school faculty and staff in employment
Land Use Project
Data Required bull Parking supply and
parking costs ndash Parking spaces may
reflect use restrictions
bull Monthly
bull Daily
bull Hourly
ndash Parking costs consistent with type of use
Land Use Project
bull Park Area 1 (pink) ndash May park in MAZ other
than destination MAZ
ndash Parking cost applies
bull Park Area 2 (gree) ndash Parks at destination MAZ
ndash Parking cost applies
Land Use Project
Data Required bull Visitor Model ndash Number of hotel and motel rooms
bull Special Generators ndash Regional shopping malls
ndash Beach recreation areas
Land Use Project
The Gardens Mall Aventura Mall
Boynton Mall Dolphin Mall
Delray Community Mall Dadeland Mall
Towncenter Mall The Falls Shopping Center
Wellington Greens Mall Cutler Ridge Mall
Coral Square Mall Bal Harbour Shops
Pompano Citi Centre CocoWalk
Sawgrass Mills Mall The Mall at 163rd Street
Broward Mall Mall of the Americas
Galleria Mall Mary Brickell Village
Pembroke Lakes Mall Miami International Mall
Lakes Mall Miracle Marketplace
Oakwood Plaza Village of Merrick Park
The Promenade at Coconut Creek Westland Mall
Regional Shopping Mall Special Generators
Land Use Project
Deerfield Beach
Pompano Beach
Fort Lauderdale Beach
Fort Lauderdale Beach
Hollywood Beach
South Beach
Haulover Beach
Crandon Park
Dania Beach
Bill Baggs State Park
Beach Special Generators
Land Use Project
Sample Problem
bull MINTO West Example - a mixed residentialcommercial development ndash 6500 singlemulti-family residential units in multiple TAZs
ndash 14 million square feet of non-residential space
ndash 150 room hotel
ndash 3000 student college campus
Land Use Project
MINTO WEST
Land Use Project
TAZsMAZs representing MINTO West Development
Land Use Project
Need to translate population household and employment information from developer into model input data ndash As discussed in the Population Synthesis presentation population and
household attribute estimates can be taken from other known nearby neighborhoods
bull In this sample problem first start by allocating percentages of total
households into individual MAZs within the development area
bull Keep in mind household density when estimating the number of
households in each MAZ
Land Use Project
bull In this sample employment can be assumed to include bull Retail
bull RestaurantsBars
bull Offices
bull Health services
bull Hotelmotel employment and
bull Educational employment
ndash As with households yoursquoll need to apportion the employment areas to individual MAZs while keeping in mind the types of employment expected in those locations
Land Use Project
bull Employment data is usually estimated by converting floor space available to individual types of employment through conversion factors
bull ie ndash (3000 sqft office space)(20 sqft per office employee) =
150 office employees
Land Use Project
bull Once population household and employment figures are estimated they are entered into the appropriate model input file
bull Population ndash TAZ synthetic population control file
bull Household ndash TAZ synthetic population control file
bull Employment School Parking and Special Gen ndash maz_datacsv
bull Ensure that population household and employment figures
are the same in each file
bull Prior to performing model run PopSyn must be run and user must copy output files to SERPM7 input folders
Application 6 ndashTransit Project
Transit Project ndash MetroRail North Corridor
SERPM Transit Modes
Transit Mode Tour and Trip
Mode TAP Transit Skim Mode
Tri-Rail Commuter Rail Premium
Metrorail Urban Rail Premium
I-95 Inter-County Express I-95X I-95E
Express Bus Premium
Busway BRT Premium
MDT Express Express Bus Premium
Metromover Local Bus Local Bus
MDT Local BCT Local
Palm Tran Local Local Bus Local Bus
Breeze Local Bus Local Bus
Tri-Rail Shuttles Local Bus Local Bus
SERPM Transit Modes
Transit Mode Tour and Trip
Mode TAP Transit Skim
Mode
Mode coded on the route ldquocardsrdquo
Used to specify boarding and transfer penalties for transit
path building
(most disaggregate)
Line-haul choices in the tour and trip mode choice
models
Used to create sets of TAP to TAP levels of service
(most aggregate)
Similar to SERPM 67 SERPM 7 ABM
SERPM Transit Modes S67 Mode Local (L) S7
Mode Mode Name Operator amp Name UserA4 Name Prem (P) MODE
15 Tri-Rail 11 Tri-Rail 15 Commuter P 111
14 Metrorail 25 Metrorail 14 Urban Rail P 121
X Regional LRT Regional LRT 14 LRT P 131
16 Inter-County Express Bus 33 I-95 Inter-County Express 16 Express P 151
12 Exclusive ROW Cir-Reg 13 Exclusive ROW Cir-Reg 12 Mover L 181
11 TrolleysShuttles-Reg 12 Tri-Rail Shuttles 11 Local L 191
11 TrolleysShuttles-Reg 12 Tri-Rail Shuttles 33 Local L 192
X LRT- MDT 25 MDT LRT 14 LRT P 231
16 Buses (localexpress) - MDT 27 MDT Busway Flyers 27 BRT P 241
23 Buses (localexpress) - MDT 27 MDT MAXKATBusway Local 27 BRT P 242
24 BRT - MDT 28 MDT BRTLRT 28 BRT P 243
23 Buses (localexpress) - MDT 22 MDT Express 24 Express P 251
16 Buses (localexpress) - MDT 24 MDT I-95 Exp 26 Express P 252
16 Inter-County Express Bus 24 I-95 Inter-County Express 16 Express P 253
22 Exclusive ROW Cir-MDT 26 Metromover 22 Mover L 281
21 TrolleysShuttles-MDT 21 MDT TrolleysShuttles 21 Local L 291
23 Buses (localexpress) - MDT 21 MDT Local 23 Local L 292
23 Buses (localexpress) - MDT 23 MDT Shuttle 25 Local L 293
X LRT - BCT 35 BCT LRT 37 LRT P 331
34 BCT Rapid Bus BRT 34 BCT Rapid Bus 36 BRT P 341
34 BCT Fixed-guideway BRT 35 BCT BRT 37 BRT P 342
33 Buses (localexpress) - BCT 32 BCT Breeze 34 Express P 351
33 Buses (localexpress) - BCT 33 BCT Express 35 Express P 352
32 Exclusive ROW Cir-BCT 31 BCT Exclusive ROW Cir 32 Mover L 381
31 TrolleysShuttles-BCT 31 BCT TrolleysShuttles 31 Local L 393
33 Buses (localexpress) - BCT 31 BCT Local 27 Local L 391
33 Buses (localexpress) - BCT 31 BCT Local 33 Local L 392
X LRT - Palm Tran 43 Palm Tran LRT 44 LRT P 431
44 BRT - Palm Tran 43 Palm Tran BRT 44 BRT P 441
43 Buses (localexpress) - Ptran 42 Palm Tran Exp 44 Express P 451
42 Exclusive ROW Cir-PTran 41 Palm Tran Exclusive ROW Cir 42 Mover L 481
41 TrolleysShuttles-Ptran 41 Palm Tran TrolleysShuttles 41 Local L 491
43 Buses (localexpress) - Ptran 41 Palm Tran Local 43 Local L 492
Modes Not in the 2010 Network
SERPM7 Transit Network Building
bull Typically bus routes are coded on top of existing highway links
bull SERPM7 reserves some facility type codes for transit-only use helpful to more accurately represent route ndash Caution -- make sure network integrity is preserved once transit only
links are removed
bull Rail routes require coding first fixed-guideway links
SERPM7 Transit Network Building
bull Route Attributes -- User Coded ndash Name
ndash Long Name
ndash Mode
ndash Operator
ndash Headway[1] ndash AM Peak
ndash Headway[2] ndash Midday
ndash Headway[3] ndash PM Peak
ndash UserA4 (stop dwell time)
SERPM7 Transit Network Building
bull PNR Node Attributes ndash User Coded ndash Parking Spaces
ndash Parking Cost AM
ndash Parking Cost MD
ndash Terminal Time PNR
ndash Terminal Time KNR
bull At this time parking spaces is used only to identify park-n-ride locations (parking spaces gt 0)
SERPM7 Transit Network Building
bull Transit Access Points -- Created by Cube for the ABM ndash One TAP for each stop on premium routes
bull Tri-Rail Metrorail Express Bus BRT
ndash One TAP for each Local Bus park-n-ride node
ndash Synthesized TAPs to represent access to local bus stops
bull Transit Access Point Attributes ndash TAP Mode
ndash Inherit PNR node data
Sample Highway Network with TAPs
TAPs become part of the highway network and replace the TAZ centroids when building transit skims
Transit Access Points and ldquoon the flyrdquo Path Building
bull Transit skims are built TAP to TAP
Matrix origins and destinations are TAPS
Transit Access Points and ldquoon the flyrdquo Path Building
Trip Origins and
Destinations
MAZ to MAZ
Auto Skims
TAZ to TAZ
Transit Skims
TAP to TAP
The three spatial systems are put together by the mode choice model
ldquoOn the Flyrdquo Path Building
bull TAZs TAPs and MAZs are linked via drive and access connectors prior to running CT-RAMP
rmdir OUTDIRABMTEMP S Q rmdir DATADIRABMTEMP S Q xcopy OUTDIR OUTDIRABMTEMP E I Y xcopy DATADIR DATADIRABMTEMP E I Y if(fbi=1) need to run only the first time through - kdk CUBEctramprunCreateAccessFilescmd endif mkdir logFiles taskkill im javaexe F start CUBEctramprunHhMgrcmd JDK64 HOST_IP start CUBEctramprunMtxMgrcmd HOST_IP JDK64 rem start CUBEctrampconfigrunDrivercmd copy CUBEctrampserpm_abmproperties serpm_abmproperties Y ping -n 11 127001 gt nul CUBEctramprunSERPMAbmcmd SAMPLERATE VSAMPLERATE JDK64 CUBEctramprunCreateDemandMatricescmd SAMPLERATE VSAMPLERATE JDK64 taskkill im javaexe F rmdir OUTDIRctramp S Q rmdir DATADIRctramp S Q xcopy OUTDIRABMTEMPctramp OUTDIRctramp E I Y xcopy DATADIRABMTEMPctramp DATADIRctramp E I Y
ldquoOn the Flyrdquo Path Building
MAZ to MAZ Connectors
Created by finding shortest distance paths over an all-streets network Connects all MAZs within 15 mi
Used to represent walk mode distance and time
MAZ to TAP Connectors
Created by finding shortest distance paths over an all-streets network Connects each MAZ to all TAPs within 10 mi
Used to represent transit walk access and walk egress distance and time
TAZ to TAP Connectors
Connects each TAZ to all TAPs within the TAP maximum drive distance bull Bus TAPs ndash 4 miles bull Rail TAPs ndash 15 miles
Used to represent transit drive access and egress distance and time
ldquoOn the Flyrdquo Path Building
bull No actual links created on the network bull Connectivity is expressed in table format
ldquoOn the Flyrdquo Path Building
bull Once the access and walk connectors are created the mode choice model builds complete paths MAZ to MAZ transit paths
bull Local-only paths are built using the ldquolocalrdquo transit skim bull Express BRT Urban Rail and Commuter rail paths are all
built at the same time using the ldquopremiumrdquo transit skim bull For each MAZ to MAZ pair CT-RAMP keeps the shortest
generalized cost path for each available premium mode bull Even though only one ldquopremiumrdquo skim is built CT-RAMP
may find competing premium paths It may also find that the best path is a combination of two premium modes or a premium mode and local bus
Tour Mode Choice Model
Choice
Auto
Drive alone
GP(1)
Pay(2)
Shared ride 2
GP(3)
HOV(4)
Pay(5)
Shared ride 3+
GP(6)
HOV(7)
Pay(8)
Non-motorized
Walk(9)
Bike(10)
Transit
Walk access
Local bus(11)
Express bus(12)
BRT(13)
Urban rail(14)
Commuter rail(15)
PNR access
Local bus(16)
Express bus(17)
BRT(18)
Urban rail(19)
Commuter rail(20)
KNR access
Local bus(21)
Express bus(22)
BRT(23)
Urban rail(24)
Commuter rail(25)
School Bus(26)
Trip Mode Choice Model
bull Same nesting structure as the tour mode choice but conditional on the tour mode
bull Some trip modes may be unavailable depending on the tour mode
DA SR2 SR3+ Walk Wlk-Trn PNR-Trn KNR-Trn
DA Must - - - - - -
SR2 Can Can - Can - - -
SR3+ Can Can Can Can - - -
Walk - - - Must - - -
Wlk-Trn - Can Can Can Can - -
PNR-Trn Can Can Can Can Can Can
KNR-Trn - Can Can Can Can - Can
Trip Switching Rules Simplified
Transit Trip Reporting
bull In SERPM7 the transit boarding and alighting location can be reported in two ways ndash Trip list files (ABM output) -- Boarding TAP Alighting TAP
ndash Transit assignment (Cube output) ndash Route nodes
bull Each type of reporting has its strengths ndash Trip list file allows building detailed transit trip patterns for
population cohorts and time periods
bull Mode split reports
bull Transit trip distance frequency distributions access distance TLFDs
bull Mode to mode transfers
ndash Note ABM reports only the first boarding TAP and the last alighting TAP regardless of mode
ndash Cube output gives aggregate link volumes station to station boardings etc
User Benefit Files
bull SERPM7 can produce FTA User Benefit files for input to SUMMIT
bull User benefits remain a useful analysis tool bull Steps to produce user benefit files require some manual
intervention ndash see User Guide
SERPM ABM Reports
bull Stores ABM inputs and outputs in a relational database to generate some standard model reports
bull Consistent reporting framework to be used for analysis across model runs
bull SERPM7 user community can easily share the scripts that create the reports
bull Reports take the form of Excel workbooks bull Foundation for future development of a visualization
dashboard
Reporting Database Components
Reporting Database Components
bull Reporting ETL (extract transform and load) program ndash Loads all Cube and CT-RAMP Java model outputs into the database
ndash Written in Cube scripts and Java
bull Database ndash Stores all data used in reporting including select network skims
household person tour and trip data zonal data etc
ndash Implemented with SQL Server
bull Report scripts to generate reports ndash Written in T-SQL
bull Report packaging program ndash Generates Excel workbooks with one report per worksheet
ndash Written in Java
Reporting Database Components
bull Run time required to build database and generate reports varies with sample size and type of report ndash Several hours required to build the database for a 100 sample
ndash ~ 30 minutes to produce reports for a 10 sample
bull Report step is optional not part of a standard model run bull Report production is transparent to the user
bull hellip but users can contribute reports bull hellip and choose which reports to build at any one time
Running SERPM ABM Reports
bull Report queries reside in ctrampreports_sql time_spent_travelingsql Total weekday travel time by person type
and income group
total_trips_typesql Trips by trip mode person type county of residence and tour purpose
total_tours_typesql Tours by trip mode person type county of residence and tour purpose
tours_districtssql Tours by tour purpose and tour origin and destination districts
transit_access_time+distsql Drive to transit trip list with many trip details
hellip
Running SERPM ABM Reports
bull List of reports to run is specified in properties file ndash ctrampserpm_reportsproperties
sqlscriptsdirectory = Cserpm7ctrampreports_sql sqlscriptsschemakey = SCHEMA sqlscripts=cleanupsqltransit_access_time+distsql worksheettables=temptransittrips worksheetnames=TransitTrips workbookname = Cserpm7ctrampreports_sqlSERPM_REPORTXLS databaseschema = 2010R databaseipaddress = w-ampdx-d-sag10 databaseinstance = databaseport = 1433 databasename=SERPMABM databaseusername=serpm databasepassword=s3rpm
Adding Reports
bull Step 1 --Write report query ndash T-SQL
ndash User Guide includes a database data dictionary
bull Step 2 ndash Add query to ctrampreports_sql ndash Each query is contained in a single text file
ndash Drop file in reports folder
bull Step 3 ndash Add the query to the properties file sqlquery = Query file name
Worksheettables = Query output
Worksheetnames = Name for the report worksheet
Sample SERPM ABM Reports
bull Exhibit ctrampreports_sqlserpm_reportsxls
More information Shi-Chiang Li | shi-chianglidotstateflus |954 777 4655 Rosella Picado | picadopbworldcom | 206 382 5227 Ken Kaltenbach |kkaltenbachcorradinocom |502 587 7221

Working with a Population Sample
bull A sample expansion factor is applied when creating the trip tables for assignment
bull Expansion factor = 1samplingRate bull Loads on highway and transit networks are representative
of the entire population bull Summaries produced from the ABM list output need to be
expanded to be representative of the entire population
Running SERPM7 with a Population Sample
bull Setting the run ndash Set the sampling rate for residents and visitors in Cube
ndash All other model settings can remain unchanged
bull The same sampling rate is used on all feedback loops
Catalog Key Description
SAMPLERATE Sampling rate for the resident population
VSAMPLERATE Sampling rate for the visitor population
Running SERPM7 with a Population Sample
bull When working with a ldquoless than 100rdquo model run each record in the output list files has to be expanded by 1samplingRate ndash householdData_v1csv
ndash personData_v1csv
ndash indivTourFile_v1csv
ndash jointTourFile_v1csv
ndash indivTripFile_v1csv
ndash jointTripFile_v1csv
bull Trip tables are already expanded ndash TAZ_Demand_tmat
ndash TAP_Demand_tmat
Running SERPM7 with a Population Sample
bull Sample Output ndash County-wide highway assignment statistics
Screenline 25
Sample 50
Sample Diff ()
BOEW Northern SL along Pompano Canal 842418 843591 -01
BOEW Middle SL along Oakland Park Blvd 1187251 1183529 03
BOEW Southern SL along River Canal 881601 879618 02
BONS Western SL between I75 and TPK 586412 587353 -02
BONS Middle SL along TPK 1441311 1437065 03
BONS Eastern SL along Intracostal Wway 328855 326298 08
BOEW SL BOPB County Line 648960 648771 00
BOEW SL BOMD County Line 979327 976276 03
BOWestern Ext CL Collier County Line 31059 31059 00
BONS I-95 CL from Miami-Dade to I-595 510207 509537 01
BONS Western CL along SR897 frm PB-SR816 494591 495547 -02
Running SERPM7 with a Population Sample
Running SERPM7 with a Population Sample
Running SERPM7 with a Population Sample
bull Sample Output ndash Individual Route Boardings
Running SERPM7 with a Population Sample
bull Sample Output ndash Individual Route Boardings
Running SERPM7 with a Population Sample
bull Sample Output ndash Regionwide Household Income Profile
Household Income 25 Sample 100 Sample
Less than $10000 1015 1021
$10000 to $15000 470 468
$15000 - $20000 566 564
$20000 to $25000 519 516
$25000 to $30000 493 494
$30000 to $35000 475 477
$35000 to $40000 387 387
$40000 to $45000 343 345
$45000 to $50000 348 348
$50000 to $75000 1754 1747
$75000 to $100000 1432 1433
$100000 or More 2198 2200
Application 2 Population Synthesis
Population Synthesis
bull Each SERPM7 scenario requires a synthetic population ndash List of households -- hhFilecsv
ndash List of persons that make up the households -- personFilecsv
bull Two synthetic populations have been developed to date ndash 2010 base year population
ndash 2040 long range transportation plan population
Population Synthesis
bull New synthetic populations will be required for ndash Other regional scenario years (eg 2020 2025 2045)
ndash To test population and land use scenarios such as
bull Traffic impact study for a new housing or commercial development
bull Impact of aging population
bull Impact of rising sea levels (because some neighborhoods will no
longer be inhabitable)
bull Refinements to the 2010 and 2040 populations
Population Synthesis
bull The population synthesizer (PopSynII) does not run normally as part of SERPM7 ndash SERPM7 expects input population files in the input folder
ndash User is responsible for running PopSynII to generate the required population files and place them in the scenario folders prior to a SERPM7 run
bull Why ndash Because a new synthetic population is not required for every run
PopSyn II Setup
bull PopSynII is already configured to run on the FDOT servers bull Java application using SQL data storage
PopSynII installed in the main ctramp folder
PopSynII Setup
bull The ctramppopsyn folder
Filename Description
runAllPopsynbat Batch file that controls the execution of PopSynII
controls SQL settings file that specifies the population attributes used as controls
1_importCSVsql 2_createTargetssql 3_createSynHHPerFilessql
SQL scripts that run the PopSynII software
2010_TAZ_Datacsv TAZ input control data
2010_MAZ_Datacsv MAZ input control data
Developing a New Synthetic Population
bull Step 1 ndash Prepare the input files ndash TAZ controls 2010_taz_datacsv
ndash MAZ controls 2010_maz_datacsv
Developing a New Synthetic Population
bull MAZ Control input file eg 2010_maz_datacsv ndash Estimates of total households and persons living in group quarters
bull Total households
bull Total group quarter population
ndash One record for each MAZ
Developing a New Synthetic Population
bull TAZ Controls input file -- eg 2010_taz_datacsv ndash Estimates of number of households or population for each SERPM7
controlled attribute
bull Household size
bull Household income
bull Household workers
bull Type of dwelling unit
bull Presence of children in the household
bull Population age group
bull Gender
bull Raceethnicity
bull Population in group quarters
ndash One record per TAZ
Analogous to the TAZ SE data file in the trip-
based model
Developing a New Synthetic Population
When preparing TAZ and MAZ control data it is critically important to
maintain internal data consistency
Developing a New Synthetic Population
bull Some data checks to perform and problems to look out for ndash The household and person marginals pertain to household residents
only except for the group quarter controls
ndash All household-based marginals add up to the same total households for each TAZ
ndash All person-based marginals add up to the same total persons for each TAZ
ndash The total number of persons implied by the household size marginal is consistent with the sum total of the person marginals
ndash The total number of children obtained from the age marginal is consistent with the marginal of households by presence of children
ndash Large deviations from 5050 split of persons by gender is suspect
ndash The household income distribution is consistency with the workers-in-household distribution
Developing a New Synthetic Population
bull More data checks ndash The MAZ and TAZ controls should add up
bull to the same number of households by TAZ
bull to the same number of persons in group quarters by TAZ
Developing a New Synthetic Population
bull Exhibit ndash SERPM7 2010 TAZ control file
Example ndash Minto West Palm Beach Co
Example ndash Minto West
bull Mixed-use development in a agricultural area adjacent to an existing housing development
bull Information available from proposedapproved plans ndash Single-family dwelling units ndash 5050
ndash Multi-family dwelling units ndash 1040
ndash Total population ndash 14 535 persons
ndash Spatial location of dwelling units by type
bull Other PopSyn required data not available from plans (income distribution age distribution etc) ndash Estimateassert it based on similar existing developments
surrounding neighborhood
Example ndash Minto West
bull Adding householdspersons to a TAZ
bull Adding TAZs or MAZs to SERPM7 should be a rare occurrence ndash Households are ultimately allocated to MAZs and therersquos already
12000 of them
ndash Households are represented individually so the zone attributes are derived from them
Trip-Based Model Modify the input zonal data file
Activity-Based Model Modify the population synthesis control file
Running PopSynII
bull Step 2 ndash Modify the PopSyn settings file for this run ndash Update TAZ and MAZ control filenames in runAll_popsynbat
REM BATCH FILE TO SETUP POPSYN RUN RUN POPSYNII AND OUTPUT CSV FILES REM SETUP REM PLEASE SET PATH NAMES FOR WORKING FOLDER AND CSV FILE LOCATIONS SET SERVERNAME=W-AMSTL-D-00052SQLEXPRESS SET DATABASENAME=popSyn SET ARCPATH=Cpopsyn SET CSVPATH_CONTROLS=Cpopsyninputscontrolscsv SET CSVPATH_MAZ=Cpopsyninputs2010_MAZ_Data_20120207csv SET CSVPATH_TAZ=Cpopsyninputs2010_TAZ_Data_20120207csv REM MAIN SCRIPT REM MAKE FILENAMES TABLE REM sqlcmd -S SERVER NAME -E -i INPUT FILE PATH (SCRIPT) -o OUTPUT LOG REM -E means to use Windows authentication for the user that is running the batch file SQLCMD -S SERVERNAME -d DATABASENAME -E -Q IF OBJECT_ID(dbocsv_filenames) IS NOT NULL DROP TABLE csv_filenames -o ARCPATHResultLogtxt
hellip hellip
Running PopSynII
bull Other PopSyn settings ndash rarely used in a production run ndash Change the control attributes
ndash Change the priority of control attributes
Running PopSynII
bull Step 3 ndash Run PopSynII -- runAll_popsynbat
Running PopSynII
bull Step 4 ndash Review Output amp Check Fit to Controls
Output File Description
hhFilecsv List of households
personFilecsv List of persons
ZoneResultscsv Comparisons of synthetized households to controlled and uncontrolled attributes
BalanceDetailscsv
ValidationStatscsv
ValidationStatsByPumacsv
Reviewing PopSyn Output
bull Zone_Resultscsv bull Comparison of synthesized totals to target totals for each
TAZ and controlled attribute
TOTAL_HOUSEHOLDS
ZONE TARGET SYNTHESIZED DIFFERENCE PCTDIFF
1 715 715 0 0
2 811 811 0 0
3 878 878 0 0
4 826 826 0 0
5 1181 1181 0 0
6 212 212 0 0
7 459 459 0 0
8 253 253 0 0
Reviewing PopSyn Output
bull Balance_Detailscsv bull Same output as Zone_Results different format
Zone Control ID ControlCat Target PUMSVal ConStat
1989 109 TOTAL_HOUSEHOLDS 1508 1508 yes
1989 249 INCOME_25K 273 271 no
1989 19 HHSIZE_4PLUS 467 467 yes
1989 160 FEMALE 2196 2108 no
1989 55 INCOME_100K 258 257 yes
1989 67 MULTI_UNIT 423 407 no
1989 31 WORKERS_3PLUS 164 166 no
Reviewing PopSyn Output
bull Validation_Statscsv ndash Comparison of synthesized attributes to input Census data (5 PUMS)
ndash Includes uncontrolled attributes
Description popSynSum censusSum meanDiff stdDev minDiff maxDiff Universe 1 number of households 2085375 1964881 17 61 -97 331
family 67 65 3 17 -26 48
non family 33 35 0 34 -58 111
size 1 27 28 0 36 -59 111
size 2 31 32 -3 14 -30 30
size 3 17 17 1 22 -37 53
size 4 25 23 18 50 -46 160
Reviewing PopSyn Output
bull Validation_StatsByPumacsv ndash Same as validation_stats but for each PUMA
bull Note that synthesized population may differ from 5 Census population by design
Application 3 ndash Highway Project
Highway Project
Example Projects ndashToll road extension ndashReversible lanes ndashManaged lanes
Overview
How to use SERPM7 to perform a model run and do some standard analysis ndash Option 1 -- Code the project directly on the geodatabase
bull Roadway links
bull Node links
bull Turn penalties
bull [assume no change to transit]
ndash Option 2 --Code the project on net files and then build the geodatabase
bull Use flowchart script to build the geodatabase
ndash Coding is very similar to earlier versions of SERPM
bull Facility types are the same
SERPM Facility Types (not new)
Editing the Highway Network
bull SERPM 7 requires a geodatabase bull Editing can be done either to a net file or directly on the
geodatabase bull The user can use utilities in the model flowchart to write a
net file from the geodatabase edit the net and then write it to the geodatabase
bull The geodatabase must exist to run the model
Editing in the Geodatabase
bull Simplest and most direct method bull Requires an understanding of the CubeArcGIS tools
Export geodatabase and edit as a net
bull Start Data Manager bull Open geodatabase (SERPM_NETSMDB) bull Double click on the network Input Hwy Net and specify an
output file (maybe ldquoeditnetrdquo) bull Open from Cube and edit as usual bull Use ldquoPrepare for Model Run and Trap Errorsrdquo (2) utilities to
write back to geodatabase ndash Reload geodatabase from Cube files ndash Cull and sort
ndash Write to geodatabase
Edit as a net
Export Edit in Cube
Change to point to edited network
Input Hwy Net
Toll Road Extension
bull Short Cut ndash copy an existing toll link bull No special NODE attributes bull Only new attribute is ISTOLL=1 for all links that could not be
used unless a toll were paid bull Toll Mainline FTC2=91 ISTOLL=1 DIRCODE=1 bull Plaza (gantry) ndash assume all will be electronic collection ndash TOLL=1 DIRCODE=1
ndash TOLLTYPE=3 CARTOLL=toll in dollars
ndash FTC2=95
ndash ISTOLL=1
ndash SVCSECONDS=001
ndash DELCODE=1 ACCELCODE=1 AVILANES=2
Toll Road Extension
Not much different from earlier versions of SERPM
Reversible Lanes
bull Control by the link attribute REVERSIBLE ndash REVERSIBLE=1 means AM operation only
ndash REVERSIBLE=2 means PM operation only
ndash I-595 example
Managed Lanes (typically Express)
bull HOT=1 ndash 98 (99 makes the link a dummy) bull FTC2 most likely=91 but other types permitted bull TOLL=0 ISTOLL=0 bull Tolls set by HOTTOLLdbf
HOT Lanes Tolls
bull Set as a function of the VC bull Updated in the travel time feedback loop bull Affects the TollFree split in mode choice bull Column HOT_x were x=HOT link attribute bull HOT_1 is the current 95 Express rate HOT_2 is a placeholder
Common Errors
bull Errors to watch out for ndash If network steps fail look for missing attributes
ndash Update transit routes as needed due to changes to underlying highway network
ndash Check for dangling links and unconnected zones
ndash Verify that all TAZs are connected to lsquofreersquo roads
bull Special procedures required for TAZs that have toll-only access must
include the attribute ISRCTOLLINK=1 (currently used for the
Rickenbacker Causeway)
ndash Some CT-RAMP errors caused by network coding errors may not be apparent until feedback loop 2 because in loop 1 CT-RAMP uses seed skims
bull Use small sample size when testing a new network
Was the Run Successful
bull Did the run converge ndash AM and PM travel time RMSE values reported to
OUTDIRfeedbacklogprn
ndash Run stops when RMSE is less than 01
ndash 2010 Scenario converges in 5 loops
bull What to do if it didnrsquot converge ndash Look for obvious errors
ndash Run more iterations (future year might require more)
bull Are the top-level results comparable to a similar run ndash Use HEVAL reports
ndash Examine screenlines (RMSE reports)
ndash Spot check link loads
Tools for Analysis
bull Analysis ndash perform standard highway project type analyses
bull Usual analysis similar to trip-based model ndash Total daily and period-specific roadway volumes and speeds by
vehicle class
ndash Vehicle trip OD matrices
bull Standard FSUTMS HEVAL and RMSE reports are still available ndash Day and period assignments
ndash By County
ndash Truck assignment
Tools for Analysis
bull Potential for customized assignment classes to address
specific project questions ndash Does the manage lane serve primarily high income users
bull Stratify vehicle classes by lowhigh income to understand facility
usage by income level
bull Stratify vehicle classes by disadvantaged population cohorts
bull Trip and person tabulations built from ABM output ndash Trip mode shares for many different population cohorts subareas
ndash For example toll vs non-toll shares by value of time or fine-graded income levels
ndash Many other possibilities
Application 4 ndash Mobility Project
Mobility Project ndash SUNPASS Market Share
bull Persons in households that own a SUNPASS transponder respond differently to managed lane and toll road policies ndash Pay lower tolls than cash users
ndash Have access to I-95 managed lanes
bull Policy questions ndash How does projected toll traffic and revenue vary with the SUNPASS
penetration rate and toll discount
ndash How will SUNPASS penetration rate vary as more managed lane facilities are built in the region
Mobility Project ndash SUNPASS Market Share
bull Question 1 -- How does projected toll traffic and revenue vary with the SUNPASS penetration rate and toll discount
bull Procedure ndash Step1 ndash Assume a SUNPASS market share by modifying the toll
transponder model
ndash Step 2 ndash Run SERPM7 to produce traffic volumes
ndash Step 3 ndash Estimate toll traffic revenue
Modifying the Toll Transponder Ownership Model
bull Model specification is contained in TransponderOwnershipxls and can be edited with Microsoft Excel
Utility Variable Coefficient
Expected time savings up to 644 min 00631
Distance less than 5 miles -00304
Distance between 5 and 10 miles -00648
Distance 10 miles or more -00648
Constant 04877
Modifying the Toll Transponder Ownership Model
Utility Variable Coefficient
Expected time savings up to 644 min 00631
Distance less than 5 miles -00304
Distance between 5 and 10 miles -00648
Distance 10 miles or more -00648
Constant 04877
Increasing the constant will increase the number of households equipped with transponders
TransponderOwnershipxls
Modifying the Toll Transponder Model
bull Increase the constant by how much ndash Process is akin to model calibration
ndash Several runs of the transponder model required to estimate the constant that yields the desired market share
ndash 2010 market share is approximately 65
ndash Use a small sample (5 or 10) to save run-time while establishing the right constant
Modifying the Toll Transponder Model
bull Variation ndash Add terms to the model so that certain types of households are more
likely to exhibit a SUNPASS market share increase
bull Highlow income households
bull Multi-car households
bull Miami-Dade households
Modifying the Toll Transponder Model
bull Exhibit TransponderOwnershipxls
Mobility Project ndash SUNPASS Market Share
bull Question 2 -- How will SUNPASS penetration rate vary as more managed lane facilities are built in the region
bull Procedure ndash Step 1 ndash Code the manage lane facilities
ndash Step 2 ndash Run SERPM7 to forecast transponder ownership
ndash Step 3 ndash Analyze the forecast household data for changes in the profile of households equipped with transponders
Application 5 ndash Land Use Project
Land Use Project
bull Transportation projects comprise not only network scenarios but also land use scenarios
bull Land use scenarios can be ndash Very large scale (substantial changes to housing and employment
estimates throughout the region) or
ndash Small scale (localized changes for example for a traffic impact study)
bull For both large scale and small scale land use updates the
general procedure for updating the input data and running the model is the same
Land Use Project
bull The land use data in SERPM7 consists of ndash Synthetic population and derived input files
ndash Employment data
ndash School enrollment data
ndash Parking costs and parking spaces
ndash Regional shopping mall special generators
ndash Beach special generators
ndash Hotel and motel room data
Land Use Project
bull The land use data reside in different input files
Data Item Input File
Synthetic Population hhFilecsv personFilecsv ctramppopsynTAZDatacsv ctramppopsynMAZDatacsv
Employment School Enrollment Parking Supply Data Special Generators Hotel and Motel Rooms
inputsIN-2010Rmaz_datacsv
Land Use Project
bull As demonstrated earlier SERPM 7 requires significantly more comprehensive socio-economic inputs as compared to previous versions ndash Greater spatial detail
ndash More categoriestypes of land uses
bull These inputs require additional preparation when
performing land use model runs
Land Use Project
Data Required and examples bull Population
bull Age distribution of the population expected to live in the
development
bull Income profile
bull Type of dwelling unit (single-family vs multi-family)
ndash The input data need to be internally consistent (distribution of households by presence of children needs to be consistent with population age distribution for example)
Land Use Project
Data Required bull Employment classification ndash Previous models had three
employment classifications
ndash In SERPM 7 there are 16 employment categories to better differentiate type of land use and improve the relationship between land use and activity purpose
Land Use Project
Data Required bull School enrollment ndash note that it differentiates by grade level
(K-8 high-school collegepost-secondary) ndash Donrsquot forget to include school faculty and staff in employment
Land Use Project
Data Required bull Parking supply and
parking costs ndash Parking spaces may
reflect use restrictions
bull Monthly
bull Daily
bull Hourly
ndash Parking costs consistent with type of use
Land Use Project
bull Park Area 1 (pink) ndash May park in MAZ other
than destination MAZ
ndash Parking cost applies
bull Park Area 2 (gree) ndash Parks at destination MAZ
ndash Parking cost applies
Land Use Project
Data Required bull Visitor Model ndash Number of hotel and motel rooms
bull Special Generators ndash Regional shopping malls
ndash Beach recreation areas
Land Use Project
The Gardens Mall Aventura Mall
Boynton Mall Dolphin Mall
Delray Community Mall Dadeland Mall
Towncenter Mall The Falls Shopping Center
Wellington Greens Mall Cutler Ridge Mall
Coral Square Mall Bal Harbour Shops
Pompano Citi Centre CocoWalk
Sawgrass Mills Mall The Mall at 163rd Street
Broward Mall Mall of the Americas
Galleria Mall Mary Brickell Village
Pembroke Lakes Mall Miami International Mall
Lakes Mall Miracle Marketplace
Oakwood Plaza Village of Merrick Park
The Promenade at Coconut Creek Westland Mall
Regional Shopping Mall Special Generators
Land Use Project
Deerfield Beach
Pompano Beach
Fort Lauderdale Beach
Fort Lauderdale Beach
Hollywood Beach
South Beach
Haulover Beach
Crandon Park
Dania Beach
Bill Baggs State Park
Beach Special Generators
Land Use Project
Sample Problem
bull MINTO West Example - a mixed residentialcommercial development ndash 6500 singlemulti-family residential units in multiple TAZs
ndash 14 million square feet of non-residential space
ndash 150 room hotel
ndash 3000 student college campus
Land Use Project
MINTO WEST
Land Use Project
TAZsMAZs representing MINTO West Development
Land Use Project
Need to translate population household and employment information from developer into model input data ndash As discussed in the Population Synthesis presentation population and
household attribute estimates can be taken from other known nearby neighborhoods
bull In this sample problem first start by allocating percentages of total
households into individual MAZs within the development area
bull Keep in mind household density when estimating the number of
households in each MAZ
Land Use Project
bull In this sample employment can be assumed to include bull Retail
bull RestaurantsBars
bull Offices
bull Health services
bull Hotelmotel employment and
bull Educational employment
ndash As with households yoursquoll need to apportion the employment areas to individual MAZs while keeping in mind the types of employment expected in those locations
Land Use Project
bull Employment data is usually estimated by converting floor space available to individual types of employment through conversion factors
bull ie ndash (3000 sqft office space)(20 sqft per office employee) =
150 office employees
Land Use Project
bull Once population household and employment figures are estimated they are entered into the appropriate model input file
bull Population ndash TAZ synthetic population control file
bull Household ndash TAZ synthetic population control file
bull Employment School Parking and Special Gen ndash maz_datacsv
bull Ensure that population household and employment figures
are the same in each file
bull Prior to performing model run PopSyn must be run and user must copy output files to SERPM7 input folders
Application 6 ndashTransit Project
Transit Project ndash MetroRail North Corridor
SERPM Transit Modes
Transit Mode Tour and Trip
Mode TAP Transit Skim Mode
Tri-Rail Commuter Rail Premium
Metrorail Urban Rail Premium
I-95 Inter-County Express I-95X I-95E
Express Bus Premium
Busway BRT Premium
MDT Express Express Bus Premium
Metromover Local Bus Local Bus
MDT Local BCT Local
Palm Tran Local Local Bus Local Bus
Breeze Local Bus Local Bus
Tri-Rail Shuttles Local Bus Local Bus
SERPM Transit Modes
Transit Mode Tour and Trip
Mode TAP Transit Skim
Mode
Mode coded on the route ldquocardsrdquo
Used to specify boarding and transfer penalties for transit
path building
(most disaggregate)
Line-haul choices in the tour and trip mode choice
models
Used to create sets of TAP to TAP levels of service
(most aggregate)
Similar to SERPM 67 SERPM 7 ABM
SERPM Transit Modes S67 Mode Local (L) S7
Mode Mode Name Operator amp Name UserA4 Name Prem (P) MODE
15 Tri-Rail 11 Tri-Rail 15 Commuter P 111
14 Metrorail 25 Metrorail 14 Urban Rail P 121
X Regional LRT Regional LRT 14 LRT P 131
16 Inter-County Express Bus 33 I-95 Inter-County Express 16 Express P 151
12 Exclusive ROW Cir-Reg 13 Exclusive ROW Cir-Reg 12 Mover L 181
11 TrolleysShuttles-Reg 12 Tri-Rail Shuttles 11 Local L 191
11 TrolleysShuttles-Reg 12 Tri-Rail Shuttles 33 Local L 192
X LRT- MDT 25 MDT LRT 14 LRT P 231
16 Buses (localexpress) - MDT 27 MDT Busway Flyers 27 BRT P 241
23 Buses (localexpress) - MDT 27 MDT MAXKATBusway Local 27 BRT P 242
24 BRT - MDT 28 MDT BRTLRT 28 BRT P 243
23 Buses (localexpress) - MDT 22 MDT Express 24 Express P 251
16 Buses (localexpress) - MDT 24 MDT I-95 Exp 26 Express P 252
16 Inter-County Express Bus 24 I-95 Inter-County Express 16 Express P 253
22 Exclusive ROW Cir-MDT 26 Metromover 22 Mover L 281
21 TrolleysShuttles-MDT 21 MDT TrolleysShuttles 21 Local L 291
23 Buses (localexpress) - MDT 21 MDT Local 23 Local L 292
23 Buses (localexpress) - MDT 23 MDT Shuttle 25 Local L 293
X LRT - BCT 35 BCT LRT 37 LRT P 331
34 BCT Rapid Bus BRT 34 BCT Rapid Bus 36 BRT P 341
34 BCT Fixed-guideway BRT 35 BCT BRT 37 BRT P 342
33 Buses (localexpress) - BCT 32 BCT Breeze 34 Express P 351
33 Buses (localexpress) - BCT 33 BCT Express 35 Express P 352
32 Exclusive ROW Cir-BCT 31 BCT Exclusive ROW Cir 32 Mover L 381
31 TrolleysShuttles-BCT 31 BCT TrolleysShuttles 31 Local L 393
33 Buses (localexpress) - BCT 31 BCT Local 27 Local L 391
33 Buses (localexpress) - BCT 31 BCT Local 33 Local L 392
X LRT - Palm Tran 43 Palm Tran LRT 44 LRT P 431
44 BRT - Palm Tran 43 Palm Tran BRT 44 BRT P 441
43 Buses (localexpress) - Ptran 42 Palm Tran Exp 44 Express P 451
42 Exclusive ROW Cir-PTran 41 Palm Tran Exclusive ROW Cir 42 Mover L 481
41 TrolleysShuttles-Ptran 41 Palm Tran TrolleysShuttles 41 Local L 491
43 Buses (localexpress) - Ptran 41 Palm Tran Local 43 Local L 492
Modes Not in the 2010 Network
SERPM7 Transit Network Building
bull Typically bus routes are coded on top of existing highway links
bull SERPM7 reserves some facility type codes for transit-only use helpful to more accurately represent route ndash Caution -- make sure network integrity is preserved once transit only
links are removed
bull Rail routes require coding first fixed-guideway links
SERPM7 Transit Network Building
bull Route Attributes -- User Coded ndash Name
ndash Long Name
ndash Mode
ndash Operator
ndash Headway[1] ndash AM Peak
ndash Headway[2] ndash Midday
ndash Headway[3] ndash PM Peak
ndash UserA4 (stop dwell time)
SERPM7 Transit Network Building
bull PNR Node Attributes ndash User Coded ndash Parking Spaces
ndash Parking Cost AM
ndash Parking Cost MD
ndash Terminal Time PNR
ndash Terminal Time KNR
bull At this time parking spaces is used only to identify park-n-ride locations (parking spaces gt 0)
SERPM7 Transit Network Building
bull Transit Access Points -- Created by Cube for the ABM ndash One TAP for each stop on premium routes
bull Tri-Rail Metrorail Express Bus BRT
ndash One TAP for each Local Bus park-n-ride node
ndash Synthesized TAPs to represent access to local bus stops
bull Transit Access Point Attributes ndash TAP Mode
ndash Inherit PNR node data
Sample Highway Network with TAPs
TAPs become part of the highway network and replace the TAZ centroids when building transit skims
Transit Access Points and ldquoon the flyrdquo Path Building
bull Transit skims are built TAP to TAP
Matrix origins and destinations are TAPS
Transit Access Points and ldquoon the flyrdquo Path Building
Trip Origins and
Destinations
MAZ to MAZ
Auto Skims
TAZ to TAZ
Transit Skims
TAP to TAP
The three spatial systems are put together by the mode choice model
ldquoOn the Flyrdquo Path Building
bull TAZs TAPs and MAZs are linked via drive and access connectors prior to running CT-RAMP
rmdir OUTDIRABMTEMP S Q rmdir DATADIRABMTEMP S Q xcopy OUTDIR OUTDIRABMTEMP E I Y xcopy DATADIR DATADIRABMTEMP E I Y if(fbi=1) need to run only the first time through - kdk CUBEctramprunCreateAccessFilescmd endif mkdir logFiles taskkill im javaexe F start CUBEctramprunHhMgrcmd JDK64 HOST_IP start CUBEctramprunMtxMgrcmd HOST_IP JDK64 rem start CUBEctrampconfigrunDrivercmd copy CUBEctrampserpm_abmproperties serpm_abmproperties Y ping -n 11 127001 gt nul CUBEctramprunSERPMAbmcmd SAMPLERATE VSAMPLERATE JDK64 CUBEctramprunCreateDemandMatricescmd SAMPLERATE VSAMPLERATE JDK64 taskkill im javaexe F rmdir OUTDIRctramp S Q rmdir DATADIRctramp S Q xcopy OUTDIRABMTEMPctramp OUTDIRctramp E I Y xcopy DATADIRABMTEMPctramp DATADIRctramp E I Y
ldquoOn the Flyrdquo Path Building
MAZ to MAZ Connectors
Created by finding shortest distance paths over an all-streets network Connects all MAZs within 15 mi
Used to represent walk mode distance and time
MAZ to TAP Connectors
Created by finding shortest distance paths over an all-streets network Connects each MAZ to all TAPs within 10 mi
Used to represent transit walk access and walk egress distance and time
TAZ to TAP Connectors
Connects each TAZ to all TAPs within the TAP maximum drive distance bull Bus TAPs ndash 4 miles bull Rail TAPs ndash 15 miles
Used to represent transit drive access and egress distance and time
ldquoOn the Flyrdquo Path Building
bull No actual links created on the network bull Connectivity is expressed in table format
ldquoOn the Flyrdquo Path Building
bull Once the access and walk connectors are created the mode choice model builds complete paths MAZ to MAZ transit paths
bull Local-only paths are built using the ldquolocalrdquo transit skim bull Express BRT Urban Rail and Commuter rail paths are all
built at the same time using the ldquopremiumrdquo transit skim bull For each MAZ to MAZ pair CT-RAMP keeps the shortest
generalized cost path for each available premium mode bull Even though only one ldquopremiumrdquo skim is built CT-RAMP
may find competing premium paths It may also find that the best path is a combination of two premium modes or a premium mode and local bus
Tour Mode Choice Model
Choice
Auto
Drive alone
GP(1)
Pay(2)
Shared ride 2
GP(3)
HOV(4)
Pay(5)
Shared ride 3+
GP(6)
HOV(7)
Pay(8)
Non-motorized
Walk(9)
Bike(10)
Transit
Walk access
Local bus(11)
Express bus(12)
BRT(13)
Urban rail(14)
Commuter rail(15)
PNR access
Local bus(16)
Express bus(17)
BRT(18)
Urban rail(19)
Commuter rail(20)
KNR access
Local bus(21)
Express bus(22)
BRT(23)
Urban rail(24)
Commuter rail(25)
School Bus(26)
Trip Mode Choice Model
bull Same nesting structure as the tour mode choice but conditional on the tour mode
bull Some trip modes may be unavailable depending on the tour mode
DA SR2 SR3+ Walk Wlk-Trn PNR-Trn KNR-Trn
DA Must - - - - - -
SR2 Can Can - Can - - -
SR3+ Can Can Can Can - - -
Walk - - - Must - - -
Wlk-Trn - Can Can Can Can - -
PNR-Trn Can Can Can Can Can Can
KNR-Trn - Can Can Can Can - Can
Trip Switching Rules Simplified
Transit Trip Reporting
bull In SERPM7 the transit boarding and alighting location can be reported in two ways ndash Trip list files (ABM output) -- Boarding TAP Alighting TAP
ndash Transit assignment (Cube output) ndash Route nodes
bull Each type of reporting has its strengths ndash Trip list file allows building detailed transit trip patterns for
population cohorts and time periods
bull Mode split reports
bull Transit trip distance frequency distributions access distance TLFDs
bull Mode to mode transfers
ndash Note ABM reports only the first boarding TAP and the last alighting TAP regardless of mode
ndash Cube output gives aggregate link volumes station to station boardings etc
User Benefit Files
bull SERPM7 can produce FTA User Benefit files for input to SUMMIT
bull User benefits remain a useful analysis tool bull Steps to produce user benefit files require some manual
intervention ndash see User Guide
SERPM ABM Reports
bull Stores ABM inputs and outputs in a relational database to generate some standard model reports
bull Consistent reporting framework to be used for analysis across model runs
bull SERPM7 user community can easily share the scripts that create the reports
bull Reports take the form of Excel workbooks bull Foundation for future development of a visualization
dashboard
Reporting Database Components
Reporting Database Components
bull Reporting ETL (extract transform and load) program ndash Loads all Cube and CT-RAMP Java model outputs into the database
ndash Written in Cube scripts and Java
bull Database ndash Stores all data used in reporting including select network skims
household person tour and trip data zonal data etc
ndash Implemented with SQL Server
bull Report scripts to generate reports ndash Written in T-SQL
bull Report packaging program ndash Generates Excel workbooks with one report per worksheet
ndash Written in Java
Reporting Database Components
bull Run time required to build database and generate reports varies with sample size and type of report ndash Several hours required to build the database for a 100 sample
ndash ~ 30 minutes to produce reports for a 10 sample
bull Report step is optional not part of a standard model run bull Report production is transparent to the user
bull hellip but users can contribute reports bull hellip and choose which reports to build at any one time
Running SERPM ABM Reports
bull Report queries reside in ctrampreports_sql time_spent_travelingsql Total weekday travel time by person type
and income group
total_trips_typesql Trips by trip mode person type county of residence and tour purpose
total_tours_typesql Tours by trip mode person type county of residence and tour purpose
tours_districtssql Tours by tour purpose and tour origin and destination districts
transit_access_time+distsql Drive to transit trip list with many trip details
hellip
Running SERPM ABM Reports
bull List of reports to run is specified in properties file ndash ctrampserpm_reportsproperties
sqlscriptsdirectory = Cserpm7ctrampreports_sql sqlscriptsschemakey = SCHEMA sqlscripts=cleanupsqltransit_access_time+distsql worksheettables=temptransittrips worksheetnames=TransitTrips workbookname = Cserpm7ctrampreports_sqlSERPM_REPORTXLS databaseschema = 2010R databaseipaddress = w-ampdx-d-sag10 databaseinstance = databaseport = 1433 databasename=SERPMABM databaseusername=serpm databasepassword=s3rpm
Adding Reports
bull Step 1 --Write report query ndash T-SQL
ndash User Guide includes a database data dictionary
bull Step 2 ndash Add query to ctrampreports_sql ndash Each query is contained in a single text file
ndash Drop file in reports folder
bull Step 3 ndash Add the query to the properties file sqlquery = Query file name
Worksheettables = Query output
Worksheetnames = Name for the report worksheet
Sample SERPM ABM Reports
bull Exhibit ctrampreports_sqlserpm_reportsxls
More information Shi-Chiang Li | shi-chianglidotstateflus |954 777 4655 Rosella Picado | picadopbworldcom | 206 382 5227 Ken Kaltenbach |kkaltenbachcorradinocom |502 587 7221

Running SERPM7 with a Population Sample
Running SERPM7 with a Population Sample
Running SERPM7 with a Population Sample
bull Sample Output ndash Individual Route Boardings
Running SERPM7 with a Population Sample
bull Sample Output ndash Individual Route Boardings
Running SERPM7 with a Population Sample
bull Sample Output ndash Regionwide Household Income Profile
Household Income 25 Sample 100 Sample
Less than $10000 1015 1021
$10000 to $15000 470 468
$15000 - $20000 566 564
$20000 to $25000 519 516
$25000 to $30000 493 494
$30000 to $35000 475 477
$35000 to $40000 387 387
$40000 to $45000 343 345
$45000 to $50000 348 348
$50000 to $75000 1754 1747
$75000 to $100000 1432 1433
$100000 or More 2198 2200
Application 2 Population Synthesis
Population Synthesis
bull Each SERPM7 scenario requires a synthetic population ndash List of households -- hhFilecsv
ndash List of persons that make up the households -- personFilecsv
bull Two synthetic populations have been developed to date ndash 2010 base year population
ndash 2040 long range transportation plan population
Population Synthesis
bull New synthetic populations will be required for ndash Other regional scenario years (eg 2020 2025 2045)
ndash To test population and land use scenarios such as
bull Traffic impact study for a new housing or commercial development
bull Impact of aging population
bull Impact of rising sea levels (because some neighborhoods will no
longer be inhabitable)
bull Refinements to the 2010 and 2040 populations
Population Synthesis
bull The population synthesizer (PopSynII) does not run normally as part of SERPM7 ndash SERPM7 expects input population files in the input folder
ndash User is responsible for running PopSynII to generate the required population files and place them in the scenario folders prior to a SERPM7 run
bull Why ndash Because a new synthetic population is not required for every run
PopSyn II Setup
bull PopSynII is already configured to run on the FDOT servers bull Java application using SQL data storage
PopSynII installed in the main ctramp folder
PopSynII Setup
bull The ctramppopsyn folder
Filename Description
runAllPopsynbat Batch file that controls the execution of PopSynII
controls SQL settings file that specifies the population attributes used as controls
1_importCSVsql 2_createTargetssql 3_createSynHHPerFilessql
SQL scripts that run the PopSynII software
2010_TAZ_Datacsv TAZ input control data
2010_MAZ_Datacsv MAZ input control data
Developing a New Synthetic Population
bull Step 1 ndash Prepare the input files ndash TAZ controls 2010_taz_datacsv
ndash MAZ controls 2010_maz_datacsv
Developing a New Synthetic Population
bull MAZ Control input file eg 2010_maz_datacsv ndash Estimates of total households and persons living in group quarters
bull Total households
bull Total group quarter population
ndash One record for each MAZ
Developing a New Synthetic Population
bull TAZ Controls input file -- eg 2010_taz_datacsv ndash Estimates of number of households or population for each SERPM7
controlled attribute
bull Household size
bull Household income
bull Household workers
bull Type of dwelling unit
bull Presence of children in the household
bull Population age group
bull Gender
bull Raceethnicity
bull Population in group quarters
ndash One record per TAZ
Analogous to the TAZ SE data file in the trip-
based model
Developing a New Synthetic Population
When preparing TAZ and MAZ control data it is critically important to
maintain internal data consistency
Developing a New Synthetic Population
bull Some data checks to perform and problems to look out for ndash The household and person marginals pertain to household residents
only except for the group quarter controls
ndash All household-based marginals add up to the same total households for each TAZ
ndash All person-based marginals add up to the same total persons for each TAZ
ndash The total number of persons implied by the household size marginal is consistent with the sum total of the person marginals
ndash The total number of children obtained from the age marginal is consistent with the marginal of households by presence of children
ndash Large deviations from 5050 split of persons by gender is suspect
ndash The household income distribution is consistency with the workers-in-household distribution
Developing a New Synthetic Population
bull More data checks ndash The MAZ and TAZ controls should add up
bull to the same number of households by TAZ
bull to the same number of persons in group quarters by TAZ
Developing a New Synthetic Population
bull Exhibit ndash SERPM7 2010 TAZ control file
Example ndash Minto West Palm Beach Co
Example ndash Minto West
bull Mixed-use development in a agricultural area adjacent to an existing housing development
bull Information available from proposedapproved plans ndash Single-family dwelling units ndash 5050
ndash Multi-family dwelling units ndash 1040
ndash Total population ndash 14 535 persons
ndash Spatial location of dwelling units by type
bull Other PopSyn required data not available from plans (income distribution age distribution etc) ndash Estimateassert it based on similar existing developments
surrounding neighborhood
Example ndash Minto West
bull Adding householdspersons to a TAZ
bull Adding TAZs or MAZs to SERPM7 should be a rare occurrence ndash Households are ultimately allocated to MAZs and therersquos already
12000 of them
ndash Households are represented individually so the zone attributes are derived from them
Trip-Based Model Modify the input zonal data file
Activity-Based Model Modify the population synthesis control file
Running PopSynII
bull Step 2 ndash Modify the PopSyn settings file for this run ndash Update TAZ and MAZ control filenames in runAll_popsynbat
REM BATCH FILE TO SETUP POPSYN RUN RUN POPSYNII AND OUTPUT CSV FILES REM SETUP REM PLEASE SET PATH NAMES FOR WORKING FOLDER AND CSV FILE LOCATIONS SET SERVERNAME=W-AMSTL-D-00052SQLEXPRESS SET DATABASENAME=popSyn SET ARCPATH=Cpopsyn SET CSVPATH_CONTROLS=Cpopsyninputscontrolscsv SET CSVPATH_MAZ=Cpopsyninputs2010_MAZ_Data_20120207csv SET CSVPATH_TAZ=Cpopsyninputs2010_TAZ_Data_20120207csv REM MAIN SCRIPT REM MAKE FILENAMES TABLE REM sqlcmd -S SERVER NAME -E -i INPUT FILE PATH (SCRIPT) -o OUTPUT LOG REM -E means to use Windows authentication for the user that is running the batch file SQLCMD -S SERVERNAME -d DATABASENAME -E -Q IF OBJECT_ID(dbocsv_filenames) IS NOT NULL DROP TABLE csv_filenames -o ARCPATHResultLogtxt
hellip hellip
Running PopSynII
bull Other PopSyn settings ndash rarely used in a production run ndash Change the control attributes
ndash Change the priority of control attributes
Running PopSynII
bull Step 3 ndash Run PopSynII -- runAll_popsynbat
Running PopSynII
bull Step 4 ndash Review Output amp Check Fit to Controls
Output File Description
hhFilecsv List of households
personFilecsv List of persons
ZoneResultscsv Comparisons of synthetized households to controlled and uncontrolled attributes
BalanceDetailscsv
ValidationStatscsv
ValidationStatsByPumacsv
Reviewing PopSyn Output
bull Zone_Resultscsv bull Comparison of synthesized totals to target totals for each
TAZ and controlled attribute
TOTAL_HOUSEHOLDS
ZONE TARGET SYNTHESIZED DIFFERENCE PCTDIFF
1 715 715 0 0
2 811 811 0 0
3 878 878 0 0
4 826 826 0 0
5 1181 1181 0 0
6 212 212 0 0
7 459 459 0 0
8 253 253 0 0
Reviewing PopSyn Output
bull Balance_Detailscsv bull Same output as Zone_Results different format
Zone Control ID ControlCat Target PUMSVal ConStat
1989 109 TOTAL_HOUSEHOLDS 1508 1508 yes
1989 249 INCOME_25K 273 271 no
1989 19 HHSIZE_4PLUS 467 467 yes
1989 160 FEMALE 2196 2108 no
1989 55 INCOME_100K 258 257 yes
1989 67 MULTI_UNIT 423 407 no
1989 31 WORKERS_3PLUS 164 166 no
Reviewing PopSyn Output
bull Validation_Statscsv ndash Comparison of synthesized attributes to input Census data (5 PUMS)
ndash Includes uncontrolled attributes
Description popSynSum censusSum meanDiff stdDev minDiff maxDiff Universe 1 number of households 2085375 1964881 17 61 -97 331
family 67 65 3 17 -26 48
non family 33 35 0 34 -58 111
size 1 27 28 0 36 -59 111
size 2 31 32 -3 14 -30 30
size 3 17 17 1 22 -37 53
size 4 25 23 18 50 -46 160
Reviewing PopSyn Output
bull Validation_StatsByPumacsv ndash Same as validation_stats but for each PUMA
bull Note that synthesized population may differ from 5 Census population by design
Application 3 ndash Highway Project
Highway Project
Example Projects ndashToll road extension ndashReversible lanes ndashManaged lanes
Overview
How to use SERPM7 to perform a model run and do some standard analysis ndash Option 1 -- Code the project directly on the geodatabase
bull Roadway links
bull Node links
bull Turn penalties
bull [assume no change to transit]
ndash Option 2 --Code the project on net files and then build the geodatabase
bull Use flowchart script to build the geodatabase
ndash Coding is very similar to earlier versions of SERPM
bull Facility types are the same
SERPM Facility Types (not new)
Editing the Highway Network
bull SERPM 7 requires a geodatabase bull Editing can be done either to a net file or directly on the
geodatabase bull The user can use utilities in the model flowchart to write a
net file from the geodatabase edit the net and then write it to the geodatabase
bull The geodatabase must exist to run the model
Editing in the Geodatabase
bull Simplest and most direct method bull Requires an understanding of the CubeArcGIS tools
Export geodatabase and edit as a net
bull Start Data Manager bull Open geodatabase (SERPM_NETSMDB) bull Double click on the network Input Hwy Net and specify an
output file (maybe ldquoeditnetrdquo) bull Open from Cube and edit as usual bull Use ldquoPrepare for Model Run and Trap Errorsrdquo (2) utilities to
write back to geodatabase ndash Reload geodatabase from Cube files ndash Cull and sort
ndash Write to geodatabase
Edit as a net
Export Edit in Cube
Change to point to edited network
Input Hwy Net
Toll Road Extension
bull Short Cut ndash copy an existing toll link bull No special NODE attributes bull Only new attribute is ISTOLL=1 for all links that could not be
used unless a toll were paid bull Toll Mainline FTC2=91 ISTOLL=1 DIRCODE=1 bull Plaza (gantry) ndash assume all will be electronic collection ndash TOLL=1 DIRCODE=1
ndash TOLLTYPE=3 CARTOLL=toll in dollars
ndash FTC2=95
ndash ISTOLL=1
ndash SVCSECONDS=001
ndash DELCODE=1 ACCELCODE=1 AVILANES=2
Toll Road Extension
Not much different from earlier versions of SERPM
Reversible Lanes
bull Control by the link attribute REVERSIBLE ndash REVERSIBLE=1 means AM operation only
ndash REVERSIBLE=2 means PM operation only
ndash I-595 example
Managed Lanes (typically Express)
bull HOT=1 ndash 98 (99 makes the link a dummy) bull FTC2 most likely=91 but other types permitted bull TOLL=0 ISTOLL=0 bull Tolls set by HOTTOLLdbf
HOT Lanes Tolls
bull Set as a function of the VC bull Updated in the travel time feedback loop bull Affects the TollFree split in mode choice bull Column HOT_x were x=HOT link attribute bull HOT_1 is the current 95 Express rate HOT_2 is a placeholder
Common Errors
bull Errors to watch out for ndash If network steps fail look for missing attributes
ndash Update transit routes as needed due to changes to underlying highway network
ndash Check for dangling links and unconnected zones
ndash Verify that all TAZs are connected to lsquofreersquo roads
bull Special procedures required for TAZs that have toll-only access must
include the attribute ISRCTOLLINK=1 (currently used for the
Rickenbacker Causeway)
ndash Some CT-RAMP errors caused by network coding errors may not be apparent until feedback loop 2 because in loop 1 CT-RAMP uses seed skims
bull Use small sample size when testing a new network
Was the Run Successful
bull Did the run converge ndash AM and PM travel time RMSE values reported to
OUTDIRfeedbacklogprn
ndash Run stops when RMSE is less than 01
ndash 2010 Scenario converges in 5 loops
bull What to do if it didnrsquot converge ndash Look for obvious errors
ndash Run more iterations (future year might require more)
bull Are the top-level results comparable to a similar run ndash Use HEVAL reports
ndash Examine screenlines (RMSE reports)
ndash Spot check link loads
Tools for Analysis
bull Analysis ndash perform standard highway project type analyses
bull Usual analysis similar to trip-based model ndash Total daily and period-specific roadway volumes and speeds by
vehicle class
ndash Vehicle trip OD matrices
bull Standard FSUTMS HEVAL and RMSE reports are still available ndash Day and period assignments
ndash By County
ndash Truck assignment
Tools for Analysis
bull Potential for customized assignment classes to address
specific project questions ndash Does the manage lane serve primarily high income users
bull Stratify vehicle classes by lowhigh income to understand facility
usage by income level
bull Stratify vehicle classes by disadvantaged population cohorts
bull Trip and person tabulations built from ABM output ndash Trip mode shares for many different population cohorts subareas
ndash For example toll vs non-toll shares by value of time or fine-graded income levels
ndash Many other possibilities
Application 4 ndash Mobility Project
Mobility Project ndash SUNPASS Market Share
bull Persons in households that own a SUNPASS transponder respond differently to managed lane and toll road policies ndash Pay lower tolls than cash users
ndash Have access to I-95 managed lanes
bull Policy questions ndash How does projected toll traffic and revenue vary with the SUNPASS
penetration rate and toll discount
ndash How will SUNPASS penetration rate vary as more managed lane facilities are built in the region
Mobility Project ndash SUNPASS Market Share
bull Question 1 -- How does projected toll traffic and revenue vary with the SUNPASS penetration rate and toll discount
bull Procedure ndash Step1 ndash Assume a SUNPASS market share by modifying the toll
transponder model
ndash Step 2 ndash Run SERPM7 to produce traffic volumes
ndash Step 3 ndash Estimate toll traffic revenue
Modifying the Toll Transponder Ownership Model
bull Model specification is contained in TransponderOwnershipxls and can be edited with Microsoft Excel
Utility Variable Coefficient
Expected time savings up to 644 min 00631
Distance less than 5 miles -00304
Distance between 5 and 10 miles -00648
Distance 10 miles or more -00648
Constant 04877
Modifying the Toll Transponder Ownership Model
Utility Variable Coefficient
Expected time savings up to 644 min 00631
Distance less than 5 miles -00304
Distance between 5 and 10 miles -00648
Distance 10 miles or more -00648
Constant 04877
Increasing the constant will increase the number of households equipped with transponders
TransponderOwnershipxls
Modifying the Toll Transponder Model
bull Increase the constant by how much ndash Process is akin to model calibration
ndash Several runs of the transponder model required to estimate the constant that yields the desired market share
ndash 2010 market share is approximately 65
ndash Use a small sample (5 or 10) to save run-time while establishing the right constant
Modifying the Toll Transponder Model
bull Variation ndash Add terms to the model so that certain types of households are more
likely to exhibit a SUNPASS market share increase
bull Highlow income households
bull Multi-car households
bull Miami-Dade households
Modifying the Toll Transponder Model
bull Exhibit TransponderOwnershipxls
Mobility Project ndash SUNPASS Market Share
bull Question 2 -- How will SUNPASS penetration rate vary as more managed lane facilities are built in the region
bull Procedure ndash Step 1 ndash Code the manage lane facilities
ndash Step 2 ndash Run SERPM7 to forecast transponder ownership
ndash Step 3 ndash Analyze the forecast household data for changes in the profile of households equipped with transponders
Application 5 ndash Land Use Project
Land Use Project
bull Transportation projects comprise not only network scenarios but also land use scenarios
bull Land use scenarios can be ndash Very large scale (substantial changes to housing and employment
estimates throughout the region) or
ndash Small scale (localized changes for example for a traffic impact study)
bull For both large scale and small scale land use updates the
general procedure for updating the input data and running the model is the same
Land Use Project
bull The land use data in SERPM7 consists of ndash Synthetic population and derived input files
ndash Employment data
ndash School enrollment data
ndash Parking costs and parking spaces
ndash Regional shopping mall special generators
ndash Beach special generators
ndash Hotel and motel room data
Land Use Project
bull The land use data reside in different input files
Data Item Input File
Synthetic Population hhFilecsv personFilecsv ctramppopsynTAZDatacsv ctramppopsynMAZDatacsv
Employment School Enrollment Parking Supply Data Special Generators Hotel and Motel Rooms
inputsIN-2010Rmaz_datacsv
Land Use Project
bull As demonstrated earlier SERPM 7 requires significantly more comprehensive socio-economic inputs as compared to previous versions ndash Greater spatial detail
ndash More categoriestypes of land uses
bull These inputs require additional preparation when
performing land use model runs
Land Use Project
Data Required and examples bull Population
bull Age distribution of the population expected to live in the
development
bull Income profile
bull Type of dwelling unit (single-family vs multi-family)
ndash The input data need to be internally consistent (distribution of households by presence of children needs to be consistent with population age distribution for example)
Land Use Project
Data Required bull Employment classification ndash Previous models had three
employment classifications
ndash In SERPM 7 there are 16 employment categories to better differentiate type of land use and improve the relationship between land use and activity purpose
Land Use Project
Data Required bull School enrollment ndash note that it differentiates by grade level
(K-8 high-school collegepost-secondary) ndash Donrsquot forget to include school faculty and staff in employment
Land Use Project
Data Required bull Parking supply and
parking costs ndash Parking spaces may
reflect use restrictions
bull Monthly
bull Daily
bull Hourly
ndash Parking costs consistent with type of use
Land Use Project
bull Park Area 1 (pink) ndash May park in MAZ other
than destination MAZ
ndash Parking cost applies
bull Park Area 2 (gree) ndash Parks at destination MAZ
ndash Parking cost applies
Land Use Project
Data Required bull Visitor Model ndash Number of hotel and motel rooms
bull Special Generators ndash Regional shopping malls
ndash Beach recreation areas
Land Use Project
The Gardens Mall Aventura Mall
Boynton Mall Dolphin Mall
Delray Community Mall Dadeland Mall
Towncenter Mall The Falls Shopping Center
Wellington Greens Mall Cutler Ridge Mall
Coral Square Mall Bal Harbour Shops
Pompano Citi Centre CocoWalk
Sawgrass Mills Mall The Mall at 163rd Street
Broward Mall Mall of the Americas
Galleria Mall Mary Brickell Village
Pembroke Lakes Mall Miami International Mall
Lakes Mall Miracle Marketplace
Oakwood Plaza Village of Merrick Park
The Promenade at Coconut Creek Westland Mall
Regional Shopping Mall Special Generators
Land Use Project
Deerfield Beach
Pompano Beach
Fort Lauderdale Beach
Fort Lauderdale Beach
Hollywood Beach
South Beach
Haulover Beach
Crandon Park
Dania Beach
Bill Baggs State Park
Beach Special Generators
Land Use Project
Sample Problem
bull MINTO West Example - a mixed residentialcommercial development ndash 6500 singlemulti-family residential units in multiple TAZs
ndash 14 million square feet of non-residential space
ndash 150 room hotel
ndash 3000 student college campus
Land Use Project
MINTO WEST
Land Use Project
TAZsMAZs representing MINTO West Development
Land Use Project
Need to translate population household and employment information from developer into model input data ndash As discussed in the Population Synthesis presentation population and
household attribute estimates can be taken from other known nearby neighborhoods
bull In this sample problem first start by allocating percentages of total
households into individual MAZs within the development area
bull Keep in mind household density when estimating the number of
households in each MAZ
Land Use Project
bull In this sample employment can be assumed to include bull Retail
bull RestaurantsBars
bull Offices
bull Health services
bull Hotelmotel employment and
bull Educational employment
ndash As with households yoursquoll need to apportion the employment areas to individual MAZs while keeping in mind the types of employment expected in those locations
Land Use Project
bull Employment data is usually estimated by converting floor space available to individual types of employment through conversion factors
bull ie ndash (3000 sqft office space)(20 sqft per office employee) =
150 office employees
Land Use Project
bull Once population household and employment figures are estimated they are entered into the appropriate model input file
bull Population ndash TAZ synthetic population control file
bull Household ndash TAZ synthetic population control file
bull Employment School Parking and Special Gen ndash maz_datacsv
bull Ensure that population household and employment figures
are the same in each file
bull Prior to performing model run PopSyn must be run and user must copy output files to SERPM7 input folders
Application 6 ndashTransit Project
Transit Project ndash MetroRail North Corridor
SERPM Transit Modes
Transit Mode Tour and Trip
Mode TAP Transit Skim Mode
Tri-Rail Commuter Rail Premium
Metrorail Urban Rail Premium
I-95 Inter-County Express I-95X I-95E
Express Bus Premium
Busway BRT Premium
MDT Express Express Bus Premium
Metromover Local Bus Local Bus
MDT Local BCT Local
Palm Tran Local Local Bus Local Bus
Breeze Local Bus Local Bus
Tri-Rail Shuttles Local Bus Local Bus
SERPM Transit Modes
Transit Mode Tour and Trip
Mode TAP Transit Skim
Mode
Mode coded on the route ldquocardsrdquo
Used to specify boarding and transfer penalties for transit
path building
(most disaggregate)
Line-haul choices in the tour and trip mode choice
models
Used to create sets of TAP to TAP levels of service
(most aggregate)
Similar to SERPM 67 SERPM 7 ABM
SERPM Transit Modes S67 Mode Local (L) S7
Mode Mode Name Operator amp Name UserA4 Name Prem (P) MODE
15 Tri-Rail 11 Tri-Rail 15 Commuter P 111
14 Metrorail 25 Metrorail 14 Urban Rail P 121
X Regional LRT Regional LRT 14 LRT P 131
16 Inter-County Express Bus 33 I-95 Inter-County Express 16 Express P 151
12 Exclusive ROW Cir-Reg 13 Exclusive ROW Cir-Reg 12 Mover L 181
11 TrolleysShuttles-Reg 12 Tri-Rail Shuttles 11 Local L 191
11 TrolleysShuttles-Reg 12 Tri-Rail Shuttles 33 Local L 192
X LRT- MDT 25 MDT LRT 14 LRT P 231
16 Buses (localexpress) - MDT 27 MDT Busway Flyers 27 BRT P 241
23 Buses (localexpress) - MDT 27 MDT MAXKATBusway Local 27 BRT P 242
24 BRT - MDT 28 MDT BRTLRT 28 BRT P 243
23 Buses (localexpress) - MDT 22 MDT Express 24 Express P 251
16 Buses (localexpress) - MDT 24 MDT I-95 Exp 26 Express P 252
16 Inter-County Express Bus 24 I-95 Inter-County Express 16 Express P 253
22 Exclusive ROW Cir-MDT 26 Metromover 22 Mover L 281
21 TrolleysShuttles-MDT 21 MDT TrolleysShuttles 21 Local L 291
23 Buses (localexpress) - MDT 21 MDT Local 23 Local L 292
23 Buses (localexpress) - MDT 23 MDT Shuttle 25 Local L 293
X LRT - BCT 35 BCT LRT 37 LRT P 331
34 BCT Rapid Bus BRT 34 BCT Rapid Bus 36 BRT P 341
34 BCT Fixed-guideway BRT 35 BCT BRT 37 BRT P 342
33 Buses (localexpress) - BCT 32 BCT Breeze 34 Express P 351
33 Buses (localexpress) - BCT 33 BCT Express 35 Express P 352
32 Exclusive ROW Cir-BCT 31 BCT Exclusive ROW Cir 32 Mover L 381
31 TrolleysShuttles-BCT 31 BCT TrolleysShuttles 31 Local L 393
33 Buses (localexpress) - BCT 31 BCT Local 27 Local L 391
33 Buses (localexpress) - BCT 31 BCT Local 33 Local L 392
X LRT - Palm Tran 43 Palm Tran LRT 44 LRT P 431
44 BRT - Palm Tran 43 Palm Tran BRT 44 BRT P 441
43 Buses (localexpress) - Ptran 42 Palm Tran Exp 44 Express P 451
42 Exclusive ROW Cir-PTran 41 Palm Tran Exclusive ROW Cir 42 Mover L 481
41 TrolleysShuttles-Ptran 41 Palm Tran TrolleysShuttles 41 Local L 491
43 Buses (localexpress) - Ptran 41 Palm Tran Local 43 Local L 492
Modes Not in the 2010 Network
SERPM7 Transit Network Building
bull Typically bus routes are coded on top of existing highway links
bull SERPM7 reserves some facility type codes for transit-only use helpful to more accurately represent route ndash Caution -- make sure network integrity is preserved once transit only
links are removed
bull Rail routes require coding first fixed-guideway links
SERPM7 Transit Network Building
bull Route Attributes -- User Coded ndash Name
ndash Long Name
ndash Mode
ndash Operator
ndash Headway[1] ndash AM Peak
ndash Headway[2] ndash Midday
ndash Headway[3] ndash PM Peak
ndash UserA4 (stop dwell time)
SERPM7 Transit Network Building
bull PNR Node Attributes ndash User Coded ndash Parking Spaces
ndash Parking Cost AM
ndash Parking Cost MD
ndash Terminal Time PNR
ndash Terminal Time KNR
bull At this time parking spaces is used only to identify park-n-ride locations (parking spaces gt 0)
SERPM7 Transit Network Building
bull Transit Access Points -- Created by Cube for the ABM ndash One TAP for each stop on premium routes
bull Tri-Rail Metrorail Express Bus BRT
ndash One TAP for each Local Bus park-n-ride node
ndash Synthesized TAPs to represent access to local bus stops
bull Transit Access Point Attributes ndash TAP Mode
ndash Inherit PNR node data
Sample Highway Network with TAPs
TAPs become part of the highway network and replace the TAZ centroids when building transit skims
Transit Access Points and ldquoon the flyrdquo Path Building
bull Transit skims are built TAP to TAP
Matrix origins and destinations are TAPS
Transit Access Points and ldquoon the flyrdquo Path Building
Trip Origins and
Destinations
MAZ to MAZ
Auto Skims
TAZ to TAZ
Transit Skims
TAP to TAP
The three spatial systems are put together by the mode choice model
ldquoOn the Flyrdquo Path Building
bull TAZs TAPs and MAZs are linked via drive and access connectors prior to running CT-RAMP
rmdir OUTDIRABMTEMP S Q rmdir DATADIRABMTEMP S Q xcopy OUTDIR OUTDIRABMTEMP E I Y xcopy DATADIR DATADIRABMTEMP E I Y if(fbi=1) need to run only the first time through - kdk CUBEctramprunCreateAccessFilescmd endif mkdir logFiles taskkill im javaexe F start CUBEctramprunHhMgrcmd JDK64 HOST_IP start CUBEctramprunMtxMgrcmd HOST_IP JDK64 rem start CUBEctrampconfigrunDrivercmd copy CUBEctrampserpm_abmproperties serpm_abmproperties Y ping -n 11 127001 gt nul CUBEctramprunSERPMAbmcmd SAMPLERATE VSAMPLERATE JDK64 CUBEctramprunCreateDemandMatricescmd SAMPLERATE VSAMPLERATE JDK64 taskkill im javaexe F rmdir OUTDIRctramp S Q rmdir DATADIRctramp S Q xcopy OUTDIRABMTEMPctramp OUTDIRctramp E I Y xcopy DATADIRABMTEMPctramp DATADIRctramp E I Y
ldquoOn the Flyrdquo Path Building
MAZ to MAZ Connectors
Created by finding shortest distance paths over an all-streets network Connects all MAZs within 15 mi
Used to represent walk mode distance and time
MAZ to TAP Connectors
Created by finding shortest distance paths over an all-streets network Connects each MAZ to all TAPs within 10 mi
Used to represent transit walk access and walk egress distance and time
TAZ to TAP Connectors
Connects each TAZ to all TAPs within the TAP maximum drive distance bull Bus TAPs ndash 4 miles bull Rail TAPs ndash 15 miles
Used to represent transit drive access and egress distance and time
ldquoOn the Flyrdquo Path Building
bull No actual links created on the network bull Connectivity is expressed in table format
ldquoOn the Flyrdquo Path Building
bull Once the access and walk connectors are created the mode choice model builds complete paths MAZ to MAZ transit paths
bull Local-only paths are built using the ldquolocalrdquo transit skim bull Express BRT Urban Rail and Commuter rail paths are all
built at the same time using the ldquopremiumrdquo transit skim bull For each MAZ to MAZ pair CT-RAMP keeps the shortest
generalized cost path for each available premium mode bull Even though only one ldquopremiumrdquo skim is built CT-RAMP
may find competing premium paths It may also find that the best path is a combination of two premium modes or a premium mode and local bus
Tour Mode Choice Model
Choice
Auto
Drive alone
GP(1)
Pay(2)
Shared ride 2
GP(3)
HOV(4)
Pay(5)
Shared ride 3+
GP(6)
HOV(7)
Pay(8)
Non-motorized
Walk(9)
Bike(10)
Transit
Walk access
Local bus(11)
Express bus(12)
BRT(13)
Urban rail(14)
Commuter rail(15)
PNR access
Local bus(16)
Express bus(17)
BRT(18)
Urban rail(19)
Commuter rail(20)
KNR access
Local bus(21)
Express bus(22)
BRT(23)
Urban rail(24)
Commuter rail(25)
School Bus(26)
Trip Mode Choice Model
bull Same nesting structure as the tour mode choice but conditional on the tour mode
bull Some trip modes may be unavailable depending on the tour mode
DA SR2 SR3+ Walk Wlk-Trn PNR-Trn KNR-Trn
DA Must - - - - - -
SR2 Can Can - Can - - -
SR3+ Can Can Can Can - - -
Walk - - - Must - - -
Wlk-Trn - Can Can Can Can - -
PNR-Trn Can Can Can Can Can Can
KNR-Trn - Can Can Can Can - Can
Trip Switching Rules Simplified
Transit Trip Reporting
bull In SERPM7 the transit boarding and alighting location can be reported in two ways ndash Trip list files (ABM output) -- Boarding TAP Alighting TAP
ndash Transit assignment (Cube output) ndash Route nodes
bull Each type of reporting has its strengths ndash Trip list file allows building detailed transit trip patterns for
population cohorts and time periods
bull Mode split reports
bull Transit trip distance frequency distributions access distance TLFDs
bull Mode to mode transfers
ndash Note ABM reports only the first boarding TAP and the last alighting TAP regardless of mode
ndash Cube output gives aggregate link volumes station to station boardings etc
User Benefit Files
bull SERPM7 can produce FTA User Benefit files for input to SUMMIT
bull User benefits remain a useful analysis tool bull Steps to produce user benefit files require some manual
intervention ndash see User Guide
SERPM ABM Reports
bull Stores ABM inputs and outputs in a relational database to generate some standard model reports
bull Consistent reporting framework to be used for analysis across model runs
bull SERPM7 user community can easily share the scripts that create the reports
bull Reports take the form of Excel workbooks bull Foundation for future development of a visualization
dashboard
Reporting Database Components
Reporting Database Components
bull Reporting ETL (extract transform and load) program ndash Loads all Cube and CT-RAMP Java model outputs into the database
ndash Written in Cube scripts and Java
bull Database ndash Stores all data used in reporting including select network skims
household person tour and trip data zonal data etc
ndash Implemented with SQL Server
bull Report scripts to generate reports ndash Written in T-SQL
bull Report packaging program ndash Generates Excel workbooks with one report per worksheet
ndash Written in Java
Reporting Database Components
bull Run time required to build database and generate reports varies with sample size and type of report ndash Several hours required to build the database for a 100 sample
ndash ~ 30 minutes to produce reports for a 10 sample
bull Report step is optional not part of a standard model run bull Report production is transparent to the user
bull hellip but users can contribute reports bull hellip and choose which reports to build at any one time
Running SERPM ABM Reports
bull Report queries reside in ctrampreports_sql time_spent_travelingsql Total weekday travel time by person type
and income group
total_trips_typesql Trips by trip mode person type county of residence and tour purpose
total_tours_typesql Tours by trip mode person type county of residence and tour purpose
tours_districtssql Tours by tour purpose and tour origin and destination districts
transit_access_time+distsql Drive to transit trip list with many trip details
hellip
Running SERPM ABM Reports
bull List of reports to run is specified in properties file ndash ctrampserpm_reportsproperties
sqlscriptsdirectory = Cserpm7ctrampreports_sql sqlscriptsschemakey = SCHEMA sqlscripts=cleanupsqltransit_access_time+distsql worksheettables=temptransittrips worksheetnames=TransitTrips workbookname = Cserpm7ctrampreports_sqlSERPM_REPORTXLS databaseschema = 2010R databaseipaddress = w-ampdx-d-sag10 databaseinstance = databaseport = 1433 databasename=SERPMABM databaseusername=serpm databasepassword=s3rpm
Adding Reports
bull Step 1 --Write report query ndash T-SQL
ndash User Guide includes a database data dictionary
bull Step 2 ndash Add query to ctrampreports_sql ndash Each query is contained in a single text file
ndash Drop file in reports folder
bull Step 3 ndash Add the query to the properties file sqlquery = Query file name
Worksheettables = Query output
Worksheetnames = Name for the report worksheet
Sample SERPM ABM Reports
bull Exhibit ctrampreports_sqlserpm_reportsxls
More information Shi-Chiang Li | shi-chianglidotstateflus |954 777 4655 Rosella Picado | picadopbworldcom | 206 382 5227 Ken Kaltenbach |kkaltenbachcorradinocom |502 587 7221

Running SERPM7 with a Population Sample
Running SERPM7 with a Population Sample
bull Sample Output ndash Individual Route Boardings
Running SERPM7 with a Population Sample
bull Sample Output ndash Individual Route Boardings
Running SERPM7 with a Population Sample
bull Sample Output ndash Regionwide Household Income Profile
Household Income 25 Sample 100 Sample
Less than $10000 1015 1021
$10000 to $15000 470 468
$15000 - $20000 566 564
$20000 to $25000 519 516
$25000 to $30000 493 494
$30000 to $35000 475 477
$35000 to $40000 387 387
$40000 to $45000 343 345
$45000 to $50000 348 348
$50000 to $75000 1754 1747
$75000 to $100000 1432 1433
$100000 or More 2198 2200
Application 2 Population Synthesis
Population Synthesis
bull Each SERPM7 scenario requires a synthetic population ndash List of households -- hhFilecsv
ndash List of persons that make up the households -- personFilecsv
bull Two synthetic populations have been developed to date ndash 2010 base year population
ndash 2040 long range transportation plan population
Population Synthesis
bull New synthetic populations will be required for ndash Other regional scenario years (eg 2020 2025 2045)
ndash To test population and land use scenarios such as
bull Traffic impact study for a new housing or commercial development
bull Impact of aging population
bull Impact of rising sea levels (because some neighborhoods will no
longer be inhabitable)
bull Refinements to the 2010 and 2040 populations
Population Synthesis
bull The population synthesizer (PopSynII) does not run normally as part of SERPM7 ndash SERPM7 expects input population files in the input folder
ndash User is responsible for running PopSynII to generate the required population files and place them in the scenario folders prior to a SERPM7 run
bull Why ndash Because a new synthetic population is not required for every run
PopSyn II Setup
bull PopSynII is already configured to run on the FDOT servers bull Java application using SQL data storage
PopSynII installed in the main ctramp folder
PopSynII Setup
bull The ctramppopsyn folder
Filename Description
runAllPopsynbat Batch file that controls the execution of PopSynII
controls SQL settings file that specifies the population attributes used as controls
1_importCSVsql 2_createTargetssql 3_createSynHHPerFilessql
SQL scripts that run the PopSynII software
2010_TAZ_Datacsv TAZ input control data
2010_MAZ_Datacsv MAZ input control data
Developing a New Synthetic Population
bull Step 1 ndash Prepare the input files ndash TAZ controls 2010_taz_datacsv
ndash MAZ controls 2010_maz_datacsv
Developing a New Synthetic Population
bull MAZ Control input file eg 2010_maz_datacsv ndash Estimates of total households and persons living in group quarters
bull Total households
bull Total group quarter population
ndash One record for each MAZ
Developing a New Synthetic Population
bull TAZ Controls input file -- eg 2010_taz_datacsv ndash Estimates of number of households or population for each SERPM7
controlled attribute
bull Household size
bull Household income
bull Household workers
bull Type of dwelling unit
bull Presence of children in the household
bull Population age group
bull Gender
bull Raceethnicity
bull Population in group quarters
ndash One record per TAZ
Analogous to the TAZ SE data file in the trip-
based model
Developing a New Synthetic Population
When preparing TAZ and MAZ control data it is critically important to
maintain internal data consistency
Developing a New Synthetic Population
bull Some data checks to perform and problems to look out for ndash The household and person marginals pertain to household residents
only except for the group quarter controls
ndash All household-based marginals add up to the same total households for each TAZ
ndash All person-based marginals add up to the same total persons for each TAZ
ndash The total number of persons implied by the household size marginal is consistent with the sum total of the person marginals
ndash The total number of children obtained from the age marginal is consistent with the marginal of households by presence of children
ndash Large deviations from 5050 split of persons by gender is suspect
ndash The household income distribution is consistency with the workers-in-household distribution
Developing a New Synthetic Population
bull More data checks ndash The MAZ and TAZ controls should add up
bull to the same number of households by TAZ
bull to the same number of persons in group quarters by TAZ
Developing a New Synthetic Population
bull Exhibit ndash SERPM7 2010 TAZ control file
Example ndash Minto West Palm Beach Co
Example ndash Minto West
bull Mixed-use development in a agricultural area adjacent to an existing housing development
bull Information available from proposedapproved plans ndash Single-family dwelling units ndash 5050
ndash Multi-family dwelling units ndash 1040
ndash Total population ndash 14 535 persons
ndash Spatial location of dwelling units by type
bull Other PopSyn required data not available from plans (income distribution age distribution etc) ndash Estimateassert it based on similar existing developments
surrounding neighborhood
Example ndash Minto West
bull Adding householdspersons to a TAZ
bull Adding TAZs or MAZs to SERPM7 should be a rare occurrence ndash Households are ultimately allocated to MAZs and therersquos already
12000 of them
ndash Households are represented individually so the zone attributes are derived from them
Trip-Based Model Modify the input zonal data file
Activity-Based Model Modify the population synthesis control file
Running PopSynII
bull Step 2 ndash Modify the PopSyn settings file for this run ndash Update TAZ and MAZ control filenames in runAll_popsynbat
REM BATCH FILE TO SETUP POPSYN RUN RUN POPSYNII AND OUTPUT CSV FILES REM SETUP REM PLEASE SET PATH NAMES FOR WORKING FOLDER AND CSV FILE LOCATIONS SET SERVERNAME=W-AMSTL-D-00052SQLEXPRESS SET DATABASENAME=popSyn SET ARCPATH=Cpopsyn SET CSVPATH_CONTROLS=Cpopsyninputscontrolscsv SET CSVPATH_MAZ=Cpopsyninputs2010_MAZ_Data_20120207csv SET CSVPATH_TAZ=Cpopsyninputs2010_TAZ_Data_20120207csv REM MAIN SCRIPT REM MAKE FILENAMES TABLE REM sqlcmd -S SERVER NAME -E -i INPUT FILE PATH (SCRIPT) -o OUTPUT LOG REM -E means to use Windows authentication for the user that is running the batch file SQLCMD -S SERVERNAME -d DATABASENAME -E -Q IF OBJECT_ID(dbocsv_filenames) IS NOT NULL DROP TABLE csv_filenames -o ARCPATHResultLogtxt
hellip hellip
Running PopSynII
bull Other PopSyn settings ndash rarely used in a production run ndash Change the control attributes
ndash Change the priority of control attributes
Running PopSynII
bull Step 3 ndash Run PopSynII -- runAll_popsynbat
Running PopSynII
bull Step 4 ndash Review Output amp Check Fit to Controls
Output File Description
hhFilecsv List of households
personFilecsv List of persons
ZoneResultscsv Comparisons of synthetized households to controlled and uncontrolled attributes
BalanceDetailscsv
ValidationStatscsv
ValidationStatsByPumacsv
Reviewing PopSyn Output
bull Zone_Resultscsv bull Comparison of synthesized totals to target totals for each
TAZ and controlled attribute
TOTAL_HOUSEHOLDS
ZONE TARGET SYNTHESIZED DIFFERENCE PCTDIFF
1 715 715 0 0
2 811 811 0 0
3 878 878 0 0
4 826 826 0 0
5 1181 1181 0 0
6 212 212 0 0
7 459 459 0 0
8 253 253 0 0
Reviewing PopSyn Output
bull Balance_Detailscsv bull Same output as Zone_Results different format
Zone Control ID ControlCat Target PUMSVal ConStat
1989 109 TOTAL_HOUSEHOLDS 1508 1508 yes
1989 249 INCOME_25K 273 271 no
1989 19 HHSIZE_4PLUS 467 467 yes
1989 160 FEMALE 2196 2108 no
1989 55 INCOME_100K 258 257 yes
1989 67 MULTI_UNIT 423 407 no
1989 31 WORKERS_3PLUS 164 166 no
Reviewing PopSyn Output
bull Validation_Statscsv ndash Comparison of synthesized attributes to input Census data (5 PUMS)
ndash Includes uncontrolled attributes
Description popSynSum censusSum meanDiff stdDev minDiff maxDiff Universe 1 number of households 2085375 1964881 17 61 -97 331
family 67 65 3 17 -26 48
non family 33 35 0 34 -58 111
size 1 27 28 0 36 -59 111
size 2 31 32 -3 14 -30 30
size 3 17 17 1 22 -37 53
size 4 25 23 18 50 -46 160
Reviewing PopSyn Output
bull Validation_StatsByPumacsv ndash Same as validation_stats but for each PUMA
bull Note that synthesized population may differ from 5 Census population by design
Application 3 ndash Highway Project
Highway Project
Example Projects ndashToll road extension ndashReversible lanes ndashManaged lanes
Overview
How to use SERPM7 to perform a model run and do some standard analysis ndash Option 1 -- Code the project directly on the geodatabase
bull Roadway links
bull Node links
bull Turn penalties
bull [assume no change to transit]
ndash Option 2 --Code the project on net files and then build the geodatabase
bull Use flowchart script to build the geodatabase
ndash Coding is very similar to earlier versions of SERPM
bull Facility types are the same
SERPM Facility Types (not new)
Editing the Highway Network
bull SERPM 7 requires a geodatabase bull Editing can be done either to a net file or directly on the
geodatabase bull The user can use utilities in the model flowchart to write a
net file from the geodatabase edit the net and then write it to the geodatabase
bull The geodatabase must exist to run the model
Editing in the Geodatabase
bull Simplest and most direct method bull Requires an understanding of the CubeArcGIS tools
Export geodatabase and edit as a net
bull Start Data Manager bull Open geodatabase (SERPM_NETSMDB) bull Double click on the network Input Hwy Net and specify an
output file (maybe ldquoeditnetrdquo) bull Open from Cube and edit as usual bull Use ldquoPrepare for Model Run and Trap Errorsrdquo (2) utilities to
write back to geodatabase ndash Reload geodatabase from Cube files ndash Cull and sort
ndash Write to geodatabase
Edit as a net
Export Edit in Cube
Change to point to edited network
Input Hwy Net
Toll Road Extension
bull Short Cut ndash copy an existing toll link bull No special NODE attributes bull Only new attribute is ISTOLL=1 for all links that could not be
used unless a toll were paid bull Toll Mainline FTC2=91 ISTOLL=1 DIRCODE=1 bull Plaza (gantry) ndash assume all will be electronic collection ndash TOLL=1 DIRCODE=1
ndash TOLLTYPE=3 CARTOLL=toll in dollars
ndash FTC2=95
ndash ISTOLL=1
ndash SVCSECONDS=001
ndash DELCODE=1 ACCELCODE=1 AVILANES=2
Toll Road Extension
Not much different from earlier versions of SERPM
Reversible Lanes
bull Control by the link attribute REVERSIBLE ndash REVERSIBLE=1 means AM operation only
ndash REVERSIBLE=2 means PM operation only
ndash I-595 example
Managed Lanes (typically Express)
bull HOT=1 ndash 98 (99 makes the link a dummy) bull FTC2 most likely=91 but other types permitted bull TOLL=0 ISTOLL=0 bull Tolls set by HOTTOLLdbf
HOT Lanes Tolls
bull Set as a function of the VC bull Updated in the travel time feedback loop bull Affects the TollFree split in mode choice bull Column HOT_x were x=HOT link attribute bull HOT_1 is the current 95 Express rate HOT_2 is a placeholder
Common Errors
bull Errors to watch out for ndash If network steps fail look for missing attributes
ndash Update transit routes as needed due to changes to underlying highway network
ndash Check for dangling links and unconnected zones
ndash Verify that all TAZs are connected to lsquofreersquo roads
bull Special procedures required for TAZs that have toll-only access must
include the attribute ISRCTOLLINK=1 (currently used for the
Rickenbacker Causeway)
ndash Some CT-RAMP errors caused by network coding errors may not be apparent until feedback loop 2 because in loop 1 CT-RAMP uses seed skims
bull Use small sample size when testing a new network
Was the Run Successful
bull Did the run converge ndash AM and PM travel time RMSE values reported to
OUTDIRfeedbacklogprn
ndash Run stops when RMSE is less than 01
ndash 2010 Scenario converges in 5 loops
bull What to do if it didnrsquot converge ndash Look for obvious errors
ndash Run more iterations (future year might require more)
bull Are the top-level results comparable to a similar run ndash Use HEVAL reports
ndash Examine screenlines (RMSE reports)
ndash Spot check link loads
Tools for Analysis
bull Analysis ndash perform standard highway project type analyses
bull Usual analysis similar to trip-based model ndash Total daily and period-specific roadway volumes and speeds by
vehicle class
ndash Vehicle trip OD matrices
bull Standard FSUTMS HEVAL and RMSE reports are still available ndash Day and period assignments
ndash By County
ndash Truck assignment
Tools for Analysis
bull Potential for customized assignment classes to address
specific project questions ndash Does the manage lane serve primarily high income users
bull Stratify vehicle classes by lowhigh income to understand facility
usage by income level
bull Stratify vehicle classes by disadvantaged population cohorts
bull Trip and person tabulations built from ABM output ndash Trip mode shares for many different population cohorts subareas
ndash For example toll vs non-toll shares by value of time or fine-graded income levels
ndash Many other possibilities
Application 4 ndash Mobility Project
Mobility Project ndash SUNPASS Market Share
bull Persons in households that own a SUNPASS transponder respond differently to managed lane and toll road policies ndash Pay lower tolls than cash users
ndash Have access to I-95 managed lanes
bull Policy questions ndash How does projected toll traffic and revenue vary with the SUNPASS
penetration rate and toll discount
ndash How will SUNPASS penetration rate vary as more managed lane facilities are built in the region
Mobility Project ndash SUNPASS Market Share
bull Question 1 -- How does projected toll traffic and revenue vary with the SUNPASS penetration rate and toll discount
bull Procedure ndash Step1 ndash Assume a SUNPASS market share by modifying the toll
transponder model
ndash Step 2 ndash Run SERPM7 to produce traffic volumes
ndash Step 3 ndash Estimate toll traffic revenue
Modifying the Toll Transponder Ownership Model
bull Model specification is contained in TransponderOwnershipxls and can be edited with Microsoft Excel
Utility Variable Coefficient
Expected time savings up to 644 min 00631
Distance less than 5 miles -00304
Distance between 5 and 10 miles -00648
Distance 10 miles or more -00648
Constant 04877
Modifying the Toll Transponder Ownership Model
Utility Variable Coefficient
Expected time savings up to 644 min 00631
Distance less than 5 miles -00304
Distance between 5 and 10 miles -00648
Distance 10 miles or more -00648
Constant 04877
Increasing the constant will increase the number of households equipped with transponders
TransponderOwnershipxls
Modifying the Toll Transponder Model
bull Increase the constant by how much ndash Process is akin to model calibration
ndash Several runs of the transponder model required to estimate the constant that yields the desired market share
ndash 2010 market share is approximately 65
ndash Use a small sample (5 or 10) to save run-time while establishing the right constant
Modifying the Toll Transponder Model
bull Variation ndash Add terms to the model so that certain types of households are more
likely to exhibit a SUNPASS market share increase
bull Highlow income households
bull Multi-car households
bull Miami-Dade households
Modifying the Toll Transponder Model
bull Exhibit TransponderOwnershipxls
Mobility Project ndash SUNPASS Market Share
bull Question 2 -- How will SUNPASS penetration rate vary as more managed lane facilities are built in the region
bull Procedure ndash Step 1 ndash Code the manage lane facilities
ndash Step 2 ndash Run SERPM7 to forecast transponder ownership
ndash Step 3 ndash Analyze the forecast household data for changes in the profile of households equipped with transponders
Application 5 ndash Land Use Project
Land Use Project
bull Transportation projects comprise not only network scenarios but also land use scenarios
bull Land use scenarios can be ndash Very large scale (substantial changes to housing and employment
estimates throughout the region) or
ndash Small scale (localized changes for example for a traffic impact study)
bull For both large scale and small scale land use updates the
general procedure for updating the input data and running the model is the same
Land Use Project
bull The land use data in SERPM7 consists of ndash Synthetic population and derived input files
ndash Employment data
ndash School enrollment data
ndash Parking costs and parking spaces
ndash Regional shopping mall special generators
ndash Beach special generators
ndash Hotel and motel room data
Land Use Project
bull The land use data reside in different input files
Data Item Input File
Synthetic Population hhFilecsv personFilecsv ctramppopsynTAZDatacsv ctramppopsynMAZDatacsv
Employment School Enrollment Parking Supply Data Special Generators Hotel and Motel Rooms
inputsIN-2010Rmaz_datacsv
Land Use Project
bull As demonstrated earlier SERPM 7 requires significantly more comprehensive socio-economic inputs as compared to previous versions ndash Greater spatial detail
ndash More categoriestypes of land uses
bull These inputs require additional preparation when
performing land use model runs
Land Use Project
Data Required and examples bull Population
bull Age distribution of the population expected to live in the
development
bull Income profile
bull Type of dwelling unit (single-family vs multi-family)
ndash The input data need to be internally consistent (distribution of households by presence of children needs to be consistent with population age distribution for example)
Land Use Project
Data Required bull Employment classification ndash Previous models had three
employment classifications
ndash In SERPM 7 there are 16 employment categories to better differentiate type of land use and improve the relationship between land use and activity purpose
Land Use Project
Data Required bull School enrollment ndash note that it differentiates by grade level
(K-8 high-school collegepost-secondary) ndash Donrsquot forget to include school faculty and staff in employment
Land Use Project
Data Required bull Parking supply and
parking costs ndash Parking spaces may
reflect use restrictions
bull Monthly
bull Daily
bull Hourly
ndash Parking costs consistent with type of use
Land Use Project
bull Park Area 1 (pink) ndash May park in MAZ other
than destination MAZ
ndash Parking cost applies
bull Park Area 2 (gree) ndash Parks at destination MAZ
ndash Parking cost applies
Land Use Project
Data Required bull Visitor Model ndash Number of hotel and motel rooms
bull Special Generators ndash Regional shopping malls
ndash Beach recreation areas
Land Use Project
The Gardens Mall Aventura Mall
Boynton Mall Dolphin Mall
Delray Community Mall Dadeland Mall
Towncenter Mall The Falls Shopping Center
Wellington Greens Mall Cutler Ridge Mall
Coral Square Mall Bal Harbour Shops
Pompano Citi Centre CocoWalk
Sawgrass Mills Mall The Mall at 163rd Street
Broward Mall Mall of the Americas
Galleria Mall Mary Brickell Village
Pembroke Lakes Mall Miami International Mall
Lakes Mall Miracle Marketplace
Oakwood Plaza Village of Merrick Park
The Promenade at Coconut Creek Westland Mall
Regional Shopping Mall Special Generators
Land Use Project
Deerfield Beach
Pompano Beach
Fort Lauderdale Beach
Fort Lauderdale Beach
Hollywood Beach
South Beach
Haulover Beach
Crandon Park
Dania Beach
Bill Baggs State Park
Beach Special Generators
Land Use Project
Sample Problem
bull MINTO West Example - a mixed residentialcommercial development ndash 6500 singlemulti-family residential units in multiple TAZs
ndash 14 million square feet of non-residential space
ndash 150 room hotel
ndash 3000 student college campus
Land Use Project
MINTO WEST
Land Use Project
TAZsMAZs representing MINTO West Development
Land Use Project
Need to translate population household and employment information from developer into model input data ndash As discussed in the Population Synthesis presentation population and
household attribute estimates can be taken from other known nearby neighborhoods
bull In this sample problem first start by allocating percentages of total
households into individual MAZs within the development area
bull Keep in mind household density when estimating the number of
households in each MAZ
Land Use Project
bull In this sample employment can be assumed to include bull Retail
bull RestaurantsBars
bull Offices
bull Health services
bull Hotelmotel employment and
bull Educational employment
ndash As with households yoursquoll need to apportion the employment areas to individual MAZs while keeping in mind the types of employment expected in those locations
Land Use Project
bull Employment data is usually estimated by converting floor space available to individual types of employment through conversion factors
bull ie ndash (3000 sqft office space)(20 sqft per office employee) =
150 office employees
Land Use Project
bull Once population household and employment figures are estimated they are entered into the appropriate model input file
bull Population ndash TAZ synthetic population control file
bull Household ndash TAZ synthetic population control file
bull Employment School Parking and Special Gen ndash maz_datacsv
bull Ensure that population household and employment figures
are the same in each file
bull Prior to performing model run PopSyn must be run and user must copy output files to SERPM7 input folders
Application 6 ndashTransit Project
Transit Project ndash MetroRail North Corridor
SERPM Transit Modes
Transit Mode Tour and Trip
Mode TAP Transit Skim Mode
Tri-Rail Commuter Rail Premium
Metrorail Urban Rail Premium
I-95 Inter-County Express I-95X I-95E
Express Bus Premium
Busway BRT Premium
MDT Express Express Bus Premium
Metromover Local Bus Local Bus
MDT Local BCT Local
Palm Tran Local Local Bus Local Bus
Breeze Local Bus Local Bus
Tri-Rail Shuttles Local Bus Local Bus
SERPM Transit Modes
Transit Mode Tour and Trip
Mode TAP Transit Skim
Mode
Mode coded on the route ldquocardsrdquo
Used to specify boarding and transfer penalties for transit
path building
(most disaggregate)
Line-haul choices in the tour and trip mode choice
models
Used to create sets of TAP to TAP levels of service
(most aggregate)
Similar to SERPM 67 SERPM 7 ABM
SERPM Transit Modes S67 Mode Local (L) S7
Mode Mode Name Operator amp Name UserA4 Name Prem (P) MODE
15 Tri-Rail 11 Tri-Rail 15 Commuter P 111
14 Metrorail 25 Metrorail 14 Urban Rail P 121
X Regional LRT Regional LRT 14 LRT P 131
16 Inter-County Express Bus 33 I-95 Inter-County Express 16 Express P 151
12 Exclusive ROW Cir-Reg 13 Exclusive ROW Cir-Reg 12 Mover L 181
11 TrolleysShuttles-Reg 12 Tri-Rail Shuttles 11 Local L 191
11 TrolleysShuttles-Reg 12 Tri-Rail Shuttles 33 Local L 192
X LRT- MDT 25 MDT LRT 14 LRT P 231
16 Buses (localexpress) - MDT 27 MDT Busway Flyers 27 BRT P 241
23 Buses (localexpress) - MDT 27 MDT MAXKATBusway Local 27 BRT P 242
24 BRT - MDT 28 MDT BRTLRT 28 BRT P 243
23 Buses (localexpress) - MDT 22 MDT Express 24 Express P 251
16 Buses (localexpress) - MDT 24 MDT I-95 Exp 26 Express P 252
16 Inter-County Express Bus 24 I-95 Inter-County Express 16 Express P 253
22 Exclusive ROW Cir-MDT 26 Metromover 22 Mover L 281
21 TrolleysShuttles-MDT 21 MDT TrolleysShuttles 21 Local L 291
23 Buses (localexpress) - MDT 21 MDT Local 23 Local L 292
23 Buses (localexpress) - MDT 23 MDT Shuttle 25 Local L 293
X LRT - BCT 35 BCT LRT 37 LRT P 331
34 BCT Rapid Bus BRT 34 BCT Rapid Bus 36 BRT P 341
34 BCT Fixed-guideway BRT 35 BCT BRT 37 BRT P 342
33 Buses (localexpress) - BCT 32 BCT Breeze 34 Express P 351
33 Buses (localexpress) - BCT 33 BCT Express 35 Express P 352
32 Exclusive ROW Cir-BCT 31 BCT Exclusive ROW Cir 32 Mover L 381
31 TrolleysShuttles-BCT 31 BCT TrolleysShuttles 31 Local L 393
33 Buses (localexpress) - BCT 31 BCT Local 27 Local L 391
33 Buses (localexpress) - BCT 31 BCT Local 33 Local L 392
X LRT - Palm Tran 43 Palm Tran LRT 44 LRT P 431
44 BRT - Palm Tran 43 Palm Tran BRT 44 BRT P 441
43 Buses (localexpress) - Ptran 42 Palm Tran Exp 44 Express P 451
42 Exclusive ROW Cir-PTran 41 Palm Tran Exclusive ROW Cir 42 Mover L 481
41 TrolleysShuttles-Ptran 41 Palm Tran TrolleysShuttles 41 Local L 491
43 Buses (localexpress) - Ptran 41 Palm Tran Local 43 Local L 492
Modes Not in the 2010 Network
SERPM7 Transit Network Building
bull Typically bus routes are coded on top of existing highway links
bull SERPM7 reserves some facility type codes for transit-only use helpful to more accurately represent route ndash Caution -- make sure network integrity is preserved once transit only
links are removed
bull Rail routes require coding first fixed-guideway links
SERPM7 Transit Network Building
bull Route Attributes -- User Coded ndash Name
ndash Long Name
ndash Mode
ndash Operator
ndash Headway[1] ndash AM Peak
ndash Headway[2] ndash Midday
ndash Headway[3] ndash PM Peak
ndash UserA4 (stop dwell time)
SERPM7 Transit Network Building
bull PNR Node Attributes ndash User Coded ndash Parking Spaces
ndash Parking Cost AM
ndash Parking Cost MD
ndash Terminal Time PNR
ndash Terminal Time KNR
bull At this time parking spaces is used only to identify park-n-ride locations (parking spaces gt 0)
SERPM7 Transit Network Building
bull Transit Access Points -- Created by Cube for the ABM ndash One TAP for each stop on premium routes
bull Tri-Rail Metrorail Express Bus BRT
ndash One TAP for each Local Bus park-n-ride node
ndash Synthesized TAPs to represent access to local bus stops
bull Transit Access Point Attributes ndash TAP Mode
ndash Inherit PNR node data
Sample Highway Network with TAPs
TAPs become part of the highway network and replace the TAZ centroids when building transit skims
Transit Access Points and ldquoon the flyrdquo Path Building
bull Transit skims are built TAP to TAP
Matrix origins and destinations are TAPS
Transit Access Points and ldquoon the flyrdquo Path Building
Trip Origins and
Destinations
MAZ to MAZ
Auto Skims
TAZ to TAZ
Transit Skims
TAP to TAP
The three spatial systems are put together by the mode choice model
ldquoOn the Flyrdquo Path Building
bull TAZs TAPs and MAZs are linked via drive and access connectors prior to running CT-RAMP
rmdir OUTDIRABMTEMP S Q rmdir DATADIRABMTEMP S Q xcopy OUTDIR OUTDIRABMTEMP E I Y xcopy DATADIR DATADIRABMTEMP E I Y if(fbi=1) need to run only the first time through - kdk CUBEctramprunCreateAccessFilescmd endif mkdir logFiles taskkill im javaexe F start CUBEctramprunHhMgrcmd JDK64 HOST_IP start CUBEctramprunMtxMgrcmd HOST_IP JDK64 rem start CUBEctrampconfigrunDrivercmd copy CUBEctrampserpm_abmproperties serpm_abmproperties Y ping -n 11 127001 gt nul CUBEctramprunSERPMAbmcmd SAMPLERATE VSAMPLERATE JDK64 CUBEctramprunCreateDemandMatricescmd SAMPLERATE VSAMPLERATE JDK64 taskkill im javaexe F rmdir OUTDIRctramp S Q rmdir DATADIRctramp S Q xcopy OUTDIRABMTEMPctramp OUTDIRctramp E I Y xcopy DATADIRABMTEMPctramp DATADIRctramp E I Y
ldquoOn the Flyrdquo Path Building
MAZ to MAZ Connectors
Created by finding shortest distance paths over an all-streets network Connects all MAZs within 15 mi
Used to represent walk mode distance and time
MAZ to TAP Connectors
Created by finding shortest distance paths over an all-streets network Connects each MAZ to all TAPs within 10 mi
Used to represent transit walk access and walk egress distance and time
TAZ to TAP Connectors
Connects each TAZ to all TAPs within the TAP maximum drive distance bull Bus TAPs ndash 4 miles bull Rail TAPs ndash 15 miles
Used to represent transit drive access and egress distance and time
ldquoOn the Flyrdquo Path Building
bull No actual links created on the network bull Connectivity is expressed in table format
ldquoOn the Flyrdquo Path Building
bull Once the access and walk connectors are created the mode choice model builds complete paths MAZ to MAZ transit paths
bull Local-only paths are built using the ldquolocalrdquo transit skim bull Express BRT Urban Rail and Commuter rail paths are all
built at the same time using the ldquopremiumrdquo transit skim bull For each MAZ to MAZ pair CT-RAMP keeps the shortest
generalized cost path for each available premium mode bull Even though only one ldquopremiumrdquo skim is built CT-RAMP
may find competing premium paths It may also find that the best path is a combination of two premium modes or a premium mode and local bus
Tour Mode Choice Model
Choice
Auto
Drive alone
GP(1)
Pay(2)
Shared ride 2
GP(3)
HOV(4)
Pay(5)
Shared ride 3+
GP(6)
HOV(7)
Pay(8)
Non-motorized
Walk(9)
Bike(10)
Transit
Walk access
Local bus(11)
Express bus(12)
BRT(13)
Urban rail(14)
Commuter rail(15)
PNR access
Local bus(16)
Express bus(17)
BRT(18)
Urban rail(19)
Commuter rail(20)
KNR access
Local bus(21)
Express bus(22)
BRT(23)
Urban rail(24)
Commuter rail(25)
School Bus(26)
Trip Mode Choice Model
bull Same nesting structure as the tour mode choice but conditional on the tour mode
bull Some trip modes may be unavailable depending on the tour mode
DA SR2 SR3+ Walk Wlk-Trn PNR-Trn KNR-Trn
DA Must - - - - - -
SR2 Can Can - Can - - -
SR3+ Can Can Can Can - - -
Walk - - - Must - - -
Wlk-Trn - Can Can Can Can - -
PNR-Trn Can Can Can Can Can Can
KNR-Trn - Can Can Can Can - Can
Trip Switching Rules Simplified
Transit Trip Reporting
bull In SERPM7 the transit boarding and alighting location can be reported in two ways ndash Trip list files (ABM output) -- Boarding TAP Alighting TAP
ndash Transit assignment (Cube output) ndash Route nodes
bull Each type of reporting has its strengths ndash Trip list file allows building detailed transit trip patterns for
population cohorts and time periods
bull Mode split reports
bull Transit trip distance frequency distributions access distance TLFDs
bull Mode to mode transfers
ndash Note ABM reports only the first boarding TAP and the last alighting TAP regardless of mode
ndash Cube output gives aggregate link volumes station to station boardings etc
User Benefit Files
bull SERPM7 can produce FTA User Benefit files for input to SUMMIT
bull User benefits remain a useful analysis tool bull Steps to produce user benefit files require some manual
intervention ndash see User Guide
SERPM ABM Reports
bull Stores ABM inputs and outputs in a relational database to generate some standard model reports
bull Consistent reporting framework to be used for analysis across model runs
bull SERPM7 user community can easily share the scripts that create the reports
bull Reports take the form of Excel workbooks bull Foundation for future development of a visualization
dashboard
Reporting Database Components
Reporting Database Components
bull Reporting ETL (extract transform and load) program ndash Loads all Cube and CT-RAMP Java model outputs into the database
ndash Written in Cube scripts and Java
bull Database ndash Stores all data used in reporting including select network skims
household person tour and trip data zonal data etc
ndash Implemented with SQL Server
bull Report scripts to generate reports ndash Written in T-SQL
bull Report packaging program ndash Generates Excel workbooks with one report per worksheet
ndash Written in Java
Reporting Database Components
bull Run time required to build database and generate reports varies with sample size and type of report ndash Several hours required to build the database for a 100 sample
ndash ~ 30 minutes to produce reports for a 10 sample
bull Report step is optional not part of a standard model run bull Report production is transparent to the user
bull hellip but users can contribute reports bull hellip and choose which reports to build at any one time
Running SERPM ABM Reports
bull Report queries reside in ctrampreports_sql time_spent_travelingsql Total weekday travel time by person type
and income group
total_trips_typesql Trips by trip mode person type county of residence and tour purpose
total_tours_typesql Tours by trip mode person type county of residence and tour purpose
tours_districtssql Tours by tour purpose and tour origin and destination districts
transit_access_time+distsql Drive to transit trip list with many trip details
hellip
Running SERPM ABM Reports
bull List of reports to run is specified in properties file ndash ctrampserpm_reportsproperties
sqlscriptsdirectory = Cserpm7ctrampreports_sql sqlscriptsschemakey = SCHEMA sqlscripts=cleanupsqltransit_access_time+distsql worksheettables=temptransittrips worksheetnames=TransitTrips workbookname = Cserpm7ctrampreports_sqlSERPM_REPORTXLS databaseschema = 2010R databaseipaddress = w-ampdx-d-sag10 databaseinstance = databaseport = 1433 databasename=SERPMABM databaseusername=serpm databasepassword=s3rpm
Adding Reports
bull Step 1 --Write report query ndash T-SQL
ndash User Guide includes a database data dictionary
bull Step 2 ndash Add query to ctrampreports_sql ndash Each query is contained in a single text file
ndash Drop file in reports folder
bull Step 3 ndash Add the query to the properties file sqlquery = Query file name
Worksheettables = Query output
Worksheetnames = Name for the report worksheet
Sample SERPM ABM Reports
bull Exhibit ctrampreports_sqlserpm_reportsxls
More information Shi-Chiang Li | shi-chianglidotstateflus |954 777 4655 Rosella Picado | picadopbworldcom | 206 382 5227 Ken Kaltenbach |kkaltenbachcorradinocom |502 587 7221

Running SERPM7 with a Population Sample
bull Sample Output ndash Individual Route Boardings
Running SERPM7 with a Population Sample
bull Sample Output ndash Individual Route Boardings
Running SERPM7 with a Population Sample
bull Sample Output ndash Regionwide Household Income Profile
Household Income 25 Sample 100 Sample
Less than $10000 1015 1021
$10000 to $15000 470 468
$15000 - $20000 566 564
$20000 to $25000 519 516
$25000 to $30000 493 494
$30000 to $35000 475 477
$35000 to $40000 387 387
$40000 to $45000 343 345
$45000 to $50000 348 348
$50000 to $75000 1754 1747
$75000 to $100000 1432 1433
$100000 or More 2198 2200
Application 2 Population Synthesis
Population Synthesis
bull Each SERPM7 scenario requires a synthetic population ndash List of households -- hhFilecsv
ndash List of persons that make up the households -- personFilecsv
bull Two synthetic populations have been developed to date ndash 2010 base year population
ndash 2040 long range transportation plan population
Population Synthesis
bull New synthetic populations will be required for ndash Other regional scenario years (eg 2020 2025 2045)
ndash To test population and land use scenarios such as
bull Traffic impact study for a new housing or commercial development
bull Impact of aging population
bull Impact of rising sea levels (because some neighborhoods will no
longer be inhabitable)
bull Refinements to the 2010 and 2040 populations
Population Synthesis
bull The population synthesizer (PopSynII) does not run normally as part of SERPM7 ndash SERPM7 expects input population files in the input folder
ndash User is responsible for running PopSynII to generate the required population files and place them in the scenario folders prior to a SERPM7 run
bull Why ndash Because a new synthetic population is not required for every run
PopSyn II Setup
bull PopSynII is already configured to run on the FDOT servers bull Java application using SQL data storage
PopSynII installed in the main ctramp folder
PopSynII Setup
bull The ctramppopsyn folder
Filename Description
runAllPopsynbat Batch file that controls the execution of PopSynII
controls SQL settings file that specifies the population attributes used as controls
1_importCSVsql 2_createTargetssql 3_createSynHHPerFilessql
SQL scripts that run the PopSynII software
2010_TAZ_Datacsv TAZ input control data
2010_MAZ_Datacsv MAZ input control data
Developing a New Synthetic Population
bull Step 1 ndash Prepare the input files ndash TAZ controls 2010_taz_datacsv
ndash MAZ controls 2010_maz_datacsv
Developing a New Synthetic Population
bull MAZ Control input file eg 2010_maz_datacsv ndash Estimates of total households and persons living in group quarters
bull Total households
bull Total group quarter population
ndash One record for each MAZ
Developing a New Synthetic Population
bull TAZ Controls input file -- eg 2010_taz_datacsv ndash Estimates of number of households or population for each SERPM7
controlled attribute
bull Household size
bull Household income
bull Household workers
bull Type of dwelling unit
bull Presence of children in the household
bull Population age group
bull Gender
bull Raceethnicity
bull Population in group quarters
ndash One record per TAZ
Analogous to the TAZ SE data file in the trip-
based model
Developing a New Synthetic Population
When preparing TAZ and MAZ control data it is critically important to
maintain internal data consistency
Developing a New Synthetic Population
bull Some data checks to perform and problems to look out for ndash The household and person marginals pertain to household residents
only except for the group quarter controls
ndash All household-based marginals add up to the same total households for each TAZ
ndash All person-based marginals add up to the same total persons for each TAZ
ndash The total number of persons implied by the household size marginal is consistent with the sum total of the person marginals
ndash The total number of children obtained from the age marginal is consistent with the marginal of households by presence of children
ndash Large deviations from 5050 split of persons by gender is suspect
ndash The household income distribution is consistency with the workers-in-household distribution
Developing a New Synthetic Population
bull More data checks ndash The MAZ and TAZ controls should add up
bull to the same number of households by TAZ
bull to the same number of persons in group quarters by TAZ
Developing a New Synthetic Population
bull Exhibit ndash SERPM7 2010 TAZ control file
Example ndash Minto West Palm Beach Co
Example ndash Minto West
bull Mixed-use development in a agricultural area adjacent to an existing housing development
bull Information available from proposedapproved plans ndash Single-family dwelling units ndash 5050
ndash Multi-family dwelling units ndash 1040
ndash Total population ndash 14 535 persons
ndash Spatial location of dwelling units by type
bull Other PopSyn required data not available from plans (income distribution age distribution etc) ndash Estimateassert it based on similar existing developments
surrounding neighborhood
Example ndash Minto West
bull Adding householdspersons to a TAZ
bull Adding TAZs or MAZs to SERPM7 should be a rare occurrence ndash Households are ultimately allocated to MAZs and therersquos already
12000 of them
ndash Households are represented individually so the zone attributes are derived from them
Trip-Based Model Modify the input zonal data file
Activity-Based Model Modify the population synthesis control file
Running PopSynII
bull Step 2 ndash Modify the PopSyn settings file for this run ndash Update TAZ and MAZ control filenames in runAll_popsynbat
REM BATCH FILE TO SETUP POPSYN RUN RUN POPSYNII AND OUTPUT CSV FILES REM SETUP REM PLEASE SET PATH NAMES FOR WORKING FOLDER AND CSV FILE LOCATIONS SET SERVERNAME=W-AMSTL-D-00052SQLEXPRESS SET DATABASENAME=popSyn SET ARCPATH=Cpopsyn SET CSVPATH_CONTROLS=Cpopsyninputscontrolscsv SET CSVPATH_MAZ=Cpopsyninputs2010_MAZ_Data_20120207csv SET CSVPATH_TAZ=Cpopsyninputs2010_TAZ_Data_20120207csv REM MAIN SCRIPT REM MAKE FILENAMES TABLE REM sqlcmd -S SERVER NAME -E -i INPUT FILE PATH (SCRIPT) -o OUTPUT LOG REM -E means to use Windows authentication for the user that is running the batch file SQLCMD -S SERVERNAME -d DATABASENAME -E -Q IF OBJECT_ID(dbocsv_filenames) IS NOT NULL DROP TABLE csv_filenames -o ARCPATHResultLogtxt
hellip hellip
Running PopSynII
bull Other PopSyn settings ndash rarely used in a production run ndash Change the control attributes
ndash Change the priority of control attributes
Running PopSynII
bull Step 3 ndash Run PopSynII -- runAll_popsynbat
Running PopSynII
bull Step 4 ndash Review Output amp Check Fit to Controls
Output File Description
hhFilecsv List of households
personFilecsv List of persons
ZoneResultscsv Comparisons of synthetized households to controlled and uncontrolled attributes
BalanceDetailscsv
ValidationStatscsv
ValidationStatsByPumacsv
Reviewing PopSyn Output
bull Zone_Resultscsv bull Comparison of synthesized totals to target totals for each
TAZ and controlled attribute
TOTAL_HOUSEHOLDS
ZONE TARGET SYNTHESIZED DIFFERENCE PCTDIFF
1 715 715 0 0
2 811 811 0 0
3 878 878 0 0
4 826 826 0 0
5 1181 1181 0 0
6 212 212 0 0
7 459 459 0 0
8 253 253 0 0
Reviewing PopSyn Output
bull Balance_Detailscsv bull Same output as Zone_Results different format
Zone Control ID ControlCat Target PUMSVal ConStat
1989 109 TOTAL_HOUSEHOLDS 1508 1508 yes
1989 249 INCOME_25K 273 271 no
1989 19 HHSIZE_4PLUS 467 467 yes
1989 160 FEMALE 2196 2108 no
1989 55 INCOME_100K 258 257 yes
1989 67 MULTI_UNIT 423 407 no
1989 31 WORKERS_3PLUS 164 166 no
Reviewing PopSyn Output
bull Validation_Statscsv ndash Comparison of synthesized attributes to input Census data (5 PUMS)
ndash Includes uncontrolled attributes
Description popSynSum censusSum meanDiff stdDev minDiff maxDiff Universe 1 number of households 2085375 1964881 17 61 -97 331
family 67 65 3 17 -26 48
non family 33 35 0 34 -58 111
size 1 27 28 0 36 -59 111
size 2 31 32 -3 14 -30 30
size 3 17 17 1 22 -37 53
size 4 25 23 18 50 -46 160
Reviewing PopSyn Output
bull Validation_StatsByPumacsv ndash Same as validation_stats but for each PUMA
bull Note that synthesized population may differ from 5 Census population by design
Application 3 ndash Highway Project
Highway Project
Example Projects ndashToll road extension ndashReversible lanes ndashManaged lanes
Overview
How to use SERPM7 to perform a model run and do some standard analysis ndash Option 1 -- Code the project directly on the geodatabase
bull Roadway links
bull Node links
bull Turn penalties
bull [assume no change to transit]
ndash Option 2 --Code the project on net files and then build the geodatabase
bull Use flowchart script to build the geodatabase
ndash Coding is very similar to earlier versions of SERPM
bull Facility types are the same
SERPM Facility Types (not new)
Editing the Highway Network
bull SERPM 7 requires a geodatabase bull Editing can be done either to a net file or directly on the
geodatabase bull The user can use utilities in the model flowchart to write a
net file from the geodatabase edit the net and then write it to the geodatabase
bull The geodatabase must exist to run the model
Editing in the Geodatabase
bull Simplest and most direct method bull Requires an understanding of the CubeArcGIS tools
Export geodatabase and edit as a net
bull Start Data Manager bull Open geodatabase (SERPM_NETSMDB) bull Double click on the network Input Hwy Net and specify an
output file (maybe ldquoeditnetrdquo) bull Open from Cube and edit as usual bull Use ldquoPrepare for Model Run and Trap Errorsrdquo (2) utilities to
write back to geodatabase ndash Reload geodatabase from Cube files ndash Cull and sort
ndash Write to geodatabase
Edit as a net
Export Edit in Cube
Change to point to edited network
Input Hwy Net
Toll Road Extension
bull Short Cut ndash copy an existing toll link bull No special NODE attributes bull Only new attribute is ISTOLL=1 for all links that could not be
used unless a toll were paid bull Toll Mainline FTC2=91 ISTOLL=1 DIRCODE=1 bull Plaza (gantry) ndash assume all will be electronic collection ndash TOLL=1 DIRCODE=1
ndash TOLLTYPE=3 CARTOLL=toll in dollars
ndash FTC2=95
ndash ISTOLL=1
ndash SVCSECONDS=001
ndash DELCODE=1 ACCELCODE=1 AVILANES=2
Toll Road Extension
Not much different from earlier versions of SERPM
Reversible Lanes
bull Control by the link attribute REVERSIBLE ndash REVERSIBLE=1 means AM operation only
ndash REVERSIBLE=2 means PM operation only
ndash I-595 example
Managed Lanes (typically Express)
bull HOT=1 ndash 98 (99 makes the link a dummy) bull FTC2 most likely=91 but other types permitted bull TOLL=0 ISTOLL=0 bull Tolls set by HOTTOLLdbf
HOT Lanes Tolls
bull Set as a function of the VC bull Updated in the travel time feedback loop bull Affects the TollFree split in mode choice bull Column HOT_x were x=HOT link attribute bull HOT_1 is the current 95 Express rate HOT_2 is a placeholder
Common Errors
bull Errors to watch out for ndash If network steps fail look for missing attributes
ndash Update transit routes as needed due to changes to underlying highway network
ndash Check for dangling links and unconnected zones
ndash Verify that all TAZs are connected to lsquofreersquo roads
bull Special procedures required for TAZs that have toll-only access must
include the attribute ISRCTOLLINK=1 (currently used for the
Rickenbacker Causeway)
ndash Some CT-RAMP errors caused by network coding errors may not be apparent until feedback loop 2 because in loop 1 CT-RAMP uses seed skims
bull Use small sample size when testing a new network
Was the Run Successful
bull Did the run converge ndash AM and PM travel time RMSE values reported to
OUTDIRfeedbacklogprn
ndash Run stops when RMSE is less than 01
ndash 2010 Scenario converges in 5 loops
bull What to do if it didnrsquot converge ndash Look for obvious errors
ndash Run more iterations (future year might require more)
bull Are the top-level results comparable to a similar run ndash Use HEVAL reports
ndash Examine screenlines (RMSE reports)
ndash Spot check link loads
Tools for Analysis
bull Analysis ndash perform standard highway project type analyses
bull Usual analysis similar to trip-based model ndash Total daily and period-specific roadway volumes and speeds by
vehicle class
ndash Vehicle trip OD matrices
bull Standard FSUTMS HEVAL and RMSE reports are still available ndash Day and period assignments
ndash By County
ndash Truck assignment
Tools for Analysis
bull Potential for customized assignment classes to address
specific project questions ndash Does the manage lane serve primarily high income users
bull Stratify vehicle classes by lowhigh income to understand facility
usage by income level
bull Stratify vehicle classes by disadvantaged population cohorts
bull Trip and person tabulations built from ABM output ndash Trip mode shares for many different population cohorts subareas
ndash For example toll vs non-toll shares by value of time or fine-graded income levels
ndash Many other possibilities
Application 4 ndash Mobility Project
Mobility Project ndash SUNPASS Market Share
bull Persons in households that own a SUNPASS transponder respond differently to managed lane and toll road policies ndash Pay lower tolls than cash users
ndash Have access to I-95 managed lanes
bull Policy questions ndash How does projected toll traffic and revenue vary with the SUNPASS
penetration rate and toll discount
ndash How will SUNPASS penetration rate vary as more managed lane facilities are built in the region
Mobility Project ndash SUNPASS Market Share
bull Question 1 -- How does projected toll traffic and revenue vary with the SUNPASS penetration rate and toll discount
bull Procedure ndash Step1 ndash Assume a SUNPASS market share by modifying the toll
transponder model
ndash Step 2 ndash Run SERPM7 to produce traffic volumes
ndash Step 3 ndash Estimate toll traffic revenue
Modifying the Toll Transponder Ownership Model
bull Model specification is contained in TransponderOwnershipxls and can be edited with Microsoft Excel
Utility Variable Coefficient
Expected time savings up to 644 min 00631
Distance less than 5 miles -00304
Distance between 5 and 10 miles -00648
Distance 10 miles or more -00648
Constant 04877
Modifying the Toll Transponder Ownership Model
Utility Variable Coefficient
Expected time savings up to 644 min 00631
Distance less than 5 miles -00304
Distance between 5 and 10 miles -00648
Distance 10 miles or more -00648
Constant 04877
Increasing the constant will increase the number of households equipped with transponders
TransponderOwnershipxls
Modifying the Toll Transponder Model
bull Increase the constant by how much ndash Process is akin to model calibration
ndash Several runs of the transponder model required to estimate the constant that yields the desired market share
ndash 2010 market share is approximately 65
ndash Use a small sample (5 or 10) to save run-time while establishing the right constant
Modifying the Toll Transponder Model
bull Variation ndash Add terms to the model so that certain types of households are more
likely to exhibit a SUNPASS market share increase
bull Highlow income households
bull Multi-car households
bull Miami-Dade households
Modifying the Toll Transponder Model
bull Exhibit TransponderOwnershipxls
Mobility Project ndash SUNPASS Market Share
bull Question 2 -- How will SUNPASS penetration rate vary as more managed lane facilities are built in the region
bull Procedure ndash Step 1 ndash Code the manage lane facilities
ndash Step 2 ndash Run SERPM7 to forecast transponder ownership
ndash Step 3 ndash Analyze the forecast household data for changes in the profile of households equipped with transponders
Application 5 ndash Land Use Project
Land Use Project
bull Transportation projects comprise not only network scenarios but also land use scenarios
bull Land use scenarios can be ndash Very large scale (substantial changes to housing and employment
estimates throughout the region) or
ndash Small scale (localized changes for example for a traffic impact study)
bull For both large scale and small scale land use updates the
general procedure for updating the input data and running the model is the same
Land Use Project
bull The land use data in SERPM7 consists of ndash Synthetic population and derived input files
ndash Employment data
ndash School enrollment data
ndash Parking costs and parking spaces
ndash Regional shopping mall special generators
ndash Beach special generators
ndash Hotel and motel room data
Land Use Project
bull The land use data reside in different input files
Data Item Input File
Synthetic Population hhFilecsv personFilecsv ctramppopsynTAZDatacsv ctramppopsynMAZDatacsv
Employment School Enrollment Parking Supply Data Special Generators Hotel and Motel Rooms
inputsIN-2010Rmaz_datacsv
Land Use Project
bull As demonstrated earlier SERPM 7 requires significantly more comprehensive socio-economic inputs as compared to previous versions ndash Greater spatial detail
ndash More categoriestypes of land uses
bull These inputs require additional preparation when
performing land use model runs
Land Use Project
Data Required and examples bull Population
bull Age distribution of the population expected to live in the
development
bull Income profile
bull Type of dwelling unit (single-family vs multi-family)
ndash The input data need to be internally consistent (distribution of households by presence of children needs to be consistent with population age distribution for example)
Land Use Project
Data Required bull Employment classification ndash Previous models had three
employment classifications
ndash In SERPM 7 there are 16 employment categories to better differentiate type of land use and improve the relationship between land use and activity purpose
Land Use Project
Data Required bull School enrollment ndash note that it differentiates by grade level
(K-8 high-school collegepost-secondary) ndash Donrsquot forget to include school faculty and staff in employment
Land Use Project
Data Required bull Parking supply and
parking costs ndash Parking spaces may
reflect use restrictions
bull Monthly
bull Daily
bull Hourly
ndash Parking costs consistent with type of use
Land Use Project
bull Park Area 1 (pink) ndash May park in MAZ other
than destination MAZ
ndash Parking cost applies
bull Park Area 2 (gree) ndash Parks at destination MAZ
ndash Parking cost applies
Land Use Project
Data Required bull Visitor Model ndash Number of hotel and motel rooms
bull Special Generators ndash Regional shopping malls
ndash Beach recreation areas
Land Use Project
The Gardens Mall Aventura Mall
Boynton Mall Dolphin Mall
Delray Community Mall Dadeland Mall
Towncenter Mall The Falls Shopping Center
Wellington Greens Mall Cutler Ridge Mall
Coral Square Mall Bal Harbour Shops
Pompano Citi Centre CocoWalk
Sawgrass Mills Mall The Mall at 163rd Street
Broward Mall Mall of the Americas
Galleria Mall Mary Brickell Village
Pembroke Lakes Mall Miami International Mall
Lakes Mall Miracle Marketplace
Oakwood Plaza Village of Merrick Park
The Promenade at Coconut Creek Westland Mall
Regional Shopping Mall Special Generators
Land Use Project
Deerfield Beach
Pompano Beach
Fort Lauderdale Beach
Fort Lauderdale Beach
Hollywood Beach
South Beach
Haulover Beach
Crandon Park
Dania Beach
Bill Baggs State Park
Beach Special Generators
Land Use Project
Sample Problem
bull MINTO West Example - a mixed residentialcommercial development ndash 6500 singlemulti-family residential units in multiple TAZs
ndash 14 million square feet of non-residential space
ndash 150 room hotel
ndash 3000 student college campus
Land Use Project
MINTO WEST
Land Use Project
TAZsMAZs representing MINTO West Development
Land Use Project
Need to translate population household and employment information from developer into model input data ndash As discussed in the Population Synthesis presentation population and
household attribute estimates can be taken from other known nearby neighborhoods
bull In this sample problem first start by allocating percentages of total
households into individual MAZs within the development area
bull Keep in mind household density when estimating the number of
households in each MAZ
Land Use Project
bull In this sample employment can be assumed to include bull Retail
bull RestaurantsBars
bull Offices
bull Health services
bull Hotelmotel employment and
bull Educational employment
ndash As with households yoursquoll need to apportion the employment areas to individual MAZs while keeping in mind the types of employment expected in those locations
Land Use Project
bull Employment data is usually estimated by converting floor space available to individual types of employment through conversion factors
bull ie ndash (3000 sqft office space)(20 sqft per office employee) =
150 office employees
Land Use Project
bull Once population household and employment figures are estimated they are entered into the appropriate model input file
bull Population ndash TAZ synthetic population control file
bull Household ndash TAZ synthetic population control file
bull Employment School Parking and Special Gen ndash maz_datacsv
bull Ensure that population household and employment figures
are the same in each file
bull Prior to performing model run PopSyn must be run and user must copy output files to SERPM7 input folders
Application 6 ndashTransit Project
Transit Project ndash MetroRail North Corridor
SERPM Transit Modes
Transit Mode Tour and Trip
Mode TAP Transit Skim Mode
Tri-Rail Commuter Rail Premium
Metrorail Urban Rail Premium
I-95 Inter-County Express I-95X I-95E
Express Bus Premium
Busway BRT Premium
MDT Express Express Bus Premium
Metromover Local Bus Local Bus
MDT Local BCT Local
Palm Tran Local Local Bus Local Bus
Breeze Local Bus Local Bus
Tri-Rail Shuttles Local Bus Local Bus
SERPM Transit Modes
Transit Mode Tour and Trip
Mode TAP Transit Skim
Mode
Mode coded on the route ldquocardsrdquo
Used to specify boarding and transfer penalties for transit
path building
(most disaggregate)
Line-haul choices in the tour and trip mode choice
models
Used to create sets of TAP to TAP levels of service
(most aggregate)
Similar to SERPM 67 SERPM 7 ABM
SERPM Transit Modes S67 Mode Local (L) S7
Mode Mode Name Operator amp Name UserA4 Name Prem (P) MODE
15 Tri-Rail 11 Tri-Rail 15 Commuter P 111
14 Metrorail 25 Metrorail 14 Urban Rail P 121
X Regional LRT Regional LRT 14 LRT P 131
16 Inter-County Express Bus 33 I-95 Inter-County Express 16 Express P 151
12 Exclusive ROW Cir-Reg 13 Exclusive ROW Cir-Reg 12 Mover L 181
11 TrolleysShuttles-Reg 12 Tri-Rail Shuttles 11 Local L 191
11 TrolleysShuttles-Reg 12 Tri-Rail Shuttles 33 Local L 192
X LRT- MDT 25 MDT LRT 14 LRT P 231
16 Buses (localexpress) - MDT 27 MDT Busway Flyers 27 BRT P 241
23 Buses (localexpress) - MDT 27 MDT MAXKATBusway Local 27 BRT P 242
24 BRT - MDT 28 MDT BRTLRT 28 BRT P 243
23 Buses (localexpress) - MDT 22 MDT Express 24 Express P 251
16 Buses (localexpress) - MDT 24 MDT I-95 Exp 26 Express P 252
16 Inter-County Express Bus 24 I-95 Inter-County Express 16 Express P 253
22 Exclusive ROW Cir-MDT 26 Metromover 22 Mover L 281
21 TrolleysShuttles-MDT 21 MDT TrolleysShuttles 21 Local L 291
23 Buses (localexpress) - MDT 21 MDT Local 23 Local L 292
23 Buses (localexpress) - MDT 23 MDT Shuttle 25 Local L 293
X LRT - BCT 35 BCT LRT 37 LRT P 331
34 BCT Rapid Bus BRT 34 BCT Rapid Bus 36 BRT P 341
34 BCT Fixed-guideway BRT 35 BCT BRT 37 BRT P 342
33 Buses (localexpress) - BCT 32 BCT Breeze 34 Express P 351
33 Buses (localexpress) - BCT 33 BCT Express 35 Express P 352
32 Exclusive ROW Cir-BCT 31 BCT Exclusive ROW Cir 32 Mover L 381
31 TrolleysShuttles-BCT 31 BCT TrolleysShuttles 31 Local L 393
33 Buses (localexpress) - BCT 31 BCT Local 27 Local L 391
33 Buses (localexpress) - BCT 31 BCT Local 33 Local L 392
X LRT - Palm Tran 43 Palm Tran LRT 44 LRT P 431
44 BRT - Palm Tran 43 Palm Tran BRT 44 BRT P 441
43 Buses (localexpress) - Ptran 42 Palm Tran Exp 44 Express P 451
42 Exclusive ROW Cir-PTran 41 Palm Tran Exclusive ROW Cir 42 Mover L 481
41 TrolleysShuttles-Ptran 41 Palm Tran TrolleysShuttles 41 Local L 491
43 Buses (localexpress) - Ptran 41 Palm Tran Local 43 Local L 492
Modes Not in the 2010 Network
SERPM7 Transit Network Building
bull Typically bus routes are coded on top of existing highway links
bull SERPM7 reserves some facility type codes for transit-only use helpful to more accurately represent route ndash Caution -- make sure network integrity is preserved once transit only
links are removed
bull Rail routes require coding first fixed-guideway links
SERPM7 Transit Network Building
bull Route Attributes -- User Coded ndash Name
ndash Long Name
ndash Mode
ndash Operator
ndash Headway[1] ndash AM Peak
ndash Headway[2] ndash Midday
ndash Headway[3] ndash PM Peak
ndash UserA4 (stop dwell time)
SERPM7 Transit Network Building
bull PNR Node Attributes ndash User Coded ndash Parking Spaces
ndash Parking Cost AM
ndash Parking Cost MD
ndash Terminal Time PNR
ndash Terminal Time KNR
bull At this time parking spaces is used only to identify park-n-ride locations (parking spaces gt 0)
SERPM7 Transit Network Building
bull Transit Access Points -- Created by Cube for the ABM ndash One TAP for each stop on premium routes
bull Tri-Rail Metrorail Express Bus BRT
ndash One TAP for each Local Bus park-n-ride node
ndash Synthesized TAPs to represent access to local bus stops
bull Transit Access Point Attributes ndash TAP Mode
ndash Inherit PNR node data
Sample Highway Network with TAPs
TAPs become part of the highway network and replace the TAZ centroids when building transit skims
Transit Access Points and ldquoon the flyrdquo Path Building
bull Transit skims are built TAP to TAP
Matrix origins and destinations are TAPS
Transit Access Points and ldquoon the flyrdquo Path Building
Trip Origins and
Destinations
MAZ to MAZ
Auto Skims
TAZ to TAZ
Transit Skims
TAP to TAP
The three spatial systems are put together by the mode choice model
ldquoOn the Flyrdquo Path Building
bull TAZs TAPs and MAZs are linked via drive and access connectors prior to running CT-RAMP
rmdir OUTDIRABMTEMP S Q rmdir DATADIRABMTEMP S Q xcopy OUTDIR OUTDIRABMTEMP E I Y xcopy DATADIR DATADIRABMTEMP E I Y if(fbi=1) need to run only the first time through - kdk CUBEctramprunCreateAccessFilescmd endif mkdir logFiles taskkill im javaexe F start CUBEctramprunHhMgrcmd JDK64 HOST_IP start CUBEctramprunMtxMgrcmd HOST_IP JDK64 rem start CUBEctrampconfigrunDrivercmd copy CUBEctrampserpm_abmproperties serpm_abmproperties Y ping -n 11 127001 gt nul CUBEctramprunSERPMAbmcmd SAMPLERATE VSAMPLERATE JDK64 CUBEctramprunCreateDemandMatricescmd SAMPLERATE VSAMPLERATE JDK64 taskkill im javaexe F rmdir OUTDIRctramp S Q rmdir DATADIRctramp S Q xcopy OUTDIRABMTEMPctramp OUTDIRctramp E I Y xcopy DATADIRABMTEMPctramp DATADIRctramp E I Y
ldquoOn the Flyrdquo Path Building
MAZ to MAZ Connectors
Created by finding shortest distance paths over an all-streets network Connects all MAZs within 15 mi
Used to represent walk mode distance and time
MAZ to TAP Connectors
Created by finding shortest distance paths over an all-streets network Connects each MAZ to all TAPs within 10 mi
Used to represent transit walk access and walk egress distance and time
TAZ to TAP Connectors
Connects each TAZ to all TAPs within the TAP maximum drive distance bull Bus TAPs ndash 4 miles bull Rail TAPs ndash 15 miles
Used to represent transit drive access and egress distance and time
ldquoOn the Flyrdquo Path Building
bull No actual links created on the network bull Connectivity is expressed in table format
ldquoOn the Flyrdquo Path Building
bull Once the access and walk connectors are created the mode choice model builds complete paths MAZ to MAZ transit paths
bull Local-only paths are built using the ldquolocalrdquo transit skim bull Express BRT Urban Rail and Commuter rail paths are all
built at the same time using the ldquopremiumrdquo transit skim bull For each MAZ to MAZ pair CT-RAMP keeps the shortest
generalized cost path for each available premium mode bull Even though only one ldquopremiumrdquo skim is built CT-RAMP
may find competing premium paths It may also find that the best path is a combination of two premium modes or a premium mode and local bus
Tour Mode Choice Model
Choice
Auto
Drive alone
GP(1)
Pay(2)
Shared ride 2
GP(3)
HOV(4)
Pay(5)
Shared ride 3+
GP(6)
HOV(7)
Pay(8)
Non-motorized
Walk(9)
Bike(10)
Transit
Walk access
Local bus(11)
Express bus(12)
BRT(13)
Urban rail(14)
Commuter rail(15)
PNR access
Local bus(16)
Express bus(17)
BRT(18)
Urban rail(19)
Commuter rail(20)
KNR access
Local bus(21)
Express bus(22)
BRT(23)
Urban rail(24)
Commuter rail(25)
School Bus(26)
Trip Mode Choice Model
bull Same nesting structure as the tour mode choice but conditional on the tour mode
bull Some trip modes may be unavailable depending on the tour mode
DA SR2 SR3+ Walk Wlk-Trn PNR-Trn KNR-Trn
DA Must - - - - - -
SR2 Can Can - Can - - -
SR3+ Can Can Can Can - - -
Walk - - - Must - - -
Wlk-Trn - Can Can Can Can - -
PNR-Trn Can Can Can Can Can Can
KNR-Trn - Can Can Can Can - Can
Trip Switching Rules Simplified
Transit Trip Reporting
bull In SERPM7 the transit boarding and alighting location can be reported in two ways ndash Trip list files (ABM output) -- Boarding TAP Alighting TAP
ndash Transit assignment (Cube output) ndash Route nodes
bull Each type of reporting has its strengths ndash Trip list file allows building detailed transit trip patterns for
population cohorts and time periods
bull Mode split reports
bull Transit trip distance frequency distributions access distance TLFDs
bull Mode to mode transfers
ndash Note ABM reports only the first boarding TAP and the last alighting TAP regardless of mode
ndash Cube output gives aggregate link volumes station to station boardings etc
User Benefit Files
bull SERPM7 can produce FTA User Benefit files for input to SUMMIT
bull User benefits remain a useful analysis tool bull Steps to produce user benefit files require some manual
intervention ndash see User Guide
SERPM ABM Reports
bull Stores ABM inputs and outputs in a relational database to generate some standard model reports
bull Consistent reporting framework to be used for analysis across model runs
bull SERPM7 user community can easily share the scripts that create the reports
bull Reports take the form of Excel workbooks bull Foundation for future development of a visualization
dashboard
Reporting Database Components
Reporting Database Components
bull Reporting ETL (extract transform and load) program ndash Loads all Cube and CT-RAMP Java model outputs into the database
ndash Written in Cube scripts and Java
bull Database ndash Stores all data used in reporting including select network skims
household person tour and trip data zonal data etc
ndash Implemented with SQL Server
bull Report scripts to generate reports ndash Written in T-SQL
bull Report packaging program ndash Generates Excel workbooks with one report per worksheet
ndash Written in Java
Reporting Database Components
bull Run time required to build database and generate reports varies with sample size and type of report ndash Several hours required to build the database for a 100 sample
ndash ~ 30 minutes to produce reports for a 10 sample
bull Report step is optional not part of a standard model run bull Report production is transparent to the user
bull hellip but users can contribute reports bull hellip and choose which reports to build at any one time
Running SERPM ABM Reports
bull Report queries reside in ctrampreports_sql time_spent_travelingsql Total weekday travel time by person type
and income group
total_trips_typesql Trips by trip mode person type county of residence and tour purpose
total_tours_typesql Tours by trip mode person type county of residence and tour purpose
tours_districtssql Tours by tour purpose and tour origin and destination districts
transit_access_time+distsql Drive to transit trip list with many trip details
hellip
Running SERPM ABM Reports
bull List of reports to run is specified in properties file ndash ctrampserpm_reportsproperties
sqlscriptsdirectory = Cserpm7ctrampreports_sql sqlscriptsschemakey = SCHEMA sqlscripts=cleanupsqltransit_access_time+distsql worksheettables=temptransittrips worksheetnames=TransitTrips workbookname = Cserpm7ctrampreports_sqlSERPM_REPORTXLS databaseschema = 2010R databaseipaddress = w-ampdx-d-sag10 databaseinstance = databaseport = 1433 databasename=SERPMABM databaseusername=serpm databasepassword=s3rpm
Adding Reports
bull Step 1 --Write report query ndash T-SQL
ndash User Guide includes a database data dictionary
bull Step 2 ndash Add query to ctrampreports_sql ndash Each query is contained in a single text file
ndash Drop file in reports folder
bull Step 3 ndash Add the query to the properties file sqlquery = Query file name
Worksheettables = Query output
Worksheetnames = Name for the report worksheet
Sample SERPM ABM Reports
bull Exhibit ctrampreports_sqlserpm_reportsxls
More information Shi-Chiang Li | shi-chianglidotstateflus |954 777 4655 Rosella Picado | picadopbworldcom | 206 382 5227 Ken Kaltenbach |kkaltenbachcorradinocom |502 587 7221

Running SERPM7 with a Population Sample
bull Sample Output ndash Individual Route Boardings
Running SERPM7 with a Population Sample
bull Sample Output ndash Regionwide Household Income Profile
Household Income 25 Sample 100 Sample
Less than $10000 1015 1021
$10000 to $15000 470 468
$15000 - $20000 566 564
$20000 to $25000 519 516
$25000 to $30000 493 494
$30000 to $35000 475 477
$35000 to $40000 387 387
$40000 to $45000 343 345
$45000 to $50000 348 348
$50000 to $75000 1754 1747
$75000 to $100000 1432 1433
$100000 or More 2198 2200
Application 2 Population Synthesis
Population Synthesis
bull Each SERPM7 scenario requires a synthetic population ndash List of households -- hhFilecsv
ndash List of persons that make up the households -- personFilecsv
bull Two synthetic populations have been developed to date ndash 2010 base year population
ndash 2040 long range transportation plan population
Population Synthesis
bull New synthetic populations will be required for ndash Other regional scenario years (eg 2020 2025 2045)
ndash To test population and land use scenarios such as
bull Traffic impact study for a new housing or commercial development
bull Impact of aging population
bull Impact of rising sea levels (because some neighborhoods will no
longer be inhabitable)
bull Refinements to the 2010 and 2040 populations
Population Synthesis
bull The population synthesizer (PopSynII) does not run normally as part of SERPM7 ndash SERPM7 expects input population files in the input folder
ndash User is responsible for running PopSynII to generate the required population files and place them in the scenario folders prior to a SERPM7 run
bull Why ndash Because a new synthetic population is not required for every run
PopSyn II Setup
bull PopSynII is already configured to run on the FDOT servers bull Java application using SQL data storage
PopSynII installed in the main ctramp folder
PopSynII Setup
bull The ctramppopsyn folder
Filename Description
runAllPopsynbat Batch file that controls the execution of PopSynII
controls SQL settings file that specifies the population attributes used as controls
1_importCSVsql 2_createTargetssql 3_createSynHHPerFilessql
SQL scripts that run the PopSynII software
2010_TAZ_Datacsv TAZ input control data
2010_MAZ_Datacsv MAZ input control data
Developing a New Synthetic Population
bull Step 1 ndash Prepare the input files ndash TAZ controls 2010_taz_datacsv
ndash MAZ controls 2010_maz_datacsv
Developing a New Synthetic Population
bull MAZ Control input file eg 2010_maz_datacsv ndash Estimates of total households and persons living in group quarters
bull Total households
bull Total group quarter population
ndash One record for each MAZ
Developing a New Synthetic Population
bull TAZ Controls input file -- eg 2010_taz_datacsv ndash Estimates of number of households or population for each SERPM7
controlled attribute
bull Household size
bull Household income
bull Household workers
bull Type of dwelling unit
bull Presence of children in the household
bull Population age group
bull Gender
bull Raceethnicity
bull Population in group quarters
ndash One record per TAZ
Analogous to the TAZ SE data file in the trip-
based model
Developing a New Synthetic Population
When preparing TAZ and MAZ control data it is critically important to
maintain internal data consistency
Developing a New Synthetic Population
bull Some data checks to perform and problems to look out for ndash The household and person marginals pertain to household residents
only except for the group quarter controls
ndash All household-based marginals add up to the same total households for each TAZ
ndash All person-based marginals add up to the same total persons for each TAZ
ndash The total number of persons implied by the household size marginal is consistent with the sum total of the person marginals
ndash The total number of children obtained from the age marginal is consistent with the marginal of households by presence of children
ndash Large deviations from 5050 split of persons by gender is suspect
ndash The household income distribution is consistency with the workers-in-household distribution
Developing a New Synthetic Population
bull More data checks ndash The MAZ and TAZ controls should add up
bull to the same number of households by TAZ
bull to the same number of persons in group quarters by TAZ
Developing a New Synthetic Population
bull Exhibit ndash SERPM7 2010 TAZ control file
Example ndash Minto West Palm Beach Co
Example ndash Minto West
bull Mixed-use development in a agricultural area adjacent to an existing housing development
bull Information available from proposedapproved plans ndash Single-family dwelling units ndash 5050
ndash Multi-family dwelling units ndash 1040
ndash Total population ndash 14 535 persons
ndash Spatial location of dwelling units by type
bull Other PopSyn required data not available from plans (income distribution age distribution etc) ndash Estimateassert it based on similar existing developments
surrounding neighborhood
Example ndash Minto West
bull Adding householdspersons to a TAZ
bull Adding TAZs or MAZs to SERPM7 should be a rare occurrence ndash Households are ultimately allocated to MAZs and therersquos already
12000 of them
ndash Households are represented individually so the zone attributes are derived from them
Trip-Based Model Modify the input zonal data file
Activity-Based Model Modify the population synthesis control file
Running PopSynII
bull Step 2 ndash Modify the PopSyn settings file for this run ndash Update TAZ and MAZ control filenames in runAll_popsynbat
REM BATCH FILE TO SETUP POPSYN RUN RUN POPSYNII AND OUTPUT CSV FILES REM SETUP REM PLEASE SET PATH NAMES FOR WORKING FOLDER AND CSV FILE LOCATIONS SET SERVERNAME=W-AMSTL-D-00052SQLEXPRESS SET DATABASENAME=popSyn SET ARCPATH=Cpopsyn SET CSVPATH_CONTROLS=Cpopsyninputscontrolscsv SET CSVPATH_MAZ=Cpopsyninputs2010_MAZ_Data_20120207csv SET CSVPATH_TAZ=Cpopsyninputs2010_TAZ_Data_20120207csv REM MAIN SCRIPT REM MAKE FILENAMES TABLE REM sqlcmd -S SERVER NAME -E -i INPUT FILE PATH (SCRIPT) -o OUTPUT LOG REM -E means to use Windows authentication for the user that is running the batch file SQLCMD -S SERVERNAME -d DATABASENAME -E -Q IF OBJECT_ID(dbocsv_filenames) IS NOT NULL DROP TABLE csv_filenames -o ARCPATHResultLogtxt
hellip hellip
Running PopSynII
bull Other PopSyn settings ndash rarely used in a production run ndash Change the control attributes
ndash Change the priority of control attributes
Running PopSynII
bull Step 3 ndash Run PopSynII -- runAll_popsynbat
Running PopSynII
bull Step 4 ndash Review Output amp Check Fit to Controls
Output File Description
hhFilecsv List of households
personFilecsv List of persons
ZoneResultscsv Comparisons of synthetized households to controlled and uncontrolled attributes
BalanceDetailscsv
ValidationStatscsv
ValidationStatsByPumacsv
Reviewing PopSyn Output
bull Zone_Resultscsv bull Comparison of synthesized totals to target totals for each
TAZ and controlled attribute
TOTAL_HOUSEHOLDS
ZONE TARGET SYNTHESIZED DIFFERENCE PCTDIFF
1 715 715 0 0
2 811 811 0 0
3 878 878 0 0
4 826 826 0 0
5 1181 1181 0 0
6 212 212 0 0
7 459 459 0 0
8 253 253 0 0
Reviewing PopSyn Output
bull Balance_Detailscsv bull Same output as Zone_Results different format
Zone Control ID ControlCat Target PUMSVal ConStat
1989 109 TOTAL_HOUSEHOLDS 1508 1508 yes
1989 249 INCOME_25K 273 271 no
1989 19 HHSIZE_4PLUS 467 467 yes
1989 160 FEMALE 2196 2108 no
1989 55 INCOME_100K 258 257 yes
1989 67 MULTI_UNIT 423 407 no
1989 31 WORKERS_3PLUS 164 166 no
Reviewing PopSyn Output
bull Validation_Statscsv ndash Comparison of synthesized attributes to input Census data (5 PUMS)
ndash Includes uncontrolled attributes
Description popSynSum censusSum meanDiff stdDev minDiff maxDiff Universe 1 number of households 2085375 1964881 17 61 -97 331
family 67 65 3 17 -26 48
non family 33 35 0 34 -58 111
size 1 27 28 0 36 -59 111
size 2 31 32 -3 14 -30 30
size 3 17 17 1 22 -37 53
size 4 25 23 18 50 -46 160
Reviewing PopSyn Output
bull Validation_StatsByPumacsv ndash Same as validation_stats but for each PUMA
bull Note that synthesized population may differ from 5 Census population by design
Application 3 ndash Highway Project
Highway Project
Example Projects ndashToll road extension ndashReversible lanes ndashManaged lanes
Overview
How to use SERPM7 to perform a model run and do some standard analysis ndash Option 1 -- Code the project directly on the geodatabase
bull Roadway links
bull Node links
bull Turn penalties
bull [assume no change to transit]
ndash Option 2 --Code the project on net files and then build the geodatabase
bull Use flowchart script to build the geodatabase
ndash Coding is very similar to earlier versions of SERPM
bull Facility types are the same
SERPM Facility Types (not new)
Editing the Highway Network
bull SERPM 7 requires a geodatabase bull Editing can be done either to a net file or directly on the
geodatabase bull The user can use utilities in the model flowchart to write a
net file from the geodatabase edit the net and then write it to the geodatabase
bull The geodatabase must exist to run the model
Editing in the Geodatabase
bull Simplest and most direct method bull Requires an understanding of the CubeArcGIS tools
Export geodatabase and edit as a net
bull Start Data Manager bull Open geodatabase (SERPM_NETSMDB) bull Double click on the network Input Hwy Net and specify an
output file (maybe ldquoeditnetrdquo) bull Open from Cube and edit as usual bull Use ldquoPrepare for Model Run and Trap Errorsrdquo (2) utilities to
write back to geodatabase ndash Reload geodatabase from Cube files ndash Cull and sort
ndash Write to geodatabase
Edit as a net
Export Edit in Cube
Change to point to edited network
Input Hwy Net
Toll Road Extension
bull Short Cut ndash copy an existing toll link bull No special NODE attributes bull Only new attribute is ISTOLL=1 for all links that could not be
used unless a toll were paid bull Toll Mainline FTC2=91 ISTOLL=1 DIRCODE=1 bull Plaza (gantry) ndash assume all will be electronic collection ndash TOLL=1 DIRCODE=1
ndash TOLLTYPE=3 CARTOLL=toll in dollars
ndash FTC2=95
ndash ISTOLL=1
ndash SVCSECONDS=001
ndash DELCODE=1 ACCELCODE=1 AVILANES=2
Toll Road Extension
Not much different from earlier versions of SERPM
Reversible Lanes
bull Control by the link attribute REVERSIBLE ndash REVERSIBLE=1 means AM operation only
ndash REVERSIBLE=2 means PM operation only
ndash I-595 example
Managed Lanes (typically Express)
bull HOT=1 ndash 98 (99 makes the link a dummy) bull FTC2 most likely=91 but other types permitted bull TOLL=0 ISTOLL=0 bull Tolls set by HOTTOLLdbf
HOT Lanes Tolls
bull Set as a function of the VC bull Updated in the travel time feedback loop bull Affects the TollFree split in mode choice bull Column HOT_x were x=HOT link attribute bull HOT_1 is the current 95 Express rate HOT_2 is a placeholder
Common Errors
bull Errors to watch out for ndash If network steps fail look for missing attributes
ndash Update transit routes as needed due to changes to underlying highway network
ndash Check for dangling links and unconnected zones
ndash Verify that all TAZs are connected to lsquofreersquo roads
bull Special procedures required for TAZs that have toll-only access must
include the attribute ISRCTOLLINK=1 (currently used for the
Rickenbacker Causeway)
ndash Some CT-RAMP errors caused by network coding errors may not be apparent until feedback loop 2 because in loop 1 CT-RAMP uses seed skims
bull Use small sample size when testing a new network
Was the Run Successful
bull Did the run converge ndash AM and PM travel time RMSE values reported to
OUTDIRfeedbacklogprn
ndash Run stops when RMSE is less than 01
ndash 2010 Scenario converges in 5 loops
bull What to do if it didnrsquot converge ndash Look for obvious errors
ndash Run more iterations (future year might require more)
bull Are the top-level results comparable to a similar run ndash Use HEVAL reports
ndash Examine screenlines (RMSE reports)
ndash Spot check link loads
Tools for Analysis
bull Analysis ndash perform standard highway project type analyses
bull Usual analysis similar to trip-based model ndash Total daily and period-specific roadway volumes and speeds by
vehicle class
ndash Vehicle trip OD matrices
bull Standard FSUTMS HEVAL and RMSE reports are still available ndash Day and period assignments
ndash By County
ndash Truck assignment
Tools for Analysis
bull Potential for customized assignment classes to address
specific project questions ndash Does the manage lane serve primarily high income users
bull Stratify vehicle classes by lowhigh income to understand facility
usage by income level
bull Stratify vehicle classes by disadvantaged population cohorts
bull Trip and person tabulations built from ABM output ndash Trip mode shares for many different population cohorts subareas
ndash For example toll vs non-toll shares by value of time or fine-graded income levels
ndash Many other possibilities
Application 4 ndash Mobility Project
Mobility Project ndash SUNPASS Market Share
bull Persons in households that own a SUNPASS transponder respond differently to managed lane and toll road policies ndash Pay lower tolls than cash users
ndash Have access to I-95 managed lanes
bull Policy questions ndash How does projected toll traffic and revenue vary with the SUNPASS
penetration rate and toll discount
ndash How will SUNPASS penetration rate vary as more managed lane facilities are built in the region
Mobility Project ndash SUNPASS Market Share
bull Question 1 -- How does projected toll traffic and revenue vary with the SUNPASS penetration rate and toll discount
bull Procedure ndash Step1 ndash Assume a SUNPASS market share by modifying the toll
transponder model
ndash Step 2 ndash Run SERPM7 to produce traffic volumes
ndash Step 3 ndash Estimate toll traffic revenue
Modifying the Toll Transponder Ownership Model
bull Model specification is contained in TransponderOwnershipxls and can be edited with Microsoft Excel
Utility Variable Coefficient
Expected time savings up to 644 min 00631
Distance less than 5 miles -00304
Distance between 5 and 10 miles -00648
Distance 10 miles or more -00648
Constant 04877
Modifying the Toll Transponder Ownership Model
Utility Variable Coefficient
Expected time savings up to 644 min 00631
Distance less than 5 miles -00304
Distance between 5 and 10 miles -00648
Distance 10 miles or more -00648
Constant 04877
Increasing the constant will increase the number of households equipped with transponders
TransponderOwnershipxls
Modifying the Toll Transponder Model
bull Increase the constant by how much ndash Process is akin to model calibration
ndash Several runs of the transponder model required to estimate the constant that yields the desired market share
ndash 2010 market share is approximately 65
ndash Use a small sample (5 or 10) to save run-time while establishing the right constant
Modifying the Toll Transponder Model
bull Variation ndash Add terms to the model so that certain types of households are more
likely to exhibit a SUNPASS market share increase
bull Highlow income households
bull Multi-car households
bull Miami-Dade households
Modifying the Toll Transponder Model
bull Exhibit TransponderOwnershipxls
Mobility Project ndash SUNPASS Market Share
bull Question 2 -- How will SUNPASS penetration rate vary as more managed lane facilities are built in the region
bull Procedure ndash Step 1 ndash Code the manage lane facilities
ndash Step 2 ndash Run SERPM7 to forecast transponder ownership
ndash Step 3 ndash Analyze the forecast household data for changes in the profile of households equipped with transponders
Application 5 ndash Land Use Project
Land Use Project
bull Transportation projects comprise not only network scenarios but also land use scenarios
bull Land use scenarios can be ndash Very large scale (substantial changes to housing and employment
estimates throughout the region) or
ndash Small scale (localized changes for example for a traffic impact study)
bull For both large scale and small scale land use updates the
general procedure for updating the input data and running the model is the same
Land Use Project
bull The land use data in SERPM7 consists of ndash Synthetic population and derived input files
ndash Employment data
ndash School enrollment data
ndash Parking costs and parking spaces
ndash Regional shopping mall special generators
ndash Beach special generators
ndash Hotel and motel room data
Land Use Project
bull The land use data reside in different input files
Data Item Input File
Synthetic Population hhFilecsv personFilecsv ctramppopsynTAZDatacsv ctramppopsynMAZDatacsv
Employment School Enrollment Parking Supply Data Special Generators Hotel and Motel Rooms
inputsIN-2010Rmaz_datacsv
Land Use Project
bull As demonstrated earlier SERPM 7 requires significantly more comprehensive socio-economic inputs as compared to previous versions ndash Greater spatial detail
ndash More categoriestypes of land uses
bull These inputs require additional preparation when
performing land use model runs
Land Use Project
Data Required and examples bull Population
bull Age distribution of the population expected to live in the
development
bull Income profile
bull Type of dwelling unit (single-family vs multi-family)
ndash The input data need to be internally consistent (distribution of households by presence of children needs to be consistent with population age distribution for example)
Land Use Project
Data Required bull Employment classification ndash Previous models had three
employment classifications
ndash In SERPM 7 there are 16 employment categories to better differentiate type of land use and improve the relationship between land use and activity purpose
Land Use Project
Data Required bull School enrollment ndash note that it differentiates by grade level
(K-8 high-school collegepost-secondary) ndash Donrsquot forget to include school faculty and staff in employment
Land Use Project
Data Required bull Parking supply and
parking costs ndash Parking spaces may
reflect use restrictions
bull Monthly
bull Daily
bull Hourly
ndash Parking costs consistent with type of use
Land Use Project
bull Park Area 1 (pink) ndash May park in MAZ other
than destination MAZ
ndash Parking cost applies
bull Park Area 2 (gree) ndash Parks at destination MAZ
ndash Parking cost applies
Land Use Project
Data Required bull Visitor Model ndash Number of hotel and motel rooms
bull Special Generators ndash Regional shopping malls
ndash Beach recreation areas
Land Use Project
The Gardens Mall Aventura Mall
Boynton Mall Dolphin Mall
Delray Community Mall Dadeland Mall
Towncenter Mall The Falls Shopping Center
Wellington Greens Mall Cutler Ridge Mall
Coral Square Mall Bal Harbour Shops
Pompano Citi Centre CocoWalk
Sawgrass Mills Mall The Mall at 163rd Street
Broward Mall Mall of the Americas
Galleria Mall Mary Brickell Village
Pembroke Lakes Mall Miami International Mall
Lakes Mall Miracle Marketplace
Oakwood Plaza Village of Merrick Park
The Promenade at Coconut Creek Westland Mall
Regional Shopping Mall Special Generators
Land Use Project
Deerfield Beach
Pompano Beach
Fort Lauderdale Beach
Fort Lauderdale Beach
Hollywood Beach
South Beach
Haulover Beach
Crandon Park
Dania Beach
Bill Baggs State Park
Beach Special Generators
Land Use Project
Sample Problem
bull MINTO West Example - a mixed residentialcommercial development ndash 6500 singlemulti-family residential units in multiple TAZs
ndash 14 million square feet of non-residential space
ndash 150 room hotel
ndash 3000 student college campus
Land Use Project
MINTO WEST
Land Use Project
TAZsMAZs representing MINTO West Development
Land Use Project
Need to translate population household and employment information from developer into model input data ndash As discussed in the Population Synthesis presentation population and
household attribute estimates can be taken from other known nearby neighborhoods
bull In this sample problem first start by allocating percentages of total
households into individual MAZs within the development area
bull Keep in mind household density when estimating the number of
households in each MAZ
Land Use Project
bull In this sample employment can be assumed to include bull Retail
bull RestaurantsBars
bull Offices
bull Health services
bull Hotelmotel employment and
bull Educational employment
ndash As with households yoursquoll need to apportion the employment areas to individual MAZs while keeping in mind the types of employment expected in those locations
Land Use Project
bull Employment data is usually estimated by converting floor space available to individual types of employment through conversion factors
bull ie ndash (3000 sqft office space)(20 sqft per office employee) =
150 office employees
Land Use Project
bull Once population household and employment figures are estimated they are entered into the appropriate model input file
bull Population ndash TAZ synthetic population control file
bull Household ndash TAZ synthetic population control file
bull Employment School Parking and Special Gen ndash maz_datacsv
bull Ensure that population household and employment figures
are the same in each file
bull Prior to performing model run PopSyn must be run and user must copy output files to SERPM7 input folders
Application 6 ndashTransit Project
Transit Project ndash MetroRail North Corridor
SERPM Transit Modes
Transit Mode Tour and Trip
Mode TAP Transit Skim Mode
Tri-Rail Commuter Rail Premium
Metrorail Urban Rail Premium
I-95 Inter-County Express I-95X I-95E
Express Bus Premium
Busway BRT Premium
MDT Express Express Bus Premium
Metromover Local Bus Local Bus
MDT Local BCT Local
Palm Tran Local Local Bus Local Bus
Breeze Local Bus Local Bus
Tri-Rail Shuttles Local Bus Local Bus
SERPM Transit Modes
Transit Mode Tour and Trip
Mode TAP Transit Skim
Mode
Mode coded on the route ldquocardsrdquo
Used to specify boarding and transfer penalties for transit
path building
(most disaggregate)
Line-haul choices in the tour and trip mode choice
models
Used to create sets of TAP to TAP levels of service
(most aggregate)
Similar to SERPM 67 SERPM 7 ABM
SERPM Transit Modes S67 Mode Local (L) S7
Mode Mode Name Operator amp Name UserA4 Name Prem (P) MODE
15 Tri-Rail 11 Tri-Rail 15 Commuter P 111
14 Metrorail 25 Metrorail 14 Urban Rail P 121
X Regional LRT Regional LRT 14 LRT P 131
16 Inter-County Express Bus 33 I-95 Inter-County Express 16 Express P 151
12 Exclusive ROW Cir-Reg 13 Exclusive ROW Cir-Reg 12 Mover L 181
11 TrolleysShuttles-Reg 12 Tri-Rail Shuttles 11 Local L 191
11 TrolleysShuttles-Reg 12 Tri-Rail Shuttles 33 Local L 192
X LRT- MDT 25 MDT LRT 14 LRT P 231
16 Buses (localexpress) - MDT 27 MDT Busway Flyers 27 BRT P 241
23 Buses (localexpress) - MDT 27 MDT MAXKATBusway Local 27 BRT P 242
24 BRT - MDT 28 MDT BRTLRT 28 BRT P 243
23 Buses (localexpress) - MDT 22 MDT Express 24 Express P 251
16 Buses (localexpress) - MDT 24 MDT I-95 Exp 26 Express P 252
16 Inter-County Express Bus 24 I-95 Inter-County Express 16 Express P 253
22 Exclusive ROW Cir-MDT 26 Metromover 22 Mover L 281
21 TrolleysShuttles-MDT 21 MDT TrolleysShuttles 21 Local L 291
23 Buses (localexpress) - MDT 21 MDT Local 23 Local L 292
23 Buses (localexpress) - MDT 23 MDT Shuttle 25 Local L 293
X LRT - BCT 35 BCT LRT 37 LRT P 331
34 BCT Rapid Bus BRT 34 BCT Rapid Bus 36 BRT P 341
34 BCT Fixed-guideway BRT 35 BCT BRT 37 BRT P 342
33 Buses (localexpress) - BCT 32 BCT Breeze 34 Express P 351
33 Buses (localexpress) - BCT 33 BCT Express 35 Express P 352
32 Exclusive ROW Cir-BCT 31 BCT Exclusive ROW Cir 32 Mover L 381
31 TrolleysShuttles-BCT 31 BCT TrolleysShuttles 31 Local L 393
33 Buses (localexpress) - BCT 31 BCT Local 27 Local L 391
33 Buses (localexpress) - BCT 31 BCT Local 33 Local L 392
X LRT - Palm Tran 43 Palm Tran LRT 44 LRT P 431
44 BRT - Palm Tran 43 Palm Tran BRT 44 BRT P 441
43 Buses (localexpress) - Ptran 42 Palm Tran Exp 44 Express P 451
42 Exclusive ROW Cir-PTran 41 Palm Tran Exclusive ROW Cir 42 Mover L 481
41 TrolleysShuttles-Ptran 41 Palm Tran TrolleysShuttles 41 Local L 491
43 Buses (localexpress) - Ptran 41 Palm Tran Local 43 Local L 492
Modes Not in the 2010 Network
SERPM7 Transit Network Building
bull Typically bus routes are coded on top of existing highway links
bull SERPM7 reserves some facility type codes for transit-only use helpful to more accurately represent route ndash Caution -- make sure network integrity is preserved once transit only
links are removed
bull Rail routes require coding first fixed-guideway links
SERPM7 Transit Network Building
bull Route Attributes -- User Coded ndash Name
ndash Long Name
ndash Mode
ndash Operator
ndash Headway[1] ndash AM Peak
ndash Headway[2] ndash Midday
ndash Headway[3] ndash PM Peak
ndash UserA4 (stop dwell time)
SERPM7 Transit Network Building
bull PNR Node Attributes ndash User Coded ndash Parking Spaces
ndash Parking Cost AM
ndash Parking Cost MD
ndash Terminal Time PNR
ndash Terminal Time KNR
bull At this time parking spaces is used only to identify park-n-ride locations (parking spaces gt 0)
SERPM7 Transit Network Building
bull Transit Access Points -- Created by Cube for the ABM ndash One TAP for each stop on premium routes
bull Tri-Rail Metrorail Express Bus BRT
ndash One TAP for each Local Bus park-n-ride node
ndash Synthesized TAPs to represent access to local bus stops
bull Transit Access Point Attributes ndash TAP Mode
ndash Inherit PNR node data
Sample Highway Network with TAPs
TAPs become part of the highway network and replace the TAZ centroids when building transit skims
Transit Access Points and ldquoon the flyrdquo Path Building
bull Transit skims are built TAP to TAP
Matrix origins and destinations are TAPS
Transit Access Points and ldquoon the flyrdquo Path Building
Trip Origins and
Destinations
MAZ to MAZ
Auto Skims
TAZ to TAZ
Transit Skims
TAP to TAP
The three spatial systems are put together by the mode choice model
ldquoOn the Flyrdquo Path Building
bull TAZs TAPs and MAZs are linked via drive and access connectors prior to running CT-RAMP
rmdir OUTDIRABMTEMP S Q rmdir DATADIRABMTEMP S Q xcopy OUTDIR OUTDIRABMTEMP E I Y xcopy DATADIR DATADIRABMTEMP E I Y if(fbi=1) need to run only the first time through - kdk CUBEctramprunCreateAccessFilescmd endif mkdir logFiles taskkill im javaexe F start CUBEctramprunHhMgrcmd JDK64 HOST_IP start CUBEctramprunMtxMgrcmd HOST_IP JDK64 rem start CUBEctrampconfigrunDrivercmd copy CUBEctrampserpm_abmproperties serpm_abmproperties Y ping -n 11 127001 gt nul CUBEctramprunSERPMAbmcmd SAMPLERATE VSAMPLERATE JDK64 CUBEctramprunCreateDemandMatricescmd SAMPLERATE VSAMPLERATE JDK64 taskkill im javaexe F rmdir OUTDIRctramp S Q rmdir DATADIRctramp S Q xcopy OUTDIRABMTEMPctramp OUTDIRctramp E I Y xcopy DATADIRABMTEMPctramp DATADIRctramp E I Y
ldquoOn the Flyrdquo Path Building
MAZ to MAZ Connectors
Created by finding shortest distance paths over an all-streets network Connects all MAZs within 15 mi
Used to represent walk mode distance and time
MAZ to TAP Connectors
Created by finding shortest distance paths over an all-streets network Connects each MAZ to all TAPs within 10 mi
Used to represent transit walk access and walk egress distance and time
TAZ to TAP Connectors
Connects each TAZ to all TAPs within the TAP maximum drive distance bull Bus TAPs ndash 4 miles bull Rail TAPs ndash 15 miles
Used to represent transit drive access and egress distance and time
ldquoOn the Flyrdquo Path Building
bull No actual links created on the network bull Connectivity is expressed in table format
ldquoOn the Flyrdquo Path Building
bull Once the access and walk connectors are created the mode choice model builds complete paths MAZ to MAZ transit paths
bull Local-only paths are built using the ldquolocalrdquo transit skim bull Express BRT Urban Rail and Commuter rail paths are all
built at the same time using the ldquopremiumrdquo transit skim bull For each MAZ to MAZ pair CT-RAMP keeps the shortest
generalized cost path for each available premium mode bull Even though only one ldquopremiumrdquo skim is built CT-RAMP
may find competing premium paths It may also find that the best path is a combination of two premium modes or a premium mode and local bus
Tour Mode Choice Model
Choice
Auto
Drive alone
GP(1)
Pay(2)
Shared ride 2
GP(3)
HOV(4)
Pay(5)
Shared ride 3+
GP(6)
HOV(7)
Pay(8)
Non-motorized
Walk(9)
Bike(10)
Transit
Walk access
Local bus(11)
Express bus(12)
BRT(13)
Urban rail(14)
Commuter rail(15)
PNR access
Local bus(16)
Express bus(17)
BRT(18)
Urban rail(19)
Commuter rail(20)
KNR access
Local bus(21)
Express bus(22)
BRT(23)
Urban rail(24)
Commuter rail(25)
School Bus(26)
Trip Mode Choice Model
bull Same nesting structure as the tour mode choice but conditional on the tour mode
bull Some trip modes may be unavailable depending on the tour mode
DA SR2 SR3+ Walk Wlk-Trn PNR-Trn KNR-Trn
DA Must - - - - - -
SR2 Can Can - Can - - -
SR3+ Can Can Can Can - - -
Walk - - - Must - - -
Wlk-Trn - Can Can Can Can - -
PNR-Trn Can Can Can Can Can Can
KNR-Trn - Can Can Can Can - Can
Trip Switching Rules Simplified
Transit Trip Reporting
bull In SERPM7 the transit boarding and alighting location can be reported in two ways ndash Trip list files (ABM output) -- Boarding TAP Alighting TAP
ndash Transit assignment (Cube output) ndash Route nodes
bull Each type of reporting has its strengths ndash Trip list file allows building detailed transit trip patterns for
population cohorts and time periods
bull Mode split reports
bull Transit trip distance frequency distributions access distance TLFDs
bull Mode to mode transfers
ndash Note ABM reports only the first boarding TAP and the last alighting TAP regardless of mode
ndash Cube output gives aggregate link volumes station to station boardings etc
User Benefit Files
bull SERPM7 can produce FTA User Benefit files for input to SUMMIT
bull User benefits remain a useful analysis tool bull Steps to produce user benefit files require some manual
intervention ndash see User Guide
SERPM ABM Reports
bull Stores ABM inputs and outputs in a relational database to generate some standard model reports
bull Consistent reporting framework to be used for analysis across model runs
bull SERPM7 user community can easily share the scripts that create the reports
bull Reports take the form of Excel workbooks bull Foundation for future development of a visualization
dashboard
Reporting Database Components
Reporting Database Components
bull Reporting ETL (extract transform and load) program ndash Loads all Cube and CT-RAMP Java model outputs into the database
ndash Written in Cube scripts and Java
bull Database ndash Stores all data used in reporting including select network skims
household person tour and trip data zonal data etc
ndash Implemented with SQL Server
bull Report scripts to generate reports ndash Written in T-SQL
bull Report packaging program ndash Generates Excel workbooks with one report per worksheet
ndash Written in Java
Reporting Database Components
bull Run time required to build database and generate reports varies with sample size and type of report ndash Several hours required to build the database for a 100 sample
ndash ~ 30 minutes to produce reports for a 10 sample
bull Report step is optional not part of a standard model run bull Report production is transparent to the user
bull hellip but users can contribute reports bull hellip and choose which reports to build at any one time
Running SERPM ABM Reports
bull Report queries reside in ctrampreports_sql time_spent_travelingsql Total weekday travel time by person type
and income group
total_trips_typesql Trips by trip mode person type county of residence and tour purpose
total_tours_typesql Tours by trip mode person type county of residence and tour purpose
tours_districtssql Tours by tour purpose and tour origin and destination districts
transit_access_time+distsql Drive to transit trip list with many trip details
hellip
Running SERPM ABM Reports
bull List of reports to run is specified in properties file ndash ctrampserpm_reportsproperties
sqlscriptsdirectory = Cserpm7ctrampreports_sql sqlscriptsschemakey = SCHEMA sqlscripts=cleanupsqltransit_access_time+distsql worksheettables=temptransittrips worksheetnames=TransitTrips workbookname = Cserpm7ctrampreports_sqlSERPM_REPORTXLS databaseschema = 2010R databaseipaddress = w-ampdx-d-sag10 databaseinstance = databaseport = 1433 databasename=SERPMABM databaseusername=serpm databasepassword=s3rpm
Adding Reports
bull Step 1 --Write report query ndash T-SQL
ndash User Guide includes a database data dictionary
bull Step 2 ndash Add query to ctrampreports_sql ndash Each query is contained in a single text file
ndash Drop file in reports folder
bull Step 3 ndash Add the query to the properties file sqlquery = Query file name
Worksheettables = Query output
Worksheetnames = Name for the report worksheet
Sample SERPM ABM Reports
bull Exhibit ctrampreports_sqlserpm_reportsxls
More information Shi-Chiang Li | shi-chianglidotstateflus |954 777 4655 Rosella Picado | picadopbworldcom | 206 382 5227 Ken Kaltenbach |kkaltenbachcorradinocom |502 587 7221

Running SERPM7 with a Population Sample
bull Sample Output ndash Regionwide Household Income Profile
Household Income 25 Sample 100 Sample
Less than $10000 1015 1021
$10000 to $15000 470 468
$15000 - $20000 566 564
$20000 to $25000 519 516
$25000 to $30000 493 494
$30000 to $35000 475 477
$35000 to $40000 387 387
$40000 to $45000 343 345
$45000 to $50000 348 348
$50000 to $75000 1754 1747
$75000 to $100000 1432 1433
$100000 or More 2198 2200
Application 2 Population Synthesis
Population Synthesis
bull Each SERPM7 scenario requires a synthetic population ndash List of households -- hhFilecsv
ndash List of persons that make up the households -- personFilecsv
bull Two synthetic populations have been developed to date ndash 2010 base year population
ndash 2040 long range transportation plan population
Population Synthesis
bull New synthetic populations will be required for ndash Other regional scenario years (eg 2020 2025 2045)
ndash To test population and land use scenarios such as
bull Traffic impact study for a new housing or commercial development
bull Impact of aging population
bull Impact of rising sea levels (because some neighborhoods will no
longer be inhabitable)
bull Refinements to the 2010 and 2040 populations
Population Synthesis
bull The population synthesizer (PopSynII) does not run normally as part of SERPM7 ndash SERPM7 expects input population files in the input folder
ndash User is responsible for running PopSynII to generate the required population files and place them in the scenario folders prior to a SERPM7 run
bull Why ndash Because a new synthetic population is not required for every run
PopSyn II Setup
bull PopSynII is already configured to run on the FDOT servers bull Java application using SQL data storage
PopSynII installed in the main ctramp folder
PopSynII Setup
bull The ctramppopsyn folder
Filename Description
runAllPopsynbat Batch file that controls the execution of PopSynII
controls SQL settings file that specifies the population attributes used as controls
1_importCSVsql 2_createTargetssql 3_createSynHHPerFilessql
SQL scripts that run the PopSynII software
2010_TAZ_Datacsv TAZ input control data
2010_MAZ_Datacsv MAZ input control data
Developing a New Synthetic Population
bull Step 1 ndash Prepare the input files ndash TAZ controls 2010_taz_datacsv
ndash MAZ controls 2010_maz_datacsv
Developing a New Synthetic Population
bull MAZ Control input file eg 2010_maz_datacsv ndash Estimates of total households and persons living in group quarters
bull Total households
bull Total group quarter population
ndash One record for each MAZ
Developing a New Synthetic Population
bull TAZ Controls input file -- eg 2010_taz_datacsv ndash Estimates of number of households or population for each SERPM7
controlled attribute
bull Household size
bull Household income
bull Household workers
bull Type of dwelling unit
bull Presence of children in the household
bull Population age group
bull Gender
bull Raceethnicity
bull Population in group quarters
ndash One record per TAZ
Analogous to the TAZ SE data file in the trip-
based model
Developing a New Synthetic Population
When preparing TAZ and MAZ control data it is critically important to
maintain internal data consistency
Developing a New Synthetic Population
bull Some data checks to perform and problems to look out for ndash The household and person marginals pertain to household residents
only except for the group quarter controls
ndash All household-based marginals add up to the same total households for each TAZ
ndash All person-based marginals add up to the same total persons for each TAZ
ndash The total number of persons implied by the household size marginal is consistent with the sum total of the person marginals
ndash The total number of children obtained from the age marginal is consistent with the marginal of households by presence of children
ndash Large deviations from 5050 split of persons by gender is suspect
ndash The household income distribution is consistency with the workers-in-household distribution
Developing a New Synthetic Population
bull More data checks ndash The MAZ and TAZ controls should add up
bull to the same number of households by TAZ
bull to the same number of persons in group quarters by TAZ
Developing a New Synthetic Population
bull Exhibit ndash SERPM7 2010 TAZ control file
Example ndash Minto West Palm Beach Co
Example ndash Minto West
bull Mixed-use development in a agricultural area adjacent to an existing housing development
bull Information available from proposedapproved plans ndash Single-family dwelling units ndash 5050
ndash Multi-family dwelling units ndash 1040
ndash Total population ndash 14 535 persons
ndash Spatial location of dwelling units by type
bull Other PopSyn required data not available from plans (income distribution age distribution etc) ndash Estimateassert it based on similar existing developments
surrounding neighborhood
Example ndash Minto West
bull Adding householdspersons to a TAZ
bull Adding TAZs or MAZs to SERPM7 should be a rare occurrence ndash Households are ultimately allocated to MAZs and therersquos already
12000 of them
ndash Households are represented individually so the zone attributes are derived from them
Trip-Based Model Modify the input zonal data file
Activity-Based Model Modify the population synthesis control file
Running PopSynII
bull Step 2 ndash Modify the PopSyn settings file for this run ndash Update TAZ and MAZ control filenames in runAll_popsynbat
REM BATCH FILE TO SETUP POPSYN RUN RUN POPSYNII AND OUTPUT CSV FILES REM SETUP REM PLEASE SET PATH NAMES FOR WORKING FOLDER AND CSV FILE LOCATIONS SET SERVERNAME=W-AMSTL-D-00052SQLEXPRESS SET DATABASENAME=popSyn SET ARCPATH=Cpopsyn SET CSVPATH_CONTROLS=Cpopsyninputscontrolscsv SET CSVPATH_MAZ=Cpopsyninputs2010_MAZ_Data_20120207csv SET CSVPATH_TAZ=Cpopsyninputs2010_TAZ_Data_20120207csv REM MAIN SCRIPT REM MAKE FILENAMES TABLE REM sqlcmd -S SERVER NAME -E -i INPUT FILE PATH (SCRIPT) -o OUTPUT LOG REM -E means to use Windows authentication for the user that is running the batch file SQLCMD -S SERVERNAME -d DATABASENAME -E -Q IF OBJECT_ID(dbocsv_filenames) IS NOT NULL DROP TABLE csv_filenames -o ARCPATHResultLogtxt
hellip hellip
Running PopSynII
bull Other PopSyn settings ndash rarely used in a production run ndash Change the control attributes
ndash Change the priority of control attributes
Running PopSynII
bull Step 3 ndash Run PopSynII -- runAll_popsynbat
Running PopSynII
bull Step 4 ndash Review Output amp Check Fit to Controls
Output File Description
hhFilecsv List of households
personFilecsv List of persons
ZoneResultscsv Comparisons of synthetized households to controlled and uncontrolled attributes
BalanceDetailscsv
ValidationStatscsv
ValidationStatsByPumacsv
Reviewing PopSyn Output
bull Zone_Resultscsv bull Comparison of synthesized totals to target totals for each
TAZ and controlled attribute
TOTAL_HOUSEHOLDS
ZONE TARGET SYNTHESIZED DIFFERENCE PCTDIFF
1 715 715 0 0
2 811 811 0 0
3 878 878 0 0
4 826 826 0 0
5 1181 1181 0 0
6 212 212 0 0
7 459 459 0 0
8 253 253 0 0
Reviewing PopSyn Output
bull Balance_Detailscsv bull Same output as Zone_Results different format
Zone Control ID ControlCat Target PUMSVal ConStat
1989 109 TOTAL_HOUSEHOLDS 1508 1508 yes
1989 249 INCOME_25K 273 271 no
1989 19 HHSIZE_4PLUS 467 467 yes
1989 160 FEMALE 2196 2108 no
1989 55 INCOME_100K 258 257 yes
1989 67 MULTI_UNIT 423 407 no
1989 31 WORKERS_3PLUS 164 166 no
Reviewing PopSyn Output
bull Validation_Statscsv ndash Comparison of synthesized attributes to input Census data (5 PUMS)
ndash Includes uncontrolled attributes
Description popSynSum censusSum meanDiff stdDev minDiff maxDiff Universe 1 number of households 2085375 1964881 17 61 -97 331
family 67 65 3 17 -26 48
non family 33 35 0 34 -58 111
size 1 27 28 0 36 -59 111
size 2 31 32 -3 14 -30 30
size 3 17 17 1 22 -37 53
size 4 25 23 18 50 -46 160
Reviewing PopSyn Output
bull Validation_StatsByPumacsv ndash Same as validation_stats but for each PUMA
bull Note that synthesized population may differ from 5 Census population by design
Application 3 ndash Highway Project
Highway Project
Example Projects ndashToll road extension ndashReversible lanes ndashManaged lanes
Overview
How to use SERPM7 to perform a model run and do some standard analysis ndash Option 1 -- Code the project directly on the geodatabase
bull Roadway links
bull Node links
bull Turn penalties
bull [assume no change to transit]
ndash Option 2 --Code the project on net files and then build the geodatabase
bull Use flowchart script to build the geodatabase
ndash Coding is very similar to earlier versions of SERPM
bull Facility types are the same
SERPM Facility Types (not new)
Editing the Highway Network
bull SERPM 7 requires a geodatabase bull Editing can be done either to a net file or directly on the
geodatabase bull The user can use utilities in the model flowchart to write a
net file from the geodatabase edit the net and then write it to the geodatabase
bull The geodatabase must exist to run the model
Editing in the Geodatabase
bull Simplest and most direct method bull Requires an understanding of the CubeArcGIS tools
Export geodatabase and edit as a net
bull Start Data Manager bull Open geodatabase (SERPM_NETSMDB) bull Double click on the network Input Hwy Net and specify an
output file (maybe ldquoeditnetrdquo) bull Open from Cube and edit as usual bull Use ldquoPrepare for Model Run and Trap Errorsrdquo (2) utilities to
write back to geodatabase ndash Reload geodatabase from Cube files ndash Cull and sort
ndash Write to geodatabase
Edit as a net
Export Edit in Cube
Change to point to edited network
Input Hwy Net
Toll Road Extension
bull Short Cut ndash copy an existing toll link bull No special NODE attributes bull Only new attribute is ISTOLL=1 for all links that could not be
used unless a toll were paid bull Toll Mainline FTC2=91 ISTOLL=1 DIRCODE=1 bull Plaza (gantry) ndash assume all will be electronic collection ndash TOLL=1 DIRCODE=1
ndash TOLLTYPE=3 CARTOLL=toll in dollars
ndash FTC2=95
ndash ISTOLL=1
ndash SVCSECONDS=001
ndash DELCODE=1 ACCELCODE=1 AVILANES=2
Toll Road Extension
Not much different from earlier versions of SERPM
Reversible Lanes
bull Control by the link attribute REVERSIBLE ndash REVERSIBLE=1 means AM operation only
ndash REVERSIBLE=2 means PM operation only
ndash I-595 example
Managed Lanes (typically Express)
bull HOT=1 ndash 98 (99 makes the link a dummy) bull FTC2 most likely=91 but other types permitted bull TOLL=0 ISTOLL=0 bull Tolls set by HOTTOLLdbf
HOT Lanes Tolls
bull Set as a function of the VC bull Updated in the travel time feedback loop bull Affects the TollFree split in mode choice bull Column HOT_x were x=HOT link attribute bull HOT_1 is the current 95 Express rate HOT_2 is a placeholder
Common Errors
bull Errors to watch out for ndash If network steps fail look for missing attributes
ndash Update transit routes as needed due to changes to underlying highway network
ndash Check for dangling links and unconnected zones
ndash Verify that all TAZs are connected to lsquofreersquo roads
bull Special procedures required for TAZs that have toll-only access must
include the attribute ISRCTOLLINK=1 (currently used for the
Rickenbacker Causeway)
ndash Some CT-RAMP errors caused by network coding errors may not be apparent until feedback loop 2 because in loop 1 CT-RAMP uses seed skims
bull Use small sample size when testing a new network
Was the Run Successful
bull Did the run converge ndash AM and PM travel time RMSE values reported to
OUTDIRfeedbacklogprn
ndash Run stops when RMSE is less than 01
ndash 2010 Scenario converges in 5 loops
bull What to do if it didnrsquot converge ndash Look for obvious errors
ndash Run more iterations (future year might require more)
bull Are the top-level results comparable to a similar run ndash Use HEVAL reports
ndash Examine screenlines (RMSE reports)
ndash Spot check link loads
Tools for Analysis
bull Analysis ndash perform standard highway project type analyses
bull Usual analysis similar to trip-based model ndash Total daily and period-specific roadway volumes and speeds by
vehicle class
ndash Vehicle trip OD matrices
bull Standard FSUTMS HEVAL and RMSE reports are still available ndash Day and period assignments
ndash By County
ndash Truck assignment
Tools for Analysis
bull Potential for customized assignment classes to address
specific project questions ndash Does the manage lane serve primarily high income users
bull Stratify vehicle classes by lowhigh income to understand facility
usage by income level
bull Stratify vehicle classes by disadvantaged population cohorts
bull Trip and person tabulations built from ABM output ndash Trip mode shares for many different population cohorts subareas
ndash For example toll vs non-toll shares by value of time or fine-graded income levels
ndash Many other possibilities
Application 4 ndash Mobility Project
Mobility Project ndash SUNPASS Market Share
bull Persons in households that own a SUNPASS transponder respond differently to managed lane and toll road policies ndash Pay lower tolls than cash users
ndash Have access to I-95 managed lanes
bull Policy questions ndash How does projected toll traffic and revenue vary with the SUNPASS
penetration rate and toll discount
ndash How will SUNPASS penetration rate vary as more managed lane facilities are built in the region
Mobility Project ndash SUNPASS Market Share
bull Question 1 -- How does projected toll traffic and revenue vary with the SUNPASS penetration rate and toll discount
bull Procedure ndash Step1 ndash Assume a SUNPASS market share by modifying the toll
transponder model
ndash Step 2 ndash Run SERPM7 to produce traffic volumes
ndash Step 3 ndash Estimate toll traffic revenue
Modifying the Toll Transponder Ownership Model
bull Model specification is contained in TransponderOwnershipxls and can be edited with Microsoft Excel
Utility Variable Coefficient
Expected time savings up to 644 min 00631
Distance less than 5 miles -00304
Distance between 5 and 10 miles -00648
Distance 10 miles or more -00648
Constant 04877
Modifying the Toll Transponder Ownership Model
Utility Variable Coefficient
Expected time savings up to 644 min 00631
Distance less than 5 miles -00304
Distance between 5 and 10 miles -00648
Distance 10 miles or more -00648
Constant 04877
Increasing the constant will increase the number of households equipped with transponders
TransponderOwnershipxls
Modifying the Toll Transponder Model
bull Increase the constant by how much ndash Process is akin to model calibration
ndash Several runs of the transponder model required to estimate the constant that yields the desired market share
ndash 2010 market share is approximately 65
ndash Use a small sample (5 or 10) to save run-time while establishing the right constant
Modifying the Toll Transponder Model
bull Variation ndash Add terms to the model so that certain types of households are more
likely to exhibit a SUNPASS market share increase
bull Highlow income households
bull Multi-car households
bull Miami-Dade households
Modifying the Toll Transponder Model
bull Exhibit TransponderOwnershipxls
Mobility Project ndash SUNPASS Market Share
bull Question 2 -- How will SUNPASS penetration rate vary as more managed lane facilities are built in the region
bull Procedure ndash Step 1 ndash Code the manage lane facilities
ndash Step 2 ndash Run SERPM7 to forecast transponder ownership
ndash Step 3 ndash Analyze the forecast household data for changes in the profile of households equipped with transponders
Application 5 ndash Land Use Project
Land Use Project
bull Transportation projects comprise not only network scenarios but also land use scenarios
bull Land use scenarios can be ndash Very large scale (substantial changes to housing and employment
estimates throughout the region) or
ndash Small scale (localized changes for example for a traffic impact study)
bull For both large scale and small scale land use updates the
general procedure for updating the input data and running the model is the same
Land Use Project
bull The land use data in SERPM7 consists of ndash Synthetic population and derived input files
ndash Employment data
ndash School enrollment data
ndash Parking costs and parking spaces
ndash Regional shopping mall special generators
ndash Beach special generators
ndash Hotel and motel room data
Land Use Project
bull The land use data reside in different input files
Data Item Input File
Synthetic Population hhFilecsv personFilecsv ctramppopsynTAZDatacsv ctramppopsynMAZDatacsv
Employment School Enrollment Parking Supply Data Special Generators Hotel and Motel Rooms
inputsIN-2010Rmaz_datacsv
Land Use Project
bull As demonstrated earlier SERPM 7 requires significantly more comprehensive socio-economic inputs as compared to previous versions ndash Greater spatial detail
ndash More categoriestypes of land uses
bull These inputs require additional preparation when
performing land use model runs
Land Use Project
Data Required and examples bull Population
bull Age distribution of the population expected to live in the
development
bull Income profile
bull Type of dwelling unit (single-family vs multi-family)
ndash The input data need to be internally consistent (distribution of households by presence of children needs to be consistent with population age distribution for example)
Land Use Project
Data Required bull Employment classification ndash Previous models had three
employment classifications
ndash In SERPM 7 there are 16 employment categories to better differentiate type of land use and improve the relationship between land use and activity purpose
Land Use Project
Data Required bull School enrollment ndash note that it differentiates by grade level
(K-8 high-school collegepost-secondary) ndash Donrsquot forget to include school faculty and staff in employment
Land Use Project
Data Required bull Parking supply and
parking costs ndash Parking spaces may
reflect use restrictions
bull Monthly
bull Daily
bull Hourly
ndash Parking costs consistent with type of use
Land Use Project
bull Park Area 1 (pink) ndash May park in MAZ other
than destination MAZ
ndash Parking cost applies
bull Park Area 2 (gree) ndash Parks at destination MAZ
ndash Parking cost applies
Land Use Project
Data Required bull Visitor Model ndash Number of hotel and motel rooms
bull Special Generators ndash Regional shopping malls
ndash Beach recreation areas
Land Use Project
The Gardens Mall Aventura Mall
Boynton Mall Dolphin Mall
Delray Community Mall Dadeland Mall
Towncenter Mall The Falls Shopping Center
Wellington Greens Mall Cutler Ridge Mall
Coral Square Mall Bal Harbour Shops
Pompano Citi Centre CocoWalk
Sawgrass Mills Mall The Mall at 163rd Street
Broward Mall Mall of the Americas
Galleria Mall Mary Brickell Village
Pembroke Lakes Mall Miami International Mall
Lakes Mall Miracle Marketplace
Oakwood Plaza Village of Merrick Park
The Promenade at Coconut Creek Westland Mall
Regional Shopping Mall Special Generators
Land Use Project
Deerfield Beach
Pompano Beach
Fort Lauderdale Beach
Fort Lauderdale Beach
Hollywood Beach
South Beach
Haulover Beach
Crandon Park
Dania Beach
Bill Baggs State Park
Beach Special Generators
Land Use Project
Sample Problem
bull MINTO West Example - a mixed residentialcommercial development ndash 6500 singlemulti-family residential units in multiple TAZs
ndash 14 million square feet of non-residential space
ndash 150 room hotel
ndash 3000 student college campus
Land Use Project
MINTO WEST
Land Use Project
TAZsMAZs representing MINTO West Development
Land Use Project
Need to translate population household and employment information from developer into model input data ndash As discussed in the Population Synthesis presentation population and
household attribute estimates can be taken from other known nearby neighborhoods
bull In this sample problem first start by allocating percentages of total
households into individual MAZs within the development area
bull Keep in mind household density when estimating the number of
households in each MAZ
Land Use Project
bull In this sample employment can be assumed to include bull Retail
bull RestaurantsBars
bull Offices
bull Health services
bull Hotelmotel employment and
bull Educational employment
ndash As with households yoursquoll need to apportion the employment areas to individual MAZs while keeping in mind the types of employment expected in those locations
Land Use Project
bull Employment data is usually estimated by converting floor space available to individual types of employment through conversion factors
bull ie ndash (3000 sqft office space)(20 sqft per office employee) =
150 office employees
Land Use Project
bull Once population household and employment figures are estimated they are entered into the appropriate model input file
bull Population ndash TAZ synthetic population control file
bull Household ndash TAZ synthetic population control file
bull Employment School Parking and Special Gen ndash maz_datacsv
bull Ensure that population household and employment figures
are the same in each file
bull Prior to performing model run PopSyn must be run and user must copy output files to SERPM7 input folders
Application 6 ndashTransit Project
Transit Project ndash MetroRail North Corridor
SERPM Transit Modes
Transit Mode Tour and Trip
Mode TAP Transit Skim Mode
Tri-Rail Commuter Rail Premium
Metrorail Urban Rail Premium
I-95 Inter-County Express I-95X I-95E
Express Bus Premium
Busway BRT Premium
MDT Express Express Bus Premium
Metromover Local Bus Local Bus
MDT Local BCT Local
Palm Tran Local Local Bus Local Bus
Breeze Local Bus Local Bus
Tri-Rail Shuttles Local Bus Local Bus
SERPM Transit Modes
Transit Mode Tour and Trip
Mode TAP Transit Skim
Mode
Mode coded on the route ldquocardsrdquo
Used to specify boarding and transfer penalties for transit
path building
(most disaggregate)
Line-haul choices in the tour and trip mode choice
models
Used to create sets of TAP to TAP levels of service
(most aggregate)
Similar to SERPM 67 SERPM 7 ABM
SERPM Transit Modes S67 Mode Local (L) S7
Mode Mode Name Operator amp Name UserA4 Name Prem (P) MODE
15 Tri-Rail 11 Tri-Rail 15 Commuter P 111
14 Metrorail 25 Metrorail 14 Urban Rail P 121
X Regional LRT Regional LRT 14 LRT P 131
16 Inter-County Express Bus 33 I-95 Inter-County Express 16 Express P 151
12 Exclusive ROW Cir-Reg 13 Exclusive ROW Cir-Reg 12 Mover L 181
11 TrolleysShuttles-Reg 12 Tri-Rail Shuttles 11 Local L 191
11 TrolleysShuttles-Reg 12 Tri-Rail Shuttles 33 Local L 192
X LRT- MDT 25 MDT LRT 14 LRT P 231
16 Buses (localexpress) - MDT 27 MDT Busway Flyers 27 BRT P 241
23 Buses (localexpress) - MDT 27 MDT MAXKATBusway Local 27 BRT P 242
24 BRT - MDT 28 MDT BRTLRT 28 BRT P 243
23 Buses (localexpress) - MDT 22 MDT Express 24 Express P 251
16 Buses (localexpress) - MDT 24 MDT I-95 Exp 26 Express P 252
16 Inter-County Express Bus 24 I-95 Inter-County Express 16 Express P 253
22 Exclusive ROW Cir-MDT 26 Metromover 22 Mover L 281
21 TrolleysShuttles-MDT 21 MDT TrolleysShuttles 21 Local L 291
23 Buses (localexpress) - MDT 21 MDT Local 23 Local L 292
23 Buses (localexpress) - MDT 23 MDT Shuttle 25 Local L 293
X LRT - BCT 35 BCT LRT 37 LRT P 331
34 BCT Rapid Bus BRT 34 BCT Rapid Bus 36 BRT P 341
34 BCT Fixed-guideway BRT 35 BCT BRT 37 BRT P 342
33 Buses (localexpress) - BCT 32 BCT Breeze 34 Express P 351
33 Buses (localexpress) - BCT 33 BCT Express 35 Express P 352
32 Exclusive ROW Cir-BCT 31 BCT Exclusive ROW Cir 32 Mover L 381
31 TrolleysShuttles-BCT 31 BCT TrolleysShuttles 31 Local L 393
33 Buses (localexpress) - BCT 31 BCT Local 27 Local L 391
33 Buses (localexpress) - BCT 31 BCT Local 33 Local L 392
X LRT - Palm Tran 43 Palm Tran LRT 44 LRT P 431
44 BRT - Palm Tran 43 Palm Tran BRT 44 BRT P 441
43 Buses (localexpress) - Ptran 42 Palm Tran Exp 44 Express P 451
42 Exclusive ROW Cir-PTran 41 Palm Tran Exclusive ROW Cir 42 Mover L 481
41 TrolleysShuttles-Ptran 41 Palm Tran TrolleysShuttles 41 Local L 491
43 Buses (localexpress) - Ptran 41 Palm Tran Local 43 Local L 492
Modes Not in the 2010 Network
SERPM7 Transit Network Building
bull Typically bus routes are coded on top of existing highway links
bull SERPM7 reserves some facility type codes for transit-only use helpful to more accurately represent route ndash Caution -- make sure network integrity is preserved once transit only
links are removed
bull Rail routes require coding first fixed-guideway links
SERPM7 Transit Network Building
bull Route Attributes -- User Coded ndash Name
ndash Long Name
ndash Mode
ndash Operator
ndash Headway[1] ndash AM Peak
ndash Headway[2] ndash Midday
ndash Headway[3] ndash PM Peak
ndash UserA4 (stop dwell time)
SERPM7 Transit Network Building
bull PNR Node Attributes ndash User Coded ndash Parking Spaces
ndash Parking Cost AM
ndash Parking Cost MD
ndash Terminal Time PNR
ndash Terminal Time KNR
bull At this time parking spaces is used only to identify park-n-ride locations (parking spaces gt 0)
SERPM7 Transit Network Building
bull Transit Access Points -- Created by Cube for the ABM ndash One TAP for each stop on premium routes
bull Tri-Rail Metrorail Express Bus BRT
ndash One TAP for each Local Bus park-n-ride node
ndash Synthesized TAPs to represent access to local bus stops
bull Transit Access Point Attributes ndash TAP Mode
ndash Inherit PNR node data
Sample Highway Network with TAPs
TAPs become part of the highway network and replace the TAZ centroids when building transit skims
Transit Access Points and ldquoon the flyrdquo Path Building
bull Transit skims are built TAP to TAP
Matrix origins and destinations are TAPS
Transit Access Points and ldquoon the flyrdquo Path Building
Trip Origins and
Destinations
MAZ to MAZ
Auto Skims
TAZ to TAZ
Transit Skims
TAP to TAP
The three spatial systems are put together by the mode choice model
ldquoOn the Flyrdquo Path Building
bull TAZs TAPs and MAZs are linked via drive and access connectors prior to running CT-RAMP
rmdir OUTDIRABMTEMP S Q rmdir DATADIRABMTEMP S Q xcopy OUTDIR OUTDIRABMTEMP E I Y xcopy DATADIR DATADIRABMTEMP E I Y if(fbi=1) need to run only the first time through - kdk CUBEctramprunCreateAccessFilescmd endif mkdir logFiles taskkill im javaexe F start CUBEctramprunHhMgrcmd JDK64 HOST_IP start CUBEctramprunMtxMgrcmd HOST_IP JDK64 rem start CUBEctrampconfigrunDrivercmd copy CUBEctrampserpm_abmproperties serpm_abmproperties Y ping -n 11 127001 gt nul CUBEctramprunSERPMAbmcmd SAMPLERATE VSAMPLERATE JDK64 CUBEctramprunCreateDemandMatricescmd SAMPLERATE VSAMPLERATE JDK64 taskkill im javaexe F rmdir OUTDIRctramp S Q rmdir DATADIRctramp S Q xcopy OUTDIRABMTEMPctramp OUTDIRctramp E I Y xcopy DATADIRABMTEMPctramp DATADIRctramp E I Y
ldquoOn the Flyrdquo Path Building
MAZ to MAZ Connectors
Created by finding shortest distance paths over an all-streets network Connects all MAZs within 15 mi
Used to represent walk mode distance and time
MAZ to TAP Connectors
Created by finding shortest distance paths over an all-streets network Connects each MAZ to all TAPs within 10 mi
Used to represent transit walk access and walk egress distance and time
TAZ to TAP Connectors
Connects each TAZ to all TAPs within the TAP maximum drive distance bull Bus TAPs ndash 4 miles bull Rail TAPs ndash 15 miles
Used to represent transit drive access and egress distance and time
ldquoOn the Flyrdquo Path Building
bull No actual links created on the network bull Connectivity is expressed in table format
ldquoOn the Flyrdquo Path Building
bull Once the access and walk connectors are created the mode choice model builds complete paths MAZ to MAZ transit paths
bull Local-only paths are built using the ldquolocalrdquo transit skim bull Express BRT Urban Rail and Commuter rail paths are all
built at the same time using the ldquopremiumrdquo transit skim bull For each MAZ to MAZ pair CT-RAMP keeps the shortest
generalized cost path for each available premium mode bull Even though only one ldquopremiumrdquo skim is built CT-RAMP
may find competing premium paths It may also find that the best path is a combination of two premium modes or a premium mode and local bus
Tour Mode Choice Model
Choice
Auto
Drive alone
GP(1)
Pay(2)
Shared ride 2
GP(3)
HOV(4)
Pay(5)
Shared ride 3+
GP(6)
HOV(7)
Pay(8)
Non-motorized
Walk(9)
Bike(10)
Transit
Walk access
Local bus(11)
Express bus(12)
BRT(13)
Urban rail(14)
Commuter rail(15)
PNR access
Local bus(16)
Express bus(17)
BRT(18)
Urban rail(19)
Commuter rail(20)
KNR access
Local bus(21)
Express bus(22)
BRT(23)
Urban rail(24)
Commuter rail(25)
School Bus(26)
Trip Mode Choice Model
bull Same nesting structure as the tour mode choice but conditional on the tour mode
bull Some trip modes may be unavailable depending on the tour mode
DA SR2 SR3+ Walk Wlk-Trn PNR-Trn KNR-Trn
DA Must - - - - - -
SR2 Can Can - Can - - -
SR3+ Can Can Can Can - - -
Walk - - - Must - - -
Wlk-Trn - Can Can Can Can - -
PNR-Trn Can Can Can Can Can Can
KNR-Trn - Can Can Can Can - Can
Trip Switching Rules Simplified
Transit Trip Reporting
bull In SERPM7 the transit boarding and alighting location can be reported in two ways ndash Trip list files (ABM output) -- Boarding TAP Alighting TAP
ndash Transit assignment (Cube output) ndash Route nodes
bull Each type of reporting has its strengths ndash Trip list file allows building detailed transit trip patterns for
population cohorts and time periods
bull Mode split reports
bull Transit trip distance frequency distributions access distance TLFDs
bull Mode to mode transfers
ndash Note ABM reports only the first boarding TAP and the last alighting TAP regardless of mode
ndash Cube output gives aggregate link volumes station to station boardings etc
User Benefit Files
bull SERPM7 can produce FTA User Benefit files for input to SUMMIT
bull User benefits remain a useful analysis tool bull Steps to produce user benefit files require some manual
intervention ndash see User Guide
SERPM ABM Reports
bull Stores ABM inputs and outputs in a relational database to generate some standard model reports
bull Consistent reporting framework to be used for analysis across model runs
bull SERPM7 user community can easily share the scripts that create the reports
bull Reports take the form of Excel workbooks bull Foundation for future development of a visualization
dashboard
Reporting Database Components
Reporting Database Components
bull Reporting ETL (extract transform and load) program ndash Loads all Cube and CT-RAMP Java model outputs into the database
ndash Written in Cube scripts and Java
bull Database ndash Stores all data used in reporting including select network skims
household person tour and trip data zonal data etc
ndash Implemented with SQL Server
bull Report scripts to generate reports ndash Written in T-SQL
bull Report packaging program ndash Generates Excel workbooks with one report per worksheet
ndash Written in Java
Reporting Database Components
bull Run time required to build database and generate reports varies with sample size and type of report ndash Several hours required to build the database for a 100 sample
ndash ~ 30 minutes to produce reports for a 10 sample
bull Report step is optional not part of a standard model run bull Report production is transparent to the user
bull hellip but users can contribute reports bull hellip and choose which reports to build at any one time
Running SERPM ABM Reports
bull Report queries reside in ctrampreports_sql time_spent_travelingsql Total weekday travel time by person type
and income group
total_trips_typesql Trips by trip mode person type county of residence and tour purpose
total_tours_typesql Tours by trip mode person type county of residence and tour purpose
tours_districtssql Tours by tour purpose and tour origin and destination districts
transit_access_time+distsql Drive to transit trip list with many trip details
hellip
Running SERPM ABM Reports
bull List of reports to run is specified in properties file ndash ctrampserpm_reportsproperties
sqlscriptsdirectory = Cserpm7ctrampreports_sql sqlscriptsschemakey = SCHEMA sqlscripts=cleanupsqltransit_access_time+distsql worksheettables=temptransittrips worksheetnames=TransitTrips workbookname = Cserpm7ctrampreports_sqlSERPM_REPORTXLS databaseschema = 2010R databaseipaddress = w-ampdx-d-sag10 databaseinstance = databaseport = 1433 databasename=SERPMABM databaseusername=serpm databasepassword=s3rpm
Adding Reports
bull Step 1 --Write report query ndash T-SQL
ndash User Guide includes a database data dictionary
bull Step 2 ndash Add query to ctrampreports_sql ndash Each query is contained in a single text file
ndash Drop file in reports folder
bull Step 3 ndash Add the query to the properties file sqlquery = Query file name
Worksheettables = Query output
Worksheetnames = Name for the report worksheet
Sample SERPM ABM Reports
bull Exhibit ctrampreports_sqlserpm_reportsxls
More information Shi-Chiang Li | shi-chianglidotstateflus |954 777 4655 Rosella Picado | picadopbworldcom | 206 382 5227 Ken Kaltenbach |kkaltenbachcorradinocom |502 587 7221

Population Synthesis
bull The population synthesizer (PopSynII) does not run normally as part of SERPM7 ndash SERPM7 expects input population files in the input folder
ndash User is responsible for running PopSynII to generate the required population files and place them in the scenario folders prior to a SERPM7 run
bull Why ndash Because a new synthetic population is not required for every run
PopSyn II Setup
bull PopSynII is already configured to run on the FDOT servers bull Java application using SQL data storage
PopSynII installed in the main ctramp folder
PopSynII Setup
bull The ctramppopsyn folder
Filename Description
runAllPopsynbat Batch file that controls the execution of PopSynII
controls SQL settings file that specifies the population attributes used as controls
1_importCSVsql 2_createTargetssql 3_createSynHHPerFilessql
SQL scripts that run the PopSynII software
2010_TAZ_Datacsv TAZ input control data
2010_MAZ_Datacsv MAZ input control data
Developing a New Synthetic Population
bull Step 1 ndash Prepare the input files ndash TAZ controls 2010_taz_datacsv
ndash MAZ controls 2010_maz_datacsv
Developing a New Synthetic Population
bull MAZ Control input file eg 2010_maz_datacsv ndash Estimates of total households and persons living in group quarters
bull Total households
bull Total group quarter population
ndash One record for each MAZ
Developing a New Synthetic Population
bull TAZ Controls input file -- eg 2010_taz_datacsv ndash Estimates of number of households or population for each SERPM7
controlled attribute
bull Household size
bull Household income
bull Household workers
bull Type of dwelling unit
bull Presence of children in the household
bull Population age group
bull Gender
bull Raceethnicity
bull Population in group quarters
ndash One record per TAZ
Analogous to the TAZ SE data file in the trip-
based model
Developing a New Synthetic Population
When preparing TAZ and MAZ control data it is critically important to
maintain internal data consistency
Developing a New Synthetic Population
bull Some data checks to perform and problems to look out for ndash The household and person marginals pertain to household residents
only except for the group quarter controls
ndash All household-based marginals add up to the same total households for each TAZ
ndash All person-based marginals add up to the same total persons for each TAZ
ndash The total number of persons implied by the household size marginal is consistent with the sum total of the person marginals
ndash The total number of children obtained from the age marginal is consistent with the marginal of households by presence of children
ndash Large deviations from 5050 split of persons by gender is suspect
ndash The household income distribution is consistency with the workers-in-household distribution
Developing a New Synthetic Population
bull More data checks ndash The MAZ and TAZ controls should add up
bull to the same number of households by TAZ
bull to the same number of persons in group quarters by TAZ
Developing a New Synthetic Population
bull Exhibit ndash SERPM7 2010 TAZ control file
Example ndash Minto West Palm Beach Co
Example ndash Minto West
bull Mixed-use development in a agricultural area adjacent to an existing housing development
bull Information available from proposedapproved plans ndash Single-family dwelling units ndash 5050
ndash Multi-family dwelling units ndash 1040
ndash Total population ndash 14 535 persons
ndash Spatial location of dwelling units by type
bull Other PopSyn required data not available from plans (income distribution age distribution etc) ndash Estimateassert it based on similar existing developments
surrounding neighborhood
Example ndash Minto West
bull Adding householdspersons to a TAZ
bull Adding TAZs or MAZs to SERPM7 should be a rare occurrence ndash Households are ultimately allocated to MAZs and therersquos already
12000 of them
ndash Households are represented individually so the zone attributes are derived from them
Trip-Based Model Modify the input zonal data file
Activity-Based Model Modify the population synthesis control file
Running PopSynII
bull Step 2 ndash Modify the PopSyn settings file for this run ndash Update TAZ and MAZ control filenames in runAll_popsynbat
REM BATCH FILE TO SETUP POPSYN RUN RUN POPSYNII AND OUTPUT CSV FILES REM SETUP REM PLEASE SET PATH NAMES FOR WORKING FOLDER AND CSV FILE LOCATIONS SET SERVERNAME=W-AMSTL-D-00052SQLEXPRESS SET DATABASENAME=popSyn SET ARCPATH=Cpopsyn SET CSVPATH_CONTROLS=Cpopsyninputscontrolscsv SET CSVPATH_MAZ=Cpopsyninputs2010_MAZ_Data_20120207csv SET CSVPATH_TAZ=Cpopsyninputs2010_TAZ_Data_20120207csv REM MAIN SCRIPT REM MAKE FILENAMES TABLE REM sqlcmd -S SERVER NAME -E -i INPUT FILE PATH (SCRIPT) -o OUTPUT LOG REM -E means to use Windows authentication for the user that is running the batch file SQLCMD -S SERVERNAME -d DATABASENAME -E -Q IF OBJECT_ID(dbocsv_filenames) IS NOT NULL DROP TABLE csv_filenames -o ARCPATHResultLogtxt
hellip hellip
Running PopSynII
bull Other PopSyn settings ndash rarely used in a production run ndash Change the control attributes
ndash Change the priority of control attributes
Running PopSynII
bull Step 3 ndash Run PopSynII -- runAll_popsynbat
Running PopSynII
bull Step 4 ndash Review Output amp Check Fit to Controls
Output File Description
hhFilecsv List of households
personFilecsv List of persons
ZoneResultscsv Comparisons of synthetized households to controlled and uncontrolled attributes
BalanceDetailscsv
ValidationStatscsv
ValidationStatsByPumacsv
Reviewing PopSyn Output
bull Zone_Resultscsv bull Comparison of synthesized totals to target totals for each
TAZ and controlled attribute
TOTAL_HOUSEHOLDS
ZONE TARGET SYNTHESIZED DIFFERENCE PCTDIFF
1 715 715 0 0
2 811 811 0 0
3 878 878 0 0
4 826 826 0 0
5 1181 1181 0 0
6 212 212 0 0
7 459 459 0 0
8 253 253 0 0
Reviewing PopSyn Output
bull Balance_Detailscsv bull Same output as Zone_Results different format
Zone Control ID ControlCat Target PUMSVal ConStat
1989 109 TOTAL_HOUSEHOLDS 1508 1508 yes
1989 249 INCOME_25K 273 271 no
1989 19 HHSIZE_4PLUS 467 467 yes
1989 160 FEMALE 2196 2108 no
1989 55 INCOME_100K 258 257 yes
1989 67 MULTI_UNIT 423 407 no
1989 31 WORKERS_3PLUS 164 166 no
Reviewing PopSyn Output
bull Validation_Statscsv ndash Comparison of synthesized attributes to input Census data (5 PUMS)
ndash Includes uncontrolled attributes
Description popSynSum censusSum meanDiff stdDev minDiff maxDiff Universe 1 number of households 2085375 1964881 17 61 -97 331
family 67 65 3 17 -26 48
non family 33 35 0 34 -58 111
size 1 27 28 0 36 -59 111
size 2 31 32 -3 14 -30 30
size 3 17 17 1 22 -37 53
size 4 25 23 18 50 -46 160
Reviewing PopSyn Output
bull Validation_StatsByPumacsv ndash Same as validation_stats but for each PUMA
bull Note that synthesized population may differ from 5 Census population by design
Application 3 ndash Highway Project
Highway Project
Example Projects ndashToll road extension ndashReversible lanes ndashManaged lanes
Overview
How to use SERPM7 to perform a model run and do some standard analysis ndash Option 1 -- Code the project directly on the geodatabase
bull Roadway links
bull Node links
bull Turn penalties
bull [assume no change to transit]
ndash Option 2 --Code the project on net files and then build the geodatabase
bull Use flowchart script to build the geodatabase
ndash Coding is very similar to earlier versions of SERPM
bull Facility types are the same
SERPM Facility Types (not new)
Editing the Highway Network
bull SERPM 7 requires a geodatabase bull Editing can be done either to a net file or directly on the
geodatabase bull The user can use utilities in the model flowchart to write a
net file from the geodatabase edit the net and then write it to the geodatabase
bull The geodatabase must exist to run the model
Editing in the Geodatabase
bull Simplest and most direct method bull Requires an understanding of the CubeArcGIS tools
Export geodatabase and edit as a net
bull Start Data Manager bull Open geodatabase (SERPM_NETSMDB) bull Double click on the network Input Hwy Net and specify an
output file (maybe ldquoeditnetrdquo) bull Open from Cube and edit as usual bull Use ldquoPrepare for Model Run and Trap Errorsrdquo (2) utilities to
write back to geodatabase ndash Reload geodatabase from Cube files ndash Cull and sort
ndash Write to geodatabase
Edit as a net
Export Edit in Cube
Change to point to edited network
Input Hwy Net
Toll Road Extension
bull Short Cut ndash copy an existing toll link bull No special NODE attributes bull Only new attribute is ISTOLL=1 for all links that could not be
used unless a toll were paid bull Toll Mainline FTC2=91 ISTOLL=1 DIRCODE=1 bull Plaza (gantry) ndash assume all will be electronic collection ndash TOLL=1 DIRCODE=1
ndash TOLLTYPE=3 CARTOLL=toll in dollars
ndash FTC2=95
ndash ISTOLL=1
ndash SVCSECONDS=001
ndash DELCODE=1 ACCELCODE=1 AVILANES=2
Toll Road Extension
Not much different from earlier versions of SERPM
Reversible Lanes
bull Control by the link attribute REVERSIBLE ndash REVERSIBLE=1 means AM operation only
ndash REVERSIBLE=2 means PM operation only
ndash I-595 example
Managed Lanes (typically Express)
bull HOT=1 ndash 98 (99 makes the link a dummy) bull FTC2 most likely=91 but other types permitted bull TOLL=0 ISTOLL=0 bull Tolls set by HOTTOLLdbf
HOT Lanes Tolls
bull Set as a function of the VC bull Updated in the travel time feedback loop bull Affects the TollFree split in mode choice bull Column HOT_x were x=HOT link attribute bull HOT_1 is the current 95 Express rate HOT_2 is a placeholder
Common Errors
bull Errors to watch out for ndash If network steps fail look for missing attributes
ndash Update transit routes as needed due to changes to underlying highway network
ndash Check for dangling links and unconnected zones
ndash Verify that all TAZs are connected to lsquofreersquo roads
bull Special procedures required for TAZs that have toll-only access must
include the attribute ISRCTOLLINK=1 (currently used for the
Rickenbacker Causeway)
ndash Some CT-RAMP errors caused by network coding errors may not be apparent until feedback loop 2 because in loop 1 CT-RAMP uses seed skims
bull Use small sample size when testing a new network
Was the Run Successful
bull Did the run converge ndash AM and PM travel time RMSE values reported to
OUTDIRfeedbacklogprn
ndash Run stops when RMSE is less than 01
ndash 2010 Scenario converges in 5 loops
bull What to do if it didnrsquot converge ndash Look for obvious errors
ndash Run more iterations (future year might require more)
bull Are the top-level results comparable to a similar run ndash Use HEVAL reports
ndash Examine screenlines (RMSE reports)
ndash Spot check link loads
Tools for Analysis
bull Analysis ndash perform standard highway project type analyses
bull Usual analysis similar to trip-based model ndash Total daily and period-specific roadway volumes and speeds by
vehicle class
ndash Vehicle trip OD matrices
bull Standard FSUTMS HEVAL and RMSE reports are still available ndash Day and period assignments
ndash By County
ndash Truck assignment
Tools for Analysis
bull Potential for customized assignment classes to address
specific project questions ndash Does the manage lane serve primarily high income users
bull Stratify vehicle classes by lowhigh income to understand facility
usage by income level
bull Stratify vehicle classes by disadvantaged population cohorts
bull Trip and person tabulations built from ABM output ndash Trip mode shares for many different population cohorts subareas
ndash For example toll vs non-toll shares by value of time or fine-graded income levels
ndash Many other possibilities
Application 4 ndash Mobility Project
Mobility Project ndash SUNPASS Market Share
bull Persons in households that own a SUNPASS transponder respond differently to managed lane and toll road policies ndash Pay lower tolls than cash users
ndash Have access to I-95 managed lanes
bull Policy questions ndash How does projected toll traffic and revenue vary with the SUNPASS
penetration rate and toll discount
ndash How will SUNPASS penetration rate vary as more managed lane facilities are built in the region
Mobility Project ndash SUNPASS Market Share
bull Question 1 -- How does projected toll traffic and revenue vary with the SUNPASS penetration rate and toll discount
bull Procedure ndash Step1 ndash Assume a SUNPASS market share by modifying the toll
transponder model
ndash Step 2 ndash Run SERPM7 to produce traffic volumes
ndash Step 3 ndash Estimate toll traffic revenue
Modifying the Toll Transponder Ownership Model
bull Model specification is contained in TransponderOwnershipxls and can be edited with Microsoft Excel
Utility Variable Coefficient
Expected time savings up to 644 min 00631
Distance less than 5 miles -00304
Distance between 5 and 10 miles -00648
Distance 10 miles or more -00648
Constant 04877
Modifying the Toll Transponder Ownership Model
Utility Variable Coefficient
Expected time savings up to 644 min 00631
Distance less than 5 miles -00304
Distance between 5 and 10 miles -00648
Distance 10 miles or more -00648
Constant 04877
Increasing the constant will increase the number of households equipped with transponders
TransponderOwnershipxls
Modifying the Toll Transponder Model
bull Increase the constant by how much ndash Process is akin to model calibration
ndash Several runs of the transponder model required to estimate the constant that yields the desired market share
ndash 2010 market share is approximately 65
ndash Use a small sample (5 or 10) to save run-time while establishing the right constant
Modifying the Toll Transponder Model
bull Variation ndash Add terms to the model so that certain types of households are more
likely to exhibit a SUNPASS market share increase
bull Highlow income households
bull Multi-car households
bull Miami-Dade households
Modifying the Toll Transponder Model
bull Exhibit TransponderOwnershipxls
Mobility Project ndash SUNPASS Market Share
bull Question 2 -- How will SUNPASS penetration rate vary as more managed lane facilities are built in the region
bull Procedure ndash Step 1 ndash Code the manage lane facilities
ndash Step 2 ndash Run SERPM7 to forecast transponder ownership
ndash Step 3 ndash Analyze the forecast household data for changes in the profile of households equipped with transponders
Application 5 ndash Land Use Project
Land Use Project
bull Transportation projects comprise not only network scenarios but also land use scenarios
bull Land use scenarios can be ndash Very large scale (substantial changes to housing and employment
estimates throughout the region) or
ndash Small scale (localized changes for example for a traffic impact study)
bull For both large scale and small scale land use updates the
general procedure for updating the input data and running the model is the same
Land Use Project
bull The land use data in SERPM7 consists of ndash Synthetic population and derived input files
ndash Employment data
ndash School enrollment data
ndash Parking costs and parking spaces
ndash Regional shopping mall special generators
ndash Beach special generators
ndash Hotel and motel room data
Land Use Project
bull The land use data reside in different input files
Data Item Input File
Synthetic Population hhFilecsv personFilecsv ctramppopsynTAZDatacsv ctramppopsynMAZDatacsv
Employment School Enrollment Parking Supply Data Special Generators Hotel and Motel Rooms
inputsIN-2010Rmaz_datacsv
Land Use Project
bull As demonstrated earlier SERPM 7 requires significantly more comprehensive socio-economic inputs as compared to previous versions ndash Greater spatial detail
ndash More categoriestypes of land uses
bull These inputs require additional preparation when
performing land use model runs
Land Use Project
Data Required and examples bull Population
bull Age distribution of the population expected to live in the
development
bull Income profile
bull Type of dwelling unit (single-family vs multi-family)
ndash The input data need to be internally consistent (distribution of households by presence of children needs to be consistent with population age distribution for example)
Land Use Project
Data Required bull Employment classification ndash Previous models had three
employment classifications
ndash In SERPM 7 there are 16 employment categories to better differentiate type of land use and improve the relationship between land use and activity purpose
Land Use Project
Data Required bull School enrollment ndash note that it differentiates by grade level
(K-8 high-school collegepost-secondary) ndash Donrsquot forget to include school faculty and staff in employment
Land Use Project
Data Required bull Parking supply and
parking costs ndash Parking spaces may
reflect use restrictions
bull Monthly
bull Daily
bull Hourly
ndash Parking costs consistent with type of use
Land Use Project
bull Park Area 1 (pink) ndash May park in MAZ other
than destination MAZ
ndash Parking cost applies
bull Park Area 2 (gree) ndash Parks at destination MAZ
ndash Parking cost applies
Land Use Project
Data Required bull Visitor Model ndash Number of hotel and motel rooms
bull Special Generators ndash Regional shopping malls
ndash Beach recreation areas
Land Use Project
The Gardens Mall Aventura Mall
Boynton Mall Dolphin Mall
Delray Community Mall Dadeland Mall
Towncenter Mall The Falls Shopping Center
Wellington Greens Mall Cutler Ridge Mall
Coral Square Mall Bal Harbour Shops
Pompano Citi Centre CocoWalk
Sawgrass Mills Mall The Mall at 163rd Street
Broward Mall Mall of the Americas
Galleria Mall Mary Brickell Village
Pembroke Lakes Mall Miami International Mall
Lakes Mall Miracle Marketplace
Oakwood Plaza Village of Merrick Park
The Promenade at Coconut Creek Westland Mall
Regional Shopping Mall Special Generators
Land Use Project
Deerfield Beach
Pompano Beach
Fort Lauderdale Beach
Fort Lauderdale Beach
Hollywood Beach
South Beach
Haulover Beach
Crandon Park
Dania Beach
Bill Baggs State Park
Beach Special Generators
Land Use Project
Sample Problem
bull MINTO West Example - a mixed residentialcommercial development ndash 6500 singlemulti-family residential units in multiple TAZs
ndash 14 million square feet of non-residential space
ndash 150 room hotel
ndash 3000 student college campus
Land Use Project
MINTO WEST
Land Use Project
TAZsMAZs representing MINTO West Development
Land Use Project
Need to translate population household and employment information from developer into model input data ndash As discussed in the Population Synthesis presentation population and
household attribute estimates can be taken from other known nearby neighborhoods
bull In this sample problem first start by allocating percentages of total
households into individual MAZs within the development area
bull Keep in mind household density when estimating the number of
households in each MAZ
Land Use Project
bull In this sample employment can be assumed to include bull Retail
bull RestaurantsBars
bull Offices
bull Health services
bull Hotelmotel employment and
bull Educational employment
ndash As with households yoursquoll need to apportion the employment areas to individual MAZs while keeping in mind the types of employment expected in those locations
Land Use Project
bull Employment data is usually estimated by converting floor space available to individual types of employment through conversion factors
bull ie ndash (3000 sqft office space)(20 sqft per office employee) =
150 office employees
Land Use Project
bull Once population household and employment figures are estimated they are entered into the appropriate model input file
bull Population ndash TAZ synthetic population control file
bull Household ndash TAZ synthetic population control file
bull Employment School Parking and Special Gen ndash maz_datacsv
bull Ensure that population household and employment figures
are the same in each file
bull Prior to performing model run PopSyn must be run and user must copy output files to SERPM7 input folders
Application 6 ndashTransit Project
Transit Project ndash MetroRail North Corridor
SERPM Transit Modes
Transit Mode Tour and Trip
Mode TAP Transit Skim Mode
Tri-Rail Commuter Rail Premium
Metrorail Urban Rail Premium
I-95 Inter-County Express I-95X I-95E
Express Bus Premium
Busway BRT Premium
MDT Express Express Bus Premium
Metromover Local Bus Local Bus
MDT Local BCT Local
Palm Tran Local Local Bus Local Bus
Breeze Local Bus Local Bus
Tri-Rail Shuttles Local Bus Local Bus
SERPM Transit Modes
Transit Mode Tour and Trip
Mode TAP Transit Skim
Mode
Mode coded on the route ldquocardsrdquo
Used to specify boarding and transfer penalties for transit
path building
(most disaggregate)
Line-haul choices in the tour and trip mode choice
models
Used to create sets of TAP to TAP levels of service
(most aggregate)
Similar to SERPM 67 SERPM 7 ABM
SERPM Transit Modes S67 Mode Local (L) S7
Mode Mode Name Operator amp Name UserA4 Name Prem (P) MODE
15 Tri-Rail 11 Tri-Rail 15 Commuter P 111
14 Metrorail 25 Metrorail 14 Urban Rail P 121
X Regional LRT Regional LRT 14 LRT P 131
16 Inter-County Express Bus 33 I-95 Inter-County Express 16 Express P 151
12 Exclusive ROW Cir-Reg 13 Exclusive ROW Cir-Reg 12 Mover L 181
11 TrolleysShuttles-Reg 12 Tri-Rail Shuttles 11 Local L 191
11 TrolleysShuttles-Reg 12 Tri-Rail Shuttles 33 Local L 192
X LRT- MDT 25 MDT LRT 14 LRT P 231
16 Buses (localexpress) - MDT 27 MDT Busway Flyers 27 BRT P 241
23 Buses (localexpress) - MDT 27 MDT MAXKATBusway Local 27 BRT P 242
24 BRT - MDT 28 MDT BRTLRT 28 BRT P 243
23 Buses (localexpress) - MDT 22 MDT Express 24 Express P 251
16 Buses (localexpress) - MDT 24 MDT I-95 Exp 26 Express P 252
16 Inter-County Express Bus 24 I-95 Inter-County Express 16 Express P 253
22 Exclusive ROW Cir-MDT 26 Metromover 22 Mover L 281
21 TrolleysShuttles-MDT 21 MDT TrolleysShuttles 21 Local L 291
23 Buses (localexpress) - MDT 21 MDT Local 23 Local L 292
23 Buses (localexpress) - MDT 23 MDT Shuttle 25 Local L 293
X LRT - BCT 35 BCT LRT 37 LRT P 331
34 BCT Rapid Bus BRT 34 BCT Rapid Bus 36 BRT P 341
34 BCT Fixed-guideway BRT 35 BCT BRT 37 BRT P 342
33 Buses (localexpress) - BCT 32 BCT Breeze 34 Express P 351
33 Buses (localexpress) - BCT 33 BCT Express 35 Express P 352
32 Exclusive ROW Cir-BCT 31 BCT Exclusive ROW Cir 32 Mover L 381
31 TrolleysShuttles-BCT 31 BCT TrolleysShuttles 31 Local L 393
33 Buses (localexpress) - BCT 31 BCT Local 27 Local L 391
33 Buses (localexpress) - BCT 31 BCT Local 33 Local L 392
X LRT - Palm Tran 43 Palm Tran LRT 44 LRT P 431
44 BRT - Palm Tran 43 Palm Tran BRT 44 BRT P 441
43 Buses (localexpress) - Ptran 42 Palm Tran Exp 44 Express P 451
42 Exclusive ROW Cir-PTran 41 Palm Tran Exclusive ROW Cir 42 Mover L 481
41 TrolleysShuttles-Ptran 41 Palm Tran TrolleysShuttles 41 Local L 491
43 Buses (localexpress) - Ptran 41 Palm Tran Local 43 Local L 492
Modes Not in the 2010 Network
SERPM7 Transit Network Building
bull Typically bus routes are coded on top of existing highway links
bull SERPM7 reserves some facility type codes for transit-only use helpful to more accurately represent route ndash Caution -- make sure network integrity is preserved once transit only
links are removed
bull Rail routes require coding first fixed-guideway links
SERPM7 Transit Network Building
bull Route Attributes -- User Coded ndash Name
ndash Long Name
ndash Mode
ndash Operator
ndash Headway[1] ndash AM Peak
ndash Headway[2] ndash Midday
ndash Headway[3] ndash PM Peak
ndash UserA4 (stop dwell time)
SERPM7 Transit Network Building
bull PNR Node Attributes ndash User Coded ndash Parking Spaces
ndash Parking Cost AM
ndash Parking Cost MD
ndash Terminal Time PNR
ndash Terminal Time KNR
bull At this time parking spaces is used only to identify park-n-ride locations (parking spaces gt 0)
SERPM7 Transit Network Building
bull Transit Access Points -- Created by Cube for the ABM ndash One TAP for each stop on premium routes
bull Tri-Rail Metrorail Express Bus BRT
ndash One TAP for each Local Bus park-n-ride node
ndash Synthesized TAPs to represent access to local bus stops
bull Transit Access Point Attributes ndash TAP Mode
ndash Inherit PNR node data
Sample Highway Network with TAPs
TAPs become part of the highway network and replace the TAZ centroids when building transit skims
Transit Access Points and ldquoon the flyrdquo Path Building
bull Transit skims are built TAP to TAP
Matrix origins and destinations are TAPS
Transit Access Points and ldquoon the flyrdquo Path Building
Trip Origins and
Destinations
MAZ to MAZ
Auto Skims
TAZ to TAZ
Transit Skims
TAP to TAP
The three spatial systems are put together by the mode choice model
ldquoOn the Flyrdquo Path Building
bull TAZs TAPs and MAZs are linked via drive and access connectors prior to running CT-RAMP
rmdir OUTDIRABMTEMP S Q rmdir DATADIRABMTEMP S Q xcopy OUTDIR OUTDIRABMTEMP E I Y xcopy DATADIR DATADIRABMTEMP E I Y if(fbi=1) need to run only the first time through - kdk CUBEctramprunCreateAccessFilescmd endif mkdir logFiles taskkill im javaexe F start CUBEctramprunHhMgrcmd JDK64 HOST_IP start CUBEctramprunMtxMgrcmd HOST_IP JDK64 rem start CUBEctrampconfigrunDrivercmd copy CUBEctrampserpm_abmproperties serpm_abmproperties Y ping -n 11 127001 gt nul CUBEctramprunSERPMAbmcmd SAMPLERATE VSAMPLERATE JDK64 CUBEctramprunCreateDemandMatricescmd SAMPLERATE VSAMPLERATE JDK64 taskkill im javaexe F rmdir OUTDIRctramp S Q rmdir DATADIRctramp S Q xcopy OUTDIRABMTEMPctramp OUTDIRctramp E I Y xcopy DATADIRABMTEMPctramp DATADIRctramp E I Y
ldquoOn the Flyrdquo Path Building
MAZ to MAZ Connectors
Created by finding shortest distance paths over an all-streets network Connects all MAZs within 15 mi
Used to represent walk mode distance and time
MAZ to TAP Connectors
Created by finding shortest distance paths over an all-streets network Connects each MAZ to all TAPs within 10 mi
Used to represent transit walk access and walk egress distance and time
TAZ to TAP Connectors
Connects each TAZ to all TAPs within the TAP maximum drive distance bull Bus TAPs ndash 4 miles bull Rail TAPs ndash 15 miles
Used to represent transit drive access and egress distance and time
ldquoOn the Flyrdquo Path Building
bull No actual links created on the network bull Connectivity is expressed in table format
ldquoOn the Flyrdquo Path Building
bull Once the access and walk connectors are created the mode choice model builds complete paths MAZ to MAZ transit paths
bull Local-only paths are built using the ldquolocalrdquo transit skim bull Express BRT Urban Rail and Commuter rail paths are all
built at the same time using the ldquopremiumrdquo transit skim bull For each MAZ to MAZ pair CT-RAMP keeps the shortest
generalized cost path for each available premium mode bull Even though only one ldquopremiumrdquo skim is built CT-RAMP
may find competing premium paths It may also find that the best path is a combination of two premium modes or a premium mode and local bus
Tour Mode Choice Model
Choice
Auto
Drive alone
GP(1)
Pay(2)
Shared ride 2
GP(3)
HOV(4)
Pay(5)
Shared ride 3+
GP(6)
HOV(7)
Pay(8)
Non-motorized
Walk(9)
Bike(10)
Transit
Walk access
Local bus(11)
Express bus(12)
BRT(13)
Urban rail(14)
Commuter rail(15)
PNR access
Local bus(16)
Express bus(17)
BRT(18)
Urban rail(19)
Commuter rail(20)
KNR access
Local bus(21)
Express bus(22)
BRT(23)
Urban rail(24)
Commuter rail(25)
School Bus(26)
Trip Mode Choice Model
bull Same nesting structure as the tour mode choice but conditional on the tour mode
bull Some trip modes may be unavailable depending on the tour mode
DA SR2 SR3+ Walk Wlk-Trn PNR-Trn KNR-Trn
DA Must - - - - - -
SR2 Can Can - Can - - -
SR3+ Can Can Can Can - - -
Walk - - - Must - - -
Wlk-Trn - Can Can Can Can - -
PNR-Trn Can Can Can Can Can Can
KNR-Trn - Can Can Can Can - Can
Trip Switching Rules Simplified
Transit Trip Reporting
bull In SERPM7 the transit boarding and alighting location can be reported in two ways ndash Trip list files (ABM output) -- Boarding TAP Alighting TAP
ndash Transit assignment (Cube output) ndash Route nodes
bull Each type of reporting has its strengths ndash Trip list file allows building detailed transit trip patterns for
population cohorts and time periods
bull Mode split reports
bull Transit trip distance frequency distributions access distance TLFDs
bull Mode to mode transfers
ndash Note ABM reports only the first boarding TAP and the last alighting TAP regardless of mode
ndash Cube output gives aggregate link volumes station to station boardings etc
User Benefit Files
bull SERPM7 can produce FTA User Benefit files for input to SUMMIT
bull User benefits remain a useful analysis tool bull Steps to produce user benefit files require some manual
intervention ndash see User Guide
SERPM ABM Reports
bull Stores ABM inputs and outputs in a relational database to generate some standard model reports
bull Consistent reporting framework to be used for analysis across model runs
bull SERPM7 user community can easily share the scripts that create the reports
bull Reports take the form of Excel workbooks bull Foundation for future development of a visualization
dashboard
Reporting Database Components
Reporting Database Components
bull Reporting ETL (extract transform and load) program ndash Loads all Cube and CT-RAMP Java model outputs into the database
ndash Written in Cube scripts and Java
bull Database ndash Stores all data used in reporting including select network skims
household person tour and trip data zonal data etc
ndash Implemented with SQL Server
bull Report scripts to generate reports ndash Written in T-SQL
bull Report packaging program ndash Generates Excel workbooks with one report per worksheet
ndash Written in Java
Reporting Database Components
bull Run time required to build database and generate reports varies with sample size and type of report ndash Several hours required to build the database for a 100 sample
ndash ~ 30 minutes to produce reports for a 10 sample
bull Report step is optional not part of a standard model run bull Report production is transparent to the user
bull hellip but users can contribute reports bull hellip and choose which reports to build at any one time
Running SERPM ABM Reports
bull Report queries reside in ctrampreports_sql time_spent_travelingsql Total weekday travel time by person type
and income group
total_trips_typesql Trips by trip mode person type county of residence and tour purpose
total_tours_typesql Tours by trip mode person type county of residence and tour purpose
tours_districtssql Tours by tour purpose and tour origin and destination districts
transit_access_time+distsql Drive to transit trip list with many trip details
hellip
Running SERPM ABM Reports
bull List of reports to run is specified in properties file ndash ctrampserpm_reportsproperties
sqlscriptsdirectory = Cserpm7ctrampreports_sql sqlscriptsschemakey = SCHEMA sqlscripts=cleanupsqltransit_access_time+distsql worksheettables=temptransittrips worksheetnames=TransitTrips workbookname = Cserpm7ctrampreports_sqlSERPM_REPORTXLS databaseschema = 2010R databaseipaddress = w-ampdx-d-sag10 databaseinstance = databaseport = 1433 databasename=SERPMABM databaseusername=serpm databasepassword=s3rpm
Adding Reports
bull Step 1 --Write report query ndash T-SQL
ndash User Guide includes a database data dictionary
bull Step 2 ndash Add query to ctrampreports_sql ndash Each query is contained in a single text file
ndash Drop file in reports folder
bull Step 3 ndash Add the query to the properties file sqlquery = Query file name
Worksheettables = Query output
Worksheetnames = Name for the report worksheet
Sample SERPM ABM Reports
bull Exhibit ctrampreports_sqlserpm_reportsxls
More information Shi-Chiang Li | shi-chianglidotstateflus |954 777 4655 Rosella Picado | picadopbworldcom | 206 382 5227 Ken Kaltenbach |kkaltenbachcorradinocom |502 587 7221

Developing a New Synthetic Population
bull Exhibit ndash SERPM7 2010 TAZ control file
Example ndash Minto West Palm Beach Co
Example ndash Minto West
bull Mixed-use development in a agricultural area adjacent to an existing housing development
bull Information available from proposedapproved plans ndash Single-family dwelling units ndash 5050
ndash Multi-family dwelling units ndash 1040
ndash Total population ndash 14 535 persons
ndash Spatial location of dwelling units by type
bull Other PopSyn required data not available from plans (income distribution age distribution etc) ndash Estimateassert it based on similar existing developments
surrounding neighborhood
Example ndash Minto West
bull Adding householdspersons to a TAZ
bull Adding TAZs or MAZs to SERPM7 should be a rare occurrence ndash Households are ultimately allocated to MAZs and therersquos already
12000 of them
ndash Households are represented individually so the zone attributes are derived from them
Trip-Based Model Modify the input zonal data file
Activity-Based Model Modify the population synthesis control file
Running PopSynII
bull Step 2 ndash Modify the PopSyn settings file for this run ndash Update TAZ and MAZ control filenames in runAll_popsynbat
REM BATCH FILE TO SETUP POPSYN RUN RUN POPSYNII AND OUTPUT CSV FILES REM SETUP REM PLEASE SET PATH NAMES FOR WORKING FOLDER AND CSV FILE LOCATIONS SET SERVERNAME=W-AMSTL-D-00052SQLEXPRESS SET DATABASENAME=popSyn SET ARCPATH=Cpopsyn SET CSVPATH_CONTROLS=Cpopsyninputscontrolscsv SET CSVPATH_MAZ=Cpopsyninputs2010_MAZ_Data_20120207csv SET CSVPATH_TAZ=Cpopsyninputs2010_TAZ_Data_20120207csv REM MAIN SCRIPT REM MAKE FILENAMES TABLE REM sqlcmd -S SERVER NAME -E -i INPUT FILE PATH (SCRIPT) -o OUTPUT LOG REM -E means to use Windows authentication for the user that is running the batch file SQLCMD -S SERVERNAME -d DATABASENAME -E -Q IF OBJECT_ID(dbocsv_filenames) IS NOT NULL DROP TABLE csv_filenames -o ARCPATHResultLogtxt
hellip hellip
Running PopSynII
bull Other PopSyn settings ndash rarely used in a production run ndash Change the control attributes
ndash Change the priority of control attributes
Running PopSynII
bull Step 3 ndash Run PopSynII -- runAll_popsynbat
Running PopSynII
bull Step 4 ndash Review Output amp Check Fit to Controls
Output File Description
hhFilecsv List of households
personFilecsv List of persons
ZoneResultscsv Comparisons of synthetized households to controlled and uncontrolled attributes
BalanceDetailscsv
ValidationStatscsv
ValidationStatsByPumacsv
Reviewing PopSyn Output
bull Zone_Resultscsv bull Comparison of synthesized totals to target totals for each
TAZ and controlled attribute
TOTAL_HOUSEHOLDS
ZONE TARGET SYNTHESIZED DIFFERENCE PCTDIFF
1 715 715 0 0
2 811 811 0 0
3 878 878 0 0
4 826 826 0 0
5 1181 1181 0 0
6 212 212 0 0
7 459 459 0 0
8 253 253 0 0
Reviewing PopSyn Output
bull Balance_Detailscsv bull Same output as Zone_Results different format
Zone Control ID ControlCat Target PUMSVal ConStat
1989 109 TOTAL_HOUSEHOLDS 1508 1508 yes
1989 249 INCOME_25K 273 271 no
1989 19 HHSIZE_4PLUS 467 467 yes
1989 160 FEMALE 2196 2108 no
1989 55 INCOME_100K 258 257 yes
1989 67 MULTI_UNIT 423 407 no
1989 31 WORKERS_3PLUS 164 166 no
Reviewing PopSyn Output
bull Validation_Statscsv ndash Comparison of synthesized attributes to input Census data (5 PUMS)
ndash Includes uncontrolled attributes
Description popSynSum censusSum meanDiff stdDev minDiff maxDiff Universe 1 number of households 2085375 1964881 17 61 -97 331
family 67 65 3 17 -26 48
non family 33 35 0 34 -58 111
size 1 27 28 0 36 -59 111
size 2 31 32 -3 14 -30 30
size 3 17 17 1 22 -37 53
size 4 25 23 18 50 -46 160
Reviewing PopSyn Output
bull Validation_StatsByPumacsv ndash Same as validation_stats but for each PUMA
bull Note that synthesized population may differ from 5 Census population by design
Application 3 ndash Highway Project
Highway Project
Example Projects ndashToll road extension ndashReversible lanes ndashManaged lanes
Overview
How to use SERPM7 to perform a model run and do some standard analysis ndash Option 1 -- Code the project directly on the geodatabase
bull Roadway links
bull Node links
bull Turn penalties
bull [assume no change to transit]
ndash Option 2 --Code the project on net files and then build the geodatabase
bull Use flowchart script to build the geodatabase
ndash Coding is very similar to earlier versions of SERPM
bull Facility types are the same
SERPM Facility Types (not new)
Editing the Highway Network
bull SERPM 7 requires a geodatabase bull Editing can be done either to a net file or directly on the
geodatabase bull The user can use utilities in the model flowchart to write a
net file from the geodatabase edit the net and then write it to the geodatabase
bull The geodatabase must exist to run the model
Editing in the Geodatabase
bull Simplest and most direct method bull Requires an understanding of the CubeArcGIS tools
Export geodatabase and edit as a net
bull Start Data Manager bull Open geodatabase (SERPM_NETSMDB) bull Double click on the network Input Hwy Net and specify an
output file (maybe ldquoeditnetrdquo) bull Open from Cube and edit as usual bull Use ldquoPrepare for Model Run and Trap Errorsrdquo (2) utilities to
write back to geodatabase ndash Reload geodatabase from Cube files ndash Cull and sort
ndash Write to geodatabase
Edit as a net
Export Edit in Cube
Change to point to edited network
Input Hwy Net
Toll Road Extension
bull Short Cut ndash copy an existing toll link bull No special NODE attributes bull Only new attribute is ISTOLL=1 for all links that could not be
used unless a toll were paid bull Toll Mainline FTC2=91 ISTOLL=1 DIRCODE=1 bull Plaza (gantry) ndash assume all will be electronic collection ndash TOLL=1 DIRCODE=1
ndash TOLLTYPE=3 CARTOLL=toll in dollars
ndash FTC2=95
ndash ISTOLL=1
ndash SVCSECONDS=001
ndash DELCODE=1 ACCELCODE=1 AVILANES=2
Toll Road Extension
Not much different from earlier versions of SERPM
Reversible Lanes
bull Control by the link attribute REVERSIBLE ndash REVERSIBLE=1 means AM operation only
ndash REVERSIBLE=2 means PM operation only
ndash I-595 example
Managed Lanes (typically Express)
bull HOT=1 ndash 98 (99 makes the link a dummy) bull FTC2 most likely=91 but other types permitted bull TOLL=0 ISTOLL=0 bull Tolls set by HOTTOLLdbf
HOT Lanes Tolls
bull Set as a function of the VC bull Updated in the travel time feedback loop bull Affects the TollFree split in mode choice bull Column HOT_x were x=HOT link attribute bull HOT_1 is the current 95 Express rate HOT_2 is a placeholder
Common Errors
bull Errors to watch out for ndash If network steps fail look for missing attributes
ndash Update transit routes as needed due to changes to underlying highway network
ndash Check for dangling links and unconnected zones
ndash Verify that all TAZs are connected to lsquofreersquo roads
bull Special procedures required for TAZs that have toll-only access must
include the attribute ISRCTOLLINK=1 (currently used for the
Rickenbacker Causeway)
ndash Some CT-RAMP errors caused by network coding errors may not be apparent until feedback loop 2 because in loop 1 CT-RAMP uses seed skims
bull Use small sample size when testing a new network
Was the Run Successful
bull Did the run converge ndash AM and PM travel time RMSE values reported to
OUTDIRfeedbacklogprn
ndash Run stops when RMSE is less than 01
ndash 2010 Scenario converges in 5 loops
bull What to do if it didnrsquot converge ndash Look for obvious errors
ndash Run more iterations (future year might require more)
bull Are the top-level results comparable to a similar run ndash Use HEVAL reports
ndash Examine screenlines (RMSE reports)
ndash Spot check link loads
Tools for Analysis
bull Analysis ndash perform standard highway project type analyses
bull Usual analysis similar to trip-based model ndash Total daily and period-specific roadway volumes and speeds by
vehicle class
ndash Vehicle trip OD matrices
bull Standard FSUTMS HEVAL and RMSE reports are still available ndash Day and period assignments
ndash By County
ndash Truck assignment
Tools for Analysis
bull Potential for customized assignment classes to address
specific project questions ndash Does the manage lane serve primarily high income users
bull Stratify vehicle classes by lowhigh income to understand facility
usage by income level
bull Stratify vehicle classes by disadvantaged population cohorts
bull Trip and person tabulations built from ABM output ndash Trip mode shares for many different population cohorts subareas
ndash For example toll vs non-toll shares by value of time or fine-graded income levels
ndash Many other possibilities
Application 4 ndash Mobility Project
Mobility Project ndash SUNPASS Market Share
bull Persons in households that own a SUNPASS transponder respond differently to managed lane and toll road policies ndash Pay lower tolls than cash users
ndash Have access to I-95 managed lanes
bull Policy questions ndash How does projected toll traffic and revenue vary with the SUNPASS
penetration rate and toll discount
ndash How will SUNPASS penetration rate vary as more managed lane facilities are built in the region
Mobility Project ndash SUNPASS Market Share
bull Question 1 -- How does projected toll traffic and revenue vary with the SUNPASS penetration rate and toll discount
bull Procedure ndash Step1 ndash Assume a SUNPASS market share by modifying the toll
transponder model
ndash Step 2 ndash Run SERPM7 to produce traffic volumes
ndash Step 3 ndash Estimate toll traffic revenue
Modifying the Toll Transponder Ownership Model
bull Model specification is contained in TransponderOwnershipxls and can be edited with Microsoft Excel
Utility Variable Coefficient
Expected time savings up to 644 min 00631
Distance less than 5 miles -00304
Distance between 5 and 10 miles -00648
Distance 10 miles or more -00648
Constant 04877
Modifying the Toll Transponder Ownership Model
Utility Variable Coefficient
Expected time savings up to 644 min 00631
Distance less than 5 miles -00304
Distance between 5 and 10 miles -00648
Distance 10 miles or more -00648
Constant 04877
Increasing the constant will increase the number of households equipped with transponders
TransponderOwnershipxls
Modifying the Toll Transponder Model
bull Increase the constant by how much ndash Process is akin to model calibration
ndash Several runs of the transponder model required to estimate the constant that yields the desired market share
ndash 2010 market share is approximately 65
ndash Use a small sample (5 or 10) to save run-time while establishing the right constant
Modifying the Toll Transponder Model
bull Variation ndash Add terms to the model so that certain types of households are more
likely to exhibit a SUNPASS market share increase
bull Highlow income households
bull Multi-car households
bull Miami-Dade households
Modifying the Toll Transponder Model
bull Exhibit TransponderOwnershipxls
Mobility Project ndash SUNPASS Market Share
bull Question 2 -- How will SUNPASS penetration rate vary as more managed lane facilities are built in the region
bull Procedure ndash Step 1 ndash Code the manage lane facilities
ndash Step 2 ndash Run SERPM7 to forecast transponder ownership
ndash Step 3 ndash Analyze the forecast household data for changes in the profile of households equipped with transponders
Application 5 ndash Land Use Project
Land Use Project
bull Transportation projects comprise not only network scenarios but also land use scenarios
bull Land use scenarios can be ndash Very large scale (substantial changes to housing and employment
estimates throughout the region) or
ndash Small scale (localized changes for example for a traffic impact study)
bull For both large scale and small scale land use updates the
general procedure for updating the input data and running the model is the same
Land Use Project
bull The land use data in SERPM7 consists of ndash Synthetic population and derived input files
ndash Employment data
ndash School enrollment data
ndash Parking costs and parking spaces
ndash Regional shopping mall special generators
ndash Beach special generators
ndash Hotel and motel room data
Land Use Project
bull The land use data reside in different input files
Data Item Input File
Synthetic Population hhFilecsv personFilecsv ctramppopsynTAZDatacsv ctramppopsynMAZDatacsv
Employment School Enrollment Parking Supply Data Special Generators Hotel and Motel Rooms
inputsIN-2010Rmaz_datacsv
Land Use Project
bull As demonstrated earlier SERPM 7 requires significantly more comprehensive socio-economic inputs as compared to previous versions ndash Greater spatial detail
ndash More categoriestypes of land uses
bull These inputs require additional preparation when
performing land use model runs
Land Use Project
Data Required and examples bull Population
bull Age distribution of the population expected to live in the
development
bull Income profile
bull Type of dwelling unit (single-family vs multi-family)
ndash The input data need to be internally consistent (distribution of households by presence of children needs to be consistent with population age distribution for example)
Land Use Project
Data Required bull Employment classification ndash Previous models had three
employment classifications
ndash In SERPM 7 there are 16 employment categories to better differentiate type of land use and improve the relationship between land use and activity purpose
Land Use Project
Data Required bull School enrollment ndash note that it differentiates by grade level
(K-8 high-school collegepost-secondary) ndash Donrsquot forget to include school faculty and staff in employment
Land Use Project
Data Required bull Parking supply and
parking costs ndash Parking spaces may
reflect use restrictions
bull Monthly
bull Daily
bull Hourly
ndash Parking costs consistent with type of use
Land Use Project
bull Park Area 1 (pink) ndash May park in MAZ other
than destination MAZ
ndash Parking cost applies
bull Park Area 2 (gree) ndash Parks at destination MAZ
ndash Parking cost applies
Land Use Project
Data Required bull Visitor Model ndash Number of hotel and motel rooms
bull Special Generators ndash Regional shopping malls
ndash Beach recreation areas
Land Use Project
The Gardens Mall Aventura Mall
Boynton Mall Dolphin Mall
Delray Community Mall Dadeland Mall
Towncenter Mall The Falls Shopping Center
Wellington Greens Mall Cutler Ridge Mall
Coral Square Mall Bal Harbour Shops
Pompano Citi Centre CocoWalk
Sawgrass Mills Mall The Mall at 163rd Street
Broward Mall Mall of the Americas
Galleria Mall Mary Brickell Village
Pembroke Lakes Mall Miami International Mall
Lakes Mall Miracle Marketplace
Oakwood Plaza Village of Merrick Park
The Promenade at Coconut Creek Westland Mall
Regional Shopping Mall Special Generators
Land Use Project
Deerfield Beach
Pompano Beach
Fort Lauderdale Beach
Fort Lauderdale Beach
Hollywood Beach
South Beach
Haulover Beach
Crandon Park
Dania Beach
Bill Baggs State Park
Beach Special Generators
Land Use Project
Sample Problem
bull MINTO West Example - a mixed residentialcommercial development ndash 6500 singlemulti-family residential units in multiple TAZs
ndash 14 million square feet of non-residential space
ndash 150 room hotel
ndash 3000 student college campus
Land Use Project
MINTO WEST
Land Use Project
TAZsMAZs representing MINTO West Development
Land Use Project
Need to translate population household and employment information from developer into model input data ndash As discussed in the Population Synthesis presentation population and
household attribute estimates can be taken from other known nearby neighborhoods
bull In this sample problem first start by allocating percentages of total
households into individual MAZs within the development area
bull Keep in mind household density when estimating the number of
households in each MAZ
Land Use Project
bull In this sample employment can be assumed to include bull Retail
bull RestaurantsBars
bull Offices
bull Health services
bull Hotelmotel employment and
bull Educational employment
ndash As with households yoursquoll need to apportion the employment areas to individual MAZs while keeping in mind the types of employment expected in those locations
Land Use Project
bull Employment data is usually estimated by converting floor space available to individual types of employment through conversion factors
bull ie ndash (3000 sqft office space)(20 sqft per office employee) =
150 office employees
Land Use Project
bull Once population household and employment figures are estimated they are entered into the appropriate model input file
bull Population ndash TAZ synthetic population control file
bull Household ndash TAZ synthetic population control file
bull Employment School Parking and Special Gen ndash maz_datacsv
bull Ensure that population household and employment figures
are the same in each file
bull Prior to performing model run PopSyn must be run and user must copy output files to SERPM7 input folders
Application 6 ndashTransit Project
Transit Project ndash MetroRail North Corridor
SERPM Transit Modes
Transit Mode Tour and Trip
Mode TAP Transit Skim Mode
Tri-Rail Commuter Rail Premium
Metrorail Urban Rail Premium
I-95 Inter-County Express I-95X I-95E
Express Bus Premium
Busway BRT Premium
MDT Express Express Bus Premium
Metromover Local Bus Local Bus
MDT Local BCT Local
Palm Tran Local Local Bus Local Bus
Breeze Local Bus Local Bus
Tri-Rail Shuttles Local Bus Local Bus
SERPM Transit Modes
Transit Mode Tour and Trip
Mode TAP Transit Skim
Mode
Mode coded on the route ldquocardsrdquo
Used to specify boarding and transfer penalties for transit
path building
(most disaggregate)
Line-haul choices in the tour and trip mode choice
models
Used to create sets of TAP to TAP levels of service
(most aggregate)
Similar to SERPM 67 SERPM 7 ABM
SERPM Transit Modes S67 Mode Local (L) S7
Mode Mode Name Operator amp Name UserA4 Name Prem (P) MODE
15 Tri-Rail 11 Tri-Rail 15 Commuter P 111
14 Metrorail 25 Metrorail 14 Urban Rail P 121
X Regional LRT Regional LRT 14 LRT P 131
16 Inter-County Express Bus 33 I-95 Inter-County Express 16 Express P 151
12 Exclusive ROW Cir-Reg 13 Exclusive ROW Cir-Reg 12 Mover L 181
11 TrolleysShuttles-Reg 12 Tri-Rail Shuttles 11 Local L 191
11 TrolleysShuttles-Reg 12 Tri-Rail Shuttles 33 Local L 192
X LRT- MDT 25 MDT LRT 14 LRT P 231
16 Buses (localexpress) - MDT 27 MDT Busway Flyers 27 BRT P 241
23 Buses (localexpress) - MDT 27 MDT MAXKATBusway Local 27 BRT P 242
24 BRT - MDT 28 MDT BRTLRT 28 BRT P 243
23 Buses (localexpress) - MDT 22 MDT Express 24 Express P 251
16 Buses (localexpress) - MDT 24 MDT I-95 Exp 26 Express P 252
16 Inter-County Express Bus 24 I-95 Inter-County Express 16 Express P 253
22 Exclusive ROW Cir-MDT 26 Metromover 22 Mover L 281
21 TrolleysShuttles-MDT 21 MDT TrolleysShuttles 21 Local L 291
23 Buses (localexpress) - MDT 21 MDT Local 23 Local L 292
23 Buses (localexpress) - MDT 23 MDT Shuttle 25 Local L 293
X LRT - BCT 35 BCT LRT 37 LRT P 331
34 BCT Rapid Bus BRT 34 BCT Rapid Bus 36 BRT P 341
34 BCT Fixed-guideway BRT 35 BCT BRT 37 BRT P 342
33 Buses (localexpress) - BCT 32 BCT Breeze 34 Express P 351
33 Buses (localexpress) - BCT 33 BCT Express 35 Express P 352
32 Exclusive ROW Cir-BCT 31 BCT Exclusive ROW Cir 32 Mover L 381
31 TrolleysShuttles-BCT 31 BCT TrolleysShuttles 31 Local L 393
33 Buses (localexpress) - BCT 31 BCT Local 27 Local L 391
33 Buses (localexpress) - BCT 31 BCT Local 33 Local L 392
X LRT - Palm Tran 43 Palm Tran LRT 44 LRT P 431
44 BRT - Palm Tran 43 Palm Tran BRT 44 BRT P 441
43 Buses (localexpress) - Ptran 42 Palm Tran Exp 44 Express P 451
42 Exclusive ROW Cir-PTran 41 Palm Tran Exclusive ROW Cir 42 Mover L 481
41 TrolleysShuttles-Ptran 41 Palm Tran TrolleysShuttles 41 Local L 491
43 Buses (localexpress) - Ptran 41 Palm Tran Local 43 Local L 492
Modes Not in the 2010 Network
SERPM7 Transit Network Building
bull Typically bus routes are coded on top of existing highway links
bull SERPM7 reserves some facility type codes for transit-only use helpful to more accurately represent route ndash Caution -- make sure network integrity is preserved once transit only
links are removed
bull Rail routes require coding first fixed-guideway links
SERPM7 Transit Network Building
bull Route Attributes -- User Coded ndash Name
ndash Long Name
ndash Mode
ndash Operator
ndash Headway[1] ndash AM Peak
ndash Headway[2] ndash Midday
ndash Headway[3] ndash PM Peak
ndash UserA4 (stop dwell time)
SERPM7 Transit Network Building
bull PNR Node Attributes ndash User Coded ndash Parking Spaces
ndash Parking Cost AM
ndash Parking Cost MD
ndash Terminal Time PNR
ndash Terminal Time KNR
bull At this time parking spaces is used only to identify park-n-ride locations (parking spaces gt 0)
SERPM7 Transit Network Building
bull Transit Access Points -- Created by Cube for the ABM ndash One TAP for each stop on premium routes
bull Tri-Rail Metrorail Express Bus BRT
ndash One TAP for each Local Bus park-n-ride node
ndash Synthesized TAPs to represent access to local bus stops
bull Transit Access Point Attributes ndash TAP Mode
ndash Inherit PNR node data
Sample Highway Network with TAPs
TAPs become part of the highway network and replace the TAZ centroids when building transit skims
Transit Access Points and ldquoon the flyrdquo Path Building
bull Transit skims are built TAP to TAP
Matrix origins and destinations are TAPS
Transit Access Points and ldquoon the flyrdquo Path Building
Trip Origins and
Destinations
MAZ to MAZ
Auto Skims
TAZ to TAZ
Transit Skims
TAP to TAP
The three spatial systems are put together by the mode choice model
ldquoOn the Flyrdquo Path Building
bull TAZs TAPs and MAZs are linked via drive and access connectors prior to running CT-RAMP
rmdir OUTDIRABMTEMP S Q rmdir DATADIRABMTEMP S Q xcopy OUTDIR OUTDIRABMTEMP E I Y xcopy DATADIR DATADIRABMTEMP E I Y if(fbi=1) need to run only the first time through - kdk CUBEctramprunCreateAccessFilescmd endif mkdir logFiles taskkill im javaexe F start CUBEctramprunHhMgrcmd JDK64 HOST_IP start CUBEctramprunMtxMgrcmd HOST_IP JDK64 rem start CUBEctrampconfigrunDrivercmd copy CUBEctrampserpm_abmproperties serpm_abmproperties Y ping -n 11 127001 gt nul CUBEctramprunSERPMAbmcmd SAMPLERATE VSAMPLERATE JDK64 CUBEctramprunCreateDemandMatricescmd SAMPLERATE VSAMPLERATE JDK64 taskkill im javaexe F rmdir OUTDIRctramp S Q rmdir DATADIRctramp S Q xcopy OUTDIRABMTEMPctramp OUTDIRctramp E I Y xcopy DATADIRABMTEMPctramp DATADIRctramp E I Y
ldquoOn the Flyrdquo Path Building
MAZ to MAZ Connectors
Created by finding shortest distance paths over an all-streets network Connects all MAZs within 15 mi
Used to represent walk mode distance and time
MAZ to TAP Connectors
Created by finding shortest distance paths over an all-streets network Connects each MAZ to all TAPs within 10 mi
Used to represent transit walk access and walk egress distance and time
TAZ to TAP Connectors
Connects each TAZ to all TAPs within the TAP maximum drive distance bull Bus TAPs ndash 4 miles bull Rail TAPs ndash 15 miles
Used to represent transit drive access and egress distance and time
ldquoOn the Flyrdquo Path Building
bull No actual links created on the network bull Connectivity is expressed in table format
ldquoOn the Flyrdquo Path Building
bull Once the access and walk connectors are created the mode choice model builds complete paths MAZ to MAZ transit paths
bull Local-only paths are built using the ldquolocalrdquo transit skim bull Express BRT Urban Rail and Commuter rail paths are all
built at the same time using the ldquopremiumrdquo transit skim bull For each MAZ to MAZ pair CT-RAMP keeps the shortest
generalized cost path for each available premium mode bull Even though only one ldquopremiumrdquo skim is built CT-RAMP
may find competing premium paths It may also find that the best path is a combination of two premium modes or a premium mode and local bus
Tour Mode Choice Model
Choice
Auto
Drive alone
GP(1)
Pay(2)
Shared ride 2
GP(3)
HOV(4)
Pay(5)
Shared ride 3+
GP(6)
HOV(7)
Pay(8)
Non-motorized
Walk(9)
Bike(10)
Transit
Walk access
Local bus(11)
Express bus(12)
BRT(13)
Urban rail(14)
Commuter rail(15)
PNR access
Local bus(16)
Express bus(17)
BRT(18)
Urban rail(19)
Commuter rail(20)
KNR access
Local bus(21)
Express bus(22)
BRT(23)
Urban rail(24)
Commuter rail(25)
School Bus(26)
Trip Mode Choice Model
bull Same nesting structure as the tour mode choice but conditional on the tour mode
bull Some trip modes may be unavailable depending on the tour mode
DA SR2 SR3+ Walk Wlk-Trn PNR-Trn KNR-Trn
DA Must - - - - - -
SR2 Can Can - Can - - -
SR3+ Can Can Can Can - - -
Walk - - - Must - - -
Wlk-Trn - Can Can Can Can - -
PNR-Trn Can Can Can Can Can Can
KNR-Trn - Can Can Can Can - Can
Trip Switching Rules Simplified
Transit Trip Reporting
bull In SERPM7 the transit boarding and alighting location can be reported in two ways ndash Trip list files (ABM output) -- Boarding TAP Alighting TAP
ndash Transit assignment (Cube output) ndash Route nodes
bull Each type of reporting has its strengths ndash Trip list file allows building detailed transit trip patterns for
population cohorts and time periods
bull Mode split reports
bull Transit trip distance frequency distributions access distance TLFDs
bull Mode to mode transfers
ndash Note ABM reports only the first boarding TAP and the last alighting TAP regardless of mode
ndash Cube output gives aggregate link volumes station to station boardings etc
User Benefit Files
bull SERPM7 can produce FTA User Benefit files for input to SUMMIT
bull User benefits remain a useful analysis tool bull Steps to produce user benefit files require some manual
intervention ndash see User Guide
SERPM ABM Reports
bull Stores ABM inputs and outputs in a relational database to generate some standard model reports
bull Consistent reporting framework to be used for analysis across model runs
bull SERPM7 user community can easily share the scripts that create the reports
bull Reports take the form of Excel workbooks bull Foundation for future development of a visualization
dashboard
Reporting Database Components
Reporting Database Components
bull Reporting ETL (extract transform and load) program ndash Loads all Cube and CT-RAMP Java model outputs into the database
ndash Written in Cube scripts and Java
bull Database ndash Stores all data used in reporting including select network skims
household person tour and trip data zonal data etc
ndash Implemented with SQL Server
bull Report scripts to generate reports ndash Written in T-SQL
bull Report packaging program ndash Generates Excel workbooks with one report per worksheet
ndash Written in Java
Reporting Database Components
bull Run time required to build database and generate reports varies with sample size and type of report ndash Several hours required to build the database for a 100 sample
ndash ~ 30 minutes to produce reports for a 10 sample
bull Report step is optional not part of a standard model run bull Report production is transparent to the user
bull hellip but users can contribute reports bull hellip and choose which reports to build at any one time
Running SERPM ABM Reports
bull Report queries reside in ctrampreports_sql time_spent_travelingsql Total weekday travel time by person type
and income group
total_trips_typesql Trips by trip mode person type county of residence and tour purpose
total_tours_typesql Tours by trip mode person type county of residence and tour purpose
tours_districtssql Tours by tour purpose and tour origin and destination districts
transit_access_time+distsql Drive to transit trip list with many trip details
hellip
Running SERPM ABM Reports
bull List of reports to run is specified in properties file ndash ctrampserpm_reportsproperties
sqlscriptsdirectory = Cserpm7ctrampreports_sql sqlscriptsschemakey = SCHEMA sqlscripts=cleanupsqltransit_access_time+distsql worksheettables=temptransittrips worksheetnames=TransitTrips workbookname = Cserpm7ctrampreports_sqlSERPM_REPORTXLS databaseschema = 2010R databaseipaddress = w-ampdx-d-sag10 databaseinstance = databaseport = 1433 databasename=SERPMABM databaseusername=serpm databasepassword=s3rpm
Adding Reports
bull Step 1 --Write report query ndash T-SQL
ndash User Guide includes a database data dictionary
bull Step 2 ndash Add query to ctrampreports_sql ndash Each query is contained in a single text file
ndash Drop file in reports folder
bull Step 3 ndash Add the query to the properties file sqlquery = Query file name
Worksheettables = Query output
Worksheetnames = Name for the report worksheet
Sample SERPM ABM Reports
bull Exhibit ctrampreports_sqlserpm_reportsxls
More information Shi-Chiang Li | shi-chianglidotstateflus |954 777 4655 Rosella Picado | picadopbworldcom | 206 382 5227 Ken Kaltenbach |kkaltenbachcorradinocom |502 587 7221

Example ndash Minto West
bull Adding householdspersons to a TAZ
bull Adding TAZs or MAZs to SERPM7 should be a rare occurrence ndash Households are ultimately allocated to MAZs and therersquos already
12000 of them
ndash Households are represented individually so the zone attributes are derived from them
Trip-Based Model Modify the input zonal data file
Activity-Based Model Modify the population synthesis control file
Running PopSynII
bull Step 2 ndash Modify the PopSyn settings file for this run ndash Update TAZ and MAZ control filenames in runAll_popsynbat
REM BATCH FILE TO SETUP POPSYN RUN RUN POPSYNII AND OUTPUT CSV FILES REM SETUP REM PLEASE SET PATH NAMES FOR WORKING FOLDER AND CSV FILE LOCATIONS SET SERVERNAME=W-AMSTL-D-00052SQLEXPRESS SET DATABASENAME=popSyn SET ARCPATH=Cpopsyn SET CSVPATH_CONTROLS=Cpopsyninputscontrolscsv SET CSVPATH_MAZ=Cpopsyninputs2010_MAZ_Data_20120207csv SET CSVPATH_TAZ=Cpopsyninputs2010_TAZ_Data_20120207csv REM MAIN SCRIPT REM MAKE FILENAMES TABLE REM sqlcmd -S SERVER NAME -E -i INPUT FILE PATH (SCRIPT) -o OUTPUT LOG REM -E means to use Windows authentication for the user that is running the batch file SQLCMD -S SERVERNAME -d DATABASENAME -E -Q IF OBJECT_ID(dbocsv_filenames) IS NOT NULL DROP TABLE csv_filenames -o ARCPATHResultLogtxt
hellip hellip
Running PopSynII
bull Other PopSyn settings ndash rarely used in a production run ndash Change the control attributes
ndash Change the priority of control attributes
Running PopSynII
bull Step 3 ndash Run PopSynII -- runAll_popsynbat
Running PopSynII
bull Step 4 ndash Review Output amp Check Fit to Controls
Output File Description
hhFilecsv List of households
personFilecsv List of persons
ZoneResultscsv Comparisons of synthetized households to controlled and uncontrolled attributes
BalanceDetailscsv
ValidationStatscsv
ValidationStatsByPumacsv
Reviewing PopSyn Output
bull Zone_Resultscsv bull Comparison of synthesized totals to target totals for each
TAZ and controlled attribute
TOTAL_HOUSEHOLDS
ZONE TARGET SYNTHESIZED DIFFERENCE PCTDIFF
1 715 715 0 0
2 811 811 0 0
3 878 878 0 0
4 826 826 0 0
5 1181 1181 0 0
6 212 212 0 0
7 459 459 0 0
8 253 253 0 0
Reviewing PopSyn Output
bull Balance_Detailscsv bull Same output as Zone_Results different format
Zone Control ID ControlCat Target PUMSVal ConStat
1989 109 TOTAL_HOUSEHOLDS 1508 1508 yes
1989 249 INCOME_25K 273 271 no
1989 19 HHSIZE_4PLUS 467 467 yes
1989 160 FEMALE 2196 2108 no
1989 55 INCOME_100K 258 257 yes
1989 67 MULTI_UNIT 423 407 no
1989 31 WORKERS_3PLUS 164 166 no
Reviewing PopSyn Output
bull Validation_Statscsv ndash Comparison of synthesized attributes to input Census data (5 PUMS)
ndash Includes uncontrolled attributes
Description popSynSum censusSum meanDiff stdDev minDiff maxDiff Universe 1 number of households 2085375 1964881 17 61 -97 331
family 67 65 3 17 -26 48
non family 33 35 0 34 -58 111
size 1 27 28 0 36 -59 111
size 2 31 32 -3 14 -30 30
size 3 17 17 1 22 -37 53
size 4 25 23 18 50 -46 160
Reviewing PopSyn Output
bull Validation_StatsByPumacsv ndash Same as validation_stats but for each PUMA
bull Note that synthesized population may differ from 5 Census population by design
Application 3 ndash Highway Project
Highway Project
Example Projects ndashToll road extension ndashReversible lanes ndashManaged lanes
Overview
How to use SERPM7 to perform a model run and do some standard analysis ndash Option 1 -- Code the project directly on the geodatabase
bull Roadway links
bull Node links
bull Turn penalties
bull [assume no change to transit]
ndash Option 2 --Code the project on net files and then build the geodatabase
bull Use flowchart script to build the geodatabase
ndash Coding is very similar to earlier versions of SERPM
bull Facility types are the same
SERPM Facility Types (not new)
Editing the Highway Network
bull SERPM 7 requires a geodatabase bull Editing can be done either to a net file or directly on the
geodatabase bull The user can use utilities in the model flowchart to write a
net file from the geodatabase edit the net and then write it to the geodatabase
bull The geodatabase must exist to run the model
Editing in the Geodatabase
bull Simplest and most direct method bull Requires an understanding of the CubeArcGIS tools
Export geodatabase and edit as a net
bull Start Data Manager bull Open geodatabase (SERPM_NETSMDB) bull Double click on the network Input Hwy Net and specify an
output file (maybe ldquoeditnetrdquo) bull Open from Cube and edit as usual bull Use ldquoPrepare for Model Run and Trap Errorsrdquo (2) utilities to
write back to geodatabase ndash Reload geodatabase from Cube files ndash Cull and sort
ndash Write to geodatabase
Edit as a net
Export Edit in Cube
Change to point to edited network
Input Hwy Net
Toll Road Extension
bull Short Cut ndash copy an existing toll link bull No special NODE attributes bull Only new attribute is ISTOLL=1 for all links that could not be
used unless a toll were paid bull Toll Mainline FTC2=91 ISTOLL=1 DIRCODE=1 bull Plaza (gantry) ndash assume all will be electronic collection ndash TOLL=1 DIRCODE=1
ndash TOLLTYPE=3 CARTOLL=toll in dollars
ndash FTC2=95
ndash ISTOLL=1
ndash SVCSECONDS=001
ndash DELCODE=1 ACCELCODE=1 AVILANES=2
Toll Road Extension
Not much different from earlier versions of SERPM
Reversible Lanes
bull Control by the link attribute REVERSIBLE ndash REVERSIBLE=1 means AM operation only
ndash REVERSIBLE=2 means PM operation only
ndash I-595 example
Managed Lanes (typically Express)
bull HOT=1 ndash 98 (99 makes the link a dummy) bull FTC2 most likely=91 but other types permitted bull TOLL=0 ISTOLL=0 bull Tolls set by HOTTOLLdbf
HOT Lanes Tolls
bull Set as a function of the VC bull Updated in the travel time feedback loop bull Affects the TollFree split in mode choice bull Column HOT_x were x=HOT link attribute bull HOT_1 is the current 95 Express rate HOT_2 is a placeholder
Common Errors
bull Errors to watch out for ndash If network steps fail look for missing attributes
ndash Update transit routes as needed due to changes to underlying highway network
ndash Check for dangling links and unconnected zones
ndash Verify that all TAZs are connected to lsquofreersquo roads
bull Special procedures required for TAZs that have toll-only access must
include the attribute ISRCTOLLINK=1 (currently used for the
Rickenbacker Causeway)
ndash Some CT-RAMP errors caused by network coding errors may not be apparent until feedback loop 2 because in loop 1 CT-RAMP uses seed skims
bull Use small sample size when testing a new network
Was the Run Successful
bull Did the run converge ndash AM and PM travel time RMSE values reported to
OUTDIRfeedbacklogprn
ndash Run stops when RMSE is less than 01
ndash 2010 Scenario converges in 5 loops
bull What to do if it didnrsquot converge ndash Look for obvious errors
ndash Run more iterations (future year might require more)
bull Are the top-level results comparable to a similar run ndash Use HEVAL reports
ndash Examine screenlines (RMSE reports)
ndash Spot check link loads
Tools for Analysis
bull Analysis ndash perform standard highway project type analyses
bull Usual analysis similar to trip-based model ndash Total daily and period-specific roadway volumes and speeds by
vehicle class
ndash Vehicle trip OD matrices
bull Standard FSUTMS HEVAL and RMSE reports are still available ndash Day and period assignments
ndash By County
ndash Truck assignment
Tools for Analysis
bull Potential for customized assignment classes to address
specific project questions ndash Does the manage lane serve primarily high income users
bull Stratify vehicle classes by lowhigh income to understand facility
usage by income level
bull Stratify vehicle classes by disadvantaged population cohorts
bull Trip and person tabulations built from ABM output ndash Trip mode shares for many different population cohorts subareas
ndash For example toll vs non-toll shares by value of time or fine-graded income levels
ndash Many other possibilities
Application 4 ndash Mobility Project
Mobility Project ndash SUNPASS Market Share
bull Persons in households that own a SUNPASS transponder respond differently to managed lane and toll road policies ndash Pay lower tolls than cash users
ndash Have access to I-95 managed lanes
bull Policy questions ndash How does projected toll traffic and revenue vary with the SUNPASS
penetration rate and toll discount
ndash How will SUNPASS penetration rate vary as more managed lane facilities are built in the region
Mobility Project ndash SUNPASS Market Share
bull Question 1 -- How does projected toll traffic and revenue vary with the SUNPASS penetration rate and toll discount
bull Procedure ndash Step1 ndash Assume a SUNPASS market share by modifying the toll
transponder model
ndash Step 2 ndash Run SERPM7 to produce traffic volumes
ndash Step 3 ndash Estimate toll traffic revenue
Modifying the Toll Transponder Ownership Model
bull Model specification is contained in TransponderOwnershipxls and can be edited with Microsoft Excel
Utility Variable Coefficient
Expected time savings up to 644 min 00631
Distance less than 5 miles -00304
Distance between 5 and 10 miles -00648
Distance 10 miles or more -00648
Constant 04877
Modifying the Toll Transponder Ownership Model
Utility Variable Coefficient
Expected time savings up to 644 min 00631
Distance less than 5 miles -00304
Distance between 5 and 10 miles -00648
Distance 10 miles or more -00648
Constant 04877
Increasing the constant will increase the number of households equipped with transponders
TransponderOwnershipxls
Modifying the Toll Transponder Model
bull Increase the constant by how much ndash Process is akin to model calibration
ndash Several runs of the transponder model required to estimate the constant that yields the desired market share
ndash 2010 market share is approximately 65
ndash Use a small sample (5 or 10) to save run-time while establishing the right constant
Modifying the Toll Transponder Model
bull Variation ndash Add terms to the model so that certain types of households are more
likely to exhibit a SUNPASS market share increase
bull Highlow income households
bull Multi-car households
bull Miami-Dade households
Modifying the Toll Transponder Model
bull Exhibit TransponderOwnershipxls
Mobility Project ndash SUNPASS Market Share
bull Question 2 -- How will SUNPASS penetration rate vary as more managed lane facilities are built in the region
bull Procedure ndash Step 1 ndash Code the manage lane facilities
ndash Step 2 ndash Run SERPM7 to forecast transponder ownership
ndash Step 3 ndash Analyze the forecast household data for changes in the profile of households equipped with transponders
Application 5 ndash Land Use Project
Land Use Project
bull Transportation projects comprise not only network scenarios but also land use scenarios
bull Land use scenarios can be ndash Very large scale (substantial changes to housing and employment
estimates throughout the region) or
ndash Small scale (localized changes for example for a traffic impact study)
bull For both large scale and small scale land use updates the
general procedure for updating the input data and running the model is the same
Land Use Project
bull The land use data in SERPM7 consists of ndash Synthetic population and derived input files
ndash Employment data
ndash School enrollment data
ndash Parking costs and parking spaces
ndash Regional shopping mall special generators
ndash Beach special generators
ndash Hotel and motel room data
Land Use Project
bull The land use data reside in different input files
Data Item Input File
Synthetic Population hhFilecsv personFilecsv ctramppopsynTAZDatacsv ctramppopsynMAZDatacsv
Employment School Enrollment Parking Supply Data Special Generators Hotel and Motel Rooms
inputsIN-2010Rmaz_datacsv
Land Use Project
bull As demonstrated earlier SERPM 7 requires significantly more comprehensive socio-economic inputs as compared to previous versions ndash Greater spatial detail
ndash More categoriestypes of land uses
bull These inputs require additional preparation when
performing land use model runs
Land Use Project
Data Required and examples bull Population
bull Age distribution of the population expected to live in the
development
bull Income profile
bull Type of dwelling unit (single-family vs multi-family)
ndash The input data need to be internally consistent (distribution of households by presence of children needs to be consistent with population age distribution for example)
Land Use Project
Data Required bull Employment classification ndash Previous models had three
employment classifications
ndash In SERPM 7 there are 16 employment categories to better differentiate type of land use and improve the relationship between land use and activity purpose
Land Use Project
Data Required bull School enrollment ndash note that it differentiates by grade level
(K-8 high-school collegepost-secondary) ndash Donrsquot forget to include school faculty and staff in employment
Land Use Project
Data Required bull Parking supply and
parking costs ndash Parking spaces may
reflect use restrictions
bull Monthly
bull Daily
bull Hourly
ndash Parking costs consistent with type of use
Land Use Project
bull Park Area 1 (pink) ndash May park in MAZ other
than destination MAZ
ndash Parking cost applies
bull Park Area 2 (gree) ndash Parks at destination MAZ
ndash Parking cost applies
Land Use Project
Data Required bull Visitor Model ndash Number of hotel and motel rooms
bull Special Generators ndash Regional shopping malls
ndash Beach recreation areas
Land Use Project
The Gardens Mall Aventura Mall
Boynton Mall Dolphin Mall
Delray Community Mall Dadeland Mall
Towncenter Mall The Falls Shopping Center
Wellington Greens Mall Cutler Ridge Mall
Coral Square Mall Bal Harbour Shops
Pompano Citi Centre CocoWalk
Sawgrass Mills Mall The Mall at 163rd Street
Broward Mall Mall of the Americas
Galleria Mall Mary Brickell Village
Pembroke Lakes Mall Miami International Mall
Lakes Mall Miracle Marketplace
Oakwood Plaza Village of Merrick Park
The Promenade at Coconut Creek Westland Mall
Regional Shopping Mall Special Generators
Land Use Project
Deerfield Beach
Pompano Beach
Fort Lauderdale Beach
Fort Lauderdale Beach
Hollywood Beach
South Beach
Haulover Beach
Crandon Park
Dania Beach
Bill Baggs State Park
Beach Special Generators
Land Use Project
Sample Problem
bull MINTO West Example - a mixed residentialcommercial development ndash 6500 singlemulti-family residential units in multiple TAZs
ndash 14 million square feet of non-residential space
ndash 150 room hotel
ndash 3000 student college campus
Land Use Project
MINTO WEST
Land Use Project
TAZsMAZs representing MINTO West Development
Land Use Project
Need to translate population household and employment information from developer into model input data ndash As discussed in the Population Synthesis presentation population and
household attribute estimates can be taken from other known nearby neighborhoods
bull In this sample problem first start by allocating percentages of total
households into individual MAZs within the development area
bull Keep in mind household density when estimating the number of
households in each MAZ
Land Use Project
bull In this sample employment can be assumed to include bull Retail
bull RestaurantsBars
bull Offices
bull Health services
bull Hotelmotel employment and
bull Educational employment
ndash As with households yoursquoll need to apportion the employment areas to individual MAZs while keeping in mind the types of employment expected in those locations
Land Use Project
bull Employment data is usually estimated by converting floor space available to individual types of employment through conversion factors
bull ie ndash (3000 sqft office space)(20 sqft per office employee) =
150 office employees
Land Use Project
bull Once population household and employment figures are estimated they are entered into the appropriate model input file
bull Population ndash TAZ synthetic population control file
bull Household ndash TAZ synthetic population control file
bull Employment School Parking and Special Gen ndash maz_datacsv
bull Ensure that population household and employment figures
are the same in each file
bull Prior to performing model run PopSyn must be run and user must copy output files to SERPM7 input folders
Application 6 ndashTransit Project
Transit Project ndash MetroRail North Corridor
SERPM Transit Modes
Transit Mode Tour and Trip
Mode TAP Transit Skim Mode
Tri-Rail Commuter Rail Premium
Metrorail Urban Rail Premium
I-95 Inter-County Express I-95X I-95E
Express Bus Premium
Busway BRT Premium
MDT Express Express Bus Premium
Metromover Local Bus Local Bus
MDT Local BCT Local
Palm Tran Local Local Bus Local Bus
Breeze Local Bus Local Bus
Tri-Rail Shuttles Local Bus Local Bus
SERPM Transit Modes
Transit Mode Tour and Trip
Mode TAP Transit Skim
Mode
Mode coded on the route ldquocardsrdquo
Used to specify boarding and transfer penalties for transit
path building
(most disaggregate)
Line-haul choices in the tour and trip mode choice
models
Used to create sets of TAP to TAP levels of service
(most aggregate)
Similar to SERPM 67 SERPM 7 ABM
SERPM Transit Modes S67 Mode Local (L) S7
Mode Mode Name Operator amp Name UserA4 Name Prem (P) MODE
15 Tri-Rail 11 Tri-Rail 15 Commuter P 111
14 Metrorail 25 Metrorail 14 Urban Rail P 121
X Regional LRT Regional LRT 14 LRT P 131
16 Inter-County Express Bus 33 I-95 Inter-County Express 16 Express P 151
12 Exclusive ROW Cir-Reg 13 Exclusive ROW Cir-Reg 12 Mover L 181
11 TrolleysShuttles-Reg 12 Tri-Rail Shuttles 11 Local L 191
11 TrolleysShuttles-Reg 12 Tri-Rail Shuttles 33 Local L 192
X LRT- MDT 25 MDT LRT 14 LRT P 231
16 Buses (localexpress) - MDT 27 MDT Busway Flyers 27 BRT P 241
23 Buses (localexpress) - MDT 27 MDT MAXKATBusway Local 27 BRT P 242
24 BRT - MDT 28 MDT BRTLRT 28 BRT P 243
23 Buses (localexpress) - MDT 22 MDT Express 24 Express P 251
16 Buses (localexpress) - MDT 24 MDT I-95 Exp 26 Express P 252
16 Inter-County Express Bus 24 I-95 Inter-County Express 16 Express P 253
22 Exclusive ROW Cir-MDT 26 Metromover 22 Mover L 281
21 TrolleysShuttles-MDT 21 MDT TrolleysShuttles 21 Local L 291
23 Buses (localexpress) - MDT 21 MDT Local 23 Local L 292
23 Buses (localexpress) - MDT 23 MDT Shuttle 25 Local L 293
X LRT - BCT 35 BCT LRT 37 LRT P 331
34 BCT Rapid Bus BRT 34 BCT Rapid Bus 36 BRT P 341
34 BCT Fixed-guideway BRT 35 BCT BRT 37 BRT P 342
33 Buses (localexpress) - BCT 32 BCT Breeze 34 Express P 351
33 Buses (localexpress) - BCT 33 BCT Express 35 Express P 352
32 Exclusive ROW Cir-BCT 31 BCT Exclusive ROW Cir 32 Mover L 381
31 TrolleysShuttles-BCT 31 BCT TrolleysShuttles 31 Local L 393
33 Buses (localexpress) - BCT 31 BCT Local 27 Local L 391
33 Buses (localexpress) - BCT 31 BCT Local 33 Local L 392
X LRT - Palm Tran 43 Palm Tran LRT 44 LRT P 431
44 BRT - Palm Tran 43 Palm Tran BRT 44 BRT P 441
43 Buses (localexpress) - Ptran 42 Palm Tran Exp 44 Express P 451
42 Exclusive ROW Cir-PTran 41 Palm Tran Exclusive ROW Cir 42 Mover L 481
41 TrolleysShuttles-Ptran 41 Palm Tran TrolleysShuttles 41 Local L 491
43 Buses (localexpress) - Ptran 41 Palm Tran Local 43 Local L 492
Modes Not in the 2010 Network
SERPM7 Transit Network Building
bull Typically bus routes are coded on top of existing highway links
bull SERPM7 reserves some facility type codes for transit-only use helpful to more accurately represent route ndash Caution -- make sure network integrity is preserved once transit only
links are removed
bull Rail routes require coding first fixed-guideway links
SERPM7 Transit Network Building
bull Route Attributes -- User Coded ndash Name
ndash Long Name
ndash Mode
ndash Operator
ndash Headway[1] ndash AM Peak
ndash Headway[2] ndash Midday
ndash Headway[3] ndash PM Peak
ndash UserA4 (stop dwell time)
SERPM7 Transit Network Building
bull PNR Node Attributes ndash User Coded ndash Parking Spaces
ndash Parking Cost AM
ndash Parking Cost MD
ndash Terminal Time PNR
ndash Terminal Time KNR
bull At this time parking spaces is used only to identify park-n-ride locations (parking spaces gt 0)
SERPM7 Transit Network Building
bull Transit Access Points -- Created by Cube for the ABM ndash One TAP for each stop on premium routes
bull Tri-Rail Metrorail Express Bus BRT
ndash One TAP for each Local Bus park-n-ride node
ndash Synthesized TAPs to represent access to local bus stops
bull Transit Access Point Attributes ndash TAP Mode
ndash Inherit PNR node data
Sample Highway Network with TAPs
TAPs become part of the highway network and replace the TAZ centroids when building transit skims
Transit Access Points and ldquoon the flyrdquo Path Building
bull Transit skims are built TAP to TAP
Matrix origins and destinations are TAPS
Transit Access Points and ldquoon the flyrdquo Path Building
Trip Origins and
Destinations
MAZ to MAZ
Auto Skims
TAZ to TAZ
Transit Skims
TAP to TAP
The three spatial systems are put together by the mode choice model
ldquoOn the Flyrdquo Path Building
bull TAZs TAPs and MAZs are linked via drive and access connectors prior to running CT-RAMP
rmdir OUTDIRABMTEMP S Q rmdir DATADIRABMTEMP S Q xcopy OUTDIR OUTDIRABMTEMP E I Y xcopy DATADIR DATADIRABMTEMP E I Y if(fbi=1) need to run only the first time through - kdk CUBEctramprunCreateAccessFilescmd endif mkdir logFiles taskkill im javaexe F start CUBEctramprunHhMgrcmd JDK64 HOST_IP start CUBEctramprunMtxMgrcmd HOST_IP JDK64 rem start CUBEctrampconfigrunDrivercmd copy CUBEctrampserpm_abmproperties serpm_abmproperties Y ping -n 11 127001 gt nul CUBEctramprunSERPMAbmcmd SAMPLERATE VSAMPLERATE JDK64 CUBEctramprunCreateDemandMatricescmd SAMPLERATE VSAMPLERATE JDK64 taskkill im javaexe F rmdir OUTDIRctramp S Q rmdir DATADIRctramp S Q xcopy OUTDIRABMTEMPctramp OUTDIRctramp E I Y xcopy DATADIRABMTEMPctramp DATADIRctramp E I Y
ldquoOn the Flyrdquo Path Building
MAZ to MAZ Connectors
Created by finding shortest distance paths over an all-streets network Connects all MAZs within 15 mi
Used to represent walk mode distance and time
MAZ to TAP Connectors
Created by finding shortest distance paths over an all-streets network Connects each MAZ to all TAPs within 10 mi
Used to represent transit walk access and walk egress distance and time
TAZ to TAP Connectors
Connects each TAZ to all TAPs within the TAP maximum drive distance bull Bus TAPs ndash 4 miles bull Rail TAPs ndash 15 miles
Used to represent transit drive access and egress distance and time
ldquoOn the Flyrdquo Path Building
bull No actual links created on the network bull Connectivity is expressed in table format
ldquoOn the Flyrdquo Path Building
bull Once the access and walk connectors are created the mode choice model builds complete paths MAZ to MAZ transit paths
bull Local-only paths are built using the ldquolocalrdquo transit skim bull Express BRT Urban Rail and Commuter rail paths are all
built at the same time using the ldquopremiumrdquo transit skim bull For each MAZ to MAZ pair CT-RAMP keeps the shortest
generalized cost path for each available premium mode bull Even though only one ldquopremiumrdquo skim is built CT-RAMP
may find competing premium paths It may also find that the best path is a combination of two premium modes or a premium mode and local bus
Tour Mode Choice Model
Choice
Auto
Drive alone
GP(1)
Pay(2)
Shared ride 2
GP(3)
HOV(4)
Pay(5)
Shared ride 3+
GP(6)
HOV(7)
Pay(8)
Non-motorized
Walk(9)
Bike(10)
Transit
Walk access
Local bus(11)
Express bus(12)
BRT(13)
Urban rail(14)
Commuter rail(15)
PNR access
Local bus(16)
Express bus(17)
BRT(18)
Urban rail(19)
Commuter rail(20)
KNR access
Local bus(21)
Express bus(22)
BRT(23)
Urban rail(24)
Commuter rail(25)
School Bus(26)
Trip Mode Choice Model
bull Same nesting structure as the tour mode choice but conditional on the tour mode
bull Some trip modes may be unavailable depending on the tour mode
DA SR2 SR3+ Walk Wlk-Trn PNR-Trn KNR-Trn
DA Must - - - - - -
SR2 Can Can - Can - - -
SR3+ Can Can Can Can - - -
Walk - - - Must - - -
Wlk-Trn - Can Can Can Can - -
PNR-Trn Can Can Can Can Can Can
KNR-Trn - Can Can Can Can - Can
Trip Switching Rules Simplified
Transit Trip Reporting
bull In SERPM7 the transit boarding and alighting location can be reported in two ways ndash Trip list files (ABM output) -- Boarding TAP Alighting TAP
ndash Transit assignment (Cube output) ndash Route nodes
bull Each type of reporting has its strengths ndash Trip list file allows building detailed transit trip patterns for
population cohorts and time periods
bull Mode split reports
bull Transit trip distance frequency distributions access distance TLFDs
bull Mode to mode transfers
ndash Note ABM reports only the first boarding TAP and the last alighting TAP regardless of mode
ndash Cube output gives aggregate link volumes station to station boardings etc
User Benefit Files
bull SERPM7 can produce FTA User Benefit files for input to SUMMIT
bull User benefits remain a useful analysis tool bull Steps to produce user benefit files require some manual
intervention ndash see User Guide
SERPM ABM Reports
bull Stores ABM inputs and outputs in a relational database to generate some standard model reports
bull Consistent reporting framework to be used for analysis across model runs
bull SERPM7 user community can easily share the scripts that create the reports
bull Reports take the form of Excel workbooks bull Foundation for future development of a visualization
dashboard
Reporting Database Components
Reporting Database Components
bull Reporting ETL (extract transform and load) program ndash Loads all Cube and CT-RAMP Java model outputs into the database
ndash Written in Cube scripts and Java
bull Database ndash Stores all data used in reporting including select network skims
household person tour and trip data zonal data etc
ndash Implemented with SQL Server
bull Report scripts to generate reports ndash Written in T-SQL
bull Report packaging program ndash Generates Excel workbooks with one report per worksheet
ndash Written in Java
Reporting Database Components
bull Run time required to build database and generate reports varies with sample size and type of report ndash Several hours required to build the database for a 100 sample
ndash ~ 30 minutes to produce reports for a 10 sample
bull Report step is optional not part of a standard model run bull Report production is transparent to the user
bull hellip but users can contribute reports bull hellip and choose which reports to build at any one time
Running SERPM ABM Reports
bull Report queries reside in ctrampreports_sql time_spent_travelingsql Total weekday travel time by person type
and income group
total_trips_typesql Trips by trip mode person type county of residence and tour purpose
total_tours_typesql Tours by trip mode person type county of residence and tour purpose
tours_districtssql Tours by tour purpose and tour origin and destination districts
transit_access_time+distsql Drive to transit trip list with many trip details
hellip
Running SERPM ABM Reports
bull List of reports to run is specified in properties file ndash ctrampserpm_reportsproperties
sqlscriptsdirectory = Cserpm7ctrampreports_sql sqlscriptsschemakey = SCHEMA sqlscripts=cleanupsqltransit_access_time+distsql worksheettables=temptransittrips worksheetnames=TransitTrips workbookname = Cserpm7ctrampreports_sqlSERPM_REPORTXLS databaseschema = 2010R databaseipaddress = w-ampdx-d-sag10 databaseinstance = databaseport = 1433 databasename=SERPMABM databaseusername=serpm databasepassword=s3rpm
Adding Reports
bull Step 1 --Write report query ndash T-SQL
ndash User Guide includes a database data dictionary
bull Step 2 ndash Add query to ctrampreports_sql ndash Each query is contained in a single text file
ndash Drop file in reports folder
bull Step 3 ndash Add the query to the properties file sqlquery = Query file name
Worksheettables = Query output
Worksheetnames = Name for the report worksheet
Sample SERPM ABM Reports
bull Exhibit ctrampreports_sqlserpm_reportsxls
More information Shi-Chiang Li | shi-chianglidotstateflus |954 777 4655 Rosella Picado | picadopbworldcom | 206 382 5227 Ken Kaltenbach |kkaltenbachcorradinocom |502 587 7221

Running PopSynII
bull Step 4 ndash Review Output amp Check Fit to Controls
Output File Description
hhFilecsv List of households
personFilecsv List of persons
ZoneResultscsv Comparisons of synthetized households to controlled and uncontrolled attributes
BalanceDetailscsv
ValidationStatscsv
ValidationStatsByPumacsv
Reviewing PopSyn Output
bull Zone_Resultscsv bull Comparison of synthesized totals to target totals for each
TAZ and controlled attribute
TOTAL_HOUSEHOLDS
ZONE TARGET SYNTHESIZED DIFFERENCE PCTDIFF
1 715 715 0 0
2 811 811 0 0
3 878 878 0 0
4 826 826 0 0
5 1181 1181 0 0
6 212 212 0 0
7 459 459 0 0
8 253 253 0 0
Reviewing PopSyn Output
bull Balance_Detailscsv bull Same output as Zone_Results different format
Zone Control ID ControlCat Target PUMSVal ConStat
1989 109 TOTAL_HOUSEHOLDS 1508 1508 yes
1989 249 INCOME_25K 273 271 no
1989 19 HHSIZE_4PLUS 467 467 yes
1989 160 FEMALE 2196 2108 no
1989 55 INCOME_100K 258 257 yes
1989 67 MULTI_UNIT 423 407 no
1989 31 WORKERS_3PLUS 164 166 no
Reviewing PopSyn Output
bull Validation_Statscsv ndash Comparison of synthesized attributes to input Census data (5 PUMS)
ndash Includes uncontrolled attributes
Description popSynSum censusSum meanDiff stdDev minDiff maxDiff Universe 1 number of households 2085375 1964881 17 61 -97 331
family 67 65 3 17 -26 48
non family 33 35 0 34 -58 111
size 1 27 28 0 36 -59 111
size 2 31 32 -3 14 -30 30
size 3 17 17 1 22 -37 53
size 4 25 23 18 50 -46 160
Reviewing PopSyn Output
bull Validation_StatsByPumacsv ndash Same as validation_stats but for each PUMA
bull Note that synthesized population may differ from 5 Census population by design
Application 3 ndash Highway Project
Highway Project
Example Projects ndashToll road extension ndashReversible lanes ndashManaged lanes
Overview
How to use SERPM7 to perform a model run and do some standard analysis ndash Option 1 -- Code the project directly on the geodatabase
bull Roadway links
bull Node links
bull Turn penalties
bull [assume no change to transit]
ndash Option 2 --Code the project on net files and then build the geodatabase
bull Use flowchart script to build the geodatabase
ndash Coding is very similar to earlier versions of SERPM
bull Facility types are the same
SERPM Facility Types (not new)
Editing the Highway Network
bull SERPM 7 requires a geodatabase bull Editing can be done either to a net file or directly on the
geodatabase bull The user can use utilities in the model flowchart to write a
net file from the geodatabase edit the net and then write it to the geodatabase
bull The geodatabase must exist to run the model
Editing in the Geodatabase
bull Simplest and most direct method bull Requires an understanding of the CubeArcGIS tools
Export geodatabase and edit as a net
bull Start Data Manager bull Open geodatabase (SERPM_NETSMDB) bull Double click on the network Input Hwy Net and specify an
output file (maybe ldquoeditnetrdquo) bull Open from Cube and edit as usual bull Use ldquoPrepare for Model Run and Trap Errorsrdquo (2) utilities to
write back to geodatabase ndash Reload geodatabase from Cube files ndash Cull and sort
ndash Write to geodatabase
Edit as a net
Export Edit in Cube
Change to point to edited network
Input Hwy Net
Toll Road Extension
bull Short Cut ndash copy an existing toll link bull No special NODE attributes bull Only new attribute is ISTOLL=1 for all links that could not be
used unless a toll were paid bull Toll Mainline FTC2=91 ISTOLL=1 DIRCODE=1 bull Plaza (gantry) ndash assume all will be electronic collection ndash TOLL=1 DIRCODE=1
ndash TOLLTYPE=3 CARTOLL=toll in dollars
ndash FTC2=95
ndash ISTOLL=1
ndash SVCSECONDS=001
ndash DELCODE=1 ACCELCODE=1 AVILANES=2
Toll Road Extension
Not much different from earlier versions of SERPM
Reversible Lanes
bull Control by the link attribute REVERSIBLE ndash REVERSIBLE=1 means AM operation only
ndash REVERSIBLE=2 means PM operation only
ndash I-595 example
Managed Lanes (typically Express)
bull HOT=1 ndash 98 (99 makes the link a dummy) bull FTC2 most likely=91 but other types permitted bull TOLL=0 ISTOLL=0 bull Tolls set by HOTTOLLdbf
HOT Lanes Tolls
bull Set as a function of the VC bull Updated in the travel time feedback loop bull Affects the TollFree split in mode choice bull Column HOT_x were x=HOT link attribute bull HOT_1 is the current 95 Express rate HOT_2 is a placeholder
Common Errors
bull Errors to watch out for ndash If network steps fail look for missing attributes
ndash Update transit routes as needed due to changes to underlying highway network
ndash Check for dangling links and unconnected zones
ndash Verify that all TAZs are connected to lsquofreersquo roads
bull Special procedures required for TAZs that have toll-only access must
include the attribute ISRCTOLLINK=1 (currently used for the
Rickenbacker Causeway)
ndash Some CT-RAMP errors caused by network coding errors may not be apparent until feedback loop 2 because in loop 1 CT-RAMP uses seed skims
bull Use small sample size when testing a new network
Was the Run Successful
bull Did the run converge ndash AM and PM travel time RMSE values reported to
OUTDIRfeedbacklogprn
ndash Run stops when RMSE is less than 01
ndash 2010 Scenario converges in 5 loops
bull What to do if it didnrsquot converge ndash Look for obvious errors
ndash Run more iterations (future year might require more)
bull Are the top-level results comparable to a similar run ndash Use HEVAL reports
ndash Examine screenlines (RMSE reports)
ndash Spot check link loads
Tools for Analysis
bull Analysis ndash perform standard highway project type analyses
bull Usual analysis similar to trip-based model ndash Total daily and period-specific roadway volumes and speeds by
vehicle class
ndash Vehicle trip OD matrices
bull Standard FSUTMS HEVAL and RMSE reports are still available ndash Day and period assignments
ndash By County
ndash Truck assignment
Tools for Analysis
bull Potential for customized assignment classes to address
specific project questions ndash Does the manage lane serve primarily high income users
bull Stratify vehicle classes by lowhigh income to understand facility
usage by income level
bull Stratify vehicle classes by disadvantaged population cohorts
bull Trip and person tabulations built from ABM output ndash Trip mode shares for many different population cohorts subareas
ndash For example toll vs non-toll shares by value of time or fine-graded income levels
ndash Many other possibilities
Application 4 ndash Mobility Project
Mobility Project ndash SUNPASS Market Share
bull Persons in households that own a SUNPASS transponder respond differently to managed lane and toll road policies ndash Pay lower tolls than cash users
ndash Have access to I-95 managed lanes
bull Policy questions ndash How does projected toll traffic and revenue vary with the SUNPASS
penetration rate and toll discount
ndash How will SUNPASS penetration rate vary as more managed lane facilities are built in the region
Mobility Project ndash SUNPASS Market Share
bull Question 1 -- How does projected toll traffic and revenue vary with the SUNPASS penetration rate and toll discount
bull Procedure ndash Step1 ndash Assume a SUNPASS market share by modifying the toll
transponder model
ndash Step 2 ndash Run SERPM7 to produce traffic volumes
ndash Step 3 ndash Estimate toll traffic revenue
Modifying the Toll Transponder Ownership Model
bull Model specification is contained in TransponderOwnershipxls and can be edited with Microsoft Excel
Utility Variable Coefficient
Expected time savings up to 644 min 00631
Distance less than 5 miles -00304
Distance between 5 and 10 miles -00648
Distance 10 miles or more -00648
Constant 04877
Modifying the Toll Transponder Ownership Model
Utility Variable Coefficient
Expected time savings up to 644 min 00631
Distance less than 5 miles -00304
Distance between 5 and 10 miles -00648
Distance 10 miles or more -00648
Constant 04877
Increasing the constant will increase the number of households equipped with transponders
TransponderOwnershipxls
Modifying the Toll Transponder Model
bull Increase the constant by how much ndash Process is akin to model calibration
ndash Several runs of the transponder model required to estimate the constant that yields the desired market share
ndash 2010 market share is approximately 65
ndash Use a small sample (5 or 10) to save run-time while establishing the right constant
Modifying the Toll Transponder Model
bull Variation ndash Add terms to the model so that certain types of households are more
likely to exhibit a SUNPASS market share increase
bull Highlow income households
bull Multi-car households
bull Miami-Dade households
Modifying the Toll Transponder Model
bull Exhibit TransponderOwnershipxls
Mobility Project ndash SUNPASS Market Share
bull Question 2 -- How will SUNPASS penetration rate vary as more managed lane facilities are built in the region
bull Procedure ndash Step 1 ndash Code the manage lane facilities
ndash Step 2 ndash Run SERPM7 to forecast transponder ownership
ndash Step 3 ndash Analyze the forecast household data for changes in the profile of households equipped with transponders
Application 5 ndash Land Use Project
Land Use Project
bull Transportation projects comprise not only network scenarios but also land use scenarios
bull Land use scenarios can be ndash Very large scale (substantial changes to housing and employment
estimates throughout the region) or
ndash Small scale (localized changes for example for a traffic impact study)
bull For both large scale and small scale land use updates the
general procedure for updating the input data and running the model is the same
Land Use Project
bull The land use data in SERPM7 consists of ndash Synthetic population and derived input files
ndash Employment data
ndash School enrollment data
ndash Parking costs and parking spaces
ndash Regional shopping mall special generators
ndash Beach special generators
ndash Hotel and motel room data
Land Use Project
bull The land use data reside in different input files
Data Item Input File
Synthetic Population hhFilecsv personFilecsv ctramppopsynTAZDatacsv ctramppopsynMAZDatacsv
Employment School Enrollment Parking Supply Data Special Generators Hotel and Motel Rooms
inputsIN-2010Rmaz_datacsv
Land Use Project
bull As demonstrated earlier SERPM 7 requires significantly more comprehensive socio-economic inputs as compared to previous versions ndash Greater spatial detail
ndash More categoriestypes of land uses
bull These inputs require additional preparation when
performing land use model runs
Land Use Project
Data Required and examples bull Population
bull Age distribution of the population expected to live in the
development
bull Income profile
bull Type of dwelling unit (single-family vs multi-family)
ndash The input data need to be internally consistent (distribution of households by presence of children needs to be consistent with population age distribution for example)
Land Use Project
Data Required bull Employment classification ndash Previous models had three
employment classifications
ndash In SERPM 7 there are 16 employment categories to better differentiate type of land use and improve the relationship between land use and activity purpose
Land Use Project
Data Required bull School enrollment ndash note that it differentiates by grade level
(K-8 high-school collegepost-secondary) ndash Donrsquot forget to include school faculty and staff in employment
Land Use Project
Data Required bull Parking supply and
parking costs ndash Parking spaces may
reflect use restrictions
bull Monthly
bull Daily
bull Hourly
ndash Parking costs consistent with type of use
Land Use Project
bull Park Area 1 (pink) ndash May park in MAZ other
than destination MAZ
ndash Parking cost applies
bull Park Area 2 (gree) ndash Parks at destination MAZ
ndash Parking cost applies
Land Use Project
Data Required bull Visitor Model ndash Number of hotel and motel rooms
bull Special Generators ndash Regional shopping malls
ndash Beach recreation areas
Land Use Project
The Gardens Mall Aventura Mall
Boynton Mall Dolphin Mall
Delray Community Mall Dadeland Mall
Towncenter Mall The Falls Shopping Center
Wellington Greens Mall Cutler Ridge Mall
Coral Square Mall Bal Harbour Shops
Pompano Citi Centre CocoWalk
Sawgrass Mills Mall The Mall at 163rd Street
Broward Mall Mall of the Americas
Galleria Mall Mary Brickell Village
Pembroke Lakes Mall Miami International Mall
Lakes Mall Miracle Marketplace
Oakwood Plaza Village of Merrick Park
The Promenade at Coconut Creek Westland Mall
Regional Shopping Mall Special Generators
Land Use Project
Deerfield Beach
Pompano Beach
Fort Lauderdale Beach
Fort Lauderdale Beach
Hollywood Beach
South Beach
Haulover Beach
Crandon Park
Dania Beach
Bill Baggs State Park
Beach Special Generators
Land Use Project
Sample Problem
bull MINTO West Example - a mixed residentialcommercial development ndash 6500 singlemulti-family residential units in multiple TAZs
ndash 14 million square feet of non-residential space
ndash 150 room hotel
ndash 3000 student college campus
Land Use Project
MINTO WEST
Land Use Project
TAZsMAZs representing MINTO West Development
Land Use Project
Need to translate population household and employment information from developer into model input data ndash As discussed in the Population Synthesis presentation population and
household attribute estimates can be taken from other known nearby neighborhoods
bull In this sample problem first start by allocating percentages of total
households into individual MAZs within the development area
bull Keep in mind household density when estimating the number of
households in each MAZ
Land Use Project
bull In this sample employment can be assumed to include bull Retail
bull RestaurantsBars
bull Offices
bull Health services
bull Hotelmotel employment and
bull Educational employment
ndash As with households yoursquoll need to apportion the employment areas to individual MAZs while keeping in mind the types of employment expected in those locations
Land Use Project
bull Employment data is usually estimated by converting floor space available to individual types of employment through conversion factors
bull ie ndash (3000 sqft office space)(20 sqft per office employee) =
150 office employees
Land Use Project
bull Once population household and employment figures are estimated they are entered into the appropriate model input file
bull Population ndash TAZ synthetic population control file
bull Household ndash TAZ synthetic population control file
bull Employment School Parking and Special Gen ndash maz_datacsv
bull Ensure that population household and employment figures
are the same in each file
bull Prior to performing model run PopSyn must be run and user must copy output files to SERPM7 input folders
Application 6 ndashTransit Project
Transit Project ndash MetroRail North Corridor
SERPM Transit Modes
Transit Mode Tour and Trip
Mode TAP Transit Skim Mode
Tri-Rail Commuter Rail Premium
Metrorail Urban Rail Premium
I-95 Inter-County Express I-95X I-95E
Express Bus Premium
Busway BRT Premium
MDT Express Express Bus Premium
Metromover Local Bus Local Bus
MDT Local BCT Local
Palm Tran Local Local Bus Local Bus
Breeze Local Bus Local Bus
Tri-Rail Shuttles Local Bus Local Bus
SERPM Transit Modes
Transit Mode Tour and Trip
Mode TAP Transit Skim
Mode
Mode coded on the route ldquocardsrdquo
Used to specify boarding and transfer penalties for transit
path building
(most disaggregate)
Line-haul choices in the tour and trip mode choice
models
Used to create sets of TAP to TAP levels of service
(most aggregate)
Similar to SERPM 67 SERPM 7 ABM
SERPM Transit Modes S67 Mode Local (L) S7
Mode Mode Name Operator amp Name UserA4 Name Prem (P) MODE
15 Tri-Rail 11 Tri-Rail 15 Commuter P 111
14 Metrorail 25 Metrorail 14 Urban Rail P 121
X Regional LRT Regional LRT 14 LRT P 131
16 Inter-County Express Bus 33 I-95 Inter-County Express 16 Express P 151
12 Exclusive ROW Cir-Reg 13 Exclusive ROW Cir-Reg 12 Mover L 181
11 TrolleysShuttles-Reg 12 Tri-Rail Shuttles 11 Local L 191
11 TrolleysShuttles-Reg 12 Tri-Rail Shuttles 33 Local L 192
X LRT- MDT 25 MDT LRT 14 LRT P 231
16 Buses (localexpress) - MDT 27 MDT Busway Flyers 27 BRT P 241
23 Buses (localexpress) - MDT 27 MDT MAXKATBusway Local 27 BRT P 242
24 BRT - MDT 28 MDT BRTLRT 28 BRT P 243
23 Buses (localexpress) - MDT 22 MDT Express 24 Express P 251
16 Buses (localexpress) - MDT 24 MDT I-95 Exp 26 Express P 252
16 Inter-County Express Bus 24 I-95 Inter-County Express 16 Express P 253
22 Exclusive ROW Cir-MDT 26 Metromover 22 Mover L 281
21 TrolleysShuttles-MDT 21 MDT TrolleysShuttles 21 Local L 291
23 Buses (localexpress) - MDT 21 MDT Local 23 Local L 292
23 Buses (localexpress) - MDT 23 MDT Shuttle 25 Local L 293
X LRT - BCT 35 BCT LRT 37 LRT P 331
34 BCT Rapid Bus BRT 34 BCT Rapid Bus 36 BRT P 341
34 BCT Fixed-guideway BRT 35 BCT BRT 37 BRT P 342
33 Buses (localexpress) - BCT 32 BCT Breeze 34 Express P 351
33 Buses (localexpress) - BCT 33 BCT Express 35 Express P 352
32 Exclusive ROW Cir-BCT 31 BCT Exclusive ROW Cir 32 Mover L 381
31 TrolleysShuttles-BCT 31 BCT TrolleysShuttles 31 Local L 393
33 Buses (localexpress) - BCT 31 BCT Local 27 Local L 391
33 Buses (localexpress) - BCT 31 BCT Local 33 Local L 392
X LRT - Palm Tran 43 Palm Tran LRT 44 LRT P 431
44 BRT - Palm Tran 43 Palm Tran BRT 44 BRT P 441
43 Buses (localexpress) - Ptran 42 Palm Tran Exp 44 Express P 451
42 Exclusive ROW Cir-PTran 41 Palm Tran Exclusive ROW Cir 42 Mover L 481
41 TrolleysShuttles-Ptran 41 Palm Tran TrolleysShuttles 41 Local L 491
43 Buses (localexpress) - Ptran 41 Palm Tran Local 43 Local L 492
Modes Not in the 2010 Network
SERPM7 Transit Network Building
bull Typically bus routes are coded on top of existing highway links
bull SERPM7 reserves some facility type codes for transit-only use helpful to more accurately represent route ndash Caution -- make sure network integrity is preserved once transit only
links are removed
bull Rail routes require coding first fixed-guideway links
SERPM7 Transit Network Building
bull Route Attributes -- User Coded ndash Name
ndash Long Name
ndash Mode
ndash Operator
ndash Headway[1] ndash AM Peak
ndash Headway[2] ndash Midday
ndash Headway[3] ndash PM Peak
ndash UserA4 (stop dwell time)
SERPM7 Transit Network Building
bull PNR Node Attributes ndash User Coded ndash Parking Spaces
ndash Parking Cost AM
ndash Parking Cost MD
ndash Terminal Time PNR
ndash Terminal Time KNR
bull At this time parking spaces is used only to identify park-n-ride locations (parking spaces gt 0)
SERPM7 Transit Network Building
bull Transit Access Points -- Created by Cube for the ABM ndash One TAP for each stop on premium routes
bull Tri-Rail Metrorail Express Bus BRT
ndash One TAP for each Local Bus park-n-ride node
ndash Synthesized TAPs to represent access to local bus stops
bull Transit Access Point Attributes ndash TAP Mode
ndash Inherit PNR node data
Sample Highway Network with TAPs
TAPs become part of the highway network and replace the TAZ centroids when building transit skims
Transit Access Points and ldquoon the flyrdquo Path Building
bull Transit skims are built TAP to TAP
Matrix origins and destinations are TAPS
Transit Access Points and ldquoon the flyrdquo Path Building
Trip Origins and
Destinations
MAZ to MAZ
Auto Skims
TAZ to TAZ
Transit Skims
TAP to TAP
The three spatial systems are put together by the mode choice model
ldquoOn the Flyrdquo Path Building
bull TAZs TAPs and MAZs are linked via drive and access connectors prior to running CT-RAMP
rmdir OUTDIRABMTEMP S Q rmdir DATADIRABMTEMP S Q xcopy OUTDIR OUTDIRABMTEMP E I Y xcopy DATADIR DATADIRABMTEMP E I Y if(fbi=1) need to run only the first time through - kdk CUBEctramprunCreateAccessFilescmd endif mkdir logFiles taskkill im javaexe F start CUBEctramprunHhMgrcmd JDK64 HOST_IP start CUBEctramprunMtxMgrcmd HOST_IP JDK64 rem start CUBEctrampconfigrunDrivercmd copy CUBEctrampserpm_abmproperties serpm_abmproperties Y ping -n 11 127001 gt nul CUBEctramprunSERPMAbmcmd SAMPLERATE VSAMPLERATE JDK64 CUBEctramprunCreateDemandMatricescmd SAMPLERATE VSAMPLERATE JDK64 taskkill im javaexe F rmdir OUTDIRctramp S Q rmdir DATADIRctramp S Q xcopy OUTDIRABMTEMPctramp OUTDIRctramp E I Y xcopy DATADIRABMTEMPctramp DATADIRctramp E I Y
ldquoOn the Flyrdquo Path Building
MAZ to MAZ Connectors
Created by finding shortest distance paths over an all-streets network Connects all MAZs within 15 mi
Used to represent walk mode distance and time
MAZ to TAP Connectors
Created by finding shortest distance paths over an all-streets network Connects each MAZ to all TAPs within 10 mi
Used to represent transit walk access and walk egress distance and time
TAZ to TAP Connectors
Connects each TAZ to all TAPs within the TAP maximum drive distance bull Bus TAPs ndash 4 miles bull Rail TAPs ndash 15 miles
Used to represent transit drive access and egress distance and time
ldquoOn the Flyrdquo Path Building
bull No actual links created on the network bull Connectivity is expressed in table format
ldquoOn the Flyrdquo Path Building
bull Once the access and walk connectors are created the mode choice model builds complete paths MAZ to MAZ transit paths
bull Local-only paths are built using the ldquolocalrdquo transit skim bull Express BRT Urban Rail and Commuter rail paths are all
built at the same time using the ldquopremiumrdquo transit skim bull For each MAZ to MAZ pair CT-RAMP keeps the shortest
generalized cost path for each available premium mode bull Even though only one ldquopremiumrdquo skim is built CT-RAMP
may find competing premium paths It may also find that the best path is a combination of two premium modes or a premium mode and local bus
Tour Mode Choice Model
Choice
Auto
Drive alone
GP(1)
Pay(2)
Shared ride 2
GP(3)
HOV(4)
Pay(5)
Shared ride 3+
GP(6)
HOV(7)
Pay(8)
Non-motorized
Walk(9)
Bike(10)
Transit
Walk access
Local bus(11)
Express bus(12)
BRT(13)
Urban rail(14)
Commuter rail(15)
PNR access
Local bus(16)
Express bus(17)
BRT(18)
Urban rail(19)
Commuter rail(20)
KNR access
Local bus(21)
Express bus(22)
BRT(23)
Urban rail(24)
Commuter rail(25)
School Bus(26)
Trip Mode Choice Model
bull Same nesting structure as the tour mode choice but conditional on the tour mode
bull Some trip modes may be unavailable depending on the tour mode
DA SR2 SR3+ Walk Wlk-Trn PNR-Trn KNR-Trn
DA Must - - - - - -
SR2 Can Can - Can - - -
SR3+ Can Can Can Can - - -
Walk - - - Must - - -
Wlk-Trn - Can Can Can Can - -
PNR-Trn Can Can Can Can Can Can
KNR-Trn - Can Can Can Can - Can
Trip Switching Rules Simplified
Transit Trip Reporting
bull In SERPM7 the transit boarding and alighting location can be reported in two ways ndash Trip list files (ABM output) -- Boarding TAP Alighting TAP
ndash Transit assignment (Cube output) ndash Route nodes
bull Each type of reporting has its strengths ndash Trip list file allows building detailed transit trip patterns for
population cohorts and time periods
bull Mode split reports
bull Transit trip distance frequency distributions access distance TLFDs
bull Mode to mode transfers
ndash Note ABM reports only the first boarding TAP and the last alighting TAP regardless of mode
ndash Cube output gives aggregate link volumes station to station boardings etc
User Benefit Files
bull SERPM7 can produce FTA User Benefit files for input to SUMMIT
bull User benefits remain a useful analysis tool bull Steps to produce user benefit files require some manual
intervention ndash see User Guide
SERPM ABM Reports
bull Stores ABM inputs and outputs in a relational database to generate some standard model reports
bull Consistent reporting framework to be used for analysis across model runs
bull SERPM7 user community can easily share the scripts that create the reports
bull Reports take the form of Excel workbooks bull Foundation for future development of a visualization
dashboard
Reporting Database Components
Reporting Database Components
bull Reporting ETL (extract transform and load) program ndash Loads all Cube and CT-RAMP Java model outputs into the database
ndash Written in Cube scripts and Java
bull Database ndash Stores all data used in reporting including select network skims
household person tour and trip data zonal data etc
ndash Implemented with SQL Server
bull Report scripts to generate reports ndash Written in T-SQL
bull Report packaging program ndash Generates Excel workbooks with one report per worksheet
ndash Written in Java
Reporting Database Components
bull Run time required to build database and generate reports varies with sample size and type of report ndash Several hours required to build the database for a 100 sample
ndash ~ 30 minutes to produce reports for a 10 sample
bull Report step is optional not part of a standard model run bull Report production is transparent to the user
bull hellip but users can contribute reports bull hellip and choose which reports to build at any one time
Running SERPM ABM Reports
bull Report queries reside in ctrampreports_sql time_spent_travelingsql Total weekday travel time by person type
and income group
total_trips_typesql Trips by trip mode person type county of residence and tour purpose
total_tours_typesql Tours by trip mode person type county of residence and tour purpose
tours_districtssql Tours by tour purpose and tour origin and destination districts
transit_access_time+distsql Drive to transit trip list with many trip details
hellip
Running SERPM ABM Reports
bull List of reports to run is specified in properties file ndash ctrampserpm_reportsproperties
sqlscriptsdirectory = Cserpm7ctrampreports_sql sqlscriptsschemakey = SCHEMA sqlscripts=cleanupsqltransit_access_time+distsql worksheettables=temptransittrips worksheetnames=TransitTrips workbookname = Cserpm7ctrampreports_sqlSERPM_REPORTXLS databaseschema = 2010R databaseipaddress = w-ampdx-d-sag10 databaseinstance = databaseport = 1433 databasename=SERPMABM databaseusername=serpm databasepassword=s3rpm
Adding Reports
bull Step 1 --Write report query ndash T-SQL
ndash User Guide includes a database data dictionary
bull Step 2 ndash Add query to ctrampreports_sql ndash Each query is contained in a single text file
ndash Drop file in reports folder
bull Step 3 ndash Add the query to the properties file sqlquery = Query file name
Worksheettables = Query output
Worksheetnames = Name for the report worksheet
Sample SERPM ABM Reports
bull Exhibit ctrampreports_sqlserpm_reportsxls
More information Shi-Chiang Li | shi-chianglidotstateflus |954 777 4655 Rosella Picado | picadopbworldcom | 206 382 5227 Ken Kaltenbach |kkaltenbachcorradinocom |502 587 7221

Reviewing PopSyn Output
bull Validation_StatsByPumacsv ndash Same as validation_stats but for each PUMA
bull Note that synthesized population may differ from 5 Census population by design
Application 3 ndash Highway Project
Highway Project
Example Projects ndashToll road extension ndashReversible lanes ndashManaged lanes
Overview
How to use SERPM7 to perform a model run and do some standard analysis ndash Option 1 -- Code the project directly on the geodatabase
bull Roadway links
bull Node links
bull Turn penalties
bull [assume no change to transit]
ndash Option 2 --Code the project on net files and then build the geodatabase
bull Use flowchart script to build the geodatabase
ndash Coding is very similar to earlier versions of SERPM
bull Facility types are the same
SERPM Facility Types (not new)
Editing the Highway Network
bull SERPM 7 requires a geodatabase bull Editing can be done either to a net file or directly on the
geodatabase bull The user can use utilities in the model flowchart to write a
net file from the geodatabase edit the net and then write it to the geodatabase
bull The geodatabase must exist to run the model
Editing in the Geodatabase
bull Simplest and most direct method bull Requires an understanding of the CubeArcGIS tools
Export geodatabase and edit as a net
bull Start Data Manager bull Open geodatabase (SERPM_NETSMDB) bull Double click on the network Input Hwy Net and specify an
output file (maybe ldquoeditnetrdquo) bull Open from Cube and edit as usual bull Use ldquoPrepare for Model Run and Trap Errorsrdquo (2) utilities to
write back to geodatabase ndash Reload geodatabase from Cube files ndash Cull and sort
ndash Write to geodatabase
Edit as a net
Export Edit in Cube
Change to point to edited network
Input Hwy Net
Toll Road Extension
bull Short Cut ndash copy an existing toll link bull No special NODE attributes bull Only new attribute is ISTOLL=1 for all links that could not be
used unless a toll were paid bull Toll Mainline FTC2=91 ISTOLL=1 DIRCODE=1 bull Plaza (gantry) ndash assume all will be electronic collection ndash TOLL=1 DIRCODE=1
ndash TOLLTYPE=3 CARTOLL=toll in dollars
ndash FTC2=95
ndash ISTOLL=1
ndash SVCSECONDS=001
ndash DELCODE=1 ACCELCODE=1 AVILANES=2
Toll Road Extension
Not much different from earlier versions of SERPM
Reversible Lanes
bull Control by the link attribute REVERSIBLE ndash REVERSIBLE=1 means AM operation only
ndash REVERSIBLE=2 means PM operation only
ndash I-595 example
Managed Lanes (typically Express)
bull HOT=1 ndash 98 (99 makes the link a dummy) bull FTC2 most likely=91 but other types permitted bull TOLL=0 ISTOLL=0 bull Tolls set by HOTTOLLdbf
HOT Lanes Tolls
bull Set as a function of the VC bull Updated in the travel time feedback loop bull Affects the TollFree split in mode choice bull Column HOT_x were x=HOT link attribute bull HOT_1 is the current 95 Express rate HOT_2 is a placeholder
Common Errors
bull Errors to watch out for ndash If network steps fail look for missing attributes
ndash Update transit routes as needed due to changes to underlying highway network
ndash Check for dangling links and unconnected zones
ndash Verify that all TAZs are connected to lsquofreersquo roads
bull Special procedures required for TAZs that have toll-only access must
include the attribute ISRCTOLLINK=1 (currently used for the
Rickenbacker Causeway)
ndash Some CT-RAMP errors caused by network coding errors may not be apparent until feedback loop 2 because in loop 1 CT-RAMP uses seed skims
bull Use small sample size when testing a new network
Was the Run Successful
bull Did the run converge ndash AM and PM travel time RMSE values reported to
OUTDIRfeedbacklogprn
ndash Run stops when RMSE is less than 01
ndash 2010 Scenario converges in 5 loops
bull What to do if it didnrsquot converge ndash Look for obvious errors
ndash Run more iterations (future year might require more)
bull Are the top-level results comparable to a similar run ndash Use HEVAL reports
ndash Examine screenlines (RMSE reports)
ndash Spot check link loads
Tools for Analysis
bull Analysis ndash perform standard highway project type analyses
bull Usual analysis similar to trip-based model ndash Total daily and period-specific roadway volumes and speeds by
vehicle class
ndash Vehicle trip OD matrices
bull Standard FSUTMS HEVAL and RMSE reports are still available ndash Day and period assignments
ndash By County
ndash Truck assignment
Tools for Analysis
bull Potential for customized assignment classes to address
specific project questions ndash Does the manage lane serve primarily high income users
bull Stratify vehicle classes by lowhigh income to understand facility
usage by income level
bull Stratify vehicle classes by disadvantaged population cohorts
bull Trip and person tabulations built from ABM output ndash Trip mode shares for many different population cohorts subareas
ndash For example toll vs non-toll shares by value of time or fine-graded income levels
ndash Many other possibilities
Application 4 ndash Mobility Project
Mobility Project ndash SUNPASS Market Share
bull Persons in households that own a SUNPASS transponder respond differently to managed lane and toll road policies ndash Pay lower tolls than cash users
ndash Have access to I-95 managed lanes
bull Policy questions ndash How does projected toll traffic and revenue vary with the SUNPASS
penetration rate and toll discount
ndash How will SUNPASS penetration rate vary as more managed lane facilities are built in the region
Mobility Project ndash SUNPASS Market Share
bull Question 1 -- How does projected toll traffic and revenue vary with the SUNPASS penetration rate and toll discount
bull Procedure ndash Step1 ndash Assume a SUNPASS market share by modifying the toll
transponder model
ndash Step 2 ndash Run SERPM7 to produce traffic volumes
ndash Step 3 ndash Estimate toll traffic revenue
Modifying the Toll Transponder Ownership Model
bull Model specification is contained in TransponderOwnershipxls and can be edited with Microsoft Excel
Utility Variable Coefficient
Expected time savings up to 644 min 00631
Distance less than 5 miles -00304
Distance between 5 and 10 miles -00648
Distance 10 miles or more -00648
Constant 04877
Modifying the Toll Transponder Ownership Model
Utility Variable Coefficient
Expected time savings up to 644 min 00631
Distance less than 5 miles -00304
Distance between 5 and 10 miles -00648
Distance 10 miles or more -00648
Constant 04877
Increasing the constant will increase the number of households equipped with transponders
TransponderOwnershipxls
Modifying the Toll Transponder Model
bull Increase the constant by how much ndash Process is akin to model calibration
ndash Several runs of the transponder model required to estimate the constant that yields the desired market share
ndash 2010 market share is approximately 65
ndash Use a small sample (5 or 10) to save run-time while establishing the right constant
Modifying the Toll Transponder Model
bull Variation ndash Add terms to the model so that certain types of households are more
likely to exhibit a SUNPASS market share increase
bull Highlow income households
bull Multi-car households
bull Miami-Dade households
Modifying the Toll Transponder Model
bull Exhibit TransponderOwnershipxls
Mobility Project ndash SUNPASS Market Share
bull Question 2 -- How will SUNPASS penetration rate vary as more managed lane facilities are built in the region
bull Procedure ndash Step 1 ndash Code the manage lane facilities
ndash Step 2 ndash Run SERPM7 to forecast transponder ownership
ndash Step 3 ndash Analyze the forecast household data for changes in the profile of households equipped with transponders
Application 5 ndash Land Use Project
Land Use Project
bull Transportation projects comprise not only network scenarios but also land use scenarios
bull Land use scenarios can be ndash Very large scale (substantial changes to housing and employment
estimates throughout the region) or
ndash Small scale (localized changes for example for a traffic impact study)
bull For both large scale and small scale land use updates the
general procedure for updating the input data and running the model is the same
Land Use Project
bull The land use data in SERPM7 consists of ndash Synthetic population and derived input files
ndash Employment data
ndash School enrollment data
ndash Parking costs and parking spaces
ndash Regional shopping mall special generators
ndash Beach special generators
ndash Hotel and motel room data
Land Use Project
bull The land use data reside in different input files
Data Item Input File
Synthetic Population hhFilecsv personFilecsv ctramppopsynTAZDatacsv ctramppopsynMAZDatacsv
Employment School Enrollment Parking Supply Data Special Generators Hotel and Motel Rooms
inputsIN-2010Rmaz_datacsv
Land Use Project
bull As demonstrated earlier SERPM 7 requires significantly more comprehensive socio-economic inputs as compared to previous versions ndash Greater spatial detail
ndash More categoriestypes of land uses
bull These inputs require additional preparation when
performing land use model runs
Land Use Project
Data Required and examples bull Population
bull Age distribution of the population expected to live in the
development
bull Income profile
bull Type of dwelling unit (single-family vs multi-family)
ndash The input data need to be internally consistent (distribution of households by presence of children needs to be consistent with population age distribution for example)
Land Use Project
Data Required bull Employment classification ndash Previous models had three
employment classifications
ndash In SERPM 7 there are 16 employment categories to better differentiate type of land use and improve the relationship between land use and activity purpose
Land Use Project
Data Required bull School enrollment ndash note that it differentiates by grade level
(K-8 high-school collegepost-secondary) ndash Donrsquot forget to include school faculty and staff in employment
Land Use Project
Data Required bull Parking supply and
parking costs ndash Parking spaces may
reflect use restrictions
bull Monthly
bull Daily
bull Hourly
ndash Parking costs consistent with type of use
Land Use Project
bull Park Area 1 (pink) ndash May park in MAZ other
than destination MAZ
ndash Parking cost applies
bull Park Area 2 (gree) ndash Parks at destination MAZ
ndash Parking cost applies
Land Use Project
Data Required bull Visitor Model ndash Number of hotel and motel rooms
bull Special Generators ndash Regional shopping malls
ndash Beach recreation areas
Land Use Project
The Gardens Mall Aventura Mall
Boynton Mall Dolphin Mall
Delray Community Mall Dadeland Mall
Towncenter Mall The Falls Shopping Center
Wellington Greens Mall Cutler Ridge Mall
Coral Square Mall Bal Harbour Shops
Pompano Citi Centre CocoWalk
Sawgrass Mills Mall The Mall at 163rd Street
Broward Mall Mall of the Americas
Galleria Mall Mary Brickell Village
Pembroke Lakes Mall Miami International Mall
Lakes Mall Miracle Marketplace
Oakwood Plaza Village of Merrick Park
The Promenade at Coconut Creek Westland Mall
Regional Shopping Mall Special Generators
Land Use Project
Deerfield Beach
Pompano Beach
Fort Lauderdale Beach
Fort Lauderdale Beach
Hollywood Beach
South Beach
Haulover Beach
Crandon Park
Dania Beach
Bill Baggs State Park
Beach Special Generators
Land Use Project
Sample Problem
bull MINTO West Example - a mixed residentialcommercial development ndash 6500 singlemulti-family residential units in multiple TAZs
ndash 14 million square feet of non-residential space
ndash 150 room hotel
ndash 3000 student college campus
Land Use Project
MINTO WEST
Land Use Project
TAZsMAZs representing MINTO West Development
Land Use Project
Need to translate population household and employment information from developer into model input data ndash As discussed in the Population Synthesis presentation population and
household attribute estimates can be taken from other known nearby neighborhoods
bull In this sample problem first start by allocating percentages of total
households into individual MAZs within the development area
bull Keep in mind household density when estimating the number of
households in each MAZ
Land Use Project
bull In this sample employment can be assumed to include bull Retail
bull RestaurantsBars
bull Offices
bull Health services
bull Hotelmotel employment and
bull Educational employment
ndash As with households yoursquoll need to apportion the employment areas to individual MAZs while keeping in mind the types of employment expected in those locations
Land Use Project
bull Employment data is usually estimated by converting floor space available to individual types of employment through conversion factors
bull ie ndash (3000 sqft office space)(20 sqft per office employee) =
150 office employees
Land Use Project
bull Once population household and employment figures are estimated they are entered into the appropriate model input file
bull Population ndash TAZ synthetic population control file
bull Household ndash TAZ synthetic population control file
bull Employment School Parking and Special Gen ndash maz_datacsv
bull Ensure that population household and employment figures
are the same in each file
bull Prior to performing model run PopSyn must be run and user must copy output files to SERPM7 input folders
Application 6 ndashTransit Project
Transit Project ndash MetroRail North Corridor
SERPM Transit Modes
Transit Mode Tour and Trip
Mode TAP Transit Skim Mode
Tri-Rail Commuter Rail Premium
Metrorail Urban Rail Premium
I-95 Inter-County Express I-95X I-95E
Express Bus Premium
Busway BRT Premium
MDT Express Express Bus Premium
Metromover Local Bus Local Bus
MDT Local BCT Local
Palm Tran Local Local Bus Local Bus
Breeze Local Bus Local Bus
Tri-Rail Shuttles Local Bus Local Bus
SERPM Transit Modes
Transit Mode Tour and Trip
Mode TAP Transit Skim
Mode
Mode coded on the route ldquocardsrdquo
Used to specify boarding and transfer penalties for transit
path building
(most disaggregate)
Line-haul choices in the tour and trip mode choice
models
Used to create sets of TAP to TAP levels of service
(most aggregate)
Similar to SERPM 67 SERPM 7 ABM
SERPM Transit Modes S67 Mode Local (L) S7
Mode Mode Name Operator amp Name UserA4 Name Prem (P) MODE
15 Tri-Rail 11 Tri-Rail 15 Commuter P 111
14 Metrorail 25 Metrorail 14 Urban Rail P 121
X Regional LRT Regional LRT 14 LRT P 131
16 Inter-County Express Bus 33 I-95 Inter-County Express 16 Express P 151
12 Exclusive ROW Cir-Reg 13 Exclusive ROW Cir-Reg 12 Mover L 181
11 TrolleysShuttles-Reg 12 Tri-Rail Shuttles 11 Local L 191
11 TrolleysShuttles-Reg 12 Tri-Rail Shuttles 33 Local L 192
X LRT- MDT 25 MDT LRT 14 LRT P 231
16 Buses (localexpress) - MDT 27 MDT Busway Flyers 27 BRT P 241
23 Buses (localexpress) - MDT 27 MDT MAXKATBusway Local 27 BRT P 242
24 BRT - MDT 28 MDT BRTLRT 28 BRT P 243
23 Buses (localexpress) - MDT 22 MDT Express 24 Express P 251
16 Buses (localexpress) - MDT 24 MDT I-95 Exp 26 Express P 252
16 Inter-County Express Bus 24 I-95 Inter-County Express 16 Express P 253
22 Exclusive ROW Cir-MDT 26 Metromover 22 Mover L 281
21 TrolleysShuttles-MDT 21 MDT TrolleysShuttles 21 Local L 291
23 Buses (localexpress) - MDT 21 MDT Local 23 Local L 292
23 Buses (localexpress) - MDT 23 MDT Shuttle 25 Local L 293
X LRT - BCT 35 BCT LRT 37 LRT P 331
34 BCT Rapid Bus BRT 34 BCT Rapid Bus 36 BRT P 341
34 BCT Fixed-guideway BRT 35 BCT BRT 37 BRT P 342
33 Buses (localexpress) - BCT 32 BCT Breeze 34 Express P 351
33 Buses (localexpress) - BCT 33 BCT Express 35 Express P 352
32 Exclusive ROW Cir-BCT 31 BCT Exclusive ROW Cir 32 Mover L 381
31 TrolleysShuttles-BCT 31 BCT TrolleysShuttles 31 Local L 393
33 Buses (localexpress) - BCT 31 BCT Local 27 Local L 391
33 Buses (localexpress) - BCT 31 BCT Local 33 Local L 392
X LRT - Palm Tran 43 Palm Tran LRT 44 LRT P 431
44 BRT - Palm Tran 43 Palm Tran BRT 44 BRT P 441
43 Buses (localexpress) - Ptran 42 Palm Tran Exp 44 Express P 451
42 Exclusive ROW Cir-PTran 41 Palm Tran Exclusive ROW Cir 42 Mover L 481
41 TrolleysShuttles-Ptran 41 Palm Tran TrolleysShuttles 41 Local L 491
43 Buses (localexpress) - Ptran 41 Palm Tran Local 43 Local L 492
Modes Not in the 2010 Network
SERPM7 Transit Network Building
bull Typically bus routes are coded on top of existing highway links
bull SERPM7 reserves some facility type codes for transit-only use helpful to more accurately represent route ndash Caution -- make sure network integrity is preserved once transit only
links are removed
bull Rail routes require coding first fixed-guideway links
SERPM7 Transit Network Building
bull Route Attributes -- User Coded ndash Name
ndash Long Name
ndash Mode
ndash Operator
ndash Headway[1] ndash AM Peak
ndash Headway[2] ndash Midday
ndash Headway[3] ndash PM Peak
ndash UserA4 (stop dwell time)
SERPM7 Transit Network Building
bull PNR Node Attributes ndash User Coded ndash Parking Spaces
ndash Parking Cost AM
ndash Parking Cost MD
ndash Terminal Time PNR
ndash Terminal Time KNR
bull At this time parking spaces is used only to identify park-n-ride locations (parking spaces gt 0)
SERPM7 Transit Network Building
bull Transit Access Points -- Created by Cube for the ABM ndash One TAP for each stop on premium routes
bull Tri-Rail Metrorail Express Bus BRT
ndash One TAP for each Local Bus park-n-ride node
ndash Synthesized TAPs to represent access to local bus stops
bull Transit Access Point Attributes ndash TAP Mode
ndash Inherit PNR node data
Sample Highway Network with TAPs
TAPs become part of the highway network and replace the TAZ centroids when building transit skims
Transit Access Points and ldquoon the flyrdquo Path Building
bull Transit skims are built TAP to TAP
Matrix origins and destinations are TAPS
Transit Access Points and ldquoon the flyrdquo Path Building
Trip Origins and
Destinations
MAZ to MAZ
Auto Skims
TAZ to TAZ
Transit Skims
TAP to TAP
The three spatial systems are put together by the mode choice model
ldquoOn the Flyrdquo Path Building
bull TAZs TAPs and MAZs are linked via drive and access connectors prior to running CT-RAMP
rmdir OUTDIRABMTEMP S Q rmdir DATADIRABMTEMP S Q xcopy OUTDIR OUTDIRABMTEMP E I Y xcopy DATADIR DATADIRABMTEMP E I Y if(fbi=1) need to run only the first time through - kdk CUBEctramprunCreateAccessFilescmd endif mkdir logFiles taskkill im javaexe F start CUBEctramprunHhMgrcmd JDK64 HOST_IP start CUBEctramprunMtxMgrcmd HOST_IP JDK64 rem start CUBEctrampconfigrunDrivercmd copy CUBEctrampserpm_abmproperties serpm_abmproperties Y ping -n 11 127001 gt nul CUBEctramprunSERPMAbmcmd SAMPLERATE VSAMPLERATE JDK64 CUBEctramprunCreateDemandMatricescmd SAMPLERATE VSAMPLERATE JDK64 taskkill im javaexe F rmdir OUTDIRctramp S Q rmdir DATADIRctramp S Q xcopy OUTDIRABMTEMPctramp OUTDIRctramp E I Y xcopy DATADIRABMTEMPctramp DATADIRctramp E I Y
ldquoOn the Flyrdquo Path Building
MAZ to MAZ Connectors
Created by finding shortest distance paths over an all-streets network Connects all MAZs within 15 mi
Used to represent walk mode distance and time
MAZ to TAP Connectors
Created by finding shortest distance paths over an all-streets network Connects each MAZ to all TAPs within 10 mi
Used to represent transit walk access and walk egress distance and time
TAZ to TAP Connectors
Connects each TAZ to all TAPs within the TAP maximum drive distance bull Bus TAPs ndash 4 miles bull Rail TAPs ndash 15 miles
Used to represent transit drive access and egress distance and time
ldquoOn the Flyrdquo Path Building
bull No actual links created on the network bull Connectivity is expressed in table format
ldquoOn the Flyrdquo Path Building
bull Once the access and walk connectors are created the mode choice model builds complete paths MAZ to MAZ transit paths
bull Local-only paths are built using the ldquolocalrdquo transit skim bull Express BRT Urban Rail and Commuter rail paths are all
built at the same time using the ldquopremiumrdquo transit skim bull For each MAZ to MAZ pair CT-RAMP keeps the shortest
generalized cost path for each available premium mode bull Even though only one ldquopremiumrdquo skim is built CT-RAMP
may find competing premium paths It may also find that the best path is a combination of two premium modes or a premium mode and local bus
Tour Mode Choice Model
Choice
Auto
Drive alone
GP(1)
Pay(2)
Shared ride 2
GP(3)
HOV(4)
Pay(5)
Shared ride 3+
GP(6)
HOV(7)
Pay(8)
Non-motorized
Walk(9)
Bike(10)
Transit
Walk access
Local bus(11)
Express bus(12)
BRT(13)
Urban rail(14)
Commuter rail(15)
PNR access
Local bus(16)
Express bus(17)
BRT(18)
Urban rail(19)
Commuter rail(20)
KNR access
Local bus(21)
Express bus(22)
BRT(23)
Urban rail(24)
Commuter rail(25)
School Bus(26)
Trip Mode Choice Model
bull Same nesting structure as the tour mode choice but conditional on the tour mode
bull Some trip modes may be unavailable depending on the tour mode
DA SR2 SR3+ Walk Wlk-Trn PNR-Trn KNR-Trn
DA Must - - - - - -
SR2 Can Can - Can - - -
SR3+ Can Can Can Can - - -
Walk - - - Must - - -
Wlk-Trn - Can Can Can Can - -
PNR-Trn Can Can Can Can Can Can
KNR-Trn - Can Can Can Can - Can
Trip Switching Rules Simplified
Transit Trip Reporting
bull In SERPM7 the transit boarding and alighting location can be reported in two ways ndash Trip list files (ABM output) -- Boarding TAP Alighting TAP
ndash Transit assignment (Cube output) ndash Route nodes
bull Each type of reporting has its strengths ndash Trip list file allows building detailed transit trip patterns for
population cohorts and time periods
bull Mode split reports
bull Transit trip distance frequency distributions access distance TLFDs
bull Mode to mode transfers
ndash Note ABM reports only the first boarding TAP and the last alighting TAP regardless of mode
ndash Cube output gives aggregate link volumes station to station boardings etc
User Benefit Files
bull SERPM7 can produce FTA User Benefit files for input to SUMMIT
bull User benefits remain a useful analysis tool bull Steps to produce user benefit files require some manual
intervention ndash see User Guide
SERPM ABM Reports
bull Stores ABM inputs and outputs in a relational database to generate some standard model reports
bull Consistent reporting framework to be used for analysis across model runs
bull SERPM7 user community can easily share the scripts that create the reports
bull Reports take the form of Excel workbooks bull Foundation for future development of a visualization
dashboard
Reporting Database Components
Reporting Database Components
bull Reporting ETL (extract transform and load) program ndash Loads all Cube and CT-RAMP Java model outputs into the database
ndash Written in Cube scripts and Java
bull Database ndash Stores all data used in reporting including select network skims
household person tour and trip data zonal data etc
ndash Implemented with SQL Server
bull Report scripts to generate reports ndash Written in T-SQL
bull Report packaging program ndash Generates Excel workbooks with one report per worksheet
ndash Written in Java
Reporting Database Components
bull Run time required to build database and generate reports varies with sample size and type of report ndash Several hours required to build the database for a 100 sample
ndash ~ 30 minutes to produce reports for a 10 sample
bull Report step is optional not part of a standard model run bull Report production is transparent to the user
bull hellip but users can contribute reports bull hellip and choose which reports to build at any one time
Running SERPM ABM Reports
bull Report queries reside in ctrampreports_sql time_spent_travelingsql Total weekday travel time by person type
and income group
total_trips_typesql Trips by trip mode person type county of residence and tour purpose
total_tours_typesql Tours by trip mode person type county of residence and tour purpose
tours_districtssql Tours by tour purpose and tour origin and destination districts
transit_access_time+distsql Drive to transit trip list with many trip details
hellip
Running SERPM ABM Reports
bull List of reports to run is specified in properties file ndash ctrampserpm_reportsproperties
sqlscriptsdirectory = Cserpm7ctrampreports_sql sqlscriptsschemakey = SCHEMA sqlscripts=cleanupsqltransit_access_time+distsql worksheettables=temptransittrips worksheetnames=TransitTrips workbookname = Cserpm7ctrampreports_sqlSERPM_REPORTXLS databaseschema = 2010R databaseipaddress = w-ampdx-d-sag10 databaseinstance = databaseport = 1433 databasename=SERPMABM databaseusername=serpm databasepassword=s3rpm
Adding Reports
bull Step 1 --Write report query ndash T-SQL
ndash User Guide includes a database data dictionary
bull Step 2 ndash Add query to ctrampreports_sql ndash Each query is contained in a single text file
ndash Drop file in reports folder
bull Step 3 ndash Add the query to the properties file sqlquery = Query file name
Worksheettables = Query output
Worksheetnames = Name for the report worksheet
Sample SERPM ABM Reports
bull Exhibit ctrampreports_sqlserpm_reportsxls
More information Shi-Chiang Li | shi-chianglidotstateflus |954 777 4655 Rosella Picado | picadopbworldcom | 206 382 5227 Ken Kaltenbach |kkaltenbachcorradinocom |502 587 7221

Toll Road Extension
Not much different from earlier versions of SERPM
Reversible Lanes
bull Control by the link attribute REVERSIBLE ndash REVERSIBLE=1 means AM operation only
ndash REVERSIBLE=2 means PM operation only
ndash I-595 example
Managed Lanes (typically Express)
bull HOT=1 ndash 98 (99 makes the link a dummy) bull FTC2 most likely=91 but other types permitted bull TOLL=0 ISTOLL=0 bull Tolls set by HOTTOLLdbf
HOT Lanes Tolls
bull Set as a function of the VC bull Updated in the travel time feedback loop bull Affects the TollFree split in mode choice bull Column HOT_x were x=HOT link attribute bull HOT_1 is the current 95 Express rate HOT_2 is a placeholder
Common Errors
bull Errors to watch out for ndash If network steps fail look for missing attributes
ndash Update transit routes as needed due to changes to underlying highway network
ndash Check for dangling links and unconnected zones
ndash Verify that all TAZs are connected to lsquofreersquo roads
bull Special procedures required for TAZs that have toll-only access must
include the attribute ISRCTOLLINK=1 (currently used for the
Rickenbacker Causeway)
ndash Some CT-RAMP errors caused by network coding errors may not be apparent until feedback loop 2 because in loop 1 CT-RAMP uses seed skims
bull Use small sample size when testing a new network
Was the Run Successful
bull Did the run converge ndash AM and PM travel time RMSE values reported to
OUTDIRfeedbacklogprn
ndash Run stops when RMSE is less than 01
ndash 2010 Scenario converges in 5 loops
bull What to do if it didnrsquot converge ndash Look for obvious errors
ndash Run more iterations (future year might require more)
bull Are the top-level results comparable to a similar run ndash Use HEVAL reports
ndash Examine screenlines (RMSE reports)
ndash Spot check link loads
Tools for Analysis
bull Analysis ndash perform standard highway project type analyses
bull Usual analysis similar to trip-based model ndash Total daily and period-specific roadway volumes and speeds by
vehicle class
ndash Vehicle trip OD matrices
bull Standard FSUTMS HEVAL and RMSE reports are still available ndash Day and period assignments
ndash By County
ndash Truck assignment
Tools for Analysis
bull Potential for customized assignment classes to address
specific project questions ndash Does the manage lane serve primarily high income users
bull Stratify vehicle classes by lowhigh income to understand facility
usage by income level
bull Stratify vehicle classes by disadvantaged population cohorts
bull Trip and person tabulations built from ABM output ndash Trip mode shares for many different population cohorts subareas
ndash For example toll vs non-toll shares by value of time or fine-graded income levels
ndash Many other possibilities
Application 4 ndash Mobility Project
Mobility Project ndash SUNPASS Market Share
bull Persons in households that own a SUNPASS transponder respond differently to managed lane and toll road policies ndash Pay lower tolls than cash users
ndash Have access to I-95 managed lanes
bull Policy questions ndash How does projected toll traffic and revenue vary with the SUNPASS
penetration rate and toll discount
ndash How will SUNPASS penetration rate vary as more managed lane facilities are built in the region
Mobility Project ndash SUNPASS Market Share
bull Question 1 -- How does projected toll traffic and revenue vary with the SUNPASS penetration rate and toll discount
bull Procedure ndash Step1 ndash Assume a SUNPASS market share by modifying the toll
transponder model
ndash Step 2 ndash Run SERPM7 to produce traffic volumes
ndash Step 3 ndash Estimate toll traffic revenue
Modifying the Toll Transponder Ownership Model
bull Model specification is contained in TransponderOwnershipxls and can be edited with Microsoft Excel
Utility Variable Coefficient
Expected time savings up to 644 min 00631
Distance less than 5 miles -00304
Distance between 5 and 10 miles -00648
Distance 10 miles or more -00648
Constant 04877
Modifying the Toll Transponder Ownership Model
Utility Variable Coefficient
Expected time savings up to 644 min 00631
Distance less than 5 miles -00304
Distance between 5 and 10 miles -00648
Distance 10 miles or more -00648
Constant 04877
Increasing the constant will increase the number of households equipped with transponders
TransponderOwnershipxls
Modifying the Toll Transponder Model
bull Increase the constant by how much ndash Process is akin to model calibration
ndash Several runs of the transponder model required to estimate the constant that yields the desired market share
ndash 2010 market share is approximately 65
ndash Use a small sample (5 or 10) to save run-time while establishing the right constant
Modifying the Toll Transponder Model
bull Variation ndash Add terms to the model so that certain types of households are more
likely to exhibit a SUNPASS market share increase
bull Highlow income households
bull Multi-car households
bull Miami-Dade households
Modifying the Toll Transponder Model
bull Exhibit TransponderOwnershipxls
Mobility Project ndash SUNPASS Market Share
bull Question 2 -- How will SUNPASS penetration rate vary as more managed lane facilities are built in the region
bull Procedure ndash Step 1 ndash Code the manage lane facilities
ndash Step 2 ndash Run SERPM7 to forecast transponder ownership
ndash Step 3 ndash Analyze the forecast household data for changes in the profile of households equipped with transponders
Application 5 ndash Land Use Project
Land Use Project
bull Transportation projects comprise not only network scenarios but also land use scenarios
bull Land use scenarios can be ndash Very large scale (substantial changes to housing and employment
estimates throughout the region) or
ndash Small scale (localized changes for example for a traffic impact study)
bull For both large scale and small scale land use updates the
general procedure for updating the input data and running the model is the same
Land Use Project
bull The land use data in SERPM7 consists of ndash Synthetic population and derived input files
ndash Employment data
ndash School enrollment data
ndash Parking costs and parking spaces
ndash Regional shopping mall special generators
ndash Beach special generators
ndash Hotel and motel room data
Land Use Project
bull The land use data reside in different input files
Data Item Input File
Synthetic Population hhFilecsv personFilecsv ctramppopsynTAZDatacsv ctramppopsynMAZDatacsv
Employment School Enrollment Parking Supply Data Special Generators Hotel and Motel Rooms
inputsIN-2010Rmaz_datacsv
Land Use Project
bull As demonstrated earlier SERPM 7 requires significantly more comprehensive socio-economic inputs as compared to previous versions ndash Greater spatial detail
ndash More categoriestypes of land uses
bull These inputs require additional preparation when
performing land use model runs
Land Use Project
Data Required and examples bull Population
bull Age distribution of the population expected to live in the
development
bull Income profile
bull Type of dwelling unit (single-family vs multi-family)
ndash The input data need to be internally consistent (distribution of households by presence of children needs to be consistent with population age distribution for example)
Land Use Project
Data Required bull Employment classification ndash Previous models had three
employment classifications
ndash In SERPM 7 there are 16 employment categories to better differentiate type of land use and improve the relationship between land use and activity purpose
Land Use Project
Data Required bull School enrollment ndash note that it differentiates by grade level
(K-8 high-school collegepost-secondary) ndash Donrsquot forget to include school faculty and staff in employment
Land Use Project
Data Required bull Parking supply and
parking costs ndash Parking spaces may
reflect use restrictions
bull Monthly
bull Daily
bull Hourly
ndash Parking costs consistent with type of use
Land Use Project
bull Park Area 1 (pink) ndash May park in MAZ other
than destination MAZ
ndash Parking cost applies
bull Park Area 2 (gree) ndash Parks at destination MAZ
ndash Parking cost applies
Land Use Project
Data Required bull Visitor Model ndash Number of hotel and motel rooms
bull Special Generators ndash Regional shopping malls
ndash Beach recreation areas
Land Use Project
The Gardens Mall Aventura Mall
Boynton Mall Dolphin Mall
Delray Community Mall Dadeland Mall
Towncenter Mall The Falls Shopping Center
Wellington Greens Mall Cutler Ridge Mall
Coral Square Mall Bal Harbour Shops
Pompano Citi Centre CocoWalk
Sawgrass Mills Mall The Mall at 163rd Street
Broward Mall Mall of the Americas
Galleria Mall Mary Brickell Village
Pembroke Lakes Mall Miami International Mall
Lakes Mall Miracle Marketplace
Oakwood Plaza Village of Merrick Park
The Promenade at Coconut Creek Westland Mall
Regional Shopping Mall Special Generators
Land Use Project
Deerfield Beach
Pompano Beach
Fort Lauderdale Beach
Fort Lauderdale Beach
Hollywood Beach
South Beach
Haulover Beach
Crandon Park
Dania Beach
Bill Baggs State Park
Beach Special Generators
Land Use Project
Sample Problem
bull MINTO West Example - a mixed residentialcommercial development ndash 6500 singlemulti-family residential units in multiple TAZs
ndash 14 million square feet of non-residential space
ndash 150 room hotel
ndash 3000 student college campus
Land Use Project
MINTO WEST
Land Use Project
TAZsMAZs representing MINTO West Development
Land Use Project
Need to translate population household and employment information from developer into model input data ndash As discussed in the Population Synthesis presentation population and
household attribute estimates can be taken from other known nearby neighborhoods
bull In this sample problem first start by allocating percentages of total
households into individual MAZs within the development area
bull Keep in mind household density when estimating the number of
households in each MAZ
Land Use Project
bull In this sample employment can be assumed to include bull Retail
bull RestaurantsBars
bull Offices
bull Health services
bull Hotelmotel employment and
bull Educational employment
ndash As with households yoursquoll need to apportion the employment areas to individual MAZs while keeping in mind the types of employment expected in those locations
Land Use Project
bull Employment data is usually estimated by converting floor space available to individual types of employment through conversion factors
bull ie ndash (3000 sqft office space)(20 sqft per office employee) =
150 office employees
Land Use Project
bull Once population household and employment figures are estimated they are entered into the appropriate model input file
bull Population ndash TAZ synthetic population control file
bull Household ndash TAZ synthetic population control file
bull Employment School Parking and Special Gen ndash maz_datacsv
bull Ensure that population household and employment figures
are the same in each file
bull Prior to performing model run PopSyn must be run and user must copy output files to SERPM7 input folders
Application 6 ndashTransit Project
Transit Project ndash MetroRail North Corridor
SERPM Transit Modes
Transit Mode Tour and Trip
Mode TAP Transit Skim Mode
Tri-Rail Commuter Rail Premium
Metrorail Urban Rail Premium
I-95 Inter-County Express I-95X I-95E
Express Bus Premium
Busway BRT Premium
MDT Express Express Bus Premium
Metromover Local Bus Local Bus
MDT Local BCT Local
Palm Tran Local Local Bus Local Bus
Breeze Local Bus Local Bus
Tri-Rail Shuttles Local Bus Local Bus
SERPM Transit Modes
Transit Mode Tour and Trip
Mode TAP Transit Skim
Mode
Mode coded on the route ldquocardsrdquo
Used to specify boarding and transfer penalties for transit
path building
(most disaggregate)
Line-haul choices in the tour and trip mode choice
models
Used to create sets of TAP to TAP levels of service
(most aggregate)
Similar to SERPM 67 SERPM 7 ABM
SERPM Transit Modes S67 Mode Local (L) S7
Mode Mode Name Operator amp Name UserA4 Name Prem (P) MODE
15 Tri-Rail 11 Tri-Rail 15 Commuter P 111
14 Metrorail 25 Metrorail 14 Urban Rail P 121
X Regional LRT Regional LRT 14 LRT P 131
16 Inter-County Express Bus 33 I-95 Inter-County Express 16 Express P 151
12 Exclusive ROW Cir-Reg 13 Exclusive ROW Cir-Reg 12 Mover L 181
11 TrolleysShuttles-Reg 12 Tri-Rail Shuttles 11 Local L 191
11 TrolleysShuttles-Reg 12 Tri-Rail Shuttles 33 Local L 192
X LRT- MDT 25 MDT LRT 14 LRT P 231
16 Buses (localexpress) - MDT 27 MDT Busway Flyers 27 BRT P 241
23 Buses (localexpress) - MDT 27 MDT MAXKATBusway Local 27 BRT P 242
24 BRT - MDT 28 MDT BRTLRT 28 BRT P 243
23 Buses (localexpress) - MDT 22 MDT Express 24 Express P 251
16 Buses (localexpress) - MDT 24 MDT I-95 Exp 26 Express P 252
16 Inter-County Express Bus 24 I-95 Inter-County Express 16 Express P 253
22 Exclusive ROW Cir-MDT 26 Metromover 22 Mover L 281
21 TrolleysShuttles-MDT 21 MDT TrolleysShuttles 21 Local L 291
23 Buses (localexpress) - MDT 21 MDT Local 23 Local L 292
23 Buses (localexpress) - MDT 23 MDT Shuttle 25 Local L 293
X LRT - BCT 35 BCT LRT 37 LRT P 331
34 BCT Rapid Bus BRT 34 BCT Rapid Bus 36 BRT P 341
34 BCT Fixed-guideway BRT 35 BCT BRT 37 BRT P 342
33 Buses (localexpress) - BCT 32 BCT Breeze 34 Express P 351
33 Buses (localexpress) - BCT 33 BCT Express 35 Express P 352
32 Exclusive ROW Cir-BCT 31 BCT Exclusive ROW Cir 32 Mover L 381
31 TrolleysShuttles-BCT 31 BCT TrolleysShuttles 31 Local L 393
33 Buses (localexpress) - BCT 31 BCT Local 27 Local L 391
33 Buses (localexpress) - BCT 31 BCT Local 33 Local L 392
X LRT - Palm Tran 43 Palm Tran LRT 44 LRT P 431
44 BRT - Palm Tran 43 Palm Tran BRT 44 BRT P 441
43 Buses (localexpress) - Ptran 42 Palm Tran Exp 44 Express P 451
42 Exclusive ROW Cir-PTran 41 Palm Tran Exclusive ROW Cir 42 Mover L 481
41 TrolleysShuttles-Ptran 41 Palm Tran TrolleysShuttles 41 Local L 491
43 Buses (localexpress) - Ptran 41 Palm Tran Local 43 Local L 492
Modes Not in the 2010 Network
SERPM7 Transit Network Building
bull Typically bus routes are coded on top of existing highway links
bull SERPM7 reserves some facility type codes for transit-only use helpful to more accurately represent route ndash Caution -- make sure network integrity is preserved once transit only
links are removed
bull Rail routes require coding first fixed-guideway links
SERPM7 Transit Network Building
bull Route Attributes -- User Coded ndash Name
ndash Long Name
ndash Mode
ndash Operator
ndash Headway[1] ndash AM Peak
ndash Headway[2] ndash Midday
ndash Headway[3] ndash PM Peak
ndash UserA4 (stop dwell time)
SERPM7 Transit Network Building
bull PNR Node Attributes ndash User Coded ndash Parking Spaces
ndash Parking Cost AM
ndash Parking Cost MD
ndash Terminal Time PNR
ndash Terminal Time KNR
bull At this time parking spaces is used only to identify park-n-ride locations (parking spaces gt 0)
SERPM7 Transit Network Building
bull Transit Access Points -- Created by Cube for the ABM ndash One TAP for each stop on premium routes
bull Tri-Rail Metrorail Express Bus BRT
ndash One TAP for each Local Bus park-n-ride node
ndash Synthesized TAPs to represent access to local bus stops
bull Transit Access Point Attributes ndash TAP Mode
ndash Inherit PNR node data
Sample Highway Network with TAPs
TAPs become part of the highway network and replace the TAZ centroids when building transit skims
Transit Access Points and ldquoon the flyrdquo Path Building
bull Transit skims are built TAP to TAP
Matrix origins and destinations are TAPS
Transit Access Points and ldquoon the flyrdquo Path Building
Trip Origins and
Destinations
MAZ to MAZ
Auto Skims
TAZ to TAZ
Transit Skims
TAP to TAP
The three spatial systems are put together by the mode choice model
ldquoOn the Flyrdquo Path Building
bull TAZs TAPs and MAZs are linked via drive and access connectors prior to running CT-RAMP
rmdir OUTDIRABMTEMP S Q rmdir DATADIRABMTEMP S Q xcopy OUTDIR OUTDIRABMTEMP E I Y xcopy DATADIR DATADIRABMTEMP E I Y if(fbi=1) need to run only the first time through - kdk CUBEctramprunCreateAccessFilescmd endif mkdir logFiles taskkill im javaexe F start CUBEctramprunHhMgrcmd JDK64 HOST_IP start CUBEctramprunMtxMgrcmd HOST_IP JDK64 rem start CUBEctrampconfigrunDrivercmd copy CUBEctrampserpm_abmproperties serpm_abmproperties Y ping -n 11 127001 gt nul CUBEctramprunSERPMAbmcmd SAMPLERATE VSAMPLERATE JDK64 CUBEctramprunCreateDemandMatricescmd SAMPLERATE VSAMPLERATE JDK64 taskkill im javaexe F rmdir OUTDIRctramp S Q rmdir DATADIRctramp S Q xcopy OUTDIRABMTEMPctramp OUTDIRctramp E I Y xcopy DATADIRABMTEMPctramp DATADIRctramp E I Y
ldquoOn the Flyrdquo Path Building
MAZ to MAZ Connectors
Created by finding shortest distance paths over an all-streets network Connects all MAZs within 15 mi
Used to represent walk mode distance and time
MAZ to TAP Connectors
Created by finding shortest distance paths over an all-streets network Connects each MAZ to all TAPs within 10 mi
Used to represent transit walk access and walk egress distance and time
TAZ to TAP Connectors
Connects each TAZ to all TAPs within the TAP maximum drive distance bull Bus TAPs ndash 4 miles bull Rail TAPs ndash 15 miles
Used to represent transit drive access and egress distance and time
ldquoOn the Flyrdquo Path Building
bull No actual links created on the network bull Connectivity is expressed in table format
ldquoOn the Flyrdquo Path Building
bull Once the access and walk connectors are created the mode choice model builds complete paths MAZ to MAZ transit paths
bull Local-only paths are built using the ldquolocalrdquo transit skim bull Express BRT Urban Rail and Commuter rail paths are all
built at the same time using the ldquopremiumrdquo transit skim bull For each MAZ to MAZ pair CT-RAMP keeps the shortest
generalized cost path for each available premium mode bull Even though only one ldquopremiumrdquo skim is built CT-RAMP
may find competing premium paths It may also find that the best path is a combination of two premium modes or a premium mode and local bus
Tour Mode Choice Model
Choice
Auto
Drive alone
GP(1)
Pay(2)
Shared ride 2
GP(3)
HOV(4)
Pay(5)
Shared ride 3+
GP(6)
HOV(7)
Pay(8)
Non-motorized
Walk(9)
Bike(10)
Transit
Walk access
Local bus(11)
Express bus(12)
BRT(13)
Urban rail(14)
Commuter rail(15)
PNR access
Local bus(16)
Express bus(17)
BRT(18)
Urban rail(19)
Commuter rail(20)
KNR access
Local bus(21)
Express bus(22)
BRT(23)
Urban rail(24)
Commuter rail(25)
School Bus(26)
Trip Mode Choice Model
bull Same nesting structure as the tour mode choice but conditional on the tour mode
bull Some trip modes may be unavailable depending on the tour mode
DA SR2 SR3+ Walk Wlk-Trn PNR-Trn KNR-Trn
DA Must - - - - - -
SR2 Can Can - Can - - -
SR3+ Can Can Can Can - - -
Walk - - - Must - - -
Wlk-Trn - Can Can Can Can - -
PNR-Trn Can Can Can Can Can Can
KNR-Trn - Can Can Can Can - Can
Trip Switching Rules Simplified
Transit Trip Reporting
bull In SERPM7 the transit boarding and alighting location can be reported in two ways ndash Trip list files (ABM output) -- Boarding TAP Alighting TAP
ndash Transit assignment (Cube output) ndash Route nodes
bull Each type of reporting has its strengths ndash Trip list file allows building detailed transit trip patterns for
population cohorts and time periods
bull Mode split reports
bull Transit trip distance frequency distributions access distance TLFDs
bull Mode to mode transfers
ndash Note ABM reports only the first boarding TAP and the last alighting TAP regardless of mode
ndash Cube output gives aggregate link volumes station to station boardings etc
User Benefit Files
bull SERPM7 can produce FTA User Benefit files for input to SUMMIT
bull User benefits remain a useful analysis tool bull Steps to produce user benefit files require some manual
intervention ndash see User Guide
SERPM ABM Reports
bull Stores ABM inputs and outputs in a relational database to generate some standard model reports
bull Consistent reporting framework to be used for analysis across model runs
bull SERPM7 user community can easily share the scripts that create the reports
bull Reports take the form of Excel workbooks bull Foundation for future development of a visualization
dashboard
Reporting Database Components
Reporting Database Components
bull Reporting ETL (extract transform and load) program ndash Loads all Cube and CT-RAMP Java model outputs into the database
ndash Written in Cube scripts and Java
bull Database ndash Stores all data used in reporting including select network skims
household person tour and trip data zonal data etc
ndash Implemented with SQL Server
bull Report scripts to generate reports ndash Written in T-SQL
bull Report packaging program ndash Generates Excel workbooks with one report per worksheet
ndash Written in Java
Reporting Database Components
bull Run time required to build database and generate reports varies with sample size and type of report ndash Several hours required to build the database for a 100 sample
ndash ~ 30 minutes to produce reports for a 10 sample
bull Report step is optional not part of a standard model run bull Report production is transparent to the user
bull hellip but users can contribute reports bull hellip and choose which reports to build at any one time
Running SERPM ABM Reports
bull Report queries reside in ctrampreports_sql time_spent_travelingsql Total weekday travel time by person type
and income group
total_trips_typesql Trips by trip mode person type county of residence and tour purpose
total_tours_typesql Tours by trip mode person type county of residence and tour purpose
tours_districtssql Tours by tour purpose and tour origin and destination districts
transit_access_time+distsql Drive to transit trip list with many trip details
hellip
Running SERPM ABM Reports
bull List of reports to run is specified in properties file ndash ctrampserpm_reportsproperties
sqlscriptsdirectory = Cserpm7ctrampreports_sql sqlscriptsschemakey = SCHEMA sqlscripts=cleanupsqltransit_access_time+distsql worksheettables=temptransittrips worksheetnames=TransitTrips workbookname = Cserpm7ctrampreports_sqlSERPM_REPORTXLS databaseschema = 2010R databaseipaddress = w-ampdx-d-sag10 databaseinstance = databaseport = 1433 databasename=SERPMABM databaseusername=serpm databasepassword=s3rpm
Adding Reports
bull Step 1 --Write report query ndash T-SQL
ndash User Guide includes a database data dictionary
bull Step 2 ndash Add query to ctrampreports_sql ndash Each query is contained in a single text file
ndash Drop file in reports folder
bull Step 3 ndash Add the query to the properties file sqlquery = Query file name
Worksheettables = Query output
Worksheetnames = Name for the report worksheet
Sample SERPM ABM Reports
bull Exhibit ctrampreports_sqlserpm_reportsxls
More information Shi-Chiang Li | shi-chianglidotstateflus |954 777 4655 Rosella Picado | picadopbworldcom | 206 382 5227 Ken Kaltenbach |kkaltenbachcorradinocom |502 587 7221

Tools for Analysis
bull Potential for customized assignment classes to address
specific project questions ndash Does the manage lane serve primarily high income users
bull Stratify vehicle classes by lowhigh income to understand facility
usage by income level
bull Stratify vehicle classes by disadvantaged population cohorts
bull Trip and person tabulations built from ABM output ndash Trip mode shares for many different population cohorts subareas
ndash For example toll vs non-toll shares by value of time or fine-graded income levels
ndash Many other possibilities
Application 4 ndash Mobility Project
Mobility Project ndash SUNPASS Market Share
bull Persons in households that own a SUNPASS transponder respond differently to managed lane and toll road policies ndash Pay lower tolls than cash users
ndash Have access to I-95 managed lanes
bull Policy questions ndash How does projected toll traffic and revenue vary with the SUNPASS
penetration rate and toll discount
ndash How will SUNPASS penetration rate vary as more managed lane facilities are built in the region
Mobility Project ndash SUNPASS Market Share
bull Question 1 -- How does projected toll traffic and revenue vary with the SUNPASS penetration rate and toll discount
bull Procedure ndash Step1 ndash Assume a SUNPASS market share by modifying the toll
transponder model
ndash Step 2 ndash Run SERPM7 to produce traffic volumes
ndash Step 3 ndash Estimate toll traffic revenue
Modifying the Toll Transponder Ownership Model
bull Model specification is contained in TransponderOwnershipxls and can be edited with Microsoft Excel
Utility Variable Coefficient
Expected time savings up to 644 min 00631
Distance less than 5 miles -00304
Distance between 5 and 10 miles -00648
Distance 10 miles or more -00648
Constant 04877
Modifying the Toll Transponder Ownership Model
Utility Variable Coefficient
Expected time savings up to 644 min 00631
Distance less than 5 miles -00304
Distance between 5 and 10 miles -00648
Distance 10 miles or more -00648
Constant 04877
Increasing the constant will increase the number of households equipped with transponders
TransponderOwnershipxls
Modifying the Toll Transponder Model
bull Increase the constant by how much ndash Process is akin to model calibration
ndash Several runs of the transponder model required to estimate the constant that yields the desired market share
ndash 2010 market share is approximately 65
ndash Use a small sample (5 or 10) to save run-time while establishing the right constant
Modifying the Toll Transponder Model
bull Variation ndash Add terms to the model so that certain types of households are more
likely to exhibit a SUNPASS market share increase
bull Highlow income households
bull Multi-car households
bull Miami-Dade households
Modifying the Toll Transponder Model
bull Exhibit TransponderOwnershipxls
Mobility Project ndash SUNPASS Market Share
bull Question 2 -- How will SUNPASS penetration rate vary as more managed lane facilities are built in the region
bull Procedure ndash Step 1 ndash Code the manage lane facilities
ndash Step 2 ndash Run SERPM7 to forecast transponder ownership
ndash Step 3 ndash Analyze the forecast household data for changes in the profile of households equipped with transponders
Application 5 ndash Land Use Project
Land Use Project
bull Transportation projects comprise not only network scenarios but also land use scenarios
bull Land use scenarios can be ndash Very large scale (substantial changes to housing and employment
estimates throughout the region) or
ndash Small scale (localized changes for example for a traffic impact study)
bull For both large scale and small scale land use updates the
general procedure for updating the input data and running the model is the same
Land Use Project
bull The land use data in SERPM7 consists of ndash Synthetic population and derived input files
ndash Employment data
ndash School enrollment data
ndash Parking costs and parking spaces
ndash Regional shopping mall special generators
ndash Beach special generators
ndash Hotel and motel room data
Land Use Project
bull The land use data reside in different input files
Data Item Input File
Synthetic Population hhFilecsv personFilecsv ctramppopsynTAZDatacsv ctramppopsynMAZDatacsv
Employment School Enrollment Parking Supply Data Special Generators Hotel and Motel Rooms
inputsIN-2010Rmaz_datacsv
Land Use Project
bull As demonstrated earlier SERPM 7 requires significantly more comprehensive socio-economic inputs as compared to previous versions ndash Greater spatial detail
ndash More categoriestypes of land uses
bull These inputs require additional preparation when
performing land use model runs
Land Use Project
Data Required and examples bull Population
bull Age distribution of the population expected to live in the
development
bull Income profile
bull Type of dwelling unit (single-family vs multi-family)
ndash The input data need to be internally consistent (distribution of households by presence of children needs to be consistent with population age distribution for example)
Land Use Project
Data Required bull Employment classification ndash Previous models had three
employment classifications
ndash In SERPM 7 there are 16 employment categories to better differentiate type of land use and improve the relationship between land use and activity purpose
Land Use Project
Data Required bull School enrollment ndash note that it differentiates by grade level
(K-8 high-school collegepost-secondary) ndash Donrsquot forget to include school faculty and staff in employment
Land Use Project
Data Required bull Parking supply and
parking costs ndash Parking spaces may
reflect use restrictions
bull Monthly
bull Daily
bull Hourly
ndash Parking costs consistent with type of use
Land Use Project
bull Park Area 1 (pink) ndash May park in MAZ other
than destination MAZ
ndash Parking cost applies
bull Park Area 2 (gree) ndash Parks at destination MAZ
ndash Parking cost applies
Land Use Project
Data Required bull Visitor Model ndash Number of hotel and motel rooms
bull Special Generators ndash Regional shopping malls
ndash Beach recreation areas
Land Use Project
The Gardens Mall Aventura Mall
Boynton Mall Dolphin Mall
Delray Community Mall Dadeland Mall
Towncenter Mall The Falls Shopping Center
Wellington Greens Mall Cutler Ridge Mall
Coral Square Mall Bal Harbour Shops
Pompano Citi Centre CocoWalk
Sawgrass Mills Mall The Mall at 163rd Street
Broward Mall Mall of the Americas
Galleria Mall Mary Brickell Village
Pembroke Lakes Mall Miami International Mall
Lakes Mall Miracle Marketplace
Oakwood Plaza Village of Merrick Park
The Promenade at Coconut Creek Westland Mall
Regional Shopping Mall Special Generators
Land Use Project
Deerfield Beach
Pompano Beach
Fort Lauderdale Beach
Fort Lauderdale Beach
Hollywood Beach
South Beach
Haulover Beach
Crandon Park
Dania Beach
Bill Baggs State Park
Beach Special Generators
Land Use Project
Sample Problem
bull MINTO West Example - a mixed residentialcommercial development ndash 6500 singlemulti-family residential units in multiple TAZs
ndash 14 million square feet of non-residential space
ndash 150 room hotel
ndash 3000 student college campus
Land Use Project
MINTO WEST
Land Use Project
TAZsMAZs representing MINTO West Development
Land Use Project
Need to translate population household and employment information from developer into model input data ndash As discussed in the Population Synthesis presentation population and
household attribute estimates can be taken from other known nearby neighborhoods
bull In this sample problem first start by allocating percentages of total
households into individual MAZs within the development area
bull Keep in mind household density when estimating the number of
households in each MAZ
Land Use Project
bull In this sample employment can be assumed to include bull Retail
bull RestaurantsBars
bull Offices
bull Health services
bull Hotelmotel employment and
bull Educational employment
ndash As with households yoursquoll need to apportion the employment areas to individual MAZs while keeping in mind the types of employment expected in those locations
Land Use Project
bull Employment data is usually estimated by converting floor space available to individual types of employment through conversion factors
bull ie ndash (3000 sqft office space)(20 sqft per office employee) =
150 office employees
Land Use Project
bull Once population household and employment figures are estimated they are entered into the appropriate model input file
bull Population ndash TAZ synthetic population control file
bull Household ndash TAZ synthetic population control file
bull Employment School Parking and Special Gen ndash maz_datacsv
bull Ensure that population household and employment figures
are the same in each file
bull Prior to performing model run PopSyn must be run and user must copy output files to SERPM7 input folders
Application 6 ndashTransit Project
Transit Project ndash MetroRail North Corridor
SERPM Transit Modes
Transit Mode Tour and Trip
Mode TAP Transit Skim Mode
Tri-Rail Commuter Rail Premium
Metrorail Urban Rail Premium
I-95 Inter-County Express I-95X I-95E
Express Bus Premium
Busway BRT Premium
MDT Express Express Bus Premium
Metromover Local Bus Local Bus
MDT Local BCT Local
Palm Tran Local Local Bus Local Bus
Breeze Local Bus Local Bus
Tri-Rail Shuttles Local Bus Local Bus
SERPM Transit Modes
Transit Mode Tour and Trip
Mode TAP Transit Skim
Mode
Mode coded on the route ldquocardsrdquo
Used to specify boarding and transfer penalties for transit
path building
(most disaggregate)
Line-haul choices in the tour and trip mode choice
models
Used to create sets of TAP to TAP levels of service
(most aggregate)
Similar to SERPM 67 SERPM 7 ABM
SERPM Transit Modes S67 Mode Local (L) S7
Mode Mode Name Operator amp Name UserA4 Name Prem (P) MODE
15 Tri-Rail 11 Tri-Rail 15 Commuter P 111
14 Metrorail 25 Metrorail 14 Urban Rail P 121
X Regional LRT Regional LRT 14 LRT P 131
16 Inter-County Express Bus 33 I-95 Inter-County Express 16 Express P 151
12 Exclusive ROW Cir-Reg 13 Exclusive ROW Cir-Reg 12 Mover L 181
11 TrolleysShuttles-Reg 12 Tri-Rail Shuttles 11 Local L 191
11 TrolleysShuttles-Reg 12 Tri-Rail Shuttles 33 Local L 192
X LRT- MDT 25 MDT LRT 14 LRT P 231
16 Buses (localexpress) - MDT 27 MDT Busway Flyers 27 BRT P 241
23 Buses (localexpress) - MDT 27 MDT MAXKATBusway Local 27 BRT P 242
24 BRT - MDT 28 MDT BRTLRT 28 BRT P 243
23 Buses (localexpress) - MDT 22 MDT Express 24 Express P 251
16 Buses (localexpress) - MDT 24 MDT I-95 Exp 26 Express P 252
16 Inter-County Express Bus 24 I-95 Inter-County Express 16 Express P 253
22 Exclusive ROW Cir-MDT 26 Metromover 22 Mover L 281
21 TrolleysShuttles-MDT 21 MDT TrolleysShuttles 21 Local L 291
23 Buses (localexpress) - MDT 21 MDT Local 23 Local L 292
23 Buses (localexpress) - MDT 23 MDT Shuttle 25 Local L 293
X LRT - BCT 35 BCT LRT 37 LRT P 331
34 BCT Rapid Bus BRT 34 BCT Rapid Bus 36 BRT P 341
34 BCT Fixed-guideway BRT 35 BCT BRT 37 BRT P 342
33 Buses (localexpress) - BCT 32 BCT Breeze 34 Express P 351
33 Buses (localexpress) - BCT 33 BCT Express 35 Express P 352
32 Exclusive ROW Cir-BCT 31 BCT Exclusive ROW Cir 32 Mover L 381
31 TrolleysShuttles-BCT 31 BCT TrolleysShuttles 31 Local L 393
33 Buses (localexpress) - BCT 31 BCT Local 27 Local L 391
33 Buses (localexpress) - BCT 31 BCT Local 33 Local L 392
X LRT - Palm Tran 43 Palm Tran LRT 44 LRT P 431
44 BRT - Palm Tran 43 Palm Tran BRT 44 BRT P 441
43 Buses (localexpress) - Ptran 42 Palm Tran Exp 44 Express P 451
42 Exclusive ROW Cir-PTran 41 Palm Tran Exclusive ROW Cir 42 Mover L 481
41 TrolleysShuttles-Ptran 41 Palm Tran TrolleysShuttles 41 Local L 491
43 Buses (localexpress) - Ptran 41 Palm Tran Local 43 Local L 492
Modes Not in the 2010 Network
SERPM7 Transit Network Building
bull Typically bus routes are coded on top of existing highway links
bull SERPM7 reserves some facility type codes for transit-only use helpful to more accurately represent route ndash Caution -- make sure network integrity is preserved once transit only
links are removed
bull Rail routes require coding first fixed-guideway links
SERPM7 Transit Network Building
bull Route Attributes -- User Coded ndash Name
ndash Long Name
ndash Mode
ndash Operator
ndash Headway[1] ndash AM Peak
ndash Headway[2] ndash Midday
ndash Headway[3] ndash PM Peak
ndash UserA4 (stop dwell time)
SERPM7 Transit Network Building
bull PNR Node Attributes ndash User Coded ndash Parking Spaces
ndash Parking Cost AM
ndash Parking Cost MD
ndash Terminal Time PNR
ndash Terminal Time KNR
bull At this time parking spaces is used only to identify park-n-ride locations (parking spaces gt 0)
SERPM7 Transit Network Building
bull Transit Access Points -- Created by Cube for the ABM ndash One TAP for each stop on premium routes
bull Tri-Rail Metrorail Express Bus BRT
ndash One TAP for each Local Bus park-n-ride node
ndash Synthesized TAPs to represent access to local bus stops
bull Transit Access Point Attributes ndash TAP Mode
ndash Inherit PNR node data
Sample Highway Network with TAPs
TAPs become part of the highway network and replace the TAZ centroids when building transit skims
Transit Access Points and ldquoon the flyrdquo Path Building
bull Transit skims are built TAP to TAP
Matrix origins and destinations are TAPS
Transit Access Points and ldquoon the flyrdquo Path Building
Trip Origins and
Destinations
MAZ to MAZ
Auto Skims
TAZ to TAZ
Transit Skims
TAP to TAP
The three spatial systems are put together by the mode choice model
ldquoOn the Flyrdquo Path Building
bull TAZs TAPs and MAZs are linked via drive and access connectors prior to running CT-RAMP
rmdir OUTDIRABMTEMP S Q rmdir DATADIRABMTEMP S Q xcopy OUTDIR OUTDIRABMTEMP E I Y xcopy DATADIR DATADIRABMTEMP E I Y if(fbi=1) need to run only the first time through - kdk CUBEctramprunCreateAccessFilescmd endif mkdir logFiles taskkill im javaexe F start CUBEctramprunHhMgrcmd JDK64 HOST_IP start CUBEctramprunMtxMgrcmd HOST_IP JDK64 rem start CUBEctrampconfigrunDrivercmd copy CUBEctrampserpm_abmproperties serpm_abmproperties Y ping -n 11 127001 gt nul CUBEctramprunSERPMAbmcmd SAMPLERATE VSAMPLERATE JDK64 CUBEctramprunCreateDemandMatricescmd SAMPLERATE VSAMPLERATE JDK64 taskkill im javaexe F rmdir OUTDIRctramp S Q rmdir DATADIRctramp S Q xcopy OUTDIRABMTEMPctramp OUTDIRctramp E I Y xcopy DATADIRABMTEMPctramp DATADIRctramp E I Y
ldquoOn the Flyrdquo Path Building
MAZ to MAZ Connectors
Created by finding shortest distance paths over an all-streets network Connects all MAZs within 15 mi
Used to represent walk mode distance and time
MAZ to TAP Connectors
Created by finding shortest distance paths over an all-streets network Connects each MAZ to all TAPs within 10 mi
Used to represent transit walk access and walk egress distance and time
TAZ to TAP Connectors
Connects each TAZ to all TAPs within the TAP maximum drive distance bull Bus TAPs ndash 4 miles bull Rail TAPs ndash 15 miles
Used to represent transit drive access and egress distance and time
ldquoOn the Flyrdquo Path Building
bull No actual links created on the network bull Connectivity is expressed in table format
ldquoOn the Flyrdquo Path Building
bull Once the access and walk connectors are created the mode choice model builds complete paths MAZ to MAZ transit paths
bull Local-only paths are built using the ldquolocalrdquo transit skim bull Express BRT Urban Rail and Commuter rail paths are all
built at the same time using the ldquopremiumrdquo transit skim bull For each MAZ to MAZ pair CT-RAMP keeps the shortest
generalized cost path for each available premium mode bull Even though only one ldquopremiumrdquo skim is built CT-RAMP
may find competing premium paths It may also find that the best path is a combination of two premium modes or a premium mode and local bus
Tour Mode Choice Model
Choice
Auto
Drive alone
GP(1)
Pay(2)
Shared ride 2
GP(3)
HOV(4)
Pay(5)
Shared ride 3+
GP(6)
HOV(7)
Pay(8)
Non-motorized
Walk(9)
Bike(10)
Transit
Walk access
Local bus(11)
Express bus(12)
BRT(13)
Urban rail(14)
Commuter rail(15)
PNR access
Local bus(16)
Express bus(17)
BRT(18)
Urban rail(19)
Commuter rail(20)
KNR access
Local bus(21)
Express bus(22)
BRT(23)
Urban rail(24)
Commuter rail(25)
School Bus(26)
Trip Mode Choice Model
bull Same nesting structure as the tour mode choice but conditional on the tour mode
bull Some trip modes may be unavailable depending on the tour mode
DA SR2 SR3+ Walk Wlk-Trn PNR-Trn KNR-Trn
DA Must - - - - - -
SR2 Can Can - Can - - -
SR3+ Can Can Can Can - - -
Walk - - - Must - - -
Wlk-Trn - Can Can Can Can - -
PNR-Trn Can Can Can Can Can Can
KNR-Trn - Can Can Can Can - Can
Trip Switching Rules Simplified
Transit Trip Reporting
bull In SERPM7 the transit boarding and alighting location can be reported in two ways ndash Trip list files (ABM output) -- Boarding TAP Alighting TAP
ndash Transit assignment (Cube output) ndash Route nodes
bull Each type of reporting has its strengths ndash Trip list file allows building detailed transit trip patterns for
population cohorts and time periods
bull Mode split reports
bull Transit trip distance frequency distributions access distance TLFDs
bull Mode to mode transfers
ndash Note ABM reports only the first boarding TAP and the last alighting TAP regardless of mode
ndash Cube output gives aggregate link volumes station to station boardings etc
User Benefit Files
bull SERPM7 can produce FTA User Benefit files for input to SUMMIT
bull User benefits remain a useful analysis tool bull Steps to produce user benefit files require some manual
intervention ndash see User Guide
SERPM ABM Reports
bull Stores ABM inputs and outputs in a relational database to generate some standard model reports
bull Consistent reporting framework to be used for analysis across model runs
bull SERPM7 user community can easily share the scripts that create the reports
bull Reports take the form of Excel workbooks bull Foundation for future development of a visualization
dashboard
Reporting Database Components
Reporting Database Components
bull Reporting ETL (extract transform and load) program ndash Loads all Cube and CT-RAMP Java model outputs into the database
ndash Written in Cube scripts and Java
bull Database ndash Stores all data used in reporting including select network skims
household person tour and trip data zonal data etc
ndash Implemented with SQL Server
bull Report scripts to generate reports ndash Written in T-SQL
bull Report packaging program ndash Generates Excel workbooks with one report per worksheet
ndash Written in Java
Reporting Database Components
bull Run time required to build database and generate reports varies with sample size and type of report ndash Several hours required to build the database for a 100 sample
ndash ~ 30 minutes to produce reports for a 10 sample
bull Report step is optional not part of a standard model run bull Report production is transparent to the user
bull hellip but users can contribute reports bull hellip and choose which reports to build at any one time
Running SERPM ABM Reports
bull Report queries reside in ctrampreports_sql time_spent_travelingsql Total weekday travel time by person type
and income group
total_trips_typesql Trips by trip mode person type county of residence and tour purpose
total_tours_typesql Tours by trip mode person type county of residence and tour purpose
tours_districtssql Tours by tour purpose and tour origin and destination districts
transit_access_time+distsql Drive to transit trip list with many trip details
hellip
Running SERPM ABM Reports
bull List of reports to run is specified in properties file ndash ctrampserpm_reportsproperties
sqlscriptsdirectory = Cserpm7ctrampreports_sql sqlscriptsschemakey = SCHEMA sqlscripts=cleanupsqltransit_access_time+distsql worksheettables=temptransittrips worksheetnames=TransitTrips workbookname = Cserpm7ctrampreports_sqlSERPM_REPORTXLS databaseschema = 2010R databaseipaddress = w-ampdx-d-sag10 databaseinstance = databaseport = 1433 databasename=SERPMABM databaseusername=serpm databasepassword=s3rpm
Adding Reports
bull Step 1 --Write report query ndash T-SQL
ndash User Guide includes a database data dictionary
bull Step 2 ndash Add query to ctrampreports_sql ndash Each query is contained in a single text file
ndash Drop file in reports folder
bull Step 3 ndash Add the query to the properties file sqlquery = Query file name
Worksheettables = Query output
Worksheetnames = Name for the report worksheet
Sample SERPM ABM Reports
bull Exhibit ctrampreports_sqlserpm_reportsxls
More information Shi-Chiang Li | shi-chianglidotstateflus |954 777 4655 Rosella Picado | picadopbworldcom | 206 382 5227 Ken Kaltenbach |kkaltenbachcorradinocom |502 587 7221

Mobility Project ndash SUNPASS Market Share
bull Question 1 -- How does projected toll traffic and revenue vary with the SUNPASS penetration rate and toll discount
bull Procedure ndash Step1 ndash Assume a SUNPASS market share by modifying the toll
transponder model
ndash Step 2 ndash Run SERPM7 to produce traffic volumes
ndash Step 3 ndash Estimate toll traffic revenue
Modifying the Toll Transponder Ownership Model
bull Model specification is contained in TransponderOwnershipxls and can be edited with Microsoft Excel
Utility Variable Coefficient
Expected time savings up to 644 min 00631
Distance less than 5 miles -00304
Distance between 5 and 10 miles -00648
Distance 10 miles or more -00648
Constant 04877
Modifying the Toll Transponder Ownership Model
Utility Variable Coefficient
Expected time savings up to 644 min 00631
Distance less than 5 miles -00304
Distance between 5 and 10 miles -00648
Distance 10 miles or more -00648
Constant 04877
Increasing the constant will increase the number of households equipped with transponders
TransponderOwnershipxls
Modifying the Toll Transponder Model
bull Increase the constant by how much ndash Process is akin to model calibration
ndash Several runs of the transponder model required to estimate the constant that yields the desired market share
ndash 2010 market share is approximately 65
ndash Use a small sample (5 or 10) to save run-time while establishing the right constant
Modifying the Toll Transponder Model
bull Variation ndash Add terms to the model so that certain types of households are more
likely to exhibit a SUNPASS market share increase
bull Highlow income households
bull Multi-car households
bull Miami-Dade households
Modifying the Toll Transponder Model
bull Exhibit TransponderOwnershipxls
Mobility Project ndash SUNPASS Market Share
bull Question 2 -- How will SUNPASS penetration rate vary as more managed lane facilities are built in the region
bull Procedure ndash Step 1 ndash Code the manage lane facilities
ndash Step 2 ndash Run SERPM7 to forecast transponder ownership
ndash Step 3 ndash Analyze the forecast household data for changes in the profile of households equipped with transponders
Application 5 ndash Land Use Project
Land Use Project
bull Transportation projects comprise not only network scenarios but also land use scenarios
bull Land use scenarios can be ndash Very large scale (substantial changes to housing and employment
estimates throughout the region) or
ndash Small scale (localized changes for example for a traffic impact study)
bull For both large scale and small scale land use updates the
general procedure for updating the input data and running the model is the same
Land Use Project
bull The land use data in SERPM7 consists of ndash Synthetic population and derived input files
ndash Employment data
ndash School enrollment data
ndash Parking costs and parking spaces
ndash Regional shopping mall special generators
ndash Beach special generators
ndash Hotel and motel room data
Land Use Project
bull The land use data reside in different input files
Data Item Input File
Synthetic Population hhFilecsv personFilecsv ctramppopsynTAZDatacsv ctramppopsynMAZDatacsv
Employment School Enrollment Parking Supply Data Special Generators Hotel and Motel Rooms
inputsIN-2010Rmaz_datacsv
Land Use Project
bull As demonstrated earlier SERPM 7 requires significantly more comprehensive socio-economic inputs as compared to previous versions ndash Greater spatial detail
ndash More categoriestypes of land uses
bull These inputs require additional preparation when
performing land use model runs
Land Use Project
Data Required and examples bull Population
bull Age distribution of the population expected to live in the
development
bull Income profile
bull Type of dwelling unit (single-family vs multi-family)
ndash The input data need to be internally consistent (distribution of households by presence of children needs to be consistent with population age distribution for example)
Land Use Project
Data Required bull Employment classification ndash Previous models had three
employment classifications
ndash In SERPM 7 there are 16 employment categories to better differentiate type of land use and improve the relationship between land use and activity purpose
Land Use Project
Data Required bull School enrollment ndash note that it differentiates by grade level
(K-8 high-school collegepost-secondary) ndash Donrsquot forget to include school faculty and staff in employment
Land Use Project
Data Required bull Parking supply and
parking costs ndash Parking spaces may
reflect use restrictions
bull Monthly
bull Daily
bull Hourly
ndash Parking costs consistent with type of use
Land Use Project
bull Park Area 1 (pink) ndash May park in MAZ other
than destination MAZ
ndash Parking cost applies
bull Park Area 2 (gree) ndash Parks at destination MAZ
ndash Parking cost applies
Land Use Project
Data Required bull Visitor Model ndash Number of hotel and motel rooms
bull Special Generators ndash Regional shopping malls
ndash Beach recreation areas
Land Use Project
The Gardens Mall Aventura Mall
Boynton Mall Dolphin Mall
Delray Community Mall Dadeland Mall
Towncenter Mall The Falls Shopping Center
Wellington Greens Mall Cutler Ridge Mall
Coral Square Mall Bal Harbour Shops
Pompano Citi Centre CocoWalk
Sawgrass Mills Mall The Mall at 163rd Street
Broward Mall Mall of the Americas
Galleria Mall Mary Brickell Village
Pembroke Lakes Mall Miami International Mall
Lakes Mall Miracle Marketplace
Oakwood Plaza Village of Merrick Park
The Promenade at Coconut Creek Westland Mall
Regional Shopping Mall Special Generators
Land Use Project
Deerfield Beach
Pompano Beach
Fort Lauderdale Beach
Fort Lauderdale Beach
Hollywood Beach
South Beach
Haulover Beach
Crandon Park
Dania Beach
Bill Baggs State Park
Beach Special Generators
Land Use Project
Sample Problem
bull MINTO West Example - a mixed residentialcommercial development ndash 6500 singlemulti-family residential units in multiple TAZs
ndash 14 million square feet of non-residential space
ndash 150 room hotel
ndash 3000 student college campus
Land Use Project
MINTO WEST
Land Use Project
TAZsMAZs representing MINTO West Development
Land Use Project
Need to translate population household and employment information from developer into model input data ndash As discussed in the Population Synthesis presentation population and
household attribute estimates can be taken from other known nearby neighborhoods
bull In this sample problem first start by allocating percentages of total
households into individual MAZs within the development area
bull Keep in mind household density when estimating the number of
households in each MAZ
Land Use Project
bull In this sample employment can be assumed to include bull Retail
bull RestaurantsBars
bull Offices
bull Health services
bull Hotelmotel employment and
bull Educational employment
ndash As with households yoursquoll need to apportion the employment areas to individual MAZs while keeping in mind the types of employment expected in those locations
Land Use Project
bull Employment data is usually estimated by converting floor space available to individual types of employment through conversion factors
bull ie ndash (3000 sqft office space)(20 sqft per office employee) =
150 office employees
Land Use Project
bull Once population household and employment figures are estimated they are entered into the appropriate model input file
bull Population ndash TAZ synthetic population control file
bull Household ndash TAZ synthetic population control file
bull Employment School Parking and Special Gen ndash maz_datacsv
bull Ensure that population household and employment figures
are the same in each file
bull Prior to performing model run PopSyn must be run and user must copy output files to SERPM7 input folders
Application 6 ndashTransit Project
Transit Project ndash MetroRail North Corridor
SERPM Transit Modes
Transit Mode Tour and Trip
Mode TAP Transit Skim Mode
Tri-Rail Commuter Rail Premium
Metrorail Urban Rail Premium
I-95 Inter-County Express I-95X I-95E
Express Bus Premium
Busway BRT Premium
MDT Express Express Bus Premium
Metromover Local Bus Local Bus
MDT Local BCT Local
Palm Tran Local Local Bus Local Bus
Breeze Local Bus Local Bus
Tri-Rail Shuttles Local Bus Local Bus
SERPM Transit Modes
Transit Mode Tour and Trip
Mode TAP Transit Skim
Mode
Mode coded on the route ldquocardsrdquo
Used to specify boarding and transfer penalties for transit
path building
(most disaggregate)
Line-haul choices in the tour and trip mode choice
models
Used to create sets of TAP to TAP levels of service
(most aggregate)
Similar to SERPM 67 SERPM 7 ABM
SERPM Transit Modes S67 Mode Local (L) S7
Mode Mode Name Operator amp Name UserA4 Name Prem (P) MODE
15 Tri-Rail 11 Tri-Rail 15 Commuter P 111
14 Metrorail 25 Metrorail 14 Urban Rail P 121
X Regional LRT Regional LRT 14 LRT P 131
16 Inter-County Express Bus 33 I-95 Inter-County Express 16 Express P 151
12 Exclusive ROW Cir-Reg 13 Exclusive ROW Cir-Reg 12 Mover L 181
11 TrolleysShuttles-Reg 12 Tri-Rail Shuttles 11 Local L 191
11 TrolleysShuttles-Reg 12 Tri-Rail Shuttles 33 Local L 192
X LRT- MDT 25 MDT LRT 14 LRT P 231
16 Buses (localexpress) - MDT 27 MDT Busway Flyers 27 BRT P 241
23 Buses (localexpress) - MDT 27 MDT MAXKATBusway Local 27 BRT P 242
24 BRT - MDT 28 MDT BRTLRT 28 BRT P 243
23 Buses (localexpress) - MDT 22 MDT Express 24 Express P 251
16 Buses (localexpress) - MDT 24 MDT I-95 Exp 26 Express P 252
16 Inter-County Express Bus 24 I-95 Inter-County Express 16 Express P 253
22 Exclusive ROW Cir-MDT 26 Metromover 22 Mover L 281
21 TrolleysShuttles-MDT 21 MDT TrolleysShuttles 21 Local L 291
23 Buses (localexpress) - MDT 21 MDT Local 23 Local L 292
23 Buses (localexpress) - MDT 23 MDT Shuttle 25 Local L 293
X LRT - BCT 35 BCT LRT 37 LRT P 331
34 BCT Rapid Bus BRT 34 BCT Rapid Bus 36 BRT P 341
34 BCT Fixed-guideway BRT 35 BCT BRT 37 BRT P 342
33 Buses (localexpress) - BCT 32 BCT Breeze 34 Express P 351
33 Buses (localexpress) - BCT 33 BCT Express 35 Express P 352
32 Exclusive ROW Cir-BCT 31 BCT Exclusive ROW Cir 32 Mover L 381
31 TrolleysShuttles-BCT 31 BCT TrolleysShuttles 31 Local L 393
33 Buses (localexpress) - BCT 31 BCT Local 27 Local L 391
33 Buses (localexpress) - BCT 31 BCT Local 33 Local L 392
X LRT - Palm Tran 43 Palm Tran LRT 44 LRT P 431
44 BRT - Palm Tran 43 Palm Tran BRT 44 BRT P 441
43 Buses (localexpress) - Ptran 42 Palm Tran Exp 44 Express P 451
42 Exclusive ROW Cir-PTran 41 Palm Tran Exclusive ROW Cir 42 Mover L 481
41 TrolleysShuttles-Ptran 41 Palm Tran TrolleysShuttles 41 Local L 491
43 Buses (localexpress) - Ptran 41 Palm Tran Local 43 Local L 492
Modes Not in the 2010 Network
SERPM7 Transit Network Building
bull Typically bus routes are coded on top of existing highway links
bull SERPM7 reserves some facility type codes for transit-only use helpful to more accurately represent route ndash Caution -- make sure network integrity is preserved once transit only
links are removed
bull Rail routes require coding first fixed-guideway links
SERPM7 Transit Network Building
bull Route Attributes -- User Coded ndash Name
ndash Long Name
ndash Mode
ndash Operator
ndash Headway[1] ndash AM Peak
ndash Headway[2] ndash Midday
ndash Headway[3] ndash PM Peak
ndash UserA4 (stop dwell time)
SERPM7 Transit Network Building
bull PNR Node Attributes ndash User Coded ndash Parking Spaces
ndash Parking Cost AM
ndash Parking Cost MD
ndash Terminal Time PNR
ndash Terminal Time KNR
bull At this time parking spaces is used only to identify park-n-ride locations (parking spaces gt 0)
SERPM7 Transit Network Building
bull Transit Access Points -- Created by Cube for the ABM ndash One TAP for each stop on premium routes
bull Tri-Rail Metrorail Express Bus BRT
ndash One TAP for each Local Bus park-n-ride node
ndash Synthesized TAPs to represent access to local bus stops
bull Transit Access Point Attributes ndash TAP Mode
ndash Inherit PNR node data
Sample Highway Network with TAPs
TAPs become part of the highway network and replace the TAZ centroids when building transit skims
Transit Access Points and ldquoon the flyrdquo Path Building
bull Transit skims are built TAP to TAP
Matrix origins and destinations are TAPS
Transit Access Points and ldquoon the flyrdquo Path Building
Trip Origins and
Destinations
MAZ to MAZ
Auto Skims
TAZ to TAZ
Transit Skims
TAP to TAP
The three spatial systems are put together by the mode choice model
ldquoOn the Flyrdquo Path Building
bull TAZs TAPs and MAZs are linked via drive and access connectors prior to running CT-RAMP
rmdir OUTDIRABMTEMP S Q rmdir DATADIRABMTEMP S Q xcopy OUTDIR OUTDIRABMTEMP E I Y xcopy DATADIR DATADIRABMTEMP E I Y if(fbi=1) need to run only the first time through - kdk CUBEctramprunCreateAccessFilescmd endif mkdir logFiles taskkill im javaexe F start CUBEctramprunHhMgrcmd JDK64 HOST_IP start CUBEctramprunMtxMgrcmd HOST_IP JDK64 rem start CUBEctrampconfigrunDrivercmd copy CUBEctrampserpm_abmproperties serpm_abmproperties Y ping -n 11 127001 gt nul CUBEctramprunSERPMAbmcmd SAMPLERATE VSAMPLERATE JDK64 CUBEctramprunCreateDemandMatricescmd SAMPLERATE VSAMPLERATE JDK64 taskkill im javaexe F rmdir OUTDIRctramp S Q rmdir DATADIRctramp S Q xcopy OUTDIRABMTEMPctramp OUTDIRctramp E I Y xcopy DATADIRABMTEMPctramp DATADIRctramp E I Y
ldquoOn the Flyrdquo Path Building
MAZ to MAZ Connectors
Created by finding shortest distance paths over an all-streets network Connects all MAZs within 15 mi
Used to represent walk mode distance and time
MAZ to TAP Connectors
Created by finding shortest distance paths over an all-streets network Connects each MAZ to all TAPs within 10 mi
Used to represent transit walk access and walk egress distance and time
TAZ to TAP Connectors
Connects each TAZ to all TAPs within the TAP maximum drive distance bull Bus TAPs ndash 4 miles bull Rail TAPs ndash 15 miles
Used to represent transit drive access and egress distance and time
ldquoOn the Flyrdquo Path Building
bull No actual links created on the network bull Connectivity is expressed in table format
ldquoOn the Flyrdquo Path Building
bull Once the access and walk connectors are created the mode choice model builds complete paths MAZ to MAZ transit paths
bull Local-only paths are built using the ldquolocalrdquo transit skim bull Express BRT Urban Rail and Commuter rail paths are all
built at the same time using the ldquopremiumrdquo transit skim bull For each MAZ to MAZ pair CT-RAMP keeps the shortest
generalized cost path for each available premium mode bull Even though only one ldquopremiumrdquo skim is built CT-RAMP
may find competing premium paths It may also find that the best path is a combination of two premium modes or a premium mode and local bus
Tour Mode Choice Model
Choice
Auto
Drive alone
GP(1)
Pay(2)
Shared ride 2
GP(3)
HOV(4)
Pay(5)
Shared ride 3+
GP(6)
HOV(7)
Pay(8)
Non-motorized
Walk(9)
Bike(10)
Transit
Walk access
Local bus(11)
Express bus(12)
BRT(13)
Urban rail(14)
Commuter rail(15)
PNR access
Local bus(16)
Express bus(17)
BRT(18)
Urban rail(19)
Commuter rail(20)
KNR access
Local bus(21)
Express bus(22)
BRT(23)
Urban rail(24)
Commuter rail(25)
School Bus(26)
Trip Mode Choice Model
bull Same nesting structure as the tour mode choice but conditional on the tour mode
bull Some trip modes may be unavailable depending on the tour mode
DA SR2 SR3+ Walk Wlk-Trn PNR-Trn KNR-Trn
DA Must - - - - - -
SR2 Can Can - Can - - -
SR3+ Can Can Can Can - - -
Walk - - - Must - - -
Wlk-Trn - Can Can Can Can - -
PNR-Trn Can Can Can Can Can Can
KNR-Trn - Can Can Can Can - Can
Trip Switching Rules Simplified
Transit Trip Reporting
bull In SERPM7 the transit boarding and alighting location can be reported in two ways ndash Trip list files (ABM output) -- Boarding TAP Alighting TAP
ndash Transit assignment (Cube output) ndash Route nodes
bull Each type of reporting has its strengths ndash Trip list file allows building detailed transit trip patterns for
population cohorts and time periods
bull Mode split reports
bull Transit trip distance frequency distributions access distance TLFDs
bull Mode to mode transfers
ndash Note ABM reports only the first boarding TAP and the last alighting TAP regardless of mode
ndash Cube output gives aggregate link volumes station to station boardings etc
User Benefit Files
bull SERPM7 can produce FTA User Benefit files for input to SUMMIT
bull User benefits remain a useful analysis tool bull Steps to produce user benefit files require some manual
intervention ndash see User Guide
SERPM ABM Reports
bull Stores ABM inputs and outputs in a relational database to generate some standard model reports
bull Consistent reporting framework to be used for analysis across model runs
bull SERPM7 user community can easily share the scripts that create the reports
bull Reports take the form of Excel workbooks bull Foundation for future development of a visualization
dashboard
Reporting Database Components
Reporting Database Components
bull Reporting ETL (extract transform and load) program ndash Loads all Cube and CT-RAMP Java model outputs into the database
ndash Written in Cube scripts and Java
bull Database ndash Stores all data used in reporting including select network skims
household person tour and trip data zonal data etc
ndash Implemented with SQL Server
bull Report scripts to generate reports ndash Written in T-SQL
bull Report packaging program ndash Generates Excel workbooks with one report per worksheet
ndash Written in Java
Reporting Database Components
bull Run time required to build database and generate reports varies with sample size and type of report ndash Several hours required to build the database for a 100 sample
ndash ~ 30 minutes to produce reports for a 10 sample
bull Report step is optional not part of a standard model run bull Report production is transparent to the user
bull hellip but users can contribute reports bull hellip and choose which reports to build at any one time
Running SERPM ABM Reports
bull Report queries reside in ctrampreports_sql time_spent_travelingsql Total weekday travel time by person type
and income group
total_trips_typesql Trips by trip mode person type county of residence and tour purpose
total_tours_typesql Tours by trip mode person type county of residence and tour purpose
tours_districtssql Tours by tour purpose and tour origin and destination districts
transit_access_time+distsql Drive to transit trip list with many trip details
hellip
Running SERPM ABM Reports
bull List of reports to run is specified in properties file ndash ctrampserpm_reportsproperties
sqlscriptsdirectory = Cserpm7ctrampreports_sql sqlscriptsschemakey = SCHEMA sqlscripts=cleanupsqltransit_access_time+distsql worksheettables=temptransittrips worksheetnames=TransitTrips workbookname = Cserpm7ctrampreports_sqlSERPM_REPORTXLS databaseschema = 2010R databaseipaddress = w-ampdx-d-sag10 databaseinstance = databaseport = 1433 databasename=SERPMABM databaseusername=serpm databasepassword=s3rpm
Adding Reports
bull Step 1 --Write report query ndash T-SQL
ndash User Guide includes a database data dictionary
bull Step 2 ndash Add query to ctrampreports_sql ndash Each query is contained in a single text file
ndash Drop file in reports folder
bull Step 3 ndash Add the query to the properties file sqlquery = Query file name
Worksheettables = Query output
Worksheetnames = Name for the report worksheet
Sample SERPM ABM Reports
bull Exhibit ctrampreports_sqlserpm_reportsxls
More information Shi-Chiang Li | shi-chianglidotstateflus |954 777 4655 Rosella Picado | picadopbworldcom | 206 382 5227 Ken Kaltenbach |kkaltenbachcorradinocom |502 587 7221

Modifying the Toll Transponder Ownership Model
Utility Variable Coefficient
Expected time savings up to 644 min 00631
Distance less than 5 miles -00304
Distance between 5 and 10 miles -00648
Distance 10 miles or more -00648
Constant 04877
Increasing the constant will increase the number of households equipped with transponders
TransponderOwnershipxls
Modifying the Toll Transponder Model
bull Increase the constant by how much ndash Process is akin to model calibration
ndash Several runs of the transponder model required to estimate the constant that yields the desired market share
ndash 2010 market share is approximately 65
ndash Use a small sample (5 or 10) to save run-time while establishing the right constant
Modifying the Toll Transponder Model
bull Variation ndash Add terms to the model so that certain types of households are more
likely to exhibit a SUNPASS market share increase
bull Highlow income households
bull Multi-car households
bull Miami-Dade households
Modifying the Toll Transponder Model
bull Exhibit TransponderOwnershipxls
Mobility Project ndash SUNPASS Market Share
bull Question 2 -- How will SUNPASS penetration rate vary as more managed lane facilities are built in the region
bull Procedure ndash Step 1 ndash Code the manage lane facilities
ndash Step 2 ndash Run SERPM7 to forecast transponder ownership
ndash Step 3 ndash Analyze the forecast household data for changes in the profile of households equipped with transponders
Application 5 ndash Land Use Project
Land Use Project
bull Transportation projects comprise not only network scenarios but also land use scenarios
bull Land use scenarios can be ndash Very large scale (substantial changes to housing and employment
estimates throughout the region) or
ndash Small scale (localized changes for example for a traffic impact study)
bull For both large scale and small scale land use updates the
general procedure for updating the input data and running the model is the same
Land Use Project
bull The land use data in SERPM7 consists of ndash Synthetic population and derived input files
ndash Employment data
ndash School enrollment data
ndash Parking costs and parking spaces
ndash Regional shopping mall special generators
ndash Beach special generators
ndash Hotel and motel room data
Land Use Project
bull The land use data reside in different input files
Data Item Input File
Synthetic Population hhFilecsv personFilecsv ctramppopsynTAZDatacsv ctramppopsynMAZDatacsv
Employment School Enrollment Parking Supply Data Special Generators Hotel and Motel Rooms
inputsIN-2010Rmaz_datacsv
Land Use Project
bull As demonstrated earlier SERPM 7 requires significantly more comprehensive socio-economic inputs as compared to previous versions ndash Greater spatial detail
ndash More categoriestypes of land uses
bull These inputs require additional preparation when
performing land use model runs
Land Use Project
Data Required and examples bull Population
bull Age distribution of the population expected to live in the
development
bull Income profile
bull Type of dwelling unit (single-family vs multi-family)
ndash The input data need to be internally consistent (distribution of households by presence of children needs to be consistent with population age distribution for example)
Land Use Project
Data Required bull Employment classification ndash Previous models had three
employment classifications
ndash In SERPM 7 there are 16 employment categories to better differentiate type of land use and improve the relationship between land use and activity purpose
Land Use Project
Data Required bull School enrollment ndash note that it differentiates by grade level
(K-8 high-school collegepost-secondary) ndash Donrsquot forget to include school faculty and staff in employment
Land Use Project
Data Required bull Parking supply and
parking costs ndash Parking spaces may
reflect use restrictions
bull Monthly
bull Daily
bull Hourly
ndash Parking costs consistent with type of use
Land Use Project
bull Park Area 1 (pink) ndash May park in MAZ other
than destination MAZ
ndash Parking cost applies
bull Park Area 2 (gree) ndash Parks at destination MAZ
ndash Parking cost applies
Land Use Project
Data Required bull Visitor Model ndash Number of hotel and motel rooms
bull Special Generators ndash Regional shopping malls
ndash Beach recreation areas
Land Use Project
The Gardens Mall Aventura Mall
Boynton Mall Dolphin Mall
Delray Community Mall Dadeland Mall
Towncenter Mall The Falls Shopping Center
Wellington Greens Mall Cutler Ridge Mall
Coral Square Mall Bal Harbour Shops
Pompano Citi Centre CocoWalk
Sawgrass Mills Mall The Mall at 163rd Street
Broward Mall Mall of the Americas
Galleria Mall Mary Brickell Village
Pembroke Lakes Mall Miami International Mall
Lakes Mall Miracle Marketplace
Oakwood Plaza Village of Merrick Park
The Promenade at Coconut Creek Westland Mall
Regional Shopping Mall Special Generators
Land Use Project
Deerfield Beach
Pompano Beach
Fort Lauderdale Beach
Fort Lauderdale Beach
Hollywood Beach
South Beach
Haulover Beach
Crandon Park
Dania Beach
Bill Baggs State Park
Beach Special Generators
Land Use Project
Sample Problem
bull MINTO West Example - a mixed residentialcommercial development ndash 6500 singlemulti-family residential units in multiple TAZs
ndash 14 million square feet of non-residential space
ndash 150 room hotel
ndash 3000 student college campus
Land Use Project
MINTO WEST
Land Use Project
TAZsMAZs representing MINTO West Development
Land Use Project
Need to translate population household and employment information from developer into model input data ndash As discussed in the Population Synthesis presentation population and
household attribute estimates can be taken from other known nearby neighborhoods
bull In this sample problem first start by allocating percentages of total
households into individual MAZs within the development area
bull Keep in mind household density when estimating the number of
households in each MAZ
Land Use Project
bull In this sample employment can be assumed to include bull Retail
bull RestaurantsBars
bull Offices
bull Health services
bull Hotelmotel employment and
bull Educational employment
ndash As with households yoursquoll need to apportion the employment areas to individual MAZs while keeping in mind the types of employment expected in those locations
Land Use Project
bull Employment data is usually estimated by converting floor space available to individual types of employment through conversion factors
bull ie ndash (3000 sqft office space)(20 sqft per office employee) =
150 office employees
Land Use Project
bull Once population household and employment figures are estimated they are entered into the appropriate model input file
bull Population ndash TAZ synthetic population control file
bull Household ndash TAZ synthetic population control file
bull Employment School Parking and Special Gen ndash maz_datacsv
bull Ensure that population household and employment figures
are the same in each file
bull Prior to performing model run PopSyn must be run and user must copy output files to SERPM7 input folders
Application 6 ndashTransit Project
Transit Project ndash MetroRail North Corridor
SERPM Transit Modes
Transit Mode Tour and Trip
Mode TAP Transit Skim Mode
Tri-Rail Commuter Rail Premium
Metrorail Urban Rail Premium
I-95 Inter-County Express I-95X I-95E
Express Bus Premium
Busway BRT Premium
MDT Express Express Bus Premium
Metromover Local Bus Local Bus
MDT Local BCT Local
Palm Tran Local Local Bus Local Bus
Breeze Local Bus Local Bus
Tri-Rail Shuttles Local Bus Local Bus
SERPM Transit Modes
Transit Mode Tour and Trip
Mode TAP Transit Skim
Mode
Mode coded on the route ldquocardsrdquo
Used to specify boarding and transfer penalties for transit
path building
(most disaggregate)
Line-haul choices in the tour and trip mode choice
models
Used to create sets of TAP to TAP levels of service
(most aggregate)
Similar to SERPM 67 SERPM 7 ABM
SERPM Transit Modes S67 Mode Local (L) S7
Mode Mode Name Operator amp Name UserA4 Name Prem (P) MODE
15 Tri-Rail 11 Tri-Rail 15 Commuter P 111
14 Metrorail 25 Metrorail 14 Urban Rail P 121
X Regional LRT Regional LRT 14 LRT P 131
16 Inter-County Express Bus 33 I-95 Inter-County Express 16 Express P 151
12 Exclusive ROW Cir-Reg 13 Exclusive ROW Cir-Reg 12 Mover L 181
11 TrolleysShuttles-Reg 12 Tri-Rail Shuttles 11 Local L 191
11 TrolleysShuttles-Reg 12 Tri-Rail Shuttles 33 Local L 192
X LRT- MDT 25 MDT LRT 14 LRT P 231
16 Buses (localexpress) - MDT 27 MDT Busway Flyers 27 BRT P 241
23 Buses (localexpress) - MDT 27 MDT MAXKATBusway Local 27 BRT P 242
24 BRT - MDT 28 MDT BRTLRT 28 BRT P 243
23 Buses (localexpress) - MDT 22 MDT Express 24 Express P 251
16 Buses (localexpress) - MDT 24 MDT I-95 Exp 26 Express P 252
16 Inter-County Express Bus 24 I-95 Inter-County Express 16 Express P 253
22 Exclusive ROW Cir-MDT 26 Metromover 22 Mover L 281
21 TrolleysShuttles-MDT 21 MDT TrolleysShuttles 21 Local L 291
23 Buses (localexpress) - MDT 21 MDT Local 23 Local L 292
23 Buses (localexpress) - MDT 23 MDT Shuttle 25 Local L 293
X LRT - BCT 35 BCT LRT 37 LRT P 331
34 BCT Rapid Bus BRT 34 BCT Rapid Bus 36 BRT P 341
34 BCT Fixed-guideway BRT 35 BCT BRT 37 BRT P 342
33 Buses (localexpress) - BCT 32 BCT Breeze 34 Express P 351
33 Buses (localexpress) - BCT 33 BCT Express 35 Express P 352
32 Exclusive ROW Cir-BCT 31 BCT Exclusive ROW Cir 32 Mover L 381
31 TrolleysShuttles-BCT 31 BCT TrolleysShuttles 31 Local L 393
33 Buses (localexpress) - BCT 31 BCT Local 27 Local L 391
33 Buses (localexpress) - BCT 31 BCT Local 33 Local L 392
X LRT - Palm Tran 43 Palm Tran LRT 44 LRT P 431
44 BRT - Palm Tran 43 Palm Tran BRT 44 BRT P 441
43 Buses (localexpress) - Ptran 42 Palm Tran Exp 44 Express P 451
42 Exclusive ROW Cir-PTran 41 Palm Tran Exclusive ROW Cir 42 Mover L 481
41 TrolleysShuttles-Ptran 41 Palm Tran TrolleysShuttles 41 Local L 491
43 Buses (localexpress) - Ptran 41 Palm Tran Local 43 Local L 492
Modes Not in the 2010 Network
SERPM7 Transit Network Building
bull Typically bus routes are coded on top of existing highway links
bull SERPM7 reserves some facility type codes for transit-only use helpful to more accurately represent route ndash Caution -- make sure network integrity is preserved once transit only
links are removed
bull Rail routes require coding first fixed-guideway links
SERPM7 Transit Network Building
bull Route Attributes -- User Coded ndash Name
ndash Long Name
ndash Mode
ndash Operator
ndash Headway[1] ndash AM Peak
ndash Headway[2] ndash Midday
ndash Headway[3] ndash PM Peak
ndash UserA4 (stop dwell time)
SERPM7 Transit Network Building
bull PNR Node Attributes ndash User Coded ndash Parking Spaces
ndash Parking Cost AM
ndash Parking Cost MD
ndash Terminal Time PNR
ndash Terminal Time KNR
bull At this time parking spaces is used only to identify park-n-ride locations (parking spaces gt 0)
SERPM7 Transit Network Building
bull Transit Access Points -- Created by Cube for the ABM ndash One TAP for each stop on premium routes
bull Tri-Rail Metrorail Express Bus BRT
ndash One TAP for each Local Bus park-n-ride node
ndash Synthesized TAPs to represent access to local bus stops
bull Transit Access Point Attributes ndash TAP Mode
ndash Inherit PNR node data
Sample Highway Network with TAPs
TAPs become part of the highway network and replace the TAZ centroids when building transit skims
Transit Access Points and ldquoon the flyrdquo Path Building
bull Transit skims are built TAP to TAP
Matrix origins and destinations are TAPS
Transit Access Points and ldquoon the flyrdquo Path Building
Trip Origins and
Destinations
MAZ to MAZ
Auto Skims
TAZ to TAZ
Transit Skims
TAP to TAP
The three spatial systems are put together by the mode choice model
ldquoOn the Flyrdquo Path Building
bull TAZs TAPs and MAZs are linked via drive and access connectors prior to running CT-RAMP
rmdir OUTDIRABMTEMP S Q rmdir DATADIRABMTEMP S Q xcopy OUTDIR OUTDIRABMTEMP E I Y xcopy DATADIR DATADIRABMTEMP E I Y if(fbi=1) need to run only the first time through - kdk CUBEctramprunCreateAccessFilescmd endif mkdir logFiles taskkill im javaexe F start CUBEctramprunHhMgrcmd JDK64 HOST_IP start CUBEctramprunMtxMgrcmd HOST_IP JDK64 rem start CUBEctrampconfigrunDrivercmd copy CUBEctrampserpm_abmproperties serpm_abmproperties Y ping -n 11 127001 gt nul CUBEctramprunSERPMAbmcmd SAMPLERATE VSAMPLERATE JDK64 CUBEctramprunCreateDemandMatricescmd SAMPLERATE VSAMPLERATE JDK64 taskkill im javaexe F rmdir OUTDIRctramp S Q rmdir DATADIRctramp S Q xcopy OUTDIRABMTEMPctramp OUTDIRctramp E I Y xcopy DATADIRABMTEMPctramp DATADIRctramp E I Y
ldquoOn the Flyrdquo Path Building
MAZ to MAZ Connectors
Created by finding shortest distance paths over an all-streets network Connects all MAZs within 15 mi
Used to represent walk mode distance and time
MAZ to TAP Connectors
Created by finding shortest distance paths over an all-streets network Connects each MAZ to all TAPs within 10 mi
Used to represent transit walk access and walk egress distance and time
TAZ to TAP Connectors
Connects each TAZ to all TAPs within the TAP maximum drive distance bull Bus TAPs ndash 4 miles bull Rail TAPs ndash 15 miles
Used to represent transit drive access and egress distance and time
ldquoOn the Flyrdquo Path Building
bull No actual links created on the network bull Connectivity is expressed in table format
ldquoOn the Flyrdquo Path Building
bull Once the access and walk connectors are created the mode choice model builds complete paths MAZ to MAZ transit paths
bull Local-only paths are built using the ldquolocalrdquo transit skim bull Express BRT Urban Rail and Commuter rail paths are all
built at the same time using the ldquopremiumrdquo transit skim bull For each MAZ to MAZ pair CT-RAMP keeps the shortest
generalized cost path for each available premium mode bull Even though only one ldquopremiumrdquo skim is built CT-RAMP
may find competing premium paths It may also find that the best path is a combination of two premium modes or a premium mode and local bus
Tour Mode Choice Model
Choice
Auto
Drive alone
GP(1)
Pay(2)
Shared ride 2
GP(3)
HOV(4)
Pay(5)
Shared ride 3+
GP(6)
HOV(7)
Pay(8)
Non-motorized
Walk(9)
Bike(10)
Transit
Walk access
Local bus(11)
Express bus(12)
BRT(13)
Urban rail(14)
Commuter rail(15)
PNR access
Local bus(16)
Express bus(17)
BRT(18)
Urban rail(19)
Commuter rail(20)
KNR access
Local bus(21)
Express bus(22)
BRT(23)
Urban rail(24)
Commuter rail(25)
School Bus(26)
Trip Mode Choice Model
bull Same nesting structure as the tour mode choice but conditional on the tour mode
bull Some trip modes may be unavailable depending on the tour mode
DA SR2 SR3+ Walk Wlk-Trn PNR-Trn KNR-Trn
DA Must - - - - - -
SR2 Can Can - Can - - -
SR3+ Can Can Can Can - - -
Walk - - - Must - - -
Wlk-Trn - Can Can Can Can - -
PNR-Trn Can Can Can Can Can Can
KNR-Trn - Can Can Can Can - Can
Trip Switching Rules Simplified
Transit Trip Reporting
bull In SERPM7 the transit boarding and alighting location can be reported in two ways ndash Trip list files (ABM output) -- Boarding TAP Alighting TAP
ndash Transit assignment (Cube output) ndash Route nodes
bull Each type of reporting has its strengths ndash Trip list file allows building detailed transit trip patterns for
population cohorts and time periods
bull Mode split reports
bull Transit trip distance frequency distributions access distance TLFDs
bull Mode to mode transfers
ndash Note ABM reports only the first boarding TAP and the last alighting TAP regardless of mode
ndash Cube output gives aggregate link volumes station to station boardings etc
User Benefit Files
bull SERPM7 can produce FTA User Benefit files for input to SUMMIT
bull User benefits remain a useful analysis tool bull Steps to produce user benefit files require some manual
intervention ndash see User Guide
SERPM ABM Reports
bull Stores ABM inputs and outputs in a relational database to generate some standard model reports
bull Consistent reporting framework to be used for analysis across model runs
bull SERPM7 user community can easily share the scripts that create the reports
bull Reports take the form of Excel workbooks bull Foundation for future development of a visualization
dashboard
Reporting Database Components
Reporting Database Components
bull Reporting ETL (extract transform and load) program ndash Loads all Cube and CT-RAMP Java model outputs into the database
ndash Written in Cube scripts and Java
bull Database ndash Stores all data used in reporting including select network skims
household person tour and trip data zonal data etc
ndash Implemented with SQL Server
bull Report scripts to generate reports ndash Written in T-SQL
bull Report packaging program ndash Generates Excel workbooks with one report per worksheet
ndash Written in Java
Reporting Database Components
bull Run time required to build database and generate reports varies with sample size and type of report ndash Several hours required to build the database for a 100 sample
ndash ~ 30 minutes to produce reports for a 10 sample
bull Report step is optional not part of a standard model run bull Report production is transparent to the user
bull hellip but users can contribute reports bull hellip and choose which reports to build at any one time
Running SERPM ABM Reports
bull Report queries reside in ctrampreports_sql time_spent_travelingsql Total weekday travel time by person type
and income group
total_trips_typesql Trips by trip mode person type county of residence and tour purpose
total_tours_typesql Tours by trip mode person type county of residence and tour purpose
tours_districtssql Tours by tour purpose and tour origin and destination districts
transit_access_time+distsql Drive to transit trip list with many trip details
hellip
Running SERPM ABM Reports
bull List of reports to run is specified in properties file ndash ctrampserpm_reportsproperties
sqlscriptsdirectory = Cserpm7ctrampreports_sql sqlscriptsschemakey = SCHEMA sqlscripts=cleanupsqltransit_access_time+distsql worksheettables=temptransittrips worksheetnames=TransitTrips workbookname = Cserpm7ctrampreports_sqlSERPM_REPORTXLS databaseschema = 2010R databaseipaddress = w-ampdx-d-sag10 databaseinstance = databaseport = 1433 databasename=SERPMABM databaseusername=serpm databasepassword=s3rpm
Adding Reports
bull Step 1 --Write report query ndash T-SQL
ndash User Guide includes a database data dictionary
bull Step 2 ndash Add query to ctrampreports_sql ndash Each query is contained in a single text file
ndash Drop file in reports folder
bull Step 3 ndash Add the query to the properties file sqlquery = Query file name
Worksheettables = Query output
Worksheetnames = Name for the report worksheet
Sample SERPM ABM Reports
bull Exhibit ctrampreports_sqlserpm_reportsxls
More information Shi-Chiang Li | shi-chianglidotstateflus |954 777 4655 Rosella Picado | picadopbworldcom | 206 382 5227 Ken Kaltenbach |kkaltenbachcorradinocom |502 587 7221

Modifying the Toll Transponder Model
bull Exhibit TransponderOwnershipxls
Mobility Project ndash SUNPASS Market Share
bull Question 2 -- How will SUNPASS penetration rate vary as more managed lane facilities are built in the region
bull Procedure ndash Step 1 ndash Code the manage lane facilities
ndash Step 2 ndash Run SERPM7 to forecast transponder ownership
ndash Step 3 ndash Analyze the forecast household data for changes in the profile of households equipped with transponders
Application 5 ndash Land Use Project
Land Use Project
bull Transportation projects comprise not only network scenarios but also land use scenarios
bull Land use scenarios can be ndash Very large scale (substantial changes to housing and employment
estimates throughout the region) or
ndash Small scale (localized changes for example for a traffic impact study)
bull For both large scale and small scale land use updates the
general procedure for updating the input data and running the model is the same
Land Use Project
bull The land use data in SERPM7 consists of ndash Synthetic population and derived input files
ndash Employment data
ndash School enrollment data
ndash Parking costs and parking spaces
ndash Regional shopping mall special generators
ndash Beach special generators
ndash Hotel and motel room data
Land Use Project
bull The land use data reside in different input files
Data Item Input File
Synthetic Population hhFilecsv personFilecsv ctramppopsynTAZDatacsv ctramppopsynMAZDatacsv
Employment School Enrollment Parking Supply Data Special Generators Hotel and Motel Rooms
inputsIN-2010Rmaz_datacsv
Land Use Project
bull As demonstrated earlier SERPM 7 requires significantly more comprehensive socio-economic inputs as compared to previous versions ndash Greater spatial detail
ndash More categoriestypes of land uses
bull These inputs require additional preparation when
performing land use model runs
Land Use Project
Data Required and examples bull Population
bull Age distribution of the population expected to live in the
development
bull Income profile
bull Type of dwelling unit (single-family vs multi-family)
ndash The input data need to be internally consistent (distribution of households by presence of children needs to be consistent with population age distribution for example)
Land Use Project
Data Required bull Employment classification ndash Previous models had three
employment classifications
ndash In SERPM 7 there are 16 employment categories to better differentiate type of land use and improve the relationship between land use and activity purpose
Land Use Project
Data Required bull School enrollment ndash note that it differentiates by grade level
(K-8 high-school collegepost-secondary) ndash Donrsquot forget to include school faculty and staff in employment
Land Use Project
Data Required bull Parking supply and
parking costs ndash Parking spaces may
reflect use restrictions
bull Monthly
bull Daily
bull Hourly
ndash Parking costs consistent with type of use
Land Use Project
bull Park Area 1 (pink) ndash May park in MAZ other
than destination MAZ
ndash Parking cost applies
bull Park Area 2 (gree) ndash Parks at destination MAZ
ndash Parking cost applies
Land Use Project
Data Required bull Visitor Model ndash Number of hotel and motel rooms
bull Special Generators ndash Regional shopping malls
ndash Beach recreation areas
Land Use Project
The Gardens Mall Aventura Mall
Boynton Mall Dolphin Mall
Delray Community Mall Dadeland Mall
Towncenter Mall The Falls Shopping Center
Wellington Greens Mall Cutler Ridge Mall
Coral Square Mall Bal Harbour Shops
Pompano Citi Centre CocoWalk
Sawgrass Mills Mall The Mall at 163rd Street
Broward Mall Mall of the Americas
Galleria Mall Mary Brickell Village
Pembroke Lakes Mall Miami International Mall
Lakes Mall Miracle Marketplace
Oakwood Plaza Village of Merrick Park
The Promenade at Coconut Creek Westland Mall
Regional Shopping Mall Special Generators
Land Use Project
Deerfield Beach
Pompano Beach
Fort Lauderdale Beach
Fort Lauderdale Beach
Hollywood Beach
South Beach
Haulover Beach
Crandon Park
Dania Beach
Bill Baggs State Park
Beach Special Generators
Land Use Project
Sample Problem
bull MINTO West Example - a mixed residentialcommercial development ndash 6500 singlemulti-family residential units in multiple TAZs
ndash 14 million square feet of non-residential space
ndash 150 room hotel
ndash 3000 student college campus
Land Use Project
MINTO WEST
Land Use Project
TAZsMAZs representing MINTO West Development
Land Use Project
Need to translate population household and employment information from developer into model input data ndash As discussed in the Population Synthesis presentation population and
household attribute estimates can be taken from other known nearby neighborhoods
bull In this sample problem first start by allocating percentages of total
households into individual MAZs within the development area
bull Keep in mind household density when estimating the number of
households in each MAZ
Land Use Project
bull In this sample employment can be assumed to include bull Retail
bull RestaurantsBars
bull Offices
bull Health services
bull Hotelmotel employment and
bull Educational employment
ndash As with households yoursquoll need to apportion the employment areas to individual MAZs while keeping in mind the types of employment expected in those locations
Land Use Project
bull Employment data is usually estimated by converting floor space available to individual types of employment through conversion factors
bull ie ndash (3000 sqft office space)(20 sqft per office employee) =
150 office employees
Land Use Project
bull Once population household and employment figures are estimated they are entered into the appropriate model input file
bull Population ndash TAZ synthetic population control file
bull Household ndash TAZ synthetic population control file
bull Employment School Parking and Special Gen ndash maz_datacsv
bull Ensure that population household and employment figures
are the same in each file
bull Prior to performing model run PopSyn must be run and user must copy output files to SERPM7 input folders
Application 6 ndashTransit Project
Transit Project ndash MetroRail North Corridor
SERPM Transit Modes
Transit Mode Tour and Trip
Mode TAP Transit Skim Mode
Tri-Rail Commuter Rail Premium
Metrorail Urban Rail Premium
I-95 Inter-County Express I-95X I-95E
Express Bus Premium
Busway BRT Premium
MDT Express Express Bus Premium
Metromover Local Bus Local Bus
MDT Local BCT Local
Palm Tran Local Local Bus Local Bus
Breeze Local Bus Local Bus
Tri-Rail Shuttles Local Bus Local Bus
SERPM Transit Modes
Transit Mode Tour and Trip
Mode TAP Transit Skim
Mode
Mode coded on the route ldquocardsrdquo
Used to specify boarding and transfer penalties for transit
path building
(most disaggregate)
Line-haul choices in the tour and trip mode choice
models
Used to create sets of TAP to TAP levels of service
(most aggregate)
Similar to SERPM 67 SERPM 7 ABM
SERPM Transit Modes S67 Mode Local (L) S7
Mode Mode Name Operator amp Name UserA4 Name Prem (P) MODE
15 Tri-Rail 11 Tri-Rail 15 Commuter P 111
14 Metrorail 25 Metrorail 14 Urban Rail P 121
X Regional LRT Regional LRT 14 LRT P 131
16 Inter-County Express Bus 33 I-95 Inter-County Express 16 Express P 151
12 Exclusive ROW Cir-Reg 13 Exclusive ROW Cir-Reg 12 Mover L 181
11 TrolleysShuttles-Reg 12 Tri-Rail Shuttles 11 Local L 191
11 TrolleysShuttles-Reg 12 Tri-Rail Shuttles 33 Local L 192
X LRT- MDT 25 MDT LRT 14 LRT P 231
16 Buses (localexpress) - MDT 27 MDT Busway Flyers 27 BRT P 241
23 Buses (localexpress) - MDT 27 MDT MAXKATBusway Local 27 BRT P 242
24 BRT - MDT 28 MDT BRTLRT 28 BRT P 243
23 Buses (localexpress) - MDT 22 MDT Express 24 Express P 251
16 Buses (localexpress) - MDT 24 MDT I-95 Exp 26 Express P 252
16 Inter-County Express Bus 24 I-95 Inter-County Express 16 Express P 253
22 Exclusive ROW Cir-MDT 26 Metromover 22 Mover L 281
21 TrolleysShuttles-MDT 21 MDT TrolleysShuttles 21 Local L 291
23 Buses (localexpress) - MDT 21 MDT Local 23 Local L 292
23 Buses (localexpress) - MDT 23 MDT Shuttle 25 Local L 293
X LRT - BCT 35 BCT LRT 37 LRT P 331
34 BCT Rapid Bus BRT 34 BCT Rapid Bus 36 BRT P 341
34 BCT Fixed-guideway BRT 35 BCT BRT 37 BRT P 342
33 Buses (localexpress) - BCT 32 BCT Breeze 34 Express P 351
33 Buses (localexpress) - BCT 33 BCT Express 35 Express P 352
32 Exclusive ROW Cir-BCT 31 BCT Exclusive ROW Cir 32 Mover L 381
31 TrolleysShuttles-BCT 31 BCT TrolleysShuttles 31 Local L 393
33 Buses (localexpress) - BCT 31 BCT Local 27 Local L 391
33 Buses (localexpress) - BCT 31 BCT Local 33 Local L 392
X LRT - Palm Tran 43 Palm Tran LRT 44 LRT P 431
44 BRT - Palm Tran 43 Palm Tran BRT 44 BRT P 441
43 Buses (localexpress) - Ptran 42 Palm Tran Exp 44 Express P 451
42 Exclusive ROW Cir-PTran 41 Palm Tran Exclusive ROW Cir 42 Mover L 481
41 TrolleysShuttles-Ptran 41 Palm Tran TrolleysShuttles 41 Local L 491
43 Buses (localexpress) - Ptran 41 Palm Tran Local 43 Local L 492
Modes Not in the 2010 Network
SERPM7 Transit Network Building
bull Typically bus routes are coded on top of existing highway links
bull SERPM7 reserves some facility type codes for transit-only use helpful to more accurately represent route ndash Caution -- make sure network integrity is preserved once transit only
links are removed
bull Rail routes require coding first fixed-guideway links
SERPM7 Transit Network Building
bull Route Attributes -- User Coded ndash Name
ndash Long Name
ndash Mode
ndash Operator
ndash Headway[1] ndash AM Peak
ndash Headway[2] ndash Midday
ndash Headway[3] ndash PM Peak
ndash UserA4 (stop dwell time)
SERPM7 Transit Network Building
bull PNR Node Attributes ndash User Coded ndash Parking Spaces
ndash Parking Cost AM
ndash Parking Cost MD
ndash Terminal Time PNR
ndash Terminal Time KNR
bull At this time parking spaces is used only to identify park-n-ride locations (parking spaces gt 0)
SERPM7 Transit Network Building
bull Transit Access Points -- Created by Cube for the ABM ndash One TAP for each stop on premium routes
bull Tri-Rail Metrorail Express Bus BRT
ndash One TAP for each Local Bus park-n-ride node
ndash Synthesized TAPs to represent access to local bus stops
bull Transit Access Point Attributes ndash TAP Mode
ndash Inherit PNR node data
Sample Highway Network with TAPs
TAPs become part of the highway network and replace the TAZ centroids when building transit skims
Transit Access Points and ldquoon the flyrdquo Path Building
bull Transit skims are built TAP to TAP
Matrix origins and destinations are TAPS
Transit Access Points and ldquoon the flyrdquo Path Building
Trip Origins and
Destinations
MAZ to MAZ
Auto Skims
TAZ to TAZ
Transit Skims
TAP to TAP
The three spatial systems are put together by the mode choice model
ldquoOn the Flyrdquo Path Building
bull TAZs TAPs and MAZs are linked via drive and access connectors prior to running CT-RAMP
rmdir OUTDIRABMTEMP S Q rmdir DATADIRABMTEMP S Q xcopy OUTDIR OUTDIRABMTEMP E I Y xcopy DATADIR DATADIRABMTEMP E I Y if(fbi=1) need to run only the first time through - kdk CUBEctramprunCreateAccessFilescmd endif mkdir logFiles taskkill im javaexe F start CUBEctramprunHhMgrcmd JDK64 HOST_IP start CUBEctramprunMtxMgrcmd HOST_IP JDK64 rem start CUBEctrampconfigrunDrivercmd copy CUBEctrampserpm_abmproperties serpm_abmproperties Y ping -n 11 127001 gt nul CUBEctramprunSERPMAbmcmd SAMPLERATE VSAMPLERATE JDK64 CUBEctramprunCreateDemandMatricescmd SAMPLERATE VSAMPLERATE JDK64 taskkill im javaexe F rmdir OUTDIRctramp S Q rmdir DATADIRctramp S Q xcopy OUTDIRABMTEMPctramp OUTDIRctramp E I Y xcopy DATADIRABMTEMPctramp DATADIRctramp E I Y
ldquoOn the Flyrdquo Path Building
MAZ to MAZ Connectors
Created by finding shortest distance paths over an all-streets network Connects all MAZs within 15 mi
Used to represent walk mode distance and time
MAZ to TAP Connectors
Created by finding shortest distance paths over an all-streets network Connects each MAZ to all TAPs within 10 mi
Used to represent transit walk access and walk egress distance and time
TAZ to TAP Connectors
Connects each TAZ to all TAPs within the TAP maximum drive distance bull Bus TAPs ndash 4 miles bull Rail TAPs ndash 15 miles
Used to represent transit drive access and egress distance and time
ldquoOn the Flyrdquo Path Building
bull No actual links created on the network bull Connectivity is expressed in table format
ldquoOn the Flyrdquo Path Building
bull Once the access and walk connectors are created the mode choice model builds complete paths MAZ to MAZ transit paths
bull Local-only paths are built using the ldquolocalrdquo transit skim bull Express BRT Urban Rail and Commuter rail paths are all
built at the same time using the ldquopremiumrdquo transit skim bull For each MAZ to MAZ pair CT-RAMP keeps the shortest
generalized cost path for each available premium mode bull Even though only one ldquopremiumrdquo skim is built CT-RAMP
may find competing premium paths It may also find that the best path is a combination of two premium modes or a premium mode and local bus
Tour Mode Choice Model
Choice
Auto
Drive alone
GP(1)
Pay(2)
Shared ride 2
GP(3)
HOV(4)
Pay(5)
Shared ride 3+
GP(6)
HOV(7)
Pay(8)
Non-motorized
Walk(9)
Bike(10)
Transit
Walk access
Local bus(11)
Express bus(12)
BRT(13)
Urban rail(14)
Commuter rail(15)
PNR access
Local bus(16)
Express bus(17)
BRT(18)
Urban rail(19)
Commuter rail(20)
KNR access
Local bus(21)
Express bus(22)
BRT(23)
Urban rail(24)
Commuter rail(25)
School Bus(26)
Trip Mode Choice Model
bull Same nesting structure as the tour mode choice but conditional on the tour mode
bull Some trip modes may be unavailable depending on the tour mode
DA SR2 SR3+ Walk Wlk-Trn PNR-Trn KNR-Trn
DA Must - - - - - -
SR2 Can Can - Can - - -
SR3+ Can Can Can Can - - -
Walk - - - Must - - -
Wlk-Trn - Can Can Can Can - -
PNR-Trn Can Can Can Can Can Can
KNR-Trn - Can Can Can Can - Can
Trip Switching Rules Simplified
Transit Trip Reporting
bull In SERPM7 the transit boarding and alighting location can be reported in two ways ndash Trip list files (ABM output) -- Boarding TAP Alighting TAP
ndash Transit assignment (Cube output) ndash Route nodes
bull Each type of reporting has its strengths ndash Trip list file allows building detailed transit trip patterns for
population cohorts and time periods
bull Mode split reports
bull Transit trip distance frequency distributions access distance TLFDs
bull Mode to mode transfers
ndash Note ABM reports only the first boarding TAP and the last alighting TAP regardless of mode
ndash Cube output gives aggregate link volumes station to station boardings etc
User Benefit Files
bull SERPM7 can produce FTA User Benefit files for input to SUMMIT
bull User benefits remain a useful analysis tool bull Steps to produce user benefit files require some manual
intervention ndash see User Guide
SERPM ABM Reports
bull Stores ABM inputs and outputs in a relational database to generate some standard model reports
bull Consistent reporting framework to be used for analysis across model runs
bull SERPM7 user community can easily share the scripts that create the reports
bull Reports take the form of Excel workbooks bull Foundation for future development of a visualization
dashboard
Reporting Database Components
Reporting Database Components
bull Reporting ETL (extract transform and load) program ndash Loads all Cube and CT-RAMP Java model outputs into the database
ndash Written in Cube scripts and Java
bull Database ndash Stores all data used in reporting including select network skims
household person tour and trip data zonal data etc
ndash Implemented with SQL Server
bull Report scripts to generate reports ndash Written in T-SQL
bull Report packaging program ndash Generates Excel workbooks with one report per worksheet
ndash Written in Java
Reporting Database Components
bull Run time required to build database and generate reports varies with sample size and type of report ndash Several hours required to build the database for a 100 sample
ndash ~ 30 minutes to produce reports for a 10 sample
bull Report step is optional not part of a standard model run bull Report production is transparent to the user
bull hellip but users can contribute reports bull hellip and choose which reports to build at any one time
Running SERPM ABM Reports
bull Report queries reside in ctrampreports_sql time_spent_travelingsql Total weekday travel time by person type
and income group
total_trips_typesql Trips by trip mode person type county of residence and tour purpose
total_tours_typesql Tours by trip mode person type county of residence and tour purpose
tours_districtssql Tours by tour purpose and tour origin and destination districts
transit_access_time+distsql Drive to transit trip list with many trip details
hellip
Running SERPM ABM Reports
bull List of reports to run is specified in properties file ndash ctrampserpm_reportsproperties
sqlscriptsdirectory = Cserpm7ctrampreports_sql sqlscriptsschemakey = SCHEMA sqlscripts=cleanupsqltransit_access_time+distsql worksheettables=temptransittrips worksheetnames=TransitTrips workbookname = Cserpm7ctrampreports_sqlSERPM_REPORTXLS databaseschema = 2010R databaseipaddress = w-ampdx-d-sag10 databaseinstance = databaseport = 1433 databasename=SERPMABM databaseusername=serpm databasepassword=s3rpm
Adding Reports
bull Step 1 --Write report query ndash T-SQL
ndash User Guide includes a database data dictionary
bull Step 2 ndash Add query to ctrampreports_sql ndash Each query is contained in a single text file
ndash Drop file in reports folder
bull Step 3 ndash Add the query to the properties file sqlquery = Query file name
Worksheettables = Query output
Worksheetnames = Name for the report worksheet
Sample SERPM ABM Reports
bull Exhibit ctrampreports_sqlserpm_reportsxls
More information Shi-Chiang Li | shi-chianglidotstateflus |954 777 4655 Rosella Picado | picadopbworldcom | 206 382 5227 Ken Kaltenbach |kkaltenbachcorradinocom |502 587 7221

Land Use Project
Deerfield Beach
Pompano Beach
Fort Lauderdale Beach
Fort Lauderdale Beach
Hollywood Beach
South Beach
Haulover Beach
Crandon Park
Dania Beach
Bill Baggs State Park
Beach Special Generators
Land Use Project
Sample Problem
bull MINTO West Example - a mixed residentialcommercial development ndash 6500 singlemulti-family residential units in multiple TAZs
ndash 14 million square feet of non-residential space
ndash 150 room hotel
ndash 3000 student college campus
Land Use Project
MINTO WEST
Land Use Project
TAZsMAZs representing MINTO West Development
Land Use Project
Need to translate population household and employment information from developer into model input data ndash As discussed in the Population Synthesis presentation population and
household attribute estimates can be taken from other known nearby neighborhoods
bull In this sample problem first start by allocating percentages of total
households into individual MAZs within the development area
bull Keep in mind household density when estimating the number of
households in each MAZ
Land Use Project
bull In this sample employment can be assumed to include bull Retail
bull RestaurantsBars
bull Offices
bull Health services
bull Hotelmotel employment and
bull Educational employment
ndash As with households yoursquoll need to apportion the employment areas to individual MAZs while keeping in mind the types of employment expected in those locations
Land Use Project
bull Employment data is usually estimated by converting floor space available to individual types of employment through conversion factors
bull ie ndash (3000 sqft office space)(20 sqft per office employee) =
150 office employees
Land Use Project
bull Once population household and employment figures are estimated they are entered into the appropriate model input file
bull Population ndash TAZ synthetic population control file
bull Household ndash TAZ synthetic population control file
bull Employment School Parking and Special Gen ndash maz_datacsv
bull Ensure that population household and employment figures
are the same in each file
bull Prior to performing model run PopSyn must be run and user must copy output files to SERPM7 input folders
Application 6 ndashTransit Project
Transit Project ndash MetroRail North Corridor
SERPM Transit Modes
Transit Mode Tour and Trip
Mode TAP Transit Skim Mode
Tri-Rail Commuter Rail Premium
Metrorail Urban Rail Premium
I-95 Inter-County Express I-95X I-95E
Express Bus Premium
Busway BRT Premium
MDT Express Express Bus Premium
Metromover Local Bus Local Bus
MDT Local BCT Local
Palm Tran Local Local Bus Local Bus
Breeze Local Bus Local Bus
Tri-Rail Shuttles Local Bus Local Bus
SERPM Transit Modes
Transit Mode Tour and Trip
Mode TAP Transit Skim
Mode
Mode coded on the route ldquocardsrdquo
Used to specify boarding and transfer penalties for transit
path building
(most disaggregate)
Line-haul choices in the tour and trip mode choice
models
Used to create sets of TAP to TAP levels of service
(most aggregate)
Similar to SERPM 67 SERPM 7 ABM
SERPM Transit Modes S67 Mode Local (L) S7
Mode Mode Name Operator amp Name UserA4 Name Prem (P) MODE
15 Tri-Rail 11 Tri-Rail 15 Commuter P 111
14 Metrorail 25 Metrorail 14 Urban Rail P 121
X Regional LRT Regional LRT 14 LRT P 131
16 Inter-County Express Bus 33 I-95 Inter-County Express 16 Express P 151
12 Exclusive ROW Cir-Reg 13 Exclusive ROW Cir-Reg 12 Mover L 181
11 TrolleysShuttles-Reg 12 Tri-Rail Shuttles 11 Local L 191
11 TrolleysShuttles-Reg 12 Tri-Rail Shuttles 33 Local L 192
X LRT- MDT 25 MDT LRT 14 LRT P 231
16 Buses (localexpress) - MDT 27 MDT Busway Flyers 27 BRT P 241
23 Buses (localexpress) - MDT 27 MDT MAXKATBusway Local 27 BRT P 242
24 BRT - MDT 28 MDT BRTLRT 28 BRT P 243
23 Buses (localexpress) - MDT 22 MDT Express 24 Express P 251
16 Buses (localexpress) - MDT 24 MDT I-95 Exp 26 Express P 252
16 Inter-County Express Bus 24 I-95 Inter-County Express 16 Express P 253
22 Exclusive ROW Cir-MDT 26 Metromover 22 Mover L 281
21 TrolleysShuttles-MDT 21 MDT TrolleysShuttles 21 Local L 291
23 Buses (localexpress) - MDT 21 MDT Local 23 Local L 292
23 Buses (localexpress) - MDT 23 MDT Shuttle 25 Local L 293
X LRT - BCT 35 BCT LRT 37 LRT P 331
34 BCT Rapid Bus BRT 34 BCT Rapid Bus 36 BRT P 341
34 BCT Fixed-guideway BRT 35 BCT BRT 37 BRT P 342
33 Buses (localexpress) - BCT 32 BCT Breeze 34 Express P 351
33 Buses (localexpress) - BCT 33 BCT Express 35 Express P 352
32 Exclusive ROW Cir-BCT 31 BCT Exclusive ROW Cir 32 Mover L 381
31 TrolleysShuttles-BCT 31 BCT TrolleysShuttles 31 Local L 393
33 Buses (localexpress) - BCT 31 BCT Local 27 Local L 391
33 Buses (localexpress) - BCT 31 BCT Local 33 Local L 392
X LRT - Palm Tran 43 Palm Tran LRT 44 LRT P 431
44 BRT - Palm Tran 43 Palm Tran BRT 44 BRT P 441
43 Buses (localexpress) - Ptran 42 Palm Tran Exp 44 Express P 451
42 Exclusive ROW Cir-PTran 41 Palm Tran Exclusive ROW Cir 42 Mover L 481
41 TrolleysShuttles-Ptran 41 Palm Tran TrolleysShuttles 41 Local L 491
43 Buses (localexpress) - Ptran 41 Palm Tran Local 43 Local L 492
Modes Not in the 2010 Network
SERPM7 Transit Network Building
bull Typically bus routes are coded on top of existing highway links
bull SERPM7 reserves some facility type codes for transit-only use helpful to more accurately represent route ndash Caution -- make sure network integrity is preserved once transit only
links are removed
bull Rail routes require coding first fixed-guideway links
SERPM7 Transit Network Building
bull Route Attributes -- User Coded ndash Name
ndash Long Name
ndash Mode
ndash Operator
ndash Headway[1] ndash AM Peak
ndash Headway[2] ndash Midday
ndash Headway[3] ndash PM Peak
ndash UserA4 (stop dwell time)
SERPM7 Transit Network Building
bull PNR Node Attributes ndash User Coded ndash Parking Spaces
ndash Parking Cost AM
ndash Parking Cost MD
ndash Terminal Time PNR
ndash Terminal Time KNR
bull At this time parking spaces is used only to identify park-n-ride locations (parking spaces gt 0)
SERPM7 Transit Network Building
bull Transit Access Points -- Created by Cube for the ABM ndash One TAP for each stop on premium routes
bull Tri-Rail Metrorail Express Bus BRT
ndash One TAP for each Local Bus park-n-ride node
ndash Synthesized TAPs to represent access to local bus stops
bull Transit Access Point Attributes ndash TAP Mode
ndash Inherit PNR node data
Sample Highway Network with TAPs
TAPs become part of the highway network and replace the TAZ centroids when building transit skims
Transit Access Points and ldquoon the flyrdquo Path Building
bull Transit skims are built TAP to TAP
Matrix origins and destinations are TAPS
Transit Access Points and ldquoon the flyrdquo Path Building
Trip Origins and
Destinations
MAZ to MAZ
Auto Skims
TAZ to TAZ
Transit Skims
TAP to TAP
The three spatial systems are put together by the mode choice model
ldquoOn the Flyrdquo Path Building
bull TAZs TAPs and MAZs are linked via drive and access connectors prior to running CT-RAMP
rmdir OUTDIRABMTEMP S Q rmdir DATADIRABMTEMP S Q xcopy OUTDIR OUTDIRABMTEMP E I Y xcopy DATADIR DATADIRABMTEMP E I Y if(fbi=1) need to run only the first time through - kdk CUBEctramprunCreateAccessFilescmd endif mkdir logFiles taskkill im javaexe F start CUBEctramprunHhMgrcmd JDK64 HOST_IP start CUBEctramprunMtxMgrcmd HOST_IP JDK64 rem start CUBEctrampconfigrunDrivercmd copy CUBEctrampserpm_abmproperties serpm_abmproperties Y ping -n 11 127001 gt nul CUBEctramprunSERPMAbmcmd SAMPLERATE VSAMPLERATE JDK64 CUBEctramprunCreateDemandMatricescmd SAMPLERATE VSAMPLERATE JDK64 taskkill im javaexe F rmdir OUTDIRctramp S Q rmdir DATADIRctramp S Q xcopy OUTDIRABMTEMPctramp OUTDIRctramp E I Y xcopy DATADIRABMTEMPctramp DATADIRctramp E I Y
ldquoOn the Flyrdquo Path Building
MAZ to MAZ Connectors
Created by finding shortest distance paths over an all-streets network Connects all MAZs within 15 mi
Used to represent walk mode distance and time
MAZ to TAP Connectors
Created by finding shortest distance paths over an all-streets network Connects each MAZ to all TAPs within 10 mi
Used to represent transit walk access and walk egress distance and time
TAZ to TAP Connectors
Connects each TAZ to all TAPs within the TAP maximum drive distance bull Bus TAPs ndash 4 miles bull Rail TAPs ndash 15 miles
Used to represent transit drive access and egress distance and time
ldquoOn the Flyrdquo Path Building
bull No actual links created on the network bull Connectivity is expressed in table format
ldquoOn the Flyrdquo Path Building
bull Once the access and walk connectors are created the mode choice model builds complete paths MAZ to MAZ transit paths
bull Local-only paths are built using the ldquolocalrdquo transit skim bull Express BRT Urban Rail and Commuter rail paths are all
built at the same time using the ldquopremiumrdquo transit skim bull For each MAZ to MAZ pair CT-RAMP keeps the shortest
generalized cost path for each available premium mode bull Even though only one ldquopremiumrdquo skim is built CT-RAMP
may find competing premium paths It may also find that the best path is a combination of two premium modes or a premium mode and local bus
Tour Mode Choice Model
Choice
Auto
Drive alone
GP(1)
Pay(2)
Shared ride 2
GP(3)
HOV(4)
Pay(5)
Shared ride 3+
GP(6)
HOV(7)
Pay(8)
Non-motorized
Walk(9)
Bike(10)
Transit
Walk access
Local bus(11)
Express bus(12)
BRT(13)
Urban rail(14)
Commuter rail(15)
PNR access
Local bus(16)
Express bus(17)
BRT(18)
Urban rail(19)
Commuter rail(20)
KNR access
Local bus(21)
Express bus(22)
BRT(23)
Urban rail(24)
Commuter rail(25)
School Bus(26)
Trip Mode Choice Model
bull Same nesting structure as the tour mode choice but conditional on the tour mode
bull Some trip modes may be unavailable depending on the tour mode
DA SR2 SR3+ Walk Wlk-Trn PNR-Trn KNR-Trn
DA Must - - - - - -
SR2 Can Can - Can - - -
SR3+ Can Can Can Can - - -
Walk - - - Must - - -
Wlk-Trn - Can Can Can Can - -
PNR-Trn Can Can Can Can Can Can
KNR-Trn - Can Can Can Can - Can
Trip Switching Rules Simplified
Transit Trip Reporting
bull In SERPM7 the transit boarding and alighting location can be reported in two ways ndash Trip list files (ABM output) -- Boarding TAP Alighting TAP
ndash Transit assignment (Cube output) ndash Route nodes
bull Each type of reporting has its strengths ndash Trip list file allows building detailed transit trip patterns for
population cohorts and time periods
bull Mode split reports
bull Transit trip distance frequency distributions access distance TLFDs
bull Mode to mode transfers
ndash Note ABM reports only the first boarding TAP and the last alighting TAP regardless of mode
ndash Cube output gives aggregate link volumes station to station boardings etc
User Benefit Files
bull SERPM7 can produce FTA User Benefit files for input to SUMMIT
bull User benefits remain a useful analysis tool bull Steps to produce user benefit files require some manual
intervention ndash see User Guide
SERPM ABM Reports
bull Stores ABM inputs and outputs in a relational database to generate some standard model reports
bull Consistent reporting framework to be used for analysis across model runs
bull SERPM7 user community can easily share the scripts that create the reports
bull Reports take the form of Excel workbooks bull Foundation for future development of a visualization
dashboard
Reporting Database Components
Reporting Database Components
bull Reporting ETL (extract transform and load) program ndash Loads all Cube and CT-RAMP Java model outputs into the database
ndash Written in Cube scripts and Java
bull Database ndash Stores all data used in reporting including select network skims
household person tour and trip data zonal data etc
ndash Implemented with SQL Server
bull Report scripts to generate reports ndash Written in T-SQL
bull Report packaging program ndash Generates Excel workbooks with one report per worksheet
ndash Written in Java
Reporting Database Components
bull Run time required to build database and generate reports varies with sample size and type of report ndash Several hours required to build the database for a 100 sample
ndash ~ 30 minutes to produce reports for a 10 sample
bull Report step is optional not part of a standard model run bull Report production is transparent to the user
bull hellip but users can contribute reports bull hellip and choose which reports to build at any one time
Running SERPM ABM Reports
bull Report queries reside in ctrampreports_sql time_spent_travelingsql Total weekday travel time by person type
and income group
total_trips_typesql Trips by trip mode person type county of residence and tour purpose
total_tours_typesql Tours by trip mode person type county of residence and tour purpose
tours_districtssql Tours by tour purpose and tour origin and destination districts
transit_access_time+distsql Drive to transit trip list with many trip details
hellip
Running SERPM ABM Reports
bull List of reports to run is specified in properties file ndash ctrampserpm_reportsproperties
sqlscriptsdirectory = Cserpm7ctrampreports_sql sqlscriptsschemakey = SCHEMA sqlscripts=cleanupsqltransit_access_time+distsql worksheettables=temptransittrips worksheetnames=TransitTrips workbookname = Cserpm7ctrampreports_sqlSERPM_REPORTXLS databaseschema = 2010R databaseipaddress = w-ampdx-d-sag10 databaseinstance = databaseport = 1433 databasename=SERPMABM databaseusername=serpm databasepassword=s3rpm
Adding Reports
bull Step 1 --Write report query ndash T-SQL
ndash User Guide includes a database data dictionary
bull Step 2 ndash Add query to ctrampreports_sql ndash Each query is contained in a single text file
ndash Drop file in reports folder
bull Step 3 ndash Add the query to the properties file sqlquery = Query file name
Worksheettables = Query output
Worksheetnames = Name for the report worksheet
Sample SERPM ABM Reports
bull Exhibit ctrampreports_sqlserpm_reportsxls
More information Shi-Chiang Li | shi-chianglidotstateflus |954 777 4655 Rosella Picado | picadopbworldcom | 206 382 5227 Ken Kaltenbach |kkaltenbachcorradinocom |502 587 7221
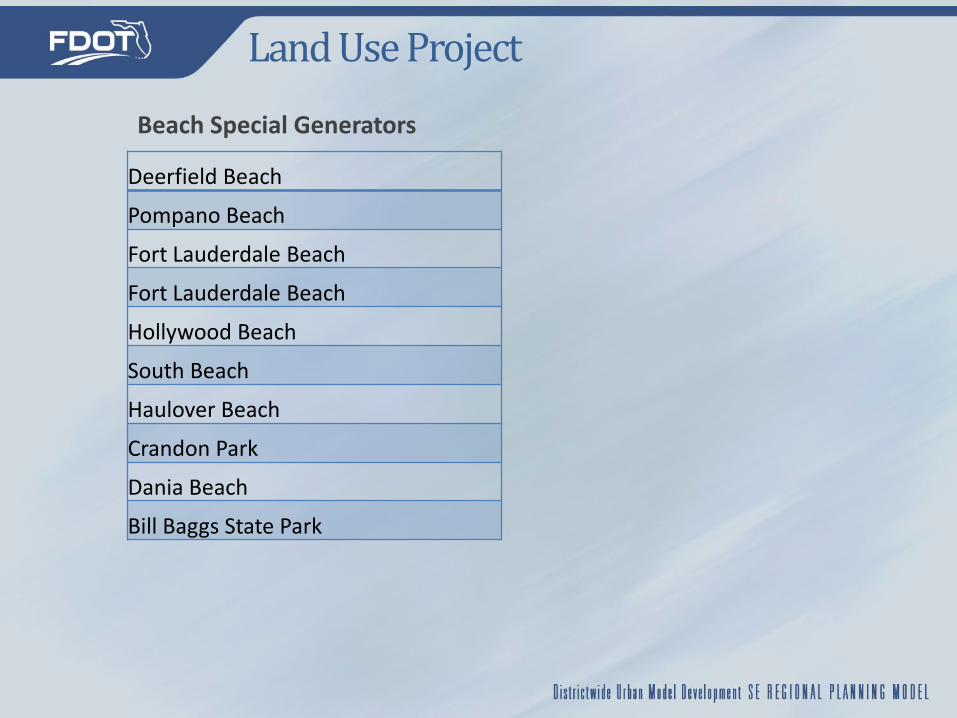
Land Use Project
bull Once population household and employment figures are estimated they are entered into the appropriate model input file
bull Population ndash TAZ synthetic population control file
bull Household ndash TAZ synthetic population control file
bull Employment School Parking and Special Gen ndash maz_datacsv
bull Ensure that population household and employment figures
are the same in each file
bull Prior to performing model run PopSyn must be run and user must copy output files to SERPM7 input folders
Application 6 ndashTransit Project
Transit Project ndash MetroRail North Corridor
SERPM Transit Modes
Transit Mode Tour and Trip
Mode TAP Transit Skim Mode
Tri-Rail Commuter Rail Premium
Metrorail Urban Rail Premium
I-95 Inter-County Express I-95X I-95E
Express Bus Premium
Busway BRT Premium
MDT Express Express Bus Premium
Metromover Local Bus Local Bus
MDT Local BCT Local
Palm Tran Local Local Bus Local Bus
Breeze Local Bus Local Bus
Tri-Rail Shuttles Local Bus Local Bus
SERPM Transit Modes
Transit Mode Tour and Trip
Mode TAP Transit Skim
Mode
Mode coded on the route ldquocardsrdquo
Used to specify boarding and transfer penalties for transit
path building
(most disaggregate)
Line-haul choices in the tour and trip mode choice
models
Used to create sets of TAP to TAP levels of service
(most aggregate)
Similar to SERPM 67 SERPM 7 ABM
SERPM Transit Modes S67 Mode Local (L) S7
Mode Mode Name Operator amp Name UserA4 Name Prem (P) MODE
15 Tri-Rail 11 Tri-Rail 15 Commuter P 111
14 Metrorail 25 Metrorail 14 Urban Rail P 121
X Regional LRT Regional LRT 14 LRT P 131
16 Inter-County Express Bus 33 I-95 Inter-County Express 16 Express P 151
12 Exclusive ROW Cir-Reg 13 Exclusive ROW Cir-Reg 12 Mover L 181
11 TrolleysShuttles-Reg 12 Tri-Rail Shuttles 11 Local L 191
11 TrolleysShuttles-Reg 12 Tri-Rail Shuttles 33 Local L 192
X LRT- MDT 25 MDT LRT 14 LRT P 231
16 Buses (localexpress) - MDT 27 MDT Busway Flyers 27 BRT P 241
23 Buses (localexpress) - MDT 27 MDT MAXKATBusway Local 27 BRT P 242
24 BRT - MDT 28 MDT BRTLRT 28 BRT P 243
23 Buses (localexpress) - MDT 22 MDT Express 24 Express P 251
16 Buses (localexpress) - MDT 24 MDT I-95 Exp 26 Express P 252
16 Inter-County Express Bus 24 I-95 Inter-County Express 16 Express P 253
22 Exclusive ROW Cir-MDT 26 Metromover 22 Mover L 281
21 TrolleysShuttles-MDT 21 MDT TrolleysShuttles 21 Local L 291
23 Buses (localexpress) - MDT 21 MDT Local 23 Local L 292
23 Buses (localexpress) - MDT 23 MDT Shuttle 25 Local L 293
X LRT - BCT 35 BCT LRT 37 LRT P 331
34 BCT Rapid Bus BRT 34 BCT Rapid Bus 36 BRT P 341
34 BCT Fixed-guideway BRT 35 BCT BRT 37 BRT P 342
33 Buses (localexpress) - BCT 32 BCT Breeze 34 Express P 351
33 Buses (localexpress) - BCT 33 BCT Express 35 Express P 352
32 Exclusive ROW Cir-BCT 31 BCT Exclusive ROW Cir 32 Mover L 381
31 TrolleysShuttles-BCT 31 BCT TrolleysShuttles 31 Local L 393
33 Buses (localexpress) - BCT 31 BCT Local 27 Local L 391
33 Buses (localexpress) - BCT 31 BCT Local 33 Local L 392
X LRT - Palm Tran 43 Palm Tran LRT 44 LRT P 431
44 BRT - Palm Tran 43 Palm Tran BRT 44 BRT P 441
43 Buses (localexpress) - Ptran 42 Palm Tran Exp 44 Express P 451
42 Exclusive ROW Cir-PTran 41 Palm Tran Exclusive ROW Cir 42 Mover L 481
41 TrolleysShuttles-Ptran 41 Palm Tran TrolleysShuttles 41 Local L 491
43 Buses (localexpress) - Ptran 41 Palm Tran Local 43 Local L 492
Modes Not in the 2010 Network
SERPM7 Transit Network Building
bull Typically bus routes are coded on top of existing highway links
bull SERPM7 reserves some facility type codes for transit-only use helpful to more accurately represent route ndash Caution -- make sure network integrity is preserved once transit only
links are removed
bull Rail routes require coding first fixed-guideway links
SERPM7 Transit Network Building
bull Route Attributes -- User Coded ndash Name
ndash Long Name
ndash Mode
ndash Operator
ndash Headway[1] ndash AM Peak
ndash Headway[2] ndash Midday
ndash Headway[3] ndash PM Peak
ndash UserA4 (stop dwell time)
SERPM7 Transit Network Building
bull PNR Node Attributes ndash User Coded ndash Parking Spaces
ndash Parking Cost AM
ndash Parking Cost MD
ndash Terminal Time PNR
ndash Terminal Time KNR
bull At this time parking spaces is used only to identify park-n-ride locations (parking spaces gt 0)
SERPM7 Transit Network Building
bull Transit Access Points -- Created by Cube for the ABM ndash One TAP for each stop on premium routes
bull Tri-Rail Metrorail Express Bus BRT
ndash One TAP for each Local Bus park-n-ride node
ndash Synthesized TAPs to represent access to local bus stops
bull Transit Access Point Attributes ndash TAP Mode
ndash Inherit PNR node data
Sample Highway Network with TAPs
TAPs become part of the highway network and replace the TAZ centroids when building transit skims
Transit Access Points and ldquoon the flyrdquo Path Building
bull Transit skims are built TAP to TAP
Matrix origins and destinations are TAPS
Transit Access Points and ldquoon the flyrdquo Path Building
Trip Origins and
Destinations
MAZ to MAZ
Auto Skims
TAZ to TAZ
Transit Skims
TAP to TAP
The three spatial systems are put together by the mode choice model
ldquoOn the Flyrdquo Path Building
bull TAZs TAPs and MAZs are linked via drive and access connectors prior to running CT-RAMP
rmdir OUTDIRABMTEMP S Q rmdir DATADIRABMTEMP S Q xcopy OUTDIR OUTDIRABMTEMP E I Y xcopy DATADIR DATADIRABMTEMP E I Y if(fbi=1) need to run only the first time through - kdk CUBEctramprunCreateAccessFilescmd endif mkdir logFiles taskkill im javaexe F start CUBEctramprunHhMgrcmd JDK64 HOST_IP start CUBEctramprunMtxMgrcmd HOST_IP JDK64 rem start CUBEctrampconfigrunDrivercmd copy CUBEctrampserpm_abmproperties serpm_abmproperties Y ping -n 11 127001 gt nul CUBEctramprunSERPMAbmcmd SAMPLERATE VSAMPLERATE JDK64 CUBEctramprunCreateDemandMatricescmd SAMPLERATE VSAMPLERATE JDK64 taskkill im javaexe F rmdir OUTDIRctramp S Q rmdir DATADIRctramp S Q xcopy OUTDIRABMTEMPctramp OUTDIRctramp E I Y xcopy DATADIRABMTEMPctramp DATADIRctramp E I Y
ldquoOn the Flyrdquo Path Building
MAZ to MAZ Connectors
Created by finding shortest distance paths over an all-streets network Connects all MAZs within 15 mi
Used to represent walk mode distance and time
MAZ to TAP Connectors
Created by finding shortest distance paths over an all-streets network Connects each MAZ to all TAPs within 10 mi
Used to represent transit walk access and walk egress distance and time
TAZ to TAP Connectors
Connects each TAZ to all TAPs within the TAP maximum drive distance bull Bus TAPs ndash 4 miles bull Rail TAPs ndash 15 miles
Used to represent transit drive access and egress distance and time
ldquoOn the Flyrdquo Path Building
bull No actual links created on the network bull Connectivity is expressed in table format
ldquoOn the Flyrdquo Path Building
bull Once the access and walk connectors are created the mode choice model builds complete paths MAZ to MAZ transit paths
bull Local-only paths are built using the ldquolocalrdquo transit skim bull Express BRT Urban Rail and Commuter rail paths are all
built at the same time using the ldquopremiumrdquo transit skim bull For each MAZ to MAZ pair CT-RAMP keeps the shortest
generalized cost path for each available premium mode bull Even though only one ldquopremiumrdquo skim is built CT-RAMP
may find competing premium paths It may also find that the best path is a combination of two premium modes or a premium mode and local bus
Tour Mode Choice Model
Choice
Auto
Drive alone
GP(1)
Pay(2)
Shared ride 2
GP(3)
HOV(4)
Pay(5)
Shared ride 3+
GP(6)
HOV(7)
Pay(8)
Non-motorized
Walk(9)
Bike(10)
Transit
Walk access
Local bus(11)
Express bus(12)
BRT(13)
Urban rail(14)
Commuter rail(15)
PNR access
Local bus(16)
Express bus(17)
BRT(18)
Urban rail(19)
Commuter rail(20)
KNR access
Local bus(21)
Express bus(22)
BRT(23)
Urban rail(24)
Commuter rail(25)
School Bus(26)
Trip Mode Choice Model
bull Same nesting structure as the tour mode choice but conditional on the tour mode
bull Some trip modes may be unavailable depending on the tour mode
DA SR2 SR3+ Walk Wlk-Trn PNR-Trn KNR-Trn
DA Must - - - - - -
SR2 Can Can - Can - - -
SR3+ Can Can Can Can - - -
Walk - - - Must - - -
Wlk-Trn - Can Can Can Can - -
PNR-Trn Can Can Can Can Can Can
KNR-Trn - Can Can Can Can - Can
Trip Switching Rules Simplified
Transit Trip Reporting
bull In SERPM7 the transit boarding and alighting location can be reported in two ways ndash Trip list files (ABM output) -- Boarding TAP Alighting TAP
ndash Transit assignment (Cube output) ndash Route nodes
bull Each type of reporting has its strengths ndash Trip list file allows building detailed transit trip patterns for
population cohorts and time periods
bull Mode split reports
bull Transit trip distance frequency distributions access distance TLFDs
bull Mode to mode transfers
ndash Note ABM reports only the first boarding TAP and the last alighting TAP regardless of mode
ndash Cube output gives aggregate link volumes station to station boardings etc
User Benefit Files
bull SERPM7 can produce FTA User Benefit files for input to SUMMIT
bull User benefits remain a useful analysis tool bull Steps to produce user benefit files require some manual
intervention ndash see User Guide
SERPM ABM Reports
bull Stores ABM inputs and outputs in a relational database to generate some standard model reports
bull Consistent reporting framework to be used for analysis across model runs
bull SERPM7 user community can easily share the scripts that create the reports
bull Reports take the form of Excel workbooks bull Foundation for future development of a visualization
dashboard
Reporting Database Components
Reporting Database Components
bull Reporting ETL (extract transform and load) program ndash Loads all Cube and CT-RAMP Java model outputs into the database
ndash Written in Cube scripts and Java
bull Database ndash Stores all data used in reporting including select network skims
household person tour and trip data zonal data etc
ndash Implemented with SQL Server
bull Report scripts to generate reports ndash Written in T-SQL
bull Report packaging program ndash Generates Excel workbooks with one report per worksheet
ndash Written in Java
Reporting Database Components
bull Run time required to build database and generate reports varies with sample size and type of report ndash Several hours required to build the database for a 100 sample
ndash ~ 30 minutes to produce reports for a 10 sample
bull Report step is optional not part of a standard model run bull Report production is transparent to the user
bull hellip but users can contribute reports bull hellip and choose which reports to build at any one time
Running SERPM ABM Reports
bull Report queries reside in ctrampreports_sql time_spent_travelingsql Total weekday travel time by person type
and income group
total_trips_typesql Trips by trip mode person type county of residence and tour purpose
total_tours_typesql Tours by trip mode person type county of residence and tour purpose
tours_districtssql Tours by tour purpose and tour origin and destination districts
transit_access_time+distsql Drive to transit trip list with many trip details
hellip
Running SERPM ABM Reports
bull List of reports to run is specified in properties file ndash ctrampserpm_reportsproperties
sqlscriptsdirectory = Cserpm7ctrampreports_sql sqlscriptsschemakey = SCHEMA sqlscripts=cleanupsqltransit_access_time+distsql worksheettables=temptransittrips worksheetnames=TransitTrips workbookname = Cserpm7ctrampreports_sqlSERPM_REPORTXLS databaseschema = 2010R databaseipaddress = w-ampdx-d-sag10 databaseinstance = databaseport = 1433 databasename=SERPMABM databaseusername=serpm databasepassword=s3rpm
Adding Reports
bull Step 1 --Write report query ndash T-SQL
ndash User Guide includes a database data dictionary
bull Step 2 ndash Add query to ctrampreports_sql ndash Each query is contained in a single text file
ndash Drop file in reports folder
bull Step 3 ndash Add the query to the properties file sqlquery = Query file name
Worksheettables = Query output
Worksheetnames = Name for the report worksheet
Sample SERPM ABM Reports
bull Exhibit ctrampreports_sqlserpm_reportsxls
More information Shi-Chiang Li | shi-chianglidotstateflus |954 777 4655 Rosella Picado | picadopbworldcom | 206 382 5227 Ken Kaltenbach |kkaltenbachcorradinocom |502 587 7221

SERPM Transit Modes
Transit Mode Tour and Trip
Mode TAP Transit Skim
Mode
Mode coded on the route ldquocardsrdquo
Used to specify boarding and transfer penalties for transit
path building
(most disaggregate)
Line-haul choices in the tour and trip mode choice
models
Used to create sets of TAP to TAP levels of service
(most aggregate)
Similar to SERPM 67 SERPM 7 ABM
SERPM Transit Modes S67 Mode Local (L) S7
Mode Mode Name Operator amp Name UserA4 Name Prem (P) MODE
15 Tri-Rail 11 Tri-Rail 15 Commuter P 111
14 Metrorail 25 Metrorail 14 Urban Rail P 121
X Regional LRT Regional LRT 14 LRT P 131
16 Inter-County Express Bus 33 I-95 Inter-County Express 16 Express P 151
12 Exclusive ROW Cir-Reg 13 Exclusive ROW Cir-Reg 12 Mover L 181
11 TrolleysShuttles-Reg 12 Tri-Rail Shuttles 11 Local L 191
11 TrolleysShuttles-Reg 12 Tri-Rail Shuttles 33 Local L 192
X LRT- MDT 25 MDT LRT 14 LRT P 231
16 Buses (localexpress) - MDT 27 MDT Busway Flyers 27 BRT P 241
23 Buses (localexpress) - MDT 27 MDT MAXKATBusway Local 27 BRT P 242
24 BRT - MDT 28 MDT BRTLRT 28 BRT P 243
23 Buses (localexpress) - MDT 22 MDT Express 24 Express P 251
16 Buses (localexpress) - MDT 24 MDT I-95 Exp 26 Express P 252
16 Inter-County Express Bus 24 I-95 Inter-County Express 16 Express P 253
22 Exclusive ROW Cir-MDT 26 Metromover 22 Mover L 281
21 TrolleysShuttles-MDT 21 MDT TrolleysShuttles 21 Local L 291
23 Buses (localexpress) - MDT 21 MDT Local 23 Local L 292
23 Buses (localexpress) - MDT 23 MDT Shuttle 25 Local L 293
X LRT - BCT 35 BCT LRT 37 LRT P 331
34 BCT Rapid Bus BRT 34 BCT Rapid Bus 36 BRT P 341
34 BCT Fixed-guideway BRT 35 BCT BRT 37 BRT P 342
33 Buses (localexpress) - BCT 32 BCT Breeze 34 Express P 351
33 Buses (localexpress) - BCT 33 BCT Express 35 Express P 352
32 Exclusive ROW Cir-BCT 31 BCT Exclusive ROW Cir 32 Mover L 381
31 TrolleysShuttles-BCT 31 BCT TrolleysShuttles 31 Local L 393
33 Buses (localexpress) - BCT 31 BCT Local 27 Local L 391
33 Buses (localexpress) - BCT 31 BCT Local 33 Local L 392
X LRT - Palm Tran 43 Palm Tran LRT 44 LRT P 431
44 BRT - Palm Tran 43 Palm Tran BRT 44 BRT P 441
43 Buses (localexpress) - Ptran 42 Palm Tran Exp 44 Express P 451
42 Exclusive ROW Cir-PTran 41 Palm Tran Exclusive ROW Cir 42 Mover L 481
41 TrolleysShuttles-Ptran 41 Palm Tran TrolleysShuttles 41 Local L 491
43 Buses (localexpress) - Ptran 41 Palm Tran Local 43 Local L 492
Modes Not in the 2010 Network
SERPM7 Transit Network Building
bull Typically bus routes are coded on top of existing highway links
bull SERPM7 reserves some facility type codes for transit-only use helpful to more accurately represent route ndash Caution -- make sure network integrity is preserved once transit only
links are removed
bull Rail routes require coding first fixed-guideway links
SERPM7 Transit Network Building
bull Route Attributes -- User Coded ndash Name
ndash Long Name
ndash Mode
ndash Operator
ndash Headway[1] ndash AM Peak
ndash Headway[2] ndash Midday
ndash Headway[3] ndash PM Peak
ndash UserA4 (stop dwell time)
SERPM7 Transit Network Building
bull PNR Node Attributes ndash User Coded ndash Parking Spaces
ndash Parking Cost AM
ndash Parking Cost MD
ndash Terminal Time PNR
ndash Terminal Time KNR
bull At this time parking spaces is used only to identify park-n-ride locations (parking spaces gt 0)
SERPM7 Transit Network Building
bull Transit Access Points -- Created by Cube for the ABM ndash One TAP for each stop on premium routes
bull Tri-Rail Metrorail Express Bus BRT
ndash One TAP for each Local Bus park-n-ride node
ndash Synthesized TAPs to represent access to local bus stops
bull Transit Access Point Attributes ndash TAP Mode
ndash Inherit PNR node data
Sample Highway Network with TAPs
TAPs become part of the highway network and replace the TAZ centroids when building transit skims
Transit Access Points and ldquoon the flyrdquo Path Building
bull Transit skims are built TAP to TAP
Matrix origins and destinations are TAPS
Transit Access Points and ldquoon the flyrdquo Path Building
Trip Origins and
Destinations
MAZ to MAZ
Auto Skims
TAZ to TAZ
Transit Skims
TAP to TAP
The three spatial systems are put together by the mode choice model
ldquoOn the Flyrdquo Path Building
bull TAZs TAPs and MAZs are linked via drive and access connectors prior to running CT-RAMP
rmdir OUTDIRABMTEMP S Q rmdir DATADIRABMTEMP S Q xcopy OUTDIR OUTDIRABMTEMP E I Y xcopy DATADIR DATADIRABMTEMP E I Y if(fbi=1) need to run only the first time through - kdk CUBEctramprunCreateAccessFilescmd endif mkdir logFiles taskkill im javaexe F start CUBEctramprunHhMgrcmd JDK64 HOST_IP start CUBEctramprunMtxMgrcmd HOST_IP JDK64 rem start CUBEctrampconfigrunDrivercmd copy CUBEctrampserpm_abmproperties serpm_abmproperties Y ping -n 11 127001 gt nul CUBEctramprunSERPMAbmcmd SAMPLERATE VSAMPLERATE JDK64 CUBEctramprunCreateDemandMatricescmd SAMPLERATE VSAMPLERATE JDK64 taskkill im javaexe F rmdir OUTDIRctramp S Q rmdir DATADIRctramp S Q xcopy OUTDIRABMTEMPctramp OUTDIRctramp E I Y xcopy DATADIRABMTEMPctramp DATADIRctramp E I Y
ldquoOn the Flyrdquo Path Building
MAZ to MAZ Connectors
Created by finding shortest distance paths over an all-streets network Connects all MAZs within 15 mi
Used to represent walk mode distance and time
MAZ to TAP Connectors
Created by finding shortest distance paths over an all-streets network Connects each MAZ to all TAPs within 10 mi
Used to represent transit walk access and walk egress distance and time
TAZ to TAP Connectors
Connects each TAZ to all TAPs within the TAP maximum drive distance bull Bus TAPs ndash 4 miles bull Rail TAPs ndash 15 miles
Used to represent transit drive access and egress distance and time
ldquoOn the Flyrdquo Path Building
bull No actual links created on the network bull Connectivity is expressed in table format
ldquoOn the Flyrdquo Path Building
bull Once the access and walk connectors are created the mode choice model builds complete paths MAZ to MAZ transit paths
bull Local-only paths are built using the ldquolocalrdquo transit skim bull Express BRT Urban Rail and Commuter rail paths are all
built at the same time using the ldquopremiumrdquo transit skim bull For each MAZ to MAZ pair CT-RAMP keeps the shortest
generalized cost path for each available premium mode bull Even though only one ldquopremiumrdquo skim is built CT-RAMP
may find competing premium paths It may also find that the best path is a combination of two premium modes or a premium mode and local bus
Tour Mode Choice Model
Choice
Auto
Drive alone
GP(1)
Pay(2)
Shared ride 2
GP(3)
HOV(4)
Pay(5)
Shared ride 3+
GP(6)
HOV(7)
Pay(8)
Non-motorized
Walk(9)
Bike(10)
Transit
Walk access
Local bus(11)
Express bus(12)
BRT(13)
Urban rail(14)
Commuter rail(15)
PNR access
Local bus(16)
Express bus(17)
BRT(18)
Urban rail(19)
Commuter rail(20)
KNR access
Local bus(21)
Express bus(22)
BRT(23)
Urban rail(24)
Commuter rail(25)
School Bus(26)
Trip Mode Choice Model
bull Same nesting structure as the tour mode choice but conditional on the tour mode
bull Some trip modes may be unavailable depending on the tour mode
DA SR2 SR3+ Walk Wlk-Trn PNR-Trn KNR-Trn
DA Must - - - - - -
SR2 Can Can - Can - - -
SR3+ Can Can Can Can - - -
Walk - - - Must - - -
Wlk-Trn - Can Can Can Can - -
PNR-Trn Can Can Can Can Can Can
KNR-Trn - Can Can Can Can - Can
Trip Switching Rules Simplified
Transit Trip Reporting
bull In SERPM7 the transit boarding and alighting location can be reported in two ways ndash Trip list files (ABM output) -- Boarding TAP Alighting TAP
ndash Transit assignment (Cube output) ndash Route nodes
bull Each type of reporting has its strengths ndash Trip list file allows building detailed transit trip patterns for
population cohorts and time periods
bull Mode split reports
bull Transit trip distance frequency distributions access distance TLFDs
bull Mode to mode transfers
ndash Note ABM reports only the first boarding TAP and the last alighting TAP regardless of mode
ndash Cube output gives aggregate link volumes station to station boardings etc
User Benefit Files
bull SERPM7 can produce FTA User Benefit files for input to SUMMIT
bull User benefits remain a useful analysis tool bull Steps to produce user benefit files require some manual
intervention ndash see User Guide
SERPM ABM Reports
bull Stores ABM inputs and outputs in a relational database to generate some standard model reports
bull Consistent reporting framework to be used for analysis across model runs
bull SERPM7 user community can easily share the scripts that create the reports
bull Reports take the form of Excel workbooks bull Foundation for future development of a visualization
dashboard
Reporting Database Components
Reporting Database Components
bull Reporting ETL (extract transform and load) program ndash Loads all Cube and CT-RAMP Java model outputs into the database
ndash Written in Cube scripts and Java
bull Database ndash Stores all data used in reporting including select network skims
household person tour and trip data zonal data etc
ndash Implemented with SQL Server
bull Report scripts to generate reports ndash Written in T-SQL
bull Report packaging program ndash Generates Excel workbooks with one report per worksheet
ndash Written in Java
Reporting Database Components
bull Run time required to build database and generate reports varies with sample size and type of report ndash Several hours required to build the database for a 100 sample
ndash ~ 30 minutes to produce reports for a 10 sample
bull Report step is optional not part of a standard model run bull Report production is transparent to the user
bull hellip but users can contribute reports bull hellip and choose which reports to build at any one time
Running SERPM ABM Reports
bull Report queries reside in ctrampreports_sql time_spent_travelingsql Total weekday travel time by person type
and income group
total_trips_typesql Trips by trip mode person type county of residence and tour purpose
total_tours_typesql Tours by trip mode person type county of residence and tour purpose
tours_districtssql Tours by tour purpose and tour origin and destination districts
transit_access_time+distsql Drive to transit trip list with many trip details
hellip
Running SERPM ABM Reports
bull List of reports to run is specified in properties file ndash ctrampserpm_reportsproperties
sqlscriptsdirectory = Cserpm7ctrampreports_sql sqlscriptsschemakey = SCHEMA sqlscripts=cleanupsqltransit_access_time+distsql worksheettables=temptransittrips worksheetnames=TransitTrips workbookname = Cserpm7ctrampreports_sqlSERPM_REPORTXLS databaseschema = 2010R databaseipaddress = w-ampdx-d-sag10 databaseinstance = databaseport = 1433 databasename=SERPMABM databaseusername=serpm databasepassword=s3rpm
Adding Reports
bull Step 1 --Write report query ndash T-SQL
ndash User Guide includes a database data dictionary
bull Step 2 ndash Add query to ctrampreports_sql ndash Each query is contained in a single text file
ndash Drop file in reports folder
bull Step 3 ndash Add the query to the properties file sqlquery = Query file name
Worksheettables = Query output
Worksheetnames = Name for the report worksheet
Sample SERPM ABM Reports
bull Exhibit ctrampreports_sqlserpm_reportsxls
More information Shi-Chiang Li | shi-chianglidotstateflus |954 777 4655 Rosella Picado | picadopbworldcom | 206 382 5227 Ken Kaltenbach |kkaltenbachcorradinocom |502 587 7221

SERPM7 Transit Network Building
bull Transit Access Points -- Created by Cube for the ABM ndash One TAP for each stop on premium routes
bull Tri-Rail Metrorail Express Bus BRT
ndash One TAP for each Local Bus park-n-ride node
ndash Synthesized TAPs to represent access to local bus stops
bull Transit Access Point Attributes ndash TAP Mode
ndash Inherit PNR node data
Sample Highway Network with TAPs
TAPs become part of the highway network and replace the TAZ centroids when building transit skims
Transit Access Points and ldquoon the flyrdquo Path Building
bull Transit skims are built TAP to TAP
Matrix origins and destinations are TAPS
Transit Access Points and ldquoon the flyrdquo Path Building
Trip Origins and
Destinations
MAZ to MAZ
Auto Skims
TAZ to TAZ
Transit Skims
TAP to TAP
The three spatial systems are put together by the mode choice model
ldquoOn the Flyrdquo Path Building
bull TAZs TAPs and MAZs are linked via drive and access connectors prior to running CT-RAMP
rmdir OUTDIRABMTEMP S Q rmdir DATADIRABMTEMP S Q xcopy OUTDIR OUTDIRABMTEMP E I Y xcopy DATADIR DATADIRABMTEMP E I Y if(fbi=1) need to run only the first time through - kdk CUBEctramprunCreateAccessFilescmd endif mkdir logFiles taskkill im javaexe F start CUBEctramprunHhMgrcmd JDK64 HOST_IP start CUBEctramprunMtxMgrcmd HOST_IP JDK64 rem start CUBEctrampconfigrunDrivercmd copy CUBEctrampserpm_abmproperties serpm_abmproperties Y ping -n 11 127001 gt nul CUBEctramprunSERPMAbmcmd SAMPLERATE VSAMPLERATE JDK64 CUBEctramprunCreateDemandMatricescmd SAMPLERATE VSAMPLERATE JDK64 taskkill im javaexe F rmdir OUTDIRctramp S Q rmdir DATADIRctramp S Q xcopy OUTDIRABMTEMPctramp OUTDIRctramp E I Y xcopy DATADIRABMTEMPctramp DATADIRctramp E I Y
ldquoOn the Flyrdquo Path Building
MAZ to MAZ Connectors
Created by finding shortest distance paths over an all-streets network Connects all MAZs within 15 mi
Used to represent walk mode distance and time
MAZ to TAP Connectors
Created by finding shortest distance paths over an all-streets network Connects each MAZ to all TAPs within 10 mi
Used to represent transit walk access and walk egress distance and time
TAZ to TAP Connectors
Connects each TAZ to all TAPs within the TAP maximum drive distance bull Bus TAPs ndash 4 miles bull Rail TAPs ndash 15 miles
Used to represent transit drive access and egress distance and time
ldquoOn the Flyrdquo Path Building
bull No actual links created on the network bull Connectivity is expressed in table format
ldquoOn the Flyrdquo Path Building
bull Once the access and walk connectors are created the mode choice model builds complete paths MAZ to MAZ transit paths
bull Local-only paths are built using the ldquolocalrdquo transit skim bull Express BRT Urban Rail and Commuter rail paths are all
built at the same time using the ldquopremiumrdquo transit skim bull For each MAZ to MAZ pair CT-RAMP keeps the shortest
generalized cost path for each available premium mode bull Even though only one ldquopremiumrdquo skim is built CT-RAMP
may find competing premium paths It may also find that the best path is a combination of two premium modes or a premium mode and local bus
Tour Mode Choice Model
Choice
Auto
Drive alone
GP(1)
Pay(2)
Shared ride 2
GP(3)
HOV(4)
Pay(5)
Shared ride 3+
GP(6)
HOV(7)
Pay(8)
Non-motorized
Walk(9)
Bike(10)
Transit
Walk access
Local bus(11)
Express bus(12)
BRT(13)
Urban rail(14)
Commuter rail(15)
PNR access
Local bus(16)
Express bus(17)
BRT(18)
Urban rail(19)
Commuter rail(20)
KNR access
Local bus(21)
Express bus(22)
BRT(23)
Urban rail(24)
Commuter rail(25)
School Bus(26)
Trip Mode Choice Model
bull Same nesting structure as the tour mode choice but conditional on the tour mode
bull Some trip modes may be unavailable depending on the tour mode
DA SR2 SR3+ Walk Wlk-Trn PNR-Trn KNR-Trn
DA Must - - - - - -
SR2 Can Can - Can - - -
SR3+ Can Can Can Can - - -
Walk - - - Must - - -
Wlk-Trn - Can Can Can Can - -
PNR-Trn Can Can Can Can Can Can
KNR-Trn - Can Can Can Can - Can
Trip Switching Rules Simplified
Transit Trip Reporting
bull In SERPM7 the transit boarding and alighting location can be reported in two ways ndash Trip list files (ABM output) -- Boarding TAP Alighting TAP
ndash Transit assignment (Cube output) ndash Route nodes
bull Each type of reporting has its strengths ndash Trip list file allows building detailed transit trip patterns for
population cohorts and time periods
bull Mode split reports
bull Transit trip distance frequency distributions access distance TLFDs
bull Mode to mode transfers
ndash Note ABM reports only the first boarding TAP and the last alighting TAP regardless of mode
ndash Cube output gives aggregate link volumes station to station boardings etc
User Benefit Files
bull SERPM7 can produce FTA User Benefit files for input to SUMMIT
bull User benefits remain a useful analysis tool bull Steps to produce user benefit files require some manual
intervention ndash see User Guide
SERPM ABM Reports
bull Stores ABM inputs and outputs in a relational database to generate some standard model reports
bull Consistent reporting framework to be used for analysis across model runs
bull SERPM7 user community can easily share the scripts that create the reports
bull Reports take the form of Excel workbooks bull Foundation for future development of a visualization
dashboard
Reporting Database Components
Reporting Database Components
bull Reporting ETL (extract transform and load) program ndash Loads all Cube and CT-RAMP Java model outputs into the database
ndash Written in Cube scripts and Java
bull Database ndash Stores all data used in reporting including select network skims
household person tour and trip data zonal data etc
ndash Implemented with SQL Server
bull Report scripts to generate reports ndash Written in T-SQL
bull Report packaging program ndash Generates Excel workbooks with one report per worksheet
ndash Written in Java
Reporting Database Components
bull Run time required to build database and generate reports varies with sample size and type of report ndash Several hours required to build the database for a 100 sample
ndash ~ 30 minutes to produce reports for a 10 sample
bull Report step is optional not part of a standard model run bull Report production is transparent to the user
bull hellip but users can contribute reports bull hellip and choose which reports to build at any one time
Running SERPM ABM Reports
bull Report queries reside in ctrampreports_sql time_spent_travelingsql Total weekday travel time by person type
and income group
total_trips_typesql Trips by trip mode person type county of residence and tour purpose
total_tours_typesql Tours by trip mode person type county of residence and tour purpose
tours_districtssql Tours by tour purpose and tour origin and destination districts
transit_access_time+distsql Drive to transit trip list with many trip details
hellip
Running SERPM ABM Reports
bull List of reports to run is specified in properties file ndash ctrampserpm_reportsproperties
sqlscriptsdirectory = Cserpm7ctrampreports_sql sqlscriptsschemakey = SCHEMA sqlscripts=cleanupsqltransit_access_time+distsql worksheettables=temptransittrips worksheetnames=TransitTrips workbookname = Cserpm7ctrampreports_sqlSERPM_REPORTXLS databaseschema = 2010R databaseipaddress = w-ampdx-d-sag10 databaseinstance = databaseport = 1433 databasename=SERPMABM databaseusername=serpm databasepassword=s3rpm
Adding Reports
bull Step 1 --Write report query ndash T-SQL
ndash User Guide includes a database data dictionary
bull Step 2 ndash Add query to ctrampreports_sql ndash Each query is contained in a single text file
ndash Drop file in reports folder
bull Step 3 ndash Add the query to the properties file sqlquery = Query file name
Worksheettables = Query output
Worksheetnames = Name for the report worksheet
Sample SERPM ABM Reports
bull Exhibit ctrampreports_sqlserpm_reportsxls
More information Shi-Chiang Li | shi-chianglidotstateflus |954 777 4655 Rosella Picado | picadopbworldcom | 206 382 5227 Ken Kaltenbach |kkaltenbachcorradinocom |502 587 7221

Transit Access Points and ldquoon the flyrdquo Path Building
Trip Origins and
Destinations
MAZ to MAZ
Auto Skims
TAZ to TAZ
Transit Skims
TAP to TAP
The three spatial systems are put together by the mode choice model
ldquoOn the Flyrdquo Path Building
bull TAZs TAPs and MAZs are linked via drive and access connectors prior to running CT-RAMP
rmdir OUTDIRABMTEMP S Q rmdir DATADIRABMTEMP S Q xcopy OUTDIR OUTDIRABMTEMP E I Y xcopy DATADIR DATADIRABMTEMP E I Y if(fbi=1) need to run only the first time through - kdk CUBEctramprunCreateAccessFilescmd endif mkdir logFiles taskkill im javaexe F start CUBEctramprunHhMgrcmd JDK64 HOST_IP start CUBEctramprunMtxMgrcmd HOST_IP JDK64 rem start CUBEctrampconfigrunDrivercmd copy CUBEctrampserpm_abmproperties serpm_abmproperties Y ping -n 11 127001 gt nul CUBEctramprunSERPMAbmcmd SAMPLERATE VSAMPLERATE JDK64 CUBEctramprunCreateDemandMatricescmd SAMPLERATE VSAMPLERATE JDK64 taskkill im javaexe F rmdir OUTDIRctramp S Q rmdir DATADIRctramp S Q xcopy OUTDIRABMTEMPctramp OUTDIRctramp E I Y xcopy DATADIRABMTEMPctramp DATADIRctramp E I Y
ldquoOn the Flyrdquo Path Building
MAZ to MAZ Connectors
Created by finding shortest distance paths over an all-streets network Connects all MAZs within 15 mi
Used to represent walk mode distance and time
MAZ to TAP Connectors
Created by finding shortest distance paths over an all-streets network Connects each MAZ to all TAPs within 10 mi
Used to represent transit walk access and walk egress distance and time
TAZ to TAP Connectors
Connects each TAZ to all TAPs within the TAP maximum drive distance bull Bus TAPs ndash 4 miles bull Rail TAPs ndash 15 miles
Used to represent transit drive access and egress distance and time
ldquoOn the Flyrdquo Path Building
bull No actual links created on the network bull Connectivity is expressed in table format
ldquoOn the Flyrdquo Path Building
bull Once the access and walk connectors are created the mode choice model builds complete paths MAZ to MAZ transit paths
bull Local-only paths are built using the ldquolocalrdquo transit skim bull Express BRT Urban Rail and Commuter rail paths are all
built at the same time using the ldquopremiumrdquo transit skim bull For each MAZ to MAZ pair CT-RAMP keeps the shortest
generalized cost path for each available premium mode bull Even though only one ldquopremiumrdquo skim is built CT-RAMP
may find competing premium paths It may also find that the best path is a combination of two premium modes or a premium mode and local bus
Tour Mode Choice Model
Choice
Auto
Drive alone
GP(1)
Pay(2)
Shared ride 2
GP(3)
HOV(4)
Pay(5)
Shared ride 3+
GP(6)
HOV(7)
Pay(8)
Non-motorized
Walk(9)
Bike(10)
Transit
Walk access
Local bus(11)
Express bus(12)
BRT(13)
Urban rail(14)
Commuter rail(15)
PNR access
Local bus(16)
Express bus(17)
BRT(18)
Urban rail(19)
Commuter rail(20)
KNR access
Local bus(21)
Express bus(22)
BRT(23)
Urban rail(24)
Commuter rail(25)
School Bus(26)
Trip Mode Choice Model
bull Same nesting structure as the tour mode choice but conditional on the tour mode
bull Some trip modes may be unavailable depending on the tour mode
DA SR2 SR3+ Walk Wlk-Trn PNR-Trn KNR-Trn
DA Must - - - - - -
SR2 Can Can - Can - - -
SR3+ Can Can Can Can - - -
Walk - - - Must - - -
Wlk-Trn - Can Can Can Can - -
PNR-Trn Can Can Can Can Can Can
KNR-Trn - Can Can Can Can - Can
Trip Switching Rules Simplified
Transit Trip Reporting
bull In SERPM7 the transit boarding and alighting location can be reported in two ways ndash Trip list files (ABM output) -- Boarding TAP Alighting TAP
ndash Transit assignment (Cube output) ndash Route nodes
bull Each type of reporting has its strengths ndash Trip list file allows building detailed transit trip patterns for
population cohorts and time periods
bull Mode split reports
bull Transit trip distance frequency distributions access distance TLFDs
bull Mode to mode transfers
ndash Note ABM reports only the first boarding TAP and the last alighting TAP regardless of mode
ndash Cube output gives aggregate link volumes station to station boardings etc
User Benefit Files
bull SERPM7 can produce FTA User Benefit files for input to SUMMIT
bull User benefits remain a useful analysis tool bull Steps to produce user benefit files require some manual
intervention ndash see User Guide
SERPM ABM Reports
bull Stores ABM inputs and outputs in a relational database to generate some standard model reports
bull Consistent reporting framework to be used for analysis across model runs
bull SERPM7 user community can easily share the scripts that create the reports
bull Reports take the form of Excel workbooks bull Foundation for future development of a visualization
dashboard
Reporting Database Components
Reporting Database Components
bull Reporting ETL (extract transform and load) program ndash Loads all Cube and CT-RAMP Java model outputs into the database
ndash Written in Cube scripts and Java
bull Database ndash Stores all data used in reporting including select network skims
household person tour and trip data zonal data etc
ndash Implemented with SQL Server
bull Report scripts to generate reports ndash Written in T-SQL
bull Report packaging program ndash Generates Excel workbooks with one report per worksheet
ndash Written in Java
Reporting Database Components
bull Run time required to build database and generate reports varies with sample size and type of report ndash Several hours required to build the database for a 100 sample
ndash ~ 30 minutes to produce reports for a 10 sample
bull Report step is optional not part of a standard model run bull Report production is transparent to the user
bull hellip but users can contribute reports bull hellip and choose which reports to build at any one time
Running SERPM ABM Reports
bull Report queries reside in ctrampreports_sql time_spent_travelingsql Total weekday travel time by person type
and income group
total_trips_typesql Trips by trip mode person type county of residence and tour purpose
total_tours_typesql Tours by trip mode person type county of residence and tour purpose
tours_districtssql Tours by tour purpose and tour origin and destination districts
transit_access_time+distsql Drive to transit trip list with many trip details
hellip
Running SERPM ABM Reports
bull List of reports to run is specified in properties file ndash ctrampserpm_reportsproperties
sqlscriptsdirectory = Cserpm7ctrampreports_sql sqlscriptsschemakey = SCHEMA sqlscripts=cleanupsqltransit_access_time+distsql worksheettables=temptransittrips worksheetnames=TransitTrips workbookname = Cserpm7ctrampreports_sqlSERPM_REPORTXLS databaseschema = 2010R databaseipaddress = w-ampdx-d-sag10 databaseinstance = databaseport = 1433 databasename=SERPMABM databaseusername=serpm databasepassword=s3rpm
Adding Reports
bull Step 1 --Write report query ndash T-SQL
ndash User Guide includes a database data dictionary
bull Step 2 ndash Add query to ctrampreports_sql ndash Each query is contained in a single text file
ndash Drop file in reports folder
bull Step 3 ndash Add the query to the properties file sqlquery = Query file name
Worksheettables = Query output
Worksheetnames = Name for the report worksheet
Sample SERPM ABM Reports
bull Exhibit ctrampreports_sqlserpm_reportsxls
More information Shi-Chiang Li | shi-chianglidotstateflus |954 777 4655 Rosella Picado | picadopbworldcom | 206 382 5227 Ken Kaltenbach |kkaltenbachcorradinocom |502 587 7221

ldquoOn the Flyrdquo Path Building
bull TAZs TAPs and MAZs are linked via drive and access connectors prior to running CT-RAMP
rmdir OUTDIRABMTEMP S Q rmdir DATADIRABMTEMP S Q xcopy OUTDIR OUTDIRABMTEMP E I Y xcopy DATADIR DATADIRABMTEMP E I Y if(fbi=1) need to run only the first time through - kdk CUBEctramprunCreateAccessFilescmd endif mkdir logFiles taskkill im javaexe F start CUBEctramprunHhMgrcmd JDK64 HOST_IP start CUBEctramprunMtxMgrcmd HOST_IP JDK64 rem start CUBEctrampconfigrunDrivercmd copy CUBEctrampserpm_abmproperties serpm_abmproperties Y ping -n 11 127001 gt nul CUBEctramprunSERPMAbmcmd SAMPLERATE VSAMPLERATE JDK64 CUBEctramprunCreateDemandMatricescmd SAMPLERATE VSAMPLERATE JDK64 taskkill im javaexe F rmdir OUTDIRctramp S Q rmdir DATADIRctramp S Q xcopy OUTDIRABMTEMPctramp OUTDIRctramp E I Y xcopy DATADIRABMTEMPctramp DATADIRctramp E I Y
ldquoOn the Flyrdquo Path Building
MAZ to MAZ Connectors
Created by finding shortest distance paths over an all-streets network Connects all MAZs within 15 mi
Used to represent walk mode distance and time
MAZ to TAP Connectors
Created by finding shortest distance paths over an all-streets network Connects each MAZ to all TAPs within 10 mi
Used to represent transit walk access and walk egress distance and time
TAZ to TAP Connectors
Connects each TAZ to all TAPs within the TAP maximum drive distance bull Bus TAPs ndash 4 miles bull Rail TAPs ndash 15 miles
Used to represent transit drive access and egress distance and time
ldquoOn the Flyrdquo Path Building
bull No actual links created on the network bull Connectivity is expressed in table format
ldquoOn the Flyrdquo Path Building
bull Once the access and walk connectors are created the mode choice model builds complete paths MAZ to MAZ transit paths
bull Local-only paths are built using the ldquolocalrdquo transit skim bull Express BRT Urban Rail and Commuter rail paths are all
built at the same time using the ldquopremiumrdquo transit skim bull For each MAZ to MAZ pair CT-RAMP keeps the shortest
generalized cost path for each available premium mode bull Even though only one ldquopremiumrdquo skim is built CT-RAMP
may find competing premium paths It may also find that the best path is a combination of two premium modes or a premium mode and local bus
Tour Mode Choice Model
Choice
Auto
Drive alone
GP(1)
Pay(2)
Shared ride 2
GP(3)
HOV(4)
Pay(5)
Shared ride 3+
GP(6)
HOV(7)
Pay(8)
Non-motorized
Walk(9)
Bike(10)
Transit
Walk access
Local bus(11)
Express bus(12)
BRT(13)
Urban rail(14)
Commuter rail(15)
PNR access
Local bus(16)
Express bus(17)
BRT(18)
Urban rail(19)
Commuter rail(20)
KNR access
Local bus(21)
Express bus(22)
BRT(23)
Urban rail(24)
Commuter rail(25)
School Bus(26)
Trip Mode Choice Model
bull Same nesting structure as the tour mode choice but conditional on the tour mode
bull Some trip modes may be unavailable depending on the tour mode
DA SR2 SR3+ Walk Wlk-Trn PNR-Trn KNR-Trn
DA Must - - - - - -
SR2 Can Can - Can - - -
SR3+ Can Can Can Can - - -
Walk - - - Must - - -
Wlk-Trn - Can Can Can Can - -
PNR-Trn Can Can Can Can Can Can
KNR-Trn - Can Can Can Can - Can
Trip Switching Rules Simplified
Transit Trip Reporting
bull In SERPM7 the transit boarding and alighting location can be reported in two ways ndash Trip list files (ABM output) -- Boarding TAP Alighting TAP
ndash Transit assignment (Cube output) ndash Route nodes
bull Each type of reporting has its strengths ndash Trip list file allows building detailed transit trip patterns for
population cohorts and time periods
bull Mode split reports
bull Transit trip distance frequency distributions access distance TLFDs
bull Mode to mode transfers
ndash Note ABM reports only the first boarding TAP and the last alighting TAP regardless of mode
ndash Cube output gives aggregate link volumes station to station boardings etc
User Benefit Files
bull SERPM7 can produce FTA User Benefit files for input to SUMMIT
bull User benefits remain a useful analysis tool bull Steps to produce user benefit files require some manual
intervention ndash see User Guide
SERPM ABM Reports
bull Stores ABM inputs and outputs in a relational database to generate some standard model reports
bull Consistent reporting framework to be used for analysis across model runs
bull SERPM7 user community can easily share the scripts that create the reports
bull Reports take the form of Excel workbooks bull Foundation for future development of a visualization
dashboard
Reporting Database Components
Reporting Database Components
bull Reporting ETL (extract transform and load) program ndash Loads all Cube and CT-RAMP Java model outputs into the database
ndash Written in Cube scripts and Java
bull Database ndash Stores all data used in reporting including select network skims
household person tour and trip data zonal data etc
ndash Implemented with SQL Server
bull Report scripts to generate reports ndash Written in T-SQL
bull Report packaging program ndash Generates Excel workbooks with one report per worksheet
ndash Written in Java
Reporting Database Components
bull Run time required to build database and generate reports varies with sample size and type of report ndash Several hours required to build the database for a 100 sample
ndash ~ 30 minutes to produce reports for a 10 sample
bull Report step is optional not part of a standard model run bull Report production is transparent to the user
bull hellip but users can contribute reports bull hellip and choose which reports to build at any one time
Running SERPM ABM Reports
bull Report queries reside in ctrampreports_sql time_spent_travelingsql Total weekday travel time by person type
and income group
total_trips_typesql Trips by trip mode person type county of residence and tour purpose
total_tours_typesql Tours by trip mode person type county of residence and tour purpose
tours_districtssql Tours by tour purpose and tour origin and destination districts
transit_access_time+distsql Drive to transit trip list with many trip details
hellip
Running SERPM ABM Reports
bull List of reports to run is specified in properties file ndash ctrampserpm_reportsproperties
sqlscriptsdirectory = Cserpm7ctrampreports_sql sqlscriptsschemakey = SCHEMA sqlscripts=cleanupsqltransit_access_time+distsql worksheettables=temptransittrips worksheetnames=TransitTrips workbookname = Cserpm7ctrampreports_sqlSERPM_REPORTXLS databaseschema = 2010R databaseipaddress = w-ampdx-d-sag10 databaseinstance = databaseport = 1433 databasename=SERPMABM databaseusername=serpm databasepassword=s3rpm
Adding Reports
bull Step 1 --Write report query ndash T-SQL
ndash User Guide includes a database data dictionary
bull Step 2 ndash Add query to ctrampreports_sql ndash Each query is contained in a single text file
ndash Drop file in reports folder
bull Step 3 ndash Add the query to the properties file sqlquery = Query file name
Worksheettables = Query output
Worksheetnames = Name for the report worksheet
Sample SERPM ABM Reports
bull Exhibit ctrampreports_sqlserpm_reportsxls
More information Shi-Chiang Li | shi-chianglidotstateflus |954 777 4655 Rosella Picado | picadopbworldcom | 206 382 5227 Ken Kaltenbach |kkaltenbachcorradinocom |502 587 7221
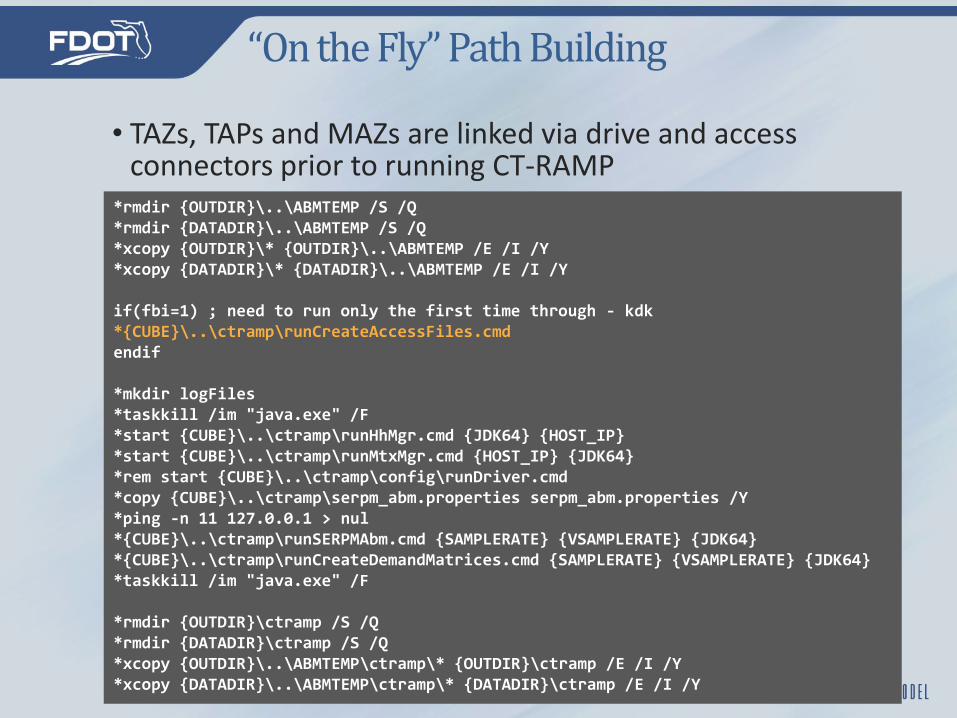
ldquoOn the Flyrdquo Path Building
bull Once the access and walk connectors are created the mode choice model builds complete paths MAZ to MAZ transit paths
bull Local-only paths are built using the ldquolocalrdquo transit skim bull Express BRT Urban Rail and Commuter rail paths are all
built at the same time using the ldquopremiumrdquo transit skim bull For each MAZ to MAZ pair CT-RAMP keeps the shortest
generalized cost path for each available premium mode bull Even though only one ldquopremiumrdquo skim is built CT-RAMP
may find competing premium paths It may also find that the best path is a combination of two premium modes or a premium mode and local bus
Tour Mode Choice Model
Choice
Auto
Drive alone
GP(1)
Pay(2)
Shared ride 2
GP(3)
HOV(4)
Pay(5)
Shared ride 3+
GP(6)
HOV(7)
Pay(8)
Non-motorized
Walk(9)
Bike(10)
Transit
Walk access
Local bus(11)
Express bus(12)
BRT(13)
Urban rail(14)
Commuter rail(15)
PNR access
Local bus(16)
Express bus(17)
BRT(18)
Urban rail(19)
Commuter rail(20)
KNR access
Local bus(21)
Express bus(22)
BRT(23)
Urban rail(24)
Commuter rail(25)
School Bus(26)
Trip Mode Choice Model
bull Same nesting structure as the tour mode choice but conditional on the tour mode
bull Some trip modes may be unavailable depending on the tour mode
DA SR2 SR3+ Walk Wlk-Trn PNR-Trn KNR-Trn
DA Must - - - - - -
SR2 Can Can - Can - - -
SR3+ Can Can Can Can - - -
Walk - - - Must - - -
Wlk-Trn - Can Can Can Can - -
PNR-Trn Can Can Can Can Can Can
KNR-Trn - Can Can Can Can - Can
Trip Switching Rules Simplified
Transit Trip Reporting
bull In SERPM7 the transit boarding and alighting location can be reported in two ways ndash Trip list files (ABM output) -- Boarding TAP Alighting TAP
ndash Transit assignment (Cube output) ndash Route nodes
bull Each type of reporting has its strengths ndash Trip list file allows building detailed transit trip patterns for
population cohorts and time periods
bull Mode split reports
bull Transit trip distance frequency distributions access distance TLFDs
bull Mode to mode transfers
ndash Note ABM reports only the first boarding TAP and the last alighting TAP regardless of mode
ndash Cube output gives aggregate link volumes station to station boardings etc
User Benefit Files
bull SERPM7 can produce FTA User Benefit files for input to SUMMIT
bull User benefits remain a useful analysis tool bull Steps to produce user benefit files require some manual
intervention ndash see User Guide
SERPM ABM Reports
bull Stores ABM inputs and outputs in a relational database to generate some standard model reports
bull Consistent reporting framework to be used for analysis across model runs
bull SERPM7 user community can easily share the scripts that create the reports
bull Reports take the form of Excel workbooks bull Foundation for future development of a visualization
dashboard
Reporting Database Components
Reporting Database Components
bull Reporting ETL (extract transform and load) program ndash Loads all Cube and CT-RAMP Java model outputs into the database
ndash Written in Cube scripts and Java
bull Database ndash Stores all data used in reporting including select network skims
household person tour and trip data zonal data etc
ndash Implemented with SQL Server
bull Report scripts to generate reports ndash Written in T-SQL
bull Report packaging program ndash Generates Excel workbooks with one report per worksheet
ndash Written in Java
Reporting Database Components
bull Run time required to build database and generate reports varies with sample size and type of report ndash Several hours required to build the database for a 100 sample
ndash ~ 30 minutes to produce reports for a 10 sample
bull Report step is optional not part of a standard model run bull Report production is transparent to the user
bull hellip but users can contribute reports bull hellip and choose which reports to build at any one time
Running SERPM ABM Reports
bull Report queries reside in ctrampreports_sql time_spent_travelingsql Total weekday travel time by person type
and income group
total_trips_typesql Trips by trip mode person type county of residence and tour purpose
total_tours_typesql Tours by trip mode person type county of residence and tour purpose
tours_districtssql Tours by tour purpose and tour origin and destination districts
transit_access_time+distsql Drive to transit trip list with many trip details
hellip
Running SERPM ABM Reports
bull List of reports to run is specified in properties file ndash ctrampserpm_reportsproperties
sqlscriptsdirectory = Cserpm7ctrampreports_sql sqlscriptsschemakey = SCHEMA sqlscripts=cleanupsqltransit_access_time+distsql worksheettables=temptransittrips worksheetnames=TransitTrips workbookname = Cserpm7ctrampreports_sqlSERPM_REPORTXLS databaseschema = 2010R databaseipaddress = w-ampdx-d-sag10 databaseinstance = databaseport = 1433 databasename=SERPMABM databaseusername=serpm databasepassword=s3rpm
Adding Reports
bull Step 1 --Write report query ndash T-SQL
ndash User Guide includes a database data dictionary
bull Step 2 ndash Add query to ctrampreports_sql ndash Each query is contained in a single text file
ndash Drop file in reports folder
bull Step 3 ndash Add the query to the properties file sqlquery = Query file name
Worksheettables = Query output
Worksheetnames = Name for the report worksheet
Sample SERPM ABM Reports
bull Exhibit ctrampreports_sqlserpm_reportsxls
More information Shi-Chiang Li | shi-chianglidotstateflus |954 777 4655 Rosella Picado | picadopbworldcom | 206 382 5227 Ken Kaltenbach |kkaltenbachcorradinocom |502 587 7221

Reporting Database Components
Reporting Database Components
bull Reporting ETL (extract transform and load) program ndash Loads all Cube and CT-RAMP Java model outputs into the database
ndash Written in Cube scripts and Java
bull Database ndash Stores all data used in reporting including select network skims
household person tour and trip data zonal data etc
ndash Implemented with SQL Server
bull Report scripts to generate reports ndash Written in T-SQL
bull Report packaging program ndash Generates Excel workbooks with one report per worksheet
ndash Written in Java
Reporting Database Components
bull Run time required to build database and generate reports varies with sample size and type of report ndash Several hours required to build the database for a 100 sample
ndash ~ 30 minutes to produce reports for a 10 sample
bull Report step is optional not part of a standard model run bull Report production is transparent to the user
bull hellip but users can contribute reports bull hellip and choose which reports to build at any one time
Running SERPM ABM Reports
bull Report queries reside in ctrampreports_sql time_spent_travelingsql Total weekday travel time by person type
and income group
total_trips_typesql Trips by trip mode person type county of residence and tour purpose
total_tours_typesql Tours by trip mode person type county of residence and tour purpose
tours_districtssql Tours by tour purpose and tour origin and destination districts
transit_access_time+distsql Drive to transit trip list with many trip details
hellip
Running SERPM ABM Reports
bull List of reports to run is specified in properties file ndash ctrampserpm_reportsproperties
sqlscriptsdirectory = Cserpm7ctrampreports_sql sqlscriptsschemakey = SCHEMA sqlscripts=cleanupsqltransit_access_time+distsql worksheettables=temptransittrips worksheetnames=TransitTrips workbookname = Cserpm7ctrampreports_sqlSERPM_REPORTXLS databaseschema = 2010R databaseipaddress = w-ampdx-d-sag10 databaseinstance = databaseport = 1433 databasename=SERPMABM databaseusername=serpm databasepassword=s3rpm
Adding Reports
bull Step 1 --Write report query ndash T-SQL
ndash User Guide includes a database data dictionary
bull Step 2 ndash Add query to ctrampreports_sql ndash Each query is contained in a single text file
ndash Drop file in reports folder
bull Step 3 ndash Add the query to the properties file sqlquery = Query file name
Worksheettables = Query output
Worksheetnames = Name for the report worksheet
Sample SERPM ABM Reports
bull Exhibit ctrampreports_sqlserpm_reportsxls
More information Shi-Chiang Li | shi-chianglidotstateflus |954 777 4655 Rosella Picado | picadopbworldcom | 206 382 5227 Ken Kaltenbach |kkaltenbachcorradinocom |502 587 7221

Reporting Database Components
bull Reporting ETL (extract transform and load) program ndash Loads all Cube and CT-RAMP Java model outputs into the database
ndash Written in Cube scripts and Java
bull Database ndash Stores all data used in reporting including select network skims
household person tour and trip data zonal data etc
ndash Implemented with SQL Server
bull Report scripts to generate reports ndash Written in T-SQL
bull Report packaging program ndash Generates Excel workbooks with one report per worksheet
ndash Written in Java
Reporting Database Components
bull Run time required to build database and generate reports varies with sample size and type of report ndash Several hours required to build the database for a 100 sample
ndash ~ 30 minutes to produce reports for a 10 sample
bull Report step is optional not part of a standard model run bull Report production is transparent to the user
bull hellip but users can contribute reports bull hellip and choose which reports to build at any one time
Running SERPM ABM Reports
bull Report queries reside in ctrampreports_sql time_spent_travelingsql Total weekday travel time by person type
and income group
total_trips_typesql Trips by trip mode person type county of residence and tour purpose
total_tours_typesql Tours by trip mode person type county of residence and tour purpose
tours_districtssql Tours by tour purpose and tour origin and destination districts
transit_access_time+distsql Drive to transit trip list with many trip details
hellip
Running SERPM ABM Reports
bull List of reports to run is specified in properties file ndash ctrampserpm_reportsproperties
sqlscriptsdirectory = Cserpm7ctrampreports_sql sqlscriptsschemakey = SCHEMA sqlscripts=cleanupsqltransit_access_time+distsql worksheettables=temptransittrips worksheetnames=TransitTrips workbookname = Cserpm7ctrampreports_sqlSERPM_REPORTXLS databaseschema = 2010R databaseipaddress = w-ampdx-d-sag10 databaseinstance = databaseport = 1433 databasename=SERPMABM databaseusername=serpm databasepassword=s3rpm
Adding Reports
bull Step 1 --Write report query ndash T-SQL
ndash User Guide includes a database data dictionary
bull Step 2 ndash Add query to ctrampreports_sql ndash Each query is contained in a single text file
ndash Drop file in reports folder
bull Step 3 ndash Add the query to the properties file sqlquery = Query file name
Worksheettables = Query output
Worksheetnames = Name for the report worksheet
Sample SERPM ABM Reports
bull Exhibit ctrampreports_sqlserpm_reportsxls
More information Shi-Chiang Li | shi-chianglidotstateflus |954 777 4655 Rosella Picado | picadopbworldcom | 206 382 5227 Ken Kaltenbach |kkaltenbachcorradinocom |502 587 7221
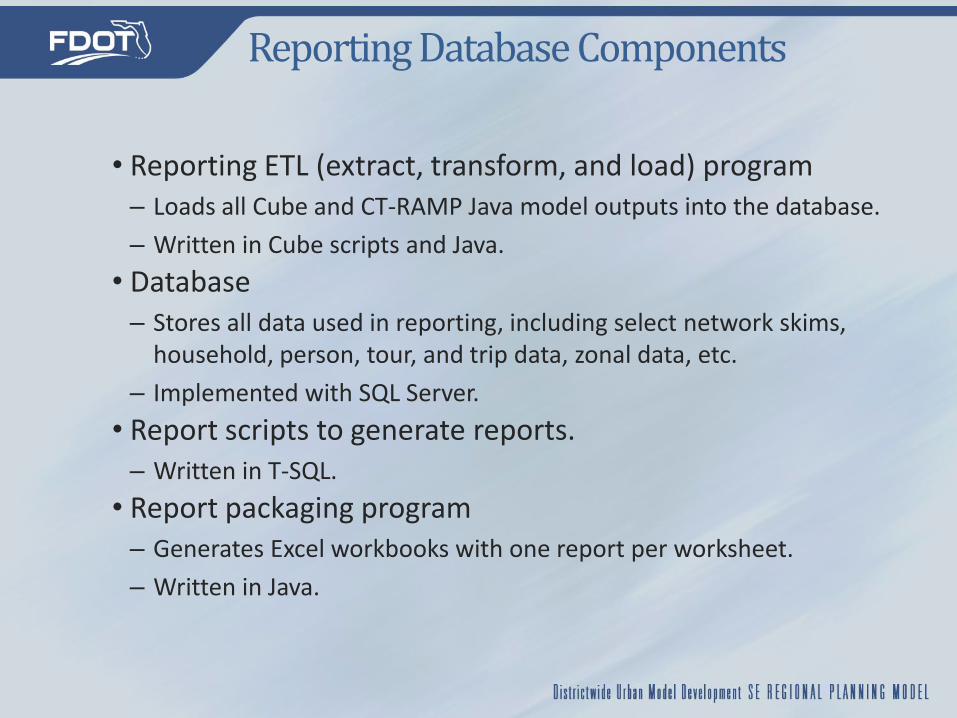
Reporting Database Components
bull Run time required to build database and generate reports varies with sample size and type of report ndash Several hours required to build the database for a 100 sample
ndash ~ 30 minutes to produce reports for a 10 sample
bull Report step is optional not part of a standard model run bull Report production is transparent to the user
bull hellip but users can contribute reports bull hellip and choose which reports to build at any one time
Running SERPM ABM Reports
bull Report queries reside in ctrampreports_sql time_spent_travelingsql Total weekday travel time by person type
and income group
total_trips_typesql Trips by trip mode person type county of residence and tour purpose
total_tours_typesql Tours by trip mode person type county of residence and tour purpose
tours_districtssql Tours by tour purpose and tour origin and destination districts
transit_access_time+distsql Drive to transit trip list with many trip details
hellip
Running SERPM ABM Reports
bull List of reports to run is specified in properties file ndash ctrampserpm_reportsproperties
sqlscriptsdirectory = Cserpm7ctrampreports_sql sqlscriptsschemakey = SCHEMA sqlscripts=cleanupsqltransit_access_time+distsql worksheettables=temptransittrips worksheetnames=TransitTrips workbookname = Cserpm7ctrampreports_sqlSERPM_REPORTXLS databaseschema = 2010R databaseipaddress = w-ampdx-d-sag10 databaseinstance = databaseport = 1433 databasename=SERPMABM databaseusername=serpm databasepassword=s3rpm
Adding Reports
bull Step 1 --Write report query ndash T-SQL
ndash User Guide includes a database data dictionary
bull Step 2 ndash Add query to ctrampreports_sql ndash Each query is contained in a single text file
ndash Drop file in reports folder
bull Step 3 ndash Add the query to the properties file sqlquery = Query file name
Worksheettables = Query output
Worksheetnames = Name for the report worksheet
Sample SERPM ABM Reports
bull Exhibit ctrampreports_sqlserpm_reportsxls
More information Shi-Chiang Li | shi-chianglidotstateflus |954 777 4655 Rosella Picado | picadopbworldcom | 206 382 5227 Ken Kaltenbach |kkaltenbachcorradinocom |502 587 7221

Running SERPM ABM Reports
bull List of reports to run is specified in properties file ndash ctrampserpm_reportsproperties
sqlscriptsdirectory = Cserpm7ctrampreports_sql sqlscriptsschemakey = SCHEMA sqlscripts=cleanupsqltransit_access_time+distsql worksheettables=temptransittrips worksheetnames=TransitTrips workbookname = Cserpm7ctrampreports_sqlSERPM_REPORTXLS databaseschema = 2010R databaseipaddress = w-ampdx-d-sag10 databaseinstance = databaseport = 1433 databasename=SERPMABM databaseusername=serpm databasepassword=s3rpm
Adding Reports
bull Step 1 --Write report query ndash T-SQL
ndash User Guide includes a database data dictionary
bull Step 2 ndash Add query to ctrampreports_sql ndash Each query is contained in a single text file
ndash Drop file in reports folder
bull Step 3 ndash Add the query to the properties file sqlquery = Query file name
Worksheettables = Query output
Worksheetnames = Name for the report worksheet
Sample SERPM ABM Reports
bull Exhibit ctrampreports_sqlserpm_reportsxls
More information Shi-Chiang Li | shi-chianglidotstateflus |954 777 4655 Rosella Picado | picadopbworldcom | 206 382 5227 Ken Kaltenbach |kkaltenbachcorradinocom |502 587 7221

Sample SERPM ABM Reports
bull Exhibit ctrampreports_sqlserpm_reportsxls
More information Shi-Chiang Li | shi-chianglidotstateflus |954 777 4655 Rosella Picado | picadopbworldcom | 206 382 5227 Ken Kaltenbach |kkaltenbachcorradinocom |502 587 7221

More information Shi-Chiang Li | shi-chianglidotstateflus |954 777 4655 Rosella Picado | picadopbworldcom | 206 382 5227 Ken Kaltenbach |kkaltenbachcorradinocom |502 587 7221