FDI TO THE MOST VULNERABLE ECONOMIES DECLINED IN 2016...
13
No.26 23 MAY 2017 FDI TO THE MOST VULNERABLE ECONOMIES DECLINED IN 2016, WITH POSSIBLE MODEST RECOVERY IN 2017 HIGHLIGHTS Foreign direct investment (FDI) flows to structurally weak, vulnerable and small economies declined in 2016, although some groups were less affected than others (figure 1). Their share in the world total shrank from 3.6 per cent in 2015 to 3.3 per cent in 2016. Figure 1. FDI inflows in LDCs, LLDCs and SIDS, 2007–2016 (Billions of US dollars) Source: ©UNCTAD. After a high of $44 billion in 2015, flows to the 48 least developed countries (LDCs) retreated by 13 per cent to $38 billion. FDI to commodity-rich LDCs in Africa, notably Angola, Mozambique and Zambia, continued to decline, and flows to Asian LDCs slowed after a record year in 2015. FDI flows to the 32 landlocked developing countries (LLDCs) slipped by 2 per cent to $24 billion. LLDCs remain marginal in the global foreign direct investment scene, accounting for less than 2 per cent of the world’s inflows. FDI remained unevenly distributed, with the top five recipients accounting for more than 90 per cent of the total.
Transcript of FDI TO THE MOST VULNERABLE ECONOMIES DECLINED IN 2016...

No.26 23 MAY 2017
FDI TO THE MOST VULNERABLE ECONOMIES DECLINED IN 2016,
WITH POSSIBLE MODEST RECOVERY IN 2017
HIGHLIGHTS
Foreign direct investment (FDI) flows to structurally weak, vulnerable and small economies declined in 2016,
although some groups were less affected than others (figure 1). Their share in the world total shrank from 3.6 per
cent in 2015 to 3.3 per cent in 2016.
Figure 1. FDI inflows in LDCs, LLDCs and SIDS, 2007–2016 (Billions of US dollars)
Source: ©UNCTAD.
After a high of $44 billion in 2015, flows to the 48 least developed countries (LDCs) retreated by 13 per cent to
$38 billion. FDI to commodity-rich LDCs in Africa, notably Angola, Mozambique and Zambia, continued to
decline, and flows to Asian LDCs slowed after a record year in 2015.
FDI flows to the 32 landlocked developing countries (LLDCs) slipped by 2 per cent to $24 billion. LLDCs
remain marginal in the global foreign direct investment scene, accounting for less than 2 per cent of the world’s
inflows. FDI remained unevenly distributed, with the top five recipients accounting for more than 90 per cent of
the total.

The already fragile FDI flows to small island developing States (SIDS) fell further in 2016, representing merely
0.2 per cent of global flows. The five largest recipients, Jamaica, followed by the Bahamas, Maldives,
Mauritius and Fiji, accounted for 70 per cent of the group’s total.
FDI has become the most important component of development finance for LLDCs and SIDS, while official
development assistance (ODA) tends to dominate external financial flows to LDCs, including FDI.
Investors from developing economies, led by China, continue to actively expand into LDCs and LLDCs. In fact,
China’s outward FDI became three times as much as the second largest investing economy. Developing
economies accounted for seven of the top 10 investors in SIDS, although Canada and the United States were the
top investors.
In 2017, FDI flows to LDCs are expected to recover. Investments related to oil and gas will continue to drive
overall FDI inflows, although the group has the potential to attract more investment in manufacturing and
services. FDI prospects in LLDCs warrant cautious optimism. A recovery hinges very much on the evolution of
both commodity prices and political issues. The prospects for attracting more foreign direct investment to SIDS
remain challenging, in the absence of any new large-scale projects in the extractive industries.
FDI flows to structurally weak, vulnerable and small economies declined, but at different speeds:
Flows to least developed countries retreated by 13 per cent, to $38 billion, flows to landlocked developing
countries slipped by 2 per cent, to $24 billion, while small island developing States saw inflows shrink by
6 per cent, to $3.5 billion.
Declines of FDI in natural-resource-based LDCs pulled down
aggregate flows of the group
Higher manufacturing and infrastructure FDI in selected LDCs – Ethiopia, Bangladesh and Cambodia
– was not enough to offset lower foreign investment in leading commodity rich LDCs and Asian LDCs.
Aggregate FDI flows to African LDCs and Haiti fell by 12 per cent to $31 billion. FDI flows to
Angola, the second largest oil producer in Africa, declined for the second consecutive year to $14 billion
(-11 per cent) from a record of $17 billion posted in 2014. Nevertheless, it remained by far the largest FDI
host in LDCs, absorbing nearly 40 per cent of total foreign investment flows to the group. Foreign
investors reduced their reinvested earnings to a nine-year low of $1 billion (-46 per cent). Although equity
investment declined by 6 per cent to $13 billion – from a record of $14 billion in 2015 – it remained
higher than the annual average of $10 billion recorded in 2011–2013. FDI flows to the Sudan, another oil-
related economy, fell to $1 billion (-38 per cent), as compared with a peak of over $2 billion in 2012.
Although South Sudan recorded negative flows in 2016, it attracted investments into coffee farms, thereby
positioning coffee beans as its primary non-oil export.
Facing challenging macroeconomic conditions and a deteriorating business climate, Mozambique saw
its FDI inflows fall for the third consecutive year to a six-year low of $3 billion (-20 per cent from 2015).
With the finalization of agreements on a large natural gas project between the Government and foreign
investors taking longer than expected, the surge in FDI in auxiliary infrastructure came to a temporary halt
in 2016. In the United Republic of Tanzania, which is also expected to become a new producer of natural
gas in the future, FDI slipped for the third consecutive year, to $1.4 billion (-15 per cent), amid
uncertainty about FDI policies and tax rules.
Two leading mineral exporters – the Democratic Republic of the Congo and Zambia – also saw their
FDI shrink further in the face of low commodity prices. In the former, despite growing interest from
Chinese firms, FDI fell for the fourth consecutive year to $1 billion (-28 per cent), significantly below its
2012 peak of more than $3 billion. In Zambia, FDI slumped to $469 million (-70 per cent) – about a fifth
of its peak of $2.1 billion, posted in 2013. Low commodity prices and uncertainty about mining tax policy
amendments could be the main reasons why foreign investors put on hold projects in the country’s mining
sector, although some positive prospects cropped up in non-mining sectors.
In contrast, thanks to investments in infrastructure and manufacturing, Ethiopia again posted strong
growth in FDI (up 46 per cent to $3 billion) and became the second largest LDC host economy, up from
the fifth position in 2015. The largest cross-border merger and acquisitions (M&A) sale of the year ($510
million) was also recorded in the country, with Japan Tobacco acquiring a local cigarette manufacturing
facility. Ethiopia attracted new FDI in manufacturing, which could create opportunities for local SMEs to
link to global supply chains. Although China was one of the major sources of FDI, foreign investors from
other economies have started investing more in Ethiopia’s agro-processing, hotels and resorts, as well as
in its manufacturing activities.
Following a record high in 2015, FDI into LDCs in Asia and Oceania also retreated, by 14 per cent to
$7 billion. FDI in both Myanmar and the Lao People’s Democratic Republic declined after buoyant
performances in 2015. In the former, delays in implementing large-scale projects and policy uncertainty
over coal-fired power projects appeared to curb its FDI flows (-22 per cent to $2.2 billion) in 2016, which
nonetheless remained much higher than in 2014 ($946 million). Yet the country continued to attract
greenfield projects in industries such as transport, telecommunication and garments. Myanmar’s first
operational special economic zone, in Thilawa, successfully attracted export-oriented manufacturing FDI
while securing foreign capital to advance infrastructure developments (e.g. a power plant, industrial water
supply and a waste disposal facility). In the Lao People’s Democratic Republic, too, flows declined (-20
per cent to $890 million) but were more than 20 per cent higher than in 2014. The country continues to
attract projects from other ASEAN members in electricity, construction and financial services.
Despite this retreat, two manufacturing exporters performed well. Bangladesh became the fourth
largest FDI host among LDCs with a record $2.3 billion in inflows (+4 per cent). Thanks to new, large-
scale electricity projects, the total value of announced greenfield projects soared to $6.4 billion in 2016,
more than three times greater than the annual average of $2.0 billion in 2013–2015. Following a slight dip
in 2015, FDI into Cambodia hit a record of $1.9 billion (+13 per cent), bolstered by projects in electricity,
construction and non-garment manufacturing from China, Japan and other ASEAN members.
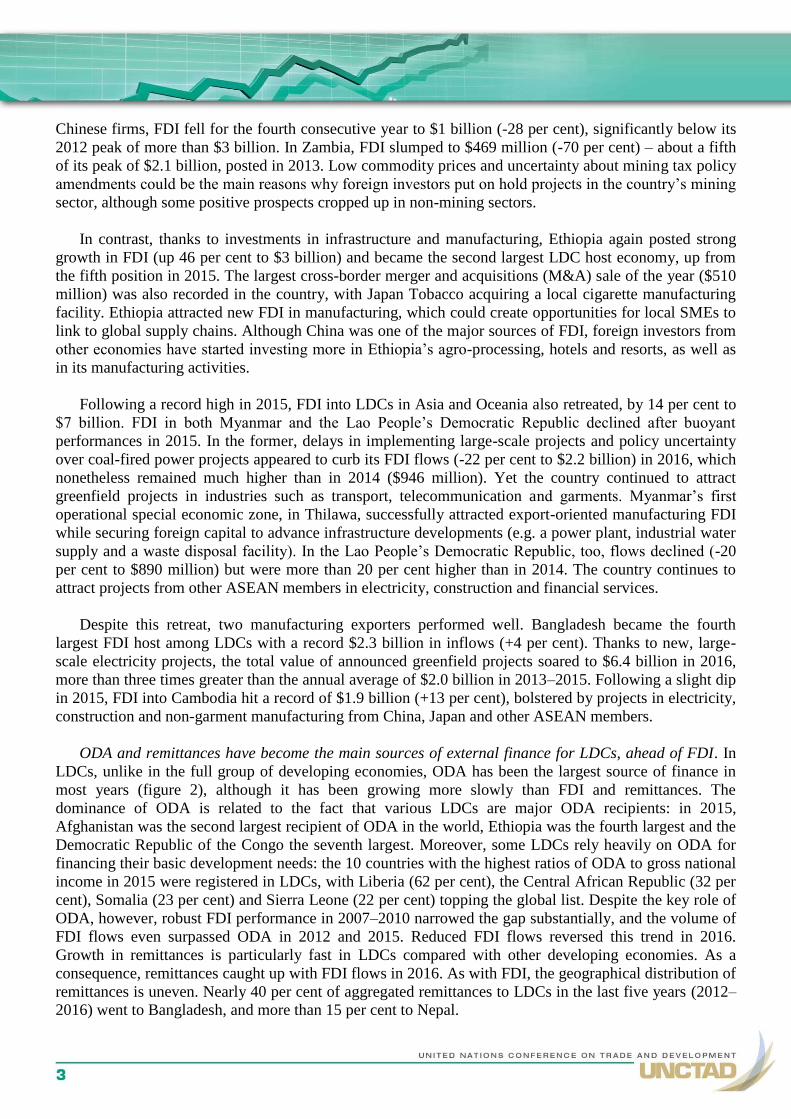
ODA and remittances have become the main sources of external finance for LDCs, ahead of FDI. In
LDCs, unlike in the full group of developing economies, ODA has been the largest source of finance in
most years (figure 2), although it has been growing more slowly than FDI and remittances. The
dominance of ODA is related to the fact that various LDCs are major ODA recipients: in 2015,
Afghanistan was the second largest recipient of ODA in the world, Ethiopia was the fourth largest and the
Democratic Republic of the Congo the seventh largest. Moreover, some LDCs rely heavily on ODA for
financing their basic development needs: the 10 countries with the highest ratios of ODA to gross national
income in 2015 were registered in LDCs, with Liberia (62 per cent), the Central African Republic (32 per
cent), Somalia (23 per cent) and Sierra Leone (22 per cent) topping the global list. Despite the key role of
ODA, however, robust FDI performance in 2007–2010 narrowed the gap substantially, and the volume of
FDI flows even surpassed ODA in 2012 and 2015. Reduced FDI flows reversed this trend in 2016.
Growth in remittances is particularly fast in LDCs compared with other developing economies. As a
consequence, remittances caught up with FDI flows in 2016. As with FDI, the geographical distribution of
remittances is uneven. Nearly 40 per cent of aggregated remittances to LDCs in the last five years (2012–
2016) went to Bangladesh, and more than 15 per cent to Nepal.

Figure 2. LDCs: FDI inflows, ODA and remittances, 2007–2016
(Billions of dollars)
Source: © UNCTAD, based on FDI/MNE database (www.unctad.org/fdistatistics) (for FDI inflows), OECD (for ODA) and
the World Bank (for remittances).
Six developing economies feature among the top 10 countries investing in LDCs (figure 3).
Multinational enterprises (MNEs) from developing Asia, led by China, have been actively expanding into
LDCs, and their significance is growing in manufacturing and services. At the end of 2015, Chinese FDI
stock in LDCs was almost three times more than the next largest investor’s. From 2010 to 2015, its stock
in LDCs more than tripled. Although more than half of Chinese FDI to LDCs was held in commodity-rich
African countries, three ASEAN LDCs – the Lao People’s Democratic Republic (close to $5 billion, up
nearly six times from 2010), Myanmar (more than $4 billion, up more than two times from 2010) and
Cambodia (close to $4 billion, up by more than three times from 2010) – remained the largest single
recipients of Chinese investment in the group. Chinese investors have played a major role in other LDCs,
such as Ethiopia, where they have focused on garment and leather production. Chinese investors also
dominate announced greenfield projects in 2016. Estimated capital spending by Chinese MNEs
skyrocketed from an annual average of $2 billion in 2013–2015 to over $14 billion in 2016.
Figure 3. LDCs: Top 10 investor economies by FDI stock, 2010 and 2015
(Billions of dollars)
Source: © UNCTAD.

In addition to China, other developing economies have emerged as prominent investors in LDCs.
Driven by investments in the ASEAN LDCs, Thailand’s FDI stock more than tripled between 2010 and
2015, and is now almost equivalent to that of the United States. The Republic of Korea almost doubled its
FDI stock in LDCs during the same period, especially in Myanmar and Madagascar.
Among the commodity-based LDCs, South-South FDI can play a major role in diversification. For
example, the Sudan has attracted non-hydrocarbon projects from Egypt (in total exceeding $1.2 billion) in
manufacturing (pharmaceuticals and cement) and electricity, as well as a $150 million telecommunication
project from Bahrain. Somalia has received sizeable investments in telecommunication (e.g. $150 million
from Mauritius in 2013, another $150 million from Djibouti in 2014 and $300 million from Oman in 2016)
and logistics ($442 from the United Arab Emirates in 2016).
FDI to LLDCs stabilized in 2016 but still remained marginal
After a major fall in 2015, the group’s flows retreated by only 2 per cent, to $24 billion. LLDCs
continue to play a marginal role on the global FDI scene, accounting for less than 2 per cent of world
inflows, although this share is higher than their share in world GDP (1 per cent). FDI dynamics varied
across the group. FDI rebounded in landlocked transition economies thanks to buoyant FDI in Kazakhstan,
Armenia, and the former Yugoslav Republic of Macedonia, although in the latter two, it surged from a
low base. In all other regions, FDI inflows declined. In Africa, the continued upward trend in Ethiopia
was more than offset by major declines in Botswana and Zambia. A slump of FDI flows was recorded in
Asian LLDCs as well, due to negative inflows in Mongolia. FDI to the two Latin American LLDCs also
fell, as moderate gains in Paraguay could not compensate for the decline of FDI in the Plurinational State
of Bolivia. FDI to LLDCs shares similarities – small volume, volatility, dependence on commodities in
various countries – with FDI to LDCs. This is to a large degree due to a significant overlap between the
two groups (17 of the 32 LLDCs are LDCs), particularly in Africa and Asia.
In the 16 African LLDCs, FDI inflows fell by 14 per cent to $7 billion in 2016. This is low even
compared with total FDI into Africa, reflecting the fact that LLDCs are often the poorest and most
disadvantaged economies in the region. Among African LLDCs, Ethiopia was by far the most dynamic
and largest FDI recipient (accounting for almost half of the total inflows of LLDCs in Africa), thanks to
improvements in infrastructure and advances in industrialization. Inflows to Ethiopia have been rising
constantly since 2012, even when FDI declined in many other LLDCs. Small countries such as Burkina
Faso and the Central African Republic also registered high FDI growth in 2016, but from very low levels
in 2015. Rwanda also experienced a rise in inflows by 8 per cent, to $410 million.
The heterogeneous group of five Asian LLDCs (Afghanistan, Bhutan, the Lao People’s Democratic
Republic, Mongolia and Nepal) recorded negative inflows in 2016 (-$3 billion). The Lao People’s
Democratic Republic remained by far the largest recipient of FDI in this group, although inflows declined
by 20 per cent to about $900 million. Inflows to Mongolia turned negative (-$4 billion) in the face of
negative intracompany loans, which were a result of various factors, including policy and judiciary
uncertainty, low commodity prices and profit taking from mature projects.
The two Latin American LLDCs (the Plurinational State of Bolivia and Paraguay) attracted less than
$700 million in FDI in 2016 – a 16 per cent decline from the previous year. In the Plurinational State of
Bolivia the decline came about in part as foreign investment in oil and gas and in mining contracted.
The nine landlocked transition economies continued to be the largest recipients of inward FDI in the
group, attracting a record $20 billion in 2016 – more than four fifths of total FDI to LLDCs – an increase
of 35 per cent over the previous year. FDI increased in all three traditional top recipient countries
(Azerbaijan, Kazakhstan and Turkmenistan), which account now for about 90 per cent of the inflows to
landlocked transition countries. In Kazakhstan, FDI more than doubled to $9 billion, on the back of
projects in oil and gas and in mining. Similarly, in Azerbaijan, where inflows grew by 11 per cent to $4.5
billion, foreign investors remained focused on oil and gas (such as the ACG and Shah Deniz II fields), as
well as on refining and petrochemicals, followed by transportation, storage and construction. In
Turkmenistan, where FDI grew marginally, to $4.5 billion, the bulk of inflows continue to target natural-
gas-related activities such as the expansion of the Galkynysh gas field. Nevertheless, in both Kazakhstan
and Turkmenistan, in addition to the traditional focus on hydrocarbons, foreign investors also showed
interest in manufacturing plants.
Despite the persistent weight of natural resources in FDI to LLDCs, diversification of inflows is
advancing, especially in economies that have recently attracted sizeable FDI, such as Ethiopia. Cross-
border M&As and greenfield announcement data for 2016 indeed indicate that the share of natural-
resource-based projects is declining. A shift towards manufacturing can be detected, especially in food,
beverages and tobacco for M&As and in chemicals for announced greenfield projects.
In infrastructure development, investor interest goes beyond pure FDI deals and embraces other forms
of involvement, especially public-private partnerships (PPPs). Indeed, PPPs are dominated by non-equity
modalities such as concession deals, although they can include some elements of FDI. Some of the
LLDCs have been especially active in PPPs since the early 2010s. For example, the Lao People’s
Democratic Republic carried out 17 hydropower projects on this model between 2011 and 2015, for a
total value of $8 billion, including the Sinhohydro Nam Ou 1-7 megaproject. In some cases, LLDCs
cooperate with each other: the CASA 1000 project, for instance, involves linking the hydropower
capacities of Kyrgyzstan and Tajikistan with the net importing countries of Afghanistan and Pakistan.
Some projects, such as the Turkmenistan– Afghanistan–Tajikistan Railway, are currently in the feasibility
study phase.
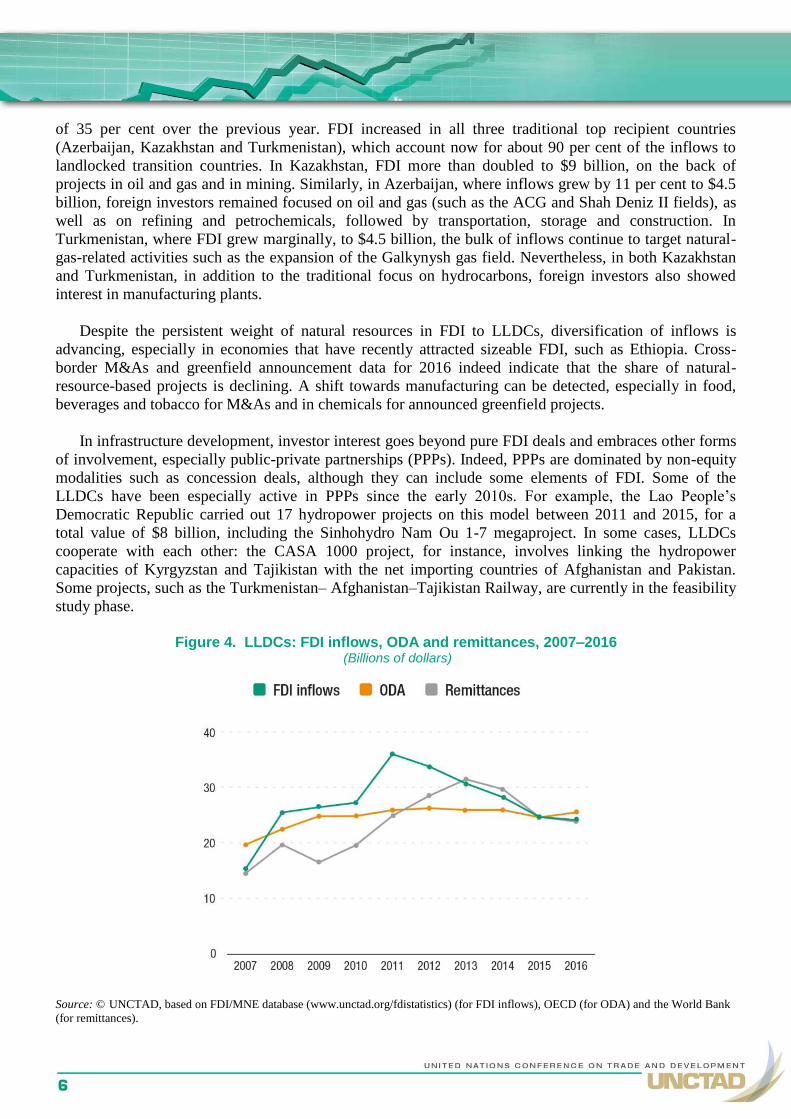
Figure 4. LLDCs: FDI inflows, ODA and remittances, 2007–2016
(Billions of dollars)
Source: © UNCTAD, based on FDI/MNE database (www.unctad.org/fdistatistics) (for FDI inflows), OECD (for ODA) and the World Bank
(for remittances).

FDI has become the most important component of development finance for LLDCs. FDI flows have
been a major source of finance for LLDCs, occasionally overtaking both remittances and ODA (figure 4).
This aggregate pattern of external finance in LLDCs is somewhat similar to the overall situation of
developing economies – and dissimilar to that of LDCs – in that FDI flows are typically larger than ODA
and remittances, although in LLDCs, remittances and ODA come closer to FDI in absolute volumes than in
developing economies. This in turn contrasts with the pattern in LDCs, where ODA dominates, followed by
remittances and then FDI. There are also major variations between individual countries in terms of using
different sources of finance. Remittances have been a crucial source of external capital flows in some small
LLDCs, notably Armenia, Kyrgyzstan, the Republic of Moldova, Nepal and Tajikistan. Economic crises in
source countries and exchange rate fluctuations in major recipient economies, however, have weighed on
remittances, which have been declining since 2014. In turn, ODA continued to be a relatively large and
more stable source of flows. Moreover, ODA has been more widely distributed among LLDCs than FDI
flows, and its role in government budget support has often been critical for the provision of essential
services and infrastructure.
The rise of South-South FDI to LLDC continues unabated. In recent years, an upswing has been
recorded in investment to LLDCs from other developing economies, including China, South Africa and
Turkey (figure 5). In 2015 again (the latest year for which complete data were available), MNEs from
developing economies, especially from Asia (including, in addition to the traditional top ones, Thailand)
and from countries in transition (especially the Russian Federation) accounted for the bulk of the inward
FDI stock in LLDCs. In terms of stock, China has widened its lead as the number one investor in these
countries.
Figure 5. LLDCs: Top 10 investor economies by FDI stock, 2010 and 2015
(Billions of dollars)
Source: © UNCTAD.
The increase of South-South FDI in LLDCs reflects recognition of these countries’ strategic value.
The One Belt One Road initiative, for instance, which covers Mongolia and all the transition-economy
LLDCs (except the former Yugoslav Republic of Macedonia), is a cooperation initiative that capitalizes
on that strategic importance through FDI and other mechanisms of collaboration. This is a zone in which
MNEs from various emerging economies (including China, India, the Russian Federation and Turkey)
have shown keen interest, for the purpose of accessing not just natural resources, but infrastructure links,
too.

Fragile FDI inflows to SIDS shrank for the second consecutive year
Despite recoveries in some leading host economies, fragile FDI inflows to SIDS shrank for the second
consecutive year. Although flows into the 10 Caribbean economies in the group slipped to $2 billion (-13
per cent), they still absorbed almost 60 per cent of total inflows to the 29 SIDS members. The largest
recipient economy in this region was Jamaica, followed by the Bahamas and Barbados. The third largest
host economy in 2015, Trinidad and Tobago, saw it FDI flows turn negative.
FDI inflows to Jamaica retreated to $856 million (-7 per cent), as new investments in tourism and
infrastructure slowed down. In mining, Jiuquan Iron and Steel (China) acquired a bauxite mining
company for $299 million from a Russian investor. This is an important project, though this cross-border
M&A sale did not generate additional FDI flows to Jamaica during the year. The growth momentum was
not lost, as the level of 2016 FDI flows was 47 per cent higher than in 2014. In the Bahamas, FDI flows
bounced back by 28 per cent to $522 million, as FDI in construction picked up. Yet the volume remained
less than one third of its previous peaks ($1.6 billion in 2014 and $1.5 billion in 2011). FDI flows into
Barbados also rebounded from $69 million in 2015 to $228 million in 2016, though they are still less than
half of the $559 billion posted in 2014.
After posting positive flows in 2014–2015, the highly volatile FDI to fuel-exporting Trinidad and
Tobago reversed to -$60 million. Unlike in previous years (when divestments took place in coke and
refined petroleum products in 2011–2015 or in extraction of crude petroleum and natural gas in 2012–
2014), the aggregated divestments registered in 2016 in chemicals and chemical products, as well as in
transport and storage, exceeded the gains made in financial and insurance activities.
FDI flows to the five African SIDS recovered to $654 million (+18 per cent) but remained below the
peak of $860 million recorded in 2014. Thanks to a comeback of luxury real estate projects (nearly three
quarters of total flows) and increased investments in financial services and insurance, FDI in Mauritius,
the largest FDI host among SIDS in Africa, rebounded from 2015 to $349 million (+68 per cent) but still
fell short of the levels attained in 2014 ($418 million) and 2012 ($589 million). While FDI flows to Cabo
Verde also picked up modestly (+3 per cent to $119 million), those to Seychelles contracted for the
second year to a 10-year low of $155 million (-20 per cent).
FDI flows to the 14 SIDS in Asia and Oceania – nearly half of all SIDS – fell by 4 per cent to $807
million. Driven by infrastructure and resort developments, FDI in Maldives, the largest FDI host among
SIDS in this region, reached a record high of $448 million (+46 per cent). Announced greenfield projects
suggest a growth in investments from Sri Lanka in tourism and financial services. FDI flows into Fiji, in
contrast, shrank further to a three-year low of $270 million (-12 per cent). In commodity-based Papua
New Guinea, highly volatile FDI flows dipped into a divestment of $40 million, reflecting policy
uncertainties in implementing large-scale mining and natural-gas projects.
The top five FDI recipients in 2016 – Jamaica, the Bahamas, Maldives, Mauritius and Fiji, in that
order – accounted for 70 per cent of total FDI received by all SIDS. This share exceeds 90 per cent when
another five SIDS – Barbados, the Seychelles, Antigua and Barbuda, Cabo Verde, and Saint Vincent and
the Grenadines – are counted. Although FDI flows in SIDS remain insignificant in global terms (0.2 per
cent), as well as compared with the total of all developing economies (0.5 per cent), SIDS depend heavily
on foreign investment: inward FDI stock represents over 80 per cent of their GDP, compared with about
30 per cent in all developing economies.
Some SIDS rely on foreign investors to help diversify their economic activity. For example, to accelerate
diversification away from oil and gas, Trinidad and Tobago, where investments in the industry represent

more than 80 per cent of total inward FDI stock, is seeking to attract foreign investors to expand an
international financial centre and develop trade facilitation infrastructure (e.g. a commercial port, a
maritime and shipbuilding complex, industrial parks, special economic zones). Mauritius, after
successfully diversifying its economy away from sugar into textiles and tourism, is relying on FDI in
luxury real estate, offshore banking, business services outsourcing and medical tourism to further expand
economic activities.
Analysis of announced greenfield FDI projects in 16 island economies, including 7 SIDS, confirms a
relatively strong correlation between the level of economic diversification and the number of FDI projects.
Among the seven SIDS with registered projects, Jamaica was the most successful in attracting diversified
FDI.27 Jamaica’s leading position is also confirmed by the sectoral distribution of its FDI stock and the
cumulative value of announced greenfield projects. Furthermore, Jamaica has attracted the majority of
infrastructure PPPs in energy and transport in SIDS. During the 2011–2015 period, just nine infrastructure
PPPs – five in energy and two in transport – were developed in SIDS economies, of which five (three
energy projects and both transport projects) were implemented in Jamaica, for a total value of $1.2 billion.
A 30-year concession for the Kingston Container Terminal (providing port and harbour operation services)
was awarded to CMA CGM (France) in April 2015. The French MNE assumed control of the facility
from the Port Authority of Jamaica in July 2016; capital spending for the first phase of port expansion is
estimated at $259 million over six years.
Figure 6. SIDS: FDI inflows, ODA and remittances, 2007–2016
(Billions of dollars)
Source: © UNCTAD, based on FDI/MNE database (www.unctad.org/fdistatistics) (for FDI inflows), OECD (for ODA) and the World
Bank (for remittances).
FDI flows to SIDS and remittances have been the most important sources of development finance.
Volatility is a prominent feature in FDI flows to all SIDS, compared with remittances and especially with
ODA (figure 6). Despite their relative instability, in the last three years (2014– 2016), FDI flows slightly
exceeded remittances, with an annual average of $4.3 billion as compared with $4.1 billion. The
importance of FDI relative to the other two sources, however, varies significantly by region, given the
highly skewed distributions of not only FDI, but also ODA and remittances among SIDS: the bulk of FDI
was absorbed by the Caribbean SIDS, and nearly 60 per cent of remittances flowed to Jamaica alone.
SIDS in Asia and Oceania, by contrast, accounted for 75 per cent of ODA to the grouping.

Seven of the top 10 investors in SIDS are developing economies. Although Canada and the United
States are by far the largest investors, their FDI stock remains heavily concentrated in two Caribbean
SIDS: the Bahamas and Barbados. All developing economies except Singapore increased their FDI stock
in SIDS between 2010 and 2015 (figure 7). Most FDI from Brazil to SIDS, which grew by more than 80
per cent between 2010 and 2015, is also held in the Bahamas and Barbados. For India and the rest of the
developing economies, in contrast, FDI stock in SIDS remains concentrated in Mauritius. Among home
countries, China ranked only 11th, but its FDI in SIDS grew almost six times, to 4.8 billion, between 2010
and 2015. More than three quarters of China’s FDI to SIDS is held in three economies: Papua New
Guinea (more than 40 per cent), Mauritius, and Trinidad and Tobago.
Figure 7. SIDS: Top 10 investor economies by FDI stock, 2010 and 2015
(Billions of dollars)
Source: © UNCTAD.
Flows to LDCs are expected to recover, while prospects are cautiously optimistic for
LLDCs and remain dim for SIDS.
Foreign investors are bullish about the LDCs’ potential in manufacturing and services, although oil
and gas will continue to dominate FDI in the near future. Long-term trends in announced greenfield FDI
projects suggest that foreign investors are increasingly interested in LDCs’ services sector (figure 4),
particularly electricity (including alternative and renewable energy), construction, transport, storage and
communications. In the manufacturing sector, greenfield projects announced in recent years highlight
investment opportunities in food and tobacco; building and construction materials; and textiles, clothing
and leather. South-based investors continue to show a keen interest in LDCs. In Ethiopia, for instance, a
$3.7 billion fertilizer plant project from Morocco signalled this LDC’s potential to attract large-scale
manufacturing projects in non-garment industries.
Despite this potential for diversification, large-scale FDI projects in African LDCs continue to focus
on extractive and related industries and to dominate aggregated FDI flows to LDCs. Examples include
petroleum refineries; natural, liquefied and compressed gas production; and, to some extent, metal and
metal products in the manufacturing sector. In the services sector, growth in transport and storage is due
to large-scale projects in oil or natural gas pipelines and terminals.

Furthermore, foreign investors are expected to capitalize on new oil and gas reserves discovered in
Mozambique, Senegal, Uganda and the United Republic of Tanzania. For example, in the United
Republic of Tanzania, where the annual average FDI flows stood at $1.5 billion in 2014–2016, the
national investment promotion agency expects the country’s $30 billion liquefied natural gas project,
together with a $10 billion port project and a $7 billion railway upgrade, to boost the country’s FDI by at
least $2 billion a year.
Regional integration could also contribute to higher FDI flows to LDCs. For example, the
establishment of the ASEAN Economic Community has boosted already positive investor perceptions of
the group’s LDC economies. As a result, foreign investments from China, Japan and other ASEAN
economies (e.g. Malaysia, Thailand, Viet Nam) into the ASEAN LDCs are expected to grow further.
Intraregional FDI, especially from China and India, is likely to grow in Bangladesh and Nepal as well,
facilitated from India by shared membership in the South Asian Association for Regional Cooperation and
from China by bilateral agreements.
Renewed interest in LLDCs by investors has so far bolstered the oil and gas industry mainly, building
on expectations of higher international prices. However, some interest is discernible in manufacturing,
offering some hope for diversification. Diversification into manufacturing takes time, however, and
LLDCs continue to rely on natural resources. Therefore, FDI prospects are still heavily influenced by the
commodity price recovery. The strong performance of announced greenfield projects in 2016 gives reason
for optimism in the near future, although the largest projects (in Kazakhstan and Ethiopia) are expected to
be carried out over the longer run.
LLDCs can contribute to attracting FDI by establishing reliable and transparent regulatory
environments. Continued FDI growth also hinges on political issues, heavily weighing on the success of
cooperation with neighbouring countries, especially transit countries. Regional integration initiatives can
provide a framework of cooperation deeper than bilateral agreements. Examples of progress with regional
integration affecting LLDCs positively include the Eurasian Union in Central Asia, the Central European
Free Trade Agreement for South-East European LLDCs, ASEAN cooperation for the Lao People’s
Democratic Republic and African integration schemes for Ethiopia, Rwanda and Uganda.
A sharp fall in the value of announced greenfield projects from 2015 to 2016 underscores the
continuing challenge for SIDS of securing FDI. The greenfield projects announced during 2016 suggest
that electricity generation (including alternative and renewable energy) and business activities (including
wired telecommunication carriers) will drive FDI in the services sector. Although commodity-based SIDS
have attracted no large-scale greenfield project in the primary sector for the last three years, both Papua
New Guinea and Trinidad and Tobago remain attractive to foreign investors expanding into their
extractive industries; they are also attracting modest investments in electricity, telecommunication and
hotel construction. Owing to the absence of sizeable projects announced by North American MNEs, the
share of capital spending plans attributed to developing economies in greenfield FDI projects swelled to
72 per cent (from the 2013–2015 average of 43 per cent). The five largest greenfield projects announced
during the year were all attributed to South-based investors, including Jamaica.
The scope for, and scale of, South-South cooperation in FDI will grow. In response to the UNCTAD
IPA survey, 12 of the 14 national IPAs in SIDS listed China as one of their most promising sources of
FDI over the period 2017–2019, even though China was not even ranked among the top 10 investors in
SIDS in 2015. Yet, that country’s increasing importance has been reported in some SIDS. For example, in
Fiji, China is the largest source of foreign investments, contributing more than 40 per cent of FDI stock.
In Mauritius, China has become the second largest source of FDI after France. The $3.5 billion resort
project waiting for revitalization in the Bahamas involves not only a Chinese construction company as

the general contractor but also the Export-Import Bank of China as a financial partner for $2.4 billion and
an equity partner of $150 million.
China is not the only developing country from the South ramping up its presence in a greater number
of SIDS. For example, in Seychelles, an international airport expansion project (with an estimated cost of
$150 million) is expected to be implemented by a State-owned enterprise from the United Arab Emirates,
and 40 per cent of this SIDS’s national airline is owned by an Abu Dhabi-based airline. In Maldives, the
traditional development partners are India and the EU; however, South-South cooperation involving
China and Saudi Arabia is on the rise, upgrading critical transport infrastructure to boost tourism revenues.
***
Notes:
Least developed countries (LDCs) include Afghanistan, Angola, Bangladesh, Benin, Bhutan, Burkina Faso, Burundi, Cambodia,
the Central African Republic, Chad, the Comoros, the Democratic Republic of the Congo, Djibouti, Equatorial Guinea, Eritrea,
Ethiopia, the Gambia, Guinea, Guinea-Bissau, Haiti, Kiribati, the Lao People’s Democratic Republic, Lesotho, Liberia,
Madagascar, Malawi, Mali, Mauritania, Mozambique, Myanmar, Nepal, the Niger, Rwanda, Sao Tome and Principe, Senegal,
Sierra Leone, Solomon Islands, Somalia, South Sudan, the Sudan, Timor-Leste, Togo, Tuvalu, Uganda, the United Republic of
Tanzania, Vanuatu, Yemen and Zambia.
Landlocked developing countries (LLDCs) include Afghanistan, Armenia, Azerbaijan, Bhutan, the Plurinational State of
Bolivia, Botswana, Burkina Faso, Burundi, the Central African Republic, Chad, Ethiopia, Kazakhstan, Kyrgyzstan, the Lao
People’s Democratic Republic, Lesotho, the former Yugoslav Republic of Macedonia, Malawi, Mali, the Republic of Moldova,
Mongolia, Nepal, the Niger, Paraguay, Rwanda, South Sudan, Swaziland, Tajikistan, Turkmenistan, Uganda, Uzbekistan,
Zambia and Zimbabwe.
Small island developing States (SIDS) include Antigua and Barbuda, the Bahamas, Barbados, Cabo Verde, the Comoros,
Dominica, Fiji, Grenada, Jamaica, Kiribati, Maldives, the Marshall Islands, Mauritius, the Federated States of Micronesia,
Nauru, Palau, Papua New Guinea, Saint Kitts and Nevis, Saint Lucia, Saint Vincent and the Grenadines, Samoa, Sao Tome and
Príncipe, Seychelles, Solomon Islands, Timor-Leste, Tonga, Trinidad and Tobago, Tuvalu and Vanuatu.

The next issue of UNCTAD’s Global Investment
Trends Monitor will be released in June 2017.