FDA
250
Package ‘fda’ June 2, 2009 Version 2.1.2 Date 2009-03-02 Title Functional Data Analysis Author J. O. Ramsay <[email protected]>, Hadley Wickham <[email protected]>, Spencer Graves <[email protected]>, Giles Hooker <[email protected]> Maintainer J. O. Ramsay <[email protected]> Depends R (>= 2.4.0), splines, zoo Suggests graphics, odesolve, R.matlab, quadprog, DierckxSpline, nlme Description These functions were developed to support functional data analysis as described in Ramsay, J. O. and Silverman, B. W. (2005) Functional Data Analysis. New York: Springer. They were ported from earlier versions in Matlab and S-PLUS. An introduction appears in Ramsay, J. O., Hooker, Giles, and Graves, Spencer (2009) Functional Data Analysis with R and Matlab (Springer). The package includes data sets and script files working many examples including all but one of the 76 figures in this latter book. License GPL (>= 2) URL http://www.functionaldata.org LazyData true Repository CRAN Repository/R-Forge/Project fda Repository/R-Forge/Revision 442 Date/Publication 2009-06-02 17:28:41 1
-
Upload
amine-khlil -
Category
Documents
-
view
116 -
download
6
Transcript of FDA

Package ‘fda’June 2, 2009
Version 2.1.2
Date 2009-03-02
Title Functional Data Analysis
Author J. O. Ramsay <[email protected]>, Hadley Wickham <[email protected]>,Spencer Graves <[email protected]>, Giles Hooker <[email protected]>
Maintainer J. O. Ramsay <[email protected]>
Depends R (>= 2.4.0), splines, zoo
Suggests graphics, odesolve, R.matlab, quadprog, DierckxSpline, nlme
Description These functions were developed to support functional data analysis as described inRamsay, J. O. and Silverman, B. W. (2005) Functional Data Analysis. New York: Springer. Theywere ported from earlier versions in Matlab and S-PLUS. An introduction appears in Ramsay, J.O., Hooker, Giles, and Graves, Spencer (2009) Functional Data Analysis with R and Matlab(Springer). The package includes data sets and script files working many examples including allbut one of the 76 figures in this latter book.
License GPL (>= 2)
URL http://www.functionaldata.org
LazyData true
Repository CRAN
Repository/R-Forge/Project fda
Repository/R-Forge/Revision 442
Date/Publication 2009-06-02 17:28:41
1

2 R topics documented:
R topics documented:fda-package . . . . . . . . . . . . . . . . . . . . . . . . . . . . . . . . . . . . . . . . . 5AmpPhaseDecomp . . . . . . . . . . . . . . . . . . . . . . . . . . . . . . . . . . . . . 6argvalsy.swap . . . . . . . . . . . . . . . . . . . . . . . . . . . . . . . . . . . . . . . . 7arithmetic.basisfd . . . . . . . . . . . . . . . . . . . . . . . . . . . . . . . . . . . . . . 10arithmetic.fd . . . . . . . . . . . . . . . . . . . . . . . . . . . . . . . . . . . . . . . . . 11as.array3 . . . . . . . . . . . . . . . . . . . . . . . . . . . . . . . . . . . . . . . . . . . 13as.fd . . . . . . . . . . . . . . . . . . . . . . . . . . . . . . . . . . . . . . . . . . . . . 14axisIntervals . . . . . . . . . . . . . . . . . . . . . . . . . . . . . . . . . . . . . . . . . 18basisfd.product . . . . . . . . . . . . . . . . . . . . . . . . . . . . . . . . . . . . . . . 19bifd . . . . . . . . . . . . . . . . . . . . . . . . . . . . . . . . . . . . . . . . . . . . . 20bsplinepen . . . . . . . . . . . . . . . . . . . . . . . . . . . . . . . . . . . . . . . . . . 22bsplineS . . . . . . . . . . . . . . . . . . . . . . . . . . . . . . . . . . . . . . . . . . . 23CanadianWeather . . . . . . . . . . . . . . . . . . . . . . . . . . . . . . . . . . . . . . 24cca.fd . . . . . . . . . . . . . . . . . . . . . . . . . . . . . . . . . . . . . . . . . . . . 26center.fd . . . . . . . . . . . . . . . . . . . . . . . . . . . . . . . . . . . . . . . . . . . 28checkDims3 . . . . . . . . . . . . . . . . . . . . . . . . . . . . . . . . . . . . . . . . . 29checkLogicalInteger . . . . . . . . . . . . . . . . . . . . . . . . . . . . . . . . . . . . 32coef.fd . . . . . . . . . . . . . . . . . . . . . . . . . . . . . . . . . . . . . . . . . . . . 34cor.fd . . . . . . . . . . . . . . . . . . . . . . . . . . . . . . . . . . . . . . . . . . . . 36create.basis . . . . . . . . . . . . . . . . . . . . . . . . . . . . . . . . . . . . . . . . . 38create.bspline.basis . . . . . . . . . . . . . . . . . . . . . . . . . . . . . . . . . . . . . 41create.constant.basis . . . . . . . . . . . . . . . . . . . . . . . . . . . . . . . . . . . . 45create.exponential.basis . . . . . . . . . . . . . . . . . . . . . . . . . . . . . . . . . . . 46create.fourier.basis . . . . . . . . . . . . . . . . . . . . . . . . . . . . . . . . . . . . . 48create.monomial.basis . . . . . . . . . . . . . . . . . . . . . . . . . . . . . . . . . . . . 50create.polygonal.basis . . . . . . . . . . . . . . . . . . . . . . . . . . . . . . . . . . . . 52create.polynomial.basis . . . . . . . . . . . . . . . . . . . . . . . . . . . . . . . . . . . 54create.power.basis . . . . . . . . . . . . . . . . . . . . . . . . . . . . . . . . . . . . . . 56CSTR . . . . . . . . . . . . . . . . . . . . . . . . . . . . . . . . . . . . . . . . . . . . 58cycleplot.fd . . . . . . . . . . . . . . . . . . . . . . . . . . . . . . . . . . . . . . . . . 64Data2fd . . . . . . . . . . . . . . . . . . . . . . . . . . . . . . . . . . . . . . . . . . . 65data2fd.old . . . . . . . . . . . . . . . . . . . . . . . . . . . . . . . . . . . . . . . . . 70dateAccessories . . . . . . . . . . . . . . . . . . . . . . . . . . . . . . . . . . . . . . . 72density.fd . . . . . . . . . . . . . . . . . . . . . . . . . . . . . . . . . . . . . . . . . . 74deriv.fd . . . . . . . . . . . . . . . . . . . . . . . . . . . . . . . . . . . . . . . . . . . 76df.residual.fRegress . . . . . . . . . . . . . . . . . . . . . . . . . . . . . . . . . . . . . 77df2lambda . . . . . . . . . . . . . . . . . . . . . . . . . . . . . . . . . . . . . . . . . . 79dirs . . . . . . . . . . . . . . . . . . . . . . . . . . . . . . . . . . . . . . . . . . . . . 80Eigen . . . . . . . . . . . . . . . . . . . . . . . . . . . . . . . . . . . . . . . . . . . . 82eigen.pda . . . . . . . . . . . . . . . . . . . . . . . . . . . . . . . . . . . . . . . . . . 84eval.basis . . . . . . . . . . . . . . . . . . . . . . . . . . . . . . . . . . . . . . . . . . 85eval.bifd . . . . . . . . . . . . . . . . . . . . . . . . . . . . . . . . . . . . . . . . . . . 87eval.fd . . . . . . . . . . . . . . . . . . . . . . . . . . . . . . . . . . . . . . . . . . . . 89eval.monfd . . . . . . . . . . . . . . . . . . . . . . . . . . . . . . . . . . . . . . . . . 91eval.penalty . . . . . . . . . . . . . . . . . . . . . . . . . . . . . . . . . . . . . . . . . 93eval.posfd . . . . . . . . . . . . . . . . . . . . . . . . . . . . . . . . . . . . . . . . . . 95

R topics documented: 3
evaldiag.bifd . . . . . . . . . . . . . . . . . . . . . . . . . . . . . . . . . . . . . . . . . 96expect.phi . . . . . . . . . . . . . . . . . . . . . . . . . . . . . . . . . . . . . . . . . . 97expon . . . . . . . . . . . . . . . . . . . . . . . . . . . . . . . . . . . . . . . . . . . . 98exponpen . . . . . . . . . . . . . . . . . . . . . . . . . . . . . . . . . . . . . . . . . . 99fdaMatlabPath . . . . . . . . . . . . . . . . . . . . . . . . . . . . . . . . . . . . . . . . 100fdlabels . . . . . . . . . . . . . . . . . . . . . . . . . . . . . . . . . . . . . . . . . . . 101fdPar . . . . . . . . . . . . . . . . . . . . . . . . . . . . . . . . . . . . . . . . . . . . . 102file.copy2 . . . . . . . . . . . . . . . . . . . . . . . . . . . . . . . . . . . . . . . . . . 104fourier . . . . . . . . . . . . . . . . . . . . . . . . . . . . . . . . . . . . . . . . . . . . 105fourierpen . . . . . . . . . . . . . . . . . . . . . . . . . . . . . . . . . . . . . . . . . . 106Fperm.fd . . . . . . . . . . . . . . . . . . . . . . . . . . . . . . . . . . . . . . . . . . . 107fRegress . . . . . . . . . . . . . . . . . . . . . . . . . . . . . . . . . . . . . . . . . . . 111fRegress.CV . . . . . . . . . . . . . . . . . . . . . . . . . . . . . . . . . . . . . . . . . 119fRegress.stderr . . . . . . . . . . . . . . . . . . . . . . . . . . . . . . . . . . . . . . . 121Fstat.fd . . . . . . . . . . . . . . . . . . . . . . . . . . . . . . . . . . . . . . . . . . . 122gait . . . . . . . . . . . . . . . . . . . . . . . . . . . . . . . . . . . . . . . . . . . . . 123getbasismatrix . . . . . . . . . . . . . . . . . . . . . . . . . . . . . . . . . . . . . . . . 124getbasispenalty . . . . . . . . . . . . . . . . . . . . . . . . . . . . . . . . . . . . . . . 125getbasisrange . . . . . . . . . . . . . . . . . . . . . . . . . . . . . . . . . . . . . . . . 126growth . . . . . . . . . . . . . . . . . . . . . . . . . . . . . . . . . . . . . . . . . . . . 126handwrit . . . . . . . . . . . . . . . . . . . . . . . . . . . . . . . . . . . . . . . . . . . 127infantGrowth . . . . . . . . . . . . . . . . . . . . . . . . . . . . . . . . . . . . . . . . 128inprod . . . . . . . . . . . . . . . . . . . . . . . . . . . . . . . . . . . . . . . . . . . . 129inprod.bspline . . . . . . . . . . . . . . . . . . . . . . . . . . . . . . . . . . . . . . . . 131int2Lfd . . . . . . . . . . . . . . . . . . . . . . . . . . . . . . . . . . . . . . . . . . . 131intensity.fd . . . . . . . . . . . . . . . . . . . . . . . . . . . . . . . . . . . . . . . . . 132is.basis . . . . . . . . . . . . . . . . . . . . . . . . . . . . . . . . . . . . . . . . . . . . 134is.fd . . . . . . . . . . . . . . . . . . . . . . . . . . . . . . . . . . . . . . . . . . . . . 135is.fdPar . . . . . . . . . . . . . . . . . . . . . . . . . . . . . . . . . . . . . . . . . . . 135is.Lfd . . . . . . . . . . . . . . . . . . . . . . . . . . . . . . . . . . . . . . . . . . . . 136knots.fd . . . . . . . . . . . . . . . . . . . . . . . . . . . . . . . . . . . . . . . . . . . 136lambda2df . . . . . . . . . . . . . . . . . . . . . . . . . . . . . . . . . . . . . . . . . . 138lambda2gcv . . . . . . . . . . . . . . . . . . . . . . . . . . . . . . . . . . . . . . . . . 138landmarkreg . . . . . . . . . . . . . . . . . . . . . . . . . . . . . . . . . . . . . . . . . 139Lfd . . . . . . . . . . . . . . . . . . . . . . . . . . . . . . . . . . . . . . . . . . . . . . 141lines.fd . . . . . . . . . . . . . . . . . . . . . . . . . . . . . . . . . . . . . . . . . . . 142linmod . . . . . . . . . . . . . . . . . . . . . . . . . . . . . . . . . . . . . . . . . . . . 143lip . . . . . . . . . . . . . . . . . . . . . . . . . . . . . . . . . . . . . . . . . . . . . . 144lmeWinsor . . . . . . . . . . . . . . . . . . . . . . . . . . . . . . . . . . . . . . . . . . 145lmWinsor . . . . . . . . . . . . . . . . . . . . . . . . . . . . . . . . . . . . . . . . . . 148lmWinsor12 . . . . . . . . . . . . . . . . . . . . . . . . . . . . . . . . . . . . . . . . . 151mean.fd . . . . . . . . . . . . . . . . . . . . . . . . . . . . . . . . . . . . . . . . . . . 152melanoma . . . . . . . . . . . . . . . . . . . . . . . . . . . . . . . . . . . . . . . . . . 154monfn . . . . . . . . . . . . . . . . . . . . . . . . . . . . . . . . . . . . . . . . . . . . 154monomial . . . . . . . . . . . . . . . . . . . . . . . . . . . . . . . . . . . . . . . . . . 156monomialpen . . . . . . . . . . . . . . . . . . . . . . . . . . . . . . . . . . . . . . . . 157MontrealTemp . . . . . . . . . . . . . . . . . . . . . . . . . . . . . . . . . . . . . . . . 158nondurables . . . . . . . . . . . . . . . . . . . . . . . . . . . . . . . . . . . . . . . . . 158

4 R topics documented:
norder . . . . . . . . . . . . . . . . . . . . . . . . . . . . . . . . . . . . . . . . . . . . 159objAndNames . . . . . . . . . . . . . . . . . . . . . . . . . . . . . . . . . . . . . . . . 160odesolv . . . . . . . . . . . . . . . . . . . . . . . . . . . . . . . . . . . . . . . . . . . 162onechild . . . . . . . . . . . . . . . . . . . . . . . . . . . . . . . . . . . . . . . . . . . 163pca.fd . . . . . . . . . . . . . . . . . . . . . . . . . . . . . . . . . . . . . . . . . . . . 163pda.fd . . . . . . . . . . . . . . . . . . . . . . . . . . . . . . . . . . . . . . . . . . . . 165pda.overlay . . . . . . . . . . . . . . . . . . . . . . . . . . . . . . . . . . . . . . . . . 171phaseplanePlot . . . . . . . . . . . . . . . . . . . . . . . . . . . . . . . . . . . . . . . 172pinch . . . . . . . . . . . . . . . . . . . . . . . . . . . . . . . . . . . . . . . . . . . . 174plot.basisfd . . . . . . . . . . . . . . . . . . . . . . . . . . . . . . . . . . . . . . . . . 175plot.fd . . . . . . . . . . . . . . . . . . . . . . . . . . . . . . . . . . . . . . . . . . . . 176plot.Lfd . . . . . . . . . . . . . . . . . . . . . . . . . . . . . . . . . . . . . . . . . . . 178plot.lmWinsor . . . . . . . . . . . . . . . . . . . . . . . . . . . . . . . . . . . . . . . . 179plot.pca.fd . . . . . . . . . . . . . . . . . . . . . . . . . . . . . . . . . . . . . . . . . . 180plot.pda.fd . . . . . . . . . . . . . . . . . . . . . . . . . . . . . . . . . . . . . . . . . . 182plotbeta . . . . . . . . . . . . . . . . . . . . . . . . . . . . . . . . . . . . . . . . . . . 184plotfit . . . . . . . . . . . . . . . . . . . . . . . . . . . . . . . . . . . . . . . . . . . . 184plotscores . . . . . . . . . . . . . . . . . . . . . . . . . . . . . . . . . . . . . . . . . . 188polyg . . . . . . . . . . . . . . . . . . . . . . . . . . . . . . . . . . . . . . . . . . . . 189polygpen . . . . . . . . . . . . . . . . . . . . . . . . . . . . . . . . . . . . . . . . . . 190powerbasis . . . . . . . . . . . . . . . . . . . . . . . . . . . . . . . . . . . . . . . . . 191powerpen . . . . . . . . . . . . . . . . . . . . . . . . . . . . . . . . . . . . . . . . . . 192predict.fRegress . . . . . . . . . . . . . . . . . . . . . . . . . . . . . . . . . . . . . . . 193predict.lmeWinsor . . . . . . . . . . . . . . . . . . . . . . . . . . . . . . . . . . . . . . 195predict.lmWinsor . . . . . . . . . . . . . . . . . . . . . . . . . . . . . . . . . . . . . . 197project.basis . . . . . . . . . . . . . . . . . . . . . . . . . . . . . . . . . . . . . . . . . 199quadset . . . . . . . . . . . . . . . . . . . . . . . . . . . . . . . . . . . . . . . . . . . 200refinery . . . . . . . . . . . . . . . . . . . . . . . . . . . . . . . . . . . . . . . . . . . 201ReginaPrecip . . . . . . . . . . . . . . . . . . . . . . . . . . . . . . . . . . . . . . . . 202register.fd . . . . . . . . . . . . . . . . . . . . . . . . . . . . . . . . . . . . . . . . . . 203register.newfd . . . . . . . . . . . . . . . . . . . . . . . . . . . . . . . . . . . . . . . . 206residuals.fRegress . . . . . . . . . . . . . . . . . . . . . . . . . . . . . . . . . . . . . . 207sd.fd . . . . . . . . . . . . . . . . . . . . . . . . . . . . . . . . . . . . . . . . . . . . . 209seabird . . . . . . . . . . . . . . . . . . . . . . . . . . . . . . . . . . . . . . . . . . . . 210smooth.basis . . . . . . . . . . . . . . . . . . . . . . . . . . . . . . . . . . . . . . . . . 211smooth.basisPar . . . . . . . . . . . . . . . . . . . . . . . . . . . . . . . . . . . . . . . 215smooth.bibasis . . . . . . . . . . . . . . . . . . . . . . . . . . . . . . . . . . . . . . . 219smooth.fd . . . . . . . . . . . . . . . . . . . . . . . . . . . . . . . . . . . . . . . . . . 220smooth.fdPar . . . . . . . . . . . . . . . . . . . . . . . . . . . . . . . . . . . . . . . . 221smooth.monotone . . . . . . . . . . . . . . . . . . . . . . . . . . . . . . . . . . . . . . 223smooth.morph . . . . . . . . . . . . . . . . . . . . . . . . . . . . . . . . . . . . . . . . 227smooth.pos . . . . . . . . . . . . . . . . . . . . . . . . . . . . . . . . . . . . . . . . . 228StatSciChinese . . . . . . . . . . . . . . . . . . . . . . . . . . . . . . . . . . . . . . . 229sum.fd . . . . . . . . . . . . . . . . . . . . . . . . . . . . . . . . . . . . . . . . . . . . 230summary.basisfd . . . . . . . . . . . . . . . . . . . . . . . . . . . . . . . . . . . . . . 231summary.bifd . . . . . . . . . . . . . . . . . . . . . . . . . . . . . . . . . . . . . . . . 232summary.fd . . . . . . . . . . . . . . . . . . . . . . . . . . . . . . . . . . . . . . . . . 232summary.fdPar . . . . . . . . . . . . . . . . . . . . . . . . . . . . . . . . . . . . . . . 233

fda-package 5
summary.Lfd . . . . . . . . . . . . . . . . . . . . . . . . . . . . . . . . . . . . . . . . 233svd2 . . . . . . . . . . . . . . . . . . . . . . . . . . . . . . . . . . . . . . . . . . . . . 234TaylorSpline . . . . . . . . . . . . . . . . . . . . . . . . . . . . . . . . . . . . . . . . . 235tperm.fd . . . . . . . . . . . . . . . . . . . . . . . . . . . . . . . . . . . . . . . . . . . 236var.fd . . . . . . . . . . . . . . . . . . . . . . . . . . . . . . . . . . . . . . . . . . . . 238varmx . . . . . . . . . . . . . . . . . . . . . . . . . . . . . . . . . . . . . . . . . . . . 240varmx.cca.fd . . . . . . . . . . . . . . . . . . . . . . . . . . . . . . . . . . . . . . . . . 241varmx.pca.fd . . . . . . . . . . . . . . . . . . . . . . . . . . . . . . . . . . . . . . . . 242vec2Lfd . . . . . . . . . . . . . . . . . . . . . . . . . . . . . . . . . . . . . . . . . . . 242wtcheck . . . . . . . . . . . . . . . . . . . . . . . . . . . . . . . . . . . . . . . . . . . 243zerofind . . . . . . . . . . . . . . . . . . . . . . . . . . . . . . . . . . . . . . . . . . . 244
Index 245
fda-package Functional Data Analysis in R
Description
Functions and data sets companion to Ramsay, J. O., and Silverman, B. W. (2006) Functional DataAnalysis, 2nd ed. and (2002) Applied Functional Data Analysis (Springer). This includes finitebases approximations (such as splines and Fourier series) to functions fit to data smoothing on theintegral of the squared deviations from an arbitrary differential operator.
Details
Package: fdaType: PackageVersion: 2.1.0Date: 2008-11-28License: GPL-2LazyLoad: yes
Author(s)
J. O. Ramsay,
Maintainer: J. O. Ramsay <[email protected]>
References
Ramsay, James O., and Silverman, Bernard W. (2006), Functional Data Analysis, 2nd ed., Springer,New York.
Ramsay, James O., and Silverman, Bernard W. (2002), Applied Functional Data Analysis, Springer,New York.

6 AmpPhaseDecomp
Examples
#### Simple smoothing##girlGrowthSm <- with(growth, smooth.basisPar(argvals=age, y=hgtf))plot(girlGrowthSm$fd, xlab="age", ylab="height (cm)",
main="Girls in Berkeley Growth Study" )plot(deriv(girlGrowthSm$fd), xlab="age", ylab="growth rate (cm / year)",
main="Girls in Berkeley Growth Study" )plot(deriv(girlGrowthSm$fd, 2), xlab="age",
ylab="growth acceleration (cm / year^2)",main="Girls in Berkeley Growth Study" )
#### Simple basis##bspl1.2 <- create.bspline.basis(norder=1, breaks=c(0,.5, 1))plot(bspl1.2)# 2 bases, order 1 = degree 0 = step functions:# (1) constant 1 between 0 and 0.5 and 0 otherwise# (2) constant 1 between 0.5 and 1 and 0 otherwise.
fd1.2 <- Data2fd(0:1, basisobj=bspl1.2)op <- par(mfrow=c(2,1))plot(bspl1.2, main='bases')plot(fd1.2, main='fit')par(op)# A step function: 0 to time=0.5, then 1 after
AmpPhaseDecomp Decomposition for Amplitude and Phase Variation
Description
Registration is the process of aligning peaks, valleys and other features in a sample of curves.Once the registration has taken place, this function computes two mean squared error measures,one for amplitude variation, and the other for phase variation. It also computes a squared multiplecorrelation index of the amount of variation in the unregistered functions is due to phase.
Usage
AmpPhaseDecomp(xfd, yfd, hfd, rng=xrng)
Arguments
xfd a functional data object containing the unregistered curves.
yfd a functional data object containing the registered curves.
hfd a functional data object containing the strictly monotone warping functions h(t).This is typically returned by the functions landmarkreg and register.fd.

argvalsy.swap 7
rng a vector of length 2 specifying a range of values over which the decomposition isto be computed. Both values must be within the range of the functional data ob-jects in the argument. By default the whole range of the functional data objectsis used.
Details
The decomposition can yield negative values for MS.phas if the registration does not improvethe alignment of the curves, or if used to compare two registration processes based on differentprinciples, such as is the case for functions landmarkreg and register.fd.
Value
a named list with the following components:
MS.amp the mean squared error for amplitude variation.
MS.phas the mean squared error for phase variation.
RSQR the squared correlation measure of the proportion of the total variation that isdue to phase variation.
C a constant required for the decomposition. Its value is one if the derivatives thewarping functions are independent of the squared registered functions.
See Also
landmarkreg, register.fd, smooth.morph
Examples
#See the analysis for the growth data in the examples.
argvalsy.swap Swap argvals with y if the latter is simpler.
Description
Preprocess argvals, y, and basisobj. If only one of argvals and y is provided, use it as yand take argvals as a vector spanning basisobj[[’rangreval’]]. If both are provided, the simplerbecomes argvals. If both have the same dimensions but only one lies in basisobj[[’rangreval’]],that becomes argvals.
Usage
argvalsy.swap(argvals=NULL, y=NULL, basisobj=NULL)

8 argvalsy.swap
Arguments
argvals a vector or array of argument values.
y an array containing sampled values of curves.
basisobj One of the following:
basisfd a functional basis object (class basisfd.fd a functional data object (class fd), from which its basis component is
extracted.fdPar a functional parameter object (class fdPar), from which its basis com-
ponent is extracted.integer an integer giving the order of a B-spline basis, create.bspline.basis(argvals,
norder=basisobj)numeric vector specifying the knots for a B-spline basis, create.bspline.basis(basisobj)
NULL Defaults to create.bspline.basis(argvals).
Details
1. If y is NULL, replace by argvals.
2. If argvals is NULL, replace by seq(basisobj[[’rangeval’]][1], basisobj[[’rangeval’]][2], dim(y)[1])with a warning.
3. If the dimensions of argvals and y match and only one is contained in basisobj[[’rangeval’]],use that as argvals and the other as y.
4. if y has fewer dimensions than argvals, swap them.
Value
a list with components argvals, y, and basisobj.
See Also
Data2fd smooth.basis, smooth.basisPar
Examples
#### one argument: y##argvalsy.swap(1:5)# warning ...
#### (argvals, y), same dimensions: retain order##argy1 <- argvalsy.swap(seq(0, 1, .2), 1:6)argy1a <- argvalsy.swap(1:6, seq(0, 1, .2))
all.equal(argy1[[1]], argy1a[[2]]) &&

argvalsy.swap 9
all.equal(argy1[[2]], argy1a[[1]])# TRUE; basisobj different
# lengths do not match## Not run:argvalsy.swap(1:4, 1:5)## End(Not run)
#### two numeric arguments, different dimensions: put simplest first##argy2 <- argvalsy.swap(seq(0, 1, .2), matrix(1:12, 6))
all.equal(argy2,argvalsy.swap(matrix(1:12, 6), seq(0, 1, .2)) )# TRUE with a warning ...
## Not run:argvalsy.swap(seq(0, 1, .2), matrix(1:12, 2))# ERROR: first dimension does not match## End(Not run)
#### one numeric, one basisobj##argy3 <- argvalsy.swap(1:6, b=4)# warning: argvals assumed seq(0, 1, .2)
argy3. <- argvalsy.swap(1:6, b=create.bspline.basis(breaks=0:1))# warning: argvals assumed seq(0, 1, .2)
argy3.6 <- argvalsy.swap(seq(0, 1, .2), b=create.bspline.basis(breaks=1:3))# warning: argvals assumed seq(1, 3 length=6)
#### two numeric, one basisobj: first matches basisobj### OKargy3a <- argvalsy.swap(1:6, seq(0, 1, .2),
create.bspline.basis(breaks=c(1, 4, 8)))
# Swap (argvals, y)
all.equal(argy3a,argvalsy.swap(seq(0, 1, .2), 1:6,
create.bspline.basis(breaks=c(1, 4, 8))) )# TRUE with a warning
## Not run:

10 arithmetic.basisfd
# neither match basisobj: errorargvalsy.swap(seq(0, 1, .2), 1:6,
create.bspline.basis(breaks=1:3) )## End(Not run)
arithmetic.basisfd Arithmatic on functional basis objects
Description
Arithmatic on functional basis objects
Usage
"==.basisfd"(basis1, basis2)
Arguments
basis1, basis2functional basis object
Value
basisobj1 == basisobj2 returns a logical scalar.
References
Ramsay, James O., and Silverman, Bernard W. (2006), Functional Data Analysis, 2nd ed., Springer,New York.
Ramsay, James O., and Silverman, Bernard W. (2002), Applied Functional Data Analysis, Springer,New York.
See Also
basisfd, basisfd.product arithmetic.fd

arithmetic.fd 11
arithmetic.fd Arithmetic on functional data (’fd’) objects
Description
Arithmetic on functional data objects
Usage
"+.fd"(e1, e2)"-.fd"(e1, e2)"*.fd"(e1, e2)plus.fd(e1, e2, basisobj=NULL)minus.fd(e1, e2, basisobj=NULL)times.fd(e1, e2, basisobj=NULL)
Arguments
e1, e2 object of class ’fd’ or a numeric vector. Note that ’e1+e2’ will dispatch toplus.fd(e1, e2) only of e1 has class ’fd’. Similarly, ’e1-e2’ or ’e1*e2’ will dis-patch to minus.fd(e1, e2) or time.fd(e1, e2), respetively, only if e1 is of class’fd’.
basisobj reference basis; defaults to e1[[’basis’]] * e2[[’basis’]]; ignored for plus.fdand minus.fd.
Value
A function data object corresponding to the pointwise sum, difference or product of e1 and e2.
If both arguments are functional data objects, the bases are the same, and the coefficient matricesare the same dims, the indicated operation is applied to the coefficient matrices of the two objects.In other words, e1+e2 is obtained for this case by adding the coefficient matrices from e1 and e2.
If e1 or e2 is a numeric scalar, that scalar is applied to the coefficient matrix of the functional dataobject.
If either e1 or e2 is a numeric vector, it must be the same length as the number of replicated func-tional observations in the other argument.
When both arguments are functional data objects, they need not have the same bases. However, ifthey don’t have the same number of replicates, then one of them must have a single replicate. Inthe second case, the singleton function is replicated to match the number of replicates of the otherfunction. In either case, they must have the same number of functions. When both arguments arefunctional data objects, and the bases are not the same, the basis used for the sum is constructedto be of higher dimension than the basis for either factor according to rules described in functionTIMES for two basis objects.
See Also
basisfd, basisfd.product

12 arithmetic.fd
Examples
#### add a parabola to itself##bspl4 <- create.bspline.basis(nbasis=4)parab4.5 <- fd(c(3, -1, -1, 3)/3, bspl4)
coef2 <- matrix(c(6, -2, -2, 6)/3, 4)dimnames(coef2) <- list(NULL, 'reps 1')
all.equal(coef(parab4.5+parab4.5), coef2)
#### Same example with interior knots at 1/3 and 1/2##bspl5.3 <- create.bspline.basis(breaks=c(0, 1/3, 1))plot(bspl5.3)x. <- seq(0, 1, .1)para4.5.3 <- smooth.basis(x., 4*(x.-0.5)^2, fdParobj=bspl5.3)[['fd']]plot(para4.5.3)
bspl5.2 <- create.bspline.basis(breaks=c(0, 1/2, 1))plot(bspl5.2)para4.5.2 <- smooth.basis(x., 4*(x.-0.5)^2, fdParobj=bspl5.2)[['fd']]plot(para4.5.2)
#str(para4.5.3+para4.5.2)
coef2. <- matrix(0, 9, 1)dimnames(coef2.) <- list(NULL, 'rep1')
all.equal(coef(para4.5.3-para4.5.2), coef2.)
#str(para4.5.3*para4.5.2)# interior knots of the sum# = union(interior knots of the summands);# ditto for difference and product.plot(para4.5.3*para4.5.2)
#### fd+numeric##coef1 <- matrix(c(6, 2, 2, 6)/3, 4)dimnames(coef1) <- list(NULL, 'reps 1')
all.equal(coef(parab4.5+1), coef1)
all.equal(1+parab4.5, parab4.5+1)

as.array3 13
#### fd-numeric##coefneg <- matrix(c(-3, 1, 1, -3)/3, 4)dimnames(coefneg) <- list(NULL, 'reps 1')
all.equal(coef(-parab4.5), coefneg)
plot(parab4.5-1)
plot(1-parab4.5)
as.array3 Reshape a vector or array to have 3 dimensions.
Description
Coerce a vector or array to have 3 dimensions, preserving dimnames if feasible. Throw an error iflength(dim(x)) > 3.
Usage
as.array3(x)
Arguments
x A vector or array.
Details
1. dimx <- dim(x); ndim <- length(dimx)
2. if(ndim==3)return(x).
3. if(ndim>3)stop.
4. x2 <- as.matrix(x)
5. dim(x2) <- c(dim(x2), 1)
6. xnames <- dimnames(x)
7. if(is.list(xnames))dimnames(x2) <- list(xnames[[1]], xnames[[2]], NULL)
Value
A 3-dimensional array with names matching x

14 as.fd
Author(s)
Spencer Graves
See Also
dim, dimnames checkDims3
Examples
#### vector -> array##as.array3(c(a=1, b=2))
#### matrix -> array##as.array3(matrix(1:6, 2))as.array3(matrix(1:6, 2, dimnames=list(letters[1:2], LETTERS[3:5])))
#### array -> array##as.array3(array(1:6, 1:3))
#### 4-d array#### Not run:as.array3(array(1:24, 1:4))Error in as.array3(array(1:24, 1:4)) :length(dim(array(1:24, 1:4)) = 4 > 3
## End(Not run)
as.fd Convert a spline object to class ’fd’
Description
Translate a spline object of another class into the Functional Data (class fd) format.
Usage
as.fd(x, ...)## S3 method for class 'fdSmooth':as.fd(x, ...)## S3 method for class 'dierckx':as.fd(x, ...)## S3 method for class 'function':

as.fd 15
as.fd(x, ...)## S3 method for class 'smooth.spline':as.fd(x, ...)
Arguments
x an object to be converted to class fd.... optional arguments passed to specific methods, currently unused.
Details
The behavior depends on the class and nature of x.
as.fd.fdSmooth extract the fd componentas.fd.dierckx The ’fda’ package (as of version 2.0.0) supports B-splines with coincident boundary knots. For
periodic phenomena, the DierckxSpline packages uses periodic spines, while fda rec-ommends finite Fourier series. Accordingly, as.fd.dierckx if x[["periodic"]] is TRUE.The following describes how the components of a dierckx object are handled by as.dierckx(as.fd(x)):
x lost. Restored from the knots.y lost. Restored from spline predictions at the restored values of ’x’.w lost. Restored as rep(1, length(x)).
from, to fd[["basis"]][["rangeval"]]k coded indirectly as fd[["basis"]][["nbasis"]] - length(fd[["basis"]][["params"]]) - 1.s lost, restored as 0.
nest lost, restored as length(x) + k + 1n coded indirectly as 2*fd[["basis"]][["nbasis"]] - length(fd[["basis"]][["params"]]).
knots The end knots are stored (unreplicated) in fd[["basis"]][["rangeval"]], while the interiorknots are stored in fd[["basis"]][["params"]].
fp lost. Restored as 0.wrk, lwrk, iwrk lost. Restore by refitting to the knots.
ier lost. Restored as 0.message lost. Restored as character(0).
g stored indirectly as length(fd[["basis"]][["params"]]).method lost. Restored as "ss".
periodic ’dierckx2fd’ only translates ’dierckx’ objects with coincident boundary knots. Therefore,’periodic’ is restored as FALSE.
routine lost. Restored as ’curfit.default’.xlab fd[["fdnames"]][["args"]]ylab fd[["fdnames"]][["funs"]]
as.fd.function Create an fd object from a function of the form created by splinefun. This will translatemethod = ’fmn’ and ’natural’ but not ’periodic’: ’fmn’ splines are isomorphic to standard B-splines with coincident boundary knots, which is the basis produced by create.bspline.basis.’natural’ splines occupy a subspace of this space, with the restriction that the second deriva-tive at the end points is zero (as noted in the Wikipedia spline article). ’periodic’ splines donot use coindicent boundary knots and are not currently supported in fda; instead, fda usesfinite Fourier bases for periodic phenomena.
as.fd.smooth.spline Create an fd object from a smooth.spline object.

16 as.fd
Value
as.fd.dierckx converts an object of class ’dierckx’ into one of class fd.
Author(s)
Spencer Graves
References
Dierckx, P. (1991) Curve and Surface Fitting with Splines, Oxford Science Publications.
Ramsay, James O., and Silverman, Bernard W. (2006), Functional Data Analysis, 2nd ed., Springer,New York.
Ramsay, James O., and Silverman, Bernard W. (2002), Applied Functional Data Analysis, Springer,New York.
spline entry in Wikipedia http://en.wikipedia.org/wiki/Spline_(mathematics)
See Also
as.dierckx curfit fd splinefun
Examples
#### as.fd.fdSmooth##girlGrowthSm <- with(growth, smooth.basisPar(argvals=age, y=hgtf))girlGrowth.fd <- as.fd(girlGrowthSm)
#### as.fd.dierckx##x <- 0:24y <- c(1.0,1.0,1.4,1.1,1.0,1.0,4.0,9.0,13.0,
13.4,12.8,13.1,13.0,14.0,13.0,13.5,10.0,2.0,3.0,2.5,2.5,2.5,3.0,4.0,3.5)
library(DierckxSpline)curfit.xy <- curfit(x, y, s=0)
curfit.fd <- as.fd(curfit.xy)plot(curfit.fd) # as an 'fd' objectpoints(x, y) # Curve goes through the points.
x. <- seq(0, 24, length=241)pred.y <- predict(curfit.xy, x.)lines(x., pred.y, lty="dashed", lwd=3, col="blue")# dierckx and fd objects match.
all.equal(knots(curfit.xy, FALSE), knots(curfit.fd, FALSE))

as.fd 17
all.equal(coef(curfit.xy), as.vector(coef(curfit.fd)))
#### as.fd.function(splinefun(...), ...)##x2 <- 1:7y2 <- sin((x2-0.5)*pi)f <- splinefun(x2, y2)fd. <- as.fd(f)x. <- seq(1, 7, .02)fx. <- f(x.)fdx. <- eval.fd(x., fd.)plot(range(x2), range(y2, fx., fdx.), type='n')points(x2, y2)lines(x., sin((x.-0.5)*pi), lty='dashed')lines(x., f(x.), col='blue')lines(x., eval.fd(x., fd.), col='red', lwd=3, lty='dashed')# splinefun and as.fd(splineful(...)) are close# but quite different from the actual function# apart from the actual 7 points fitted,# which are fitted exactly# ... and there is no information in the data# to support a better fit!
# Translate also a natural splinefn <- splinefun(x2, y2, method='natural')fn. <- as.fd(fn)lines(x., fn(x.), lty='dotted', col='blue')lines(x., eval.fd(x., fn.), col='green', lty='dotted', lwd=3)
## Not run:# Will NOT translate a periodic splinefp <- splinefun(x, y, method='periodic')as.fd(fp)#Error in as.fd.function(fp) :# x (fp) uses periodic B-splines, and as.fd is programmed# to translate only B-splines with coincident boundary knots.
## End(Not run)
#### as.fd.smooth.spline##cars.spl <- with(cars, smooth.spline(speed, dist))cars.fd <- as.fd(cars.spl)
plot(dist~speed, cars)lines(cars.spl)sp. <- with(cars, seq(min(speed), max(speed), len=101))

18 axisIntervals
d. <- eval.fd(sp., cars.fd)lines(sp., d., lty=2, col='red', lwd=3)
axisIntervals Mark Intervals on a Plot Axis
Description
Adds an axis (axisintervals) or two axes (axesIntervals) to the current plot with tick marks delimitinginterval described by labels
Usage
axisIntervals(side=1, atTick1=monthBegin.5, atTick2=monthEnd.5,atLabels=monthMid, labels=month.abb, cex.axis=0.9, ...)
axesIntervals(side=1:2, atTick1=monthBegin.5, atTick2=monthEnd.5,atLabels=monthMid, labels=month.abb, cex.axis=0.9, las=1, ...)
Arguments
side an integer specifying which side of the plot the axis is to be drawn on. The axisis placed as follows: 1=below, 2=left, 3=above and 4=right.
atTick1 the points at which tick-marks marking the starting points of the intervals areto be drawn. This defaults to ’monthBegin.5’ to mark monthly periods foran annual cycle. These are constructed by calling axis(side, at=atTick1, la-bels=FALSE, ...). For more detail on this, see ’axis’.
atTick2 the points at which tick-marks marking the ends of the intervals are to be drawn.This defaults to ’monthBegin.5’ to mark monthly periods for an annual cycle.These are constructed by calling axis(side, at=atTick2, labels=FALSE, ...). UseatTick2=NA to rely only on atTick1. For more detail on this, see ’axis’.
atLabels the points at which ’labels’ should be typed. These are constructed by callingaxis(side, at=atLabels, tick=FALSE, ...). For more detail on this, see ’axis’.
labels Labels to be typed at locations ’atLabels’. This is accomplished by callingaxis(side, at=atLabels, labels=labels, tick=FALSE, ...). For more detail on this,see ’axis’.
cex.axis Character expansion (magnification) used for axis annotations (’labels’ in thisfunction call) relative to the current setting of ’cex’. For more detail, see ’par’.
las line axis style; see par.
... additional arguments passed to axis.
Value
The value from the third (labels) call to ’axis’. This function is usually invoked for its side effect,which is to add an axis to an already existing plot.
axesIntervals calls axisIntervals(side[1], ...) then axis(side[2], ...).

basisfd.product 19
Side Effects
An axis is added to the current plot.
Author(s)
Spencer Graves
See Also
axis, par monthBegin.5 monthEnd.5 monthMid month.abb monthLetters
Examples
daybasis65 <- create.fourier.basis(c(0, 365), 65)
daytempfd <- with(CanadianWeather, data2fd(dailyAv[,,"Temperature.C"], day.5,daybasis65, argnames=list("Day", "Station", "Deg C")) )
with(CanadianWeather, plotfit.fd(dailyAv[,,"Temperature.C"], argvals=day.5,
daytempfd, index=1, titles=place, axes=FALSE) )# Label the horizontal axis with the month namesaxisIntervals(1)axis(2)# Depending on the physical size of the plot,# axis labels may not all print.# In that case, there are 2 options:# (1) reduce 'cex.lab'.# (2) Use different labels as illustrated by adding# such an axis to the top of this plot
with(CanadianWeather, plotfit.fd(dailyAv[,,"Temperature.C"], argvals=day.5,
daytempfd, index=1, titles=place, axes=FALSE) )# Label the horizontal axis with the month namesaxesIntervals()
axisIntervals(3, labels=monthLetters, cex.lab=1.2, line=-0.5)# 'line' argument here is passed to 'axis' via '...'
basisfd.product Product of two basisfd objects
Description
pointwise multiplication method for basisfd class

20 bifd
Usage
"*.basisfd"(basisobj1, basisobj2)
Arguments
basisobj1, basisobj2objects of class basisfd
Details
TIMES for (two basis objects sets up a basis suitable for expanding the pointwise product of twofunctional data objects with these respective bases. In the absence of a true product basis system inthis code, the rules followed are inevitably a compromise: (1) if both bases are B-splines, the norderis the sum of the two orders - 1, and the breaks are the union of the two knot sequences, each knotmultiplicity being the maximum of the multiplicities of the value in the two break sequences. Thatis, no knot in the product knot sequence will have a multiplicity greater than the multiplicities ofthis value in the two knot sequences. The rationale this rule is that order of differentiability of theproduct at eachy value will be controlled by whichever knot sequence has the greater multiplicity. Inthe case where one of the splines is order 1, or a step function, the problem is dealt with by replacingthe original knot values by multiple values at that location to give a discontinuous derivative. (2) ifboth bases are Fourier bases, AND the periods are the the same, the product is a Fourier basis withnumber of basis functions the sum of the two numbers of basis fns. (3) if only one of the bases isB-spline, the product basis is B-spline with the same knot sequence and order two higher. (4) in allother cases, the product is a B-spline basis with number of basis functions equal to the sum of thetwo numbers of bases and equally spaced knots.
See Also
basisfd
bifd Create a bivariate functional data object
Description
This function creates a bivariate functional data object, which consists of two bases for expandinga functional data object of two variables, s and t, and a set of coefficients defining this expansion.The bases are contained in "basisfd" objects.
Usage
bifd (coef=matrix(0,2,1), sbasisobj=create.bspline.basis(),tbasisobj=create.bspline.basis(), fdnames=defaultnames)

bifd 21
Arguments
coef a two-, three-, or four-dimensional array containing coefficient values for theexpansion of each set of bivariate function values=terms of a set of basis functionvaluesIf ’coef’ is two dimensional, this implies that there is only one variable and onlyone replication. In that case, the first and second dimensions correspond to thebasis functions for the first and second argument, respectively.If ’coef’ is three dimensional, this implies that there are multiple replicates ononly one variable. In that case, the first and second dimensions correspond tothe basis functions for the first and second argument, respectively, and the thirddimension corresponds to replications.If ’coef’ has four dimensions, the fourth dimension corresponds to variables.
sbasisobj a functional data basis object for the first argument s of the bivariate function.
tbasisobj a functional data basis object for the second argument t of the bivariate function.
fdnames A list of length 4 containing dimnames for ’coefs’ if it is a 4-dimensional array.If it is only 2- or 3-dimensional, the later components of fdnames are not appliedto ’coefs’. In any event, the components of fdnames describe the following:(1) The row of ’coefs’ corresponding to the bases in sbasisobj. Defaults tosbasisobj[["names"]] if non-null and of the proper length, or to existing dim-names(coefs)[[1]] if non-null and of the proper length, and to ’s1’, ’s2’, ..., oth-erwise.(2) The columns of ’coefs’ corresponding to the bases in tbasisobj. Defaultsto tbasisobj[["names"]] if non-null and of the proper length, or to existing dim-names(coefs)[[2]] if non-null and of the proper length, and to ’t1’, ’t2’, ..., oth-erwise.(3) The replicates. Defaults to dimnames(coefs)[[3]] if non-null and of theproper length, and to ’rep1’, ..., otherwise.(4) Variable names. Defaults to dimnames(coefs)[[4]] if non-null and of theproper length, and to ’var1’, ..., otherwise.
Value
A bivariate functional data object = a list of class ’bifd’ with the following components:
coefs the input ’coefs’ possible with dimnames from dfnames if provided or fromsbasisobjnamesandtbasisobsjnames
sbasisobj a functional data basis object for the first argument s of the bivariate function.
tbasisobj a functional data basis object for the second argument t of the bivariate function.
bifdnames a list of length 4 giving names for the dimensions of coefs, with one or twounused lists of names if length(dim(coefs)) is only two or one, respectively.
Author(s)
Spencer Graves

22 bsplinepen
See Also
basisfd data2fd objAndNames
Examples
Bspl2 <- create.bspline.basis(nbasis=2, norder=1)Bspl3 <- create.bspline.basis(nbasis=3, norder=2)
(bBspl2.3 <- bifd(array(1:6, dim=2:3), Bspl2, Bspl3))str(bBspl2.3)
bsplinepen B-Spline Penalty Matrix
Description
Computes the matrix defining the roughness penalty for functions expressed in terms of a B-splinebasis.
Usage
bsplinepen(basisobj, Lfdobj=2, rng=basisobj$rangeval)
Arguments
basisobj a B-spline basis object.
Lfdobj either a nonnegative integer or a linear differential operator object.
rng a vector of length 2 defining range over which the basis penalty is to be com-puted.
Details
A roughness penalty for a function x(t) is defined by integrating the square of either the derivativeof x(t) or, more generally, the result of applying a linear differential operator L to it. The mostcommon roughness penalty is the integral of the square of the second derivative, and this is thedefault. To apply this roughness penalty, the matrix of inner products of the basis functions (possiblyafter applying the linear differential operator to them) defining this function is necessary. Thisfunction just calls the roughness penalty evaluation function specific to the basis involved.
Value
a symmetric matrix of order equal to the number of basis functions defined by the B-spline basis ob-ject. Each element is the inner product of two B-spline basis functions after applying the derivativeor linear differential operator defined by Lfdobj.

bsplineS 23
Examples
#### bsplinepen with only one basis function##bspl1.1 <- create.bspline.basis(nbasis=1, norder=1)pen1.1 <- bsplinepen(bspl1.1, 0)
#### bspline pen for a cubic spline with knots at seq(0, 1, .1)##basisobj <- create.bspline.basis(c(0,1),13)# compute the 13 by 13 matrix of inner products of second derivativespenmat <- bsplinepen(basisobj)
bsplineS B-spline Basis Function Values
Description
Evaluates a set of B-spline basis functions, or a derivative of these functions, at a set of arguments.
Usage
bsplineS(x, breaks, norder=4, nderiv=0)
Arguments
x A vector of argument values at which the B-spline basis functions are to beevaluated.
breaks A strictly increasing set of break values defining the B-spline basis. The argu-ment values x should be within the interval spanned by the break values.
norder The order of the B-spline basis functions. The order less one is the degree ofthe piece-wise polynomials that make up any B-spline function. The default isorder 4, meaning piece-wise cubic.
nderiv A nonnegative integer specifying the order of derivative to be evaluated. Thederivative must not exceed the order. The default derivative is 0, meaning thatthe basis functions themselves are evaluated.
Value
a matrix of function values. The number of rows equals the number of arguments, and the numberof columns equals the number of basis functions.

24 CanadianWeather
Examples
# Minimal example: A B-spline of order 1 (i.e., a step function)# with 0 interior knots:bsplineS(seq(0, 1, .2), 0:1, 1, 0)
# set up break values at 0.0, 0.2,..., 0.8, 1.0.breaks <- seq(0,1,0.2)# set up a set of 11 argument valuesx <- seq(0,1,0.1)# the order willl be 4, and the number of basis functions# is equal to the number of interior break values (4 here)# plus the order, for a total here of 8.norder <- 4# compute the 11 by 8 matrix of basis function valuesbasismat <- bsplineS(x, breaks, norder)
CanadianWeather Canadian average annual weather cycle
Description
Daily temperature and precipitation at 35 different locations in Canada averaged over 1960 to 1994.
Usage
CanadianWeatherdaily
Format
’CanadianWeather’ and ’daily’ are lists containing essentially the same data. ’CanadianWeather’may be preferred for most purposes; ’daily’ is included primarily for compatability with scriptswritten before the other format became available and for compatability with the Matlab ’fda’ code.
CanadianWeather A list with the following components:
dailyAv a three dimensional array c(365, 35, 3) summarizing data collected at 35 different weatherstations in Canada on the following:[„1] = [„ ’Temperature.C’]: average daily temperature for each day of the year[„2] = [„ ’Precipitation.mm’]: average daily rainfall for each day of the year rounded to0.1 mm.[„3] = [„ ’log10precip’]: base 10 logarithm of Precipitation.mm after first replacing 27zeros by 0.05 mm (Ramsay and Silverman 2006, p. 248).
place Names of the 35 different weather stations in Canada whose data are summarized in ’dai-lyAv’. These names vary between 6 and 11 characters in length. By contrast, daily[["place"]]which are all 11 characters, with names having fewer characters being extended with trail-ing blanks.
province names of the Canadian province containing each place

CanadianWeather 25
coordinates a numeric matrix giving ’N.latitude’ and ’W.longitude’ for each place.region Which of 4 climate zones contain each place: Atlantic, Pacific, Continental, Arctic.
monthlyTemp A matrix of dimensions (12, 35) giving the average temperature in degrees celcius foreach month of the year.
monthlyPrecip A matrix of dimensions (12, 35) giving the average daily precipitation in milimeters foreach month of the year.
geogindex Order the weather stations from East to West to North
daily A list with the following components:
place Names of the 35 different weather stations in Canada whose data are summarized in’dailyAv’. These names are all 11 characters, with shorter names being extended withtrailing blanks. This is different from CanadianWeather[["place"]], where trailing blankshave been dropped.
tempav a matrix of dimensions (365, 35) giving the average temperature in degrees celcius foreach day of the year. This is essentially the same as CanadianWeather[["dailyAv"]][„"Temperature.C"].
precipav a matrix of dimensions (365, 35) giving the average temperature in degrees celcius foreach day of the year. This is essentially the same as CanadianWeather[["dailyAv"]][„"Precipitation.mm"].
Source
Ramsay, James O., and Silverman, Bernard W. (2006), Functional Data Analysis, 2nd ed., Springer,New York.
Ramsay, James O., and Silverman, Bernard W. (2002), Applied Functional Data Analysis, Springer,New York
See Also
monthAccessories MontrealTemp
Examples
#### 1. Plot (latitude & longitude) of stations by region##with(CanadianWeather, plot(-coordinates[, 2], coordinates[, 1], type='n',
xlab="West Longitude", ylab="North Latitude",axes=FALSE) )
Wlon <- pretty(CanadianWeather$coordinates[, 2])axis(1, -Wlon, Wlon)axis(2)
rgns <- 1:4names(rgns) <- c('Arctic', 'Atlantic', 'Continental', 'Pacific')Rgns <- rgns[CanadianWeather$region]with(CanadianWeather, points(-coordinates[, 2], coordinates[, 1],
col=Rgns, pch=Rgns) )legend('topright', legend=names(rgns), col=rgns, pch=rgns)

26 cca.fd
#### 2. Plot dailyAv[, 'Temperature.C'] for 4 stations##data(CanadianWeather)# Expand the left margin to allow space for place namesop <- par(mar=c(5, 4, 4, 5)+.1)# Plotstations <- c("Pr. Rupert", "Montreal", "Edmonton", "Resolute")matplot(day.5, CanadianWeather$dailyAv[, stations, "Temperature.C"],
type="l", axes=FALSE, xlab="", ylab="Mean Temperature (deg C)")axis(2, las=1)# Label the horizontal axis with the month namesaxis(1, monthBegin.5, labels=FALSE)axis(1, monthEnd.5, labels=FALSE)axis(1, monthMid, monthLetters, tick=FALSE)# Add the monthly averagesmatpoints(monthMid, CanadianWeather$monthlyTemp[, stations])# Add the names of the weather stationsmtext(stations, side=4,
at=CanadianWeather$dailyAv[365, stations, "Temperature.C"],las=1)
# clean uppar(op)
cca.fd Functional Canonical Correlation Analysis
Description
Carry out a functional canonical correlation analysis with regularization or roughness penalties onthe estimated canonical variables.
Usage
cca.fd(fdobj1, fdobj2=fdobj1, ncan = 2,ccafdParobj1=fdPar(basisobj1, 2, 1e-10),ccafdParobj2=ccafdParobj1, centerfns=TRUE)
Arguments
fdobj1 a functional data object.
fdobj2 a functional data object. By default this is fdobj1 , in which case the firstargument must be a bivariate funnctional data object.
ncan the number of canonical variables and weight functions to be computed. Thedefault is 2.
ccafdParobj1 a functional parameter object defining the first set of canonical weight functions.The object may contain specifications for a roughness penalty. The default isdefined using the same basis as that used for fdobj1 with a slight penaltyon its second derivative.

cca.fd 27
ccafdParobj2 a functional parameter object defining the second set of canonical weight func-tions. The object may contain specifications for a roughness penalty. The defaultis ccafdParobj1 .
centerfns if TRUE, the functions are centered prior to analysis. This is the default.
Value
an object of class cca.fd with the 5 slots:
ccwtfd1 a functional data object for the first canonical variate weight function
ccwtfd2 a functional data object for the second canonical variate weight function
cancorr a vector of canonical correlations
ccavar1 a matrix of scores on the first canonical variable.
ccavar2 a matrix of scores on the second canonical variable.
See Also
plot.cca.fd, varmx.cca.fd, pca.fd
Examples
# Canonical correlation analysis of knee-hip curves
gaittime <- (1:20)/21gaitrange <- c(0,1)gaitbasis <- create.fourier.basis(gaitrange,21)lambda <- 10^(-11.5)harmaccelLfd <- vec2Lfd(c(0, 0, (2*pi)^2, 0))
gaitfdPar <- fdPar(gaitbasis, harmaccelLfd, lambda)gaitfd <- smooth.basis(gaittime, gait, gaitfdPar)$fd
ccafdPar <- fdPar(gaitfd, harmaccelLfd, 1e-8)ccafd0 <- cca.fd(gaitfd[,1], gaitfd[,2], ncan=3, ccafdPar, ccafdPar)# compute a VARIMAX rotation of the canonical variablesccafd <- varmx.cca.fd(ccafd0)# plot the canonical weight functionsop <- par(mfrow=c(2,1))#plot.cca.fd(ccafd, cex=1.2, ask=TRUE)#plot.cca.fd(ccafd, cex=1.2)# display the canonical correlations#round(ccafd$ccacorr[1:6],3)par(op)

28 center.fd
center.fd Center Functional Data
Description
Subtract the pointwise mean from each of the functions in a functional data object; that is, to centerthem on the mean function.
Usage
center.fd(fdobj)
Arguments
fdobj a functional data object to be centered.
Value
a functional data object whose mean is zero.
See Also
mean.fd, sum.fd, stddev.fd, std.fd
Examples
daytime <- (1:365)-0.5daybasis <- create.fourier.basis(c(0,365), 365)harmLcoef <- c(0,(2*pi/365)^2,0)harmLfd <- vec2Lfd(harmLcoef, c(0,365))templambda <- 0.01tempfdPar <- fdPar(daybasis, harmLfd, templambda)tempfd <- smooth.basis(daytime,
CanadianWeather$dailyAv[,,"Temperature.C"], tempfdPar)$fdtempctrfd <- center.fd(tempfd)
plot(tempctrfd, xlab="Day", ylab="deg. C",main = "Centered temperature curves")

checkDims3 29
checkDims3 Compare dimensions and dimnames of arrays
Description
Compare selected dimensions and dimnames of arrays, coercing objects to 3-dimensional arraysand either give an error or force matching.
Usage
checkDim3(x, y=NULL, xdim=1, ydim=1, defaultNames='x',subset=c('xiny', 'yinx', 'neither'),xName=substring(deparse(substitute(x)), 1, 33),yName=substring(deparse(substitute(y)), 1, 33) )
checkDims3(x, y=NULL, xdim=2:3, ydim=2:3, defaultNames='x',subset=c('xiny', 'yinx', 'neither'),xName=substring(deparse(substitute(x)), 1, 33),yName=substring(deparse(substitute(y)), 1, 33) )
Arguments
x, y arrays to be compared. If y is missing, x is used.Currently, both x and y can have at most 3 dimensions. If either has more, anerror will be thrown. If either has fewer, it will be expanded to 3 dimensionsusing as.array3.
xdim, ydim For checkDim3, these are positive integers indicating which dimension of xwill be compared with which dimension of y.For checkDims3, these are positive integer vectors of the same length, passedone at a time to checkDim3. The default here is to force matching dimensionsfor plotfit.fd.
defaultNames Either NULL, FALSE or a character string or vector or list. If NULL, no check-ing is done of dimnames. If FALSE, an error is thrown unless the correspondingdimensions of x and y match exactly.If it is a character string, vector, or list, it is used as the default names if neitherx nor y have dimenames for the compared dimensions. If it is a character vectorthat is too short, it is extended to the required length using paste(defaultNames,1:ni), where ni = the required length.If it is a list, it should have length (length(xdim)+1). Each component must beeither a character vector or NULL. If neither x nor y have dimenames for thefirst compared dimensions, defaultNames[[1]] will be used instead unless it isNULL, in which case the last component of defaultNames will be used. If it isnull, an error is thrown.
subset If ’xiny’, and any(dim(y)[ydim] < dim(x)[xdim]), an error is thrown. Else ifany(dim(y)[ydim] > dim(x)[xdim]) the larger is reduced to match the smaller. If’yinx’, this procedure is reversed.If ’neither’, any dimension mismatch generates an error.

30 checkDims3
xName, yName names of the arguments x and y, used only to in error messages.
Details
For checkDims3, confirm that xdim and ydim have the same length, and call checkDim3 foreach pair.
For checkDim3, proceed as follows:
1. if((xdim>3) | (ydim>3)) throw an error.
2. ixperm <- list(1:3, c(2, 1, 3), c(3, 2, 1))[xdim]; iyperm <- list(1:3, c(2, 1, 3), c(3, 2, 1))[ydim];
3. x3 <- aperm(as.array3(x), ixperm); y3 <- aperm(as.array3(y), iyperm)
4. xNames <- dimnames(x3); yNames <- dimnames(y3)
5. Check subset. For example, for subset=’xiny’, use the following: if(is.null(xNames)){if(dim(x3)[1]>dim(y3)[1]) stop else y. <- y3[1:dim(x3)[1],,] dimnames(x)<- list(yNames[[1]], NULL, NULL) } else { if(is.null(xNames[[1]])){if(dim(x3)[1]>dim(y3)[1]) stop else y. <- y3[1:dim(x3)[1],,] dimnames(x3)[[1]]<- yNames[[1]] } else { if(any(!is.element(xNames[[1]], yNames[[1]])))stopelse y. <- y3[xNames[[1]],,] } }
6. return(list(x=aperm(x3, ixperm), y=aperm(y., iyperm)))
Value
a list with components x and y.
Author(s)
Spencer Graves
See Also
as.array3 plotfit.fd
Examples
# Select the first two rows of ystopifnot(all.equal(checkDim3(1:2, 3:5),list(x=array(1:2, c(2,1,1), list(c('x1','x2'), NULL, NULL)),
y=array(3:4, c(2,1,1), list(c('x1','x2'), NULL, NULL)) )))
# Select the first two rows of a matrix ystopifnot(all.equal(checkDim3(1:2, matrix(3:8, 3)),list(x=array(1:2, c(2,1,1), list(c('x1','x2'), NULL, NULL)),
y=array(c(3:4, 6:7), c(2,2,1), list(c('x1','x2'), NULL, NULL)) )))
# Select the first column of ystopifnot(all.equal(

checkDims3 31
checkDim3(1:2, matrix(3:8, 3), 2, 2),list(x=array(1:2, c(2,1,1), list(NULL, 'x', NULL)),
y=array(3:5, c(3,1,1), list(NULL, 'x', NULL)) )))
# Select the first two rows and the first column of ystopifnot(all.equal(checkDims3(1:2, matrix(3:8, 3), 1:2, 1:2),list(x=array(1:2, c(2,1,1), list(c('x1','x2'), 'x', NULL)),
y=array(3:4, c(2,1,1), list(c('x1','x2'), 'x', NULL)) )))
# Select the first 2 rows of yx1 <- matrix(1:4, 2, dimnames=list(NULL, LETTERS[2:3]))x1a <- x1. <- as.array3(x1)dimnames(x1a)[[1]] <- c('x1', 'x2')y1 <- matrix(11:19, 3, dimnames=list(NULL, LETTERS[1:3]))y1a <- y1. <- as.array3(y1)dimnames(y1a)[[1]] <- c('x1', 'x2', 'x3')
stopifnot(all.equal(checkDim3(x1, y1),list(x=x1a, y=y1a[1:2, , , drop=FALSE])))
# Select columns 2 & 3 of ystopifnot(all.equal(checkDim3(x1, y1, 2, 2),list(x=x1., y=y1.[, 2:3, , drop=FALSE ])))
# Select the first 2 rows and columns 2 & 3 of ystopifnot(all.equal(checkDims3(x1, y1, 1:2, 1:2),list(x=x1a, y=y1a[1:2, 2:3, , drop=FALSE ])))
# y = columns 2 and 3 of xx23 <- matrix(1:6, 2, dimnames=list(letters[2:3], letters[1:3]))x23. <- as.array3(x23)stopifnot(all.equal(checkDim3(x23, xdim=1, ydim=2),list(x=x23., y=x23.[, 2:3,, drop=FALSE ])))
# Transfer dimnames from y to xx4a <- x4 <- matrix(1:4, 2)y4 <- matrix(5:8, 2, dimnames=list(letters[1:2], letters[3:4]))dimnames(x4a) <- dimnames(t(y4))stopifnot(all.equal(checkDims3(x4, y4, 1:2, 2:1),list(x=as.array3(x4a), y=as.array3(y4))))
32 checkLogicalInteger
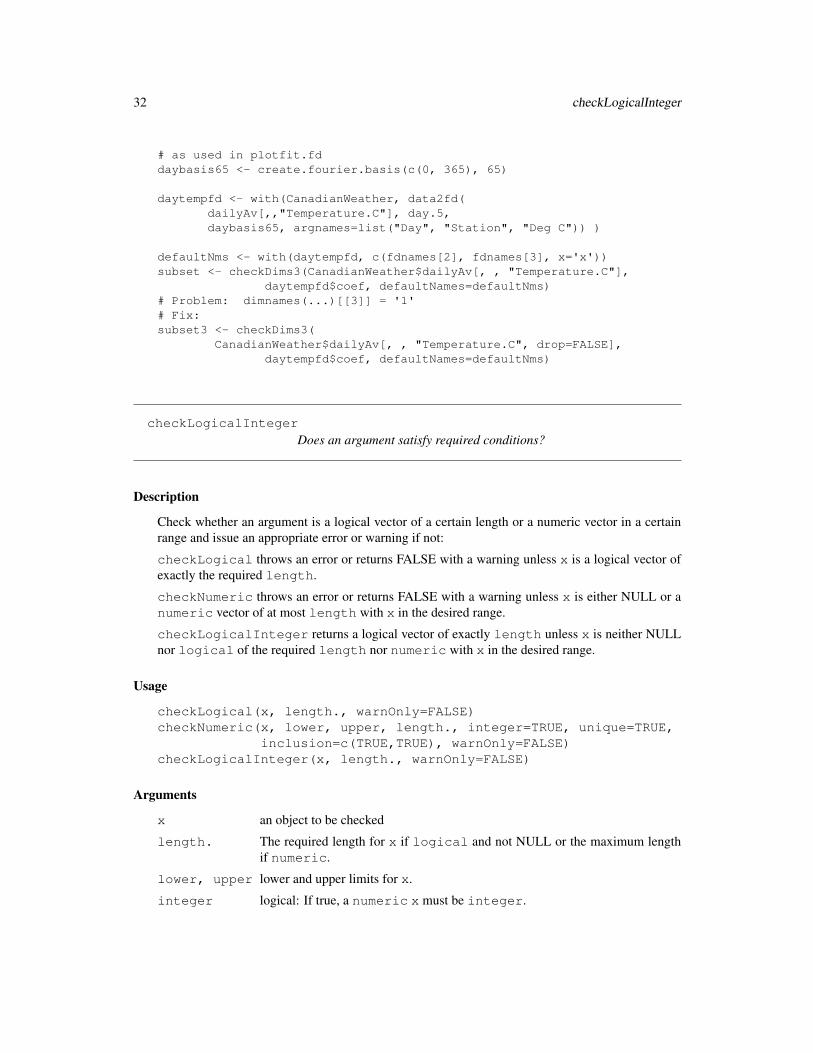
# as used in plotfit.fddaybasis65 <- create.fourier.basis(c(0, 365), 65)
daytempfd <- with(CanadianWeather, data2fd(dailyAv[,,"Temperature.C"], day.5,daybasis65, argnames=list("Day", "Station", "Deg C")) )
defaultNms <- with(daytempfd, c(fdnames[2], fdnames[3], x='x'))subset <- checkDims3(CanadianWeather$dailyAv[, , "Temperature.C"],
daytempfd$coef, defaultNames=defaultNms)# Problem: dimnames(...)[[3]] = '1'# Fix:subset3 <- checkDims3(
CanadianWeather$dailyAv[, , "Temperature.C", drop=FALSE],daytempfd$coef, defaultNames=defaultNms)
checkLogicalIntegerDoes an argument satisfy required conditions?
Description
Check whether an argument is a logical vector of a certain length or a numeric vector in a certainrange and issue an appropriate error or warning if not:
checkLogical throws an error or returns FALSE with a warning unless x is a logical vector ofexactly the required length.
checkNumeric throws an error or returns FALSE with a warning unless x is either NULL or anumeric vector of at most length with x in the desired range.
checkLogicalInteger returns a logical vector of exactly length unless x is neither NULLnor logical of the required length nor numeric with x in the desired range.
Usage
checkLogical(x, length., warnOnly=FALSE)checkNumeric(x, lower, upper, length., integer=TRUE, unique=TRUE,
inclusion=c(TRUE,TRUE), warnOnly=FALSE)checkLogicalInteger(x, length., warnOnly=FALSE)
Arguments
x an object to be checked
length. The required length for x if logical and not NULL or the maximum lengthif numeric.
lower, upper lower and upper limits for x.
integer logical: If true, a numeric x must be integer.

checkLogicalInteger 33
unique logical: TRUE if duplicates are NOT allowed in x.
inclusion logical vector of length 2, similar to link[ifultools]{checkRange}:if(inclusion[1]) (lower <= x) else (lower < x)if(inclusion[2]) (x <= upper) else (x < upper)
warnOnly logical: If TRUE, violations are reported as warnings, not as errors.
Details
1. xName <- deparse(substitute(x)) to use in any required error or warning.
2. if(is.null(x)) handle appropriately: Return FALSE for checkLogical, TRUE for checkNumericand rep(TRUE, length.) for checkLogicalInteger.
3. Check class(x).
4. Check other conditions.
Value
checkLogical returns a logical vector of the required length., unless it issues an error mes-sage.
checkNumeric returns a numeric vector of at most length. with all elements between lowerand upper, and optionally unique, unless it issues an error message.
checkLogicalInteger returns a logical vector of the required length., unless it issues anerror message.
Author(s)
Spencer Graves
See Also
checkVectorType, checkRange checkScalarType isVectorAtomic
Examples
#### checkLogical##checkLogical(NULL, length=3, warnOnly=TRUE)checkLogical(c(FALSE, TRUE, TRUE), length=4, warnOnly=TRUE)checkLogical(c(FALSE, TRUE, TRUE), length=3)
#### checkNumeric##checkNumeric(NULL, lower=1, upper=3)checkNumeric(1:3, 1, 3)checkNumeric(1:3, 1, 3, inclusion=FALSE, warnOnly=TRUE)checkNumeric(pi, 1, 4, integer=TRUE, warnOnly=TRUE)checkNumeric(c(1, 1), 1, 4, warnOnly=TRUE)

34 coef.fd
checkNumeric(c(1, 1), 1, 4, unique=FALSE, warnOnly=TRUE)
#### checkLogicalInteger##checkLogicalInteger(NULL, 3)checkLogicalInteger(c(FALSE, TRUE), warnOnly=TRUE)checkLogicalInteger(1:2, 3)checkLogicalInteger(2, warnOnly=TRUE)checkLogicalInteger(c(2, 4), 3, warnOnly=TRUE)
#### checkLogicalInteger names its calling function## rather than itself as the location of error detection## if possible##tstFun <- function(x, length., warnOnly=FALSE){
checkLogicalInteger(x, length., warnOnly)}tstFun(NULL, 3)tstFun(4, 3, warnOnly=TRUE)
tstFun2 <- function(x, length., warnOnly=FALSE){tstFun(x, length., warnOnly)
}tstFun2(4, 3, warnOnly=TRUE)
coef.fd Extract functional coefficients
Description
Obtain the coefficients component from a functional object (functional data, class fd, functionalparameter, class fdPar, a functional smooth, class fdSmooth, or a Taylor spline representation,class Taylor.
Usage
## S3 method for class 'fd':coef(object, ...)## S3 method for class 'fdPar':coef(object, ...)## S3 method for class 'fdSmooth':coef(object, ...)## S3 method for class 'Taylor':coef(object, ...)## S3 method for class 'fd':coefficients(object, ...)

coef.fd 35
## S3 method for class 'fdPar':coefficients(object, ...)## S3 method for class 'fdSmooth':coefficients(object, ...)## S3 method for class 'Taylor':coefficients(object, ...)
Arguments
object An object whose functional coefficients are desired
... other arguments
Details
Functional representations are evaluated by multiplying a basis function matrix times a coefficientvector, matrix or 3-dimensional array. (The basis function matrix contains the basis functions ascolumns evaluated at the evalarg values as rows.)
Value
A numeric vector or array of the coefficients.
See Also
coef fd fdPar smooth.basisPar smooth.basis
Examples
#### coef.fd##bspl1.1 <- create.bspline.basis(norder=1, breaks=0:1)fd.bspl1.1 <- fd(0, basisobj=bspl1.1)coef(fd.bspl1.1)
#### coef.fdPar##rangeval <- c(-3,3)# set up some standard normal datax <- rnorm(50)# make sure values within the rangex[x < -3] <- -2.99x[x > 3] <- 2.99# set up basis for W(x)basisobj <- create.bspline.basis(rangeval, 11)# set up initial value for WfdobjWfd0 <- fd(matrix(0,11,1), basisobj)WfdParobj <- fdPar(Wfd0)

36 cor.fd
coef(WfdParobj)
#### coef.fdSmooth##
girlGrowthSm <- with(growth, smooth.basisPar(argvals=age, y=hgtf))coef(girlGrowthSm)
#### coef.Taylor### coming soon.
cor.fd Correlation matrix from functional data object(s)
Description
Compute a correlation matrix for one or two functional data objects.
Usage
cor.fd(evalarg1, fdobj1, evalarg2=evalarg1, fdobj2=fdobj1)
Arguments
evalarg1 a vector of argument values for fdobj1.
evalarg2 a vector of argument values for fdobj2.fdobj1, fdobj2
functional data objects
Details
1. var1 <- var.fd(fdobj1)
2. evalVar1 <- eval.bifd(evalarg1, evalarg1, var1)
3. if(missing(fdobj2)) Convert evalVar1 to correlations
4. else:
4.1. var2 <- var.fd(fdobj2)
4.2. evalVar2 <- eval.bifd(evalarg2, evalarg2, var2)
4.3. var12 <- var.df(fdobj1, fdobj2)
4.4. evalVar12 <- eval.bifd(evalarg1, evalarg2, var12)
4.5. Convert evalVar12 to correlations

cor.fd 37
Value
A matrix or array:
With one or two functional data objects, fdobj1 and possibly fdobj2, the value is a matrix of di-mensions length(evalarg1) by length(evalarg2) giving the correlations at those points of fdobj1 ifmissing(fdojb2) or of correlations between eval.fd(evalarg1, fdobj1) and eval.fd(evalarg2, fdobj2).
With a single multivariate data object with k variables, the value is a 4-dimensional array of dim =c(nPts, nPts, 1, choose(k+1, 2)), where nPts = length(evalarg1).
See Also
mean.fd, sd.fd, std.fd stdev.fd var.fd
Examples
daybasis3 <- create.fourier.basis(c(0, 365))daybasis5 <- create.fourier.basis(c(0, 365), 5)tempfd3 <- with(CanadianWeather, data2fd(
dailyAv[,,"Temperature.C"], day.5,daybasis3, argnames=list("Day", "Station", "Deg C")) )
precfd5 <- with(CanadianWeather, data2fd(dailyAv[,,"log10precip"], day.5,daybasis5, argnames=list("Day", "Station", "Deg C")) )
# Correlation matrix for a single functional data object(tempCor3 <- cor.fd(seq(0, 356, length=4), tempfd3))
# Cross correlation matrix between two functional data objects# Compare with structure described above under 'value':(tempPrecCor3.5 <- cor.fd(seq(0, 365, length=4), tempfd3,
seq(0, 356, length=6), precfd5))
# The following produces contour and perspective plots
daybasis65 <- create.fourier.basis(rangeval=c(0, 365), nbasis=65)daytempfd <- with(CanadianWeather, data2fd(
dailyAv[,,"Temperature.C"], day.5,daybasis65, argnames=list("Day", "Station", "Deg C")) )
dayprecfd <- with(CanadianWeather, data2fd(dailyAv[,,"log10precip"], day.5,daybasis65, argnames=list("Day", "Station", "log10(mm)")) )
str(tempPrecCor <- cor.fd(weeks, daytempfd, weeks, dayprecfd))# dim(tempPrecCor)= c(53, 53)
op <- par(mfrow=c(1,2), pty="s")contour(weeks, weeks, tempPrecCor,
xlab="Average Daily Temperature",ylab="Average Daily log10(precipitation)",main=paste("Correlation function across locations\n","for Canadian Anual Temperature Cycle"),
cex.main=0.8, axes=FALSE)

38 create.basis
axisIntervals(1, atTick1=seq(0, 365, length=5), atTick2=NA,atLabels=seq(1/8, 1, 1/4)*365,labels=paste("Q", 1:4) )
axisIntervals(2, atTick1=seq(0, 365, length=5), atTick2=NA,atLabels=seq(1/8, 1, 1/4)*365,labels=paste("Q", 1:4) )
persp(weeks, weeks, tempPrecCor,xlab="Days", ylab="Days", zlab="Correlation")
mtext("Temperature-Precipitation Correlations", line=-4, outer=TRUE)par(op)
# Correlations and cross correlations# in a bivariate functional data objectgaitbasis5 <- create.fourier.basis(nbasis=5)gaitfd5 <- data2fd(gait, basisobj=gaitbasis5)
gait.t3 <- (0:2)/2(gaitCor3.5 <- cor.fd(gait.t3, gaitfd5))# Check the answers with manual computationsgait3.5 <- eval.fd(gait.t3, gaitfd5)all.equal(cor(t(gait3.5[,,1])), gaitCor3.5[,,,1])# TRUEall.equal(cor(t(gait3.5[,,2])), gaitCor3.5[,,,3])# TRUEall.equal(cor(t(gait3.5[,,2]), t(gait3.5[,,1])),
gaitCor3.5[,,,2])# TRUE
# NOTE:dimnames(gaitCor3.5)[[4]]# [1] Hip-Hip# [2] Knee-Hip# [3] Knee-Knee# If [2] were "Hip-Knee", then# gaitCor3.5[,,,2] would match# cor(t(gait3.5[,,1]), t(gait3.5[,,2]))# *** It does NOT. Instead, it matches:# cor(t(gait3.5[,,2]), t(gait3.5[,,1]))
create.basis Create Basis Set for Functional Data Analysis
Description
Functional data analysis proceeds by selecting a finite basis set and fitting data to it. The currentfda package supports fitting via least squares penalized with lambda times the integral over the(finite) support of the basis set of the squared deviations from a linear differential operator.

create.basis 39
Details
The most commonly used basis in fda is probably B-splines. For periodic phenomena, Fourierbases are quite useful. A constant basis is provided to facilitation arithmetic with functional dataobjects. To restrict attention to solutions of certain differential equations, it may be useful to use acorresponding basis set such as exponential, monomial, polynomial, or power basis sets.
Monomial and polynomial bases are similar. As noted in the table below, create.monomial.basishas an argument exponents absent from create.polynomial.basis, which has an argu-ment ctr absent from create.monomial.basis.
Power bases support the use of negative and fractional powers, while monomial bases are restrictedonly to nonnegative integer exponents.
The polygonal basis is essentialy a B-spline of order 2, degree 1.
The following summarizes arguments used by some or all of the current create.basis func-tions:
rangeval a vector of length 2 giving the lower and upper limits of the range of permissible values forthe function argument.For bspline bases, this can be inferred from range(breaks). For polygonal bases, thiscan be inferred from range(argvals). In all other cases, this defaults to 0:1.
nbasis an integer giving the number of basis functions.This is not used for two of the create.basis functions: For constant this is 1, so thereis no need to specify it. For polygonal bases, it is length(argvals), and again there is noneed to specify it.For bspline bases, if nbasis is not specified, it defaults to (length(breaks) + norder - 2) ifbreaks is provided. Otherwise, nbasis defaults to 20 for bspline bases.For exponential bases, if nbasis is not specified, it defaults to length(ratevec) if ratevecis provided. Otherwise, in fda_2.0.2, ratevec defaults to 1, which makes nbasis = 1;in fda_2.0.4, ratevec will default to 0:1, so nbasis will then default to 2.For monomial and power bases, if nbasis is not specified, it defaults to length(exponents)if exponents is provided. Otherwise, nbasis defaults to 2 for monomial and powerbases. (Temporary exception: In fda_2.0.2, the default nbasis for power bases is 1.This will be increased to 2 in fda_2.0.4.)For polynomial bases, nbasis defaults to 2.In addition to rangeval and nbasis, all but constant bases have one or two parametersunique to that basis type or shared with one other:
bspline Argument norder = the order of the spline, which is one more than the degree of thepolynomials used. This defaults to 4, which gives cubic splines.Argument breaks = the locations of the break or join points; also called knots. Thisdefaults to seq(rangeval[1], rangeval[2], nbasis-norder+2).
polygonal Argument argvals = the locations of the break or join points; also called knots. Thisdefaults to seq(rangeval[1], rangeval[2], nbasis).
fourier Argument period defaults to diff(rangeval).exponential Argument ratevec. In fda_2.0.2, this defaulted to 1. In fda_2.0.3, it will de-
fault to 0:1.

40 create.basis
monomial, power Argument exponents. Default = 0:(nbasis-1). For monomial bases, exponentsmust be distinct nonnegative integers. For power bases, they must be distinct real num-bers.
polynomial Argument ctr must be a single number used to shift the argument prior to computing itspowers. Default = mean(rangeval).
Beginning with fda_2.1.0, the last 6 arguments for all the create.basis functions willbe as follows; some but not all are available in the previous versions of fda:
dropind a vector of integers specifiying the basis functions to be dropped, if any.quadvals a matrix with two columns and a number of rows equal to the number of quadrature points
for numerical evaluation of the penalty integral. The first column of quadvals containsthe quadrature points, and the second column the quadrature weights. A minimum of 5values are required for each inter-knot interval, and that is often enough. For Simpson’srule, these points are equally spaced, and the weights are proportional to 1, 4, 2, 4, ..., 2,4, 1.
values a list of matrices with one row for each row of quadvals and one column for each basisfunction. The elements of the list correspond to the basis functions and their derivativesevaluated at the quadrature points contained in the first column of quadvals.
basisvalues A list of lists, allocated by code such as vector("list",1). This field is designed to avoidevaluation of a basis system repeatedly at a set of argument values. Each list within thevector corresponds to a specific set of argument values, and must have at least two com-ponents, which may be tagged as you wish. ‘The first component in an element of the listvector contains the argument values. The second component in an element of the list vec-tor contains a matrix of values of the basis functions evaluated at the arguments in the firstcomponent. The third and subsequent components, if present, contain matrices of valuestheir derivatives up to a maximum derivative order. Whenever function getbasismatrix iscalled, it checks the first list in each row to see, first, if the number of argument values cor-responds to the size of the first dimension, and if this test succeeds, checks that all of theargument values match. This takes time, of course, but is much faster than re-evaluationof the basis system. Even this time can be avoided by direct retrieval of the desired array.For example, you might set up a vector of argument values called "evalargs" along witha matrix of basis function values for these argument values called "basismat". You mightwant too use tags like "args" and "values", respectively for these. You would then assignthem to basisvalues with code such as the following:basisobj$basisvalues <- vector("list",1)basisobj$basisvalues[[1]] <- list(args=evalargs, values=basismat)
names either a character vector of the same length as the number of basis functions or a simplestem used to construct such a vector.For bspline bases, this defaults to paste(’bspl’, norder, ’.’, 1:nbreaks, sep=”).For other bases, there are crudely similar defaults.
axes an optional list used by selected plot functions to create custom axes. If this axes ar-gument is not NULL, functions plot.basisfd, plot.fd, plot.fdSmooth plotfit.fd,plotfit.fdSmooth, and plot.Lfdwill create axes via do.call(x$axes[[1]],x$axes[-1]). The primary example of this is to create CanadianWeather plotsusing list("axesIntervals")
Author(s)
J. O. Ramsay and Spencer Graves

create.bspline.basis 41
References
Ramsay, James O., and Silverman, Bernard W. (2006), Functional Data Analysis, 2nd ed., Springer,New York.
Ramsay, James O., and Silverman, Bernard W. (2002), Applied Functional Data Analysis, Springer,New York.
See Also
create.bspline.basis create.constant.basis create.exponential.basiscreate.fourier.basis create.monomial.basis create.polygonal.basis create.polynomial.basiscreate.power.basis
create.bspline.basisCreate a B-spline Basis
Description
Functional data objects are constructed by specifying a set of basis functions and a set of coefficientsdefining a linear combination of these basis functions. The B-spline basis is used for non-periodicfunctions. B-spline basis functions are polynomial segments jointed end-to-end at at argumentvalues called knots, breaks or join points. The segments have specifiable smoothness across thesebreaks. B-splne basis functions have the advantages of very fast computation and great flexibility.A polygonal basis generated by create.polygonal.basis is essentially a B-spline basis oforder 2, degree 1. Monomial and polynomial bases can be obtained as linear transformations ofcertain B-spline bases.
Usage
create.bspline.basis(rangeval=NULL, nbasis=NULL, norder=4,breaks=NULL, dropind=NULL, quadvals=NULL, values=NULL,basisvalues=NULL, names="bspl", axes=NULL)
Arguments
rangeval a numeric vector of length 2 defining the interval over which the functionaldata object can be evaluated; default value is if(is.null(breaks)) 0:1else range(breaks).If length(rangeval) == 1 and rangeval <= 0, this is an error. Oth-erwise, if length(rangeval) == 1, rangeval is replaced by c(0,rangeval).If length(rangeval)>2 and neither breaks nor nbasis are provided, this extralong rangeval argument is assigned to breaks, and then rangeval =range(breaks).
nbasis an integer variable specifying the number of basis functions. Default valueNULL.This ’nbasis’ argument is ignored if ’breaks’ is supplied, in which case nbasis =nbreaks + norder - 2, where nbreaks = length(breaks).

42 create.bspline.basis
norder an integer specifying the order of b-splines, which is one higher than their de-gree. The default of 4 gives cubic splines.
breaks a vector specifying the break points defining the b-spline. Also called knots,these are a strictly increasing sequence of junction points between piecewisepolynomial segments. They must satisfy breaks[1] = rangeval[1] andbreaks[nbreaks] = rangeval[2], where nbreaks is the length ofbreaks. There must be at least 2 values in breaks.
dropind a vector of integers specifiying the basis functions to be dropped, if any. Forexample, if it is required that a function be zero at the left boundary, this isachieved by dropping the first basis function, the only one that is nonzero at thatpoint.
quadvals a matrix with two columns and a number of rows equal to the number of quadra-ture points for numerical evaluation of the penalty integral. The first column ofquadvals contains the quadrature points, and the second column the quadra-ture weights. A minimum of 5 values are required for each inter-knot interval,and that is often enough. For Simpson’s rule, these points are equally spaced,and the weights are proportional to 1, 4, 2, 4, ..., 2, 4, 1.
values a list containing the basis functions and their derivatives evaluated at the quadra-ture points contained in the first column of quadvals .
basisvalues a vector of lists, allocated by code such as vector("list",1). This ar-gument is designed to avoid evaluation of a basis system repeatedly at a set ofargument values. Each list within the vector corresponds to a specific set of ar-gument values, and must have at least two components, which may be tagged asyou wish. The first component in an element of the list vector contains the ar-gument values. The second component in an element of the list vector containsa matrix of values of the basis functions evaluated at the arguments in the firstcomponent. The third and subsequent components, if present, contain matricesof values their derivatives up to a maximum derivative order. Whenever functiongetbasismatrix() is called, it checksthe first list in each row to see, first,if the number of argument values corresponds to the size of the first dimension,and if this test succeeds, checks that all of the argument values match. This takestime, of course, but is much faster than re-evaluation of the basis system.
names either a character vector of the same length as the number of basis functions or asingle character string to which norder, "." and 1:nbasis are appendedas paste(names, norder, ".", 1:nbasis, sep=""). For exam-ple, if norder = 4, this defaults to ’bspl4.1’, ’bspl4.2’, ... .
axes an optional list used by selected plot functions to create custom axes. If thisaxes argument is not NULL, functions plot.basisfd, plot.fd, plot.fdSmoothplotfit.fd, plotfit.fdSmooth, and plot.Lfd will create axes viado.call(x$axes[[1]], x$axes[-1]). The primary example of thisuses list("axesIntervals", ...), e.g., with Fourier bases to cre-ate CanadianWeather plots
Details
Spline functions are constructed by joining polynomials end-to-end at argument values called breakpoints or knots. First, the interval is subdivided into a set of adjoining intervals separated the knots.

create.bspline.basis 43
Then a polynomial of order m and degree m − 1 is defined for each interval. In order to make theresulting piece-wise polynomial smooth, two adjoining polynomials are constrained to have theirvalues and all their derivatives up to order m− 2 match at the point where they join.
Consider as an illustration the very common case where the order is 4 for all polynomials, so thatdegree of each polynomials is 3. That is, the polynomials are cubic. Then at each break pointor knot, the values of adjacent polynomials must match, and so also for their first and secondderivatives. Only their third derivatives will differ at the point of junction.
The number of degrees of freedom of a cubic spline function of this nature is calculated as follows.First, for the first interval, there are four degrees of freedom. Then, for each additional interval, thepolynomial over that interval now has only one degree of freedom because of the requirement formatching values and derivatives. This means that the number of degrees of freedom is the numberof interior knots (that is, not counting the lower and upper limits) plus the order of the polynomials:
nbasis = norder + length(breaks) - 2
The consistency of the values of nbasis, norder and breaks is checked, and an error messageresults if this equation is not satisfied.
B-splines are a set of special spline functions that can be used to construct any such piece-wisepolynomial by computing the appropriate linear combination. They derive their computationalconvience from the fact that any B-spline basis function is nonzero over at most m adjacent intervals.The number of basis functions is given by the rule above for the number of degrees of freedom.
The number of intervals controls the flexibility of the spline; the more knots, the more flexible theresulting spline will be. But the position of the knots also plays a role. Where do we position theknots? There is room for judgment here, but two considerations must be kept in mind: (1) youusually want at least one argument value between two adjacent knots, and (2) there should be moreknots where the curve needs to have sharp curvatures such as a sharp peak or valley or an abruptchange of level, but only a few knots are required where the curve is changing very slowly.
This function automatically includes norder replicates of the end points rangeval. By contrast, theanalogous functions splineDesign and spline.des in the splines package do NOT automaticallyreplicate the end points. To compare answers, the end knots must be replicated manually whenusing splineDesign or spline.des.
Value
a basis object of the type bspline
References
Ramsay, James O., and Silverman, Bernard W. (2006), Functional Data Analysis, 2nd ed., Springer,New York.
Ramsay, James O., and Silverman, Bernard W. (2002), Applied Functional Data Analysis, Springer,New York.
See Also
basisfd, create.constant.basis, create.exponential.basis, create.fourier.basis,create.monomial.basis, create.polygonal.basis, create.polynomial.basis,create.power.basis splineDesign spline.des

44 create.bspline.basis
Examples
#### The simplest basis currently available with this function:##bspl1.1 <- create.bspline.basis(norder=1)plot(bspl1.1)# 1 basis function, order 1 = degree 0 = step function:
# should be the same as above:b1.1 <- create.bspline.basis(0:1, nbasis=1, norder=1, breaks=0:1)
all.equal(bspl1.1, b1.1)
bspl2.2 <- create.bspline.basis(norder=2)plot(bspl2.2)
bspl3.3 <- create.bspline.basis(norder=3)plot(bspl3.3)
bspl4.4 <- create.bspline.basis()plot(bspl4.4)
bspl1.2 <- create.bspline.basis(norder=1, breaks=c(0,.5, 1))plot(bspl1.2)# 2 bases, order 1 = degree 0 = step functions:# (1) constant 1 between 0 and 0.5 and 0 otherwise# (2) constant 1 between 0.5 and 1 and 0 otherwise.
bspl2.3 <- create.bspline.basis(norder=2, breaks=c(0,.5, 1))plot(bspl2.3)# 3 bases: order 2 = degree 1 = linear# (1) line from (0,1) down to (0.5, 0), 0 after# (2) line from (0,0) up to (0.5, 1), then down to (1,0)# (3) 0 to (0.5, 0) then up to (1,1).
bspl3.4 <- create.bspline.basis(norder=3, breaks=c(0,.5, 1))plot(bspl3.4)# 4 bases: order 3 = degree 2 = parabolas.# (1) (x-.5)^2 from 0 to .5, 0 after# (2) 2*(x-1)^2 from .5 to 1, and a parabola# from (0,0 to (.5, .5) to match# (3 & 4) = complements to (2 & 1).
bSpl4. <- create.bspline.basis(c(-1,1))plot(bSpl4.)# Same as bSpl4.23 but over (-1,1) rather than (0,1).
# set up the b-spline basis for the lip data, using 23 basis functions,# order 4 (cubic), and equally spaced knots.# There will be 23 - 4 = 19 interior knots at 0.05, ..., 0.95lipbasis <- create.bspline.basis(c(0,1), 23)

create.constant.basis 45
plot(lipbasis)
bSpl.growth <- create.bspline.basis(growth$age)# cubic spline (order 4)
bSpl.growth6 <- create.bspline.basis(growth$age,norder=6)# quintic spline (order 6)
create.constant.basisCreate a Constant Basis
Description
Create a constant basis object, defining a single basis function whose value is everywhere 1.0.
Usage
create.constant.basis(rangeval=c(0, 1), names="const", axes=NULL)
Arguments
rangeval a vector of length 2 containing the initial and final values of argument t definingthe interval over which the functional data object can be evaluated. However,this is seldom used since the value of the basis function does not depend on therange or any argument values.
names a character vector of length 1.axes an optional list used by selected plot functions to create custom axes. If this
axes argument is not NULL, functions plot.basisfd, plot.fd, plot.fdSmoothplotfit.fd, plotfit.fdSmooth, and plot.Lfd will create axes viado.call(x$axes[[1]], x$axes[-1]). The primary example of thisuses list("axesIntervals", ...), e.g., with Fourier bases to cre-ate CanadianWeather plots
Value
a basis object with type component const.
See Also
basisfd, create.bspline.basis, create.exponential.basis, create.fourier.basis,create.monomial.basis, create.polygonal.basis, create.polynomial.basis,create.power.basis
Examples
basisobj <- create.constant.basis(c(-1,1))

46 create.exponential.basis
create.exponential.basisCreate an Exponential Basis
Description
Create an exponential basis object defining a set of exponential functions with rate constants inargument ratevec.
Usage
create.exponential.basis(rangeval=c(0,1), nbasis=NULL, ratevec=NULL,dropind=NULL, quadvals=NULL, values=NULL,basisvalues=NULL, names='exp', axes=NULL)
Arguments
rangeval a vector of length 2 containing the initial and final values of the interval overwhich the functional data object can be evaluated.
nbasis the number of basis functions. Default = if(is.null(ratevec)) 2 elselength(ratevec).
ratevec a vector of length nbasis of rate constants defining basis functions of the formexp(rate*x). Default = 0:(nbasis-1).
dropind a vector of integers specifiying the basis functions to be dropped, if any. Forexample, if it is required that a function be zero at the left boundary, this isachieved by dropping the first basis function, the only one that is nonzero at thatpoint.
quadvals a matrix with two columns and a number of rows equal to the number of quadra-ture points for numerical evaluation of the penalty integral. The first column ofquadvals contains the quadrature points, and the second column the quadra-ture weights. A minimum of 5 values are required for each inter-knot interval,and that is often enough. For Simpson’s rule, these points are equally spaced,and the weights are proportional to 1, 4, 2, 4, ..., 2, 4, 1.
values a list of matrices with one row for each row of quadvals and one column foreach basis function. The elements of the list correspond to the basis functionsand their derivatives evaluated at the quadrature points contained in the firstcolumn of quadvals.
basisvalues A list of lists, allocated by code such as vector("list",1). This field is designed toavoid evaluation of a basis system repeatedly at a set of argument values. Eachlist within the vector corresponds to a specific set of argument values, and musthave at least two components, which may be tagged as you wish. ‘The first com-ponent in an element of the list vector contains the argument values. The secondcomponent in an element of the list vector contains a matrix of values of thebasis functions evaluated at the arguments in the first component. The third andsubsequent components, if present, contain matrices of values their derivatives

create.exponential.basis 47
up to a maximum derivative order. Whenever function getbasismatrix is called,it checks the first list in each row to see, first, if the number of argument valuescorresponds to the size of the first dimension, and if this test succeeds, checksthat all of the argument values match. This takes time, of course, but is muchfaster than re-evaluation of the basis system. Even this time can be avoided bydirect retrieval of the desired array. For example, you might set up a vector ofargument values called "evalargs" along with a matrix of basis function valuesfor these argument values called "basismat". You might want too use nameslike "args" and "values", respectively for these. You would then assign them tobasisvalues with code such as the following:basisobj$basisvalues <- vector("list",1)basisobj$basisvalues[[1]] <- list(args=evalargs, values=basismat)
names either a character vector of the same length as the number of basis functions ora simple stem used to construct such a vector.For exponential bases, this defaults to paste(’exp’, 0:(nbasis-1), sep=”).
axes an optional list used by selected plot functions to create custom axes. If thisaxes argument is not NULL, functions plot.basisfd, plot.fd, plot.fdSmoothplotfit.fd, plotfit.fdSmooth, and plot.Lfd will create axes viado.call(x$axes[[1]], x$axes[-1]). The primary example of thisuses list("axesIntervals", ...), e.g., with Fourier bases to cre-ate CanadianWeather plots
Details
Exponential functions are of the type exp(bx) where b is the rate constant. If b = 0, the constantfunction is defined.
Value
a basis object with the type expon.
See Also
basisfd, create.bspline.basis, create.constant.basis, create.fourier.basis,create.monomial.basis, create.polygonal.basis, create.polynomial.basis,create.power.basis
Examples
# Create an exponential basis over interval [0,5]# with basis functions 1, exp(-t) and exp(-5t)basisobj <- create.exponential.basis(c(0,5),3,c(0,-1,-5))# plot the basisplot(basisobj)

48 create.fourier.basis
create.fourier.basisCreate a Fourier Basis
Description
Create an Fourier basis object defining a set of Fourier functions with specified period.
Usage
create.fourier.basis(rangeval=c(0, 1), nbasis=3,period=diff(rangeval), dropind=NULL, quadvals=NULL,values=NULL, basisvalues=NULL, names=NULL,axes=NULL)
Arguments
rangeval a vector of length 2 containing the initial and final values of the interval overwhich the functional data object can be evaluated.
nbasis positive odd integer: If an even number is specified, it is rounded up to thenearest odd integer to preserve the pairing of sine and cosine functions. An evennumber of basis functions only makes sense when there are always only an evennumber of observations at equally spaced points; that case can be accomodatedusing dropind = nbasis-1 (because the bases are const, sin, cos, ...).
period the width of any interval over which the Fourier functions repeat themselves orare periodic.
dropind an optional vector of integers specifiying basis functions to be dropped.
quadvals an optional matrix with two columns and a number of rows equal to the numberof quadrature points for numerical evaluation of the penalty integral. The firstcolumn of quadvals contains the quadrature points, and the second columnthe quadrature weights. A minimum of 5 values are required for each inter-knotinterval, and that is often enough. For Simpson’s rule, these points are equallyspaced, and the weights are proportional to 1, 4, 2, 4, ..., 2, 4, 1.
values an optional list of matrices with one row for each row of quadvals and onecolumn for each basis function. The elements of the list correspond to the basisfunctions and their derivatives evaluated at the quadrature points contained inthe first column of quadvals.
basisvalues an optional list of lists, allocated by code such as vector("list",1). This field isdesigned to avoid evaluation of a basis system repeatedly at a set of argumentvalues. Each sublist corresponds to a specific set of argument values, and musthave at least two components: a vector of argument values and a matrix of thevalues the basis functions evaluated at the arguments in the first component.Third and subsequent components, if present, contain matrices of values theirderivatives. Whenever function getbasismatrix is called, it checks the first list ineach row to see, first, if the number of argument values corresponds to the size

create.fourier.basis 49
of the first dimension, and if this test succeeds, checks that all of the argumentvalues match. This takes time, of course, but is much faster than re-evaluationof the basis system. Even this time can be avoided by direct retrieval of the de-sired array. For example, you might set up a vector of argument values called"evalargs" along with a matrix of basis function values for these argument valuescalled "basismat". You might want too use tags like "args" and "values", respec-tively for these. You would then assign them to basisvalues with code suchas the following:basisobj$basisvalues <- vector("list",1)basisobj$basisvalues[[1]] <- list(args=evalargs, values=basismat)
names either a character vector of the same length as the number of basis functions ora simple stem used to construct such a vector.If nbasis = 3, names defaults to c(’const’, ’cos’, ’sin’). If nbasis > 3,names defaults to c(’const’, outer(c(’cos’, ’sin’), 1:((nbasis-1)/2), paste, sep=”)).If names = NA, no names are used.
axes an optional list used by selected plot functions to create custom axes. If thisaxes argument is not NULL, functions plot.basisfd, plot.fd, plot.fdSmoothplotfit.fd, plotfit.fdSmooth, and plot.Lfd will create axes viado.call(x$axes[[1]], x$axes[-1]). The primary example of thisis to create CanadianWeather plots using list("axesIntervals")
Details
Functional data objects are constructed by specifying a set of basis functions and a set of coefficientsdefining a linear combination of these basis functions. The Fourier basis is a system that is usuallyused for periodic functions. It has the advantages of very fast computation and great flexibility. Ifthe data are considered to be nonperiod, the Fourier basis is usually preferred. The first Fourier basisfunction is the constant function. The remainder are sine and cosine pairs with integer multiples ofthe base period. The number of basis functions generated is always odd.
Value
a basis object with the type fourier.
See Also
basisfd, create.bspline.basis, create.constant.basis, create.exponential.basis,create.monomial.basis, create.polygonal.basis, create.polynomial.basis,create.power.basis
Examples
# Create a minimal Fourier basis for annual data# using 3 basis functionsyearbasis3 <- create.fourier.basis(c(0,365),
axes=list("axesIntervals") )# plot the basisplot(yearbasis3)

50 create.monomial.basis
# Identify the months with lettersplot(yearbasis3, axes=list('axesIntervals', labels=monthLetters))
# The same labels as part of the basis objectyearbasis3. <- create.fourier.basis(c(0,365),
axes=list("axesIntervals", labels=monthLetters) )plot(yearbasis3.)
# set up the Fourier basis for the monthly temperature data,# using 9 basis functions with period 12 months.monthbasis <- create.fourier.basis(c(0,12), 9, 12.0)
# plot the basisplot(monthbasis)
# Create a false Fourier basis using 1 basis function.falseFourierBasis <- create.fourier.basis(nbasis=1)# plot the basis: constantplot(falseFourierBasis)
create.monomial.basisCreate a Monomial Basis
Description
Creates a set of basis functions consisting of powers of the argument.
Usage
create.monomial.basis(rangeval=c(0, 1), nbasis=NULL,exponents=NULL, dropind=NULL, quadvals=NULL,values=NULL, basisvalues=NULL, names='monomial',axes=NULL)
Arguments
rangeval a vector of length 2 containing the initial and final values of the interval overwhich the functional data object can be evaluated.
nbasis the number of basis functions = length(exponents). Default = if(is.null(exponents))2 else length(exponents).
exponents the nonnegative integer powers to be used. By default, these are 0, 1, 2, ...,(nbasis-1).
dropind a vector of integers specifiying the basis functions to be dropped, if any. Forexample, if it is required that a function be zero at the left boundary whenrangeval[1] = 0, this is achieved by dropping the first basis function, the onlyone that is nonzero at that point.

create.monomial.basis 51
quadvals a matrix with two columns and a number of rows equal to the number of quadra-ture points for numerical evaluation of the penalty integral. The first column ofquadvals contains the quadrature points, and the second column the quadra-ture weights. A minimum of 5 values are required for each inter-knot interval,and that is often enough. For Simpson’s rule, these points are equally spaced,and the weights are proportional to 1, 4, 2, 4, ..., 2, 4, 1.
values a list of matrices with one row for each row of quadvals and one column foreach basis function. The elements of the list correspond to the basis functionsand their derivatives evaluated at the quadrature points contained in the firstcolumn of quadvals.
basisvalues A list of lists, allocated by code such as vector("list",1). This field is designed toavoid evaluation of a basis system repeatedly at a set of argument values. Eachlist within the vector corresponds to a specific set of argument values, and musthave at least two components, which may be tagged as you wish. ‘The first com-ponent in an element of the list vector contains the argument values. The secondcomponent in an element of the list vector contains a matrix of values of thebasis functions evaluated at the arguments in the first component. The third andsubsequent components, if present, contain matrices of values their derivativesup to a maximum derivative order. Whenever function getbasismatrix is called,it checks the first list in each row to see, first, if the number of argument valuescorresponds to the size of the first dimension, and if this test succeeds, checksthat all of the argument values match. This takes time, of course, but is muchfaster than re-evaluation of the basis system. Even this time can be avoided bydirect retrieval of the desired array. For example, you might set up a vector ofargument values called "evalargs" along with a matrix of basis function valuesfor these argument values called "basismat". You might want too use nameslike "args" and "values", respectively for these. You would then assign them tobasisvalues with code such as the following:basisobj$basisvalues <- vector("list",1)basisobj$basisvalues[[1]] <- list(args=evalargs, values=basismat)
names either a character vector of the same length as the number of basis functions ora simple stem used to construct such a vector.For monomial bases, this defaults to paste(’monomial’, 1:nbreaks, sep=”).
axes an optional list used by selected plot functions to create custom axes. If thisaxes argument is not NULL, functions plot.basisfd, plot.fd, plot.fdSmoothplotfit.fd, plotfit.fdSmooth, and plot.Lfd will create axes viado.call(x$axes[[1]], x$axes[-1]). The primary example of thisuses list("axesIntervals", ...), e.g., with Fourier bases to cre-ate CanadianWeather plots
Value
a basis object with the type monom.
See Also
basisfd, link{create.basis} create.bspline.basis, create.constant.basis,

52 create.polygonal.basis
create.fourier.basis, create.exponential.basis, create.polygonal.basis,create.polynomial.basis, create.power.basis
Examples
#### simplest example: one constant 'basis function'##m0 <- create.monomial.basis(nbasis=1)plot(m0)
#### Create a monomial basis over the interval [-1,1]## consisting of the first three powers of t##basisobj <- create.monomial.basis(c(-1,1), 5)# plot the basisplot(basisobj)
create.polygonal.basisCreate a Polygonal Basis
Description
A basis is set up for constructing polygonal lines, consisting of straight line segments that jointogether.
Usage
create.polygonal.basis(rangeval=NULL, argvals=NULL, dropind=NULL,quadvals=NULL, values=NULL, basisvalues=NULL, names='polygon',axes=NULL)
Arguments
rangeval a numeric vector of length 2 defining the interval over which the functional dataobject can be evaluated; default value is if(is.null(argvals)) 0:1else range(argvals).If length(rangeval) == 1 and rangeval <= 0, this is an error. Oth-erwise, if length(rangeval) == 1, rangeval is replaced by c(0,rangeval).If length(rangeval)>2 and argvals is not provided, this extra long rangevalargument is assigned to argvals, and then rangeval = range(argvale).
argvals a strictly increasing vector of argument values at which line segments join toform a polygonal line.
dropind a vector of integers specifiying the basis functions to be dropped, if any. Forexample, if it is required that a function be zero at the left boundary, this isachieved by dropping the first basis function, the only one that is nonzero at thatpoint.

create.polygonal.basis 53
quadvals a matrix with two columns and a number of rows equal to the number of quadra-ture points for numerical evaluation of the penalty integral. The first column ofquadvals contains the quadrature points, and the second column the quadra-ture weights. A minimum of 5 values are required for each inter-knot interval,and that is often enough. For Simpson’s rule, these points are equally spaced,and the weights are proportional to These are proportional to 1, 4, 2, 4, ..., 2, 4,1.
values a list containing the basis functions and their derivatives evaluated at the quadra-ture points contained in the first column of quadvals .
basisvalues A list of lists, allocated by code such as vector("list",1). This is designed toavoid evaluation of a basis system repeatedly at a set of argument values. Eachsublist corresponds to a specific set of argument values, and must have at leasttwo components, which may be named as you wish. The first component of asublist contains the argument values. The second component contains a matrixof values of the basis functions evaluated at the arguments in the first com-ponent. The third and subsequent components, if present, contain matrices ofvalues their derivatives up to a maximum derivative order. Whenever functiongetbasismatrix is called, it checks the first list in each row to see, first,if the number of argument values corresponds to the size of the first dimension,and if this test succeeds, checks that all of the argument values match. This takestime, of course, but is much faster than re-evaluation of the basis system. Eventhis time can be avoided by direct retrieval of the desired array. For example,you might set up a vector of argument values called "evalargs" along with a ma-trix of basis function values for these argument values called "basismat". Youmight want too use tags like "args" and "values", respectively for these. Youwould then assign them to basisvalues with code such as the following:
basisobj$basisvalues <- vector("list",1)
basisobj$basisvalues[[1]] <- list(args=evalargs, values=basismat)
names either a character vector of the same length as the number of basis functions or asingle character string to which 1:nbasis are appended as paste(names,1:nbasis, sep=”. For example, if nbasis = 4, this defaults to c(’polygon1’,’polygon2’, ’polygon3’, ’polygon4’).
axes an optional list used by selected plot functions to create custom axes. If thisaxes argument is not NULL, functions plot.basisfd, plot.fd, plot.fdSmoothplotfit.fd, plotfit.fdSmooth, and plot.Lfd will create axes viado.call(x$axes[[1]], x$axes[-1]). The primary example of thisuses list("axesIntervals", ...), e.g., with Fourier bases to cre-ate CanadianWeather plots
Details
The actual basis functions consist of triangles, each with its apex over an argument value. Note thatin effect the polygonal basis is identical to a B-spline basis of order 2 and a knot or break value ateach argument value. The range of the polygonal basis is set to the interval defined by the smallestand largest argument values.

54 create.polynomial.basis
Value
a basis object with the type polyg.
See Also
basisfd, create.bspline.basis, create.basis, create.constant.basis, create.exponential.basis,create.fourier.basis, create.monomial.basis, create.polynomial.basis,create.power.basis
Examples
# Create a polygonal basis over the interval [0,1]# with break points at 0, 0.1, ..., 0.95, 1(basisobj <- create.polygonal.basis(seq(0,1,0.1)))# plot the basisplot(basisobj)
create.polynomial.basisCreate a Polynomial Basis
Description
Creates a set of basis functions consisting of powers of the argument shifted by a constant.
Usage
create.polynomial.basis(rangeval=c(0, 1), nbasis=2, ctr=0,dropind=NULL, quadvals=NULL, values=NULL,basisvalues=NULL, names='polynom', axes=NULL)
Arguments
rangeval a vector of length 2 defining the range.
nbasis the number of basis functions. The default is 2, which defines a basis for straightlines.
ctr this value is used to shift the argument prior to taking its power.
dropind a vector of integers specifiying the basis functions to be dropped, if any. Forexample, if it is required that a function be zero at the left boundary, this isachieved by dropping the first basis function, the only one that is nonzero at thatpoint.
quadvals a matrix with two columns and a number of rows equal to the number of quadra-ture points for numerical evaluation of the penalty integral. The first column ofquadvals contains the quadrature points, and the second column the quadra-ture weights. A minimum of 5 values are required for each inter-knot interval,and that is often enough. For Simpson’s rule, these points are equally spaced,and the weights are proportional to 1, 4, 2, 4, ..., 2, 4, 1.
create.polynomial.basis 55
values a list of matrices with one row for each row of quadvals and one column foreach basis function. The elements of the list correspond to the basis functionsand their derivatives evaluated at the quadrature points contained in the firstcolumn of quadvals.
basisvalues A list of lists, allocated by code such as vector("list",1). This field is designed toavoid evaluation of a basis system repeatedly at a set of argument values. Eachlist within the vector corresponds to a specific set of argument values, and musthave at least two components, which may be tagged as you wish. ‘The first com-ponent in an element of the list vector contains the argument values. The secondcomponent in an element of the list vector contains a matrix of values of thebasis functions evaluated at the arguments in the first component. The third andsubsequent components, if present, contain matrices of values their derivativesup to a maximum derivative order. Whenever function getbasismatrix is called,it checks the first list in each row to see, first, if the number of argument valuescorresponds to the size of the first dimension, and if this test succeeds, checksthat all of the argument values match. This takes time, of course, but is muchfaster than re-evaluation of the basis system. Even this time can be avoided bydirect retrieval of the desired array. For example, you might set up a vector ofargument values called "evalargs" along with a matrix of basis function valuesfor these argument values called "basismat". You might want too use nameslike "args" and "values", respectively for these. You would then assign them tobasisvalues with code such as the following:basisobj$basisvalues <- vector("list",1)basisobj$basisvalues[[1]] <- list(args=evalargs, values=basismat)
names either a character vector of the same length as the number of basis functions ora simple stem used to construct such a vector.For polynom bases, this defaults to paste(’polynom’, 1:nbreaks, sep=”).
axes an optional list used by selected plot functions to create custom axes. If thisaxes argument is not NULL, functions plot.basisfd, plot.fd, plot.fdSmoothplotfit.fd, plotfit.fdSmooth, and plot.Lfd will create axes viado.call(x$axes[[1]], x$axes[-1]). The primary example of thisuses list("axesIntervals", ...), e.g., with Fourier bases to cre-ate CanadianWeather plots
Details
The only difference between a monomial and a polynomial basis is the use of a shift value. Thishelps to avoid rounding error when the argument values are a long way from zero.
Value
a basis object with the type polynom.
See Also
basisfd, create.basis, create.bspline.basis, create.constant.basis, create.fourier.basis,create.exponential.basis, create.monomial.basis, create.polygonal.basis,create.power.basis

56 create.power.basis
Examples
# Create a polynomial basis over the years in the 20th century# and center the basis functions on 1950.basisobj <- create.polynomial.basis(c(1900, 2000), nbasis=3, ctr=1950)# plot the basis# The following should work but doesn't; 2007.05.01#plot(basisobj)
create.power.basis Create a Power Basis Object
Description
The basis system is a set of powers of argument x. That is, a basis function would be x^exponent,where exponent is a vector containing a set of powers or exponents. The power basis wouldnormally only be used for positive values of x, since the power of a negative number is only definedfor nonnegative integers, and the exponents here can be any real numbers.
Usage
create.power.basis(rangeval=c(0, 1), nbasis=NULL, exponents=NULL,dropind=NULL, quadvals=NULL, values=NULL,basisvalues=NULL, names='power', axes=NULL)
Arguments
rangeval a vector of length 2 with the first element being the lower limit of the range ofargument values, and the second the upper limit. Of course the lower limit mustbe less than the upper limit.
nbasis the number of basis functions = length(exponents). Default = if(is.null(exponents))2 else length(exponents).
exponents a numeric vector of length nbasis containing the powers of x in the basis.
dropind a vector of integers specifiying the basis functions to be dropped, if any. Forexample, if it is required that a function be zero at the left boundary, this isachieved by dropping the first basis function, the only one that is nonzero at thatpoint.
quadvals a matrix with two columns and a number of rows equal to the number of quadra-ture points for numerical evaluation of the penalty integral. The first column ofquadvals contains the quadrature points, and the second column the quadra-ture weights. A minimum of 5 values are required for each inter-knot interval,and that is often enough. For Simpson’s rule, these points are equally spaced,and the weights are proportional to 1, 4, 2, 4, ..., 2, 4, 1.
values a list of matrices with one row for each row of quadvals and one column foreach basis function. The elements of the list correspond to the basis functionsand their derivatives evaluated at the quadrature points contained in the firstcolumn of quadvals.

create.power.basis 57
basisvalues A list of lists, allocated by code such as vector("list",1). This field is designed toavoid evaluation of a basis system repeatedly at a set of argument values. Eachlist within the vector corresponds to a specific set of argument values, and musthave at least two components, which may be tagged as you wish. ‘The first com-ponent in an element of the list vector contains the argument values. The secondcomponent in an element of the list vector contains a matrix of values of thebasis functions evaluated at the arguments in the first component. The third andsubsequent components, if present, contain matrices of values their derivativesup to a maximum derivative order. Whenever function getbasismatrix is called,it checks the first list in each row to see, first, if the number of argument valuescorresponds to the size of the first dimension, and if this test succeeds, checksthat all of the argument values match. This takes time, of course, but is muchfaster than re-evaluation of the basis system. Even this time can be avoided bydirect retrieval of the desired array. For example, you might set up a vector ofargument values called "evalargs" along with a matrix of basis function valuesfor these argument values called "basismat". You might want too use nameslike "args" and "values", respectively for these. You would then assign them tobasisvalues with code such as the following:basisobj$basisvalues <- vector("list",1)basisobj$basisvalues[[1]] <- list(args=evalargs, values=basismat)
names either a character vector of the same length as the number of basis functions ora simple stem used to construct such a vector.For power bases, this defaults to paste(power’, 0:(nbasis-1), sep=”).
axes an optional list used by selected plot functions to create custom axes. If thisaxes argument is not NULL, functions plot.basisfd, plot.fd, plot.fdSmoothplotfit.fd, plotfit.fdSmooth, and plot.Lfd will create axes viado.call(x$axes[[1]], x$axes[-1]). The primary example of thisuses list("axesIntervals", ...), e.g., with Fourier bases to cre-ate CanadianWeather plots
Details
The power basis differs from the monomial and polynomial bases in two ways. First, the powersmay be nonintegers. Secondly, they may be negative. Consequently, a power basis is usually usedwith arguments that only take positive values, although a zero value can be tolerated if none of thepowers are negative.
Value
a basis object of type power.
See Also
basisfd, create.basis, create.bspline.basis, create.constant.basis, create.exponential.basis,create.fourier.basis, create.monomial.basis, create.polygonal.basis,create.polynomial.basis

58 CSTR
Examples
# Create a power basis over the interval [1e-7,1]# with powers or exponents -1, -0.5, 0, 0.5 and 1basisobj <- create.power.basis(c(1e-7,1), 5, seq(-1,1,0.5))# plot the basisplot(basisobj)
CSTR Continuously Stirred Tank Reactor
Description
Functions for solving the Continuously Stirred Tank Reactor (CSTR) Ordinary Differential Equa-tions (ODEs). A solution for observations where metrology error is assumed to be negligible can beobtained via lsoda(y, Time, CSTR2, parms); CSTR2 calls CSTR2in. When metrology error can notbe ignored, use CSTRfn (which calls CSTRfitLS). To estimate parameters in the CSTR differentialequation system (kref, EoverR, a, and / or b), pass either CSTRres or CSTRres0 to nls. If nls failsto converge, first use optim or nlminb with CSTRsse, then pass the estimates to nls.
Usage
CSTR2in(Time, condition =c('all.cool.step', 'all.hot.step', 'all.hot.ramp', 'all.cool.ramp',
'Tc.hot.exponential', 'Tc.cool.exponential', 'Tc.hot.ramp','Tc.cool.ramp', 'Tc.hot.step', 'Tc.cool.step'),
tau=1)CSTR2(Time, y, parms)
CSTRfitLS(coef, datstruct, fitstruct, lambda, gradwrd=FALSE)CSTRfn(parvec, datstruct, fitstruct, CSTRbasis, lambda, gradwrd=TRUE)CSTRres(kref=NULL, EoverR=NULL, a=NULL, b=NULL,
datstruct, fitstruct, CSTRbasis, lambda, gradwrd=FALSE)CSTRres0(kref=NULL, EoverR=NULL, a=NULL, b=NULL, gradwrd=FALSE)CSTRsse(par, datstruct, fitstruct, CSTRbasis, lambda)
Arguments
Time The time(s) for which computation(s) are desired
condition a character string with the name of one of ten preprogrammed input scenarios.
tau time for exponential decay of exp(-1) under condition = ’Tc.hot.exponential’ or’Tc.cool.exponential’; ignored for other values of ’condition’.
y Either a vector of length 2 or a matrix with 2 columns giving the observation(s)on Concentration and Temperature for which computation(s) are desired

CSTR 59
parms a list of CSTR model parameters passed via the lsoda ’parms’ argument. Thislist consists of the following 3 components:
fitstruct a list with 12 components describing the structure for fitting. This is thesame as the ’fitstruct’ argument of ’CSTRfitLS’ and ’CSTRfn’ without the’fit’ component; see below.
condition a character string identifying the inputs to the simulation. Currently, anyof the following are accepted: ’all.cool.step’, ’all.hot.step’, ’all.hot.ramp’,’all.cool.ramp’, ’Tc.hot.exponential’, ’Tc.cool.exponential’, ’Tc.hot.ramp’,’Tc.cool.ramp’, ’Tc.hot.step’, or ’Tc.cool.step’.
Tlim end time for the computations.
coef a matrix with one row for each basis function in fitstruct and columns c("Conc","Temp") or a vector form of such a matrix.
datstruct a list describing the structure of the data. CSTRfitLS uses the following compo-nents:
basismat, Dbasismat basis coefficent matrices with one row for each observation and one columnfor each basis vector. These are typically produced by code something likethe following:basismat <- eval.basis(Time, CSTRbasis)Dbasismat <- eval.basis(Time, CSTRbasis, 1)
Cwt, Twt scalar variances of ’fd’ functional data objects for Concentration and Tem-perature used to place the two series on comparable scales.
y a matrix with 2 columns for the observed ’Conc’ and ’Temp’.quadbasismat, Dquadbasismat basis coefficient matrices with one row for each quadrature point and one
column for each basis vector. These are typically produced by code some-thing like the following:quadbasismat <- eval.basis(quadpts, CSTRbasis)Dquadbasismat <- eval.basis(quadpts, CSTRbasis, 1)
Fc, F., CA0, T0, Tc input series for CSTRfitLS and CSTRfn as the output list produced byCSTR2in.
quadpts Quadrature points created by ’quadset’ and stored in CSTRbasis[["quadvals"]][,"quadpts"].
quadwts Quadrature weights created by ’quadset’ and stored in CSTRbasis[["quadvals"]][,"quadpts"].
fitstruct a list with 14 components:
V volume in cubic metersCp concentration in cal/(g.K) for computing betaTC and betaTT; see details
below.rho density in grams per cubic meter
delH cal/kmolCpc concentration in cal/(g.K) used for computing alpha; see details below.Tref reference temperature.kref reference value
EoverR E/R in units of K/1e4a scale factor for Fco in alpha; see details below.

60 CSTR
b power of Fco in alpha; see details below.Tcin Tc input temperature vector.
fit logical vector of length 2 indicating whether Contentration or Temperatureor both are considered to be observed and used for parameter estimation.
coef0 data.frame(Conc = Cfdsmth[["coef"]], Temp = Tfdsmth[["coef"]]), whereCfdsmth and Tfdsmth are the objects returned by smooth.basis when ap-plied to the observations on Conc and Temp, respectively.
estimate logical vector of length 4 indicating which of kref, EoverR, a and b aretaken from ’parvec’; all others are taken from ’fitstruct’.
lambda a 2-vector of rate parameters ’lambdaC’ and ’lambdaT’.
gradwrd a logical scalar TRUE if the gradient is to be returned as well as the residualsmatrix.
parvec, par initial values for the parameters specified by fitstruct[[ "estimate"]] to be esti-mated.
CSTRbasis Quadrature basis returned by ’quadset’.kref, EoverR, a, b
the kref, EoverR, a, and b coefficients of the CSTR model as individual argu-ments of CSTRres to support using ’nls’ with the CSTR model. Those actuallyprovided by name will be estimated; the others will be taken from ’.fitstruct’;see details.
Details
Ramsay et al. (2007) considers the following differential equation system for a continuously stirredtank reactor (CSTR):
dC/dt = (-betaCC(T, F.in)*C + F.in*C.in)
dT/dt = (-betaTT(Fcvec, F.in)*T + betaTC(T, F.in)*C + alpha(Fcvec)*T.co)
where
betaCC(T, F.in) = kref*exp(-1e4*EoverR*(1/T - 1/Tref)) + F.in
betaTT(Fcvec, F.in) = alpha(Fcvec) + F.in
betaTC(T, F.in) = (-delH/(rho*Cp))*betaCC(T, F.in)
alpha(Fcvec) = (a ∗ Fcvec(b+ 1)/(K1 ∗ (Fcvec+K2 ∗ Fcvecb)))
K1 = V*rho*Cp
K2 = 1/(2*rhoc*Cpc)
The four functions CSTR2in, CSTR2, CSTRfitLS, and CSTRfn compute coefficients of basis vec-tors for two different solutions to this set of differential equations. Functions CSTR2in and CSTR2work with ’lsoda’ to provide a solution to this system of equations. Functions CSTSRitLS andCSTRfn are used to estimate parameters to fit this differential equation system to noisy data. Thesesolutions are conditioned on specified values for kref, EoverR, a, and b. The other two functionsCSTRres and CSTRres0 support estimation of these parameters using ’nls’.

CSTR 61
CSTR2in translates a character string ’condition’ into a data.frame containing system inputs forwhich the reaction of the system is desired. CSTR2 calls CSTR2in and then computes the corre-sponding predicted first derivatives of CSTR system outputs according to the right hand side of thesystem equations. CSTR2 can be called by ’lsoda’ in the ’odesolve’ package to actually solve thesystem of equations. To solve the CSTR equations for another set of inputs, the easiest modificationmight be to change CSTR2in to return the desired inputs. Another alternative would be to add anargument ’input.data.frame’ that would be used in place of CSTR2in when present.
CSTRfitLS computes standardized residuals for systems outputs Conc, Temp or both as specifiedby fitstruct[["fit"]], a logical vector of length 2. The standardization is sqrt(datstruct[["Cwt"]]) and/ or sqrt(datstruct[["Twt"]]) for Conc and Temp, respectively. CSTRfitLS also returns standardizeddeviations from the predicted first derivatives for Conc and Temp.
CSTRfn uses a Gauss-Newton optimization to estimates the coefficients of CSTRbasis to minimizethe weighted sum of squares of residuals returned by CSTRfitLS.
CSTRres and CSTRres0 provide alternative interfaces between ’nls’ and ’CSTRfn’. Both get theparameters to be estimated via their official function arguments, kref, EoverR, a, and / or b. Thesubset of these paramters to estimate must be specified both directly in the function call to ’nls’ andindirectly via fitstruct[["estimate"]]. CSTRres gets the other CSTRfn arguments (datstruct, fitstruct,CSTRbasis, and lambda) via the ’data’ argument of ’nls’. (The version of ’nls’ in the ’stats’ packagein R 2.5.0 required ’data’ to be a data.frame, not merely a list. The version of ’nls’ in ’fda’ doesnot require this.) By contrast, CSTRres0 uses ’get’ to obtain these other arguments as .datstruct,.fitstruct, .CSTRbasis and .lambda. Thus, before calling nls(~CSTRres0(...), ...), the values of thesearguments must be assigned to .datstruct, .fitstruct, .CSTRbasis and .lambda. If ’nls’ is called fromthe global environment, it will look for these objects in the global environment.
CSTRres0 has one feature absent from CSTRres: If a variable .CSTRres0.trace is available, it isassumed to be a matrix with columns kref, EoverR, a, b, SSE, plus all residuals. These numbersare rbinded as an additional row of this matrix. This is provided to help diagnose a problem were’nls’ was terminating with "step factor ... reduced below ’minFactor’", facilitating the comparisonbetween R and Matlab for the precise sets of parameter values tested by ’nls’.
CSTRsse computes sum of squares of residuals for use with optim or nlminb.
Value
CSTR2in a matrix with number of rows = length(Time) and columns for F., CA0, T0, Tcin,and Fc. This gives the inputs to the CSTR simulation for the chosen ’condition’.
CSTR2 a list with one component being a matrix with number of rows = length(tobs)and 2 columns giving the first derivatives of Conc and Temp according to theright hand side of the differential equation. CSTR2 calls CSTR2in to get itsinputs.
CSTRfitLS a list with one or two components as follows:
res a list with two componentsSres = a matrix giving the residuals between observed and predicted dat-struct[["y"]] divided by sqrt(datstruct[[c("Cwt", "Twt")]]) so the result isdimensionless. dim(Sres) = dim(datstruct[["y"]]). Thus, if datstruct[["y"]]has only one column, ’Sres’ has only one column.Lres = a matrix with two columns giving the difference between left andright hand sides of the CSTR differential equation at all the quadraturepoints. dim(Lres) = c(nquad, 2).

62 CSTR
Dres If gradwrd=TRUE, a list with two components:DSres = a matrix with one row for each element of res[["Sres"]] and twocolumns for each basis function.DLres = a matrix with two rows for each quadrature point and two columnsfor each basis function.If gradwrd=FALSE, this component is not present.
CSTRfn a list with five components:
res the ’res’ component of the final ’CSTRfitLS’ object reformatted with itscomponent Sres first followed by Lres, using with(CSTRfitLS(...)[["res"]],c(Sres, Lres)).
Dres one of two very different gradient matrices depending on the value of ’grad-wrd’.If gradwrd = TRUE, Dres is a matrix with one row for each observationvalue to match and one column for each parameter taken from ’parvec’per fitstruct[["estimate"]]. Also, if fitstruct[["fit"]] = c(1,1), CSTRfn triesto match both Concentration and Temperature, and rows corresponding toConcentration come first following by rows corresponding to Temperature.If gradwrd = FALSE, this is the ’Dres’ component of the final ’CSTRfitLS’object reformatted as follows:Dres <- with(CSTRfitLS(...)[["Dres"]], rbind(DSres, DLres))
fitstruct a list components matching the ’fitstruct’ input, with coefficients estimatedreplaced by their initial values from parvec and with coef0 replace by itsfinal estimate.
df estimated degrees of freedom as the trace of the appropriate matrix.gcv the Generalized cross validation estimate of the mean square error, as dis-
cussed in Ramsay and Silverman (2006, sec. 5.4).CSTRres, CSTRres0
the ’res’ component of CSTRfd(...) as a column vector. This allows us to use’nls’ with the CSTR model. This can be especially useful as ’nls’ has severalhelper functions to facilitate evaluating goodness of fit and and uncertainty inparameter estimates.
CSTRsse sum(res*res) from CSTRfd(...). This allows us to use ’optim’ or ’nlminb’ withthe CSTR model. This can also be used to obtain starting values for ’nls’ incases where ’nls’ fails to converge from the initiall provided starting values.Apart from ’par’, the other arguments ’datstruct’, ’fitstruct’, ’CSTRbasis’, and’lambda’, must be passed via ’...’ in ’optim’ or ’nlminb’.
References
Ramsay, J. O., Hooker, G., Cao, J. and Campbell, D. (2007) Parameter estimation for differentialequations: A generalized smoothing approach (with discussion). Journal of the Royal StatisticalSociety, Series B, 69, 741-796.
Ramsay, J. O., and Silverman, B. W. (2006) Functional Data Analysis, 2nd ed., Springer, NewYork.
Ramsay, James O., and Silverman, Bernard W. (2002), Applied Functional Data Analysis, Springer,New York.

CSTR 63
See Also
lsoda nls
Examples
######### 1. lsoda(y, times, func=CSTR2, parms=...)####### The system of two nonlinear equations has five forcing or# input functions.# These equations are taken from# Marlin, T. E. (2000) Process Control, 2nd Edition, McGraw Hill,# pages 899-902.#### Set up the problem##fitstruct <- list(V = 1.0,# volume in cubic meters
Cp = 1.0,# concentration in cal/(g.K)rho = 1.0,# density in grams per cubic meterdelH = -130.0,# cal/kmolCpc = 1.0,# concentration in cal/(g.K)rhoc = 1.0,# cal/kmolTref = 350)# reference temperature
# store true values of known parametersEoverRtru = 0.83301# E/R in units K/1e4kreftru = 0.4610 # reference valueatru = 1.678# a in units (cal/min)/K/1e6btru = 0.5# dimensionless exponent
#
fitstruct[["kref"]] = kreftru#fitstruct[["EoverR"]] = EoverRtru# kref = 0.4610fitstruct[["a"]] = atru# a in units (cal/min)/K/1e6fitstruct[["b"]] = btru# dimensionless exponent
Tlim = 64# reaction observed over interval [0, Tlim]delta = 1/12# observe every five secondstspan = seq(0, Tlim, delta)#
coolStepInput <- CSTR2in(tspan, 'all.cool.step')
# set constants for ODE solver
# cool condition solution# initial conditions
Cinit.cool = 1.5965# initial concentration in kmol per cubic meterTinit.cool = 341.3754# initial temperature in deg Kyinit = c(Conc = Cinit.cool, Temp=Tinit.cool)

64 cycleplot.fd
# load cool input into fitstruct
fitstruct[["Tcin"]] = coolStepInput[, "Tcin"];
# solve differential equation with true parameter values
if (require(odesolve)) {coolStepSoln <- lsoda(y=yinit, times=tspan, func=CSTR2,parms=list(fitstruct=fitstruct, condition='all.cool.step', Tlim=Tlim) )
}######### 2. CSTRfn######
# See the script in '~R\library\fda\scripts\CSTR\CSTR_demo.R'# for more examples.
cycleplot.fd Plot Cycles for a Periodic Bivariate Functional Data Object
Description
A plotting function for data such as the knee-hip angles in the gait data or temperature-precipitationcurves for the weather data.
Usage
cycleplot.fd(fdobj, matplt=TRUE, nx=201, ...)
Arguments
fdobj a bivariate functional data object to be plotted.
matplt if TRUE, all cycles are plotted simultaneously; otherwise each cycle in turn isplotted.
nx the number of argument values in a fine mesh to be plotted. Increase the defaultnumber of 201 if the curves have a lot of detail in them.
... additional plotting parameters such as axis labels and etc. that are used in allplot functions.
Value
None

Data2fd 65
Side Effects
A plot of the cycles
See Also
plot.fd, plotfit.fd, demo(gait)
Data2fd Create a functional data object from data
Description
This function converts an array y of function values plus an array argvals of argument valuesinto a functional data object. This function tries to do as much for the user as possible. NOTE:Interpolation with data2fd(...) can be shockingly bad, as illustrated in one of the examples.
Usage
Data2fd(argvals=NULL, y=NULL, basisobj=NULL, nderiv=NULL,lambda=0, fdnames=NULL)
Arguments
argvals a set of argument values. If this is a vector, the same set of argument values isused for all columns of y. If argvals is a matrix, the columns correspond tothe columns of y, and contain the argument values for that replicate or case.Dimensions for argvals must match the first dimensions of y, though y canhave more dimensions. For example, if dim(y) = c(9, 5, 2), argvals can bea vector of length 9 or a matrix of dimenions c(9, 5) or an array of dimensionsc(9, 5, 2).
y an array containing sampled values of curves.If y is a vector, only one replicate and variable are assumed. If y is a matrix,rows must correspond to argument values and columns to replications or cases,and it will be assumed that there is only one variable per observation. If y isa three-dimensional array, the first dimension (rows) corresponds to argumentvalues, the second (columns) to replications, and the third (layers) to variableswithin replications. Missing values are permitted, and the number of values mayvary from one replication to another. If this is the case, the number of rows mustequal the maximum number of argument values, and columns of y having fewervalues must be padded out with NA’s.
basisobj One of the following:
basisfd a functional basis object (class basisfd).fd a functional data object (class fd), from which its basis component is
extracted.

66 Data2fd
fdPar a functional parameter object (class fdPar), from which its basis com-ponent is extracted.
integer an integer giving the order of a B-spline basis, create.bspline.basis(argvals,norder=basisobj)
numeric vector specifying the knots for a B-spline basis, create.bspline.basis(basisobj)NULL Defaults to create.bspline.basis(argvals).
nderiv Smoothing typically specified as an integer order for the derivative whose squareis integrated and weighted by lambda to smooth. By default, if basisobj[[’type’]]== ’bspline’, the smoothing operator is int2Lfd(max(0, norder-2)).A general linear differential operator can also be supplied.
lambda weight on the smoothing operator specified by nderiv.
fdnames Either a charater vector of length 3 or a named list of length 3. In either case,the three elements correspond to the following:
argname name of the argument, e.g. "time" or "age".repname a description of the cases, e.g. "reps" or "weather stations"
value the name of the observed function value, e.g. "temperature"
If fdnames is a list, the components provide labels for the levels of the corre-sponding dimension of y.
Details
This function tends to be used in rather simple applications where there is no need to control theroughness of the resulting curve with any great finesse. The roughness is essentially controlled byhow many basis functions are used. In more sophisticated applications, it would be better to use thefunction smooth.basisPar.
Value
an object of the fd class containing:
coefs the coefficient array
basis a basis object
fdnames a list containing names for the arguments, function values and variables
References
Ramsay, James O., and Silverman, Bernard W. (2006), Functional Data Analysis, 2nd ed., Springer,New York.
Ramsay, James O., and Silverman, Bernard W. (2002), Applied Functional Data Analysis, Springer,New York.
See Also
smooth.basisPar, smooth.basis, project.basis, smooth.fd, smooth.monotone,smooth.pos day.5

Data2fd 67
Examples
#### Simplest possible example: step function##b1.1 <- create.bspline.basis(nbasis=1, norder=1)# 1 basis, order 1 = degree 0 = step function
y12 <- 1:2fd1.1 <- Data2fd(y12, basisobj=b1.1)plot(fd1.1)# fd1.1 = mean(y12) = 1.5
fd1.1.5 <- Data2fd(y12, basisobj=b1.1, lambda=0.5)eval.fd(seq(0, 1, .2), fd1.1.5)# fd1.1.5 = sum(y12)/(n+lambda*integral(over arg=0 to 1 of 1))# = 3 / (2+0.5) = 1.2
#### 3 step functions##b1.2 <- create.bspline.basis(nbasis=2, norder=1)# 2 bases, order 1 = degree 0 = step functionsfd1.2 <- Data2fd(1:2, basisobj=b1.2)
op <- par(mfrow=c(2,1))plot(b1.2, main='bases')plot(fd1.2, main='fit')par(op)# A step function: 1 to 0.5, then 2
#### Simple oversmoothing##b1.3 <- create.bspline.basis(nbasis=3, norder=1)fd1.3.5 <- Data2fd(y12, basisobj=b1.3, lambda=0.5)plot(0:1, c(0, 2), type='n')points(0:1, y12)lines(fd1.3.5)# Fit = penalized least squares with penalty =# = lambda * integral(0:1 of basis^2),# which shrinks the points towards 0.# X1.3 = matrix(c(1,0, 0,0, 0,1), 2)# XtX = crossprod(X1.3) = diag(c(1, 0, 1))# penmat = diag(3)/3# = 3x3 matrix of integral(over arg=0:1 of basis[i]*basis[j])# Xt.y = crossprod(X1.3, y12) = c(1, 0, 2)# XtX + lambda*penmat = diag(c(7, 1, 7)/6# so coef(fd1.3.5) = solve(XtX + lambda*penmat, Xt.y)# = c(6/7, 0, 12/7)
#### linear spline fit

68 Data2fd
##b2.3 <- create.bspline.basis(norder=2, breaks=c(0, .5, 1))# 3 bases, order 2 = degree 1 =# continuous, bounded, locally linear
fd2.3 <- Data2fd(0:1, basisobj=b2.3)round(fd2.3$coefs, 4)# (0, 0, 1),# though (0, a, 1) is also a solution for any 'a'op <- par(mfrow=c(2,1))plot(b2.3, main='bases')plot(fd2.3, main='fit')par(op)
# smoothing?fd2.3. <- Data2fd(0:1, basisobj=b2.3, lambda=1)
all.equal(as.vector(round(fd2.3.$coefs, 4)),c(0.0159, -0.2222, 0.8730) )
# The default smoothing with spline of order 2, degree 1# has nderiv = max(0, norder-2) = 0.# Direct computations confirm that the optimal B-spline# weights in this case are the numbers given above.
op <- par(mfrow=c(2,1))plot(b2.3, main='bases')plot(fd2.3., main='fit')par(op)
#### quadratic spline fit##b3.4 <- create.bspline.basis(norder=3, breaks=c(0, .5, 1))# 4 bases, order 3 = degree 2 =# continuous, bounded, locally quadratic
fd3.4 <- Data2fd(0:1, basisobj=b3.4)round(fd3.4$coefs, 4)# (0, 0, 0, 1),# but (0, a, b, 1) is also a solution for any 'a' and 'b'op <- par(mfrow=c(2,1))plot(b3.4)plot(fd3.4)par(op)
# try smoothing?fd3.4. <- Data2fd(0:1, basisobj=b3.4, lambda=1)round(fd3.4.$coef, 4)
op <- par(mfrow=c(2,1))plot(b3.4)plot(fd3.4.)

Data2fd 69
par(op)
#### A simple Fourier example##gaitbasis3 <- create.fourier.basis(nbasis=3)# note: 'names' for 3 basesgaitfd3 <- Data2fd(gait, basisobj=gaitbasis3)# Note: dimanes for 'coefs' + basis[['names']]# + 'fdnames'
# set up the fourier basisdaybasis <- create.fourier.basis(c(0, 365), nbasis=65)# Make temperature fd object# Temperature data are in 12 by 365 matrix tempav# See analyses of weather data.
# Convert the data to a functional data objecttempfd <- Data2fd(CanadianWeather$dailyAv[,,"Temperature.C"],
day.5, daybasis)# plot the temperature curvesplot(tempfd)
#### Terrifying interpolation##hgtbasis <- with(growth, create.bspline.basis(range(age),
breaks=age, norder=6))girl.data2fd <- with(growth, Data2fd(hgtf, age, hgtbasis))age2 <- with(growth, sort(c(age, (age[-1]+age[-length(age)])/2)))girlPred <- eval.fd(age2, girl.data2fd)range(growth$hgtf)range(growth$hgtf-girlPred[seq(1, by=2, length=31),])# 5.5e-6 0.028 <# The predictions are consistently too small# but by less than 0.05 percent
matplot(age2, girlPred, type="l")with(growth, matpoints(age, hgtf))# girl.data2fd fits the data fine but goes berzerk# between points
# Smoothgirl.data2fd1 <- with(growth, Data2fd(age, hgtf, hgtbasis, lambda=1))girlPred1 <- eval.fd(age2, girl.data2fd1)
matplot(age2, girlPred1, type="l")with(growth, matpoints(age, hgtf))
# problems splikes disappear

70 data2fd.old
data2fd.old Depricated: use ’Data2fd’
Description
This function converts an array y of function values plus an array argvals of argument valuesinto a functional data object. This a function that tries to do as much for the user as possible. A basisfunction expansion is used to represent the curve, but no roughness penalty is used. The data arefit using the least squares fitting criterion. NOTE: Interpolation with data2fd(...) can be shockinglybad, as illustrated in one of the examples.
Usage
data2fd(y, argvals=seq(0, 1, len = n), basisobj,fdnames=defaultnames,argnames=c("time", "reps", "values"))
Arguments
y an array containing sampled values of curves.If y is a vector, only one replicate and variable are assumed.If y is a matrix, rows must correspond to argument values and columns to repli-cations or cases, and it will be assumed that there is only one variable per obser-vation.If y is a three-dimensional array, the first dimension (rows) corresponds to ar-gument values, the second (columns) to replications, and the third layers) tovariables within replications. Missing values are permitted, and the number ofvalues may vary from one replication to another. If this is the case, the numberof rows must equal the maximum number of argument values, and columns ofy having fewer values must be padded out with NA’s.
argvals a set of argument values.If this is a vector, the same set of argument values is used for all columns of y. Ifargvals is a matrix, the columns correspond to the columns of y, and containthe argument values for that replicate or case.
basisobj either: A basisfd object created by function create.basis.fd(), or the valueNULL, in which case a basisfd object is set up by the function, using thevalues of the next three arguments.
fdnames A list of length 3, each member being a string vector containing labels for thelevels of the corresponding dimension of the discrete data. The first dimen-sion is for argument values, and is given the default name "time", the second isfor replications, and is given the default name "reps", and the third is for func-tions, and is given the default name "values". These default names are assignedin function {tt data2fd}, which also assigns default string vectors by using thedimnames attribute of the discrete data array.
argnames a character vector of length 3 containing:

data2fd.old 71
• the name of the argument, e.g. "time" or "age"• a description of the cases, e.g. "weather stations"• the name of the observed function value, e.g. "temperature"
These strings are used as names for the members of list fdnames.
Details
This function tends to be used in rather simple applications where there is no need to control theroughness of the resulting curve with any great finesse. The roughness is essentially controlled byhow many basis functions are used. In more sophisticated applications, it would be better to use thefunction smooth.basis
Value
an object of the fd class containing:
coefs the coefficient array
basis a basis object and
fdnames a list containing names for the arguments, function values and variables
See Also
\line{Data2fd} smooth.basis, smooth.basisPar, project.basis, smooth.fd,smooth.monotone, smooth.pos day.5
Examples
# Simplest possible exampleb1.2 <- create.bspline.basis(norder=1, breaks=c(0, .5, 1))# 2 bases, order 1 = degree 0 = step functions
str(fd1.2 <- data2fd(0:1, basisobj=b1.2))plot(fd1.2)# A step function: 0 to time=0.5, then 1 after
b2.3 <- create.bspline.basis(norder=2, breaks=c(0, .5, 1))# 3 bases, order 2 = degree 1 =# continuous, bounded, locally linear
str(fd2.3 <- data2fd(0:1, basisobj=b2.3))round(fd2.3$coefs, 4)# 0, -.25, 1plot(fd2.3)# Officially acceptable but crazy:# Initial negative slope from (0,0) to (0.5, -0.25),# then positive slope to (1,1).
b3.4 <- create.bspline.basis(norder=3, breaks=c(0, .5, 1))# 4 bases, order 3 = degree 2 =# continuous, bounded, locally quadratic

72 dateAccessories
str(fd3.4 <- data2fd(0:1, basisobj=b3.4))round(fd3.4$coefs, 4)# 0, .25, -.5, 1plot(fd3.4)# Officially acceptable but crazy:# Initial positive then swings negative# between 0.4 and ~0.75 before becoming positive again# with a steep slope running to (1,1).
# Simple examplegaitbasis3 <- create.fourier.basis(nbasis=3)str(gaitbasis3) # note: 'names' for 3 basesgaitfd3 <- data2fd(gait, basisobj=gaitbasis3)str(gaitfd3)# Note: dimanes for 'coefs' + basis[['names']]# + 'fdnames'
# set up the fourier basisdaybasis <- create.fourier.basis(c(0, 365), nbasis=65)# Make temperature fd object# Temperature data are in 12 by 365 matrix tempav# See analyses of weather data.
# Convert the data to a functional data objecttempfd <- data2fd(CanadianWeather$dailyAv[,,"Temperature.C"],
day.5, daybasis)# plot the temperature curvesplot(tempfd)
# Terrifying interpolationhgtbasis <- with(growth, create.bspline.basis(range(age),
breaks=age, norder=6))girl.data2fd <- with(growth, data2fd(hgtf, age, hgtbasis))age2 <- with(growth, sort(c(age, (age[-1]+age[-length(age)])/2)))girlPred <- eval.fd(age2, girl.data2fd)range(growth$hgtf)range(growth$hgtf-girlPred[seq(1, by=2, length=31),])# 5.5e-6 0.028 <# The predictions are consistently too small# but by less than 0.05 percent
matplot(age2, girlPred, type="l")with(growth, matpoints(age, hgtf))# girl.data2fd fits the data fine but goes berzerk# between points
dateAccessories Numeric and character vectors to facilitate working with dates

dateAccessories 73
Description
Numeric and character vectors to simplify functional data computations and plotting involvingdates.
Format
dayOfYear a numeric vector = 1:365 with names ’jan01’ to ’dec31’.
dayOfYearShifted a numeric vector = c(182:365, 1:181) with names ’jul01’ to ’jun30’.
day.5 a numeric vector = dayOfYear-0.5 = 0.5, 1.5, ..., 364.5
daysPerMonth a numeric vector of the days in each month (ignoring leap years) with names = month.abb
monthEnd a numeric vector of cumsum(daysPerMonth) with names = month.abb
monthEnd.5 a numeric vector of the middle of the last day of each month with names = month.abb =c(Jan=30.5, Feb=58.5, ..., Dec=364.5)
monthBegin.5 a numeric vector of the middle of the first day of each month with names - month.abb =c(Jan=0.5, Feb=31.5, ..., Dec=334.5)
monthMid a numeric vector of the middle of the month = (monthBegin.5 + monthEnd.5)/2
monthLetters A character vector of c("j", "F", "m", "A", "M", "J", "J", "A", "S", "O", "N", "D"), with’month.abb’ as the names.
weeks a numeric vector of length 53 marking 52 periods of approximately 7 days each throughoutthe year = c(0, 365/52, ..., 365)
Details
Miscellaneous vectors often used in ’fda’ scripts.
Source
Ramsay, James O., and Silverman, Bernard W. (2006), Functional Data Analysis, 2nd ed., Springer,New York, pp. 5, 47-53.
Ramsay, James O., and Silverman, Bernard W. (2002), Applied Functional Data Analysis, Springer,New York
See Also
axisIntervals month.abb
Examples
daybasis65 <- create.fourier.basis(c(0, 365), 65)daytempfd <- with(CanadianWeather, smooth.basisPar(day.5,
dailyAv[,,"Temperature.C"]) )plot(daytempfd, axes=FALSE)axisIntervals(1)# axisIntervals by default uses# monthBegin.5, monthEnd.5, monthMid, and month.abbaxis(2)

74 density.fd
density.fd Compute a Probability Density Function
Description
Like the regular S-PLUS function density, this function computes a probability density functionfor a sample of values of a random variable. However, in this case the density function is definedby a functional parameter object WfdParobj along with a normalizing constant C.
The density function p(x) has the form p(x) = C exp[W(x)] where function W (x) is definedby the functional data object WfdParobj.
Usage
density.fd(x, WfdParobj, conv=0.0001, iterlim=20,active=2:nbasis, dbglev=1, ...)
Arguments
x a set observations, which may be one of two forms:
1. a vector of observatons x_i2. a two-column matrix, with the observations x_i in the first column, and
frequencies f_i in the second.
The first option corresponds to all f_i = 1.
WfdParobj a functional parameter object specifying the initial value, basis object, roughnesspenalty and smoothing parameter defining function W (t).
conv a positive constant defining the convergence criterion.
iterlim the maximum number of iterations allowed.
active a logical vector of length equal to the number of coefficients defining Wfdobj.If an entry is TRUE, the corresponding coefficient is estimated, and if FALSE, itis held at the value defining the argument Wfdobj. Normally the first coefficientis set to 0 and not estimated, since it is assumed that W (0) = 0.
dbglev either 0, 1, or 2. This controls the amount information printed out on each iter-ation, with 0 implying no output, 1 intermediate output level, and 2 full output.If levels 1 and 2 are used, it is helpful to turn off the output buffering option inS-PLUS.
... Other arguments to match the generic function ’density’
Details
The goal of the function is provide a smooth density function estimate that approaches some targetdensity by an amount that is controlled by the linear differential operator Lfdobj and the penaltyparameter. For example, if the second derivative of W (t) is penalized heavily, this will force thefunction to approach a straight line, which in turn will force the density function itself to be nearlynormal or Gaussian. Similarly, to each textbook density function there corresponds a W (t), and

density.fd 75
to each of these in turn their corresponds a linear differential operator that will, when apply toW (t), produce zero as a result. To plot the density function or to evaluate it, evaluate Wfdobj,exponentiate the resulting vector, and then divide by the normalizing constant C.
Value
a named list of length 4 containing:
Wfdobj a functional data object defining function W (x) that that optimizes the fit to thedata of the monotone function that it defines.
C the normalizing constant.
Flist a named list containing three results for the final converged solution: (1) f: theoptimal function value being minimized, (2) grad: the gradient vector at theoptimal solution, and (3) norm: the norm of the gradient vector at the optimalsolution.
iternum the number of iterations.
iterhist a iternum+1 by 5 matrix containing the iteration history.
See Also
intensity.fd density
Examples
# set up range for densityrangeval <- c(-3,3)# set up some standard normal datax <- rnorm(50)# make sure values within the rangex[x < -3] <- -2.99x[x > 3] <- 2.99# set up basis for W(x)basisobj <- create.bspline.basis(rangeval, 11)# set up initial value for WfdobjWfd0 <- fd(matrix(0,11,1), basisobj)WfdParobj <- fdPar(Wfd0)# estimate densitydenslist <- density.fd(x, WfdParobj)# plot densityxval <- seq(-3,3,.2)wval <- eval.fd(xval, denslist$Wfdobj)pval <- exp(wval)/denslist$Cplot(xval, pval, type="l", ylim=c(0,0.4))points(x,rep(0,50))

76 deriv.fd
deriv.fd Compute a Derivative of a Functional Data Object
Description
A derivative of a functional data object, or the result of applying a linear differential operator to afunctional data object, is then converted to a functional data object. This is intended for situationswhere a derivative is to be manipulated as a functional data object rather than simply evaluated.
Usage
deriv.fd(expr, Lfdobj=int2Lfd(1), ...)
Arguments
expr a functional data object. It is assumed that the basis for representing the objectcan support the order of derivative to be computed. For B-spline bases, thismeans that the order of the spline must be at least one larger than the order ofthe derivative to be computed.
Lfdobj either a positive integer or a linear differential operator object.
... Other arguments to match generic for ’deriv’
Details
Typically, a derivative has more high frequency variation or detail than the function itself. The basisdefining the function is used, and therefore this must have enough basis functions to represent thevariation in the derivative satisfactorily.
Value
a functional data object for the derivative
See Also
getbasismatrix, eval.basis deriv
Examples
# Estimate the acceleration functions for growth curves# See the analyses of the growth data.# Set up the ages of height measurements for Berkeley dataage <- c( seq(1, 2, 0.25), seq(3, 8, 1), seq(8.5, 18, 0.5))# Range of observationsrng <- c(1,18)# Set up a B-spline basis of order 6 with knots at agesknots <- agenorder <- 6

df.residual.fRegress 77
nbasis <- length(knots) + norder - 2hgtbasis <- create.bspline.basis(rng, nbasis, norder, knots)# Set up a functional parameter object for estimating# growth curves. The 4th derivative is penalyzed to# ensure a smooth 2nd derivative or acceleration.Lfdobj <- 4lambda <- 10^(-0.5) # This value known in advance.growfdPar <- fdPar(hgtbasis, Lfdobj, lambda)# Smooth the data. The data for the boys and girls# are in matrices hgtm and hgtf, respectively.hgtmfd <- smooth.basis(age, growth$hgtm, growfdPar)$fdhgtffd <- smooth.basis(age, growth$hgtf, growfdPar)$fd# Compute the acceleration functionsaccmfd <- deriv.fd(hgtmfd, 2)accffd <- deriv.fd(hgtffd, 2)# Plot the two sets of curvespar(mfrow=c(2,1))plot(accmfd)plot(accffd)
df.residual.fRegressDegress of Freedom for Residuals from a Functional Regression
Description
Effective degrees of freedom for residuals, being the trace of the idempotent hat matrix transform-ing observations into residuals from the fit.
Usage
## S3 method for class 'fRegress':df.residual(object, ...)
Arguments
object Object of class inheriting from fRegress
... additional arguments for other methods
Details
1. Determine N = number of observations
2. df.model <- object$df
3. df.residual <- (N - df.model)
4. Add attributes

78 df.residual.fRegress
Value
The numeric value of the residual degrees-of-freedom extracted from object with the followingattributes:
nobs number of observations
df.model effective degrees of freedom for the model, being the trace of the idempotentlinear projection operator transforming the observations into their predictionsper the model. This includes the intercept, so the ’degrees of freedom for themodel’ for many standard purposes that compare with a model with an estimatedmean will be 1 less than this number.
Author(s)
Spencer Graves
References
Ramsay, James O., and Silverman, Bernard W. (2005), Functional Data Analysis, 2nd ed., Springer,New York. Hastie, Trevor, Tibshirani, Robert, and Friedman, Jerome (2001) The Elements of Sta-tistical Learning: Data Mining, Inference, and Prediction, Springer, New York.
See Also
fRegress df.residual
Examples
#### example from help('lm')##
ctl <- c(4.17,5.58,5.18,6.11,4.50,4.61,5.17,4.53,5.33,5.14)trt <- c(4.81,4.17,4.41,3.59,5.87,3.83,6.03,4.89,4.32,4.69)group <- gl(2,10,20, labels=c("Ctl","Trt"))weight <- c(ctl, trt)
fRegress.D9 <- fRegress(weight ~ group)dfr.D9 <- df.residual(fRegress.D9)
# Check the answer manuallylm.D9 <- lm(weight ~ group)dfr.D9l <- df.residual(lm.D9)attr(dfr.D9l, 'nobs') <- length(predict(lm.D9))attr(dfr.D9l, 'df.model') <- 2
all.equal(dfr.D9, dfr.D9l)
#### functional response with (concurrent) functional explanatory variable### *** NOT IMPLEMENTED YET FOR FUNCTIONAL RESPONSE# BUT WILL EVENTUALLY USE THE FOLLOWING EXAMPLE:

df2lambda 79
(gaittime <- as.numeric(dimnames(gait)[[1]])*20)gaitrange <- c(0,20)gaitbasis <- create.fourier.basis(gaitrange, nbasis=21)harmaccelLfd <- vec2Lfd(c(0, (2*pi/20)^2, 0), rangeval=gaitrange)gaitfd <- smooth.basisPar(gaittime, gait,
gaitbasis, Lfdobj=harmaccelLfd, lambda=1e-2)$fdhipfd <- gaitfd[,1]kneefd <- gaitfd[,2]
knee.hip.f <- fRegress(kneefd ~ hipfd)
#knee.hip.dfr <- df.residual(knee.hip.f)
# Check the answer#kh.dfr <- knee.hip.f$df ???
df2lambda Convert Degrees of Freedom to a Smoothing Parameter Value
Description
The degree of roughness of an estimated function is controlled by a smoothing parameter lambdathat directly multiplies the penalty. However, it can be difficult to interpret or choose this value, andit is often easier to determine the roughness by choosing a value that is equivalent of the degrees offreedom used by the smoothing procedure. This function converts a degrees of freedom value intoa multipler lambda.
Usage
df2lambda(argvals, basisobj, wtvec=rep(1, n), Lfdobj=0,df=nbasis)
Arguments
argvals a vector containing rgument values associated with the values to be smoothed.
basisobj a basis function object.
wtvec a vector of weights for the data to be smoothed.
Lfdobj either a nonnegative integer or a linear differential operator object.
df the degrees of freedom to be converted.
Details
The conversion requires a one-dimensional optimization and may be therefore computationally in-tensive.

80 dirs
Value
a positive smoothing parameter value lambda
See Also
lambda2df, lambda2gcv
Examples
# Smooth growth curves using a specified value of# degrees of freedom.# Set up the ages of height measurements for Berkeley dataage <- c( seq(1, 2, 0.25), seq(3, 8, 1), seq(8.5, 18, 0.5))# Range of observationsrng <- c(1,18)# Set up a B-spline basis of order 6 with knots at agesknots <- agenorder <- 6nbasis <- length(knots) + norder - 2hgtbasis <- create.bspline.basis(rng, nbasis, norder, knots)# Find the smoothing parameter equivalent to 12# degrees of freedomlambda <- df2lambda(age, hgtbasis, df=12)# Set up a functional parameter object for estimating# growth curves. The 4th derivative is penalyzed to# ensure a smooth 2nd derivative or acceleration.Lfdobj <- 4growfdPar <- fdPar(hgtbasis, Lfdobj, lambda)# Smooth the data. The data for the girls are in matrix# hgtf.hgtffd <- smooth.basis(age, growth$hgtf, growfdPar)$fd# Plot the curvesplot(hgtffd)
dirs Get subdirectories
Description
If you want only subfolders and no files, use dirs. With recursive = FALSE, dir returns bothfolders and files. With recursive = TRUE, it returns only files.
Usage
dirs(path='.', pattern=NULL, exclude=NULL, all.files=FALSE,full.names=FALSE, recursive=FALSE, ignore.case=FALSE)

dirs 81
Arguments
path, all.files, full.names, recursive, ignore.caseas for dir
pattern, excludeoptional regular expressions of filenames to include or exclude, respectively.
Details
1. mainDir <- dir(...) without recurse
2. Use file.info to restrict mainDir to only directories.
3. If !recursive, return the restricted mainDir. Else, if length(mainDir) > 0, create dirList to hold theresults of the recursion and call dirs for each component of mainDir. Then unlist and returnthe result.
Value
A character vector of the desired subdirectories.
Author(s)
Spencer Graves
See Also
dir, file.info package.dir
Examples
path2fdaM <- system.file('Matlab/fdaM', package='fda')dirs(path2fdaM)dirs(path2fdaM, full.names=TRUE)dirs(path2fdaM, recursive=TRUE)dirs(path2fdaM, exclude='^@|^private$', recursive=TRUE)
# Directories to add to Matlab path# for R.matlab and fdaR.matExt <- system.file('externals', package='R.matlab')fdaM <- dirs(path2fdaM, exclude='^@|^private$', full.names=TRUE,
recursive=TRUE)add2MatlabPath <- c(R.matExt, path2fdaM, fdaM)
82 Eigen
Eigen Eigenanalysis preserving dimnames
Description
Compute eigenvalues and vectors, assigning names to the eigenvalues and dimnames to the eigen-vectors.
Usage
Eigen(x, symmetric, only.values = FALSE, EISPACK = FALSE,valuenames )
Arguments
x a square matrix whose spectral decomposition is to be computed.
symmetric logical: If TRUE, the matrix is assumed to be symmetric (or Hermitian if com-plex) and only its lower triangle (diagonal included) is used. If ’symmetric’ isnot specified, the matrix is inspected for symmetry.
only.values if ’TRUE’, only the eigenvalues are computed and returned, otherwise botheigenvalues and eigenvectors are returned.
EISPACK logical. Should EISPACK be used (for compatibility with R < 1.7.0)?
valuenames character vector of length nrow(x) or a character string that can be extended tothat length by appening 1:nrow(x).The default depends on symmetric and whether rownames == colnames: Ifrownames == colnames and symmetric = TRUE (either specified or deter-mined by inspection), the default is "paste(’ev’, 1:nrow(x), sep=”)". Otherwise,the default is colnames(x) unless this is NULL.
Details
1. Check ’symmetric’
2. ev <- eigen(x, symmetric, only.values = FALSE, EISPACK = FALSE); see eigen for moredetails.
3. rNames = rownames(x); if this is NULL, rNames = if(symmetric) paste(’x’, 1:nrow(x), sep=”)else paste(’xcol’, 1:nrow(x)).
4. Parse ’valuenames’, assign to names(ev[[’values’]]).
5. dimnames(ev[[’vectors’]]) <- list(rNames, valuenames)
NOTE: This naming convention is fairly obvious if ’x’ is symmetric. Otherwise, dimensional anal-ysis suggests problems with almost any naming convention. To see this, consider the followingsimple example:
X < −matrix(1 : 4, 2, dimnames = list(LETTERS[1 : 2], letters[3 : 4]))

Eigen 83
c dA 1 3B 2 4
X.inv < −solve(X)
A Bc -2 1.5d 1 -0.5
One way of interpreting this is to assume that colnames are really reciprocals of the units. Thus,in this example, X[1,1] is in units of ’A/c’ and X.inv[1,1] is in units of ’c/A’. This would makeany matrix with the same row and column names potentially dimensionless. Since eigenvalues areessentially the diagonal of a diagonal matrix, this would mean that eigenvalues are dimensionless,and their names are merely placeholders.
Value
a list with components values and (if only.values = FALSE) vectors, as described in eigen.
Author(s)
Spencer Graves
See Also
eigen, svd qr chol
Examples
X <- matrix(1:4, 2, dimnames=list(LETTERS[1:2], letters[3:4]))eigen(X)Eigen(X)Eigen(X, valuenames='eigval')
Y <- matrix(1:4, 2, dimnames=list(letters[5:6], letters[5:6]))Eigen(Y)
Eigen(Y, symmetric=TRUE)# only the lower triangle is used;# the upper triangle is ignored.

84 eigen.pda
eigen.pda Stability Analysis for Principle Differential Analysis
Description
Performs a stability analysis of the result of pda.fd, returning the real and imaginary parts of theeigenfunctions associated with the linear differential operator.
Usage
eigen.pda(pdaList,plotresult=TRUE,npts=501,...)
Arguments
pdaList a list object returned by pda.fd.
plotresult should the result be plotted? Default is TRUE
npts number of points to use for plotting.
... other arguments for ’plot’.
Details
Conducts an eigen decomposition of the linear differential equation implied by the result of pda.fd.Imaginary eigenvalues indicate instantaneous oscillatory behavior. Positive real eigenvalues indi-cate exponential increase, negative real eigenvalues correspond to exponential decay. If the principledifferential analysis also included the estimation of a forcing function, the limitting stable pointsare also tracked.
Value
Returns a list with elements
argvals The evaluation points of the coefficient functions.
eigvals The corresponding eigenvalues at each time.
limvals The stable points of the system at each time.
See Also
pda.fd plot.pda.fd pda.overlay
Examples
# A pda analysis of the handwriting data
fdaarray = handwritfdatime <- seq(0, 2.3, len=1401)

eval.basis 85
# basis for coordinates
fdarange <- c(0, 2.3)breaks = seq(0,2.3,length.out=501)norder = 6fdabasis = create.bspline.basis(fdarange,norder=norder,breaks=breaks)
# parameter object for coordinates
fdaPar = fdPar(fdabasis,int2Lfd(4),1e-8)
# coordinate functions and a list tontaining them
Xfd = smooth.basis(fdatime, fdaarray[,,1], fdaPar)$fdYfd = smooth.basis(fdatime, fdaarray[,,2], fdaPar)$fd
xfdlist = list(Xfd, Yfd)
# basis and parameter object for weight functions
fdabasis2 = create.bspline.basis(fdarange,norder=norder,nbasis=51)pdaPar = fdPar(fdabasis2,1,1e-8)
pdaParlist = list(pdaPar, pdaPar)
bwtlist = list( list(pdaParlist,pdaParlist), list(pdaParlist,pdaParlist) )
# do the second order pda
pdaList = pda.fd(xfdlist, bwtlist)
# plot the results
eigres = eigen.pda(pdaList)
eval.basis Values of Basis Functions or their Derivatives
Description
A set of basis functions are evaluated at a vector of argument values. If a linear differential objectis provided, the values are the result of applying the the operator to each basis function.
Usage
eval.basis(evalarg, basisobj, Lfdobj=0)## S3 method for class 'basisfd':predict(object, newdata=NULL, Lfdobj=0, ...)

86 eval.basis
Argumentsevalarg, newdata
a vector of argument values at which the basis functiona is to be evaluated.
basisobj a basis object defining basis functions whose values are to be computed.
Lfdobj either a nonnegative integer or a linear differential. operator object.
object an object of class basisfd
... optional arguments for predict, not currently used
Details
If a linear differential operator object is supplied, the basis must be such that the highest orderderivative can be computed. If a B-spline basis is used, for example, its order must be one largerthan the highest order of derivative required.
Value
a matrix of basis function values with rows corresponding to argument values and columns to basisfunctions.
predict.basisfd is a convenience wrapper for eval.basis.
Source
Ramsay, James O., and Silverman, Bernard W. (2006), Functional Data Analysis, 2nd ed., Springer,New York.
Ramsay, James O., and Silverman, Bernard W. (2002), Applied Functional Data Analysis, Springer,New York
See Also
getbasismatrix, eval.fd, plot.basisfd
Examples
#### 1. B-splines### The simplest basis currently available:# a single step functionbspl1.1 <- create.bspline.basis(norder=1, breaks=0:1)eval.bspl1.1 <- eval.basis(seq(0, 1, .2), bspl1.1)
# The second simplest basis:# 2 step functions, [0, .5], [.5, 1]bspl1.2 <- create.bspline.basis(norder=1, breaks=c(0,.5, 1))eval.bspl1.2 <- eval.basis(seq(0, 1, .2), bspl1.2)
# Second order B-splines (degree 1: linear splines)bspl2.3 <- create.bspline.basis(norder=2, breaks=c(0,.5, 1))eval.bspl2.3 <- eval.basis(seq(0, 1, .1), bspl2.3)

eval.bifd 87
# 3 bases: order 2 = degree 1 = linear# (1) line from (0,1) down to (0.5, 0), 0 after# (2) line from (0,0) up to (0.5, 1), then down to (1,0)# (3) 0 to (0.5, 0) then up to (1,1).
#### 2. Fourier### The false Fourier series with 1 basis functionfalseFourierBasis <- create.fourier.basis(nbasis=1)eval.fFB <- eval.basis(seq(0, 1, .2), falseFourierBasis)
# Simplest real Fourier basis with 3 basis functionsfourier3 <- create.fourier.basis()eval.fourier3 <- eval.basis(seq(0, 1, .2), fourier3)
# 3 basis functions on [0, 365]fourier3.365 <- create.fourier.basis(c(0, 365))eval.F3.365 <- eval.basis(day.5, fourier3.365)
matplot(eval.F3.365, type="l")
# The next simplest Fourier basis (5 basis functions)fourier5 <- create.fourier.basis(nbasis=5)eval.F5 <- eval.basis(seq(0, 1, .1), fourier5)matplot(eval.F5, type="l")
# A more complicated exampledayrng <- c(0, 365)
nbasis <- 51norder <- 6
weatherBasis <- create.fourier.basis(dayrng, nbasis)basisMat <- eval.basis(day.5, weatherBasis)
matplot(basisMat[, 1:5], type="l")
#### 3. predict.basisfd##basisMat. <- predict(weatherBasis, day.5)
all.equal(basisMat, basisMat.)
eval.bifd Values a Two-argument Functional Data Object

88 eval.bifd
Description
A vector of argument values for the first argument s of the functional data object to be evaluated.
Usage
eval.bifd(sevalarg, tevalarg, bifd, sLfdobj=0, tLfdobj=0)
Arguments
sevalarg a vector of argument values for the first argument s of the functional data objectto be evaluated.
tevalarg a vector of argument values for the second argument t of the functional dataobject to be evaluated.
bifd a two-argument functional data object.
sLfdobj either a nonnegative integer or a linear differential operator object. If present,the derivative or the value of applying the operator to the object as a function ofthe first argument s is evaluated rather than the functions themselves.
tLfdobj either a nonnegative integer or a linear differential operator object. If present,the derivative or the value of applying the operator to the object as a function ofthe second argument t is evaluated rather than the functions themselves.
Value
an array of 2, 3, or 4 dimensions containing the function values. The first dimension correspondsto the argument values in sevalarg, the second to argument values in tevalarg, the third if present toreplications, and the fourth if present to functions.
Examples
daybasis <- create.fourier.basis(c(0,365), 365)harmLcoef <- c(0,(2*pi/365)^2,0)harmLfd <- vec2Lfd(harmLcoef, c(0,365))templambda <- 1.0tempfdPar <- fdPar(daybasis, harmLfd, lambda=1)tempfd <- smooth.basis(day.5,
CanadianWeather$dailyAv[,,"Temperature.C"], tempfdPar)$fd# define the variance-covariance bivariate fd objecttempvarbifd <- var.fd(tempfd)# evaluate the variance-covariance surface and plotweektime <- seq(0,365,len=53)tempvarmat <- eval.bifd(weektime,weektime,tempvarbifd)# make a perspective plot of the variance functionpersp(tempvarmat)

eval.fd 89
eval.fd Values of a Functional Data Object
Description
Evaluate a functional data object at specified argument values, or evaluate a derivative or the resultof applying a linear differential operator to the functional object.
Usage
eval.fd(evalarg, fdobj, Lfdobj=0)## S3 method for class 'fd':predict(object, newdata=NULL, Lfdobj=0, ...)## S3 method for class 'fdPar':predict(object, newdata=NULL, Lfdobj=0, ...)## S3 method for class 'fdSmooth':predict(object, newdata=NULL, Lfdobj=0, ...)## S3 method for class 'fdSmooth':fitted(object, ...)## S3 method for class 'fdSmooth':residuals(object, ...)
Arguments
evalarg, newdataa vector of argument values at which the functional data object is to be evaluated.
fdobj a functional data object to be evaluated.
Lfdobj either a nonnegative integer or a linear differential operator object. If present,the derivative or the value of applying the operator is evaluated rather than thefunctions themselves.
object an object of class fd
... optional arguments for predict, not currently used
Details
eval.fd evaluates Lfdobj of fdobj at evalarg. predict.fd is a convenience wrapperfor eval.fd. If newdata is NULL and fdobj[[’basis’]][[’type’]] is bspline,newdata = unique(knots(fdojb,interior=FALSE)); otherwise, newdata = fdobj[[’basis’]][[’rangeval’]].
predict.fdSmooth, fitted.fdSmooth and residuals.fdSmooth are other wrapperfor eval.fd.
Value
an array of 2 or 3 dimensions containing the function values. The first dimension corresponds tothe argument values in evalarg, the second to replications, and the third if present to functions.

90 eval.fd
Author(s)
Soren Hosgaard wrote an initial version of predict.fdSmooth, fitted.fdSmooth, andresiduals.fdSmooth.
See Also
getbasismatrix, eval.bifd, eval.penalty, eval.monfd, eval.posfd
Examples
#### eval.fd### set up the fourier basisdaybasis <- create.fourier.basis(c(0, 365), nbasis=65)# Make temperature fd object# Temperature data are in 12 by 365 matrix tempav# See analyses of weather data.# Set up sampling points at mid days# Convert the data to a functional data objecttempfd <- data2fd(CanadianWeather$dailyAv[,,"Temperature.C"],
day.5, daybasis)# set up the harmonic acceleration operatorLbasis <- create.constant.basis(c(0, 365))Lcoef <- matrix(c(0,(2*pi/365)^2,0),1,3)bfdobj <- fd(Lcoef,Lbasis)bwtlist <- fd2list(bfdobj)harmaccelLfd <- Lfd(3, bwtlist)# evaluate the value of the harmonic acceleration# operator at the sampling pointsLtempmat <- eval.fd(day.5, tempfd, harmaccelLfd)# Plot the values of this operatormatplot(day.5, Ltempmat, type="l")
#### predict.fd##predict(tempfd) # end points only at 35 locationsstr(predict(tempfd, day.5)) # 365 x 35 matrixstr(predict(tempfd, day.5, harmaccelLfd))
# cublic splie with knots at 0, .5, 1bspl3 <- create.bspline.basis(c(0, .5, 1))plot(bspl3) # 5 basesfd.bspl3 <- fd(c(0, 0, 1, 0, 0), bspl3)pred3 <- predict(fd.bspl3)
pred3. <- matrix(c(0, .5, 0), 3)dimnames(pred3.) <- list(NULL, 'reps 1')
all.equal(pred3, pred3.)

eval.monfd 91
pred.2 <- predict(fd.bspl3, c(.2, .8))
pred.2. <- matrix(.176, 2, 1)dimnames(pred.2.) <- list(NULL, 'reps 1')
all.equal(pred.2, pred.2.)
#### predict.fdSmooth##lipSm9 <- smooth.basisPar(liptime, lip, lambda=1e-9)plot(lipSm9)
pred.lipSm9 <- predict(lipSm9)
all.equal(pred.lipSm9, fitted(lipSm9))
resid.lipSm9 <- resid(lipSm9)
all.equal(resid.lipSm9, residuals(lipSm9))
eval.monfd Values of a Monotone Functional Data Object
Description
Evaluate a monotone functional data object at specified argument values, or evaluate a derivative ofthe functional object.
Usage
eval.monfd(evalarg, Wfdobj, Lfdobj=int2Lfd(0))## S3 method for class 'monfd':predict(object, newdata=NULL, Lfdobj=0, ...)## S3 method for class 'monfd':fitted(object, ...)## S3 method for class 'monfd':residuals(object, ...)
Arguments
evalarg, newdataa vector of argument values at which the functional data object is to be evaluated.

92 eval.monfd
Wfdobj an object of class fd that defines the monotone function to be evaluated. Onlyunivariate functions are permitted.
Lfdobj a nonnegative integer specifying a derivative to be evaluated. At this time ofwriting, permissible derivative values are 0, 1, 2, or 3. A linear differentialoperator is not allowed.
object an object of class monfd that defines the monotone function to be evaluated.Only univariate functions are permitted.
... optional arguments required by predict; not currently used.
Details
A monotone function data object h(t) is defined by h(t) = [Dˆ{−1}expWfdobj](t). In thisequation, the operator Dˆ{−1} means taking the indefinite integral of the function to which itapplies. Note that this equation implies that the monotone function has a value of zero at the lowerlimit of the arguments. To actually fit monotone data, it will usually be necessary to estimate anintercept and a regression coefficient to be applied to h(t), usually with the least squares regressionfunction lsfit. The function Wfdobj that defines the monotone function is usually estimated bymonotone smoothing function smooth.monotone.
eval.monfd only computes the standardized monotone form. predict.monfd computes thescaled version using with(object, beta[1] + beta[2]*eval.monfd(...)) if Lf-dobj = 0 or beta[2]*eval.monfd(...) if Lfdobj > 0.
Value
a matrix containing the monotone function values. The first dimension corresponds to the argumentvalues in evalarg and the second to replications.
See Also
eval.fd, smooth.monotone eval.posfd
Examples
# Estimate the acceleration functions for growth curves# See the analyses of the growth data.# Set up the ages of height measurements for Berkeley dataage <- c( seq(1, 2, 0.25), seq(3, 8, 1), seq(8.5, 18, 0.5))# Range of observationsrng <- c(1,18)# First set up a basis for monotone smooth# We use b-spline basis functions of order 6# Knots are positioned at the ages of observation.norder <- 6nage <- 31nbasis <- nage + norder - 2wbasis <- create.bspline.basis(rng, nbasis, norder, age)# starting values for coefficientcvec0 <- matrix(0,nbasis,1)Wfd0 <- fd(cvec0, wbasis)

eval.penalty 93
# set up functional parameter objectLfdobj <- 3 # penalize curvature of accelerationlambda <- 10^(-0.5) # smoothing parametergrowfdPar <- fdPar(Wfd0, Lfdobj, lambda)# Set up wgt vectorwgt <- rep(1,nage)# Smooth the data for the first girlhgt1 = growth$hgtf[,1]result <- smooth.monotone(age, hgt1, growfdPar, wgt)# Extract the functional data object and regression# coefficientsWfd <- result$Wfdobjbeta <- result$beta# Evaluate the fitted height curve over a fine meshagefine <- seq(1,18,len=101)hgtfine <- beta[1] + beta[2]*eval.monfd(agefine, Wfd)# Plot the data and the curveplot(age, hgt1, type="p")lines(agefine, hgtfine)# Evaluate the acceleration curveaccfine <- beta[2]*eval.monfd(agefine, Wfd, 2)# Plot the acceleration curveplot(agefine, accfine, type="l")lines(c(1,18),c(0,0),lty=4)
#### using predict.monfd##hgtfit <- with(result, beta[1]+beta[2]*eval.monfd(argvals, Wfdobj))hgtfit. <- fitted(result)
all.equal(hgtfit, hgtfit.)
accfine. <- predict(result, agefine, Lfdobj=2)
all.equal(accfine, accfine.)
growthResid <- resid(result)
all.equal(growthResid, with(result, y-hgtfit.))
eval.penalty Evaluate a Basis Penalty Matrix

94 eval.penalty
Description
A basis roughness penalty matrix is the matrix containing the possible inner products of pairs ofbasis functions. These inner products are typically defined in terms of the value of a derivativeor of a linear differential operator applied to the basis function. The basis penalty matrix playsan important role in the computation of functions whose roughness is controlled by a roughnesspenalty.
Usage
eval.penalty(basisobj, Lfdobj=int2Lfd(0), rng=rangeval)
Arguments
basisobj a basis object.
Lfdobj either a nonnegative integer defining an order of a derivative or a linear differ-ential operator.
rng a vector of length 2 defining a restricted range. Optionally, the inner productscan be computed over a range of argument values that lies within the intervalcovered by the basis function definition.
Details
The inner product can be computed exactly for many types of bases if m is an integer. Theseinclude B-spline, fourier, exponential, monomial, polynomial and power bases. In other cases,and for noninteger operators, the inner products are computed by an iterative numerical integrationmethod called Richard extrapolation using the trapezoidal rule.
If the penalty matrix must be evaluated repeatedly, computation can be greatly speeded up by avoid-ing the use of this function, and instead using quadrature points and weights defined by Simpson’srule.
Value
a square symmetric matrix whose order is equal to the number of basis functions defined by thebasis function object basisobj . If Lfdobj is m or a linear differential operator of order m,the rank of the matrix should be at least approximately equal to its order minus m.
See Also
getbasispenalty, eval.basis,

eval.posfd 95
eval.posfd Evaluate a Positive Functional Data Object
Description
Evaluate a positive functional data object at specified argument values, or evaluate a derivative ofthe functional object.
Usage
eval.posfd(evalarg, Wfdobj, Lfdobj=int2Lfd(0))## S3 method for class 'posfd':predict(object, newdata=NULL, Lfdobj=0, ...)## S3 method for class 'posfd':fitted(object, ...)## S3 method for class 'posfd':residuals(object, ...)
Arguments
evalarg, newdataa vector of argument values at which the functional data object is to be evaluated.
Wfdobj a functional data object that defines the positive function to be evaluated. Onlyunivariate functions are permitted.
Lfdobj a nonnegative integer specifying a derivative to be evaluated. At this time ofwriting, permissible derivative values are 0, 1 or 2. A linear differential operatoris not allowed.
object an object of class posfd that defines the positive function to be evaluated. Onlyunivariate functions are permitted.
... optional arguments required by predict; not currently used.
Details
A positive function data object h(t) is defined by h(t) = [expWfd](t). The function Wfdobj thatdefines the positive function is usually estimated by positive smoothing function smooth.pos
Value
a matrix containing the positive function values. The first dimension corresponds to the argumentvalues in evalarg and the second to replications.
See Also
eval.fd, eval.monfd

96 evaldiag.bifd
Examples
harmaccelLfd365 <- vec2Lfd(c(0,(2*pi/365)^2,0), c(0, 365))smallbasis <- create.fourier.basis(c(0, 365), 65)index <- (1:35)[CanadianWeather$place == "Vancouver"]VanPrec <- CanadianWeather$dailyAv[,index, "Precipitation.mm"]lambda <- 1e4dayfdPar <- fdPar(smallbasis, harmaccelLfd365, lambda)Van.pos <- smooth.pos(day.5, VanPrec, dayfdPar)
VanPrecposvec <- eval.posfd(day.5, Van.pos$Wfdobj)
VanPrecpos <- predict(Van.pos, day.5)
all.equal(VanPrecposvec, VanPrecpos)
VanPrecFit <- fitted(Van.pos)VanPrecRes <- resid(Van.pos)
all.equal(VanPrecRes, Van.pos$y-VanPrecFit)
evaldiag.bifd Evaluate the Diagonal of a Bivariate Functional Data Object
Description
Bivariate function data objects are functions of two arguments, f(s, t). It can be useful to evaluatethe function for argument values satisying s = t, such as evaluating the univariate variance func-tion given the bivariate function that defines the variance-covariance function or surface. A lineardifferential operator can be applied to function f(s, t) considered as a univariate function of eitherobject holding the other object fixed.
Usage
evaldiag.bifd(evalarg, bifdobj, sLfd=int2Lfd(0),tLfd=int2Lfd(0))
Arguments
evalarg a vector of values of s = t.
bifdobj a bivariate functional data object of the bifd class.
sLfd either a nonnegative integer or a linear differential operator object.
tLfd either a nonnegative integer or a linear differential operator object.

expect.phi 97
Value
a vector or matrix of diagonal function values.
See Also
var.fd, eval.bifd
expect.phi Expectation of basis functions
Description
Computes expectations of basis functions with respect to a density by numerical integration usingRomberg integration
Usage
normint.phi(basisobj, cvec, JMAX=15, EPS=1e-7)normden.phi(basisobj, cvec, JMAX=15, EPS=1e-7)expect.phi(basisobj, cvec, nderiv=0, rng=rangeval,
JMAX=15, EPS=1e-7)expectden.phi(basisobj, cvec, Cval=1, nderiv=0, rng=rangeval,
JMAX=15, EPS=1e-7)expectden.phiphit(basisobj, cvec, Cval=1, nderiv1=0,
nderiv2=0, rng=rangeval, JMAX=15, EPS=1e-7)
Arguments
basisobj a basis function objectcvec coefficient vector defining density, of length NBASISCval normalizing constant defining densitynderiv, nderiv1, nderiv2
order of derivative required for basis function expectationrng a vector of length 2 giving the interval over which the integration is to take placeJMAX maximum number of allowable iterationsEPS convergence criterion for relative stop
Details
normint.phi computes integrals of p(x) = exp phi’(x)
normdel.phi computes integrals of p(x) = exp phi"(x)
expect.phi computes expectations of basis functions with respect to intensity p(x) <- exp t(c)*phi(x)
expectden.phi computes expectations of basis functions with respect to density
p(x) <- exp(t(c)*phi(x))/Cval
expectden.phiphit computes expectations of cross product of basis functions with respect to density
p(x) <- exp(t(c)*phi(x))/Cval

98 expon
Value
A vector SS of length NBASIS of integrals of functions.
See Also
plot.basisfd,
expon Exponential Basis Function Values
Description
Evaluates a set of exponential basis functions, or a derivative of these functions, at a set of argu-ments.
Usage
expon(x, ratevec=1, nderiv=0)
Arguments
x a vector of values at which the basis functions are to be evaluated.
ratevec a vector of rate or time constants defining the exponential functions. That is, ifa is the value of an element of this vector, then the corresponding basis functionis exp(at). The number of basis functions is equal to the length of ratevec.
nderiv a nonnegative integer specifying an order of derivative to be computed. Thedefault is 0, or the basis function value.
Details
There are no restrictions on the rate constants.
Value
a matrix of basis function values with rows corresponding to argument values and columns to basisfunctions.
See Also
exponpen

exponpen 99
exponpen Exponential Penalty Matrix
Description
Computes the matrix defining the roughness penalty for functions expressed in terms of an expo-nential basis.
Usage
exponpen(basisobj, Lfdobj=int2Lfd(2))
Arguments
basisobj an exponential basis object.
Lfdobj either a nonnegative integer or a linear differential operator object.
Details
A roughness penalty for a function x(t) is defined by integrating the square of either the derivativeof x(t) or, more generally, the result of applying a linear differential operator L to it. The mostcommon roughness penalty is the integral of the square of the second derivative, and this is thedefault. To apply this roughness penalty, the matrix of inner products of the basis functions (possiblyafter applying the linear differential operator to them) defining this function is necessary. Thisfunction just calls the roughness penalty evaluation function specific to the basis involved.
Value
a symmetric matrix of order equal to the number of basis functions defined by the exponential basisobject. Each element is the inner product of two exponential basis functions after applying thederivative or linear differential operator defined by Lfdobj.
See Also
expon, eval.penalty, getbasispenalty
Examples
# set up an exponential basis with 3 basis functionsratevec <- c(0, -1, -5)basisobj <- create.exponential.basis(c(0,1),3,ratevec)# compute the 3 by 3 matrix of inner products of# second derivativespenmat <- exponpen(basisobj)

100 fdaMatlabPath
fdaMatlabPath Add ’fdaM’ to the Matlab path
Description
Write a sequence of Matlab commands to fdaMatlabPath.m in the working directory contain-ing commands to add fdaM to the path for Matlab.
Usage
fdaMatlabPath(R.matlab)
Arguments
R.matlab logical: If TRUE, include ’~R/library/R.matlab/externals’ in the path. If(missing(R.matlab))include ’~R/library/R.matlab/externals’ only if R.matlab is installed.
Details
USAGE If your Matlab installation does NOT have a startup.m file, it might be wise to copyfdaMatlabPath.m into a directory where Matlab would look for startup.m, then re-name it to startup.m.If you have a startup.m, you could add the contents of fdaMatlabPath.m to startup.m.Alternatively, you can copy fdaMatlabPath.m into the directory containing startup.mand add the following to the end of startup.m:
if exist(’fdaMatlabPath’)fdaMatlabPath ;
end
ALGORITHM 1. path2fdaM = path to the Matlab/fdaM subdiretory of the fda installation directory.
2. Find all subdirectories of path2fdaM except those beginning in ’@’ or including ’private’.
3. if(requires(R.matlab)) add the path to MatlabServer.m to dirs2add
4. d2a <- paste("addpath(’", dirs2add, "’);", sep=”)
5. writeLines(d2a, ’fdaMatlabPath.m’)
6. if(exists(startupFile)) append d2a to it
Value
A character vector of Matlab addpath commands is returned invisibly.
Author(s)
Spencer Graves with help from Jerome Besnard

fdlabels 101
References
Matlab documentation for addpath and startup.m.
See Also
Matlab, dirs
Examples
# Modify the Matlab startup.m only when you really want to,# typically once per installation ... certaintly not# every time we test this package.fdaMatlabPath()
fdlabels Extract plot labels and names for replicates and variables
Description
Extract plot labels and, if available, names for each replicate and variable
Usage
fdlabels(fdnames, nrep, nvar)
Arguments
fdnames a list of lenght 3 with xlabel, casenames, and ylabels.
nrep integer number of cases or observations
nvar integer number of variables
Details
xlabel <- if(length(fdnames[[1]])>1) names(fdnames)[1] else fdnames[[1]]
ylabel <- if(length(fdnames[[3]])>1) names(fdnames)[3] else fdnames[[3]]
casenames <- if(length(fdnames[[2]])== nrep)fdnames[[2]] else NULL
varnames <- if(length(fdnames[[3]])==nvar)fdnames[[3]] else NULL
Value
A list of xlabel, ylabel, casenames, and varnames
Author(s)
Jim Ramsay

102 fdPar
See Also
plot.fd
fdPar Define a Functional Parameter Object
Description
Functional parameter objects are used as arguments to functions that estimate functional parameters,such as smoothing functions like smooth.basis. A functional parameter object is a functionaldata object with additional slots specifying a roughness penalty, a smoothing parameter and whetheror not the functional parameter is to be estimated or held fixed. Functional parameter objects areused as arguments to functions that estimate functional parameters.
Usage
fdPar(fdobj=NULL, Lfdobj=NULL, lambda=0, estimate=TRUE,penmat=NULL)
Arguments
fdobj a functional data object, functional basis object, a functional parameter object ora matrix. If it a matrix, it is replaced by fd(fdobj). If class(fdobj) == ’basisfd’,it is converted to an object of class fd with a coefficient matrix consisting of asingle column of zeros.
Lfdobj either a nonnegative integer or a linear differential operator object.If NULL, Lfdobj depends on fdobj[[’basis’]][[’type’]]:
bspline Lfdobj <- int2Lfd(max(0, norder-2)), where norder = norder(fdobj).fourier Lfdobj = a harmonic acceleration operator:
Lfdobj <- vec2Lfd(c(0,(2*pi/diff(rng))^2,0), rng)where rng = fdobj[[’basis’]][[’rangeval’]].
anything else Lfdobj <- int2Lfd(0)
lambda a nonnegative real number specifying the amount of smoothing to be applied tothe estimated functional parameter.
estimate not currently used.
penmat a roughness penalty matrix. Including this can eliminate the need to computethis matrix over and over again in some types of calculations.
Details
Functional parameters are often needed to specify initial values for iteratively refined estimates, asis the case in functions register.fd and smooth.monotone.
Often a list of functional parameters must be supplied to a function as an argument, and it maybe that some of these parameters are considered known and must remain fixed during the analysis.This is the case for functions fRegress and pda.fd, for example.

fdPar 103
Value
a functional parameter object (i.e., an object of class fdPar), which is a list with the followingcomponents:
fd a functional data object (i.e., with class fd)
Lfd a linear differential operator object (i.e., with class Lfd)
lambda a nonnegative real number
estimate not currently used
penmat either NULL or a square, symmetric matrix with penmat[i, j] = integral overfd[[’basis’]][[’rangeval’]] of basis[i]*basis[j]
Source
Ramsay, James O., and Silverman, Bernard W. (2006), Functional Data Analysis, 2nd ed., Springer,New York.
Ramsay, James O., and Silverman, Bernard W. (2002), Applied Functional Data Analysis, Springer,New York
See Also
cca.fd, density.fd, fRegress, intensity.fd, pca.fd, smooth.fdPar, smooth.basis,smooth.basisPar, smooth.monotone, \line{int2Lfd}
Examples
#### Simple example### set up range for densityrangeval <- c(-3,3)# set up some standard normal datax <- rnorm(50)# make sure values within the rangex[x < -3] <- -2.99x[x > 3] <- 2.99# set up basis for W(x)basisobj <- create.bspline.basis(rangeval, 11)# set up initial value for WfdobjWfd0 <- fd(matrix(0,11,1), basisobj)WfdParobj <- fdPar(Wfd0)
WfdP3 <- fdPar(seq(-3, 3, length=11))
#### smooth the Canadian daily temperature data### set up the fourier basisnbasis <- 365dayrange <- c(0,365)
104 file.copy2
daybasis <- create.fourier.basis(dayrange, nbasis)dayperiod <- 365harmaccelLfd <- vec2Lfd(c(0,(2*pi/365)^2,0), dayrange)# Make temperature fd object# Temperature data are in 12 by 365 matrix tempav# See analyses of weather data.# Set up sampling points at mid daysdaytime <- (1:365)-0.5# Convert the data to a functional data objectdaybasis65 <- create.fourier.basis(dayrange, nbasis, dayperiod)templambda <- 1e1tempfdPar <- fdPar(fdobj=daybasis65, Lfdobj=harmaccelLfd,
lambda=templambda)
#FIXME#tempfd <- smooth.basis(CanadianWeather$tempav, daytime, tempfdPar)# Set up the harmonic acceleration operatorLbasis <- create.constant.basis(dayrange);Lcoef <- matrix(c(0,(2*pi/365)^2,0),1,3)bfdobj <- fd(Lcoef,Lbasis)bwtlist <- fd2list(bfdobj)harmaccelLfd <- Lfd(3, bwtlist)# Define the functional parameter object for# smoothing the temperature datalambda <- 0.01 # minimum GCV estimate#tempPar <- fdPar(daybasis365, harmaccelLfd, lambda)# smooth the data#tempfd <- smooth.basis(daytime, CanadialWeather$tempav, tempPar)$fd# plot the temperature curves#plot(tempfd)
file.copy2 Copy a file with a default ’to’ name
Description
Copy a file appending a number to make the to name unique, with default to = from.
Usage
file.copy2(from, to)
Arguments
from character: name of a file to be copied
to character: name of copy. Default = from with an integer appended to the name.

fourier 105
Details
1. length(from) != 1: Error: Only one file can be copied.
2. file.exists(from)? If no, If no, return FALSE.
3. if(missing(to))to <- from; else if(length(to)!=1) error.
4. file.exists(to)? If yes, Dir <- dir(dirname(to)), find all Dir starting with to, and find the smallestinteger to append to make a unique to name.
5. file.copy(from, to)
6. Return TRUE.
Value
logical: TRUE (with a name = name of the file created); FALSE if no file created.
Author(s)
Spencer Graves
See Also
file.copy,
Examples
## Not run:file.copy2('startup.m')# Used by 'fdaMatlabPath' so an existing 'startup.m' is not destroyed## End(Not run)
fourier Fourier Basis Function Values
Description
Evaluates a set of Fourier basis functions, or a derivative of these functions, at a set of arguments.
Usage
fourier(x, nbasis=n, period=span, nderiv=0)

106 fourierpen
Arguments
x a vector of argument values at which the Fourier basis functions are to be eval-uated.
nbasis the number of basis functions in the Fourier basis. The first basis function is theconstant function, followed by sets of sine/cosine pairs. Normally the numberof basis functions will be an odd. The default number is the number of argumentvalues.
period the width of an interval over which all sine/cosine basis functions repeat them-selves. The default is the difference between the largest and smallest argumentvalues.
nderiv the derivative to be evaluated. The derivative must not exceed the order. Thedefault derivative is 0, meaning that the basis functions themselves are evaluated.
Value
a matrix of function values. The number of rows equals the number of arguments, and the numberof columns equals the number of basis functions.
See Also
fourierpen
Examples
# set up a set of 11 argument valuesx <- seq(0,1,0.1)names(x) <- paste("x", 0:10, sep="")# compute values for five Fourier basis functions# with the default period (1) and derivative (0)(basismat <- fourier(x, 5))
# Create a false Fourier basis, i.e., nbasis = 1# = a constant functionfourier(x, 1)
fourierpen Fourier Penalty Matrix
Description
Computes the matrix defining the roughness penalty for functions expressed in terms of a Fourierbasis.
Usage
fourierpen(basisobj, Lfdobj=int2Lfd(2))

Fperm.fd 107
Arguments
basisobj a Fourier basis object.
Lfdobj either a nonnegative integer or a linear differential operator object.
Details
A roughness penalty for a function x(t) is defined by integrating the square of either the derivativeof x(t) or, more generally, the result of applying a linear differential operator L to it. The mostcommon roughness penalty is the integral of the square of the second derivative, and this is thedefault. To apply this roughness penalty, the matrix of inner products of the basis functions (possiblyafter applying the linear differential operator to them) defining this function is necessary. Thisfunction just calls the roughness penalty evaluation function specific to the basis involved.
Value
a symmetric matrix of order equal to the number of basis functions defined by the Fourier basisobject. Each element is the inner product of two Fourier basis functions after applying the derivativeor linear differential operator defined by Lfdobj.
See Also
fourier, eval.penalty, getbasispenalty
Examples
# set up a Fourier basis with 13 basis functions# and and period 1.0.basisobj <- create.fourier.basis(c(0,1),13)# compute the 13 by 13 matrix of inner products# of second derivativespenmat <- fourierpen(basisobj)
Fperm.fd Permutation F-test for functional linear regression.
Description
Fperm.fd creates a null distribution for a test of no effect in functional linear regression. It makesgeneric use of fRegress and permutes the yfdPar input.
Usage
Fperm.fd(yfdPar, xfdlist, betalist, wt=NULL, nperm=200,argvals=NULL, q=0.05, plotres=TRUE, ...)

108 Fperm.fd
Arguments
yfdPar the dependent variable object. It may be an object of three possible classes:
vector if the dependent variable is scalar.fd a functional data object if the dependent variable is functional.
fdPar a functional parameter object if the dependent variable is functional, and ifit is necessary to smooth the prediction of the dependent variable.
xfdlist a list of length equal to the number of independent variables. Members of thislist are the independent variables. They be objects of either of these two classes:
• a vector if the independent dependent variable is scalar.• a functional data object if the dependent variable is functional.
In either case, the object must have the same number of replications as the de-pendent variable object. That is, if it is a scalar, it must be of the same length asthe dependent variable, and if it is functional, it must have the same number ofreplications as the dependent variable.
betalist a list of length equal to the number of independent variables. Members of thislist define the regression functions to be estimated. They are functional param-eter objects. Note that even if corresponding independent variable is scalar, itsregression coefficient will be functional if the dependent variable is functional.Each of these functional parameter objects defines a single functional data ob-ject, that is, with only one replication.
wt weights for weighted least squares, defaults to all 1.
nperm number of permutations to use in creating the null distribution.
argvals If yfdPar is a fd object, the points at which to evaluate the point-wise F-statistic.
q Critical upper-tail quantile of the null distribution to compare to the observedF-statistic.
plotres Argument to plot a visual display of the null distribution displaying the qthquantile and observed F-statistic.
... Additional plotting arguments that can be used with plot.
Details
An F-statistic is calculated as the ratio of residual variance to predicted variance. The observedF-statistic is returned along with the permutation distribution.
If yfdPar is a fd object, the maximal value of the pointwise F-statistic is calculated. The point-wise F-statistics are also returned.
The default of setting q = 0.95 is, by now, fairly standard. The default nperm = 200 may besmall, depending on the amount of computing time available.
If argvals is not specified and yfdPar is a fd object, it defaults to 101 equally-spaced pointson the range of yfdPar.

Fperm.fd 109
Value
A list with the following components:
pval the observed p-value of the permutation test.
qval the qth quantile of the null distribution.
Fobs the observed maximal F-statistic.
Fnull a vector of length nperm giving the observed values of the permutation distri-bution.
Fvals the pointwise values of the observed F-statistic.
Fnullvals the pointwise values of of the permutation observations.
pvals.pts pointwise p-values of the F-statistic.
qvals.pts pointwise qth quantiles of the null distribution
fRegressList the result of fRegress on the observed data
argvals argument values for evaluating the F-statistic if yfdPar is a functional dataobject.
Side Effects
a plot of the functional observations
Source
Ramsay, James O., and Silverman, Bernard W. (2006), Functional Data Analysis, 2nd ed., Springer,New York.
See Also
fRegress Fstat.fd
Examples
#### 1. yfdPar = vector##annualprec <- log10(apply(
CanadianWeather$dailyAv[,,"Precipitation.mm"], 2,sum))
# set up a smaller basis using only 65 Fourier basis functions# to save some computation time
smallnbasis <- 65smallbasis <- create.fourier.basis(c(0, 365), smallnbasis)tempfd <- smooth.basis(day.5, CanadianWeather$dailyAv[,,"Temperature.C"],
smallbasis)$fdconstantfd <- fd(matrix(1,1,35), create.constant.basis(c(0, 365)))
xfdlist <- vector("list",2)xfdlist[[1]] <- constantfd

110 Fperm.fd
xfdlist[[2]] <- tempfd[1:35]
betalist <- vector("list",2)# set up the first regression function as a constantbetabasis1 <- create.constant.basis(c(0, 365))betafd1 <- fd(0, betabasis1)betafdPar1 <- fdPar(betafd1)betalist[[1]] <- betafdPar1
nbetabasis <- 35betabasis2 <- create.fourier.basis(c(0, 365), nbetabasis)betafd2 <- fd(matrix(0,nbetabasis,1), betabasis2)
lambda <- 10^12.5harmaccelLfd365 <- vec2Lfd(c(0,(2*pi/365)^2,0), c(0, 365))betafdPar2 <- fdPar(betafd2, harmaccelLfd365, lambda)betalist[[2]] <- betafdPar2
F.res2 = Fperm.fd(annualprec, xfdlist, betalist)
#### 2. yfdpar = Functional data object (class fd)### The very simplest example is the equivalent of the permutation# t-test on the growth data.
# First set up a basis system to hold the smooths
Knots <- growth$agenorder <- 6nbasis <- length(Knots) + norder - 2hgtbasis <- create.bspline.basis(range(Knots), nbasis, norder, Knots)
# Now smooth with a fourth-derivative penalty and a very small smoothing# parameter
Lfdobj <- 4lambda <- 1e-2growfdPar <- fdPar(hgtbasis, Lfdobj, lambda)
hgtfd <- smooth.basis(growth$age,cbind(growth$hgtm,growth$hgtf),growfdPar)$fd
# Now set up factors for fRegress:
cbasis = create.constant.basis(range(Knots))
maleind = c(rep(1,ncol(growth$hgtm)),rep(0,ncol(growth$hgtf)))
constfd = fd( matrix(1,1,length(maleind)),cbasis)maleindfd = fd( matrix(maleind,1,length(maleind)),cbasis)
xfdlist = list(constfd,maleindfd)
fRegress 111
# The fdPar object for the coefficients and call Fperm.fd
betalist = list(fdPar(hgtbasis,2,1e-6),fdPar(hgtbasis,2,1e-6))
Fres = Fperm.fd(hgtfd,xfdlist,betalist)
fRegress Functional Regression Analysis
Description
This function carries out a functional regression analysis, where either the dependent variable orone or more independent variables are functional. Non-functional variables may be used on eitherside of the equation. In a simple problem where there is a single scalar independent covariate withvalues zi, i = 1, . . . , N and a single functional covariate with values xi(t), the two versions of themodel fit by fRegress are the scalar dependent variable model
yi = β1zi +∫xi(t)β2(t) dt+ ei
and the concurrent functional dependent variable model
yi(t) = β1(t)zi + β2(t)xi(t) + ei(t).
In these models, the final term ei or ei(t) is a residual, lack of fit or error term.
In the concurrent functional linear model for a functional dependent variable, all functional variablesare all evaluated at a common time or argument value t. That is, the fit is defined in terms of thebehavior of all variables at a fixed time, or in terms of "now" behavior.
All regression coefficient functions βj(t) are considered to be functional. In the case of a scalardependent variable, the regression coefficient for a scalar covariate is converted to a functional vari-able with a constant basis. All regression coefficient functions can be forced to be smooth throughthe use of roughness penalties, and consequently are specified in the argument list as functionalparameter objects.
Usage
fRegress(y, ...)## S3 method for class 'formula':fRegress(y, data=NULL, betalist=NULL, wt=NULL,
y2cMap=NULL, SigmaE=NULL,method=c('fRegress', 'model'), sep='.', ...)
## S3 method for class 'character':fRegress(y, data=NULL, betalist=NULL, wt=NULL,
y2cMap=NULL, SigmaE=NULL,

112 fRegress
method=c('fRegress', 'model'), sep='.', ...)## S3 method for class 'fd':fRegress(y, xfdlist, betalist, wt=NULL,
y2cMap=NULL, SigmaE=NULL, ...)## S3 method for class 'fdPar':fRegress(y, xfdlist, betalist, wt=NULL,
y2cMap=NULL, SigmaE=NULL, ...)## S3 method for class 'numeric':fRegress(y, xfdlist, betalist, wt=NULL,
y2cMap=NULL, SigmaE=NULL, ...)
Arguments
y the dependent variable object. It may be an object of five possible classes:
character or formula a formula object or a character object that can be coerced into aformula providing a symbolic description of the model to be fitted satis-fying the following rules:The left hand side, formula y, must be either a numeric vector or aunivariate object of class fd or fdPar. If the former, it is replaced byfdPar(y, ...).All objects named on the right hand side must be either numeric or fd(functional data) or fdPar. The number of replications of fd or fdParobject(s) must match each other and the number of observations of numericobjects named, as well as the number of replications of the dependentvariable object. The right hand side of this formula is translated intoxfdlist, then passed to another method for fitting (unless method =’model’). Multivariate independent variables are allowed in a formulaand are split into univariate independent variables in the resulting xfdlist.Similarly, categorical independent variables with k levels are translated intok-1 contrasts in xfdlist. Any smoothing information is passed to thecorresponding component of betalist.
scalar a vector if the dependent variable is scalar.fd a functional data object if the dependent variable is functional. A y of this
class is replaced by fdPar(y, ...) and passed to fRegress.fdPar.fdPar a functional parameter object if the dependent variable is functional, and if
it is desired to smooth the prediction of the dependent variable.
data an optional list or data.frame containing names of objects identified inthe formula or character y.
xfdlist a list of length equal to the number of independent variables (including anyintercept). Members of this list are the independent variables. They can beobjects of either of these two classes:
scalar a numeric vector if the independent variable is scalar.fd a (univariate) functional data object.
In either case, the object must have the same number of replications as the de-pendent variable object. That is, if it is a scalar, it must be of the same length asthe dependent variable, and if it is functional, it must have the same number of

fRegress 113
replications as the dependent variable. (Only univariate independent variablesare currently allowed in xfdlist.)
betalist For the fd, fdPar, and numericmethods, betalistmust be a list of lengthequal to length(xfdlist). Members of this list are functional parameterobjects (class fdPar) defining the regression functions to be estimated. Evenif a corresponding independent variable is scalar, its regression coefficient mustbe functional if the dependent variable is functional. (If the dependent variableis a scalar, the coefficients of scalar independent variables, including the inter-cept, must be constants, but the coefficients of functional independent variablesmust be functional.) Each of these functional parameter objects defines a singlefunctional data object, that is, with only one replication.For the formula and charactermethods, betalist can be either a list,as for the other methods, or NULL, in which case a list is created. If betalistis created, it will use the bases from the corresponding component of xfdlistif it is function or from the response variable. Smoothing information (argu-ments Lfdobj, lambda, estimate, and penmat of function fdPar) willcome from the corresponding component of xfdlist if it is of class fdPar(or for scalar independent variables from the response variable if it is of classfdPar) or from optional ... arguments if the reference variable is not of classfdPar.
wt weights for weighted least squares
y2cMap the matrix mapping from the vector of observed values to the coefficients forthe dependent variable. This is output by function smooth.basis. If this issupplied, confidence limits are computed, otherwise not.
SigmaE Estimate of the covariances among the residuals. This can only be estimatedafter a preliminary analysis with fRegress.
method a character string matching either fRegress for functional regression estima-tion or mode to create the argument lists for functional regression estimationwithout running it.
sep separator for creating names for multiple variables for fRegress.fdPar orfRegress.numeric created from single variables on the right hand side ofthe formula y. This happens with multidimensional fd objects as well aswith categorical variables.
... optional arguments
Details
Alternative forms of functional regression can be categorized with traditional least squares usingthe following 2 x 2 table:
explanatory variableresponse | scalar | function
| |scalar | lm | fRegress.numeric
| |function | fRegress.fd or | fRegress.fd or
| fRegress.fdPar | fRegress.fdPar or linmod

114 fRegress
For fRegress.numeric, the numeric response is assumed to be the sum of integrals of xfd *beta for all functional xfd terms.
fRegress.fd or .fdPar produces a concurrent regression with each beta being also a (uni-variate) function.
linmod predicts a functional response from a convolution integral, estimating a bivariate regres-sion function.
In the computation of regression function estimates in fRegress, all independent variables aretreated as if they are functional. If argument xfdlist contains one or more vectors, these areconverted to functional data objects having the constant basis with coefficients equal to the elementsof the vector.
Needless to say, if all the variables in the model are scalar, do NOT use this function. Instead, useeither lm or lsfit.
These functions provide a partial implementation of Ramsay and Silverman (2005, chapters 12-20).
Value
These functions return either a standard fRegress fit object or or a model specification:
fRegress fit a list of class fRegress with the following components:
y the first argument in the call to fRegress (coerced to class fdPar)xfdlist the second argument in the call to fRegress.
betalist the third argument in the call to fRegress.betaestlist a list of length equal to the number of independent variables and with mem-
bers having the same functional parameter structure as the correspondingmembers of betalist. These are the estimated regression coefficientfunctions.
yhatfdobj a functional parameter object (class fdPar) if the dependent variable isfunctional or a vector if the dependent variable is scalar. This is the set ofpredicted by the functional regression model for the dependent variable.
Cmatinv a matrix containing the inverse of the coefficient matrix for the linear equa-tions that define the solution to the regression problem. This matrix is re-quired for function fRegress.stderr that estimates confidence regionsfor the regression coefficient function estimates.
wt the vector of weights input or inferred*** If class(y) is numeric, the fRegress object also includes:
df equivalent degrees of freedom for the fit.OCV the leave-one-out cross validation score for the model.
gcv the generalized cross validation score.*** If class(y) is either fd or fdPar, the fRegress object returnedalso includes 5 other components:
y2cMap an input y2cMapSigmaE an input SigmaE
betastderrlist an fd object estimating the standard errors of betaestlistbvar a covariance matrix
c2bMap a map

fRegress 115
model specificationThe fRegress.formula and fRegress.character functions translatethe formula into the argument list required by fRegress.fdPar or fRegress.numeric.With the default value ’fRegress’ for the argument method, this list is then usedto call the appropriate other fRegress function.Alternatively, to see how the formula is translated, use the alternative ’model’value for the argument method. In that case, the function returns a list withthe arguments otherwise passed to these other functions plus the following ad-ditional components:
xfdlist0 a list of the objects named on the right hand side of formula. This willdiffer from xfdlist for any categorical or multivariate right hand sideobject.
type the type component of any fd object on the right hand side of formula.nbasis a vector containing the nbasis components of variables named in formula
having such componentsxVars an integer vector with all the variable names on the right hand side of
formula containing the corresponding number of variables in xfdlist.This can exceed 1 for any multivariate object on the right hand side of classeither numeric or fd as well as any categorical variable.
Author(s)
J. O. Ramsay, Giles Hooker, and Spencer Graves
References
Ramsay, James O., and Silverman, Bernard W. (2005), Functional Data Analysis, 2nd ed., Springer,New York.
See Also
fRegress.formula, fRegress.stderr, fRegress.CV, linmod
Examples
######### scalar response and explanatory variable### ... to compare fRegress and lm####### example from help('lm')
ctl <- c(4.17,5.58,5.18,6.11,4.50,4.61,5.17,4.53,5.33,5.14)trt <- c(4.81,4.17,4.41,3.59,5.87,3.83,6.03,4.89,4.32,4.69)group <- gl(2,10,20, labels=c("Ctl","Trt"))weight <- c(ctl, trt)
lm.D9 <- lm(weight ~ group)
fRegress.D9 <- fRegress(weight ~ group)

116 fRegress
(lm.D9.coef <- coef(lm.D9))
(fRegress.D9.coef <- sapply(fRegress.D9$betaestlist, coef))
all.equal(as.numeric(lm.D9.coef), as.numeric(fRegress.D9.coef))
######### vector response with functional explanatory variable######
#### set up##annualprec <- log10(apply(CanadianWeather$dailyAv[,,"Precipitation.mm"],
2,sum))# The simplest 'fRegress' call is singular with more bases# than observations, so we use a small basis for this examplesmallbasis <- create.fourier.basis(c(0, 365), 25)# There are other ways to handle this,# but we will not discuss them heretempfd <- smooth.basis(day.5,
CanadianWeather$dailyAv[,,"Temperature.C"], smallbasis)$fd
#### formula interface##
precip.Temp.f <- fRegress(annualprec ~ tempfd)
#### Get the default setup and modify it##
precip.Temp.mdl <- fRegress(annualprec ~ tempfd, method='m')
# set up a smaller basis than for temperaturenbetabasis <- 21betabasis2. <- create.fourier.basis(c(0, 365), nbetabasis)betafd2. <- fd(rep(0, nbetabasis), betabasis2.)# add smoothingbetafdPar2. <- fdPar(betafd2., lambda=10)
# Now do it.precip.Temp.m <- do.call('fRegress', precip.Temp.mdl)
# With the change in betalist, the answers may be different# Without that change, the answes will be the same.
all.equal(precip.Temp.m, precip.Temp.f)

fRegress 117
#### Manual construction of xfdlist and betalist##
xfdlist <- list(const=rep(1, 35), tempfd=tempfd)
# The intercept must be constant for a scalar responsebetabasis1 <- create.constant.basis(c(0, 365))betafd1 <- fd(0, betabasis1)betafdPar1 <- fdPar(betafd1)
betafd2 <- with(tempfd, fd(basisobj=basis, fdnames=fdnames))# convert to an fdPar objectbetafdPar2 <- fdPar(betafd2)
betalist <- list(const=betafdPar1, tempfd=betafdPar2)
precip.Temp <- fRegress(annualprec, xfdlist, betalist)
all.equal(precip.Temp, precip.Temp.f)
######### functional response with vector explanatory variables######
#### simplest: formula interface##daybasis65 <- create.fourier.basis(rangeval=c(0, 365), nbasis=65,
axes=list('axesIntervals'))Temp.fd <- with(CanadianWeather, smooth.basisPar(day.5,
dailyAv[,,'Temperature.C'], daybasis65)$fd)TempRgn.f <- fRegress(Temp.fd ~ region, CanadianWeather)
#### Get the default setup and possibly modify it##TempRgn.mdl <- fRegress(Temp.fd ~ region, CanadianWeather, method='m')# make desired modifications here# then runTempRgn.m <- do.call('fRegress', TempRgn.mdl)
# no change, so match the first run
all.equal(TempRgn.m, TempRgn.f)
##

118 fRegress
## More detailed set up##region.contrasts <- model.matrix(~factor(CanadianWeather$region))rgnContr3 <- region.contrastsdim(rgnContr3) <- c(1, 35, 4)dimnames(rgnContr3) <- list('', CanadianWeather$place, c('const',
paste('region', c('Atlantic', 'Continental', 'Pacific'), sep='.')) )
const365 <- create.constant.basis(c(0, 365))region.fd.Atlantic <- fd(matrix(rgnContr3[,,2], 1), const365)region.fd.Continental <- fd(matrix(rgnContr3[,,3], 1), const365)region.fd.Pacific <- fd(matrix(rgnContr3[,,4], 1), const365)region.fdlist <- list(const=rep(1, 35),
region.Atlantic=region.fd.Atlantic,region.Continental=region.fd.Continental,region.Pacific=region.fd.Pacific)
beta1 <- with(Temp.fd, fd(basisobj=basis, fdnames=fdnames))beta0 <- fdPar(beta1)betalist <- list(const=beta0, region.Atlantic=beta0,
region.Continental=beta0, region.Pacific=beta0)
TempRgn <- fRegress(Temp.fd, region.fdlist, betalist)
all.equal(TempRgn, TempRgn.f)
######### functional response with### (concurrent) functional explanatory variable######
#### predict knee angle from hip angle; from demo('gait', package='fda')#### formula interface##(gaittime <- as.numeric(dimnames(gait)[[1]])*20)gaitrange <- c(0,20)gaitbasis <- create.fourier.basis(gaitrange, nbasis=21)harmaccelLfd <- vec2Lfd(c(0, (2*pi/20)^2, 0), rangeval=gaitrange)gaitfd <- smooth.basisPar(gaittime, gait,
gaitbasis, Lfdobj=harmaccelLfd, lambda=1e-2)$fdhipfd <- gaitfd[,1]kneefd <- gaitfd[,2]
knee.hip.f <- fRegress(kneefd ~ hipfd)
#### manual set-up

fRegress.CV 119
### set up the list of covariate objectsconst <- rep(1, dim(kneefd$coef)[2])xfdlist <- list(const=const, hipfd=hipfd)
beta0 <- with(kneefd, fd(basisobj=basis, fdnames=fdnames))beta1 <- with(hipfd, fd(basisobj=basis, fdnames=fdnames))
betalist <- list(const=fdPar(beta0), hipfd=fdPar(beta1))
fRegressout <- fRegress(kneefd, xfdlist, betalist)
all.equal(fRegressout, knee.hip.f)
#See also the following demos:
#demo('canadian-weather', package='fda')#demo('gait', package='fda')#demo('refinery', package='fda')#demo('weatherANOVA', package='fda')#demo('weatherlm', package='fda')
fRegress.CV Computes Cross-validated Error Sum of Integrated Squared Errors fora Functional Regression Model
Description
For a functional regression model, a cross-validated error sum of squares is computed. For a func-tional dependent variable this is the sum of integrated squared errors. For a scalar response, thisfunction has been superceded by the OCV and gcv elements returned by fRegress. This func-tion aids the choice of smoothing parameters in this model using the cross-validated error sum ofsquares criterion.
Usage
fRegress.CV(y, xfdlist, betalist, CVobs=NULL, ...)
Arguments
y the dependent variable object. It may be an object of three possible classes:
scalar a vector if the dependent variable is scalar.fd a functional data object if the dependent variable is functional.
fdPar a functional parameter object if the dependent variable is functional
xfdlist a list whose members are functional parameter objects specifying functionalindependent variables. Some of these may also be vectors specifying scalarindependent variables.

120 fRegress.CV
betalist a list containing functional parameter objects specifying the regression functionsand their level of smoothing.
CVobs a vector giving the indices of observations to be deleted one at a time in the crossvalidation. Defaults to all of them. Observations not in CVobs will be includedin all bootstrap / cross validation samples.
... optional arguments not used by fRegress.CV but needed for superficial com-patibability with fRegress methods.
Value
A list containing
SSE.CV The sum of squared errors, or integrated squared errors
errfd.cv Either a vector or a functional data object giving the cross-validated errors.
See Also
fRegress, fRegress.stderr
Examples
#### A scalar response example.
annualprec <- log10(apply(CanadianWeather$dailyAv[,,"Precipitation.mm"], 2,sum))
# The simplest 'fRegress' call is singular with more bases# than observations, so we use a small basis for this examplesmallbasis <- create.fourier.basis(c(0, 365), 25)# There are other ways to handle this,# but we will not discuss them heretempfd <- smooth.basis(day.5,
CanadianWeather$dailyAv[,,"Temperature.C"], smallbasis)$fd
# Set up a list of predictors
xfdlist <- list(const=rep(1, 35), tempfd=tempfd)
# And some functional parameter objects to define the coefficient# functions. The intercept must be constant for a scalar responsebetabasis1 <- create.constant.basis(c(0, 365))betafd1 <- fd(0, betabasis1)betafdPar1 <- fdPar(betafd1)
betafd2 <- with(tempfd, fd(basisobj=basis, fdnames=fdnames))# convert to an fdPar objectbetafdPar2 <- fdPar(betafd2)
betalist <- list(const=betafdPar1, tempfd=betafdPar2)
# Now call fRegress.

fRegress.stderr 121
precip.Temp <- fRegress(annualprec, xfdlist, betalist)
precip.cv = fRegress.CV(annualprec,xfdlist,betalist)
# Are the temperature profiles different accross regions,# a functional response model
region.contrasts <- model.matrix(~factor(CanadianWeather$region))rgnContr3 <- region.contrastsdim(rgnContr3) <- c(1, 35, 4)rgns <- paste('region', c('Atlantic', 'Continental', 'Pacific'),
sep='.')dimnames(rgnContr3) <- list('', CanadianWeather$place, c('const', rgns))
const365 <- create.constant.basis(c(0, 365))region.fd.Atlantic <- fd(matrix(rgnContr3[,,2], 1), const365)region.fd.Continental <- fd(matrix(rgnContr3[,,3], 1), const365)region.fd.Pacific <- fd(matrix(rgnContr3[,,4], 1), const365)region.fdlist <- list(const=rep(1, 35),
region.Atlantic=region.fd.Atlantic,region.Continental=region.fd.Continental,region.Pacific=region.fd.Pacific)
beta1 <- with(tempfd, fd(basisobj=basis, fdnames=fdnames))beta0 <- fdPar(beta1)betalist <- list(const=beta0, region.Atlantic=beta0,
region.Continental=beta0, region.Pacific=beta0)
TempRgn <- fRegress(tempfd, region.fdlist, betalist)
temprgn.ocv <- fRegress.CV(tempfd, region.fdlist, betalist)
fRegress.stderr Compute Standard errors of Coefficient Functions Estimated by Func-tional Regression Analysis
Description
Function fRegress carries out a functional regression analysis of the concurrent kind, and esti-mates a regression coefficient function corresponding to each independent variable, whether it isscalar or functional. This function uses the list that is output by fRegress to provide standarderror functions for each regression function. These standard error functions are pointwise, meaningthat sampling standard deviation functions only are computed, and not sampling covariances.
Usage
fRegress.stderr(y, y2cMap, SigmaE, ...)

122 Fstat.fd
Arguments
y the named list of length six that is returned from a call to function fRegress.
y2cMap a matrix that contains the linear transformation that takes the raw data valuesinto the coefficients defining a smooth functional data object. Typically, thismatrix is returned from a call to function smooth.basis that generates thedependent variable objects. If the dependent variable is scalar, this matrix is anidentity matrix of order equal to the length of the vector.
SigmaE either a matrix or a bivariate functional data object according to whether thedependent variable is scalar or functional, respectively. This object has a numberof replications equal to the length of the dependent variable object. It containsan estimate of the variance-covariance matrix or function for the residuals.
... optional arguments not used by fRegress.stderr but needed for superficialcompatibability with fRegress methods.
Value
a named list of length 3 containing:
betastderrlista list object of length equal to the number of independent variables. Each mem-ber contains a functional parameter object for the standard error of a regressionfunction.
bvar a symmetric matrix containing sampling variances and covariances for the ma-trix of regression coefficients for the regression functions. These are storedcolumn-wise in defining BVARIANCE.
c2bMap a matrix containing the mapping from response variable coefficients to coeffi-cients for regression coefficients.
See Also
fRegress, fRegress.CV
Examples
#See the weather data analyses in the file daily.ssc for#examples of the use of function fRegress.stderr.
Fstat.fd F-statistic for functional linear regression.
Description
Fstat.fd calculates a pointwise F-statistic for functional linear regression.
Usage
Fstat.fd(y,yhat,argvals=NULL)
gait 123
Arguments
y the dependent variable object. It may be:
• a vector if the dependent variable is scalar.• a functional data object if the dependent variable is functional.
yhat The predicted values corresponding to y. It must be of the same class.
argvals If yfdPar is a functional data object, the points at which to evaluate the point-wise F-statistic.
Details
An F-statistic is calculated as the ratio of residual variance to predicted variance.
If argvals is not specified and yfdPar is a fd object, it defaults to 101 equally-spaced pointson the range of yfdPar.
Value
A list with components
F the calculated pointwise F-statistics.
argvals argument values for evaluating the F-statistic if yfdPar is a functional dataobject.
Source
Ramsay, James O., and Silverman, Bernard W. (2006), Functional Data Analysis, 2nd ed., Springer,New York.
See Also
fRegress Fstat.fd
gait Hip and knee angle while walking
Description
Hip and knee angle in degrees through a 20 point movement cycle for 39 boys
Format
An array of dim c(20, 39, 2) giving the "Hip Angle" and "Knee Angle" for 39 repetitions of a 20point gait cycle.
124 getbasismatrix
Details
The components of dimnames(gait) are as follows:
[[1]] standardized gait time = seq(from=0.025, to=0.975, by=0.05)
[[2]] subject ID = "boy1", "boy2", ..., "boy39"
[[3]] gait variable = "Hip Angle" or "Knee Angle"
Source
Ramsay, James O., and Silverman, Bernard W. (2006), Functional Data Analysis, 2nd ed., Springer,New York.
Ramsay, James O., and Silverman, Bernard W. (2002), Applied Functional Data Analysis, Springer,New York.
Examples
plot(gait[,1, 1], gait[, 1, 2], type="b")
getbasismatrix Values of Basis Functions or their Derivatives
Description
Evaluate a set of basis functions or their derivatives at a set of argument values.
Usage
getbasismatrix(evalarg, basisobj, nderiv=0)
Arguments
evalarg a vector of arguments values.
basisobj a basis object.
nderiv a nonnegative integer specifying the derivative to be evaluated.
Value
a matrix of basis function or derivative values. Rows correspond to argument values and columnsto basis functions.
See Also
eval.fd

getbasispenalty 125
Examples
# Minimal example: a B-spline of order 1, i.e., a step function# with 0 interior knots:bspl1.1 <- create.bspline.basis(norder=1, breaks=0:1)getbasismatrix(seq(0, 1, .2), bspl1.1)
getbasispenalty Evaluate a Roughness Penalty Matrix
Description
A basis roughness penalty matrix is the matrix containing the possible inner products of pairs ofbasis functions. These inner products are typically defined in terms of the value of a derivativeor of a linear differential operator applied to the basis function. The basis penalty matrix playsan important role in the computation of functions whose roughness is controlled by a roughnesspenalty.
Usage
getbasispenalty(basisobj, Lfdobj=NULL)
Arguments
basisobj a basis object.
Lfdobj
Details
A roughness penalty for a function x(t) is defined by integrating the square of either the derivativeof x(t) or, more generally, the result of applying a linear differential operator L to it. The mostcommon roughness penalty is the integral of the square of the second derivative, and this is thedefault. To apply this roughness penalty, the matrix of inner products of the basis functions definingthis function is necessary. This function just calls the roughness penalty evaluation function specificto the basis involved.
Value
a symmetric matrix of order equal to the number of basis functions defined by the B-spline basisobject. Each element is the inner product of two B-spline basis functions after taking the derivative.
See Also
eval.penalty

126 growth
Examples
# set up a B-spline basis of order 4 with 13 basis functions# and knots at 0.0, 0.1,..., 0.9, 1.0.basisobj <- create.bspline.basis(c(0,1),13)# compute the 13 by 13 matrix of inner products of second derivativespenmat <- getbasispenalty(basisobj)# set up a Fourier basis with 13 basis functions# and and period 1.0.basisobj <- create.fourier.basis(c(0,1),13)# compute the 13 by 13 matrix of inner products of second derivativespenmat <- getbasispenalty(basisobj)
getbasisrange Extract the range from a basis object
Description
Extracts the ’range’ component from basis object ’basisobj’.
Usage
getbasisrange(basisobj)
Arguments
basisobj a functional basis object
Value
a numeric vector of length 2
growth Berkeley Growth Study data
Description
A list containing the heights of 39 boys and 54 girls from age 1 to 18 and the ages at which theywere collected.
Format
This list contains the following components:
hgtm a 31 by 39 numeric matrix giving the heights in centimeters of 39 boys at 31 ages.hgtf a 31 by 54 numeric matrix giving the heights in centimeters of 54 girls at 31 ages.age a numeric vector of length 31 giving the ages at which the heights were measured.

handwrit 127
Details
The ages are not equally spaced.
Source
Ramsay, James O., and Silverman, Bernard W. (2006), Functional Data Analysis, 2nd ed., Springer,New York.
Ramsay, James O., and Silverman, Bernard W. (2002), Applied Functional Data Analysis, Springer,New York, ch. 6.
Tuddenham, R. D., and Snyder, M. M. (1954) "Physical growth of California boys and girls frombirth to age 18", University of California Publications in Child Development, 1, 183-364.
Examples
with(growth, matplot(age, hgtf[, 1:10], type="b"))
handwrit Cursive handwriting samples
Description
20 cursive samples of 1401 (x, y,) coordinates for writing "fda"
Usage
handwrithandwritTime
Format
handwrit An array of dimensions (1401, 20, 2) giving 1401 pairs of (x, y) coordinates for each of 20replicates of cursively writing "fda"
handwritTime seq(0, 2300, length=1401) = sampling times
Details
These data are the X-Y coordinates of 20 replications of writing the script "fda". The subject wasJim Ramsay. Each replication is represented by 1401 coordinate values. The scripts have beenextensively pre-processed. They have been adjusted to a common length that corresponds to 2.3seconds or 2300 milliseconds, and they have already been registered so that important features ineach script are aligned.
This analysis is designed to illustrate techniques for working with functional data having rather highfrequency variation and represented by thousands of data points per record. Comments along theway explain the choices of analysis that were made.
The final result of the analysis is a third order linear differential equation for each coordinate forcedby a constant and by time. The equations are able to reconstruct the scripts to a fairly high level

128 infantGrowth
of accuracy, and are also able to accommodate a substantial amount of the variation in the ob-served scripts across replications. by contrast, a second order equation was found to be completelyinadequate.
An interesting suprise in the results is the role placed by a 120 millisecond cycle such that sharpfeatures such as cusps correspond closely to this period. This 110-120 msec cycle seems is usuallyseen in human movement data involving rapid movements, such as speech, juggling and so on.
These 20 records have already been normalized to a common time interval of 2300 milliseconds andhave beeen also registered so that prominent features occur at the same times across replications.Time will be measured in (approximate) milliseconds and space in meters. The data will requirea small amount of smoothing, since an error of 0.5 mm is characteristic of the OPTOTRAK 3Dmeasurement system used to collect the data.
Milliseconds were chosen as a time scale in order to make the ratio of the time unit to the inter-knotinterval not too far from one. Otherwise, smoothing parameter values may be extremely small orextremely large.
The basis functions will be B-splines, with a spline placed at each knot. One may question whetherso many basis functions are required, but this decision is found to be essential for stable derivativeestimation up to the third order at and near the boundaries.
Order 7 was used to get a smooth third derivative, which requires penalizing the size of the 5thderivative, which in turn requires an order of at least 7. This implies norder + no. of interior knots= 1399 + 7 = 1406 basis functions.
The smoothing parameter value 1e8 was chosen to obtain a fitting error of about 0.5 mm, the knownerror level in the OPTOTRACK equipment.
Source
Ramsay, James O., and Silverman, Bernard W. (2006), Functional Data Analysis, 2nd ed., Springer,New York.
Examples
plot(handwrit[, 1, 1], handwrit[, 1, 2], type="l")
infantGrowth Tibia Length for One Baby
Description
Measurement of the length of the tibia for the first 40 days of life for one infant.
Usage
data(infantGrowth)

inprod 129
Format
A matrix with three columns:
day age in days
tibiaLength The average of five measurements of tibia length in millimeters
sd.length The standard deviation of five measurements of tibia length in millimeters
Source
Hermanussen, M., Thiel, C., von Bueren, E., de los Angeles Rol. de Lama, M., Perez Romero, A.,Ariznavarreta Ruiz, C., Burmeister, J., Tresguerras, J. A. F. (1998) Micro and macro perspectivesin auxology: Findings and considerations upon the variability of short term and individual growthand the stability of population derived parameters, Annals of Human Biology, 25: 359-395.
References
Ramsay, James O., and Silverman, Bernard W. (2006), Functional Data Analysis, 2nd ed., Springer,New York.
Examples
data(infantGrowth)plot(tibiaLength~day, infantGrowth)
inprod Inner products of Functional Data Objects.
Description
Computes a matrix of inner products for each pairing of a replicate for the first argument with areplicate for the second argument. This is perhaps the most important function in the functional datalibrary. Hardly any analysis fails to use inner products in some way, and many employ multiple innerproducts. While in certain cases these may be computed exactly, this is a more general function thatapproximates the inner product approximately when required. The inner product is defined by twoderivatives or linear differential operators that are applied to the first two arguments. The rangeused to compute the inner product may be contained within the range over which the functions aredefined. A weight functional data object may also be used to define weights for the inner product.
Usage
inprod(fdobj1, fdobj2,Lfdobj1=int2Lfd(0), Lfdobj2=int2Lfd(0),rng = range1, wtfd = 0)

130 inprod
Arguments
fdobj1 a functional data object or a basis object. If the object is of the basis class,it is converted to a functional data object by using the identity matrix as thecoefficient matrix.
fdobj2 a functional data object or a basis object. If the object is of the basis class,it is converted to a functional data object by using the identity matrix as thecoefficient matrix.
Lfdobj1 either a nonnegative integer specifying the derivative of the first argument to beused, or a linear differential operator object to be applied to the first argument.
Lfdobj2 either a nonnegative integer specifying the derivative of the second argumentto be used, or a linear differential operator object to be applied to the secondargument.
rng a vector of length 2 defining a restricted range contained within the range overwhich the arguments are defined.
wtfd a univariate functional data object with a single replicate defining weights to beused in computing the inner product.
Details
The approximation method is Richardson extrapolation using numerical integration by the trape-zoidal rule. At each iteration, the number of values at which the functions are evaluated is doubled,and a polynomial extrapolation method is used to estimate the converged integral values as well asan error tolerance. Convergence is declared when the relative error falls below EPS for all prod-ucts. The extrapolation method generally saves at least one and often two iterations relative toun-extrapolated trapezoidal integration. Functional data analyses will seldom need to use inproddirectly, but code developers should be aware of its pivotal role. Future work may require moresophisticated and specialized numerical integration methods. inprod computes the definite inte-gral, but some functions such as smooth.monotone and register.fd also need to computeindefinite integrals. These use the same approximation scheme, but usually require more accuracy,and hence more iterations. When one or both arguments are basis objects, they are converted tofunctional data objects using identity matrices as the coefficient matrices. inprod is only calledwhen there is no faster or exact method available. In cases where there is, it has been found that theapproximation is good to about four to five significant digits, which is sufficient for most applica-tions. Perhaps surprisingly, in the case of B-splines, the exact method is not appreciably faster, butof course is more accurate. inprod calls function eval.fd perhaps thousands of times, so highefficiency for this function and the functions that it calls is important.
Value
a matrix of inner products. The number of rows is the number of functions or basis functions inargument fd1, and the number of columns is the same thing for argument fd2.
References
Press, et, al, NumericalRecipes.

inprod.bspline 131
See Also
eval.penalty,
inprod.bspline Compute Inner Products B-spline Expansions.
Description
Computes the matrix of inner products when both functions are represented by B-spline expansionsand when both derivatives are integers. This function is called by function inprod, and is notnormally used directly.
Usage
inprod.bspline(fdobj1, fdobj2=fdobj1, nderiv1=0, nderiv2=0)
Arguments
fdobj1 a functional data object having a B-spline basis function expansion.
fdobj2 a second functional data object with a B-spline basis function expansion. Bydefault, this is the same as the first argument.
nderiv1 a nonnegative integer specifying the derivative for the first argument.
nderiv2 a nonnegative integer specifying the derivative for the second argument.
Value
a matrix of inner products with number of rows equal to the number of replications of the firstargument and number of columns equal to the number of replications of the second object.
int2Lfd Convert Integer to Linear Differential Operator
Description
This function turns an integer specifying an order of a derivative into the equivalent linear differen-tial operator object. It is also useful for checking that an object is of the "Lfd" class.
Usage
int2Lfd(m=0)
Arguments
m either a nonnegative integer or a linear differential operator object.

132 intensity.fd
Details
Smoothing is achieved by penalizing the integral of the square of the derivative of order m overrangeval:
m = 0 penalizes the squared difference from 0 of the function
1 = penalize the square of the slope or velocity
2 = penalize the squared acceleration
3 = penalize the squared rate of change of acceleration
4 = penalize the squared curvature of acceleration?
Value
a linear differential operator object of the "Lfd" class that is equivalent to the integer argument.
Examples
# Lfd to penalize the squared acceleration# typical for smoothing a cubic spline (order 4)int2Lfd(2)
# Lfd to penalize the curvature of acceleration# used with splines of order 6# when it is desired to study velocity and accelerationint2Lfd(4)
intensity.fd Intensity Function for Point Process
Description
The intensity mu of a series of event times that obey a homogeneous Poisson process is the meannumber of events per unit time. When this event rate varies over time, the process is said to benonhomogeneous, and mu(t), and is estimated by this function intensity.fd.
Usage
intensity.fd(x, WfdParobj, conv=0.0001, iterlim=20,dbglev=1)
Arguments
x a vector containing a strictly increasing series of event times. These event timesassume that the the events begin to be observed at time 0, and therefore are timessince the beginning of observation.
WfdParobj a functional parameter object estimating the log-intensity function W (t) =log[mu(t)] . Because the intensity function mu(t) is necessarily positive, itis represented by mu(x) = exp[W(x)].

intensity.fd 133
conv a convergence criterion, required because the estimation process is iterative.
iterlim maximum number of iterations that are allowed.
dbglev either 0, 1, or 2. This controls the amount information printed out on each iter-ation, with 0 implying no output, 1 intermediate output level, and 2 full output.If levels 1 and 2 are used, turn off the output buffering option.
Details
The intensity function I(t) is almost the same thing as a probability density function p(t) estimatedby function densify.fd. The only difference is the absence of the normalizing constant C thata density function requires in order to have a unit integral. The goal of the function is provide asmooth intensity function estimate that approaches some target intensity by an amount that is con-trolled by the linear differential operator Lfdobj and the penalty parameter in argument WfdPar.For example, if the first derivative of W (t) is penalized heavily, this will force the function toapproach a constant, which in turn will force the estimated Poisson process itself to be nearly ho-mogeneous. To plot the intensity function or to evaluate it, evaluate Wfdobj, exponentiate theresulting vector.
Value
a named list of length 4 containing:
Wfdobj a functional data object defining function W (x) that that optimizes the fit to thedata of the monotone function that it defines.
Flist a named list containing three results for the final converged solution: (1) f: theoptimal function value being minimized, (2) grad: the gradient vector at theoptimal solution, and (3) norm: the norm of the gradient vector at the optimalsolution.
iternum the number of iterations.
iterhist a iternum+1 by 5 matrix containing the iteration history.
See Also
density.fd
Examples
# Generate 101 Poisson-distributed event times with# intensity or rate two events per unit timeN <- 101mu <- 2# generate 101 uniform deviatesuvec <- runif(rep(0,N))# convert to 101 exponential waiting timeswvec <- -log(1-uvec)/mu# accumulate to get event timestvec <- cumsum(wvec)tmax <- max(tvec)

134 is.basis
# set up an order 4 B-spline basis over [0,tmax] with# 21 equally spaced knotstbasis <- create.bspline.basis(c(0,tmax), 23)# set up a functional parameter object for W(t),# the log intensity function. The first derivative# is penalized in order to smooth toward a constantlambda <- 10WfdParobj <- fdPar(tbasis, 1, lambda)# estimate the intensity functionWfdobj <- intensity.fd(tvec, WfdParobj)$Wfdobj# get intensity function values at 0 and event timesevents <- c(0,tvec)intenvec <- exp(eval.fd(events,Wfdobj))# plot intensity functionplot(events, intenvec, type="b")lines(c(0,tmax),c(mu,mu),lty=4)
is.basis Confirm Object is Class "Basisfd"
Description
Check that an argument is a basis object.
Usage
is.basis(basisobj)
Arguments
basisobj an object to be checked.
Value
a logical value: TRUE if the class is correct, FALSE otherwise.
See Also
is.fd, is.fdPar, is.Lfd

is.fd 135
is.fd Confirm Object has Class "fd"
Description
Check that an argument is a functional data object.
Usage
is.fd(fdobj)
Arguments
fdobj an object to be checked.
Value
a logical value: TRUE if the class is correct, FALSE otherwise.
See Also
is.basis, is.fdPar, is.Lfd
is.fdPar Confirm Object has Class "fdPar"
Description
Check that an argument is a functional parameter object.
Usage
is.fdPar(fdParobj)
Arguments
fdParobj an object to be checked.
Value
a logical value: TRUE if the class is correct, FALSE otherwise.
See Also
is.basis, is.fd, is.Lfd

136 knots.fd
is.Lfd Confirm Object has Class "Lfd"
Description
Check that an argument is a linear differential operator object.
Usage
is.Lfd(Lfdobj)
Arguments
Lfdobj an object to be checked.
Value
a logical value: TRUE if the class is correct, FALSE otherwise.
See Also
is.basis, is.fd, is.fdPar
knots.fd Extract the knots from a function basis or data object
Description
Extract either all or only the interior knots from an object of class basisfd, fd, or fdSmooth.
Usage
## S3 method for class 'fd':knots(Fn, interior=TRUE, ...)## S3 method for class 'fdSmooth':knots(Fn, interior=TRUE, ...)## S3 method for class 'basisfd':knots(Fn, interior=TRUE, ...)
Arguments
Fn an object of class basisfd or containing such an objectinterior logical:
if TRUE, the first Fn[["k"]]+1 of Fn[["knots"]] are dropped, and the next Fn[["g"]]are returned.Otherwise, the first Fn[["n"]] of Fn[["knots"]] are returned.
... ignored

knots.fd 137
Details
The interior knots of a bspline basis are stored in the params component. The remaining knotsare in the rangeval component, with mulltiplicity norder(Fn).
Value
Numeric vector. If ’interior’ is TRUE, this is the params component of the bspline basis.Otherwise, params is bracketed by rep(rangeval, norder(basisfd).
Author(s)
Spencer Graves
References
Dierckx, P. (1991) Curve and Surface Fitting with Splines, Oxford Science Publications.
See Also
fd, create.bspline.basis, knots.dierckx
Examples
x <- 0:24y <- c(1.0,1.0,1.4,1.1,1.0,1.0,4.0,9.0,13.0,
13.4,12.8,13.1,13.0,14.0,13.0,13.5,10.0,2.0,3.0,2.5,2.5,2.5,3.0,4.0,3.5)
if(require(DierckxSpline)){z1 <- curfit(x, y, method = "ss", s = 0, k = 3)knots1 <- knots(z1)knots1All <- knots(z1, interior=FALSE) # to see all knots
#fda1 <- dierckx2fd(z1)fdaKnots <- knots(fda1)fdaKnotsA <- knots(fda1, interior=FALSE)stopifnot(all.equal(knots1, fdaKnots))stopifnot(all.equal(knots1All, fdaKnotsA))
}
# knots.fdSmoothgirlGrowthSm <- with(growth, smooth.basisPar(argvals=age, y=hgtf))
girlKnots.fdSm <- knots(girlGrowthSm)girlKnots.fdSmA <- knots(girlGrowthSm, interior=FALSE)stopifnot(all.equal(girlKnots.fdSm, girlKnots.fdSmA[5:33]))
girlKnots.fd <- knots(girlGrowthSm$fd)girlKnots.fdA <- knots(girlGrowthSm$fd, interior=FALSE)
stopifnot(all.equal(girlKnots.fdSm, girlKnots.fd))stopifnot(all.equal(girlKnots.fdSmA, girlKnots.fdA))

138 lambda2gcv
lambda2df Convert Smoothing Parameter to Degrees of Freedom
Description
The degree of roughness of an estimated function is controlled by a smoothing parameter lambdathat directly multiplies the penalty. However, it can be difficult to interpret or choose this value, andit is often easier to determine the roughness by choosing a value that is equivalent of the degreesof freedom used by the smoothing procedure. This function converts a multipler lambda into adegrees of freedom value.
Usage
lambda2df(argvals, basisobj, wtvec=rep(1, n),Lfdobj=NULL, lambda=0)
Arguments
argvals a vector containing the argument values used in the smooth of the data.
basisobj the basis object used in the smoothing of the data.
wtvec the weight vector, if any, that was used in the smoothing of the data.
Lfdobj the linear differential operator object used to defining the roughness penaltyemployed in smoothing the data.
lambda the smoothing parameter to be converted.
Value
the equivalent degrees of freedom value.
See Also
df2lambda
lambda2gcv Compute GCV Criterion
Description
The generalized cross-validation or GCV criterion is often used to select an appropriate smoothingparameter value, by finding the smoothing parameter that minimizes GCV. This function locatesthat value.
Usage
lambda2gcv(log10lambda, argvals, y, fdParobj, wtvec=rep(1,length(argvals)))

landmarkreg 139
Arguments
log10lambda the logarithm (base 10) of the smoothing parameter
argvals a vector of argument values.
y the data to be smoothed.
fdParobj a functional parameter object defining the smooth.
wtvec a weight vector used in the smoothing.
Details
Currently, lambda2gcv
Value
1. fdParobj[[′lambda′]] < −10log10lambda
2. smoothlist <- smooth.basks(argvals, y, fdParobj, wtvec)
3. return(smoothlist[[’gcv’]])
See Also
smooth.basis fdPar
landmarkreg Landmark Registration of Functional Observations
Description
It is common to see that among a set of functions certain prominent features such peaks and val-leys, called landmarks, do not occur at the same times, or other argument values. This is calledphasevariation, and it can be essential to align these features before proceeding with further func-tional data analyses. This function uses the timings of these features to align or register the curves.The registration involves estimating a nonlinear transformation of the argument continuum for eachfunctional observation. This transformation is called a warping function. It must be strictly increas-ing and smooth.
Usage
landmarkreg(fdobj, ximarks, x0marks=xmeanmarks,WfdPar, monwrd=FALSE, ylambda=1e-10)
140 landmarkreg
Arguments
fdobj a functional data object containing the curves to be registered.
ximarks a matrix containing the timings or argument values associated with the land-marks for the observations in fd to be registered. The number of rows N equalsthe number of observations, and the number of columns NL equals the numberof landmarks. These landmark times must be in the interior of the interval overwhich the functions are defined.
x0marks a vector of length NL of times of landmarks for target curve. If not supplied, themean of the landmark times in ximarks is used.
WfdPar a functional parameter object defining the warping functions that transform timein order to register the curves.
monwrd A logical value: if TRUE, the warping function is estimated using a monotonesmoothing methhod; otherwise, a regular smoothing method is used, which isnot guaranteed to give strictly monotonic warping functions.
ylambda Smoothing parameter controlling the smoothness of the registered functions. Itcan happen with high dimensional bases that local wiggles can appear in theregistered curves or their derivatives that are not seen in the unregistered ver-sions. In this case, this parameter should be increased to the point where theydisappear.
Details
It is essential that the location of every landmark be clearly defined in each of the curves as wellas the template function. If this is not the case, consider using the continuous registration functionregister.fd. Although requiring that a monotone smoother be used to estimate the warpingfunctions is safer, it adds considerably to the computatation time since monotone smoothing isitself an iterative process. It is usually better to try an initial registration with this feature to seeif there are any failures of monotonicity. Moreover, monotonicity failures can usually be cured byincreasing the smoothing parameter defining WfdPar. Not much curvature is usually required inthe warping functions, so a rather low power basis, usually B-splines, is suitable for defining thefunctional paramter argument WfdPar. A registration with a few prominent landmarks is often agood preliminary to using the more sophisticated but more lengthy process in register.fd.
Value
a named list of length 2 with components:
fdreg a functional data object for the registered curves.
warpfd a functional data object for the warping functions.
See Also
register.fd, smooth.morph
Examples
#See the analysis for the lip data in the examples.

Lfd 141
Lfd Define a Linear Differential Operator Object
Description
A linear differential operator of order m is defined, usually to specify a roughness penalty.
Usage
Lfd(nderiv=0, bwtlist=vector("list", 0))
Arguments
nderiv a nonnegative integer specifying the order m of the highest order derivative inthe operator
bwtlist a list of length m. Each member contains a functional data object that acts asa weight function for a derivative. The first member weights the function, thesecond the first derivative, and so on up to order m− 1.
Details
To check that an object is of this class, use functions is.Lfd or int2Lfd.
Linear differential operator objects are often used to define roughness penalties for smoothing to-wards a "hypersmooth" function that is annihilated by the operator. For example, the harmonicacceleration operator used in the analysis of the Canadian daily weather data annihilates linearcombinations of 1, sin(2pit/365) and cos(2pit/365), and the larger the smoothing parameter, thecloser the smooth function will be to a function of this shape.
Function pda.fd estimates a linear differential operator object that comes as close as possible toannihilating a functional data object.
A linear differential operator of order m is a linear combination of the derivatives of a functionaldata object up to order m. The derivatives of orders 0, 1, ..., m − 1 can each be multiplied by aweight function b(t) that may or may not vary with argument t.
If the notationDˆj is taken to mean "take the derivative of order j", then a linear differental operatorL applied to function x has the expression
Lx(t) = b_0(t)x(t) + b_1(t)Dx(t) + ...+ b_{m− 1}(t)Dˆ{m− 1}x(t) +Dˆmx(t)
There are print, summary, and plot methods for objects of class Lfd.
Value
a linear differential operator object
See Also
int2Lfd, vec2Lfd, fdPar, pda.fd plot.Lfd

142 lines.fd
Examples
# Set up the harmonic acceleration operatordayrange <- c(0,365)Lbasis <- create.constant.basis(dayrange,
axes=list("axesIntervals"))Lcoef <- matrix(c(0,(2*pi/365)^2,0),1,3)bfdobj <- fd(Lcoef,Lbasis)bwtlist <- fd2list(bfdobj)harmaccelLfd <- Lfd(3, bwtlist)
lines.fd Add Lines from Functional Data to a Plot
Description
Lines defined by functional observations are added to an existing plot.
Usage
## S3 method for class 'fd':lines(x, Lfdobj=int2Lfd(0), nx=201, ...)## S3 method for class 'fdSmooth':lines(x, Lfdobj=int2Lfd(0), nx=201, ...)
Arguments
x a univariate functional data object to be evaluated at nx points over xlim andadded as a line to an existing plot.
Lfdobj either a nonnegative integer or a linear differential operator object. If present,the derivative or the value of applying the operator is evaluated rather than thefunctions themselves.
nx Number of points within xlim at which to evaluate x for plotting.
... additional arguments such as axis titles and so forth that can be used in plottingprograms called by lines.fd or lines.fdSmooth.
Side Effects
Lines added to an existing plot.
See Also
plot.fd, plotfit.fd

linmod 143
Examples
#### plot a fit with 3 levels of smoothing##x <- seq(-1,1,0.02)y <- x + 3*exp(-6*x^2) + sin(1:101)/2# sin not rnorm to make it easier to compare# results across platforms
result4. <- smooth.basisPar(argvals=x, y=y, lambda=1)result4.4 <- smooth.basisPar(argvals=x, y=y, lambda=1e-4)result4.0 <- smooth.basisPar(x, y, lambda=0)
plot(x, y)lines(result4.)lines(result4.4, col='green')lines.fdSmooth(result4.0, col='red')
plot(x, y, xlim=c(0.5, 1))lines.fdSmooth(result4.)lines.fdSmooth(result4.4, col='green')lines.fdSmooth(result4.0, col='red')lines.fdSmooth(result4.0, col='red', nx=101)# no visible difference from the default?
lines.fdSmooth(result4.0, col='orange', nx=31)# Clear difference, especially between 0.95 and 1
linmod Fit Fully Functional Linear Model
Description
A functional dependent variable yi(t) is approximated by a single functional covariate xi(s) plusan intercept function α(t), and the covariate can affect the dependent variable for all values of itsargument. The equation for the model is
yi(t) = β0(t) +∫β1(s, t)xi(s)ds+ ei(t)
for i = 1, ..., N . The regression function β1(s, t) is a bivariate function. The final term ei(t) is aresidual, lack of fit or error term. There is no need for values s and t to be on the same continuum.
Usage
linmod(xfdobj, yfdobj, betaList, wtvec=NULL)

144 lip
Arguments
xfdobj a functional data object for the covariate
yfdobj a functional data object for the dependent variable
betaList a list object of length 3. The first element is a functional parameter object speci-fying a basis and a roughness penalty for the intercept term, the second elementis a functional parameter object for the regression function as a function of itsfirst argument s, and the third element is a functional parameter object for theregression function as a function of its second argument t.
wtvec a vector of weights for each observation. Its default value is NULL, in whichcase the weights are assumed to be 1.
Value
a named list of length 3 with the following entries:
beta0estfd the intercept functional data object.
beta1estbifd a bivariate functional data object for the regression function.
yhatfdobj a functional data object for the approximation to the dependent variable definedby the linear model, if the dependent variable is functional. Otherwise the matrixof approximate values.
See Also
fRegress
Examples
#See the prediction of precipitation using temperature as#the independent variable in the analysis of the daily weather#data.
lip Lip motion
Description
51 measurements of the position of the lower lip every 7 milliseconds for 20 repitions of the syllable’bob’.
Usage
liplipmarksliptime

lmeWinsor 145
Format
lip a matrix of dimension c(51, 20) giving the position of the lower lip every 7 milliseconds for350 miliseconds.
lipmarks a matrix of dimension c(20, 2) giving the positions of the ’leftElbow’ and ’rightElbow’ in eachof the 20 repitions of the syllable ’bob’.
liptime time in seconds from the start = seq(0, 0.35, 51) = every 7 milliseconds.
Details
These are rather simple data, involving the movement of the lower lip while saying "bob". Thereare 20 replications and 51 sampling points. The data are used to illustrate two techniques: land-mark registration and principal differental analysis. Principal differential analysis estimates a lineardifferential equation that can be used to describe not only the observed curves, but also a certainnumber of their derivatives. For a rather more elaborate example of principal differential analysis,see the handwriting data.
See the lip demo.
Source
Ramsay, James O., and Silverman, Bernard W. (2006), Functional Data Analysis, 2nd ed., Springer,New York, sections 19.2 and 19.3.
Examples
# See the lip demo.
lmeWinsor Winsorized Regression with mixed effects
Description
Clip inputs and mixed-effects predictions to (upper, lower) or to selected quantiles to limit wildpredictions outside the training set.
Usage
lmeWinsor(fixed, data, random, lower=NULL, upper=NULL, trim=0,quantileType=7, correlation, weights, subset, method,na.action, control, contrasts = NULL, keep.data=TRUE,...)

146 lmeWinsor
Arguments
fixed a two-sided linear formula object describing the fixed-effects part of the model,with the response on the left of a ’~’ operator and the terms, separated by ’+’operators, on the right. The left hand side of ’formula’ must be a single vectorin ’data’, untransformed.
data an optional data frame containing the variables named in ’fixed’, ’random’, ’cor-relation’, ’weights’, and ’subset’. By default the variables are taken from theenvironment from which lme is called.
random a random- / mixed-effects specification, as described with lme.NOTE: Unlike lme, ’random’ must be provided; it can not be inferred from’data’.
lower, upper optional numeric vectors with names matching columns of ’data’ giving limitson the ranges of predictors and predictions: If present, values below ’lower’ willbe increased to ’lower’, and values above ’upper’ will be decreased to ’upper’.If absent, these limit(s) will be inferred from quantile(..., prob=c(trim, 1-trim),na.rm=TRUE, type=quantileType).
trim the fraction (0 to 0.5) of observations to be considered outside the range of thedata in determining limits not specified in ’lower’ and ’upper’.NOTES:(1) trim>0 with a singular fit may give an error. In such cases, fix the singularityand retry.(2) trim = 0.5 should NOT be used except to check the algorithm, because ittrims everything to the median, thereby providing zero leverage for estimating aregression.(3) The current algorithm does does NOT adjust any of the variance parameterestimates to account for predictions outside ’lower’ and ’upper’. This will haveno effect for trim = 0 or trim otherwise so small that there are not predictionsoutside ’lower’ and ’upper’. However, for more substantive trimming, this couldbe an issue. This is different from lmWinsor.
quantileType an integer between 1 and 9 selecting one of the nine quantile algorithms to beused with ’trim’ to determine limits not provided with ’lower’ and ’upper’.
correlation an optional correlation structure, as described with lme.
weights an optional heteroscedasticity structure, as described with lme.
subset an optional vector specifying a subset of observations to be used in the fittingprocess, as described with lme.
method a character string. If ’"REML"’ the model is fit by maximizing the restricted log-likelihood. If ’"ML"’ the log-likelihood is maximized. Defaults to ’"REML"’.
na.action a function that indicates what should happen when the data contain ’NA’s. Thedefault action (’na.fail’) causes ’lme’ to print an error message and terminate ifthere are any incomplete observations.
control a list of control values for the estimation algorithm to replace the default valuesreturned by the function lmeControl. Defaults to an empty list.NOTE: Other control parameters such as ’singular.ok’ as documented in glsCon-trol may also work, but should be used with caution.

lmeWinsor 147
contrasts an optional list. See the ’contrasts.arg’ of ’model.matrix.default’.
keep.data logical: should the ’data’ argument (if supplied and a data frame) be saved aspart of the model object?
... additional arguments to be passed to the low level regression fitting functions;see lm.
Details
1. Identify inputs and outputs as follows:
1.1. mdly <- mdlx <- fixed; mdly[[3]] <- NULL; mdlx[[2]] <- NULL;
1.2. xNames <- c(all.vars(mdlx), all.vars(random)).
1.3. yNames <- all.vars(mdly). Give an error if as.character(mdly[[2]]) != yNames.
2. Do ’lower’ and ’upper’ contain limits for all numeric columns of ’data? Create limits to fill anymissing.
3. clipData = data with all xNames clipped to (lower, upper).
4. fit0 <- lme(...)
5. Add components lower and upper to fit0 and convert it to class c(’lmeWinsor’, ’lme’).
6. Clip any stored predictions at the Winsor limits for ’y’.
NOTE: This is different from lmWinsor, which uses quadratic programming with predictions out-side limits, transferring extreme points one at a time to constraints that force the unWinsorizedpredictions for those points to be at least as extreme as the limits.
Value
an object of class c(’lmeWinsor’, ’lme’) with ’lower’, ’upper’, and ’message’ components in addi-tion to the standard ’lm’ components. The ’message’ is a list with its first component being either’all predictions inside limits’ or ’predictions outside limits’. In the latter case, there rest of the listsummarizes how many and which points have predictions outside limits.
Author(s)
Spencer Graves
See Also
lmWinsor predict.lmeWinsor lme quantile
Examples
fm1w <- lmeWinsor(distance ~ age, data = Orthodont,random=~age|Subject)
fm1w.1 <- lmeWinsor(distance ~ age, data = Orthodont,random=~age|Subject, trim=0.1)

148 lmWinsor
lmWinsor Winsorized Regression
Description
Clip inputs and predictions to (upper, lower) or to selected quantiles to limit wild predictions outsidethe training set.
Usage
lmWinsor(formula, data, lower=NULL, upper=NULL, trim=0,quantileType=7, subset, weights=NULL, na.action,model = TRUE, x = FALSE, y = FALSE, qr = TRUE,singular.ok = TRUE, contrasts = NULL, offset=NULL,method=c('QP', 'clip'), eps=sqrt(.Machine$double.eps),trace=ceiling(sqrt(nrow(data))), ...)
Arguments
formula an object of class ’"formula"’ (or one that can be coerced to that class): a sym-bolic description of the model to be fitted. See lm. The left hand side of ’for-mula’ must be a single vector in ’data’, untransformed.
data an optional data frame, list or environment (or object coercible by ’as.data.frame’to a data frame) containing the variables in the model. If not found in ’data’, thevariables are taken from ’environment(formula)’; see lm.
lower, upper Either NULL or a numeric vector or a list.If a numeric vector, it must have names matching columns of ’data’ giving limitson the ranges of predictors and predictions: If present, values below ’lower’ willbe increased to ’lower’, and values above ’upper’ will be decreased to ’upper’.If absent, these limit(s) will be inferred from quantile(..., prob=c(trim, 1-trim),na.rm=TRUE, type=quantileType).If a list, its components must be numeric vectors with names, as just described.If length(trim) > 1 or either ’lower’ or ’upper’ is a list, ’lmWinsor’ will return alist giving alternative fits; see ’value’ below.
trim Either a constant or a numeric vector giving the fraction (0 to 0.5) of observa-tions to be considered outside the range of the data in determining limits notspecified in ’lower’ and ’upper’. If length(trim) > 1 or either ’lower’ or ’upper’is a list, ’lmWinsor’ will return a list giving alternative fits; see ’value’ below.NOTES:(1) trim>0 with a singular fit may give an error. In such cases, fix the singularityand retry.(2) trim = 0.5 should NOT be used except to check the algorithm, because ittrims everything to the median, thereby providing zero leverage for estimating aregression.

lmWinsor 149
quantileType an integer between 1 and 9 selecting one of the nine quantile algorithms to beused with ’trim’ to determine limits not provided with ’lower’ and ’upper’; seequantile.
subset an optional vector specifying a subset of observations to be used in the fittingprocess.
weights an optional vector of weights to be used in the fitting process. Should be ’NULL’or a numeric vector. If non-NULL, weighted least squares is used with weights’weights’ (that is, minimizing ’sum(w*e*e)’); otherwise ordinary least squaresis used.
na.action a function which indicates what should happen when the data contain ’NA’s.The default is set by the ’na.action’ setting of ’options’, and is ’na.fail’ if that isunset. The factory-fresh default is ’na.omit’. Another possible value is ’NULL’,no action. Value ’na.exclude’ can be useful.
model, x, y, qrlogicals. If ’TRUE’ the corresponding components of the fit (the model frame,the model matrix, the response, the QR decomposition) are returned.
singular.oklogical. If ’FALSE’ (the default in S but not in R) a singular fit is an error.
contrasts an optional list. See the ’contrasts.arg’ of ’model.matrix.default’.
offset this can be used to specify an a priori known component to be included in thelinear predictor during fitting. This should be ’NULL’ or a numeric vector oflength either one or equal to the number of cases. One or more ’offset’ termscan be included in the formula instead or as well, and if both are specified theirsum is used. See ’model.offset’.
method Either ’QP’ or ’clip’; partial matching is allowed. If ’clip’, force all ’fitted.values’from an ’lm’ fit to be at least lower[yName] and at most’upper[yName]. If’QP’, iteratively find the prediction farthest outside (lower, upper)[yName] andtransfer it from the sum of squared residuals objective function to a constraintthat keeps high ’fitted.values’ from going below upper[yName] and low ’fit-ted.values’ from going above lower[yName].
eps small positive number used in two ways:
limits ’pred’ is judged between ’lower’ and ’upper’ for ’y’ as follows: First com-pute mod = mean(abs(y)). If this is 0, let Eps = eps; otherwise let Eps =eps*mod. Then pred is low if it is less than (lower - Eps), high if it exceeds(upper + Eps), and inside limits otherwise.
QP To identify singularity in the quadratic program (QP) discussed in ’de-tails’, step 7 below, first compute the model.matrix of the points with in-terior predictions. Then compute the QR decomposition of this reducedmodel.matix. Then compute the absolute values of the diagonal elementsof R. If the smallest of these numbers is less than eps times the largest,terminate the QP with the previous parameter estimates.
trace Print the iteration count every ’trace’ iteration during ’QP’ iterations; see details.’trace’ = 0 means no trace.
... additional arguments to be passed to the low level regression fitting functions;see lm.

150 lmWinsor
Details
1. Identify inputs and outputs via mdly <- mdlx <- formula; mdly[[3]] <- NULL; mdlx[[2]] <-NULL; xNames <- all.vars(mdlx); yNames <- all.vars(mdly). Give an error if as.character(mdly[[2]])!= yNames.
2. Do ’lower’ and ’upper’ contain limits for all numeric columns of ’data? Create limits to fill anymissing.
3. clipData = data with all xNames clipped to (lower, upper).
4. fit0 <- lm(formula, clipData, subset = subset, weights = weights, na.action = na.action, method= method, x=x, y=y, qr=qr, singular.ok=singular.ok, contrasts=contrasts, offset=offset, ...)
5. out = a logical matrix with two columns, indicating any of predict(fit0) outside (lower, up-per)[yName].
6. Add components lower and upper to fit0 and convert it to class c(’lmWinsor’, ’lm’).
7. If((method == ’clip’) || !any(out)), return(fit0).
8. Else, use quadratic programming (solve.QP) to minimize the ’Winsorized sum of squares ofresiduals’ as follows:
8.1. First find the prediction farthest outside (lower, upper)[yNames]. Set temporary limits at thenext closest point inside that point (or at the limit if that’s closer).
8.2. Use QP to minimize the sum of squares of residuals among all points not outside the tempo-rary limits while keeping the prediction for the exceptional point away from the interior of (lower,upper)[yNames].
8.3. Are the predictions for all points unconstrained in QP inside (lower, upper)[yNames]? If yes,quit.
8.4. Otherwise, among the points still unconstrained, find the prediction farthest outside (lower,upper)[yNames]. Adjust the temporary limits to the next closest point inside that point (or at thelimit if that’s closer).
8.5. Use QP as in 8.2 but with multiple exceptional points, then return to step 8.3.
9. Modify the components of fit0 as appropriate and return the result.
Value
an object of class ’lmWinsor’, which is either an object of class c(’lmWinsor’, ’lm’) or a list of suchobjects. A list is returned when length(trim) > 0 or is.list(lower) or is.list(upper). The length of theouput list is the max of length(trim) and the lengths of any lists provided for ’lower’ and ’upper’. Ifthese lengths are not the same, shorter ones are replicated to match the longest one.
An object of class c(’lmWinsor’, ’lm’) has ’lower’, ’upper’, ’out’, ’message’, and ’elapsed.time’components in addition to the standard ’lm’ components. The ’out’ component is a logical ma-trix identifying which predictions from the initial ’lm’ fit were below lower[yName] and aboveupper[yName]. If method = ’QP’ and the initial fit produces predictions outside the limits, this ob-ject returned will also include a component ’coefIter’ containing the model coefficients, the indexnumber of the observation in ’data’ transferred from the objective function to the constraints on thatiteration, plus the sum of squared residuals before and after clipping the predictions and the numberof predictions in 5 categories: below and at the lower limit, between the limits, and at and above theupper limit. The ’elapsed.time’ component gives the run time in seconds.
The options for ’message’ are as follows:

lmWinsor12 151
1 ’Initial fit in bounds’: All predictions were between ’lower’ and ’upper’ for ’y’.
2 ’QP iterations successful’: The QP iteration described in ’Details’, step 7, ter-minated with all predictions either at or between the ’lower’ and ’upper’ for’y’.
3 ’Iteration terminated by a singular quadratic program’: The QP iteration de-scribed in ’Details’, step 7, terminated when the model.matrix for the QP objec-tive function became rank deficient. (Rank deficient in this case means that thesmallest singular value is less than ’eps’ times the largest.)
In addition to the coefficients, ’coefIter’ also includes columns for ’SSEraw’ and ’SSEclipped’, con-taining the residual sums of squres from the estimated linear model before and after clipping to the’lower’ and ’upper’ limits for ’y’, plus ’nLoOut’, ’nLo.’, ’nIn’, ’nHi.’, and ’nHiOut’, summarizingthe distribtion of model predictions at each iteration relative to the limits.
Author(s)
Spencer Graves
See Also
predict.lmWinsor lmeWinsor lm quantile solve.QP
Examples
# example from 'anscombe'lm.1 <- lmWinsor(y1~x1, data=anscombe)
# no leverage to estimate the slopelm.1.5 <- lmWinsor(y1~x1, data=anscombe, trim=0.5)
# test nonlinear optimizationlm.1.25 <- lmWinsor(y1~x1, data=anscombe, trim=0.25)
# list examplelm.1. <- lmWinsor(y1~x1, data=anscombe, trim=c(0, 0.25, .4, .5))
lmWinsor12 Support functions for lmWinsor
Description
internal functions used by lmWinsor, not intended for direct use and may be changed in the futurewithout notice.

152 mean.fd
Usage
constraintCheck(Amat, bvec, eps=sqrt(.Machine$double.eps) )lmWinsor1(formula, data, lower=NULL, upper=NULL, trim=0,
quantileType=7, subset, weights=NULL, na.action,model = TRUE, x = FALSE, y = FALSE, qr = TRUE,singular.ok = TRUE, contrasts = NULL, offset=NULL,method=c('QP', 'clip'), eps=sqrt(.Machine$double.eps),trace=ceiling(sqrt(nrow(data))), ...)
lmWinsor2(formula, data, lower=NULL, upper=NULL, trim=0,quantileType=7, subset, weights=NULL, na.action,model = TRUE, x = FALSE, y = FALSE, qr = TRUE,singular.ok = TRUE, contrasts = NULL, offset=NULL,method=c('QP', 'clip'), eps=sqrt(.Machine$double.eps),trace=ceiling(sqrt(nrow(data))), ...)
Arguments
formula, data, lower, upper, trim, quantileType, subset, weights, na.action, model, x, y, qr, singular.ok, contrasts, offset, method, eps, trace, ...as for lmWinsor
Amat, bvec t(Amat) and bvec are arguments to solve.QP.
Author(s)
Spencer Graves
See Also
lmWinsor solve.QP
mean.fd Mean of Functional Data
Description
Evaluate the mean of a set of functions in a functional data object.
Usage
mean.fd(x, ...)
Arguments
x a functional data object.
... Other arguments to match the generic function for ’mean’

mean.fd 153
Value
a functional data object with a single replication that contains the mean of the functions in the objectfd.
See Also
stddev.fd, var.fd, sum.fd, center.fd mean
Examples
#### 1. univeriate: lip motion##liptime <- seq(0,1,.02)liprange <- c(0,1)
# ------------- create the fd object -----------------# use 31 order 6 splines so we can look at acceleration
nbasis <- 51norder <- 6lipbasis <- create.bspline.basis(liprange, nbasis, norder)
# ------------ apply some light smoothing to this object -------
lipLfdobj <- int2Lfd(4)lipLambda <- 1e-12lipfdPar <- fdPar(lipbasis, lipLfdobj, lipLambda)
lipfd <- smooth.basis(liptime, lip, lipfdPar)$fdnames(lipfd$fdnames) = c("Normalized time", "Replications", "mm")
lipmeanfd <- mean.fd(lipfd)plot(lipmeanfd)
#### 2. Trivariate: CanadianWeather##dayrng <- c(0, 365)
nbasis <- 51norder <- 6
weatherBasis <- create.fourier.basis(dayrng, nbasis)
weather.fd <- smooth.basis(day.5, CanadianWeather$dailyAv,weatherBasis)
str(weather.fd.mean <- mean.fd(weather.fd$fd))

154 monfn
melanoma melanoma 1936-1972
Description
These data from the Connecticut Tumor Registry present age-adjusted numbers of melanoma skin-cancer incidences per 100,000 people in Connectict for the years from 1936 to 1972.
Format
A data frame with 37 observations on the following 2 variables.
year Years 1936 to 1972.
incidence Rate of melanoma cancer per 100,000 population.
Details
This is a copy of the ’melanoma’ dataset in the ’lattice’ package. It is unrelated to the object of thesame name in the ’boot’ package.
Source
Ramsay, James O., and Silverman, Bernard W. (2006), Functional Data Analysis, 2nd ed., Springer,New York.
See Also
melanoma melanoma
Examples
plot(melanoma[, -1], type="b")
monfn Evaluates a monotone function
Description
Evaluates a monotone function
Usage
monfn(argvals, Wfdobj, basislist=vector("list", JMAX))

monfn 155
Arguments
argvals A numerical vector at which function and derivative are evaluated.
Wfdobj A functional data object.
basislist A list containing values of basis functions.
Details
This function evaluates a strictly monotone function of the form
h(x) = [D−1exp(Wfdobj)](x),
whereD−1 means taking the indefinite integral. The interval over which the integration takes placesis defined in the basis object in Wfdobj.
Value
A numerical vector or matrix containing the values the warping function h.
See Also
landmarkreg
Examples
## basically this example resembles part of landmarkreg.R that uses monfn.R to## estimate the warping function.
## Specify the curve subject to be registeredn=21tbreaks = seq(0, 2*pi, len=n)xval <- sin(tbreaks)rangeval <- range(tbreaks)
## Establish a B-spline basis for the curvewbasis <- create.bspline.basis(rangeval=rangeval, breaks=tbreaks)WfdPar <- fdPar(wbasis, 1, 1e-4)fdObj <- smooth.basis(tbreaks, xval, WfdPar)
## Set the mean landmark times. Note that the objective of the warping## function is to transform the curve such that the landmarks of the curve## occur at the designated mean landmark times.
## Specify the mean landmark times: tbreak[8]=2.2 and tbreaks[13]=3.76meanmarks <- c(rangeval[1], tbreaks[8], tbreaks[13], rangeval[2])## Specify landmark locations of the curve: tbreaks[6] and tbreaks[16]cmarks <- c(rangeval[1], tbreaks[6], tbreaks[16], rangeval[2])
## Establish a B-basis object for the warping functionWfd = smooth.morph(x=meanmarks, y=cmarks, WfdPar=WfdPar)$Wfdobj

156 monomial
## Estimate the warping functionh = monfn(tbreaks, Wfd)
## scale using a linear equation h such that h(0)=0 and h(END)=ENDb <- (rangeval[2]-rangeval[1])/ (h[n]-h[1])a <- rangeval[1] - b*h[1]h <- a + b*hplot(tbreaks, h, xlab="Time", ylab="Transformed time", type="b")
monomial Evaluate Monomial Basis
Description
Computes the values of the powers of argument t.
Usage
monomial(evalarg, exponents, nderiv=0)
Arguments
evalarg a vector of argument values.
exponents a vector of nonnegative integer values specifying the powers to be computed.
nderiv a nonnegative integer specifying the order of derivative to be evaluated.
Value
a matrix of values of basis functions. Rows correspond to argument values and columns to basisfunctions.
See Also
polynom, power, expon, fourier, polyg, bsplineS
Examples
# set up a monomial basis for the first five powersnbasis <- 5basisobj <- create.monomial.basis(c(-1,1),nbasis)# evaluate the basistval <- seq(-1,1,0.1)basismat <- monomial(tval, 1:basisobj$nbasis)

monomialpen 157
monomialpen Evaluate Monomial Roughness Penalty Matrix
Description
The roughness penalty matrix is the set of inner products of all pairs of a derivative of integer powersof the argument.
Usage
monomialpen(basisobj, Lfdobj=int2Lfd(2),rng=basisobj$rangeval)
Arguments
basisobj a monomial basis object.
Lfdobj either a nonnegative integer specifying an order of derivative or a linear differ-ential operator object.
rng the inner product may be computed over a range that is contained within therange defined in the basis object. This is a vector or length two defining therange.
Value
a symmetric matrix of order equal to the number of monomial basis functions.
See Also
polynompen, exponpen, fourierpen, bsplinepen, polygpen
Examples
# set up a monomial basis for the first five powersnbasis <- 5basisobj <- create.monomial.basis(c(-1,1),nbasis)# evaluate the rougness penalty matrix for the# second derivative.penmat <- monomialpen(basisobj, 2)

158 nondurables
MontrealTemp Montreal Daily Temperature
Description
Temperature in degrees Celsius in Montreal each day from 1961 through 1994
Usage
data(MontrealTemp)
Format
A numeric array with dimnames = list(1964:1992, names(dayOfYear)).
References
Ramsay, James O., Hooker, Giles, and Graves, Spencer B. (2009) Functional Data Analysis with Rand Matlab, Springer, New York (esp. Section 4.3)
See Also
CanadianWeather monthAccessories
Examples
data(MontrealTemp)
JanuaryThaw <- t(MontrealTemp[, 16:47])
nondurables Nondurable goods index
Description
US nondurable goods index time series, January 1919 to January 2000.
Format
An object of class ’ts’.
Source
Ramsay, James O., and Silverman, Bernard W. (2006), Functional Data Analysis, 2nd ed., Springer,New York.
Ramsay, James O., and Silverman, Bernard W. (2002), Applied Functional Data Analysis, Springer,New York, ch. 3.

norder 159
Examples
plot(nondurables, log="y")
norder Order of a B-spline
Description
norder = number of basis functions minus the number of interior knots.
Usage
norder(x, ...)## S3 method for class 'fd':norder(x, ...)## S3 method for class 'basisfd':norder(x, ...)## Default S3 method:norder(x, ...)norder.bspline(x, ...)
Arguments
x Either a basisfd object or an object containing a basisfd object as a component.
... optional arguments currently unused
Details
norder throws an error of basisfd[[’type’]] != ’bspline’.
Value
An integer giving the order of the B-spline.
Author(s)
Spencer Graves
See Also
create.bspline.basis

160 objAndNames
Examples
bspl1.1 <- create.bspline.basis(norder=1, breaks=0:1)
stopifnot(norder(bspl1.1)==1)
stopifnot(norder(fd(0, basisobj=bspl1.1))==1)
stopifnot(norder(fd(rep(0,4)))==4)
stopifnot(norder(list(fd(rep(0,4))))==4)## Not run:norder(list(list(fd(rep(0,4)))))Error in norder.default(list(list(fd(rep(0, 4))))) :input is not a 'basisfd' object and does not have a 'basisfd'
component.## End(Not run)
stopifnot(norder(create.bspline.basis(norder=1, breaks=c(0,.5, 1))) == 1)
stopifnot(norder(create.bspline.basis(norder=2, breaks=c(0,.5, 1))) == 2)
# Defaut B-spline basis: Cubic spline: degree 3, order 4,# 21 breaks, 19 interior knots.stopifnot(norder(create.bspline.basis()) == 4)
## Not run:norder(create.fourier.basis(c(0,12) ))Error in norder.bspline(x) :
object x is of type = fourier; 'norder' is only defined for type = 'bsline'## End(Not run)
objAndNames Add names to an object
Description
Add names to an object from ’preferred’ if available and ’default’ if not.
Usage
objAndNames(object, preferred, default)
Arguments
object an object of some type to which names must be added. If length(dim(object))>0add ’dimnames’, else add ’names’.
preferred A list to check first for names to add to ’object’.default A list to check for names to add to ’object’ if appropriate names are not found
in ’preferred’.

objAndNames 161
Details
1. If length(dim(object))<1, names(object) are taken from ’preferred’ if they are not NULL andhave the correct length, else try ’default’.
2. Else for(lvl in 1:length(dim(object))) take dimnames[[lvl]] from ’preferred[[i]]’ if they are notNULL and have the correct length, else try ’default[[lvl]].
Value
An object of the same class and structure as ’object’ but with either names or dimnames added orchanged.
Author(s)
Spencer Graves
See Also
data2fd, bifd
Examples
# The following should NOT check 'anything' heretst1 <- objAndNames(1:2, list(letters[1:2], LETTERS[1:2]), anything)all.equal(tst1, c(a=1, b=2))
# The following should return 'object unchangedtst2 <- objAndNames(1:2, NULL, list(letters))all.equal(tst2, 1:2)
tst3 <- objAndNames(1:2, list("a", 2), list(letters[1:2]))all.equal(tst3, c(a=1, b=2) )
# The following checks a matrix / arraytst4 <- array(1:6, dim=c(2,3))tst4a <- tst4dimnames(tst4a) <- list(letters[1:2], LETTERS[1:3])tst4b <- objAndNames(tst4,
list(letters[1:2], LETTERS[1:3]), anything)all.equal(tst4b, tst4a)
tst4c <- objAndNames(tst4, NULL,list(letters[1:2], LETTERS[1:3]) )
all.equal(tst4c, tst4a)
162 odesolv
odesolv Numerical Solution mth Order Differential Equation System
Description
The system of differential equations is linear, with possibly time-varying coefficient functions. Thenumerical solution is computed with the Runge-Kutta method.
Usage
odesolv(bwtlist, ystart=diag(rep(1,norder)),h0=width/100, hmin=width*1e-10, hmax=width*0.5,EPS=1e-4, MAXSTP=1000)
Arguments
bwtlist a list whose members are functional parameter objects defining the weight func-tions for the linear differential equation.
ystart a vector of initial values for the equations. These are the values at time 0 of thesolution and its first m - 1 derivatives.
h0 a positive initial step size.
hmin the minimum allowable step size.
hmax the maximum allowable step size.
EPS a convergence criterion.
MAXSTP the maximum number of steps allowed.
Details
This function is required to compute a set of solutions of an estimated linear differential equationin order compute a fit to the data that solves the equation. Such a fit will be a linear combinationsof m independent solutions.
Value
a named list of length 2 containing
tp a vector of time values at which the system is evaluated
yp a matrix of variable values corresponding to tp.
See Also
pda.fd,
Examples
#See the analyses of the lip data.

onechild 163
onechild growth in height of one 10-year-old boy
Description
Heights of a boy of age approximately 10 collected during one school year. The data were collected"over one school year, with gaps corresponding to the school vacations" (AFDA, p. 84)
Format
A data.frame with two columns:
day Integers counting the day into data collection with gaps indicating days during which datawere not collected.
height Height of the boy measured on the indicated day.
Source
Ramsay, James O., and Silverman, Bernard W. (2002), Applied Functional Data Analysis, 2nd ed.,Springer, New York.
Tuddenham, R. D., and Snyder, M. M. (1954) "Physical growth of California boys and girls frombirth to age 18", University of California Publications in Child Development, 1, 183-364.
Examples
with(onechild, plot(day, height, type="b"))
pca.fd Functional Principal Components Analysis
Description
Functional Principal components analysis aims to display types of variation across a sample offunctions. Principal components analysis is an exploratory data analysis that tends to be an earlypart of many projects. These modes of variation are called principalcomponents or harmonics.This function computes these harmonics, the eigenvalues that indicate how important each mode ofvariation, and harmonic scores for individual functions. If the functions are multivariate, these har-monics are combined into a composite function that summarizes joint variation among the severalfunctions that make up a multivariate functional observation.
Usage
pca.fd(fdobj, nharm = 2, harmfdPar=fdPar(fdobj),centerfns = TRUE)

164 pca.fd
Arguments
fdobj a functional data object.
nharm the number of harmonics or principal components to compute.
harmfdPar a functional parameter object that defines the harmonic or principal componentfunctions to be estimated.
centerfns a logical value: if TRUE, subtract the mean function from each function beforecomputing principal components.
Value
an object of class "pca.fd" with these named entries:
harmonics a functional data object for the harmonics or eigenfunctions
values the complete set of eigenvalues
scores s matrix of scores on the principal components or harmonics
varprop a vector giving the proportion of variance explained by each eigenfunction
meanfd a functional data object giving the mean function
See Also
cca.fd, pda.fd
Examples
# carry out a PCA of temperature# penalize harmonic acceleration, use varimax rotation
daybasis65 <- create.fourier.basis(c(0, 365), nbasis=65, period=365)
harmaccelLfd <- vec2Lfd(c(0,(2*pi/365)^2,0), c(0, 365))harmfdPar <- fdPar(daybasis65, harmaccelLfd, lambda=1e5)daytempfd <- data2fd(CanadianWeather$dailyAv[,,"Temperature.C"],
day.5, daybasis65, argnames=list("Day", "Station", "Deg C"))
daytemppcaobj <- pca.fd(daytempfd, nharm=4, harmfdPar)daytemppcaVarmx <- varmx.pca.fd(daytemppcaobj)# plot harmonicsop <- par(mfrow=c(2,2))plot.pca.fd(daytemppcaobj, cex.main=0.9)
plot.pca.fd(daytemppcaVarmx, cex.main=0.9)par(op)
plot(daytemppcaobj$harmonics)plot(daytemppcaVarmx$harmonics)

pda.fd 165
pda.fd Principal Differential Analysis
Description
Principal differential analysis (PDA) estimates a system of n linear differential equations that definefunctions that fit the data and their derivatives. There is an equation in the system for each variable.
Each equation has on its right side the highest order derivative that is used, and the order of thisderivative, mj , j = 1, ..., n can vary over equations.
On the left side of equation is a linear combination of all the variables and all the derivatives ofthese variables up to order one less than the order mj of the highest derivative.
In addition, the right side may contain linear combinations of forcing functions as well, with thenumber of forcing functions varying over equations.
The linear combinations are defined by weighting functions multiplying each variable, derivative,and forcing function in the equation. These weighting functions may be constant or vary over time.They are each represented by a functional parameter object, specifying a basis for an expansion of acoefficient, a linear differential operator for smoothing purposes, a smoothing parameter value, anda logical variable indicating whether the function is to be estimated, or kept fixed.
Usage
pda.fd(xfdlist, bwtlist=NULL,awtlist=NULL, ufdlist=NULL, nfine=501)
Arguments
xfdlist a list whose members are functional data objects representing each variable inthe system of differential equations. Each of these objects contain one or morecurves to be represented by the corresponding differential equation. The lengthof the list is equal to the number of differential equations. The number N ofreplications must be the same for each member functional data object.
bwtlist this argument contains the weight coefficients that multiply, in the right side ofeach equation, all the variables in the system, and all their derivatives, where thederivatives are used up to one less than the order of the variable. This argumenthas, in general, a three-level structure, defined by a three-level hierarchy of listobjects.At the top level, the argument is a single list of length equal to the number ofvariables. Each component of this list is itself a listAt the second level, each component of the top level list is itself a list, also oflength equal to the number of variables.At the third and bottom level, each component of a second level list is a list oflength equal to the number of orders of derivatives appearing on the right side ofthe equation, including the variable itself, a derivative of order 0. If m indicatesthe order of the equation, that is the order of the derivative on the left side, thenthis list is length m.

166 pda.fd
The components in the third level lists are functional parameter objects definingestimates for weight functions. For a first order equation, for example, m = 1and the single component in each list contains a weight function for the variable.Since each equation has a term involving each variable in the system, a systemof first order equations will have n2 at the third level of this structure.There MUST be a component for each weight function, even if the correspond-ing term does not appear in the equation. In the case of a missing term, thecorresponding component can be NULL, and it will be treated as a coefficientfixed at 0.However, in the case of a single differential equation, bwtlist can be given asimpler structure, since in this case only m coefficients are required. Therefore,for a single equation, bwtlist can be a list of length m with each componentcontaining a functional parameter object for the corresponding derivative.
awtlist a two-level list containing weight functions for forcing functions.In addition to terms in each of the equations involving terms corresponding toeach derivative of each variable in the system, each equation can also have acontribution from one or more exogenous variables, often called forcing func-tions.This argument defines the weights multiplying these forcing functions, and is alist of length n, the number of variables. Each component of this is is in turna list, each component of which contains a functional parameter object defininga weight function for a forcing function. If there are no forcing functions foran equation, this list can be NULL. If none of the equations involve forcingfunctions, awtlist can be NULL, which is its default value if it is not in theargument list.
ufdlist a two-level list containing forcing functions. This list structure is identical to thatfor awtlist, the only difference being that the components in the second levelcontain functional data objects for the forcing functions, rather than functionalparameter objects.
nfine a number of values for a fine mesh. The estimation of the differential equationinvolves discrete numerical quadrature estimates of integrals, and these requirethat functions be evaluated at a fine mesh of values of the argument. This argu-ment defines the number to use. The default value of 501 is reset to five times thelargest number of basis functions used to represent any variable in the system, ifthis number is larger.
Value
an object of class pda.fd, being a list with the following components:
bwtlist a list array of the same dimensions as the corresponding argument, containingthe estimated or fixed weight functions defining the system of linear differentialequations.
resfdlist a list of length equal to the number of variables or equations. Each members is afunctional data object giving the residual functions or forcing functions definedas the left side of the equation (the derivative of order m of a variable) minus thelinear fit on the right side. The number of replicates for each residual functionaldata object is the same as that for the variables.

pda.fd 167
awtlist a list of the same dimensions as the corresponding argument. Each member isan estimated or fixed weighting function for a forcing function.
See Also
pca.fd, cca.fd
Examples
#See analyses of daily weather data for examples.#### set up objects for examples### constant basis for estimating weight functionscbasis = create.constant.basis(c(0,1))# monomial basis: {1,t} for estimating weight functionsmbasis = create.monomial.basis(c(0,1),2)# quartic spline basis with 54 basis functions for# defining functions to be analyzedxbasis = create.bspline.basis(c(0,1),24,5)# set up functional parameter objects for weight basescfdPar = fdPar(cbasis)mfdPar = fdPar(mbasis)# sampling points over [0,1]tvec = seq(0,1,len=101)#### Example 1: a single first order constant coefficient unforced equation## Dx = -4*x for x(t) = exp(-4t)beta = 4xvec = exp(-beta*tvec)xfd = smooth.basis(tvec, xvec, xbasis)$fdxfdlist = list(xfd)bwtlist = list(cfdPar)# perform the principal differential analysisresult = pda.fd(xfdlist, bwtlist)# display weight coefficient for variablebwtlistout = result$bwtlistbwtfd = bwtlistout[[1]]$fdpar(mfrow=c(1,1))plot(bwtfd)title("Weight coefficient for variable")print(round(bwtfd$coefs,3))# display residual functionsreslist = result$resfdlistplot(reslist[[1]])title("Residual function")#### Example 2: a single first order varying coefficient unforced equation## Dx(t) = -t*x(t) or x(t) = exp(-t^2/2)bvec = tvecxvec = exp(-tvec^2/2)xfd = smooth.basis(tvec, xvec, xbasis)$fdxfdlist = list(xfd)

168 pda.fd
bwtlist = list(mfdPar)# perform the principal differential analysisresult = pda.fd(xfdlist, bwtlist)# display weight coefficient for variablebwtlistout = result$bwtlistbwtfd = bwtlistout[[1]]$fdpar(mfrow=c(1,1))plot(bwtfd)title("Weight coefficient for variable")print(round(bwtfd$coefs,3))# display residual functionreslist = result$resfdlistplot(reslist[[1]])title("Residual function")#### Example 3: a single second order constant coefficient unforced equation## Dx(t) = -(2*pi)^2*x(t) or x(t) = sin(2*pi*t)##xvec = sin(2*pi*tvec)xfd = smooth.basis(tvec, xvec, xbasis)$fdxfdlist = list(xfd)bwtlist = list(cfdPar,cfdPar)# perform the principal differential analysisresult = pda.fd(xfdlist, bwtlist)# display weight coefficientsbwtlistout = result$bwtlistbwtfd1 = bwtlistout[[1]]$fdbwtfd2 = bwtlistout[[2]]$fdpar(mfrow=c(2,1))plot(bwtfd1)title("Weight coefficient for variable")plot(bwtfd2)title("Weight coefficient for derivative of variable")print(round(c(bwtfd1$coefs, bwtfd2$coefs),3))print(bwtfd2$coefs)# display residual functionreslist = result$resfdlistpar(mfrow=c(1,1))plot(reslist[[1]])title("Residual function")#### Example 4: two first order constant coefficient unforced equations## Dx1(t) = x2(t) and Dx2(t) = -x1(t)## equivalent to x1(t) = sin(2*pi*t)##xvec1 = sin(2*pi*tvec)xvec2 = 2*pi*cos(2*pi*tvec)xfd1 = smooth.basis(tvec, xvec1, xbasis)$fdxfd2 = smooth.basis(tvec, xvec2, xbasis)$fdxfdlist = list(xfd1,xfd2)bwtlist = list(
list(list(cfdPar),

pda.fd 169
list(cfdPar)),
list(list(cfdPar),list(cfdPar))
)# perform the principal differential analysisresult = pda.fd(xfdlist, bwtlist)# display weight coefficientsbwtlistout = result$bwtlistbwtfd11 = bwtlistout[[1]][[1]][[1]]$fdbwtfd21 = bwtlistout[[2]][[1]][[1]]$fdbwtfd12 = bwtlistout[[1]][[2]][[1]]$fdbwtfd22 = bwtlistout[[2]][[2]][[1]]$fdpar(mfrow=c(2,2))plot(bwtfd11)title("Weight for variable 1 in equation 1")plot(bwtfd21)title("Weight for variable 2 in equation 1")plot(bwtfd12)title("Weight for variable 1 in equation 2")plot(bwtfd22)title("Weight for variable 2 in equation 2")print(round(bwtfd11$coefs,3))print(round(bwtfd21$coefs,3))print(round(bwtfd12$coefs,3))print(round(bwtfd22$coefs,3))# display residual functionsreslist = result$resfdlistpar(mfrow=c(2,1))plot(reslist[[1]])title("Residual function for variable 1")plot(reslist[[2]])title("Residual function for variable 2")#### Example 5: a single first order constant coefficient equation## Dx = -4*x for x(t) = exp(-4t) forced by u(t) = 2##beta = 4alpha = 2xvec0 = exp(-beta*tvec)intv = (exp(beta*tvec) - 1)/betaxvec = xvec0*(1 + alpha*intv)xfd = smooth.basis(tvec, xvec, xbasis)$fdxfdlist = list(xfd)bwtlist = list(cfdPar)awtlist = list(cfdPar)ufdlist = list(fd(1,cbasis))# perform the principal differential analysisresult = pda.fd(xfdlist, bwtlist, awtlist, ufdlist)# display weight coefficientsbwtlistout = result$bwtlist

170 pda.fd
bwtfd = bwtlistout[[1]]$fdawtlistout = result$awtlistawtfd = awtlistout[[1]]$fdpar(mfrow=c(2,1))plot(bwtfd)title("Weight for variable")plot(awtfd)title("Weight for forcing function")# display residual functionreslist = result$resfdlistpar(mfrow=c(1,1))plot(reslist[[1]], ylab="residual")title("Residual function")#### Example 6: two first order constant coefficient equations## Dx = -4*x for x(t) = exp(-4t) forced by u(t) = 2## Dx = -4*t*x for x(t) = exp(-4t^2/2) forced by u(t) = -1##beta = 4xvec10 = exp(-beta*tvec)alpha1 = 2alpha2 = -1xvec1 = xvec0 + alpha1*(1-xvec10)/betaxvec20 = exp(-beta*tvec^2/2)vvec = exp(beta*tvec^2/2);intv = 0.01*(cumsum(vvec) - 0.5*vvec)xvec2 = xvec20*(1 + alpha2*intv)xfd1 = smooth.basis(tvec, xvec1, xbasis)$fdxfd2 = smooth.basis(tvec, xvec2, xbasis)$fdxfdlist = list(xfd1, xfd2)bwtlist = list(
list(list(cfdPar),list(cfdPar)),
list(list(cfdPar),list(mfdPar))
)awtlist = list(list(cfdPar), list(cfdPar))ufdlist = list(list(fd(1,cbasis)), list(fd(1,cbasis)))# perform the principal differential analysisresult = pda.fd(xfdlist, bwtlist, awtlist, ufdlist)# display weight functions for variablesbwtlistout = result$bwtlistbwtfd11 = bwtlistout[[1]][[1]][[1]]$fdbwtfd21 = bwtlistout[[2]][[1]][[1]]$fdbwtfd12 = bwtlistout[[1]][[2]][[1]]$fdbwtfd22 = bwtlistout[[2]][[2]][[1]]$fdpar(mfrow=c(2,2))plot(bwtfd11)title("weight on variable 1 in equation 1")

pda.overlay 171
plot(bwtfd21)title("weight on variable 2 in equation 1")plot(bwtfd12)title("weight on variable 1 in equation 2")plot(bwtfd22)title("weight on variable 2 in equation 2")print(round(bwtfd11$coefs,3))print(round(bwtfd21$coefs,3))print(round(bwtfd12$coefs,3))print(round(bwtfd22$coefs,3))# display weight functions for forcing functionsawtlistout = result$awtlistawtfd1 = awtlistout[[1]][[1]]$fdawtfd2 = awtlistout[[2]][[1]]$fdpar(mfrow=c(2,1))plot(awtfd1)title("weight on forcing function in equation 1")plot(awtfd2)title("weight on forcing function in equation 2")# display residual functionsreslist = result$resfdlistpar(mfrow=c(2,1))plot(reslist[[1]])title("residual function for equation 1")plot(reslist[[2]])title("residual function for equation 2")
pda.overlay Stability Analysis for Principle Differential Analysis
Description
Overlays the results of a univariate, second-order principal differential analysis on a bifurcationdiagram to demonstrate stability.
Usage
pda.overlay(pdaList,nfine=501,ncoarse=11,...)
Arguments
pdaList a list object returned by pda.fd.nfine number of plotting points to use.ncoarse number of time markers to place along the plotted curve.... other arguments for ’plot’.
Details
Overlays a bivariate plot of the functional parameters in a univariate second-order principal differ-ential analysis on a bifurcation diagram.

172 phaseplanePlot
Value
None.
See Also
pda.fd plot.pda.fd eigen.pda
Examples
# This example looks at a principal differential analysis of the lip data# in Ramsay and Silverman (2005).
# First smooth the data
lipfd <- smooth.basisPar(liptime, lip, 6, Lfdobj=int2Lfd(4),lambda=1e-12)$fd
names(lipfd$fdnames) <- c("time(seconds)", "replications", "mm")
# Now we'll set up functional parameter objects for the beta coefficients.
lipbasis = lipfd$basisbwtlist = list(fdPar(lipbasis,2,0.0000),fdPar(lipbasis,2,0.0000))xfdlist <- list(lipfd)
# Call pda
pdaList <- pda.fd(xfdlist, bwtlist)
# And plot the overlay
pda.overlay(pdaList,lwd=2,cex.lab=1.5,cex.axis=1.5)
phaseplanePlot Phase-plane plot
Description
Plot acceleration (or Ldfobj2) vs. velocity (or Lfdobj1) of a function data object.
Usage
phaseplanePlot(evalarg, fdobj, Lfdobj1=1, Lfdobj2=2,lty=c("longdash", "solid"),
labels=list(evalarg=seq(evalarg[1], max(evalarg), length=13),labels=monthLetters),
abline=list(h=0, v=0, lty=2), xlab="Velocity",ylab="Acceleration", ...)

phaseplanePlot 173
Arguments
evalarg a vector of argument values at which the functional data object is to be evaluated.Defaults to a sequence of 181 points in the range specified by fdobj[["basis"]][["rangeval"]].If(length(evalarg) == 1)it is replaced by seq(evalarg[1], evalarg[1]+1, length=181).If(length(evalarg) == 2)it is replaced by seq(evalarg[1], evalarg[2], length=181).
fdobj a functional data object to be evaluated.
Lfdobj1 either a nonnegative integer or a linear differential operator object. The pointsplotted on the horizontal axis are eval.fd(evalarg, fdobj, Lfdobj1). By default,this is the velocity.
Lfdobj2 either a nonnegative integer or a linear differential operator object. The pointsplotted on the vertical axis are eval.fd(evalarg, fdobj, Lfdobj2). By default, thisis the acceleration.
lty line types for the first and second halves of the plot.
labels a list of length two:evalarg = a numeric vector of ’evalarg’ values to be labeled.labels = a character vector of labels, replicated to the same length as labels[["evalarg"]]in case it’s not of the same length.
abline arguments to a call to abline.
xlab x axis label
ylab y axis label
... optional arguments passed to plot.
Value
Invisibly returns a matrix with two columns containg the points plotted.
See Also
plot, eval.fd plot.fd
Examples
goodsbasis <- create.bspline.basis(rangeval=c(1919,2000),nbasis=979, norder=8)
LfdobjNonDur <- int2Lfd(4)
library(zoo)logNondurSm <- smooth.basisPar(argvals=index(nondurables),
y=log10(coredata(nondurables)), fdobj=goodsbasis,Lfdobj=LfdobjNonDur, lambda=1e-11)
phaseplanePlot(1964, logNondurSm$fd)

174 pinch
pinch pinch force data
Description
151 measurements of pinch force during 20 replications with time from start of measurement.
Usage
pinchpinchrawpinchtime
Format
pinch, pinchraw Matrices of dimension c(151, 20) = 20 replications of measuring pinch forceevery 2 milliseconds for 300 milliseconds. The original data included 300 observations.pinchraw consists of the first 151 of the 300 observations. pinch selected 151 obser-vations so the maximum of each curve occurred at 0.076 seconds.
pinchtime time in seconds from the start = seq(0, 0.3, 151) = every 2 milliseconds.
Details
Measurements every 2 milliseconds.
Source
Ramsay, James O., and Silverman, Bernard W. (2006), Functional Data Analysis, 2nd ed., Springer,New York, p. 13, Figure 1.11, pp. 22-23, Figure 2.2, and p. 144, Figure 7.13.
Examples
matplot (pinchtime, pinchraw, type="l", lty=1, cex=2,col=1, lwd=1, xlab = "Seconds", ylab="Force (N)")
abline(h=2, lty=2)
matplot (pinchtime, pinch, type="l", lty=1, cex=2,col=1, lwd=1, xlab = "Seconds", ylab="Force (N)")
abline(h=2, v=0.075, lty=2)

plot.basisfd 175
plot.basisfd Plot a Basis Object
Description
Plots all the basis functions.
Usage
## S3 method for class 'basisfd':plot(x, knots=TRUE, axes=NULL, ...)
Arguments
x a basis object
knots logical: If TRUE and x[[’type’]] == ’bslpine’, the knot locations are plottedusing vertical dotted, red lines. Ignored otherwise.
axes Either a logical or a list or NULL.
logical whether axes should be drawn on the plotlist a list used to create custom axes used to create axes via do.call(x$axes[[1]],
x$axes[-1]). The primary example of this uses list("axesIntervals",...), e.g., with Fourier bases to create CanadianWeather plots
... additional plotting parameters passed to matplot.
Value
none
Side Effects
a plot of the basis functions
See Also
plot.fd
Examples
#### 1. b-spline### set up the b-spline basis for the lip data, using 23 basis functions,# order 4 (cubic), and equally spaced knots.# There will be 23 - 4 = 19 interior knots at 0.05, ..., 0.95lipbasis <- create.bspline.basis(c(0,1), 23)# plot the basis functionsplot(lipbasis)

176 plot.fd
#### 2. Fourier basis##yearbasis3 <- create.fourier.basis(c(0,365),
axes=list("axesIntervals") )# plot the basisplot(yearbasis3)
plot.fd Plot a Functional Data Object
Description
Functional data observations, or a derivative of them, are plotted. These may be either plottedsimultaneously, as matplot does for multivariate data, or one by one with a mouse click to movefrom one plot to another. The function also accepts the other plot specification arguments that theregular plot does. Calling plot with an fdSmooth or an fdPar object plots its fd component.
Usage
## S3 method for class 'fd':plot(x, y, Lfdobj=0, href=TRUE, titles=NULL,
xlim=NULL, ylim=NULL, xlab=NULL,ylab=NULL, ask=FALSE, nx=NULL, axes=NULL, ...)
## S3 method for class 'fdPar':plot(x, y, Lfdobj=0, href=TRUE, titles=NULL,
xlim=NULL, ylim=NULL, xlab=NULL,ylab=NULL, ask=FALSE, nx=NULL, axes=NULL, ...)
## S3 method for class 'fdSmooth':plot(x, y, Lfdobj=0, href=TRUE, titles=NULL,
xlim=NULL, ylim=NULL, xlab=NULL,ylab=NULL, ask=FALSE, nx=NULL, axes=NULL, ...)
Arguments
x functional data object(s) to be plotted.
y sequence of points at which to evaluate the functions ’x’ and plot on the hori-zontal axis. Defaults to seq(rangex[1], rangex[2], length = nx).NOTE: This will be the values on the horizontal axis, NOT the vertical axis.
Lfdobj either a nonnegative integer or a linear differential operator object. If present,the derivative or the value of applying the operator is plotted rather than thefunctions themselves.
href a logical variable: If TRUE, add a horizontal reference line at 0.
titles a vector of strings for identifying curves

plot.fd 177
xlab a label for the horizontal axis.
ylab a label for the vertical axis.
xlim a vector of length 2 containing axis limits for the horizontal axis.
ylim a vector of length 2 containing axis limits for the vertical axis.
ask a logical value: If TRUE, each curve is shown separately, and the plot advanceswith a mouse click
nx the number of points to use to define the plot. The default is usually enough, butfor a highly variable function more may be required.
axes Either a logical or a list or NULL.
logical whether axes should be drawn on the plotlist a list used to create custom axes used to create axes via do.call(x$axes[[1]],
x$axes[-1]). The primary example of this uses list("axesIntervals",...), e.g., with Fourier bases to create CanadianWeather plots
... additional plotting arguments that can be used with function plot
Details
Note that for multivariate data, a suitable array must first be defined using the par function.
Value
’done’
Side Effects
a plot of the functional observations
See Also
lines.fd, plotfit.fd
Examples
#### plot.fd##
daybasis65 <- create.fourier.basis(c(0, 365), 65,axes=list("axesIntervals"))
harmaccelLfd <- vec2Lfd(c(0,(2*pi/365)^2,0), c(0, 365))
harmfdPar <- fdPar(daybasis65, harmaccelLfd, lambda=1e5)
daytempfd <- with(CanadianWeather, Data2fd(day.5,dailyAv[,,"Temperature.C"], daybasis65))
# plot all the temperature functions for the monthly weather dataplot(daytempfd, main="Temperature Functions")

178 plot.Lfd
## Not run:# To plot one at a time:# The following pauses to request page changes.
plot(daytempfd, ask=TRUE)## End(Not run)
#### plot.fdSmooth##b3.4 <- create.bspline.basis(norder=3, breaks=c(0, .5, 1))# 4 bases, order 3 = degree 2 =# continuous, bounded, locally quadraticfdPar3 <- fdPar(b3.4, lambda=1)
# Penalize excessive slope Lfdobj=1;# (Can not smooth on second derivative Lfdobj=2 at it is discontinuous.)fd3.4s0 <- smooth.basis(0:1, 0:1, fdPar3)
# using plot.fd directlyplot(fd3.4s0$fd)
# same plot via plot.fdSmoothplot(fd3.4s0)
plot.Lfd Plot a Linear Differential Operator Object
Description
Plot the coefficents of the terms of order 0 through m-1 of an object of class Lfd and length m.
Usage
## S3 method for class 'Lfd':plot(x, axes=NULL, ...)
Arguments
x a linear differential operator object to be plotted.
axes Either a logical or a list or NULL passed to plot.fd.
logical whether axes should be drawn on the plotlist a list used to create custom axes used to create axes via do.call(x$axes[[1]],
x$axes[-1]). The primary example of this uses list("axesIntervals",...), e.g., with Fourier bases to create CanadianWeather plots
... additional plotting arguments that can be used with function plot

plot.lmWinsor 179
Value
invisible(NULL)
Side Effects
a plot of the lindear differential operator object.
See Also
Lfd, plot.fd
Examples
# Set up the harmonic acceleration operatordayrange <- c(0,365)Lbasis <- create.constant.basis(dayrange,
axes=list("axesIntervals"))Lcoef <- matrix(c(0,(2*pi/365)^2,0),1,3)bfdobj <- fd(Lcoef,Lbasis)bwtlist <- fd2list(bfdobj)harmaccelLfd <- Lfd(3, bwtlist)plot(harmaccelLfd)
plot.lmWinsor lmWinsor plot
Description
plot an lmWinsor model or list of models as line(s) with the data as points
Usage
## S3 method for class 'lmWinsor':plot(x, n=101, lty=1:9, col=1:9,
lwd=c(2:4, rep(3, 6)), lty.y=c('dotted', 'dashed'),lty.x = lty.y, col.y=1:9, col.x= col.y, lwd.y = c(1.2, 1),lwd.x=lwd.y, ...)
Arguments
x an object of class ’lmWinsor’, which is either a list of objects of class c(’lmWinsor’,’lm’) or is a single object of that double class. Each object of class c(’lmWinsor’,’lm’) is the result of a single ’lmWinsor’ fit. If ’x’ is a list, it summarizes multi-ple fits with different limits to the same data.
n integer; with only one explanatory variable ’xNames’ in the model, ’n’ is thenumber of values at which to evaluate the model predictions. This is ignored ifthe number of explanatory variable ’xNames’ in the model is different from 1.

180 plot.pca.fd
lty, col, lwd, lty.y, lty.x, col.y, col.x, lwd.y, lwd.x’lty’, ’col’ and ’lwd’ are each replicated to a length matching the number of fitssummarized in ’x’ and used with one line for each fit in the order appearing in’x’. The others refer to horizontal and vertical limit lines.
... optional arguments for ’plot’
Details
1. One fit or several?
2. How many explanatory variables are involved in the model(s) in ’x’? If only one, then theresponse variable is plotted vs. that one explanatory variable. Otherwise, the response is plotted vs.predictions.
3. Plot the data.
4. Plot one line for each fit with its limits.
Value
invisible(NULL)
Author(s)
Spencer Graves
See Also
lmWinsor plot
Examples
lm.1 <- lmWinsor(y1~x1, data=anscombe)plot(lm.1)plot(lm.1, xlim=c(0, 15), main="other title")
# list examplelm.1. <- lmWinsor(y1~x1, data=anscombe, trim=c(0, 0.25, .4, .5))plot(lm.1.)
plot.pca.fd Plot Functional Principal Components
Description
Display the types of variation across a sample of functions. Label with the eigenvalues that indicatethe relative importance of each mode of variation.

plot.pca.fd 181
Usage
plot.pca.fd(x, nx = 128, pointplot = TRUE, harm = 0,expand = 0, cycle = FALSE, ...)
Arguments
x a functional data object.
nx Number of points to plot or vector (if length > 1) to use as evalarg in evalu-ating and plotting the functional principal components.
pointplot logical: If TRUE, the harmonics / principal components are plotted as ’+’ and’-’. Otherwise lines are used.
harm Harmonics / principal components to plot. If 0, plot all.If length(harm) > sum(par("mfrow")), the user advised, "Waiting to confirmpage change..." and / or ’Click or hit ENTER for next page’ for each page afterthe first.
expand nonnegative real: If expand == 0 then effect of +/- 2 standard deviations of eachpc are given otherwise the factor expand is used.
cycle logical: If cycle=TRUE and there are 2 variables then a cycle plot will be drawnIf the number of variables is anything else, cycle will be ignored.
... other arguments for ’plot’.
Details
Produces one plot for each principal component / harmonic to be plotted.
Value
invisible(NULL)
See Also
cca.fd, pda.fd plot.pca.fd
Examples
# carry out a PCA of temperature# penalize harmonic acceleration, use varimax rotation
daybasis65 <- create.fourier.basis(c(0, 365), nbasis=65, period=365)
harmaccelLfd <- vec2Lfd(c(0,(2*pi/365)^2,0), c(0, 365))harmfdPar <- fdPar(daybasis65, harmaccelLfd, lambda=1e5)daytempfd <- data2fd(CanadianWeather$dailyAv[,,"Temperature.C"],
day.5, daybasis65, argnames=list("Day", "Station", "Deg C"))
daytemppcaobj <- pca.fd(daytempfd, nharm=4, harmfdPar)# plot harmonics, asking before each new page after the first:

182 plot.pda.fd
plot.pca.fd(daytemppcaobj)
# plot 4 on 1 pageop <- par(mfrow=c(2,2))plot.pca.fd(daytemppcaobj, cex.main=0.9)par(op)
plot.pda.fd Plot Principle Differential Analysis Components
Description
Plots the results of pda.fd, allows the user to group coefficient functions by variable, equation,derivative or combination of them.
Usage
## S3 method for class 'pda.fd':plot(x,whichdim=1,npts=501,...)
Arguments
x an object of class pda.fd.
whichdim which dimension to use as grouping variables
1 coefficients of each variable differential equation2 coefficient functions for each equation3 coefficients of derivatives of each variable
whichdim should be an ordered vector of length between 1 and 3.
npts number of points to use for plotting.
... other arguments for ’plot’.
Details
Produces one plot for each coefficient function in a principle differential analysis.
Value
invisible(NULL)
See Also
pda.fd eigen.pda

plot.pda.fd 183
Examples
# A pda analysis of the handwriting data
fdaarray = handwritfdatime <- seq(0, 2.3, len=1401)
# basis for coordinates
fdarange <- c(0, 2.3)breaks = seq(0,2.3,length.out=501)norder = 6fdabasis = create.bspline.basis(fdarange,norder=norder,breaks=breaks)
# parameter object for coordinates
fdaPar = fdPar(fdabasis,int2Lfd(4),1e-8)
# coordinate functions and a list tontaining them
Xfd = smooth.basis(fdatime, fdaarray[,,1], fdaPar)$fdYfd = smooth.basis(fdatime, fdaarray[,,2], fdaPar)$fd
xfdlist = list(Xfd, Yfd)
# basis and parameter object for weight functions
fdabasis2 = create.bspline.basis(fdarange,norder=norder,nbasis=51)pdaPar = fdPar(fdabasis2,1,1e-8)
pdaParlist = list(pdaPar, pdaPar)
bwtlist = list( list(pdaParlist,pdaParlist), list(pdaParlist,pdaParlist) )
# do the second order pda
pdaList = pda.fd(xfdlist, bwtlist)
# plot the results
plot(pdaList,whichdim=1)plot(pdaList,whichdim=2)plot(pdaList,whichdim=3)
plot(pdaList,whichdim=c(1,2))plot(pdaList,whichdim=c(1,3))plot(pdaList,whichdim=c(2,3))
plot(pdaList,whichdim=1:3)

184 plotfit
plotbeta Plot a functional parameter object with confidence limits
Description
Plot a functional parameter object with confidence limits
Usage
plotbeta(betaestlist, betastderrlist, argvals=NULL, xlab="", ...)
Arguments
betaestlist a list containing one or more functional parameter objects (class = fdPar) orfunctional data objects (class = fd).
betastderrlista list containing functional data objects for the standard errors of the objects inbetaestlist.
argvals a sequence of values at which to evaluate betaestlist and betastderrlist.
xlab x axis label
... additional plotting parameters passed to plot.
Value
none
Side Effects
a plot of the basis functions
See Also
plot.fd
plotfit Plot a Functional Data Object With Data
Description
Plot either functional data observations ’x’ with a fit ’fdobj’ or residuals from the fit.
This function is useful for assessing how well a functional data object fits the actual discrete data.
The default is to make one plot per functional observation with fit if residual is FALSE and super-imposed lines if residual==TRUE.
With multiple plots, the system waits to confirm a desire to move to the next page unless ask==FALSE.

plotfit 185
Usage
plotfit.fd(y, argvals, fdobj, rng = NULL, index = NULL,nfine = 101, residual = FALSE, sortwrd = FALSE, titles=NULL,ylim=NULL, ask=TRUE, type=c("p", "l")[1+residual],xlab=NULL, ylab=NULL, sub=NULL, col=1:9, lty=1:9, lwd=1,cex.pch=1, axes=NULL, ...)
plotfit.fdSmooth(y, argvals, fdSm, rng = NULL, index = NULL,nfine = 101, residual = FALSE, sortwrd = FALSE, titles=NULL,ylim=NULL, ask=TRUE, type=c("p", "l")[1+residual],xlab=NULL, ylab=NULL, sub=NULL, col=1:9, lty=1:9, lwd=1,cex.pch=1, axes=NULL, ...)
Arguments
y a vector, matrix or array containing the discrete observations used to estimatethe functional data object.
argvals a vector containing the argument values corresponding to the first dimension ofy.
fdobj a functional data object estimated from the data.
fdSm an object of class fdSmooth
rng a vector of length 2 specifying the limits for the horizontal axis. This must be asubset of fdobj[[’basis’]][[’rangeval’]], which is the default.
index a set of indices of functions if only a subset of the observations are to be plotted.Subsetting can also be achieved by subsetting y; see details, below.
nfine the number of argument values used to define the plot of the functional dataobject. This may need to be increased if the functions have a great deal of finedetail.
residual a logical variable: if TRUE, the residuals are plotted rather than the data andfunctional data object.
sortwrd a logical variable: if TRUE, the observations (i.e., second dimension of y) aresorted for plotting by the size of the sum of squared residuals.
titles a vector containing strings that are titles for each observation.
ylim a numeric vector of length 2 giving the y axis limits; see ’par’.
ask If TRUE and if ’y’ has more levels than the max length of col, lty, lwd andcex.pch, the user must confirm page change before the next plot will be created.
type type of plot desired, as described with plot. If residual == FALSE, ’type’controls the representation for ’x’, which will typically be ’p’ to plot points butnot lines; ’fdobj’ will always plot as a line. If residual == TRUE, the defaulttype == "l"; an alternative is "b" for both.
xlab x axis label.
ylab Character vector of y axis labels. If(residual), ylab defaults to ’Residuals’,else to varnames derived from names(fdnames[[3]] or fdnames[[3]] or dim-names(y)[[3]].
sub subtitle under the x axis label. Defaults to the RMS residual from the smooth.

186 plotfit
col, lty, lwd, cex.pchNumeric or character vectors specifying the color (col), line type (lty), line width(lwd) and size of plotted character symbols (cex.pch) of the data representationon the plot.If ask==TRUE, the length of the longest of these determines the number of levelsof the array ’x’ in each plot before asking the user to acknowledge a desire tochange to the next page. Each of these is replicated to that length, so col[i] isused for x[,i] (if x is 2 dimensional), with line type and width controlled by lty[i]and lwd[i], respectively.If ask==FALSE, these are all replicated to length = the number of plots to besuperimposed.For more information on alternative values for these paramters, see ’col’, ’lty’,’lwd’, or ’cex’ with par.
axes Either a logical or a list or NULL.
logical whether axes should be drawn on the plotlist a list used to create custom axes used to create axes via do.call(x$axes[[1]],
x$axes[-1]). The primary example of this uses list("axesIntervals",...), e.g., with Fourier bases to create CanadianWeather plots
... additional arguments such as axis labels that may be used with other plotfunctions.
Details
plotfit plots discrete data along with a functional data object for fitting the data. It is designed tobe used after something like data2fd, smooth.fd, smooth.basis or smoothe.basisParto check the fit of the data offered by the fd object.
plotfit.fdSmooth calls plotfit for its ’fd’ component.
The plot can be restricted to a subset of observations (i.e., second dimension of y) or variables (i.e.,third dimension of y) by providing y with the dimnames for its second and third dimensions match-ing a subset of the dimnames of fdobj[[’coef’]] (for plotfit.fd or fdSm[[’fdobj’]][[’coef’]]for plotfit.fdSmooth). If only one observation or variable is to be plotted, y must include’drop = TRUE’, as, e.g., y[, 2, 3, drop=TRUE]. If y or fdobj[[’coef’]] does not have dimnames onits second or third dimension, subsetting is acheived by taking the first few colums so the secondor third dimensions match. This is acheived using checkDims3(y, fdobj[[’coef’]], defaultNames =fdobj[[’fdnames’]]]).
Value
A matrix of mean square deviations from predicted is returned invisibly. If fdobj[["coefs"]] is a 3-dimensional array, this is a matrix of dimensions equal to the last two dimensions of fdobj[["coefs"]].This will typically be the case when x is also a 3-dimensional array with the last two dimensionsmatching those of fdobj[["coefs"]]. The second dimension is typically replications and the thirddifferent variables.
If x and fobj[["coefs"]] are vectors or 2-dimensional arrays, they are padded to three dimensions,and then MSE is computed as a matrix with the second dimension = 1; if x and fobj[["coefs"]] arevectors, the first dimension of the returned matrix will also be 1.

plotfit 187
Side Effects
a plot of the the data ’x’ with the function or the deviations between observed and predicted, de-pending on whether residual is FALSE or TRUE.
See Also
plot, plot.fd, lines.fd plot.fdSmooth, lines.fdSmooth par data2fd smooth.fdsmooth.basis smooth.basisPar checkDims3
Examples
daybasis65 <- create.fourier.basis(c(0, 365), 65,axes=list("axesIntervals"))
daytempfd <- with(CanadianWeather, data2fd(dailyAv[,,"Temperature.C"], day.5,daybasis65, argnames=list("Day", "Station", "Deg C")) )
with(CanadianWeather, plotfit.fd(dailyAv[, , "Temperature.C"],argvals= day.5, daytempfd, index=1, titles=place) )
# Default ylab = daytempfd[['fdnames']]
with(CanadianWeather, plotfit.fd(dailyAv[, , "Temperature.C",drop=FALSE], argvals= day.5, daytempfd, index=1, titles=place) )
# Better: ylab = dimnames(y)[[3]]
## Not run:# The following pauses to request page changes.# (Without 'dontrun', the package build process# might encounter problems with the par(ask=TRUE)# feature.)with(CanadianWeather, plotfit.fd(
dailyAv[,, "Temperature.C"], day.5,daytempfd, ask=TRUE) )
## End(Not run)
# If you want only the fitted functions, use plot(daytempfd)
# To plot only a single fit vs. observations, use index# to request which one you want.
op <- par(mfrow=c(2,1), xpd=NA, bty="n")# xpd=NA: clip lines to the device region,# not the plot or figure region# bty="n": Do not draw boxes around the plots.ylim <- range(CanadianWeather$dailyAv[,,"Temperature.C"])# Force the two plots to have the same scalewith(CanadianWeather, plotfit.fd(dailyAv[,,"Temperature.C"], day.5,
daytempfd, index=2, titles=place, ylim=ylim) )
with(CanadianWeather, plotfit.fd(dailyAv[,,"Temperature.C"], day.5,daytempfd, index=35, titles=place, ylim=ylim) )

188 plotscores
par(op)
# plot residualswith(CanadianWeather, plotfit.fd(dailyAv[, , "Temperature.C"],
day.5, daytempfd, residual=TRUE) )# Can't read this, so try with 2 lines per page with ask=TRUE,# and limiting length(col), length(lty), etc. <=2## Not run:with(CanadianWeather, plotfit.fd(
dailyAv[,,"Temperature.C"], day.5,daytempfd, residual=TRUE, col=1:2, lty=1, ask=TRUE) )
## End(Not run)
plotscores Plot Principal Component Scores
Description
The coefficients multiplying the harmonics or principal component functions are plotted as points.
Usage
plotscores(pcafd, scores=c(1, 2), xlab=NULL, ylab=NULL,loc=1, matplt2=FALSE, ...)
Arguments
pcafd an object of the "pca.fd" class that is output by function pca.fd.
scores the indices of the harmonics for which coefficients are plotted.
xlab a label for the horizontal axis.
ylab a label for the vertical axis.
loc an integer: if loc >0, you can then click on the plot in loc places and you’ll getplots of the functions with these values of the principal component coefficients.
matplt2 a logical value: if TRUE, the curves are plotted on the same plot; otherwise, theyare plotted separately.
... additional plotting arguments used in function plot.
Side Effects
a plot of scores
See Also
pca.fd

polyg 189
polyg Polygonal Basis Function Values
Description
Evaluates a set of polygonal basis functions, or a derivative of these functions, at a set of arguments.
Usage
polyg(x, argvals, nderiv=0)
Arguments
x a vector of argument values at which the polygonal basis functions are to evalu-ated.
argvals a strictly increasing set of argument values containing the range of x within itthat defines the polygonal basis. The default is x itself.
nderiv the order of derivative to be evaluated. The derivative must not exceed one. Thedefault derivative is 0, meaning that the basis functions themselves are evaluated.
Value
a matrix of function values. The number of rows equals the number of arguments, and the numberof columns equals the number of basis
See Also
create.polygonal.basis, polygpen
Examples
# set up a set of 21 argument valuesx <- seq(0,1,0.05)# set up a set of 11 argument valuesargvals <- seq(0,1,0.1)# with the default period (1) and derivative (0)basismat <- polyg(x, argvals)# plot the basis functionsmatplot(x, basismat, type="l")

190 polygpen
polygpen Polygonal Penalty Matrix
Description
Computes the matrix defining the roughness penalty for functions expressed in terms of a polygonalbasis.
Usage
polygpen(basisobj, Lfdobj=int2Lfd(1))
Arguments
basisobj a polygonal functional basis object.
Lfdobj either an integer that is either 0 or 1, or a linear differential operator object ofdegree 0 or 1.
Details
a roughness penalty for a function x(t) is defined by integrating the square of either the derivativeof x(t) or, more generally, the result of applying a linear differential operator L to it. The onlyroughness penalty possible aside from penalizing the size of the function itself is the integral of thesquare of the first derivative, and this is the default. To apply this roughness penalty, the matrix ofinner products produced by this function is necessary.
Value
a symmetric matrix of order equal to the number of basis functions defined by the polygonal ba-sis object. Each element is the inner product of two polygonal basis functions after applying thederivative or linear differential operator defined by Lfdobj.
See Also
create.polygonal.basis, polyg
Examples
# set up a sequence of 11 argument valuesargvals <- seq(0,1,0.1)# set up the polygonal basisbasisobj <- create.polygonal.basis(argvals)# compute the 11 by 11 penalty matrix
penmat <- polygpen(basisobj)

powerbasis 191
powerbasis Power Basis Function Values
Description
Evaluates a set of power basis functions, or a derivative of these functions, at a set of arguments.
Usage
powerbasis(x, exponents, nderiv=0)
Arguments
x a vector of argument values at which the power basis functions are to evaluated.Since exponents may be negative, for example after differentiation, it is requiredthat all argument values be positive.
exponents a vector of exponents defining the power basis functions. If y is such a ratevalue, the corresponding basis function is x to the power y. The number of basisfunctions is equal to the number of exponents.
nderiv the derivative to be evaluated. The derivative must not exceed the order. Thedefault derivative is 0, meaning that the basis functions themselves are evaluated.
Value
a matrix of function values. The number of rows equals the number of arguments, and the numberof columns equals the number of basis functions.
See Also
create.power.basis, powerpen
Examples
# set up a set of 10 positive argument values.x <- seq(0.1,1,0.1)# compute values for three power basis functionsexponents <- c(0, 1, 2)# evaluate the basis matrixbasismat <- powerbasis(x, exponents)

192 powerpen
powerpen Power Penalty Matrix
Description
Computes the matrix defining the roughness penalty for functions expressed in terms of a powerbasis.
Usage
powerpen(basisobj, Lfdobj=int2Lfd(2))
Arguments
basisobj a power basis object.
Lfdobj either a nonnegative integer or a linear differential operator object.
Details
A roughness penalty for a function x(t) is defined by integrating the square of either the derivativeof x(t) or, more generally, the result of applying a linear differential operator L to it. The mostcommon roughness penalty is the integral of the square of the second derivative, and this is thedefault. To apply this roughness penalty, the matrix of inner products produced by this function isnecessary.
Value
a symmetric matrix of order equal to the number of basis functions defined by the power basisobject. Each element is the inner product of two power basis functions after applying the derivativeor linear differential operator defined by Lfdobj.
See Also
create.power.basis, powerbasis
Examples
# set up an power basis with 3 basis functions.# the powers are 0, 1, and 2.basisobj <- create.power.basis(c(0,1),3,c(0,1,2))# compute the 3 by 3 matrix of inner products of second derivatives#FIXME#penmat <- powerpen(basisobj, 2)

predict.fRegress 193
predict.fRegress Predict method for Functional Regression
Description
Model predictions for object of class fRegress.
Usage
## S3 method for class 'fRegress':predict(object, newdata=NULL, se.fit = FALSE,
interval = c("none", "confidence", "prediction"),level = 0.95, ...)
Arguments
object Object of class inheriting from lmWinsor
newdata Either NULL or a list matching object$xfdlist.If(is.null(newdata)) predictions <- object$yhatfdobjIf newdata is a list, predictions = the sum of either newdata[i] * betaestfdlist[i] ifobject$yfdobj has class fd or inprod( newdata[i], betaestfdlist[i]) if class(object$yfdobj)= numeric.
se.fit a switch indicating if standard errors of predictions are requiredinterval type of prediction (response or model term)level Tolerance/confidence level
... additional arguments for other methods
Details
1. Without newdata, fit <- object$yhatfdobj.
2. With newdata, if(class(object$y) == ’numeric’), fit <- sum over i of inprod(betaestlist[i], new-data[i]). Otherwise, fit <- sum over i of betaestlist[i] * newdata[i].
3. If(se.fit | (interval != ’none’)) compute se.fit, then return whatever is desired.
Value
The predictions produced by predict.fRegress are either a vector or a functional parameter(class fdPar) object, matching the class of object$y.
If interval is not "none", the predictions will be multivariate for object$y and the requestedlwr and upr bounds. If object$y is a scalar, these predictions are returned as a matrix; other-wise, they are a multivariate functional parameter object (class fdPar).
If se.fit is TRUE, predict.fRegress returns a list with the following components:
fit vector or matrix or univariate or multivariate functional parameter object de-pending on the value of interval and the class of object$y.
se.fit standard error of predicted means

194 predict.fRegress
Author(s)
Spencer Graves
See Also
fRegress predict
Examples
######### vector response with functional explanatory variable########## example from help('lm')##ctl <- c(4.17,5.58,5.18,6.11,4.50,4.61,5.17,4.53,5.33,5.14)trt <- c(4.81,4.17,4.41,3.59,5.87,3.83,6.03,4.89,4.32,4.69)group <- gl(2,10,20, labels=c("Ctl","Trt"))weight <- c(ctl, trt)fRegress.D9 <- fRegress(weight ~ group)
pred.fR.D9 <- predict(fRegress.D9)# Now compare with 'lm'lm.D9 <- lm(weight ~ group)pred.lm.D9 <- predict(lm.D9)
all.equal(as.vector(pred.fR.D9), as.vector(pred.lm.D9))
#### vector response with functional explanatory variable##annualprec <- log10(apply(CanadianWeather$dailyAv[,,
"Precipitation.mm"], 2,sum))smallbasis <- create.fourier.basis(c(0, 365), 25)tempfd <- smooth.basis(day.5,
CanadianWeather$dailyAv[,,"Temperature.C"], smallbasis)$fdprecip.Temp.f <- fRegress(annualprec ~ tempfd)
#precip.Temp.p <- predict(precip.Temp.f, interval='confidence')
#class(precip.Temp.p) == 'matrix'
## ***** not yet implemented *****
#### Example using se.fit##

predict.lmeWinsor 195
#precip.Temp.p <- predict(precip.Temp.f, se.fit=TRUE)
#class(precip.Temp.p) == 'list'
## ***** not yet implemented *****
######### functional response with### (concurrent) functional explanatory variable########## predict knee angle from hip angle; from demo('gait', package='fda')##(gaittime <- as.numeric(dimnames(gait)[[1]])*20)gaitrange <- c(0,20)gaitbasis <- create.fourier.basis(gaitrange, nbasis=21)harmaccelLfd <- vec2Lfd(c(0, (2*pi/20)^2, 0), rangeval=gaitrange)gaitfd <- smooth.basisPar(gaittime, gait,
gaitbasis, Lfdobj=harmaccelLfd, lambda=1e-2)$fdhipfd <- gaitfd[,1]kneefd <- gaitfd[,2]knee.hip.f <- fRegress(kneefd ~ hipfd)
knee.hip.pred <- predict(knee.hip.f)plot(knee.hip.pred)
predict.lmeWinsor Predict method for Winsorized linear model fits with mixed effects
Description
Model predictions for object of class ’lmeWinsor’.
Usage
## S3 method for class 'lmeWinsor':predict(object, newdata, level=Q, asList=FALSE,
na.action=na.fail, ...)
Arguments
object Object of class inheriting from ’lmeWinsor’, representing a fitted linear mixed-effects model.

196 predict.lmeWinsor
newdata an optional data frame to be used for obtaining the predictions. All variablesused in the fixed and random effects models, as well as the grouping factors,must be present in the data frame. If missing, the fitted values are returned.
level an optional integer vector giving the level(s) of grouping to be used in obtainingthe predictions. Level values increase from outermost to innermost grouping,with level zero corresponding to the population predictions. Defaults to thehighest or innermost level of grouping.
asList an optional logical value. If ’TRUE’ and a single value is given in ’level’, thereturned object is a list with the predictions split by groups; else the returnedvalue is either a vector or a data frame, according to the length of ’level’.
na.action a function that indicates what should happen when ’newdata’ contains ’NA’s.The default action (’na.fail’) causes the function to print an error message andterminate if there are any incomplete observations.
... additional arguments for other methods
Details
1. Identify inputs and outputs as with lmeWinsor.
2. If ’newdata’ are provided, clip all numeric xNames to (object[["lower"]], object[["upper"]]).
3. Call predict.lme
4. Clip the responses to the relevant components of (object[["lower"]], object[["upper"]]).
5. Done.
Value
’predict.lmeWinsor’ produces a vector of predictions or a matrix of predictions with limits or a list,as produced by predict.lme
Author(s)
Spencer Graves
See Also
lmeWinsor predict.lme lmWinsor predict.lm
Examples
fm1w <- lmeWinsor(distance ~ age, data = Orthodont,random=~age|Subject)
# predict with newdatanewDat <- data.frame(age=seq(0, 30, 2),
Subject=factor(rep("na", 16)) )pred1w <- predict(fm1w, newDat, level=0)
# fit with 10 percent Winsorizationfm1w.1 <- lmeWinsor(distance ~ age, data = Orthodont,
random=~age|Subject, trim=0.1)

predict.lmWinsor 197
pred30 <- predict(fm1w.1)stopifnot(all.equal(as.numeric(
quantile(Orthodont$distance, c(.1, .9))),range(pred30)) )
predict.lmWinsor Predict method for Winsorized linear model fits
Description
Model predictions for object of class ’lmWinsor’.
Usage
## S3 method for class 'lmWinsor':predict(object, newdata, se.fit = FALSE,
scale = NULL, df = Inf,interval = c("none", "confidence", "prediction"),level = 0.95, type = c("response", "terms"),terms = NULL, na.action = na.pass,pred.var = res.var/weights, weights = 1, ...)
Arguments
object Object of class inheriting from ’lmWinsor’
newdata An optional data frame in which to look for variables with which to predict. Ifomitted, the fitted values are used.
se.fit a switch indicating if standard errors of predictions are required
scale Scale parameter for std.err. calculation
df degrees of freedom for scale
interval type of prediction (response or model term)
level Tolerance/confidence level
type Type of prediction (response or model term); see predict.lm
terms If ’type="terms"’, which terms (default is all terms)
na.action function determining what should be done with missing values in ’newdata’.The default is to predict ’NA’.
pred.var the variance(s) for future observations to be assumed for prediction intervals.See predict.lm ’Details’.
weights variance weights for prediction. This can be a numeric vector or a one-sidedmodel formula. In the latter case, it is interpreted as an expression evaluated in’newdata’
... additional arguments for other methods

198 predict.lmWinsor
Details
1. Identify inputs and outputs via mdly <- mdlx <- formula(object); mdly[[3]] <- NULL; mdlx[[2]]<- NULL; xNames <- all.vars(mdlx); yNames <- all.vars(mdly). Give an error if as.character(mdly[[2]])!= yNames.
2. If ’newdata’ are provided, clip all numeric xNames to (object[["lower"]], object[["upper"]]).
3. Call predict.lm
4. Clip the responses to the relevant components of (object[["lower"]], object[["upper"]]).
5. Done.
Value
If class(object) == c(’lmWinsor’, ’lm’), ’predict.lmWinsor’ produces a vector of predictions or amatrix of predictions with limits or a list, as produced by predict.lm. Otherwise, ’object’ is a list ofsuch objects and will therefore return a list of such predictions.
Author(s)
Spencer Graves
See Also
lmWinsor predict.lm
Examples
# example from 'anscombe'# trim = 0lm.1 <- lmWinsor(y1~x1, data=anscombe)
newD <- data.frame(x1=seq(1, 22, .1))predW <- predict(lm.1, newdata=newD)plot(y1~x1, anscombe, xlim=c(1, 22),
main="Anscombe, example 1")lines(newD[["x1"]], predW, col='blue')abline(h=lm.1[['lower']]['y1'], col='red', lty='dashed')abline(h=lm.1[['upper']]['y1'], col='red', lty='dashed')abline(v=lm.1[['lower']]['x1'], col='green', lty='dashed')abline(v=lm.1[['upper']]['x1'], col='green', lty='dashed')# clipped at range(anscombe[, 'x1']) = c(4, 14)
# trim = 0.25lm.1.25 <- lmWinsor(y1~x1, data=anscombe, trim=0.25)
newD <- data.frame(x1=seq(1, 22, .1))predW.25 <- predict(lm.1.25, newdata=newD)plot(y1~x1, anscombe, xlim=c(1, 22))lines(newD[["x1"]], predW.25, col='blue', lwd=2)abline(h=lm.1.25[['lower']]['y1'], col='red', lty='dotted')abline(h=lm.1.25[['upper']]['y1'], col='red', lty='dotted')

project.basis 199
abline(v=lm.1.25[['lower']]['x1'], col='green', lty='dotted')abline(v=lm.1.25[['upper']]['x1'], col='green', lty='dotted')# clipped at range(anscombe[, 'y1']) = c(4.26 10.84)
# list examplelm.1. <- lmWinsor(y1~x1, data=anscombe, trim=c(0, 0.25, .4, .5))pred.1. <- predict(lm.1.)
project.basis Approximate Functional Data Using a Basis
Description
A vector or matrix of discrete data is projected into the space spanned by the values of a set ofbasis functions. This amounts to a least squares regression of the data on to the values of the basisfunctions. A small penalty can be applied to deal with stiautions in which the number of basisfunctions exceeds the number of basis points. This function is used with function data2fd, and isnot normally used directly in a functional data analysis.
Usage
project.basis(y, argvals, basisobj, penalize=FALSE)
Arguments
y a vector or matrix of discrete data.
argvals a vector containing the argument values correspond to the values in y.
basisobj a basis object.
penalize a logical variable. If TRUE, a small roughness penalty is applied to ensure thatthe linear equations defining the least squares solution are linearly independentor nonsingular.
Value
the matrix of coefficients defining the least squares approximation. This matrix has as many rowsare there are basis functions, as many columns as there are curves, and if the data are multivariate,as many layers as there are functions.
See Also
data2fd

200 quadset
quadset Quadrature points and weights for Simpson’s rule
Description
Set up quadrature points and weights for Simpson’s rule.
Usage
quadset(nquad=5, basisobj=NULL, breaks)
Arguments
nquad an odd integer at least 5 giving the number of evenly spaced Simpson’s rulequadrature points to use over each interval (breaks[i], breaks[i+1]).
basisobj the basis object that will contain the quadrature points and weights
breaks optional interval boundaries. If this is provided, the first value must be the initialpoint of the interval over which the basis is defined, and the final value must bethe end point. If this is not supplied, and ’basisobj’ is of type ’bspline’, the knotsare used as these values.
Details
Set up quadrature points and weights for Simpson’s rule and store information in the output ’ba-sisobj’. Simpson’s rule is used to integrate a function between successive values in vector ’breaks’.That is, over each interval (breaks[i], breaks[i+1]). Simpson’s rule uses ’nquad’ equally spacedquadrature points over this interval, starting with the the left boundary and ending with the rightboundary. The quadrature weights are the values delta*c(1,4,2,4,2,4,..., 2,4,1) where ’delta’ is thedifference between successive quadrature points, that is, delta = (breaks[i-1]-breaks[i])/(nquad-1).
Value
If is.null(basisobj), quadset returns a ’quadvals’ matrix with columns quadpts and quadwts. Other-wise, it returns basisobj with the two components set as follows:
quadvals cbind(quadpts=quadpts, quadwts=quadwts)
value a list with two components containing eval.basis(quadpts, basisobj, ival-1) forival=1, 2.
See Also
create.bspline.basis eval.basis

refinery 201
Examples
(qs7.1 <- quadset(nquad=7, breaks=c(0, .3, 1)))# cbind(quadpts=c(seq(0, 0.3, length=7),# seq(0.3, 1, length=7)),# quadwts=c((0.3/18)*c(1, 4, 2, 4, 2, 4, 1),# (0.7/18)*c(1, 4, 2, 4, 2, 4, 1) ) )
# The simplest basis currently available with this function:bspl2.2 <- create.bspline.basis(norder=2, breaks=c(0,.5, 1))
bspl2.2a <- quadset(basisobj=bspl2.2)bspl2.2a$quadvals# cbind(quadpts=c((0:4)/8, .5+(0:4)/8),# quadwts=rep(c(1,4,2,4,1)/24, 2) )bspl2.2a$values# a list of length 2# [[1]] = matrix of dimension c(10, 3) with the 3 basis# functions evaluated at the 10 quadrature points:# values[[1]][, 1] = c(1, .75, .5, .25, rep(0, 6))# values[[1]][, 2] = c(0, .25, .5, .75, 1, .75, .5, .25, 0)# values[[1]][, 3] = values[10:1, 1]## values[[2]] = matrix of dimension c(10, 3) with the# first derivative of values[[1]], being either# -2, 0, or 2.
refinery Reflux and tray level in a refinery
Description
194 observations on reflux and "tray 47 level" in a distallation column in an oil refinery.
Format
A data.frame with the following components:
Time observation time 0:193
Reflux reflux flow centered on the mean of the first 60 observations
Tray47 tray 47 level centered on the mean of the first 60 observations
Source
Ramsay, James O., and Silverman, Bernard W. (2006), Functional Data Analysis, 2nd ed., Springer,New York, p. 4, Figure 1.4, and chapter 17.

202 ReginaPrecip
Examples
attach(refinery)# allow space for an axis on the right
op <- par(mar=c(5, 4, 4, 5)+0.1)# plot uval
plot(Time, Reflux, type="l", bty="n")# add yval
y.u <- diff(range(Tray47))/diff(range(Reflux))u0 <- min(Reflux)y0 <- min(Tray47)
lines(Time, u0+(Tray47-y0)/y.u, lty=3, lwd=1.5, col="red")y.tick <- pretty(range(Tray47))axis(4, at=u0+(y.tick)/y.u, labels=y.tick, col="red", lty=3,
lwd=1.5)# restore previous plot margins
par(op)detach(refinery)
ReginaPrecip Regina Daily Precipitation
Description
Temperature in millimeters in June in Regina, Saskatchewan, Canada, 1960 - 1993, omitting 16missing values.
Usage
data(ReginaPrecip)
Format
A numeric vector of length 1006.
References
Ramsay, James O., Hooker, Giles, and Graves, Spencer B. (2009) Functional Data Analysis with Rand Matlab, Springer, New York (esp. Section 5.4.3)
See Also
CanadianWeather MontrealTemp
Examples
data(ReginaPrecip)hist(ReginaPrecip)

register.fd 203
register.fd Register Functional Data Objects Using a Continuous Criterion
Description
criterion. By aligned is meant that the shape of each curve is matched as closely as possible tothat of the target by means of a smooth increasing transformation of the argument, or a warpingfunction.
Usage
register.fd(y0fd=NULL, yfd=NULL, WfdParobj=c(Lfdobj=2, lambda=1),conv=1e-04, iterlim=20, dbglev=1, periodic=FALSE, crit=2)
Arguments
y0fd a functional data object defining the target for registration.If yfd is NULL and y0fd is a multivariate data object, then y0fd is assigned toyfd and y0fd is replaced by its mean.Alternatively, if yfd is a multivariate functional data object and y0fd is missing,y0fd is replaced by the mean of y0fd.Otherwise, y0fd must be a univariate functional data object taken as the targetto which yfd is registered.
yfd a multivariate functional data object defining the functions to be registered totarget y0fd. If it is NULL and y0fd is a multivariate functional data object,yfd takes the value of y0fd.
WfdParobj a functional parameter object for a single function. This is used as the initialvalue in the estimation of a function W (t) that defines the warping functionh(t) that registers a particular curve. The object also contains information on aroughness penalty and smoothing parameter to control the roughness of h(t).The basis used for this object must be a B-spline basis. If a constant basis isdesired, then use create.bspline.basis(wrange,1,1).Alternatively, this can be a vector or a list with components named Lfdobjand lambda, which are passed as arguments to fdPar to create the functionalparameter form of WfdParobj required by the rest of the register.fd algorithm.The default Lfdobj of 2 penalizes curvature, thereby preferring no warpingof time, with lambda indicating the strength of that preference. A commonalternative is Lfdobj = 3, penalizing the rate of change of curvature.
conv a criterion for convergence of the iterations.
iterlim a limit on the number of iterations.
dbglev either 0, 1, or 2. This controls the amount information printed out on each iter-ation, with 0 implying no output, 1 intermediate output level, and 2 full output.(If this is run with output buffering such as used with S-Plus, it may be neces-sary to turn off the output buffering to actually get the progress reports beforethe completion of computations.)

204 register.fd
periodic a logical variable: if TRUE, the functions are considered to be periodic, in whichcase a constant can be added to all argument values after they are warped.
crit an integer that is either 1 or 2 that indicates the nature of the continuous registra-tion criterion that is used. If 1, the criterion is least squares, and if 2, the criterionis the minimum eigenvalue of a cross-product matrix. In general, criterion 2 isto be preferred.
Details
The warping function that smoothly and monotonely transforms the argument is defined by Wfd isthe same as that defines the monotone smoothing function in for function smooth.monotone.See the help file for that function for further details.
Value
a named list of length 4 containing the following components:
regfd A functional data object containing the registered functions.
warpfd A functional data object containing the warping functions h(t).
Wfd A functional data object containing the functions hW (t) that define the warpingfunctions h(t).
shift If the functions are periodic, this is a vector of time shifts.
Source
Ramsay, James O., and Silverman, Bernard W. (2006), Functional Data Analysis, 2nd ed., Springer,New York.
Ramsay, James O., and Silverman, Bernard W. (2002), Applied Functional Data Analysis, Springer,New York, ch. 6 & 7.
See Also
smooth.monotone, smooth.morph
Examples
#See the analyses of the growth data for examples.#### 1. Simplest call### Specify smoothing weightlambda.gr2.3 <- .03
# Specify what to smooth, namely the rate of change of curvatureLfdobj.growth <- 2
# Establish a B-spline basisnage <- length(growth$age)norder.growth <- 6

register.fd 205
nbasis.growth <- nage + norder.growth - 2rng.growth <- range(growth$age)# 1 18wbasis.growth <- create.bspline.basis(rangeval=rng.growth,
nbasis=nbasis.growth, norder=norder.growth,breaks=growth$age)
# Smooth consistent with the analysis of these data# in afda-ch06.R, and register to individual smooths:cvec0.growth <- matrix(0,nbasis.growth,1)Wfd0.growth <- fd(cvec0.growth, wbasis.growth)growfdPar2.3 <- fdPar(Wfd0.growth, Lfdobj.growth, lambda.gr2.3)# Create a functional data object for all the boyshgtmfd.all <- with(growth, smooth.basis(age, hgtm, growfdPar2.3))
nBoys <- 2# nBoys <- dim(growth[["hgtm"]])[2]# register.fd takes time, so use only 2 curves as an illustration# to minimize compute time in this example;
#Alternative to subsetting later is to subset now:#hgtmfd.all<-with(growth,smooth.basis(age, hgtm[,1:nBoys],growfdPar2.3))
# Register the growth velocity rather than the# growth curves directlysmBv <- deriv(hgtmfd.all$fd, 1)
# This takes time, so limit the number of curves registered to nBoys
## Not run:smB.reg.0 <- register.fd(smBv[1:nBoys])
smB.reg.1 <- register.fd(smBv[1:nBoys],WfdParobj=c(Lfdobj=Lfdobj.growth, lambda=lambda.gr2.3))
#### 2. Call providing the target##
smBv.mean <- deriv(mean(hgtmfd.all$fd[1:nBoys]), 1)smB.reg.2a <- register.fd(smBv.mean, smBv[1:nBoys],
WfdParobj=c(Lfdobj=Lfdobj.growth, lambda=lambda.gr2.3))
smBv.mean <- mean(smBv[1:nBoys])smB.reg.2 <- register.fd(smBv.mean, smBv[1:nBoys],
WfdParobj=c(Lfdobj=Lfdobj.growth, lambda=lambda.gr2.3))all.equal(smB.reg.1, smB.reg.2)
#### 3. Call using WfdParobj##
# Create a dummy functional data object# to hold the functional data objects for the

206 register.newfd
# time warping function# ... start with a zero matrix (nbasis.growth, nBoys)smBc0 <- matrix(0, nbasis.growth, nBoys)# ... convert to a functional data objectsmBwfd0 <- fd(smBc0, wbasis.growth)# ... convert to a functional parameter objectsmB.wfdPar <- fdPar(smBwfd0, Lfdobj.growth, lambda.gr2.3)
smB.reg.3<- register.fd(smBv[1:nBoys], WfdParobj=smB.wfdPar)all.equal(smB.reg.1, smB.reg.3)## End(Not run)
register.newfd Register Functional Data Objects with Pre-Computed Warping Func-tions
Description
This function registers a new functional data object to pre-computed warping functions.
Usage
register.newfd(yfd, Wfd,type=c('direct','monotone','periodic'))
Arguments
yfd a multivariate functional data object defining the functions to be registered withWfd.
Wfd a functional data object defining the registration functions to be used to registeryfd. This can be the result of either landmarkreg or register.fd.
type indicates the type of registration function.
direct assumes Wfd is a direct definition of the registration functions. This isproduced by landmarkreg.
monotone assumes that Wfd defines a monotone functional data objected, up to shift-ing and scaling to make endpoints agree. This is produced by register.fd.
periodic does shift registration for periodic functions. This is output from register.fdif periodic=TRUE.
Details
Only shift registration is considered for the periodic case.
Value
a functional data object defining the registered curves.

residuals.fRegress 207
Source
Ramsay, James O., and Silverman, Bernard W. (2006), Functional Data Analysis, 2nd ed., Springer,New York.
Ramsay, James O., and Silverman, Bernard W. (2002), Applied Functional Data Analysis, Springer,New York, ch. 6 & 7.
See Also
landmarkreg, register.fd
Examples
# Register the lip data with landmark registration, then register the first# derivatives with the pre-computed warping functions.
# Lip data:lipfd <- smooth.basisPar(liptime, lip, 6, Lfdobj=int2Lfd(4),
lambda=1e-12)$fdnames(lipfd$fdnames) <- c("time(seconds)", "replications", "mm")
# Landmark Registration:
lipmeanmarks <- apply(lipmarks,2,mean)
wnbasis <- 6wnorder <- 4wbreaks <- c(0,lipmeanmarks,0.35)
warpbasis <- create.bspline.basis(nbasis=wnbasis, norder=wnorder,breaks=wbreaks);
WfdPar <- fdPar(fd(basisobj=warpbasis), 2, 1e-4)
lipreglist <- landmarkreg(lipfd, as.matrix(lipmarks), lipmeanmarks, WfdPar)
# And warp:
Dlipfd = deriv.fd(lipfd,Lfdobj=1)
Dlipregfd = register.newfd(Dlipfd,lipreglist$warpfd,type='direct')
residuals.fRegress Residuals from a Functional Regression
Description
Residuals from a model object of class fRegress.

208 residuals.fRegress
Usage
## S3 method for class 'fRegress':residuals(object, ...)
Arguments
object Object of class inheriting from lmWinsor
... additional arguments for other methods
Details
object$y - predict(object)
Value
The residuals produced by resid.fRegress or residuals.fRegress are either a vectoror a functional parameter (class fdPar) object, matching the class of object$y.
Author(s)
Spencer Graves
See Also
fRegress predict.fRegress residuals
Examples
#### example from help('lm')##ctl <- c(4.17,5.58,5.18,6.11,4.50,4.61,5.17,4.53,5.33,5.14)trt <- c(4.81,4.17,4.41,3.59,5.87,3.83,6.03,4.89,4.32,4.69)group <- gl(2,10,20, labels=c("Ctl","Trt"))weight <- c(ctl, trt)fRegress.D9 <- fRegress(weight ~ group)
resid.fR.D9 <- resid(fRegress.D9)# Now compare with 'lm'lm.D9 <- lm(weight ~ group)resid.lm.D9 <- resid(lm.D9)
all.equal(as.vector(resid.fR.D9), as.vector(resid.lm.D9))
#### resid from knee angle prediciton from hip angle;##(gaittime <- as.numeric(dimnames(gait)[[1]])*20)gaitrange <- c(0,20)

sd.fd 209
gaitbasis <- create.fourier.basis(gaitrange, nbasis=21)harmaccelLfd <- vec2Lfd(c(0, (2*pi/20)^2, 0), rangeval=gaitrange)gaitfd <- smooth.basisPar(gaittime, gait,
gaitbasis, Lfdobj=harmaccelLfd, lambda=1e-2)$fdhipfd <- gaitfd[,1]kneefd <- gaitfd[,2]knee.hip.f <- fRegress(kneefd ~ hipfd)
#knee.hip.e <- resid(knee.hip.f)#plot(knee.hip.e)
sd.fd Standard Deviation of Functional Data
Description
Evaluate the standard deviation of a set of functions in a functional data object.
Usage
sd.fd(fdobj)std.fd(fdobj)stdev.fd(fdobj)stddev.fd(fdobj)
Arguments
fdobj a functional data object.
Details
The multiple aliases are provided for compatibility with previous versions and with other languages.The name for the standard deviation function in R is ’sd’. Matlab uses ’std’. S-Plus and MicrosoftExcal use ’stdev’. ’stddev’ was used in a previous version of the ’fda’ package and is retained forcompatibility.
Value
a functional data object with a single replication that contains the standard deviation of the one orseveral functions in the object fdobj.
See Also
mean.fd, sum.fd, center.fd

210 seabird
Examples
liptime <- seq(0,1,.02)liprange <- c(0,1)
# ------------- create the fd object -----------------# use 31 order 6 splines so we can look at acceleration
nbasis <- 51norder <- 6lipbasis <- create.bspline.basis(liprange, nbasis, norder)lipbasis <- create.bspline.basis(liprange, nbasis, norder)
# ------------ apply some light smoothing to this object -------
Lfdobj <- int2Lfd(4)lambda <- 1e-12lipfdPar <- fdPar(lipbasis, Lfdobj, lambda)
lipfd <- smooth.basis(liptime, lip, lipfdPar)$fdnames(lipfd$fdnames) = c("Normalized time", "Replications", "mm")
lipstdfd <- sd.fd(lipfd)plot(lipstdfd)
all.equal(lipstdfd, std.fd(lipfd))all.equal(lipstdfd, stdev.fd(lipfd))all.equal(lipstdfd, stddev.fd(lipfd))
seabird Sea Bird Counts
Description
Numbers of sightings of different species of seabirds by year 1986 - 2005 at E. Sitkalidak, Uganik,Uyak, and W. Sitkalidak by people affiliated with the Kodiak National Wildlife Refuge, Alaska.
Usage
data(seabird)
Format
A data frame with 3793 observations on the following 22 variables.
BAGO, BLSC, COME, COMU, CORM, HADU, HOGR, LOON, MAMU, OLDS, PIGU, RBME, RNGR, SUSC, WWSCinteger count of the numbers of sightings of each species by transect by year
Year integer year, 1986 - 2005
Site Integer codes for Bay: 10 = Uyak, 20 = Uganik, 60 = E. Sitkalidak, 70 = W. Sitkalidak

smooth.basis 211
Transect Integer code (101 - 749) for the specific plot of ground observed
Temp a numeric vector
ObservCond a factor with levels Average Excellent Fair Good Ideal
Bay a factor with levels E. Sitkalidak Uganik Uyak W. Sitkalidak
ObservCondFactor3 a factor with levels ExcellentIdeal FairAverage Good, com-bining levels from ObservCond
Details
Data provided by the Kodiak National Wildlife Refuge
Source
Zwiefelhofer, D., Reynolds, J. H., and Keim, M. (2008) Population trends and annual density esti-mates for select wintering seabird species on Kodiak Island, Alaska, U.S. Fish and Wildlife Service,Kodiak National Wildlife Refuge, Technical Report, no. 08-00x
References
Ramsay, James O., Hooker, Giles, and Graves, Spencer B. (2009) Functional Data Analysis with Rand Matlab, Springer, New York (esp. ch. 10)
Examples
data(seabird)## maybe str(seabird) ; plot(seabird) ...
smooth.basis Smooth Data with an Indirectly Specified Roughness Penalty
Description
This is the main function for smoothing data using a roughness penalty. Unlike function data2fd,which does not employ a rougness penalty, this function controls the nature and degree of smoothingby penalyzing a measure of rougness. Roughness is definable in a wide variety of ways using eitherderivatives or a linear differential operator.
Usage
smooth.basis(argvals, y, fdParobj, wtvec=rep(1, length(argvals)),fdnames=NULL)

212 smooth.basis
Arguments
argvals a vector of argument values correspond to the observations in array y.
y an array containing values of curves at discrete sampling points or argumentvalues. If the array is a matrix, the rows must correspond to argument values andcolumns to replications, and it will be assumed that there is only one variable perobservation. If y is a three-dimensional array, the first dimension correspondsto argument values, the second to replications, and the third to variables withinreplications. If y is a vector, only one replicate and variable are assumed.
fdParobj a functional parameter object, a functional data object or a functional basis ob-ject. If the object is a functional parameter object, then the linear differentialoperator object and the smoothing parameter in this object define the roughnesspenalty. If the object is a functional data object, the basis within this object isused without a roughness penalty, and this is also the case if the object is a func-tional basis object. In these latter two cases, smooth.basis is essentially thesame as data2fd.
wtvec a vector of the same length as argvals containing weights for the values to besmoothed.
fdnames a list of length 3 containing character vectors of names for the following:
args name for each observation or point in time at which data are collected foreach ’rep’, unit or subject.
reps name for each ’rep’, unit or subject.fun name for each ’fun’ or (response) variable measured repeatedly (per ’args’)
for each ’rep’.
Details
If the smoothing parameter lambda is zero, there is no penalty on roughness. As lambda increases,usually in logarithmic terms, the penalty on roughness increases and the fitted curves become moreand more smooth. Ultimately, the curves are forced to have zero roughness in the sense of being inthe null space of the linear differential operator object Lfdobjthat is a member of the fdParobj.
For example, a common choice of roughness penalty is the integrated square of the second deriva-tive. This penalizes curvature. Since the second derivative of a straight line is zero, very large valuesof lambda will force the fit to become linear. It is also possible to control the amount of roughnessby using a degrees of freedom measure. The value equivalent to lambda is found in the list re-turned by the function. On the other hand, it is possible to specify a degrees of freedom value, andthen use function df2lambda to determine the equivalent value of lambda. One should not putcomplete faith in any automatic method for selecting lambda, including the GCV method. Thereare many reasons for this. For example, if derivatives are required, then the smoothing level thatis automatically selected may give unacceptably rough derivatives. These methods are also highlysensitive to the assumption of independent errors, which is usually dubious with functional data.The best advice is to start with the value minimizing the gcv measure, and then explore lambdavalues a few log units up and down from this value to see what the smoothing function and itsderivatives look like. The function plotfit.fd was designed for this purpose.
An alternative to using smooth.basis is to first represent the data in a basis system with reason-ably high resolution using data2fd, and then smooth the resulting functional data object usingfunction smooth.fd.

smooth.basis 213
Value
an object of class fdSmooth, which is a named list of length 8 with the following components:
fd a functional data object containing a smooth of the data.
df a degrees of freedom measure of the smooth
gcv the value of the generalized cross-validation or GCV criterion. If there are multi-ple curves, this is a vector of values, one per curve. If the smooth is multivariate,the result is a matrix of gcv values, with columns corresponding to variables.
gcv = n ∗ SSE/((n− df)2)
SSE the error sums of squares. SSE is a vector or a matrix of the same size as GCV.
penmat the penalty matrix.
y2cMap the matrix mapping the data to the coefficients.
argvals, y input arguments
See Also
data2fd, df2lambda, lambda2df, lambda2gcv, plot.fd, project.basis, smooth.fd,smooth.monotone, smooth.pos, smooth.basisPar
Examples
#### Example 1: Inappropriate smoothing### A toy example that creates problems with# data2fd: (0,0) -> (0.5, -0.25) -> (1,1)b2.3 <- create.bspline.basis(norder=2, breaks=c(0, .5, 1))# 3 bases, order 2 = degree 1 =# continuous, bounded, locally linearfdPar2 <- fdPar(b2.3, Lfdobj=2, lambda=1)
## Not run:# Penalize excessive slope Lfdobj=1;# second derivative Lfdobj=2 is discontinuous,# so the following generates an error:fd2.3s0 <- smooth.basis(0:1, 0:1, fdPar2)
Derivative of order 2 cannot be taken for B-spline of order 2Probable cause is a value of the nbasis argumentin function create.basis.fd that is too small.
Error in bsplinepen(basisobj, Lfdobj, rng) :## End(Not run)
#### Example 2. Better##b3.4 <- create.bspline.basis(norder=3, breaks=c(0, .5, 1))# 4 bases, order 3 = degree 2 =

214 smooth.basis
# continuous, bounded, locally quadraticfdPar3 <- fdPar(b3.4, lambda=1)# Penalize excessive slope Lfdobj=1;# second derivative Lfdobj=2 is discontinuous.fd3.4s0 <- smooth.basis(0:1, 0:1, fdPar3)
plot(fd3.4s0$fd)# same plot via plot.fdSmoothplot(fd3.4s0)
#### Example 3. lambda = 1, 0.0001, 0### Shows the effects of three levels of smoothing# where the size of the third derivative is penalized.# The null space contains quadratic functions.x <- seq(-1,1,0.02)y <- x + 3*exp(-6*x^2) + rnorm(rep(1,101))*0.2# set up a saturated B-spline basisbasisobj <- create.bspline.basis(c(-1,1), 101)
fdPar1 <- fdPar(basisobj, 2, lambda=1)result1 <- smooth.basis(x, y, fdPar1)with(result1, c(df, gcv, SSE))
#### Example 4. lambda = 0.0001##fdPar.0001 <- fdPar(basisobj, 2, lambda=0.0001)result2 <- smooth.basis(x, y, fdPar.0001)with(result2, c(df, gcv, SSE))# less smoothing, more degrees of freedom,# smaller gcv, smaller SSE
#### Example 5. lambda = 0##fdPar0 <- fdPar(basisobj, 2, lambda=0)result3 <- smooth.basis(x, y, fdPar0)with(result3, c(df, gcv, SSE))# Saturate fit: number of observations = nbasis# with no smoothing, so degrees of freedom = nbasis,# gcv = Inf indicating overfitting;# SSE = 0 (to within roundoff error)
plot(x,y) # plot the datalines(result1[['fd']], lty=2) # add heavily penalized smoothlines(result2[['fd']], lty=1) # add reasonably penalized smoothlines(result3[['fd']], lty=3) # add smooth without any penaltylegend(-1,3,c("1","0.0001","0"),lty=c(2,1,3))
plotfit.fd(y, x, result2[['fd']]) # plot data and smooth

smooth.basisPar 215
#### Example 6. Supersaturated##basis104 <- create.bspline.basis(c(-1,1), 104)
fdPar104.0 <- fdPar(basis104, 2, lambda=0)result104.0 <- smooth.basis(x, y, fdPar104.0)with(result104.0, c(df, gcv, SSE))
plotfit.fd(y, x, result104.0[['fd']], nfine=501)# perfect (over)fit# Need lambda > 0.
#### Example 7. gait##gaittime <- (1:20)/21gaitrange <- c(0,1)gaitbasis <- create.fourier.basis(gaitrange,21)lambda <- 10^(-11.5)harmaccelLfd <- vec2Lfd(c(0, 0, (2*pi)^2, 0))
gaitfdPar <- fdPar(gaitbasis, harmaccelLfd, lambda)gaitfd <- smooth.basis(gaittime, gait, gaitfdPar)$fd## Not run:# by default creates multiple plots, asking for a click between plotsplotfit.fd(gait, gaittime, gaitfd)## End(Not run)
smooth.basisPar Smooth Data Using a Directly Specified Roughness Penalty
Description
Smooth (argvals, y) data with roughness penalty defined by the remaining arguments.
Usage
smooth.basisPar(argvals, y, fdobj=NULL, Lfdobj=NULL,lambda=0, estimate=TRUE, penmat=NULL,wtvec=rep(1, length(argvals)), fdnames=NULL)
Arguments
argvals a vector of argument values correspond to the observations in array y.
y an array containing values of curves at discrete sampling points or argumentvalues. If the array is a matrix, the rows must correspond to argument values andcolumns to replications, and it will be assumed that there is only one variable perobservation. If y is a three-dimensional array, the first dimension corresponds

216 smooth.basisPar
to argument values, the second to replications, and the third to variables withinreplications. If y is a vector, only one replicate and variable are assumed.
fdobj One of the following:
fd a functional data object (class fd)
basisfd a functional basis object (class basisfd), which is converted to a func-tional data object with the identity matrix as the coefficient matrix.
fdPar a functional parameter object (class fdPar)
integer an integer giving the order of a B-spline basis, which is further converted toa functional data object with the identity matrix as the coefficient matrix.
matrix or array replaced by fd(fdobj)
NULL Defaults to fdobj = create.bspline.basis(argvals).
Lfdobj either a nonnegative integer or a linear differential operator object.
If NULL, Lfdobj depends on fdobj[[’basis’]][[’type’]]:
bspline Lfdobj <- int2Lfd(max(0, norder-2)), where norder = norder(fdobj).
fourier Lfdobj = a harmonic acceleration operator:Lfdobj <- vec2Lfd(c(0,(2*pi/diff(rng))^2,0), rng)where rng = fdobj[[’basis’]][[’rangeval’]].
anything else Lfdobj <- int2Lfd(0)
lambda a nonnegative real number specifying the amount of smoothing to be applied tothe estimated functional parameter.
estimate a logical value: if TRUE, the functional parameter is estimated, otherwise, it isheld fixed.
penmat a roughness penalty matrix. Including this can eliminate the need to computethis matrix over and over again in some types of calculations.
wtvec a vector of the same length as argvals containing weights for the values to besmoothed.
fdnames a list of length 3 containing character vectors of names for the following:
args name for each observation or point in time at which data are collected foreach ’rep’, unit or subject.
reps name for each ’rep’, unit or subject.
fun name for each ’fun’ or (response) variable measured repeatedly (per ’args’)for each ’rep’.
Details
1. if(is.null(fdobj))fdobj <- create.bspline.basis(argvals). Else if(is.integer(fdobj)) fdobj <- cre-ate.bspline.basis(argvals, norder = fdobj)
2. fdPar
3. smooth.basis

smooth.basisPar 217
Value
The output of a call to smooth.basis, which is an object of class fdSmooth, being a list oflength 8 with the following components:
fd a functional data object that smooths the data.
df a degrees of freedom measure of the smooth
gcv the value of the generalized cross-validation or GCV criterion. If there are multi-ple curves, this is a vector of values, one per curve. If the smooth is multivariate,the result is a matrix of gcv values, with columns corresponding to variables.
SSE the error sums of squares. SSE is a vector or a matrix of the same size as ’gcv’.
penmat the penalty matrix.
y2cMap the matrix mapping the data to the coefficients.
argvals, y input arguments
References
Ramsay, James O., and Silverman, Bernard W. (2006), Functional Data Analysis, 2nd ed., Springer,New York.
Ramsay, James O., and Silverman, Bernard W. (2002), Applied Functional Data Analysis, Springer,New York.
See Also
Data2fd, df2lambda, fdPar, lambda2df, lambda2gcv, plot.fd, project.basis,smooth.basis, smooth.fd, smooth.monotone, smooth.pos
Examples
#### simplest call##girlGrowthSm <- with(growth, smooth.basisPar(argvals=age, y=hgtf))plot(girlGrowthSm$fd, xlab="age", ylab="height (cm)",
main="Girls in Berkeley Growth Study" )plot(deriv(girlGrowthSm$fd), xlab="age", ylab="growth rate (cm / year)",
main="Girls in Berkeley Growth Study" )plot(deriv(girlGrowthSm$fd, 2), xlab="age",
ylab="growth acceleration (cm / year^2)",main="Girls in Berkeley Growth Study" )
# Undersmoothed with lambda = 0
#### Another simple call##lipSm <- smooth.basisPar(liptime, lip)plot(lipSm)# Undersmoothed with lambda = 0plot(smooth.basisPar(liptime, lip, lambda=1e-9))

218 smooth.basisPar
# more sensible
#### A third example##
x <- seq(-1,1,0.02)y <- x + 3*exp(-6*x^2) + sin(1:101)/2# sin not rnorm to make it easier to compare# results across platforms
# set up a saturated B-spline basisbasisobj101 <- create.bspline.basis(x)fdParobj101 <- fdPar(basisobj101, 2, lambda=1)result101 <- smooth.basis(x, y, fdParobj101)
resultP <- smooth.basisPar(argvals=x, y=y, fdobj=basisobj101, lambda=1)
all.equal(result101, resultP)
# TRUE
result4 <- smooth.basisPar(argvals=x, y=y, fdobj=4, lambda=1)
all.equal(resultP, result4)
# TRUE
result4. <- smooth.basisPar(argvals=x, y=y, lambda=1)
all.equal(resultP, result4.)
# TRUE
with(result4, c(df, gcv)) # display df and gcv measures
result4.4 <- smooth.basisPar(argvals=x, y=y, lambda=1e-4)with(result4.4, c(df, gcv)) # display df and gcv measures# less smoothing, more degrees of freedom, better fit
plot(result4.4)lines(result4, col='green')lines(result4$fd, col='green') # same as lines(result4, ...)
result4.0 <- smooth.basisPar(x, y, basisobj101, lambda=0)
result4.0a <- smooth.basisPar(x, y, lambda=0)
all.equal(result4.0, result4.0a)
with(result4.0, c(df, gcv)) # display df and gcv measures# no smoothing, degrees of freedom = number of points

smooth.bibasis 219
# but generalized cross validation = Inf# suggesting overfitting.
#### fdnames?##girlGrow12 <- with(growth, smooth.basisPar(argvals=age, y=hgtf[, 1:2],
fdnames=c('age', 'girl', 'height')) )girlGrow12. <- with(growth, smooth.basisPar(argvals=age, y=hgtf[, 1:2],
fdnames=list(age=age, girl=c('Carol', 'Sally'), value='height')) )
#### Fourier basis with harmonic acceleration operator##daybasis65 <- create.fourier.basis(rangeval=c(0, 365), nbasis=65)daytemp.fdSmooth <- with(CanadianWeather, smooth.basisPar(day.5,
dailyAv[,,"Temperature.C"],daybasis65, fdnames=list("Day", "Station", "Deg C")) )
smooth.bibasis Smooth a discrete surface over a rectangular lattice
Description
Estimate a smoothing function f(s, t) over a rectangular lattice
Usage
smooth.bibasis(sarg, targ, y, fdPars, fdPart,fdnames=NULL)
Arguments
sarg, targ vectors of argument values for the first and second dimensions, respectively, ofthe surface function.
y an array containing surface values measured with noisefdPars, fdPart
functional parameter objects for sarg and targ, respectively
fdnames a list of length 3 containing character vectors of names for sarg, targ, andthe surface function f(s, t).
Value
a list with the following components:
fdobj a functional data object containing a smooth of the data.
df a degrees of freedom measure of the smooth

220 smooth.fd
gcv the value of the generalized cross-validation or GCV criterion. If the function isunivariate, GCV is a vector containing the error sum of squares for each func-tion, and if the function is multivariate, GCV is a NVAR by NCURVES matrix.
coef the coefficient matrix for the basis function expansion of the smoothing function
SSE the error sums of squares. SSE is a vector or a matrix of the same size as GCV.
penmat the penalty matrix.
y2cMap the matrix mapping the data to the coefficients.
See Also
smooth.basis
smooth.fd Smooth a Functional Data Object Using an Indirectly SpecifiedRoughness Penalty
Description
Smooth data already converted to a functional data object, fdobj, using criteria consolidated ina functional data parameter object, fdParobj. For example, data may have been converted to afunctional data object using function data2fd using a fairly large set of basis functions. This’fdobj’ is then smoothed as specified in ’fdParobj’.
Usage
smooth.fd(fdobj, fdParobj)
Arguments
fdobj a functional data object to be smoothed.
fdParobj a functional parameter object. This object is defined by a roughness penalty inslot Lfd and a smoothing parameter lambda in slot lambda, and this informa-tion is used to further smooth argument fdobj.
Value
a functional data object.
See Also
smooth.basis, data2fd

smooth.fdPar 221
Examples
# Shows the effects of two levels of smoothing# where the size of the third derivative is penalized.# The null space contains quadratic functions.x <- seq(-1,1,0.02)y <- x + 3*exp(-6*x^2) + rnorm(rep(1,101))*0.2# set up a saturated B-spline basisbasisobj <- create.bspline.basis(c(-1,1),81)# convert to a functional data object that interpolates the data.result <- smooth.basis(x, y, basisobj)yfd <- result$fd
# set up a functional parameter object with smoothing# parameter 1e-6 and a penalty on the 3rd derivative.yfdPar <- fdPar(yfd, 2, 1e-6)yfd1 <- smooth.fd(yfd, yfdPar)
## Not run:# FIXME: using 3rd derivative here gave error?????yfdPar3 <- fdPar(yfd, 3, 1e-6)yfd1.3 <- smooth.fd(yfd, yfdPar3)#Error in bsplinepen(basisobj, Lfdobj, rng) :# Penalty matrix cannot be evaluated# for derivative of order 3 for B-splines of order 4## End(Not run)
# set up a functional parameter object with smoothing# parameter 1 and a penalty on the 3rd derivative.yfdPar <- fdPar(yfd, 2, 1)yfd2 <- smooth.fd(yfd, yfdPar)# plot the data and smoothplot(x,y) # plot the datalines(yfd1, lty=1) # add moderately penalized smoothlines(yfd2, lty=3) # add heavily penalized smoothlegend(-1,3,c("0.000001","1"),lty=c(1,3))# plot the data and smoothing using function plotfit.fdplotfit.fd(y, x, yfd1) # plot data and smooth
smooth.fdPar Smooth a functional data object using a directly specified roughnesspenalty
Description
Smooth data already converted to a functional data object, fdobj, using directly specified criteria.

222 smooth.fdPar
Usage
smooth.fdPar(fdobj, Lfdobj=NULL, lambda=0,estimate=TRUE, penmat=NULL)
Arguments
fdobj a functional data object to be smoothed.
Lfdobj either a nonnegative integer or a linear differential operator object.
If NULL, Lfdobj depends on fdobj[[’basis’]][[’type’]]:
bspline Lfdobj <- int2Lfd(max(0, norder-2)), where norder = norder(fdobj).
fourier Lfdobj = a harmonic acceleration operator:Lfdobj <- vec2Lfd(c(0,(2*pi/diff(rng))^2,0), rng)where rng = fdobj[[’basis’]][[’rangeval’]].
anything else Lfdobj <- int2Lfd(0)
lambda a nonnegative real number specifying the amount of smoothing to be applied tothe estimated functional parameter.
estimate a logical value: if TRUE, the functional parameter is estimated, otherwise, it isheld fixed.
penmat a roughness penalty matrix. Including this can eliminate the need to computethis matrix over and over again in some types of calculations.
Details
1. fdPar
2. smooth.fd
Value
a functional data object.
References
Ramsay, James O., and Silverman, Bernard W. (2006), Functional Data Analysis, 2nd ed., Springer,New York.
Ramsay, James O., and Silverman, Bernard W. (2002), Applied Functional Data Analysis, Springer,New York.
See Also
smooth.fd, fdPar, smooth.basis, smooth.pos, smooth.morph

smooth.monotone 223
Examples
#### 1. B-spline example### Shows the effects of two levels of smoothing# where the size of the third derivative is penalized.# The null space contains quadratic functions.x <- seq(-1,1,0.02)y <- x + 3*exp(-6*x^2) + rnorm(rep(1,101))*0.2# set up a saturated B-spline basisbasisobj <- create.bspline.basis(c(-1,1),81)# convert to a functional data object that interpolates the data.result <- smooth.basis(x, y, basisobj)yfd <- result$fd# set up a functional parameter object with smoothing# parameter 1e-6 and a penalty on the 2nd derivative.yfdPar <- fdPar(yfd, 2, 1e-6)yfd1 <- smooth.fd(yfd, yfdPar)
yfd1. <- smooth.fdPar(yfd, 2, 1e-6)all.equal(yfd1, yfd1.)# TRUE
# set up a functional parameter object with smoothing# parameter 1 and a penalty on the 2nd derivative.yfd2 <- smooth.fdPar(yfd, 2, 1)
# plot the data and smoothplot(x,y) # plot the datalines(yfd1, lty=1) # add moderately penalized smoothlines(yfd2, lty=3) # add heavily penalized smoothlegend(-1,3,c("0.000001","1"),lty=c(1,3))# plot the data and smoothing using function plotfit.fdplotfit.fd(y, x, yfd1) # plot data and smooth#### 2. Fourier basis with harmonic acceleration operator##daybasis65 <- create.fourier.basis(rangeval=c(0, 365), nbasis=65)daySmooth <- with(CanadianWeather, smooth.basis(day.5,
dailyAv[,,"Temperature.C"],daybasis65, fdnames=list("Day", "Station", "Deg C")) )
daySmooth2 <- smooth.fdPar(daySmooth$fd, lambda=1e5)op <- par(mfrow=c(2,1))plot(daySmooth)plot(daySmooth2)par(op)
smooth.monotone Monotone Smoothing of Data

224 smooth.monotone
Description
When the discrete data that are observed reflect a smooth strictly increasing or strictly decreasingfunction, it is often desirable to smooth the data with a strictly monotone function, even thoughthe data themselves may not be monotone due to observational error. An example is when data arecollected on the size of a growing organism over time. This function computes such a smoothingfunction, but, unlike other smoothing functions, for only for one curve at a time. The smoothingfunction minimizes a weighted error sum of squares criterion. This minimization requires iteration,and therefore is more computationally intensive than normal smoothing.
The monotone smooth is beta[1]+beta[2]*integral(exp(Wfdobj)), where Wfdobj is a functional dataobject. Since exp(Wfdobj)>0, its integral is monotonically increasing.
Usage
smooth.monotone(argvals, y, WfdParobj, wtvec=rep(1,n),zmat=NULL, conv=.0001, iterlim=50,active=rep(TRUE,nbasis), dbglev=1)
Arguments
argvals Argument value array of length N, where N is the number of observed curvevalues for each curve. It is assumed that that these argument values are commonto all observed curves. If this is not the case, you will need to run this functioninside one or more loops, smoothing each curve separately.
y a vector of data values. This function can only smooth one set of data at a time.Function value array (the values to be fit). If the functional data are univariate,this array will be an N by NCURVE matrix, where N is the number of observedcurve values for each curve and NCURVE is the number of curves observed.If the functional data are muliivariate, this array will be an N by NCURVE byNVAR matrix, where NVAR the number of functions observed per case. Forexample, for the gait data, NVAR = 2, since we observe knee and hip angles.
WfdParobj A functional parameter or fdPar object. This object contains the specificationsfor the functional data object to be estimated by smoothing the data. See com-ment lines in function fdPar for details. The functional data object WFD inWFDPAROBJ is used to initialize the optimization process. Its coefficient arraycontains the starting values for the iterative minimization of mean squared error.
wtvec a vector of weights to be used in the smoothing.zmat a design matrix or a matrix of covariate values that also define the smooth of the
data.conv a convergence criterion.iterlim the maximum number of iterations allowed in the minimization of error sum of
squares.active a logical vector specifying which coefficients definingW (t) are estimated. Nor-
mally, the first coefficient is fixed.dbglev either 0, 1, or 2. This controls the amount information printed out on each iter-
ation, with 0 implying no output, 1 intermediate output level, and 2 full output.If either level 1 or 2 is specified, it can be helpful to turn off the output bufferingfeature of S-PLUS.

smooth.monotone 225
Details
The smoothing function f(argvals) is determined by three objects that need to be estimated fromthe data:
• W (argvals), a functional data object that is first exponentiated and then the result integrated.This is the heart of the monotone smooth. The closer W (argvals) is to zero, the closer themonotone smooth becomes a straight line. The closer W (argvals) becomes a constant, themore the monotone smoother becomes an exponential function. It is assumed that W (0) = 0.
• b0, an intercept term that determines the value of the smoothing function at argvals = 0.
• b1, a regression coefficient that determines the slope of the smoothing function at argvals =0.
In addition, it is possible to have the intercept b0 depend in turn on the values of one or morecovariates through the design matrix Zmat as follows: b0 = Zc. In this case, the single interceptcoefficient is replaced by the regression coefficients in vector c multipying the design matrix.
Value
an object of class monfd, which is a list with the following 5 components:
Wfdobj a functional data object defining function W (argvals) that optimizes the fit tothe data of the monotone function that it defines.
beta The regression coefficients b_0 and b_1 for each smoothed curve.If the curves are univariate and ... ZMAT is NULL, BETA is 2 by NCURVE. ...ZMAT has P columns, BETA is P+1 by NCURVE.If the curves are multivariate and ... ZMAT is NULL, BETA is 2 by NCURVEby NVAR. ... ZMAT has P columns, BETA is P+1 by NCURVE by NVAR.
yhatfd A functional data object for the monotone curves that smooth the data. Thisobject is constructed using the basis for WFDOBJ, and this basis may well be toosimple to accommodate the curvature in the monotone function that Wfdobjnes.It may be necessary to discard this object and use a richer basis externally tosmooth the values defined by beta[1] + beta[2]*eval.monfd(evalarg, Wfdobj).
Flist a named list containing three results for the final converged solution: (1) f: theoptimal function value being minimized, (2) grad: the gradient vector at theoptimal solution, and (3) norm: the norm of the gradient vector at the optimalsolution.
y2cMap For each estimated curve (and variable if functions are multivariate, this is anN by NBASIS matrix containing a linear mappping from data to coefficientsthat can be used for computing point-wise confidence intervals. If NCURVE= NVAR = 1, a matrix is returned. Otherwise an NCURVE by NVAR list isreturned, with each slot containing this mapping.
argvals input argvals, possibly modified / clarified by argcheck.
y input argument y, possibly modified / clarified by ycheck.

226 smooth.monotone
References
Ramsay, James O., and Silverman, Bernard W. (2006), Functional Data Analysis, 2nd ed., Springer,New York.
Ramsay, James O., and Silverman, Bernard W. (2002), Applied Functional Data Analysis, Springer,New York.
See Also
smooth.basis, smooth.pos, smooth.morph
Examples
# Estimate the acceleration functions for growth curves# See the analyses of the growth data.# Set up the ages of height measurements for Berkeley dataage <- c( seq(1, 2, 0.25), seq(3, 8, 1), seq(8.5, 18, 0.5))# Range of observationsrng <- c(1,18)# First set up a basis for monotone smooth# We use b-spline basis functions of order 6# Knots are positioned at the ages of observation.norder <- 6nage <- 31nbasis <- nage + norder - 2wbasis <- create.bspline.basis(rng, nbasis, norder, age)# starting values for coefficientcvec0 <- matrix(0,nbasis,1)Wfd0 <- fd(cvec0, wbasis)# set up functional parameter objectLfdobj <- 3 # penalize curvature of accelerationlambda <- 10^(-0.5) # smoothing parametergrowfdPar <- fdPar(Wfd0, Lfdobj, lambda)# Set up wgt vectorwgt <- rep(1,nage)# Smooth the data for the first girlhgt1 = growth$hgtf[,1]result <- smooth.monotone(age, hgt1, growfdPar, wgt)# Extract the functional data object and regression# coefficientsWfd <- result$Wfdobjbeta <- result$beta# Evaluate the fitted height curve over a fine meshagefine <- seq(1,18,len=101)hgtfine <- beta[1] + beta[2]*eval.monfd(agefine, Wfd)# Plot the data and the curveplot(age, hgt1, type="p")lines(agefine, hgtfine)# Evaluate the acceleration curveaccfine <- beta[2]*eval.monfd(agefine, Wfd, 2)# Plot the acceleration curve

smooth.morph 227
plot(agefine, accfine, type="l")lines(c(1,18),c(0,0),lty=4)
smooth.morph Estimates a Smooth Warping Function
Description
This function is nearly identical to smooth.monotone but is intended to compute a smoothmonotone transformation h(t) of argument t such that h(0) = 0 and h(TRUE) = TRUE, wheret is the upper limit of t. This function is used primarily to register curves.
Usage
smooth.morph(x, y, WfdPar, wt=rep(1,nobs),conv=.0001, iterlim=20, dbglev=0)
Arguments
x a vector of argument values.
y a vector of data values. This function can only smooth one set of data at a time.
WfdPar a functional parameter object that provides an initial value for the coefficientsdefining function W (t), and a roughness penalty on this function.
wt a vector of weights to be used in the smoothing.
conv a convergence criterion.
iterlim the maximum number of iterations allowed in the minimization of error sum ofsquares.
dbglev either 0, 1, or 2. This controls the amount information printed out on each iter-ation, with 0 implying no output, 1 intermediate output level, and 2 full output.If either level 1 or 2 is specified, it can be helpful to turn off the output bufferingfeature of S-PLUS.
Value
A named list of length 4 containing:
Wfdobj a functional data object defining function W (x) that that optimizes the fit to thedata of the monotone function that it defines.
Flist a named list containing three results for the final converged solution: (1) f: theoptimal function value being minimized, (2) grad: the gradient vector at theoptimal solution, and (3) norm: the norm of the gradient vector at the optimalsolution.
iternum the number of iterations.
iterhist a by 5 matrix containing the iteration history.

228 smooth.pos
See Also
smooth.monotone, landmarkreg, register.fd
smooth.pos Smooth Data with a Positive Function
Description
A set of data is smoothed with a functional data object that only takes positive values. For example,this function can be used to estimate a smooth variance function from a set of squared residuals. Afunction W (t) is estimated such that that the smoothing function is exp[W (t)].
Usage
smooth.pos(argvals, y, WfdParobj, wtvec=rep(1,n),conv=.0001, iterlim=50, dbglev=1)
Arguments
argvals Argument value array of length N, where N is the number of observed curvevalues for each curve. It is assumed that that these argument values are commonto all observed curves. If this is not the case, you will need to run this functioninside one or more loops, smoothing each curve separately.
y Function value array (the values to be fit). If the functional data are univariate,this array will be an N by NCURVE matrix, where N is the number of observedcurve values for each curve and NCURVE is the number of curves observed.If the functional data are muliivariate, this array will be an N by NCURVE byNVAR matrix, where NVAR the number of functions observed per case. Forexample, for the gait data, NVAR = 2, since we observe knee and hip angles.
WfdParobj A functional parameter or fdPar object. This object contains the specificationsfor the functional data object to be estimated by smoothing the data. See com-ment lines in function fdPar for details. The functional data object WFD inWFDPAROBJ is used to initialize the optimization process. Its coefficient arraycontains the starting values for the iterative minimization of mean squared error.
wtvec a vector of weights to be used in the smoothing.
conv a convergence criterion.
iterlim the maximum number of iterations allowed in the minimization of error sum ofsquares.
dbglev either 0, 1, or 2. This controls the amount information printed out on each iter-ation, with 0 implying no output, 1 intermediate output level, and 2 full output.If either level 1 or 2 is specified, it can be helpful to turn off the output bufferingfeature of S-PLUS.

StatSciChinese 229
Value
an object of class posfd, being a list with 4 components:
Wfdobj a functional data object defining function W (x) that that optimizes the fit to thedata of the positive function that it defines.
Flist a named list containing three results for the final converged solution: (1) f: theoptimal function value being minimized, (2) grad: the gradient vector at theoptimal solution, and (3) norm: the norm of the gradient vector at the optimalsolution.
argvals, y the corresponding input arguments
See Also
smooth.monotone, smooth.morph
Examples
smallbasis <- create.fourier.basis(c(0, 365), 65)harmaccelLfd365 <- vec2Lfd(c(0,(2*pi/365)^2,0), c(0, 365))
index <- (1:35)[CanadianWeather$place == "Vancouver"]VanPrec <- CanadianWeather$dailyAv[,index, "Precipitation.mm"]
lambda <- 1e4dayfdPar <- fdPar(smallbasis, harmaccelLfd365, lambda)smooth.pos(day.5, VanPrec, dayfdPar)
StatSciChinese Statistical Science in Chinese
Description
(x, y, z) coordinates of the location of the tip of a pen during fifty replications of writing ’StatisticalScience’ in simplified Chinese at 10 millisecond intervals
Usage
data(StatSciChinese)
Format
a 3-dimensional array of dimensions (601, 50, 3) containing 601 observations of (x, y, z) coordinatesof the tip of a pen at 2.5 millisecond intervals for each of 50 repitions of writing ’Statistical Science’in simplified Chinese.

230 sum.fd
Details
Xiaochun Li wrote ’Statistical Science’ in simplified Chinese 50 times. An infra-red detecting tabletwas attached to the tip of the pen, and a wall-mounted set of three cameras recorded its position400 times per second with an error level of about 0.5 millimeters. Each sample required about 6seconds to produce, and for simplicity, time was normalized to this interval for all 50 records. Thescript requires 50 strokes, with an average time of 120 milliseconds per stroke. These raw datawere shifted and rotated so the numbers more accruately reflected x and y coordinates relative tothe drawn characters plus vertical distance from the paper.
References
Ramsay, James O. (2000) Functional Components of Variation in Handwriting, Journal of the Amer-ican Statistical Association, 95, 9-15.
Examples
data(StatSciChinese)
i <- 3StatSci1 <- StatSciChinese[, i, ]# Where does the pen leave the paper?plot(StatSci1[, 3], type='l')thresh <- quantile(StatSci1[, 3], .8)abline(h=thresh)
sel1 <- (StatSci1[, 3] < thresh)StatSci1[!sel1, 1:2] <- NAplot(StatSci1[, 1:2], type='l')
mark <- seq(1, 601, 12)points(StatSci1[mark, 1], StatSci1[mark, 2])
sum.fd Sum of Functional Data
Description
Evaluate the sum of a set of functions in a functional data object.
Usage
sum.fd(..., na.rm)
Arguments
... a functional data object to sum.
na.rm Not used.

summary.basisfd 231
Value
a functional data object with a single replication that contains the sum of the functions in the objectfd.
See Also
mean.fd, std.fd, stddev.fd, center.fd
summary.basisfd Summarize a Functional Data Object
Description
Provide a compact summary of the characteristics of a functional data object.
Usage
summary.basisfd(object, ...)
Arguments
object a functional data object.
... Other arguments to match generic
Value
a displayed summary of the bivariate functional data object.
References
Ramsay, James O., and Silverman, Bernard W. (2006), Functional Data Analysis, 2nd ed., Springer,New York.
Ramsay, James O., and Silverman, Bernard W. (2002), Applied Functional Data Analysis, Springer,New York.

232 summary.fd
summary.bifd Summarize a Bivariate Functional Data Object
Description
Provide a compact summary of the characteristics of a bivariate functional data object.
Usage
## S3 method for class 'bifd':summary(object, ...)summary.bifd(object, ...)
Arguments
object a bivariate functional data object.
... Other arguments to match the generic function for ’summary’
Value
a displayed summary of the bivariate functional data object.
See Also
summary,
summary.fd Summarize a Functional Data Object
Description
Provide a compact summary of the characteristics of a functional data object.
Usage
## S3 method for class 'fd':summary(object,...)summary.fd(object,...)
Arguments
object a functional data object.
... Other arguments to match the generic for ’summary’

summary.fdPar 233
Value
a displayed summary of the functional data object.
See Also
summary,
summary.fdPar Summarize a Functional Parameter Object
Description
Provide a compact summary of the characteristics of a functional parameter object.
Usage
## S3 method for class 'fdPar':summary(object, ...)summary.fdPar(object, ...)
Arguments
object a functional parameter object.
... Other arguments to match the generic ’summary’ function
Value
a displayed summary of the functional parameter object.
See Also
summary,
summary.Lfd Summarize a Linear Differential Operator Object
Description
Provide a compact summary of the characteristics of a linear differential operator object.
Usage
## S3 method for class 'Lfd':summary(object, ...)summary.Lfd(object, ...)

234 svd2
Arguments
object a linear differential operator object.
... Other arguments to match the generic ’summary’ function
Value
a displayed summary of the linear differential operator object.
See Also
summary,
svd2 singular value decomposition with automatic error handling
Description
The ’svd’ function in R 2.5.1 occasionally throws an error with a cryptic message. In some suchcases, changing the LINPACK argument has worked.
Usage
svd2(x, nu = min(n, p), nv = min(n, p), LINPACK = FALSE)
Argumentsx, nu, nv, LINPACK
as for the ’svd’ function in the ’base’ package.
Details
In R 2.5.1, the ’svd’ function sometimes stops with a cryptic error message for a matrix x forwhich a second call to ’svd’ with !LINPACK will produce an answer. When such conditions occur,assign ’x’ with attributes ’nu’, ’nv’, and ’LINPACK’ to ’.svd.LINPACK.error.matrix’ in ’env =.GlobalEnv’.
Except for these rare pathologies, ’svd2’ should work the same as ’svd’.
Value
a list with components d, u, and v, as described in the help file for ’svd’ in the ’base’ package.
See Also
svd,

TaylorSpline 235
TaylorSpline Taylor representation of a B-Spline
Description
Convert B-Spline coefficients into a local Taylor series representation expanded about the midpointbetween each pair of distinct knots.
Usage
TaylorSpline(object, ...)## S3 method for class 'fd':TaylorSpline(object, ...)## S3 method for class 'fdPar':TaylorSpline(object, ...)## S3 method for class 'fdSmooth':TaylorSpline(object, ...)## S3 method for class 'dierckx':TaylorSpline(object, ...)
Arguments
object a spline object, e.g., of class ’dierckx’.
... optional arguments
Details
1. Is object a spline object with a B-spline basis? If no, throw an error.
2. Find knots and midpoints.
3. Obtain coef(object).
4. Determine the number of dimensions of coef(object) and create empty coef and deriv arraysto match. Then fill the arrays.
Value
a list with the following components:
knots a numeric vector of knots(object, interior=FALSE)
midpoints midpoints of intervals defined by unique(knots)
coef A matrix of dim = c(nKnots-1, norder) containing the coeffients of a polynomialin (x-midpoints[i]) for interval i, where nKnots = length(unique(knots)).
deriv A matrix of dim = c(nKnots-1, norder) containing the derivatives of the splineevaluated at midpoints.

236 tperm.fd
Author(s)
Spencer Graves
See Also
fd create.bspline.basis
Examples
#### The simplest b-spline basis: order 1, degree 0, zero interior knots:## a single step function##library(DierckxSpline)bspl1.1 <- create.bspline.basis(norder=1, breaks=0:1)# ... jump to pi to check the codefd.bspl1.1pi <- fd(pi, basisobj=bspl1.1)bspl1.1pi <- TaylorSpline(fd.bspl1.1pi)
#### Cubic spline: 4 basis functions##bspl4 <- create.bspline.basis(nbasis=4)plot(bspl4)parab4.5 <- fd(c(3, -1, -1, 3)/3, bspl4)# = 4*(x-.5)TaylorSpline(parab4.5)
#### A more realistic example##data(titanium)# Cubic spline with 5 interior knots (6 segments)titan10 <- with(titanium, curfit.free.knot(x, y))(titan10T <- TaylorSpline(titan10) )
tperm.fd Permutation t-test for two groups of functional data objects.
Description
tperm.fd creates a null distribution for a test of no difference between two groups of functional dataobjects.
Usage
tperm.fd(x1fd, x2fd, nperm=200, q=0.05, argvals=NULL, plotres=TRUE, ...)

tperm.fd 237
Arguments
x1fd a functional data object giving the first group of functional observations.
x2fd a functional data object giving the second group of functional observations.
nperm number of permutations to use in creating the null distribution.
q Critical upper-tail quantile of the null distribution to compare to the observedt-statistic.
argvals If yfdPar is a fd object, the points at which to evaluate the point-wise t-statistic.
plotres Argument to plot a visual display of the null distribution displaying the 1-qthquantile and observed t-statistic.
... Additional plotting arguments that can be used with plot.
Details
The usual t-statistic is calculated pointwise and the test based on the maximal value. If argvalsis not specified, it defaults to 101 equally-spaced points on the range of yfdPar.
Value
A list with the following components:
pval the observed p-value of the permutation test.
qval the qth quantile of the null distribution.
Tobs the observed maximal t-statistic.
Tnull a vector of length nperm giving the observed values of the permutation distri-bution.
Tvals the pointwise values of the observed t-statistic.
Tnullvals the pointwise values of of the permutation observations.
pvals.pts pointwise p-values of the t-statistic.
qvals.pts pointwise qth quantiles of the null distribution
argvals argument values for evaluating the F-statistic if yfdParis a functional data ob-ject.
Side Effects
a plot of the functional observations
Source
Ramsay, James O., and Silverman, Bernard W. (2006), Functional Data Analysis, 2nd ed., Springer,New York.
See Also
fRegress Fstat.fd

238 var.fd
Examples
# This tests the difference between boys and girls heights in the# Berkeley growth data.
# First set up a basis system to hold the smooths
knots <- growth$agenorder <- 6nbasis <- length(knots) + norder - 2hgtbasis <- create.bspline.basis(range(knots), nbasis, norder, knots)
# Now smooth with a fourth-derivative penalty and a very small smoothing# parameter
Lfdobj <- 4lambda <- 1e-2growfdPar <- fdPar(hgtbasis, Lfdobj, lambda)
hgtmfd <- smooth.basis(growth$age, growth$hgtm, growfdPar)$fdhgtffd <- smooth.basis(growth$age, growth$hgtf, growfdPar)$fd
# Call tperm.fd
tres <- tperm.fd(hgtmfd,hgtffd)
var.fd Variance, Covariance, and Correlation Surfaces for Functional DataObject(s)
Description
Compute variance, covariance, and / or correlation functions for functional data.
These are two-argument functions and therefore define surfaces. If only one functional data objectis supplied, its variance or correlation function is computed. If two are supplied, the covariance orcorrelation function between them is computed.
Usage
var.fd(fdobj1, fdobj2=fdobj1)
Argumentsfdobj1, fdobj2
a functional data object.
Details
a two-argument or bivariate functional data object representing the variance, covariance or correla-tion surface for a single functional data object or the covariance between two functional data objectsor between different variables in a multivariate functional data object.

var.fd 239
Value
An list object of class bifd with the following components:
coefs the coefficient array with dimensions fdobj1[["basis"]][["nbasis"]] by fdobj2[["basis"]][["nbasis"]]giving the coefficients of the covariance matrix in terms of the bases used byfdobj1 and fdobj2.
sbasis fdobj1[["basis"]]
tbasis fdobj2[["basis"]]
bifdnames dimnames list for a 4-dimensional ’coefs’ array. If length(dim(coefs)) is only 2or 3, the last 2 or 1 component of bifdnames is not used with dimnames(coefs).
Examples below illustrate this structure in simple cases.
See Also
mean.fd, sd.fd, std.fd stdev.fd
Examples
#### Example with 2 different bases##daybasis3 <- create.fourier.basis(c(0, 365))daybasis5 <- create.fourier.basis(c(0, 365), 5)tempfd3 <- with(CanadianWeather, data2fd(dailyAv[,,"Temperature.C"],
day.5, daybasis3, argnames=list("Day", "Station", "Deg C")) )precfd5 <- with(CanadianWeather, data2fd(dailyAv[,,"log10precip"],
day.5, daybasis5, argnames=list("Day", "Station", "Deg C")) )
# Compare with structure described above under 'value':str(tempPrecVar3.5 <- var.fd(tempfd3, precfd5))
#### Example with 2 variables, same bases##gaitbasis3 <- create.fourier.basis(nbasis=3)str(gaitfd3 <- data2fd(gait, basisobj=gaitbasis3))str(gaitVar.fd3 <- var.fd(gaitfd3))
# Check the answers with manual computationsall.equal(var(t(gaitfd3$coefs[,,1])), gaitVar.fd3$coefs[,,,1])# TRUEall.equal(var(t(gaitfd3$coefs[,,2])), gaitVar.fd3$coefs[,,,3])# TRUEall.equal(var(t(gaitfd3$coefs[,,2]), t(gaitfd3$coefs[,,1])),
gaitVar.fd3$coefs[,,,2])# TRUE
# NOTE:dimnames(gaitVar.fd3$coefs)[[4]]# [1] Hip-Hip

240 varmx
# [2] Knee-Hip# [3] Knee-Knee# If [2] were "Hip-Knee", then# gaitVar.fd3$coefs[,,,2] would match#var(t(gaitfd3$coefs[,,1]), t(gaitfd3$coefs[,,2]))# *** It does NOT. Instead, it matches:#var(t(gaitfd3$coefs[,,2]), t(gaitfd3$coefs[,,1])),
#### The following produces contour and perspective plots### Evaluate at a 53 by 53 grid for plotting
daybasis65 <- create.fourier.basis(rangeval=c(0, 365), nbasis=65)
daytempfd <- with(CanadianWeather, data2fd(dailyAv[,,"Temperature.C"],day.5, daybasis65, argnames=list("Day", "Station", "Deg C")) )
str(tempvarbifd <- var.fd(daytempfd))
str(tempvarmat <- eval.bifd(weeks,weeks,tempvarbifd))# dim(tempvarmat)= c(53, 53)
op <- par(mfrow=c(1,2), pty="s")#contour(tempvarmat, xlab="Days", ylab="Days")contour(weeks, weeks, tempvarmat,
xlab="Daily Average Temperature",ylab="Daily Average Temperature",main=paste("Variance function across locations\n","for Canadian Anual Temperature Cycle"),
cex.main=0.8, axes=FALSE)axisIntervals(1, atTick1=seq(0, 365, length=5), atTick2=NA,
atLabels=seq(1/8, 1, 1/4)*365,labels=paste("Q", 1:4) )
axisIntervals(2, atTick1=seq(0, 365, length=5), atTick2=NA,atLabels=seq(1/8, 1, 1/4)*365,labels=paste("Q", 1:4) )
persp(weeks, weeks, tempvarmat,xlab="Days", ylab="Days", zlab="Covariance")
mtext("Temperature Covariance", line=-4, outer=TRUE)par(op)
varmx Rotate a Matrix of Component Loadings using the VARIMAX Crite-rion
Description
The matrix being rotated contains the values of the component functional data objects computed ineither a principal components analysis or a canonical correlation analysis. The values are computedover a fine mesh of argument values.

varmx.cca.fd 241
Usage
varmx(amat)
Arguments
amat the matrix to be rotated. The number of rows is equal to the number of argu-ment values nx used in a fine mesh. The number of columns is the number ofcomponents to be rotated.
Details
The VARIMAX criterion is the variance of the squared component values. As this criterion ismaximized with respect to a rotation of the space spanned by the columns of the matrix, the squaredloadings tend more and more to be either near 0 or near 1, and this tends to help with the process oflabelling or interpreting the rotated matrix.
Value
a square rotation matrix of order equal to the number of components that are rotated. A rotationmatrix T has that property that T ′T = TT ′ = I .
See Also
varmx.pca.fd, varmx.cca.fd
varmx.cca.fd Rotation of Functional Canonical Components with VARIMAX
Description
Results of canonical correlation analysis are often easier to interpret if they are rotated. Among themany possible ways in which this rotation can be defined, the VARIMAX criterion seems to givesatisfactory results most of the time.
Usage
varmx.cca.fd(ccafd, nx=201)
Arguments
ccafd an object of class "cca.fd" that is produced by function cca.fd.
nx the number of points in a fine mesh of points that is required to approximatecanonical variable functional data objects.
Value
a rotated version of argument cca.fd.

242 vec2Lfd
See Also
varmx, varmx.pca.fd
varmx.pca.fd Rotation of Functional Principal Components with VARIMAX Crite-rion
Description
Principal components are often easier to interpret if they are rotated. Among the many possibleways in which this rotation can be defined, the VARIMAX criterion seems to give satisfactoryresults most of the time.
Usage
varmx.pca.fd(pcafd, nharm=scoresd[2], nx=501)
Arguments
pcafd an object of class pca.fd that is produced by function pca.fd.
nharm the number of harmonics or principal components to be rotated.
nx the number of argument values in a fine mesh used to define the harmonics to berotated.
Value
a rotated principal components analysis object of class pca.fd.
See Also
varmx, varmx.cca.fd
vec2Lfd Make a Linear Differential Operator Object from a Vector
Description
A linear differential operator object of order m is constructed from the number in a vector of lengthm.
Usage
vec2Lfd(bwtvec, rangeval=c(0,1))

wtcheck 243
Arguments
bwtvec a vector of coefficients to define the linear differential operator object
rangeval a vector of length 2 specifying the range over which the operator is defined
Value
a linear differential operator object
See Also
int2Lfd, Lfd
Examples
# define the harmonic acceleration operator used in the# analysis of the daily temperature dataharmaccelLfd <- vec2Lfd(c(0,(2*pi/365)^2,0), c(0,365))
wtcheck Check a vector of weights
Description
Throws an error if wtvec is not n positive numbers, and return wtvec (stripped of any dimatrribute)
Usage
wtcheck(n, wtvec)
Arguments
n the required length of wtvec
wtvec an object to be checked
Value
a vector of n positive numbers
Examples
wtcheck(3, 1:3)
wtcheck(2, matrix(1:2, 2))

244 zerofind
zerofind Does the range of the input contain 0?
Description
Returns TRUE if range of the argument includes 0 and FALSES if not.
Usage
zerofind(fmat)
Arguments
fmat An object from which ’range’ returns two numbers.
Value
A logical value TRUE or FALSE.
See Also
range
Examples
zerofind(1:5)# FALSEzerofind(0:3)# TRUE

Index
∗Topic IOdirs, 77file.copy2, 101
∗Topic arrayEigen, 79svd2, 231
∗Topic attributebifd, 17checkLogicalInteger, 28getbasisrange, 123objAndNames, 157
∗Topic datasetsCanadianWeather, 21dateAccessories, 69gait, 120growth, 123handwrit, 124infantGrowth, 125lip, 141melanoma, 151MontrealTemp, 155nondurables, 155onechild, 160pinch, 171refinery, 198ReginaPrecip, 199seabird, 207StatSciChinese, 226
∗Topic hplotaxisIntervals, 14phaseplanePlot, 169plot.fd, 173plot.Lfd, 175plot.lmWinsor, 176plotfit, 181
∗Topic logicwtcheck, 240zerofind, 241
∗Topic manip
as.fd, 11TaylorSpline, 232
∗Topic modelsAmpPhaseDecomp, 3df.residual.fRegress, 74lmeWinsor, 142lmWinsor, 145lmWinsor12, 148predict.fRegress, 190predict.lmeWinsor, 192predict.lmWinsor, 194residuals.fRegress, 204
∗Topic optimizeknots.fd, 133
∗Topic programmingfdaMatlabPath, 97
∗Topic smoothAmpPhaseDecomp, 3argvalsy.swap, 4arithmetic.basisfd, 6arithmetic.fd, 7as.fd, 11axisIntervals, 14basisfd.product, 16bsplinepen, 19bsplineS, 20cca.fd, 23center.fd, 24cor.fd, 32create.basis, 35create.bspline.basis, 37create.constant.basis, 41create.exponential.basis, 42create.fourier.basis, 44create.monomial.basis, 47create.polygonal.basis, 49create.polynomial.basis, 51create.power.basis, 53CSTR, 55
245

246 INDEX
cycleplot.fd, 61Data2fd, 62data2fd.old, 66density.fd, 71deriv.fd, 73df2lambda, 76eigen.pda, 81eval.basis, 82eval.bifd, 84eval.fd, 86eval.monfd, 88eval.penalty, 90eval.posfd, 92evaldiag.bifd, 93expect.phi, 94expon, 95exponpen, 96fda-package, 2fdlabels, 98fdPar, 99fourier, 102fourierpen, 103Fperm.fd, 104fRegress, 108fRegress.CV, 116fRegress.stderr, 118Fstat.fd, 119getbasismatrix, 121getbasispenalty, 122inprod, 126inprod.bspline, 128int2Lfd, 128intensity.fd, 129is.basis, 131is.fd, 132is.fdPar, 132is.Lfd, 133knots.fd, 133lambda2df, 135lambda2gcv, 135landmarkreg, 136Lfd, 138lines.fd, 139linmod, 140mean.fd, 149monomial, 153monomialpen, 154norder, 156
odesolv, 159pca.fd, 160pda.fd, 162pda.overlay, 168phaseplanePlot, 169plot.basisfd, 172plot.fd, 173plot.Lfd, 175plot.pca.fd, 177plot.pda.fd, 179plotbeta, 181plotfit, 181plotscores, 185polyg, 186polygpen, 187powerbasis, 188powerpen, 189project.basis, 196quadset, 197register.fd, 200register.newfd, 203sd.fd, 206smooth.basis, 208smooth.basisPar, 212smooth.bibasis, 216smooth.fd, 217smooth.fdPar, 218smooth.monotone, 220smooth.morph, 224smooth.pos, 225sum.fd, 227summary.basisfd, 228summary.bifd, 229summary.fd, 229summary.fdPar, 230summary.Lfd, 230TaylorSpline, 232tperm.fd, 233var.fd, 235varmx, 237varmx.cca.fd, 238varmx.pca.fd, 239vec2Lfd, 239
∗Topic utilitiesas.array3, 9checkDims3, 25checkLogicalInteger, 28coef.fd, 31

INDEX 247
*.basisfd (basisfd.product), 16*.fd (arithmetic.fd), 7+.fd (arithmetic.fd), 7-.fd (arithmetic.fd), 7==.basisfd (arithmetic.basisfd), 6
AmpPhaseDecomp, 3argvalsy.swap, 4arithmetic.basisfd, 6arithmetic.fd, 7, 7as.array3, 9, 27as.dierckx, 12as.fd, 11as.fd.smooth.spline (as.fd), 11axesIntervals (axisIntervals), 14axis, 15axisIntervals, 14, 70
basisfd, 7, 8, 17, 18, 40, 42, 44, 46, 48, 50,52, 54
basisfd.product, 7, 8, 16bifd, 17, 158bsplinepen, 19, 154bsplineS, 20, 153
CanadianWeather, 21, 155, 199cca.fd, 23, 100, 161, 164, 178center.fd, 24, 150, 206, 228checkDim3 (checkDims3), 25checkDims3, 10, 25, 184checkLogical
(checkLogicalInteger), 28checkLogicalInteger, 28checkNumeric
(checkLogicalInteger), 28checkRange, 30checkScalarType, 30checkVectorType, 30chol, 80coef, 31coef.fd, 31coef.fdPar (coef.fd), 31coef.fdSmooth (coef.fd), 31coef.Taylor (coef.fd), 31coefficients.fd (coef.fd), 31coefficients.fdPar (coef.fd), 31coefficients.fdSmooth (coef.fd),
31coefficients.Taylor (coef.fd), 31
colnames, 79constraintCheck (lmWinsor12), 148cor.fd, 32create.basis, 35, 50, 52, 54create.bspline.basis, 37, 37, 42, 44,
46, 48, 50, 52, 54, 134, 156, 197, 233create.constant.basis, 37, 40, 41, 44,
46, 48, 50, 52, 54create.exponential.basis, 37, 40,
42, 42, 46, 48, 50, 52, 54create.fourier.basis, 37, 40, 42, 44,
44, 48, 50, 52, 54create.monomial.basis, 37, 40, 42, 44,
46, 47, 50, 52, 54create.polygonal.basis, 37, 40, 42,
44, 46, 48, 49, 52, 54, 186, 187create.polynomial.basis, 37, 40, 42,
44, 46, 48, 50, 51, 54create.power.basis, 37, 40, 42, 44, 46,
48, 50, 52, 53, 188, 189CSTR, 55CSTR2 (CSTR), 55CSTR2in (CSTR), 55CSTRfitLS (CSTR), 55CSTRfn (CSTR), 55CSTRres (CSTR), 55CSTRres0 (CSTR), 55CSTRsse (CSTR), 55curfit, 12cycleplot.fd, 61
daily (CanadianWeather), 21Data2fd, 5, 62, 214data2fd, 18, 158, 184, 196, 210, 217data2fd (data2fd.old), 66data2fd.old, 66dateAccessories, 69day.5, 63, 68day.5 (dateAccessories), 69dayOfYear (dateAccessories), 69dayOfYearShifted
(dateAccessories), 69daysPerMonth (dateAccessories), 69density, 72density.fd, 71, 100, 130deriv, 73deriv.fd, 73df.residual, 75df.residual.fRegress, 74

248 INDEX
df2lambda, 76, 135, 210, 214dim, 10dimnames, 10dir, 77, 78dirs, 77, 98
Eigen, 79eigen, 79, 80eigen.pda, 81, 169, 179eval.basis, 73, 82, 91, 197eval.bifd, 84, 87, 94eval.fd, 83, 86, 89, 92, 121, 170eval.monfd, 87, 88, 92eval.penalty, 87, 90, 96, 104, 122, 128eval.posfd, 87, 89, 92evaldiag.bifd, 93expect.phi, 94expectden.phi (expect.phi), 94expectden.phiphit (expect.phi), 94expon, 95, 96, 153exponpen, 95, 96, 154
fd, 12, 31, 134, 233fda (fda-package), 2fda-package, 2fdaMatlabPath, 97fdlabels, 98fdPar, 31, 99, 136, 138, 214, 219file.copy, 102file.copy2, 101file.info, 78fitted.fdSmooth (eval.fd), 86fitted.monfd (eval.monfd), 88fitted.posfd (eval.posfd), 92fourier, 102, 104, 153fourierpen, 103, 103, 154Fperm.fd, 104fRegress, 75, 100, 106, 108, 117, 119, 120,
141, 191, 205, 234fRegress.CV, 112, 116, 119fRegress.formula, 112fRegress.stderr, 111, 112, 117, 118Fstat.fd, 106, 119, 120, 234
gait, 120getbasismatrix, 73, 83, 87, 121getbasispenalty, 91, 96, 104, 122getbasisrange, 123glsControl, 143
growth, 123
handwrit, 124handwritTime (handwrit), 124
infantGrowth, 125inprod, 126inprod.bspline, 128int2Lfd, 128, 138, 240intensity.fd, 72, 100, 129is.basis, 131, 132, 133is.fd, 131, 132, 132, 133is.fdPar, 131, 132, 132, 133is.Lfd, 131, 132, 133isVectorAtomic, 30
knots.basisfd (knots.fd), 133knots.dierckx, 134knots.fd, 133knots.fdSmooth (knots.fd), 133
lambda2df, 77, 135, 210, 214lambda2gcv, 77, 135, 210, 214landmarkreg, 4, 136, 152, 204, 225Lfd, 138, 176, 240lines.fd, 139, 174, 184lines.fdSmooth, 184lines.fdSmooth (lines.fd), 139linmod, 112, 140lip, 141lipmarks (lip), 141liptime (lip), 141lm, 144–146, 148lme, 143, 144lmeControl, 143lmeWinsor, 142, 148, 193lmWinsor, 143, 144, 145, 149, 177, 193, 195lmWinsor1 (lmWinsor12), 148lmWinsor12, 148lmWinsor2 (lmWinsor12), 148lsoda, 59
Matlab, 98mean, 150mean.fd, 25, 33, 149, 206, 228, 236melanoma, 151, 151minus.fd (arithmetic.fd), 7monfn, 151monomial, 153

INDEX 249
monomialpen, 154month.abb, 15, 70monthAccessories, 22, 155monthAccessories
(dateAccessories), 69monthBegin.5, 15monthBegin.5 (dateAccessories), 69monthEnd (dateAccessories), 69monthEnd.5, 15monthLetters, 15monthLetters (dateAccessories), 69monthMid, 15monthMid (dateAccessories), 69MontrealTemp, 22, 155, 199
nls, 59nondurables, 155norder, 156normden.phi (expect.phi), 94normint.phi (expect.phi), 94
objAndNames, 18, 157odesolv, 159onechild, 160
package.dir, 78par, 15, 183, 184pca.fd, 24, 100, 160, 164, 185pda.fd, 81, 138, 159, 161, 162, 169, 178,
179pda.overlay, 81, 168phaseplanePlot, 169pinch, 171pinchraw (pinch), 171pinchtime (pinch), 171plot, 170, 177, 182, 184plot.basisfd, 83, 95, 172plot.cca.fd, 24plot.fd, 61, 99, 139, 170, 172, 173, 176,
181, 184, 210, 214plot.fdPar (plot.fd), 173plot.fdSmooth, 184plot.fdSmooth (plot.fd), 173plot.Lfd, 138, 175plot.lmWinsor, 176plot.pca.fd, 177, 178plot.pda.fd, 81, 169, 179plotbeta, 181plotfit, 181
plotfit.fd, 26, 27, 61, 139, 174plotscores, 185plus.fd (arithmetic.fd), 7polyg, 153, 186, 187polygpen, 154, 186, 187polynom, 153polynompen, 154power, 153powerbasis, 188, 189powerpen, 188, 189predict, 191predict.basisfd (eval.basis), 82predict.fd (eval.fd), 86predict.fdPar (eval.fd), 86predict.fdSmooth (eval.fd), 86predict.fRegress, 190, 205predict.lm, 193–195predict.lme, 193predict.lmeWinsor, 144, 192predict.lmWinsor, 148, 194predict.monfd (eval.monfd), 88predict.posfd (eval.posfd), 92project.basis, 63, 68, 196, 210, 214
qr, 80quadset, 197quantile, 144, 146, 148
range, 241refinery, 198ReginaPrecip, 199register.fd, 4, 137, 200, 204, 225register.newfd, 203residuals, 205residuals.fdSmooth (eval.fd), 86residuals.fRegress, 204residuals.monfd (eval.monfd), 88residuals.posfd (eval.posfd), 92rownames, 79
sd.fd, 33, 206, 236seabird, 207smooth.basis, 5, 31, 63, 68, 100, 136, 184,
208, 214, 217, 219, 223smooth.basisPar, 5, 31, 63, 68, 100, 184,
210, 212smooth.bibasis, 216smooth.fd, 63, 68, 184, 210, 214, 217, 219smooth.fdPar, 100, 218

250 INDEX
smooth.monotone, 63, 68, 89, 100, 201,210, 214, 220, 225, 226
smooth.morph, 4, 137, 201, 219, 223, 224,226
smooth.pos, 63, 68, 210, 214, 219, 223, 225solve.QP, 147–149spline.des, 40splineDesign, 40splinefun, 12StatSciChinese, 226std.fd, 25, 33, 228, 236std.fd (sd.fd), 206stddev.fd, 25, 150, 228stddev.fd (sd.fd), 206stdev.fd, 33, 236stdev.fd (sd.fd), 206sum.fd, 25, 150, 206, 227summary, 229–231summary.basisfd, 228summary.bifd, 229summary.fd, 229summary.fdPar, 230summary.Lfd, 230svd, 80, 231svd2, 231
TaylorSpline, 232times.fd (arithmetic.fd), 7tperm.fd, 233
unlist, 78
var.fd, 33, 94, 150, 235varmx, 237, 239varmx.cca.fd, 24, 238, 238, 239varmx.pca.fd, 238, 239, 239vec2Lfd, 138, 239
weeks (dateAccessories), 69wtcheck, 240
zerofind, 241