fcic-static.law.stanford.edufcic-static.law.stanford.edu/cdn_media/fcic-docs/0000-00-00... · ®...
131
(J): c: 0 """" ..... .... ,' ;pr' \·u: "0: c: (I)' E E 0' (..): <D: fl:: ttl E E ::J: (/) "'0: c: ttl S Cll --" 2: <D: > 0' c: 0 """", ..... Confidential Proprietary Business Information Produced Pursuant to House Rules CIJ 1'1\: '" -" " (J ,.'\ \U '+-" ri'IIiiIiiIiii' ..Ji (I) c:: o c:: o :2: Fannie Mae CJ) c: o ."- ....... , N FM-COGR 00050993
Transcript of fcic-static.law.stanford.edufcic-static.law.stanford.edu/cdn_media/fcic-docs/0000-00-00... · ®...
(J):
c: 0 """" .....
....,' ;pr' \·u:
"0: c: (I)'
E E 0' (..): <D:
fl:: ~ ttl E E ::J: (/) "'0: c: ttl S Cll --" 2: <D: > 0' c: 0"""", .....
Confidential Proprietary Business Information Produced Pursuant to House Rules
CIJ 1'1\:
'" -" " ~ (J ,.'\ \U
'+-" ri'IIiiIiiIiii'
..Ji (I) c:: o c:: o :2:
Fannie Mae
CJ) c: o
."-.......,
N
FM-COGR 00050993

(J):
c: 0 """" .....
....,' ;pr' \·u:
"0: c: (I)'
E E 0' (..): <D:
fl:: ~ ttl E E ::J: (/) "'0: c: ttl S Cll --" 2: <D: > 0' c: 0"""", .....
Confidential Proprietary Business Information Produced Pursuant to House Rules
::: ...... .
-""""":
',' ': .•.•.• ,';:
':"'"
. ~'.... ';.
:; ....... .
........
-,': .. -.-.-,':
.: ..... .
t .....
. ~ .. -.. . .. : ...... ,. ...•...•.. :
" .. :: ..... L. \ ....
-"~.
Fannie Mae
.: ....... .
. 't ...
.: ••....
::""""'"
"""""',
,', ~:'-'-'-' : .
FM-COGR 00050994

>-c:In (3 0
§"~ o 0.(1) (1)
o.-:::l ~ 0-. .: ~ ........... en >-c:I .: ..... ~ 0 :::l"C ............ ....... ..... o ~ g:~ .: IJ:j ~ .: :;0 i!J . .: :::l ...... (1) (1) en en en
"TI ~ :::l ~. (1)
~ ~
"TI ~ I n 0 I: 0 0 Vl 0 '-0 '-0 Vl
~ ~ o· :::l
,~,!,~!!,!,ll,!"~"",!l!:!,!,!,~,!"~,~,!",,,!~,!,,,,~,!!,!,,!:!,!,!,!:""'~,~,!!,,~~""'~!,,"~,,!,!!,~!~,!!,,""""""""""""": L How valuable is Phineas to shareholders given its traditional business model and current market and
regulatory environments? How does that value - and the business performance it implies - compare to comparable companies?
I I. How valuable is the charter to shareholders, net of its costs? How are the benefits and costs of the charter distributed across Phineas' activities?
HL
IV.
V.
\il.
How permanent are the shifts we've seen in the market and regulatory environments and how intense should we expect future change to be?
What kind of threat do those changes pose to Phineas' business model?
What is Phineas good at, beyond leveraging the benefits of its charter status?
What are the market opportunities for future earnings per share growth and how does those align with what Phineas is good at and with its charter benefits, costs and constraints?
VI!. What strategies and tactics are available to optimize shareholder value, within the charter and through alternative regulatory frameworks?
VI!!. What can we learn from other industries and other organizations that have experienced analogous pressures and challenges?
IX. Is a full privatization strategy currently in the best interests of Phineas' shareholders?
K Under what conditions should Phineas pursue privatization?
4 ~
cltlgroUpJ

>-c:In (3 0
§"~ o 0.(1) (1)
o.-:::l ~ 0-. .: ~ ........... en >-c:I .: ..... ~ 0 :::l"C ............ ....... ..... o ~ g:~ .: IJ:j ~ .: :;0 i!J . .: :::l ...... (1) (1) en en en
"TI
§ (ii'
~
~ n o a
1:;0 o o o Vl o '-0 '-0 0\
~ ~ o· :::l
,~,!,!"!,S"~,~,!!,I:!""~,!:!,!,!"!:!!,!"!,~,!!,!""""""""",,,,,,,,,,"""""""""""""""""""""""""""""""""""""""""""""""""""""""""""""""""""""""""""""""""""""",,, ., Phineas business model is increasingly at risk of being marginalized
@ Primary market factors
® Secondary market factors
+ The business cannot exist without the benefits provided by the charter
., +
® Size, scale and leverage
@ Funding cost and access to capital markets
A combination of these factors drive our view that the two "extreme" outcomes - stay the course and full privatization - are, in fact, not options
Phineas is not a "growth company"; the core business should grow EPS at mid/high single digits Company Phineas S&P 500(a) Countrywide American Express Wells Fargo SLM Corp P/2006E 8.3x 15.8x 8.7x 15.2x 12.2x 17.2x LT EPS Growth 10.0% 12.0% 12.0% 13.0% 11.0% 15.0%
., Phineas, however, can create significant value to shareholders by extending its business and returning to an outward rather than inward focus
-0 A tracking stock would allow segmentation of the investor base for the portfolio business
@ Investors find the company's result very opaque due to FAS 133
-0 What would be the "tipping point" for the charter to be value destructive?
® There would need to be significant legislative changes for the charter to deteriorate in value (e.g., a significant level of the book of business, lower leverage or escalating mission costs)
5 Source: Powerdata and IBES estimates. Market data as of 7/11/05. (a) S&P 500 data based on median of S&P composite companies.
~
cltlgroUpJ

>-c:In (3 0
§"~ o 0.(1) (1)
o.-:::l ~ 0-. .: ~ ........... en >-c:I .: ..... ~ 0 :::l"C ............ ....... ..... o ~ g:~ .: IJ:j ~ .: :;0 i!J . .: :::l ...... (1) (1) en en en
"TI
§ (ii'
~
~ n o a
1:;0 o o o Vl o '-0 '-0 -.l
~ ~ o· :::l
Citigroup recommendations on new business initiatives
-:-:-:-:-:-:-:-:-:-:-:-:-:-:-:-:-:-:-:-:-:-:-:-:-:-:-:-:-:-:-:-:-:-:-:-:-:-:-:-:-:-:-:-:-:-:-:-:-:-:-:-:-:-:-:-:-:-:-:-:-:-:-:-:-:-:-:-:-:-:-:-:-:-:-:-:-:-:-:-:-:-:-:-:-:-:-:-:-:-:-:-:-:-:-:-:-:-:-:-:-:-:-:-:-:-:-:-:-:-:-:-:-:-:-:-:-:-:-:-:-:-:-:-:-:-:-:-:-:-:-:-:-:-:-:-:-:-:-:-:-:-:-:-:-:-:-:-:-:-:-:-:-:-:-:-:-:-:-:-:-:-:-:-:-:-:-:-:-:-:-:-:-:-:-:-:-:-:-:-:-:-:-:-:-:-:-:-:-:-:-:-:-:-:-:-:-:-:-:-:-:-:-:-:-:-:-:-:-:-:-:-:-:-:-:-:-:-:-:-:-:-:-:-:-:-:-:-:-:-:-:-:-:-:-:-:-:-:-:-:-:-:-:-:-:-:-:-:-:-:-:-:-:-:-:-:-:-:-:-:-:-:-:-:-:-:-:-:-:-:-:-:-:-:-:-:-:-:-:-:-:-:-:-:-:-:-:-:-:-:-:-:-:-:-:-:-:-:-:-:-:-:-:-:-:-:-:-:-:-:-:-:-:-:-:-:-:-:-:-:-:-:-:-:-:-:-:-:-:-:-:-:-:-:-:-:-:-:-:-:-:-:-:. ........................................................................................................................................................................................................................................................................................................................................................
., Diversification would decrease the dependence on volatile portfolio earnings, enhance earnings growth and play to Phineas' competitive strengths
., We have focused on initiatives which we believe are closely aligned with Phineas' customer base and capabilities
4- These initiatives would allow Phineas to maximize the value of the charter and would result in a business serving the mortgage market (and the mission) more broadly
+ We further believe that becoming a full service provider would have a positive impact on Phineas' employees
., Current share price of $59 is a 6% discount to sum-of-the-parts DCF value of $63
4- Analysts use forward PIE to value Phineas, which leads to wide range of estimates due to lack of transparency
+ A comparison of values with and without the charter results in a charter value of approximately $29 per share (50% of share price)
+ Expand Guarantee business into non-trad itional products (Alt-A, Sub-prime)
»} Incremental NPV/share: $5.72
., Asset management & risk analytics
4- Incremental NPV/share: $2.31
+ Mortgage insurance
-0 Incremental NPV/share: $3.07
6 ~
cltlgroUpJ

>-c:In (3 0
§"~ o 0.(1) (1) o.-g >-c:I ..... .: e:.. ~ >-c:I .: ..... ~ 0 :::l"C ~ ~ . ....... (1)
~g framework for assessing Phineas' strategic en IJ:j
~~. alternatives ~~ :::::::::::::::::::::::::::::::::::::::::::::::::::::::::::::::::::::::::::::::::::::::::::::::::::::::::::::::::::::::::::::::::::::::::::::::::::::::::::::::::::::::::::::::::::::::::::::::::::::::::::::::::::::::::::::::::::::::::::::::::::::::::::::::::::::::::::::::::::::::::::::::::::::::::::::::::::::::::::::::::::::::::::::::::::::::::::::::::::::::::::::::::::::::::::::::::::::::::::::::::::::::::::::::::::::::::::::::::::::::::::::::::::::::::::::::::::::::::::::::::::::::::::::::::::::::::::::::::::::::::::::::::::::::::::::::::::::::::::::::::::::::::::::::::::::::::::::::::::::::::::::::::::::::::::::::::::::::::::::::::::::::::::::::::::::::::::::::::::::::::::::::
"TI
§ (ii'
~
~
g: § In assessing strategic alternatives to maximize long-term Phineas shareholder value, ~ g' Citigroup considered the following on both a whole company and business line basis:
-$ Competitive advantages of Phineas
" Charter advantages versus charter costs
" Competitive advantages within and outside the mortgage industry
-$ Valuation and financial impact of proposed strategic alternatives
" Actual economic returns vs required risk-adjusted returns
" Valuation and financial impact (including and excluding charter)
-$ Long-term market opportunity
" Phineas competitive positioning
" Environmental trends
-$ Implications of strategic alternatives
" Business line interrelationships
" Customer relationships
" Mortgage market
n o a
1:;0 o o o Vl o '-0 '-0 00
7 ~
cltlgroUpJ

>-c:In (3 0
§"~ o 0.(1) (1) o.-g >-c:I ..... .: e:.. ~ >-c:I .: ..... ~ 0 :::l"C ~ ~ . ....... (1) o ....... ::r::~ o~ .: IJ:j
~~. CitigroupJs observation of Phineas ~ c.n :::::::::::::::::::::::::::::::::::::::::::::::::::::::::::::::::::::::::::::::::::::::::::::::::::::::::::::::::::::::::::::::::::::::::::::::::::::::::::::::::::::::::::::::::::::::::::::::::::::::::::::::::::::::::::::::::::::::::::::::::::::::::::::::::::::::::::::::::::::::::::::::::::::::::::::::::::::::::::::::::::::::::::::::::::::::::::::::::::::::::::::::::::::::::::::::::::::::::::::::::::::::::::::::::::::::::::::::::::::::::::::::::::::::::::::::::::::::::::::::::::::::::::::::::::::::::::::::::::::::::::::::::::::::::::::::::::::::::::::::::::::::::::::::::::::::::::::::::::::::::::::::::::::::::::::::::::::::::::::::::::::::::::::::::::::::::::::::::::::::::::::::
"TI
§ (ii'
~
~
~ § >- The "charter" is Phineas' core asset (accounting for up to 500/0 of current market capitalization), ~
g' allowing for operating scale, access to capital markets and low cost financing that are unprecedented among financial services companies
> Mission costs however, continue to increase
> Market conditions are also evolving in ways that have reduced Phineas' ability to grow at historical rates and levels of profitability
> We have used several methodologies to value Phineas, which indicate that Phineas trades at a discount to its sum-of-the-parts valuation
>- Given Phineas competitive advantages, we believe that achieving the broad goal of enhancing market liquidity for mortgages is consistent with enhancing shareholder value
»> Distinctive competencies that Phineas can transfer beyond its current business and into new initiatives include:
* Interest rate risk analytics (and associated brand)
® Mortgage credit analysis
® Capital markets expertise
n o a
1:;0 o o o Vl o '-0 '-0 '-0
8 ~
cltlgroUpJ

>-c:In (3 0
§"~ o 0.(1) (1)
o.-:::l ~ 0-. .: ~ ........... en >-c:I .: ..... ~ 0 :::l"C ............ ....... ..... o ~ g:~ .: IJ:j ~ .: :;0 i!J . .: :::l ...... (1) (1) en en en
"TI
§ (ii'
~
~ n o a
1:;0 o o o Vl ...... o o o
~ ~ o· :::l
,~,!,!Is"~,~,!:!,r~,~,!"",~,!,!!,~,!!!,!!!,!,!!,~,!!,!,!,~,~,!",,,!~,!,,"~,!!,!,,!:!,!,!,!,,"""""""""""""""""""""""""""""""""""""""""" >- Citigroup's recommendations to enhance Phineas shareholder value have been made under the
following assumptions:
'@ Current regulatory and charter constraints have been "assumed away"
@ Phineas must currently have, or be able to readily obtain, the required key competencies
'@ Recommendations must be executable and meaningful to valuation and both net income and EPS growth
)0 Recommendation #1: Optimize value of portfolio business
@ Manage portfolio to optimize returns, not to achieve "earnings" growth
@ Isolate portfolio business via tracking stock structure to optimize investor interest
'@ Reduce use of synthetic derivatives
> Recommendation #2: Consider three new business lines
@ Non-conforming residential mortgage guaranty / conduit sub-prime
@ Mortgage insurance
@ Asset management / risk analytics
)0 Recommendation #3: Consider comprehensive investor relations program
@ Re-introduce tutorial on "how Phineas makes money"
@ Focus on communicating a non-GAAP financial measure consistent with how the business is managed
9 ~
cltlgroUpJ

>-c:In (3 0
§"~ o 0.(1) (1)
o.-:::l ~ 0-. .: ~ ........... en >-c:I .: ..... ~ 0 :::l"C ............ ....... ..... o ~ g:~ .: IJ:j ~ .: :;0 i!J . .: :::l ...... (1) (1) en en en
"TI
§ (ii'
~
~ n o a
1:;0 o o o Vl ...... o o ......
~ ~ o· :::l
The "dustbinJJ
,::::. Full privatization .. We valued the business with and without the charter: the resulting higher capital requirements
.::::: Full exit from portfolio business
·t:· Transform portfolio business into REIT
.::::: Transform into a depository (acquire retail deposits)
::~::: Spin-off of multi-family business
,::::. Preemptive capital raising
10
and funding cost, and the necessary downsizing of the portfolio and guaranty businesses lead to a valuation difference, or implied value of the charter, of c. $29 per share
.. A full exit from the portfolio business would lead to a multi-year run-off, in which the infrastructure needs to be maintained
.. This strategy would only make sense if Phineas could replace lost earnings with higher earnings growth businesses consistent with core competencies and only if this did not compromise the single family business
.. A REIT structure would require separate taxable and non-taxable subsidiaries for the portfolio and guarantee business, which would only be possible without the charter
.. The portfolio business would need to be significantly downsized; tax savings would not exceed the impact of higher financing costs, lower leverage and a smaller portfolio
.. Acquiring an inexpensive funding source would require a significant investment in either long-term de novo branch building or acquisitions at high premiums
.. Given the size of the portfolio assets, a dominant share of the U.S. deposit market would be required to have a meaningful impact on earnings
.. Higher bank capital requirements (5%) would dilute ROE
.. Spinning-off the multi-family business would raise questions by the market given its small size and high core profitability compared to the overall business
.. The multi-family business is "mission-rich"; a spin-off would simply lead to a transfer of mission costs to other business lines unless goals can be acquired at lower cost
.. Would erode Phineas' existing value per share as additional capital cannot be deployed above the cost of equity and would thus dilute ROE for existing shareholders
~
cltlgroUpJ

; ••........
......... .......
"""""":
"""""":
..........
....... , .
....... , .
....... ,.
. ~ ...... "
. ... ~ .
.•..•..•..•. ~.
.............
.•..•..•..•. ~.
:~ ......... ~. ,' ....•.••• ~"'" .' .
". ~'.
:: .. _._._._.,
L. \ ... ,
"'~,
Confidential Proprietary Business Information Produced Pursuant to House Rules
:~ .:'
~: .... '.
t .....
. ~,.-.. ._ .. _ ..... :
..':-...... ,':
:" ':. ';
.. '~""" "
L. \ ....
"'~.
Fannie Mae
.: ....... .
. 't ...
.: ••....
::"-'-'-'-"
.', ~: •.•.•. , : .
..... .....
FM-COGR 00051002

>-c:In (3 0
§"~ o 0.(1) (1)
o.-:::l ~ 0-. .: ~ ........... en >-c:I .: ..... ~ 0 :::l"C ............ ....... ..... o ~ g:~ .: IJ:j ~ .: :;0 i!J . .: :::l ...... (1) (1) en en en
"TI ~ :::l :::l (ii'
~ ~ (1)
~ n o a
1:;0 o o o Vl ...... o o w
~ ~ o· :::l
,~,~"!,!!,!"!!,S"""!,!:!,~,!:!,U,!,S"!,,,,,!,,!!,'!!,!:!,,!!,!:l",,,,,!,,!,,!:!,~"!~,!,I!,!"""""""""""""""""""""""""""""""""""""""""",,"""""""""""" CycUcal
~ Consolidation amongst top originators ~
~ Accelerated use of private label products ~
'% Decreased spreads on subordinated bonds '%
*" Increased (hybrid) ARM origination *" ~ I ncreased sub-prime and Alt-A origination ~
% Growth of affordability products (10, Option %
ARMs)
*" I ncreased participation among both traditional *" and new investors including foreign central banks, REITs, COOs and hedge funds
*" Impact of Basel II implementation *"
*" Competition from Freddie Mac *" '% Fall in the rate of conforming mortgage '%
originations
*" Potentially slowing home price appreciation *" ~ Growing homeownership rates ~
12
Competitive
Secondary Market
Secondary Market
Primary Market
Primary Market
Primary Market
Competitive
Regulatory
Competitive
Primary Market
Macro-economic
Macro-economic
Structural
~ Larger competitors compete more aggressively for assets, have greater pricing power and ability to develop new products; increased vertical integration of Wall Street firms
*" Decrease in guaranty business as issuers pursue alternative executions
% I ncreases relative attractiveness of private label execution, driving business away from Phineas
*" Lower share of originations sold to Phineas due to its lower market share in the ARM market versus fixed rate products
~ Reduction in share of agency-eligible loans reduces Phineas' target market
*" Product innovation reduces Phineas' target market
*" Crowded competitive landscape seeking to acquire assets causes spread compression, thus limiting Phineas' opportunities
*" Retaining mortgages will become a more attractive opportunity for depositories
*" Freddie Mac's focus on regaining market share from Phineas could result in a permanent loss of market share
% Agency eligibility by loan size limits growth
*" Slowing home price appreciation may impede growth
~ I ncreased mortgage debt creates increased market opportunity; increased volume for guaranty business may be partially offset by use of non-conforming products
~
cltlgroUpJ

>-c:In (3 0
§"~ o 0.(1) (1)
o.-:::l ~ 0-. .: ~ ........... en >-c:I .: ..... ~ 0 :::l"C ............ ....... ..... o ~ g:~ .: IJ:j ~ .: :;0 i!J . .: :::l ...... (1) (1) en en en
"TI
§ (ii'
~
~ n o a
1:;0 o o o Vl ...... o o +-
~ ~ o· :::l
Depository institutions will likely increase holdings of
,!,!:!,~,!:!,S,!!,IJI,!"",!,!,!,!,!,!"""""""""""""""""""""""""""""""""""""""""""""""""""""""""""""""""""""""""""""""""""""""""""""""""""""""""""""""""""""""" .. Depositories have increased mortgage holdings relative to total assets every year
since 1998, bringing their market share to its highest level since 2000
.. Basel II is likely to accelerate this trend as capital requirements against mortgages held are set to decrease beginning in 2008
$ in billions
111 !: ... 0 ..J
z-'E J!! :;::; :; :;: Qj C, !:
iii
$3,000 35%
2,000 1 -"", ~--':""'~"~: m:;::~ ww_.·/~ 130
1,000 1 mm oom ww oom ww oom moo mw ww ... mw 1 25
o 1995 1996 1997 1998 1999 2000 2001 2002 2003 2004
~Single/Multifarrily Loans Held By Banks & Thrifts
....... ,:: ........ Single/Multifarrily Loans Held By Banks & Thrifts As A % Of Total Single/Multifarrily Loans .... Single/Multifarrily Loans Held By Banks & Thrifts As A % Of Their Total Assets
20
~ Relative to the current standard approach, risk weightings for mortgages on residential property will decrease from 50% to 35%
~ The 10 largest U.S. banks are likely to be required to use the advanced internal ratings ("A-IRS") approach, with the next 10 largest banks likely to adopt such approach voluntarily (the remaining U.S. banks are expected to continue to use the standard approach)
~ Capital required to be held against mortgages will likely decrease for the banks adopting A-IRS
~ These 20 banks may then have additional incentives to retain mortgages in their own portfolios rather than sell them to Phineas
Of> These banks may also have greater incentives to compete with the GSEs in purchasing mortgages from other originators
13 Source: Federal Reserve Board. ~
cltlgroUpJ

>-c:In (3 0
§"~ o 0.(1) (1)
o.-:::l ~ 0-. .: ~ ........... en >-c:I .: ..... ~ 0 :::l"C ............ ....... ..... o ~ g:~ .: IJ:j ~ .: :;0 i!J . .: :::l ...... (1) (1) en en en
"TI ~ :::l :::l (ii'
~ ~ (1)
~ n o a
1:;0 o o o Vl ...... o o Vl
~ ~ o· :::l
Primary market consolidation increases pricing
,I!,!!,!,!,!:!"~!"",~,!!"",~,:!!!,!"",!,!!,!!"",,I!,~,!:!,!~,!,,!,,~"",!,!,!,!,!,!,,"""""""""""""""""""""'"''''''''''''''''''''''''''''"""""""""",,:
VI s::: 0 :; .= CI .;::
0 iii (5 I--0
C CII u ... CII a.
¢ The drive to capitalize on economies of scale and scope have led to rapid consolidation within the mortgage industry over the past 10 years
~ The consolidation of top originators has created competitive pressures as larger, more efficient originators are able to price mortgage loans and securities more aggressively in the secondary market
78.7% 80.0% 76.8%
60.0
40.0
20.0
0.0 1990 1991 1992 1993 1994 1995 1996 1997 1998 1999 2000 2001 2002 2003 2004
mTop5 • Second 5 ~:}Next15
14 Source: Inside MBS & ABS. ~
cltlgroUpJ

>-c:In (3 0
§"~ o 0.(1) (1)
o.-:::l ~ 0-. .: ~ ........... en >-c:I .: ..... ~ 0 :::l"C ............ ....... ..... o ~ g:~ .: IJ:j ~ .: :;0 i!J . .: :::l ...... (1) (1) en en en
"TI
§ (ii'
~
~ n o a
1:;0 o o o Vl ...... o o 0\
~ ~ o· :::l
Phineas' market share has dec~ined as ARM
~,!!,S"!"!!,!,!,!"~"!:!",,!,~,,!,!:!,,!!!,!,,,,,~,!,!,,,,,!,E:,~!,!,!,~,!,!,!,~""'"''''''''''''''''''''''''''''''''''''''''''''''''''''''''''''''''''''''''''''''''""""""""""""""""",,, ? The share of mortgage originations comprised of adjustable rate mortgages ("ARMs") is generally tied to both absolute
and relative levels of interest rates
? Other factors have also led to increased ARM originations:
" Increased popularity of hybrid ARMs
" Growth of the sub-prime market, of which approximately 70% of originations are ARMs
? Phineas has historically captured a smaller share of the ARM market compared to the fixed market
% The popularity of hybrid ARMs may signal a structural change in the fixed-rate versus ARM composition of mortgage originations
($ m billions)
70.0% 14.0% $2,500
61%
12.0 58%
/~,275
2,000 • __ --/"0// :i:'~\
" ~ 50.0 5 0
" 10.0 0
-< CD Q)
50.0%
40.0
• 00' 1b :~ 43%
~ 40.0 7% : ~"""" 39% 34%35%34%1
~ 8.0 --i "'" 1 30.0 0 1,500 -.....
" " ill ' ~ 31%'
'0 30.0
" Q)
!::! 20.0 Q) 0..
28% ~
22%ffiI .... , •.
~ 17~
iil '" '" " 6.0 -< ;0
~ 4.0 "" 2.0
12% lIIIII lIIIII12%
0.0 11111111111111111111111 I,:,:, :,:,:,:1 0.0
10.0
" :II
'" !!!. Cf) In 1,000 $889
J'I1 20.0 :;:
$793
$541
500 10.0
0.0 1983 1985 1987 1989 1991 1993 1995 1997 1999 2001 2003 2005E 1994 1995 1996 1997 1998 1999 2000 2001 2002 2003 2004 = ARM Market Share --1 O-Year Treasury = Total ARM MBS Issuance ::::::::::Total Fix MBS Issuance .', Phineas ARM Market Share ~ Phineas Fix Market Share
15 Source: Inside MBS & ABS and Mortgage Bankers Association. ~
cltlgroUpJ
>-c:In (3 0
§"~ o 0.(1) (1)
o.-:::l ~ 0-. .: ~ ........... en >-c:I .: ..... ~ 0 :::l"C ............ ....... ..... o ~ g:~ .: IJ:j ~ .: :;0 i!J . .: :::l ...... (1) (1) en en en
"TI
§ (ii'
~
~ n o a
1:;0 o o o Vl >-' o o -.l
~ ~ o· :::l
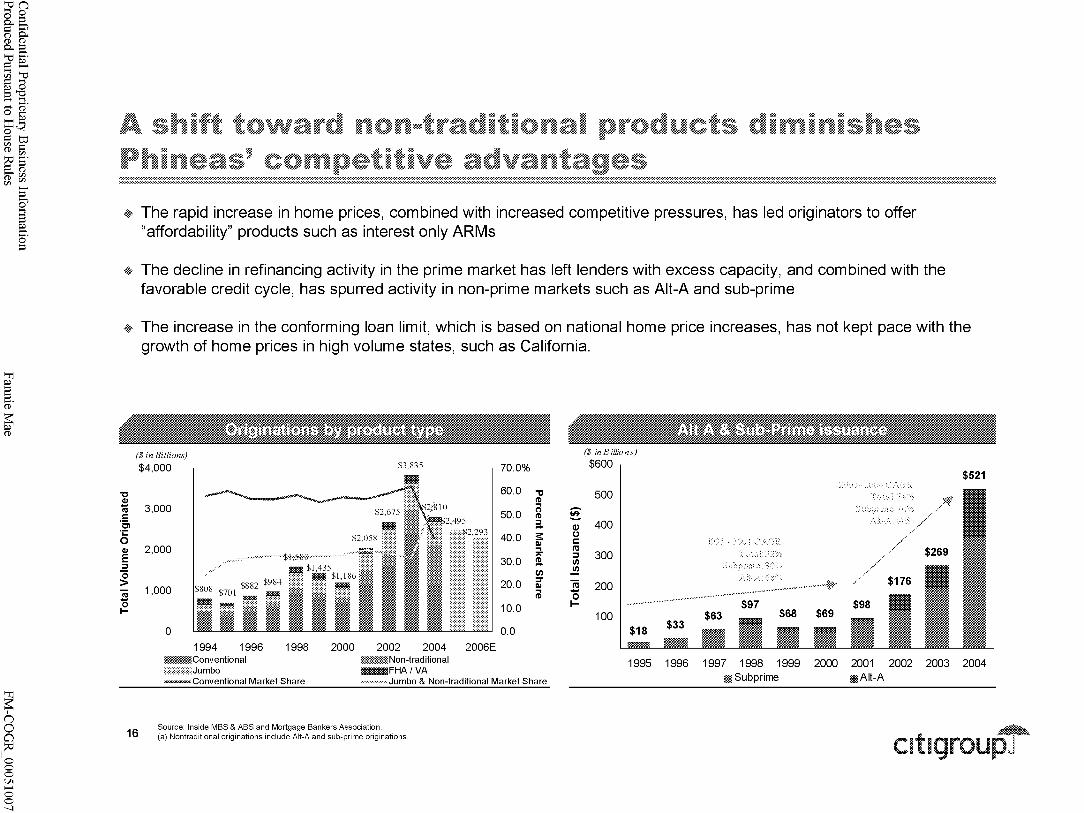
A shift toward nonmtraditionai products diminishes Phineas' competitive advantages
-:-:-:-:-:-:-:-:-:-:-:-:-:-:-:-:-:-:-:-:-:-:-:-:-:-:-:-:-:-:-:-:-:-:-:-:-:-:-:-:-:-:-:-:-:-:-:-:-:-:-:-:-:-:-:-:-:-:-:-:-:-:-:-:-:-:-:-:-:-:-:-:-:-:-:-:-:-:-:-:-:-:-:-:-:-:-:-:-:-:-:-:-:-:-:-:-:-:-:-:-:-:-:-:-:-:-:-:-:-:-:-:-:-:-:-:-:-:-:-:-:-:-:-:-:-:-:-:-:-:-:-:-:-:-:-:-:-:-:-:-:-:-:-:-:-:-:-:-:-:-:-:-:-:-:-:-:-:-:-:-:-:-:-:-:-:-:-:-:-:-:-:-:-:-:-:-:-:-:-:-:-:-:-:-:-:-:-:-:-:-:-:-:-:-:-:-:-:-:-:-:-:-:-:-:-:-:-:-:-:-:-:-:-:-:-:-:-:-:-:-:-:-:-:-:-:-:-:-:-:-:-:-:-:-:-:-:-:-:-:-:-:-:-:-:-:-:-:-:-:-:-:-:-:-:-:-:-:-:-:-:-:-:-:-:-:-:-:-:-:-:-:-:-:-:-:-:-:-:-:-:-:-:-:-:-:-:-:-:-:-:-:-:-:-:-:-:-:-:-:-:-:-:-:-:-:-:-:-:-:-:-:-:-:-:-:-:-:-:-:-:-:-:-:-:-:-:-:-:-:-:-:-:-:-:-:-:-:-:-:-:-:-:. ........................................................................................................................................................................................................................................................................................................................................................
-& The rapid increase in home prices, combined with increased competitive pressures, has led originators to offer "affordability" products such as interest only ARMs
4- The decline in refinancing activity in the prime market has left lenders with excess capacity, and combined with the favorable credit cycle, has spurred activity in non-prime markets such as Alt-A and sub-prime
-& The increase in the conforming loan limit, which is based on national home price increases, has not kept pace with the growth of home prices in high volume states, such as California.
"C CIl
1ii c: '0, .;: o CIl E ::::J
"0 > iii "0 I-
($ in Billions)
$4,000
3,000
2,000
1,000
o
$3,835
1994 1996 1998 2000 2002 2004 ~Conventional
::::::::::::::::::::::Jumbo ;:;:;:;:;:;:;:;:;:;:;: Non-trad itional IIIIIIIIIIIIIIIFHA/VA
70.0%
60.0 "C t1) ...
50.0 n t1)
a 40.0 s:
III ... ~
30.0 !a-en
20.0 :::T III ... t1)
10.0
0.0 2006E
~~Conventional Market Share .. Jumbo & Non-traditional Market Share
Source: Inside MBS & ABS and Mortgage Bankers Association.
($ inBillions)
$600 $521
500
~ Q) 400
!:: ... ::::{
.............
0 r::: :.:<;: .. n:s ::::J 300 I/)
..!!!
. ~ ;:
•• ::~:: .• :.:; !" :::>
iii 200 - •....
0 I-
100
1995 1996 1997 1998 1999 2000 2001 2002 2003 2004 mSubprime mAlt-A
16 (a) Nontraditional originations include Alt-A and sub-prime originations. ~
cltlgroUpJ

>-c:In (3 0
§"~ o 0.(1) (1)
o.-:::l ~ 0-. .: ~ ........... en >-c:I .: ..... ~ 0 :::l"C ............ ....... ..... o ~ g:~ .: IJ:j ~ .: :;0 i!J . .: :::l ...... (1) (1) en en en
"TI
§ (ii'
~
~ n o a
1:;0 o o o Vl ...... o o 00
~ ~ o· :::l
,~,~,!,!,!!,!,!"",!,,!!,,~,!,!,,",!!!,,!!,,~,~,!!,,,,!!,,~,!,~,!,,",!!,!!,~J!!,!,!,!,!!"""~"~,!,!!"!,!,!"",!"~,,,,,~,,~,~,~,,,,,,: • Economies of scale created through originator consolidation have increased opportunities for securitization in
the private label market, which had not previously been economically viable due to the fixed costs associated with securitization
¢ In addition, due to Phineas' limited presence in the sub-prime and Alt-A sectors, and reduced role in the ARM market, originators have gravitated towards selling or securitizing via the private label markets
($ in billions) $1,199
$1,200 50.0%
1,000 40.0
800 CIl s: E ::::J
30.0 III ... ~
"0 600 > !2. II)
CIl :::T C.J c: ra
20.0 III ... t1)
::::J 400 C/l
..!!! II) III 200 2:
10.0
0 0.0 1990 1991 1992 1993 1994 1995 1996 1997 1998 1999 2000 2001 2002 2003 2004
~ Private Label MBS Issuance :.:::::::::::::::;::: Phineas MBS Issuance ................... Private Label Market Share -- Phineas Market Share
17 Source: Inside MBS & ABS. ~
cltlgroUpJ

>-c:In (3 0
§"~ o 0.(1) (1)
o.-:::l ~ 0-. .: ~ ........... en >-c:I .: ..... ~ 0 :::l"C ............ ....... ..... o ~ g:~ .: IJ:j ~ .: :;0 i!J . .: :::l ...... (1) (1) en en en
"TI
§ (ii'
~
~ n o a
1:;0 o o o Vl ...... o o '-0
~ ~ o· :::l
Increasing home ownership rates have a positive
,!"!!.!"~,!,~!""~,!,!"",~,~"!"!:!,!!,!",,,,,,,,,,,,,,,,,,,,,,,,,,,,,,,,,,,,,,,,,,,"""""""""""""""""""""""""""""""""""""""""""""""""""""""""""""""""""""""""""""""""""""""""""" .. After remaining relatively stable from 1976 to 1994, the rate of homeownership in the United States
has grown steadily
c.. ..c VI ... CII s::: ~ 0 CII E 0 :I: -0 CII
~
~ Lower mortgage rates and strong economic growth have increased homeownership
~ The evolution of the sub-prime and Alt-A markets have contributed to increased homeownership opportunities for those who do not qualify for conventional loans. Loan originations by nontraditional lenders grew by approximately 31 % annually between 1994 and 2004, compared to 14% annually for all originations
70.0% $10,000
s: 8,000 0
::l (Q III
(Q
6,000 II)
65.0 C:C _. II)
4,000 5=5t :::s 0 VI s::: - -
2,000 !Il. III :::s c.. :i.
60.0 0 (Q
1976 1978 1980 1982 1984 1986 1988 1990 1992 1994 1996 1998 2000 2002 2004
:::::::::::::::::}~ Home Ow nership Rate ......... ·.·.·.·.·.·.·l\Ibrtgage Debt Outstanding
18 Source: u.s. Census Bureau and Federal Reserve Board. ~
cltlgroUpJ

>-c:In (3 0
§"~ o 0.(1) (1)
o.-:::l ~ 0-. .: ~ ........... en >-c:I .: ..... ~ 0 :::l"C ............ ....... ..... o ~ g:~ .: IJ:j ~ .: :;0 i!J . .: :::l ...... (1) (1) en en en
"TI
§ (ii'
~
~ n o a
1:;0 o o o Vl ...... o ...... o
~ ~ o· :::l
Mortgage credit performance has varying impiications for Phineas' business lines -:-:-:-:-:-:-:-:-:-:-:-:-:-:-:-:-:-:-:-:-:-:-:-:-:-:-:-:-:-:-:-:-:-:-:-:-:-:-:-:-:-:-:-:-:-:-:-:-:-:-:-:-:-:-:-:-:-:-:-:-:-:-:-:-:-:-:-:-:-:-:-:-:-:-:-:-:-:-:-:-:-:-:-:-:-:-:-:-:-:-:-:-:-:-:-:-:-:-:-:-:-:-:-:-:-:-:-:-:-:-:-:-:-:-:-:-:-:-:-:-:-:-:-:-:-:-:-:-:-:-:-:-:-:-:-:-:-:-:-:-:-:-:-:-:-:-:-:-:-:-:-:-:-:-:-:-:-:-:-:-:-:-:-:-:-:-:-:-:-:-:-:-:-:-:-:-:-:-:-:-:-:-:-:-:-:-:-:-:-:-:-:-:-:-:-:-:-:-:-:-:-:-:-:-:-:-:-:-:-:-:-:-:-:-:-:-:-:-:-:-:-:-:-:-:-:-:-:-:-:-:-:-:-:-:-:-:-:-:-:-:-:-:-:-:-:-:-:-:-:-:-:-:-:-:-:-:-:-:-:-:-:-:-:-:-:-:-:-:-:-:-:-:-:-:-:-:-:-:-:-:-:-:-:-:-:-:-:-:-:-:-:-:-:-:-:-:-:-:-:-:-:-:-:-:-:-:-:-:-:-:-:-:-:-:-:-:-:-:-:-:-:-:-:-:-:-:-:-:-:-:-:-:-:-:-:-:-:-:-:-:-:-:. ........................................................................................................................................................................................................................................................................................................................................................
% Home price appreciation and the resultant equity bUild-UP nave mitigated credit losses
% There has been a rapid onset of affordability products, however, many of which contain layered risks
" Credit performance of these loans are expected to be worse than traditional loans due to new loan features which may reduce borrowers' ability to meet monthly payments (interest only and ARM reset dates) and loans which have reduced the amount of equity in borrowers' homes (higher LTV, second liens)
¢ Reduced perceived risk, limited yield opportunities, and new pools of capital (i.e. REITs and hedge funds) have increased demand for subordinated securities and driven a dramatic reduction in spreads which has increased the relative attractiveness of private label execution
¢ On the contrary an adverse credit event may provide more business opportunities for Phineas if investors become less risk tolerant
0.30%
lO~ ~ ~ ~
3 020
~ ~
~ 9
0.15
~ 0.10 ~ ~
u ~o~ z
0.00 "''''~--------------~ ~"" -'--~ ............. -
01 '00 03 '00 01 '01 03 '01 01 '02 03 '02 01 '03 03 '03 01 '04 03 '04 01 '05 ............ Washington Mutual, Inc. ~-Golden West Financial Corporation
450
400
350
300
250
200
150
/-'/\ \
~/"--~""---,,,,--,,, 100
o NoJ-02 Mar-03
-50
50 .~~- ::::;;;,::.~ .. --~ .. ~~--~~~.~- ~';'
-=- ~(16) Jul-03 Nov-03 Mar-04 Jul-04 Nov-04 Apr-05
-Phineas MBS ~ AAA Subprime······ AA Subprime ...... A Subprime - BBB Subprime
19 Source: Citigroup Research and SNL Datasource. ~
cltlgroUpJ

>-c:In (3 0
§"~ o 0.(1) (1)
o.-:::l ~ 0-. .: ~ ........... en >-c:I .: ..... ~ 0 :::l"C ............ ....... ..... o ~ g:~ .: IJ:j ~ .: :;0 i!J . .: :::l ...... (1) (1) en en en
"TI
§ (ii'
~
~ n o a
1:;0 o o o Vl ...... o ...... ......
~ ~ o· :::l
A reduction in home price appreciation may slow
,~,~"!,!,!,!,!,!,~"",S"~,~,~!"!:!",,,,,,,,,,,,,,,,,,,,,,,,,,,,,,,,,,,,,,,,,,,,,,,"""""""""""""""""""""""""""""""""""""""""""""""""""""""""""""""""""""""""""""""""""""""""""""""",,, o Strong home price appreciation combined with record low interest rates has fueled robust growth in
the housing market over the past two years
o Growth in home prices has led to a change in consumer behavior as borrowers have extracted excess equity via home equity products
-+ Home price appreciation is a major factor in the extremely low credit costs in the mortgage sector
-+ A reduction in home price appreciation would incrl;ase frequency and severity of losses
):"
g CII CI s::: CIS
..s::: ()
C CII !:! ~
16.0%
12.0
2000 - 2004 CAGR
;..t;using Price Ir.dex· 7%
r'A~dian HomE: Price Wio ...___ .. :. 1<.)"42noor A GR -- .' " 8 - OJ'. ...!"'.." _...-------- ,,/
Hous:ng FriCE: Index: 4% ___ ------ /'.
8.0
rV::edian Horne Rice: 4% ___ --...----- l
~=--::-~,/~/ 4.0
00 I ":"': .... : .... :/ .. : .... : ..
. 1990 ::::::::::::::: ........... :/ .. ::.. 1992 1994 1996 1998 2000 2002 2004
-4.0 ······················yOy % Change of Median Home Price ~- y OY % Change of Housing Price Index
20 Source: u.s. Census Bureau and OFHEO. ~
cltlgroUpJ

· .. : •.......• :
.........
::""""'"
::-"""""
', ...... . ', ...... .
: .. ::. ....
...... ......... .......
~ ••....... ,
•••....... ,
•••......... :
, .•..•...•.. ,: ...•.... ,:
"""""",
.. ': ....... ':
:::'::.:: ....... ,;
~ ••........ ,:
Confidential Proprietary Business Information Produced Pursuant to House Rules
. : ..... .
':"
. ~: ....
':"'" . :. .~: .'. ~:....... ~:
""""':.
~'" ... '.
". ~' .
". ~'.
Fannie Mae
;' ;.
'~""""'"
.' ~:....... : .
t .....
':.: ........ .
.: ...... .
. : ...... .
... \ .".
t ....
.......... ;.
':"'"
.. '~:... .:.
..... N
FM-COGR 00051012

>-c:In (3 0
§"~ o 0.(1) (1)
o.-:::l ~ 0-. .: ~ ........... en >-c:I .: ..... ~ 0 :::l"C ............ ....... ..... o ~ g:~ .: IJ:j ~ .: :;0 i!J . .: :::l ...... (1) (1) en en en
"TI
§ (ii'
~
~ n o a
1:;0 o o o Vl ...... o ...... w
~ ~ o· :::l
,!:'!'!!,!!l,~"!,!""~,:l!!,!!"!!!,!"~,!",,,~!,,,,!!!,~,!!,,~,,!'!'!!,!,,,,,!,,!,,~,~,,!,,~!,,""""""""""""""""""""""""""""""""""""""""'"""""""
Unique skills drive dramatic market share gains and ...
... outsized financial returns which result in
high equity market valuations
Hisiorica! stress factors
Larger-cap, higherrated com petitors aggressively play
defense ...
CasuaJties
.. . which .. . creating pressure compresses both to pursue revenue I financial returns earnings and valuations... diversification and
assess longer-term strategic options
Impact of charter
Funding I liquidity Household, Finova, Associates Insulates Phineas
Disintermediation I growth First USA, CIT Hinders Phineas
Lack of diversification MBNA Hinders Phineas
22 ~
cltlgroUpJ

+-' (/) Q) ::J 0-
";:: Q)
« «E z dl ~
Confidential Proprietary Business Information Produced Pursuant to House Rules
Q) c o ro +-' "6.. ro U
+-' (/)
::J !.... I""0 o o $:
""0 Q)
0:::
Q) 0> ro 0> t o ~
>ro C C «
m u I Q) ""0 C: l:!l Q) ro
" :>'""0 "," I- Q) Q) It: L""~ w - C Q) "_ <P +-'c > ~ U "- "- ""0
+=l 0.... ..c=""O
8- ::J~O o...roQ) Ou..-r.- (f)!....
:U -';- LL
Fannie Mae
ro "u C ro C i.L ro +-' Q)
o
Q)
e ::J o
(f)
ro +-' "6.. ro U
(/) +-' C Q)
E +-' (/) Q)
> C
o o 0.. «
M N
FM-COGR 00051014

>-c:In (3 0
§"~ o 0.(1) (1)
o.-:::l ~ 0-. .: ~ ........... en >-c:I .: ..... ~ 0 :::l"C ............ ....... ..... o ~ g:~ .: IJ:j ~ .: :;0 i!J . .: :::l ...... (1) (1) en en en
"TI ~
§ (ii'
~ ~ (1)
~ n o a
1:;0 o o o Vl ...... o ...... Vl
~ ~ o· :::l
EPS growth rates have generally trended downward
!~,~"",!,!!,~IJI,!"",~,!"I!""!!,!!,!,!'!,~"!,!!,!"!""""""",,,,,,"""""""""""""""""""""""""""""""""""""""""""""""""""""""""""""""""""""""""""""""""""""""""" 30%
25
CII 1ii a:: ..c 20 ~ 0 ... (!) CJ) a. w E ... CII I-CI s::: 0
...J
15 15% ... r=--10 ~ r
5
01/02/95 01/02/96 01/01/97 01/01/98 01/02199 01/02/00 01/01/01 01/01/02 01/02/03 01/02/04 07/11/05
.. Alineas --MBNA ,-.-.-.-.-.-.-.-.-.- Countryw ide --Sallie Mae
24 Note: Market data as of 07/11/2005. Source: Powerdata.
~
cltlgroUpJ

>-c:In (3 0
§"~ o 0.(1) (1)
o.-:::l ~ 0-. .: ~ ........... en >-c:I .: ..... ~ 0 :::l"C ............ ....... ..... o ~ g:~ .: IJ:j ~ .: :;0 i!J . .: :::l ...... (1) (1) en en en
"TI
§ (ii'
~
~ n o a
1:;0 o o o Vl ...... o ...... 0\
~ ~ o· :::l
"""",~,!!!"I!,!,!,!,!,!,.!!"",I:!~,!"!,!,!,~,!!"!,!.!"S",,,~!,,,,!!!,~,!.!,,~,,!,!,,!.!,!,!,,"""""""""""""""""""""""""""""""""""""""""""""""""""""""
Company Market Share
Countrywide 4.2%
Norwest 3.2
Prudential 3.1
Chase Manhattan 2.3
Chemical Residential 2.1
Fleet Mortgage 1.8
GE Capital 1.6
GMAC 1.4
Bank of America 1.3 North American Mortgage 1.3
22.3% Source: The 2005 Mortgage Market Statistical Annual.
ffffffffffffffffff@lil@ffffffffffffffffit: Company Market Share
Citigroup 17.4% MBNA America 7.8
AT&T Universal 5.5 First Chicago 5.4 First USA 4.9
Household Bank 4.8 Chase Manhattan 4.6 Chemical Bank 4.0
Bank of America 3.6 Signet Bank 3.4
61.4%
Company
Countrywide
Wells Fargo
Washington Mutual
JP Morgan Chase
Bank of America
Citigroup
GMAC
Ameriquest
National City ABN AMRO
2004 ta)
Company
Bank of America JP Morgan Chase
Citigroup Capital One HSBC Bank
Washington Mutual Wells Fargo U.S. Bancorp
USAA Federal Savings
Based on volume outstanding of top 50 bank credit card issuers. (a) Pro forma for recent mergers.
25
Market Share
12.9%
10.6
9.1
7.0
5.1
3.7
3.1
2.9
2.3 2.0
58.7%
Market Share
25.3% 23.8
20.5 9.4 4.0
3.3 2.4 1.9
1.3
66.4%
Company Market Share Company Market Share
Household 35.1% HSBC 43.1% Associates First Capital 27.0 Citigroup 37.7 Beneficial 13.9 Wells Fargo 12.0 Commercial Credit 6.7 AIG 7.2 Avco 5.5
Norwest Finance 4.5 Transamerica Finance 3.5 American General Finance 2.1 Aristar 1.7
100.0% 100.0% NB: Market share based on sum of top 9 or 4 consumer finance receivables.
fffffffffffffffffit:Wiiifffffffffffffffffi Company Market Share
GE Capital
Mortgage Guaranty Insurance PMI Mortgage Insurance AIG Republic Mortgage Insurance Commonwealth Amerin Guaranty Triad Guaranty Insurance
27.6%
25.7 13.8 13.3 8.7 7.8 1.9 1.2
100.0% Source: The 2005 Mortgage Market Statistical Annual.
2004
Company Market Share
Mortgage Guaranty Insurance 23.2%
PMI Mortgage Insurance 18.7 Radian Guaranty 15.9 AIG 13.5 Genworth Financial 13.5 Republic Mortgage Insurance 10.3 Triad Guaranty Insurance 4.8
100.0!)/!)
Note: Market share based on sum of top 7 or 8 mortgage insurers insurers in 1994 and 2004 respectively.
~
cltlgroUpJ

.........
"""
........ , .
........ , .
......
....... ":
: .. L .. ,.
"""""".
':-"""""
::""""'"
::., :
.........
".:'.
. """'~.
..•..•..•• : .. ;
"""""".
. '. '. ""~.
\"""
~'" ... '.
" •..... , ..
Confidential Proprietary Business Information Produced Pursuant to House Rules
'~"""""':
, .......... :
'::::-.'.'.' .~ .... :.
:; ....... .
::,,::,
. .•..•..
::~ . ~~ '~:l .; .. : ...... .
\ ..... .
Fannie Mae
t .....
.. ~:... ;,
::" :~ .
.: •......... ;
.; ...... .
.;,,' .....
""";,
,' ....... .
. .. ": ..... , '.:
": "\ :::.: ....... ;'
co N
FM-COGR 00051017

Confidential Proprietary Business Information Produced Pursuant to House Rules Fannie Mae FM-COGR 00051018

>-c:In (3 0
§"~ o 0.(1) (1)
o.-:::l ~ 0-. .: ~ ........... en >-c:I .: ..... ~ 0 :::l"C ............ ....... ..... o ~ g:~ .: IJ:j ~ .: :;0 i!J . .: :::l ...... (1) (1) en en en
"TI ~ :::l :::l (ii'
~ ~ (1)
"TI ~ I n 0 a
1:;0 0 0 0 Vl ...... 0 ...... '-0
~ ~ o· :::l
,~~,!!!"I!,!,~,~,!,!,!!"",!!!,!,~~!,!"",!,!,!,!,!"!!,!,,~,!,,"""""""""""""""""""""""""""""""""""""""""""""""""""""""""""""""""""""""""""" 7/11/2005 Forward Price I
InstitutionlSector A~~ Mkt Cap 2006 PIE Book Value(a) 2006E
PEG Ratio
Current Divd. Yield (b)
I Phineas $57,164 8.3x 2.2x 83% 1.8% I
Freddie Mac 45,529 9.4 1.7 99 1.8
Mortgage Banks 27,130 8.8 2.1 66 2.4
Depositories wi Mortgage Platforms 322,412 11.1 1.8 112 3.5
Multi-Family Banks 8,012 11.9 1.5 119 11.1
Thrifts 56,118 11.3 2.2 101 2.4
Financial Guarantors 17,903 10.1 1.3 79 0.7
Mortgage Insurers 14,003 8.6 1.2 71 0.5
Residential MBS REITs 4,920 8.3 1.0 199 11.0
Commercial MBS REITs 2,483 9.9 1.7 158 8.3
Source: IDD, SNL Datasource. Mortgage Banks: Countrywide Financial Corp. (CFC), PHH Corp. (PHH), Indymac Bancorp Inc. (NDE); Depositories wi Mortgage Platform: Wells Fargo & Co. (WFC), Bank of America Corp. (BAC), National City Corp. (NCC), North Fork Bancorporation (NFB); Multi-Family Banks: New York Community Bancorp Inc. (NYB), Independence Community Bank Corp. (ICBC); Thrifts: Golden West Financial Corp. (GDW), Washington Mutual Inc. (WM); RMBS REITs: Redwood Trust Inc. (RWT), Annaly Mortgage Mgmt Inc. (NL Y), Anworth Mtg Asset Corp. (ANH), Luminent Mortgage Capital (LUM), MFA Mortgage Investments (MFA); CMBS REITs: Newcastle Investment Corp. (NCT), Anthracite Capital Inc. (AHR), Capital Trust (CT);
Financial Gurantors: MBIA Inc. (MBI), Ambac Financial Group (ABK), Assured Guaranty Ltd (AGO); Mortgage Insurers: MGIC Investment Corp. (MTG), Radian Group Inc. (RDN), PMI Group Inc. (PMI)
(a) Book Value as on December 31, 2004. Phineas book value equals $35.5 billion total equity less $9.108 billion in preferred shares, per Phineas management.
(b) Last quarter annualized.
27 ~
cltlgroUpJ

>-c:In (3 0
§"~ o 0.(1) (1)
o.-:::l ~ 0-. .: ~ ........... en >-c:I .: ..... ~ 0 :::l"C ............ ....... ..... o ~ g:~ .: IJ:j ~ .: :;0 i!J . .: :::l ...... (1) (1) en en en
"TI
§ (ii'
~
~ n o a
1:;0 o o o Vl ...... o N o
~ ~ o· :::l
Historical stock price performance versus portfolio
!,!,!,~"""~"~,!!"",U"~~,~,~,!!""""""""""""""""""""""""",,,,,,""""""""""""""""""""""""""""""""""""""""""""""""""""""""""""""""""""""""""""""""""""""""""""""" $100
(a) (b) (c)(d) (e) (f) (g)
90
80
CII 70 u .;:: a. ..>0: 60 u 0 en VI 50 CIS CII .= ..c 40 a.
30
20
10
01/02/95 01/02/96 01/01/97 01/01/98 01/02/99 01/02/00 01/01/01
(a) 10109/1998: Freddie Mac's mortgage insurance proposal fails. (b) 03/22/2000: Gary Gensler addresses role of GSEs and their increasing potential risk to the capital markets. (c) 11/08/2000: George W. Bush elected President. (d) 1/03/2001: First in a series of 13 rate decreases by the Federal Reserve Board. (e) 1/23/2003: Freddie Mac announces it will revise earnings for at least the previous two years.
01/01/02 01/02/03 01/02/04
(I) 3/30/2004: Regulators announce that Phineas may have to correct published financial statements as a result of the government accounting review. (g) 6/30/2004: First in a series of 9 rate increases by the Federal Reserve Board.
tM.O\~
07/11/05
1998 1999 2000 2001 2002 2003 2004 2005 "'"'''''''''''''''''''''''''''''''''''''''''''''''''''' """"""""""""""""""""""""'"'''''' """"""""""""""""""""""""""'''''' '''''''''''''''''''''''''''''''''''''''''''''''''''''''''' """""""""""""""""""""""""""'''''''''' """""""""""""""""""""""'"'''''''''''''''''' """"""""""""""""""'''''''''''''''''''''' """""""""""""'"
Q1 Q2 Q3 Q4 Q1 Q2 Q3 Q4 Q1 Q2 Q3 Q4 Q1 Q2 Q3 Q4 Q1 Q2 Q3 Q4 Q1 Q2 Q3 Q4 Q1 Q2 Q3 Q4 Q1 Q2
EPS Growth (%) 16 16 12 12 13 14 14 16 16 12 16 14 7 33 9 70 7 6 (18) (51) 65 (24) 158 135 (2) 1 NA NA NA NA
Core Earnings Growth (%) NA NA NA NA NA NA NA NA NA NA NA NA 18 21 22 25 23 22 22 19 24 20 13 7 10 3 NA NA NA NA
Portfolio Growth (%) NA NA NA NA 35 36 34 26 22 16 13 16 19 21 20 16 15 12 9 12 42 26 15 18 8 9 (1 ) 1 (2) (7)
Source: Company reports and Powerdata. Note: Growth rates represent year-over-year quarterly growth. 2Q 2005 Portfolio growth from May 2005 company update. Earnings data are prior to restatement. Phineas adopted FAS 133 on Jan 1, 2001.
28 ~ cltlgroUpJ

>-c:In (3 0
§"~ o 0.(1) (1)
o.-:::l ~ 0-. .: ~ ........... en >-c:I .: ..... ~ 0 :::l"C ............ ....... ..... o ~ g:~ .: IJ:j ~ .: :;0 i!J . .: :::l ...... (1) (1) en en en
"TI ~ :::l ~. (1)
~ ~ (1)
"TI ~ I n 0 a
1:;0 0 0 0 Vl ...... 0 N ......
~ ~ o· :::l
,~I!,~,~,~,!,!:,!I""~,!!,!!!"",L"~,!,~,,,,,!,!,~,!:!,,!,,!!,Et!"",~!I!!,!,!!"",~,~""!,~,!"",~,~,~",,,~,~,~: Hiah Median Low Current Phi neas as a Percent of:
Phineas 21.0x 12.5x 6.9x 8.1x Freddie Mac Freddie Mac 24.1 12.6 7.6 10.0 Thrifts & Mortgage Banks Thrifts & Mortgage Banks 15.6 10.3 6.6 10.8 Mortgage Insurers Mortgage Insurers 18.4 9.9 5.9 9.1 S&P 500 S&P 500 28.1 18.8 12.6 16.3
100%
90 CJ)
~. ~: . a. w 2:
80 I-Z a: 0 0
70 It)
a.
. .' ':~: : ::: "
J i\fiJm~J'r IAJit ~i!~l~~~~f~ "II, ~~ i I ,
0/1 CJ) -0
C CII !::! CII a. CIS VI CIS
CJ) a. w 2: I-Z a:
60
50
40
30
20 01/02/95 01/02/96 01/01/97 01/01/98 01/02/99 01/02/00 01/01/01 01/01/02
Hiah
112% 226 244
92
01/02103
.. Phineas -~ Freddie Mac -~ I\Ibrtgage Insurers·········, Thrifts & I\Ibrtgage Banks Source: Powerdata and IBES estimates.
Median Low Current
96% 75% 81% 124 63 75 118 76 89 66 41 50
~~~;';.~)
61%
':j: ::::. '::.~;"
01/02/04 07/11/05
N.B. Thrifts and Mortgage Banks include Countrywide Financial Corp. (CFC) , Golden West Financial (GDW) and Washington Mutual Inc. (WM). Mortgage Insurers include MGIC Investment Corp.
(MTG) , Radian Group Inc. (RDN) and PMI Group Inc. (PMI). Market data as of 7/11/2005. cltlgrou~ 29

>-c:In (3 0
§"~ o 0.(1) (1)
o.-:::l ~ 0-. .: ~ ........... en >-c:I .: ..... ~ 0 :::l"C ............ ....... ..... o ~ g:~ .: IJ:j ~ .: :;0 i!J . .: :::l ...... (1) (1) en en en
"TI ~ :::l :::l (ii'
~ ~ (1)
~ n o a
1:;0 o o o Vl ...... o N N
~ ~ o· :::l
Historical PE ratio -:-:-:-:-:-:-:-:-:-:-:-:-:-:-:-:-:-:-:-:-:-:-:-:-:-:-:-:-:-:-:-:-:-:-:-:-:-:-:-:-:-:-:-:-:-:-:-:-:-:-:-:-:-:-:-:-:-:-:-:-:-:-:-:-:-:-:-:-:-:-:-:-:-:-:-:-:-:-:-:-:-:-:-:-:-:-:-:-:-:-:-:-:-:-:-:-:-:-:-:-:-:-:-:-:-:-:-:-:-:-:-:-:-:-:-:-:-:-:-:-:-:-:-:-:-:-:-:-:-:-:-:-:-:-:-:-:-:-:-:-:-:-:-:-:-:-:-:-:-:-:-:-:-:-:-:-:-:-:-:-:-:-:-:-:-:-:-:-:-:-:-:-:-:-:-:-:-:-:-:-:-:-:-:-:-:-:-:-:-:-:-:-:-:-:-:-:-:-:-:-:-:-:-:-:-:-:-:-:-:-:-:-:-:-:-:-:-:-:-:-:-:-:-:-:-:-:-:-:-:-:-:-:-:-:-:-:-:-:-:-:-:-:-:-:-:-:-:-:-:-:-:-:-:-:-:-:-:-:-:-:-:-:-:-:-:-:-:-:-:-:-:-:-:-:-:-:-:-:-:-:-:-:-:-:-:-:-:-:-:-:-:-:-:-:-:-:-:-:-:-:-:-:-:-:-:-:-:-:-:-:-:-:-:-:-:-:-:-:-:-:-:-:-:-:-:-:-:-:-:-:-:-:-:-:-:-:-:-:-:-:-:-:. ........................................................................................................................................................................................................................................................................................................................................................
Hiah Median Low Current Phi neas as a Percent of: Hiah Median Low
Phineas 161% 93% 56% 81% Freddie Mac 127% 104% 70% Freddie Mac 161 89 51 111 Thrifts & Mortgage Banks 218 112 59 Thrifts & Mortgage Banks 120 87 53 98 Mortgage Insurers 269 124 71 Mortgage Insurers 121 74 46 76
180%
160
140
120
.2 100 ~ (!) w 80 a.
,., :~~J~tf~~ttiT ' ~lVJ~v\~', If:(wrJt[~r \;~:,. ',)'qN > A~ J~ , J.r?i,yy,\;~~)Ai~if.:J· \1~,A/ ~::~:~f·:i\" l~!:t:;,;):-r\ ~:::::j'f:~rr it1j' f~ :~);tj'·r;ij::, .:./),.\'~~1\. ,Jli~>·l~~A .. /f~j;·~l\::,·~.~~+f "i %p/
60 IIJ\I$' l '1Vfr. "'( WI· :~I. 11 '$.~: ":N'H fii nt ·.,.::· \~t·l~{f.i:J~W J~ .. \J)~F::..... .. ~ . . ' , . ·i ~ . r;·\~\J '\};id .' " i ::..,~ ~r.; 'i'i;,v ~;>:. ..,
40
20
01/02/95 01/02/96 01/01/97 01/01/98 01/02/99 01/02/00 01/01/01 01/01/02 01/02103
Phineas -- Freddie Mac -~ IIIbrtgage Insurers··················· Thrifts & IIIbrtgage Banks
Source: Powerdata and IBES estimates.
01/02/04 07/11/05
Current
73% 82
107
111%
::} ,;::: '::.~;"
7~;';.~)
N.B. Thrifts and Mortgage Banks include Countrywide Financial Corp. (CFC) , Golden West Financial (GDW) and Washington Mutual Inc. (WM). Mortgage Insurers include MGIC Investment Corp.
(MTG) , Radian Group Inc. (RDN) and PMI Group Inc. (PMI). Market data as of 7/11/2005. cltlgrou~ 30

>-c:In (3 0
§"~ o 0.(1) (1)
o.-:::l ~ 0-. .: ~ ........... en >-c:I .: ..... ~ 0 :::l"C ............ ....... ..... o ~ g:~ .: IJ:j ~ .: :;0 i!J . .: :::l ...... (1) (1) en en en
"TI ~ :::l :::l (ii'
~ ~ (1)
~ n o a
1:;0 o o o Vl ...... o N w
~ ~ o· :::l
!,~,!,!,!"""~,!,!,!!,!!,!,!""!,~",,,!,!:!,~,,~!,!:!,~,,!,!!,,!,,~,!,,"'!,!'!,'!"!,l!,!,!,!"""""""""""""""""""""""""""""""""""",,,,""""""""""""""" Actual Return
Since 1/1/2005 1/1/2004
Annual Total Return since:
1/1/2002 1/1/2000 1/1/1995
IPhineas (15.0%) (11.9%) (5.7%) 1.6% 14.4% I GSEs
Freddie Mac (6.9) 10.6 2.4 7.9 17.4
Thrifts
Golden West Financial Corporation 10.0 19.9 26.5 30.9 26.1
Washington Mutual, Inc. 1.5 6.6 9.6 21.4 20.6
Mortgage Banks
Countrywide Financial Corporation 11.7 36.9 48.1 40.1 26.8
Mortgage Insurers
MGI C I nvestment Corporation (4.9) 10.5 1.8 3.7 13.4
Radian Group Inc. (9.2) (0.7) 3.3 15.2 18.9
PMI Group, Inc. (5.5) 3.9 4.3 10.2 12.0
Market Indices
S&P 500 2.6 7.0 1.4 (2.6) 10.1
S&P Financial Services Index (3.8) 4.4 3.8 5.1 14.1
Source: Powerdata, Bloomberg and WinEZ. Market data as of July 11, 2005. Total return calculated as total dividends reinvested plus stock price appreciation.
31 ~
cltlgroUpJ

>-c:In (3 0
§"~ o 0.(1) (1)
o.-:::l ~ 0-. .: ~ ........... en >-c:I .: ..... ~ 0 :::l"C ............ ....... ..... o ~ g:~ .: IJ:j ~ .: :;0 i!J . .: :::l ...... (1) (1) en en en
"TI § ~. (1)
~ ~ (1)
~ n o a
1:;0 o o o Vl ...... o N +-
~ ~ o· :::l
,~,~,!,!"",~,!!,~,~I!"",!,!,!!"",F!,~,~,!,!,~,!""!!",,,~,~!!,~"!!!,!,~"",!,~"",~,!,!!,~!,!"!:l!""""""""""""",,,,,
CII U s::: CIS E ... .E ... CII a. CII U .;: a. CII > :; &!
32
(a)
140%
120
100
80
60
01/22/03
(b) (c) (d) (e)
07/23/03 01/22104
(a) 1/2312003: Freddie Mac announces it ¥ViII revise earnings for at least the previous two years.
(f) (g) (h) (i)
::'. "
::::::'
07/22/04 01/21/05
.... Phineas -- FRE
(b) 6/10/2003: Freddie Mac fires 3 top executives amid allegations of failure to cooperate with investigations into accounting practices. Gregory Parseghian named as new CEO.
(c) 8/22/2003: Federal regulators order Freddie Mac's board to remove Gregory Parseghian from position as CEO due to his involvement in improper accounting practices.
U) (k)
.:':"
::\.
07/11/05
(d) 11/21/2003: Freddie Mac reports corrected financial statements for the previous three years but announces that it is still unable to provide timely earnings reports and \Nill not provide financials until mid-2004.
(e) 12/8/2003: Freddie Mac names Richard Syron as new CEO.
(f) 3/30/2004: Regulators announce that Phineas may have to correct published financial statements as a result of the government accounting review.
(g) 9/22/2004: Government regulators report that Phineas used improper accounting methods that raise questions about financial report and management quality.
(h) 11/15/2004: Phineas announces that it cannot meet deadline to file 10-0 and may be required to record $9 billion of previously unreported losses.
(i) 12/22/2004: Phineas' board replaces CEO Franklin Raines and CFO Timothy Howard amid accounting scandal.
U) 3/3112005: Freddie Mac announces 2004 results bringing its financial reporting current
1Q7%
(k) 6/212005: Phineas names Dan Mudd as new CEO.
Source: Powerdata and IBES estimates. Market data as of 7/11/2005.
~
cltlgroUpJ

>-c:In (3 0
§"~ o 0.(1) (1)
o.-:::l ~ 0-. .: ~ ........... en >-c:I .: ..... ~ 0 :::l"C ............ ....... ..... o ~ g:~ .: IJ:j ~ .: :;0 i!J . .: :::l ...... (1) (1) en en en
"TI
§ (ii'
~
~ n o a
1:;0 o o o Vl ...... o N Vl
~ ~ o· :::l
Historical sum~of@the~parts valuation based on
,~!J!,~"!:!!,~"""~,!!,!,!"!:!,!,!,!",,I!,,~,!,,,,!,!,~,!:!,,!,,~,S,,!",,!!,~,!:!,!,,~,!,~,!:!,!,!,~,~"""""""""""""""""""""""""""""""""" $100 Actual share price vs. sum-of-the-parts valuation
33
80
60
40
20 r o 01/02/95 01/02/96 01/01/97 01/01/98
Business Line Pre-Tax Core Earnings Contribution
50%
40
30
20
10
o (10)
(20)
(30)
(40)
(50)
Guaranty
Portfolio
01/02/95 01/02/96
1995 1 996 1997
36%
64
37%
63
01/01/97
37%
63
01/01/98
:~{ l~
01/02/99 01/02/00 01/01/01
Implied Portfolio PI 2006E EPS
Value Current Price """""""""$'5'9':'66""""'" Value of Guaranty Implied Portfolio Value
01/01/02 01/02/03
27.71 31.35
01/02/04
.................... Phineas Actual Share Price ~~ Sum-of-the-Parts Value
1998 1999 2000 2001 2002 2003
43% 38% 37% 30% 31% 38%
57 62 63 70 69 62
Discount or Premium Valuation
01/02/99 01/02/00 01/01/01 01/01/02 01/02/03 01/02/04
$7i.>33
-:::::::;'$:;~:{::,-:}::;:
"","p'("?qg~,§",(~,L,,, 8.3
2004
43%
57
9.1 7.7x
07/11/05
2005E
43%
57
07/11/05
Source: Powerdata, SNL Datasource, IBES estimates, Bloomberg and company filings. Market data as of 07/11/2005. Note: Business line earnings provided by management. Historical sum-of-the-parts valuation performed by calculating Phineas' quarterly earnings for the past 10 years, applying the respective business line contribution to ~
determine income from guaranty and portfolio businesses and applying the historical price to forward multiple of respective peers to determine the value of each part. Cit I g rou p J (a) Based on 2006Q1 annualized earnings estimate. I I
>-c:In (3 0
§"~ o 0.(1) (1)
o.-:::l ~ 0-. .: ~ ........... en >-c:I .: ..... ~ 0 :::l"C ............ ....... ..... o ~ g:~ .: IJ:j ~ .: :;0 i!J . .: :::l ...... (1) (1) en en en
"TI
§ (ii'
~
~ n o a
1:;0 o o o Vl ...... o N 0\
~ ~ o· :::l
II) c.. w
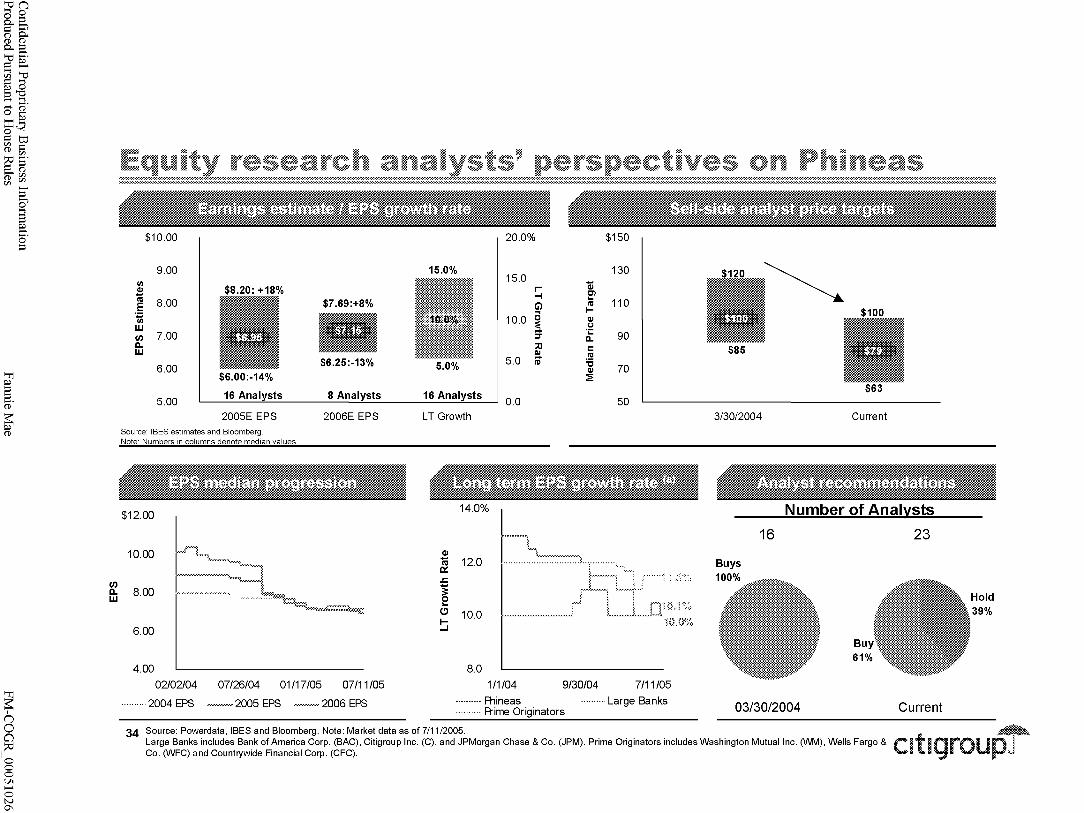
,~,~l~I!,l"",~,!,!!,!,!,~,!!"~"",!!"~,!,!,:l,!!,!:,,,,,~,!,~!,r~,!,!!,~,!,!,!,!!"",~,~"""~,~I~"!,!,!""""""""""",,,,,,:
$10.00
9.00 C/l CIl $8.20: +18% 'lii
• $7.69:+8% E 8.00
~ • W 7.00 II)
c.. w
$6.25:-13% 6.00
$6.00:-14%
5.00 16 Analysts 8 Analysts
2005E EPS 2006E EPS Source: IBES estimates and Bloomberg. Note: Numbers in columns denote median values.
$12.00
10.00
8.00
6.00
4.00
02/02/04 07/26/04 01/17/05 07/11/05
. 2004 EPS ~~ 2005 EPS·········· 2006 EPS
15.0%
• 5.0%
16 Analysts
LT Growth
CIl
~ ..c:
~ (!)
I--l
14.0%
12.0
10.0
8.0
20.0% $150
130 15.0
Ql r -I Cl ... G') ra 110 ... I-
10.0 ~ CIl C.J
:T .;: 90 c..
:;0 c: III ra
5.0 it 'S CIl 70 2:
I 0.0 50
......... \
'-, ... 3. • •.
~j~'01% 1\U.l%
111/04 9/30104 7/11/05
~~ Phineas·········· Large Banks . A-ime Originators
$85
3/30/2004 Current
Number of Analvsts
16 23
Bu
03/30/2004 Current
Hold 39%
34 Source: Powerdata, IBES and Bloomberg. Note: Market data as of 7/1112005. Large Banks includes Bank of America Corp. (BAC), Citigroup Inc. (C), and JPMorgan Chase & Co. (JPM). Prime Originators includes Washington Mutual Inc. (WM), Wells Fargo & Co. (WFC) and Countrywide Financial Corp. (CFC).
~
cltlgroUpJ

>-c:In (3 0
§"~ o 0.(1) (1)
o.-:::l ~ 0-. .: ~ ........... en >-c:I .: ..... ~ 0 :::l"C ............ ....... ..... o ~ g:~ .: IJ:j ~ .: :;0 i!J . .: :::l ...... (1) (1) en en en
"TI
§ (ii'
~
~ n o a
1:;0 o o o Vl ...... o N -.l
~ ~ o· :::l
,~,!,!!,~,,!!!,,~,~,!,!,,!,!,,~,,!!,,"'~,!,,"~,~,,!,,!!,!!,!,~"""~,~,~""!,!!I!!,!!,!,!,~,!!"""!!!,~"!,!"!J~I!,!"""""""""""",,,,,,,, ,. While growth expectations and returns are important drivers of valuation multiples,
the cost of capital is also critical
~/
PIE
~
Note: g: Growth rate
Franchise PIE Market Expectations about Future Growth
_I -\
and Profitability
Base PIE
x x
--+ +
(7.5~i:;
7.7% - (7.5%)
Current NTM P/E=
8.1x
(0.5)
x
33.4%-7.7% = 10.1
(33.4%) * (7.7%)
+
13.1 7.7%
35 CaE: Cost of equity ROE: Return on equity
~
cltlgroUpJ

>-c:In (3 0
§"~ o 0.(1) (1)
o.-:::l ~ 0-. .: ~ ........... en >-c:I .: ..... ~ 0 :::l"C ............ ....... ..... o ~ g:~ .: IJ:j ~ .: :;0 i!J . .: :::l ...... (1) (1) en en en
"TI
§ (ii'
~
~ n o a
1:;0 o o o Vl ...... o N 00
~ ~ o· :::l
PIE franchise factor model: Phineas vs Peers
10x
-2
-4
36 -6
3x
~llllt~~~: ~~~~~~ -3
JPM
~ Franchise PIE :::: Franchise Factor .:.' Growth Factor
J ::::::0 ::;:;:
C USB VVFC
~oJ AG BAC
Jilt :~:~:. 1 10
:~:~:. I IIIII Ox
VVB MTG GM VVM RCN
I I -2x -2x
PMI CFC
I '::::1
. 1"0" 'OJ
I I I I I I I I I I I
I I 011 0 I I I
-4x I i I r5X I
FRE lAl....!t!e~:J
4%
2% J::
~ 0% 0.7% 0.1%
e (!) -2% E Q) -4% >-OJ
-6% " 0 ..J
" -8% .!!!
~ -10%
-12%
-14% C USB AIG WFC BAC WB GOW MTG WM
r--~
I I .::: Implied EPS I I
Growth Rate I I I I I I
I 1(12.5%)
CFC FRE RON IPhineasjl PMI
~~~ ~
cltlgroUpJ

>-c:In (3 0
§"~ o 0.(1) (1)
o.-:::l ~ 0-. .: ~ ........... en >-c:I .: ..... ~ 0 :::l"C ............ ....... ..... o ~ g:~ .: IJ:j ~ .: :;0 i!J . .: :::l ...... (1) (1) en en en
"TI
§ (ii'
~
"TI ~ I n 0 a
1:;0 0 0 0 Vl ...... 0 N '-0
~ ~ o· :::l
,!"!!,.!!,!,!,~,~""~,~,!!,,!,!,~,!,~,~,!,!,~,!!,,!,,,,!,,,,~,I:!,!,,!!,!,~,!!,!,,''''''''''''''''''''''''''''''''''''''''''''''''''''''''''''''''''''''''''''''''''''"""""""""""""""""""""",,: .. /i\.. "I am interested in the GSEs: adjustable-rate product will become less popular relative to fixed
rate product as the yield curve flattens."
V "Phineas' financials are too opaque and complicated to understand." "My time is better spent analyzing alternatives in the financial stock sector." Hedging activities at Phineas are indecipherable.
V "How do I derive a true operating result for Phineas?" "I am concerned about sequentialquarter volatility in reported results."
V The US has enjoyed a terrific appreciation in home ownership and home values. "We are in the 11th inning." "The market is increasingly speculative and I don't want to be exposed."
V New mortgage product creation and usage is elevating credit risk in the system, with uncertain consequences for Phineas and investors.
V "I prefer to own the originators such as Wells Fargo and Countrywide." "I prefer to own the mortgage insurers--they have excess capital that can be returned to shareholders, and inexpensive valuations."
V "Am I still exposed to legislative risk?" "I have no insight into the legislative process and potential outcomes."
37 ~
cltlgroUpJ

>-c:In (3 0
§"~ o 0.(1) (1)
o.-:::l ~ 0-. .: ~ ........... en >-c:I .: ..... ~ 0 :::l"C ............ ....... ..... o ~ g:~ .: IJ:j ~ .: :;0 i!J . .: :::l ...... (1) (1) en en en
"TI
§ (ii'
~
~ n o a
1:;0 o o o Vl ...... o w o
~ ~ o· :::l
Pricel EPS is most prevalent valuation metric -:-:-:-:-:-:-:-:-:-:-:-:-:-:-:-:-:-:-:-:-:-:-:-:-:-:-:-:-:-:-:-:-:-:-:-:-:-:-:-:-:-:-:-:-:-:-:-:-:-:-:-:-:-:-:-:-:-:-:-:-:-:-:-:-:-:-:-:-:-:-:-:-:-:-:-:-:-:-:-:-:-:-:-:-:-:-:-:-:-:-:-:-:-:-:-:-:-:-:-:-:-:-:-:-:-:-:-:-:-:-:-:-:-:-:-:-:-:-:-:-:-:-:-:-:-:-:-:-:-:-:-:-:-:-:-:-:-:-:-:-:-:-:-:-:-:-:-:-:-:-:-:-:-:-:-:-:-:-:-:-:-:-:-:-:-:-:-:-:-:-:-:-:-:-:-:-:-:-:-:-:-:-:-:-:-:-:-:-:-:-:-:-:-:-:-:-:-:-:-:-:-:-:-:-:-:-:-:-:-:-:-:-:-:-:-:-:-:-:-:-:-:-:-:-:-:-:-:-:-:-:-:-:-:-:-:-:-:-:-:-:-:-:-:-:-:-:-:-:-:-:-:-:-:-:-:-:-:-:-:-:-:-:-:-:-:-:-:-:-:-:-:-:-:-:-:-:-:-:-:-:-:-:-:-:-:-:-:-:-:-:-:-:-:-:-:-:-:-:-:-:-:-:-:-:-:-:-:-:-:-:-:-:-:-:-:-:-:-:-:-:-:-:-:-:-:-:-:-:-:-:-:-:-:-:-:-:-:-:-:-:-:-:. ........................................................................................................................................................................................................................................................................................................................................................
Lehman Brothers/ Bruce Harting (b)
Bear Stearns & Co.! David Hochstim
UBS/ Eric Wasserstrom
A.G. Edwards & Son/ Matthew Park
JP Morgan/ George Sacco
Piper Jaffray & Co.! Robert Napoli
Merrill Lynch/ Kenneth Bruce
Sanford Bernstein & Co.! Jonathan Gray(b)
Morgan Stanley/ Kenneth Posner(b)
Friedman, Billings, Ramsey/ Paul Miller
Prudential Equity Group/ Bradley Ball
Wachovia/ Jim Shanahan
Source: Wall Street Research.
Specialty/ Mortgage Finance
Mortgage Finance
Mortgage Finance
Thrifts & Mortgage Finance
Mortgage Finance
Mortgage Finance
Consumer Finance / Credit Cards
Mortgage Finance
Mortgage Finance
Mortgage Finance
Mortgage Finance
Mortgage Finance
38 (a) Institutional Investor category for ranked analyst. (b) Institutional Investor ranked analyst.
@
@
@
@
@
@
@
(c) Wachovia provided a range of $59-$65 which is not included in IBES estimates
@
@
@
@
@
®
®
@
@
@
DCF based on liquidation
Residual income valuation
DCF based on liquidation
Multi-factor economic capital model
Projections of core capital level
Blended portfolio metric
Overweight/ Neutral
Outperform
Buy
Buy
Overweight
Outperform
Buy
Outperform
Equal Weight/ Attractive
Market Perform
Neutral Weight
$100.00 13.0%
89.00 10.0
88.00 12.0
82.00 5.0
80.00
79.00
76.50
74.00
67.00
65.00 8.7
63.00 15.0
__ (c) 8.0
~
cltlgroUpJ

>-c:In (3 0
§"~ o 0.(1) (1)
o.-:::l ~ 0-. .: ~ ........... en >-c:I .: ..... ~ 0 :::l"C ............ ....... ..... o ~ g:~ .: IJ:j ~ .: :;0 i!J . .: :::l ...... (1) (1) en en en
"TI
§ (ii'
~
~ n o a
1:;0 o o o Vl ...... o w ......
~ ~ o· :::l
Reconciling management estimates to median public EPS estimates
-:-:-:-:-:-:-:-:-:-:-:-:-:-:-:-:-:-:-:-:-:-:-:-:-:-:-:-:-:-:-:-:-:-:-:-:-:-:-:-:-:-:-:-:-:-:-:-:-:-:-:-:-:-:-:-:-:-:-:-:-:-:-:-:-:-:-:-:-:-:-:-:-:-:-:-:-:-:-:-:-:-:-:-:-:-:-:-:-:-:-:-:-:-:-:-:-:-:-:-:-:-:-:-:-:-:-:-:-:-:-:-:-:-:-:-:-:-:-:-:-:-:-:-:-:-:-:-:-:-:-:-:-:-:-:-:-:-:-:-:-:-:-:-:-:-:-:-:-:-:-:-:-:-:-:-:-:-:-:-:-:-:-:-:-:-:-:-:-:-:-:-:-:-:-:-:-:-:-:-:-:-:-:-:-:-:-:-:-:-:-:-:-:-:-:-:-:-:-:-:-:-:-:-:-:-:-:-:-:-:-:-:-:-:-:-:-:-:-:-:-:-:-:-:-:-:-:-:-:-:-:-:-:-:-:-:-:-:-:-:-:-:-:-:-:-:-:-:-:-:-:-:-:-:-:-:-:-:-:-:-:-:-:-:-:-:-:-:-:-:-:-:-:-:-:-:-:-:-:-:-:-:-:-:-:-:-:-:-:-:-:-:-:-:-:-:-:-:-:-:-:-:-:-:-:-:-:-:-:-:-:-:-:-:-:-:-:-:-:-:-:-:-:-:-:-:-:-:-:-:-:-:-:-:-:-:-:-:-:-:-:-:-:. ........................................................................................................................................................................................................................................................................................................................................................
($ in millions except per share figures)
Earnings Contribution
Per Share Basis
Range of IBES Estimates (a)
Median IBES Estimates (a) Management Projected EPS (b)
Shortfall
2006E
$6.25 - $7.69
$7.15 7.10
$0.05
Shortfall - Total $47
Single Family Multi Family Portfolio
Total Projected Core Earnings
(a) As of 07/11/2005.
Total % of Total
$2,934 277
3,663
$6,874
43% 4
53
100%
(b) Aggregate of individual business line projections, per management estimates. Assumes 967.9mm shares outstanding.
39 ~
cltlgroUpJ

Confidential Proprietary Business Information Produced Pursuant to House Rules
c
Fannie Mae FM-COGR 00051032

>-c:In (3 0
§"~ o 0.(1) (1)
o.-:::l ~ 0-. .: ~ ........... en >-c:I .: ..... ~ 0 :::l"C ............ ....... ..... o ~ g:~ .: IJ:j ~ .: :;0 i!J . .: :::l ...... (1) (1) en en en
"TI
§ (ii'
~
~ n o a
1:;0 o o o Vl ...... o w w
~ ~ o· :::l
,~,!,!"!,S"~,~,!!,I:!,~,!"",~"I!,I:!,~,~,!!,~,~"",~,~,,,,.!!!,!,!!,!,!,,!,~,!!,,'"''''''''''''''''''''''''''''''''''''''''''''''''''''''''''''''''''''''''''''''''''""""""""""""""""""""""""" Comparable Company Analysis
ROACE versus Price-toBook Regression
5 urn-of -the-Parts
Discounted Cash Flow
40
'-"-"-"-"-"-"-"-"-"-"-"-"-"-"-"-"-"-"-"-"-"-"-"-"-"-"-"-"-"-"-"-"-"-"-"-"-"-"-"-"-"-"-"-"-"-"-"-"-"-"-"-"-"-"-"-"-"-"-"-"-"-"-"-"-"-"-"-"-"-"-"-"-"-"-"-"-"-"-"-".
":~:" Price to 2006 Earnings
:=::: Return on Equity
:=::: Price to Book
"":. DCF
"":. ROE - PIS Regression
":~::' Cost of equity: 7 .7%
":~::' Terminal value earnings multiple for whole company, single family and multi-family
"":. Terminal value book multiple for portfolio
• Selected categories of comparable companies (Countrywide, mortgage insurers, thrifts, FRE)
• Sased on ISES EPS estimates for Phineas as a whole, based on management core earnings estimates for business line valuations
• Regression of ROE and PIS of a peer group to derive an implied PIS multiple
• Implied PIS multiple to be applied to Phineas common equity
• Value Single- and Multi-Family and Portfolio businesses individually on the basis of DCF resulting in an overall value for Phineas
.. Sased on management projections of required capital and core earnings
.. ROE - PIS regressions for multiple peer groups imply a profitability adjusted PIS multiple for each business line
• DCF for the whole company based on I/S/E/S EPS estimates and capital requirements derived from the business line assumptions
.. DCF for the business lines based on management projections of core earnings projections and capital requirements
.. Cost of equity based on a CAPM approach with a 5% EMRP and a 5-year weekly adjusted beta of 0.68
~
cltlgroUpJ

>-c:In (3 0
§"~ o 0.(1) (1)
o.-:::l ~ 0-. .: ~ ........... en >-c:I .: ..... ~ 0 :::l"C ............ ....... ..... o ~ g:~ .: IJ:j ~ .: :;0 i!J . .: :::l ...... (1) (1) en en en
"TI
§ (ii'
~
"TI ~ I n 0 a
1:;0 0 0 0 Vl ...... 0 w +-
~ ~ o· :::l
Status quo versus private company DCF valuation
!,!,!,!:!"!!!"I!,~,!"~"!!,!"""""""""""""""""""""""""""""",,,,,,"""""""""""""""""""""""""""""""""""""""""""""""""""""""""""""""""""""""""""""""""""""""""""""""""",,, Tax-Rate
:::::::::::::::::::::::::::::::::::::::::::::::::::::::::::::::::::::::::::::::::::::::
* 27% effective tax rate
*" 58.5 basis points required capital (assumes 30% surcharge to continue)
~ Single family book of business grows at a constant rate of 3.1 % from 2007 (46.1 % of mortgage debt outstanding growth)
*" Net income reduced by mission costs (incorporated in management projections)
*" Beta of 0.68 (cost of equity 7.7%)
* Terminal value: 9.0x PIE multiple
*" Portfolio growth based on management assumptions (0% growth through 2009)
~ 2.67% required capital
* Funding costs reflect management estimates on April 27
* Beta of 0.68 (cost of equity of 7.7%)
*" Terminal value book multiple of 1.2x
* 31 % effective tax rate
¢ 66.4 basis points required capital (median of three financial guarantors)
¢ Single family book of business shrinks by 15% per annum beginning in 2006. Single family book of business reduced to $1.2 trillion by 2009
-% Net income increased by 5% to adjust for "mission costs"
-% Single-family beta of 1.07 (median of peer group)
~ Multi-family beta of 0.89 (median of peer group)
-% Terminal value: 9.0x PIE multiple
¢ Portfolio in run-off; balance is reduced to $228 billion by 2009
-% Assumed to be no "mission costs" associated with the Portfolio business
Valuation as Bank
* 5.0% required capital (leverage ratio for "well-capitalized" banks)
* Funding reflects banks' cost of raising senior unsecured debt (median of comparables)
¢ Beta of 0.82 (median of peers cost of equity of 8.4%)
¢ Terminal value book multiple of 1.2x
Valuation as REIT
-%
-%
* *
Funding reflects REIT's average cost of funding (median of comparables)
10.0% required capital
Beta of 0.62 (median of peers cost of equity of 7.4%)
Terminal value book multiple of 1.2x
41 ~
cltlgroUpJ

>-c:In (3 0
§"~ o 0.(1) (1)
o.-:::l ~ 0-. .: ~ ........... en >-c:I .: ..... ~ 0 :::l"C ............ ....... ..... o ~ g:~ .: IJ:j ~ .: :;0 i!J . .: :::l ...... (1) (1) en en en
"TI ~ :::l :::l (ii'
~ ~ (1)
~ n o a
1:;0 o o o Vl ...... o w Vl
~ ~ o· :::l
,~,~"!,!,!,!,!,!"",~~,!,!"",~!",,!g,!:!,,!,!l,,,,~,!,!,,!:!,~,!!,!""'~,~,!,~,~,!,~""""""""""""""""""""""""""""""""""""""""""""""""""""
RWT NLY ANH LUM MFA
NCT AHR CT
GOW WM
WFC BAC NCC NFB
Residential MBS REITs Redwood Trust Inc. Annaly Mortage Mgmt Inc. Anworth Mtg Asset Corp. Luminent Mortgage Capital MFA Mortgage Investments Inc.
Commercial MBS REITs Newcastle Investment Corp. Anthracite Capital Inc. Capital Trust Inc.
Median Portfolio - REIT
Thrifts Golden West Financial Corp. Washington Mutual Inc.
Banks with Mortgage Platforms Wells Fargo & Co. Bank Of America Corp. National City Corp. North Fork Bancorporation
Median Portfolio - Bank
Median Portfolio
0.62 7.4% 0.55 7.1 0.68 7.7 1.00 9.3 0.59 7.3
0.57 7.2% 0.60 7.3 0.66 7.6
0.62 7.4%
0.63 7.4% 0.75 8.1
0.77 8.2% 0.94 9.0 0.86 8.6 0.88 8.7
0.82 8.4%
0.68 7.7%
Financial Guarantors MBI MBIA Inc. 1.08 9.7% ABK Ambac Financial Group 0.96 9.1 AGO Assured Guaranty Ltd. 1.08 9.7
Mortgage Insurers MTG MGIC Investment Corp. 1.06 9.7% PMI PMI Group Inc. 0.95 9.1 RON Radian Group Inc. 1.09 9.7
Median Single Family 1.07 9.7%
Financial Guarantors MBI MBIA Inc. 1.08 9.7% ABK Ambac Financial Group 0.96 9.1 AGO Assured Guaranty Ltd. 1.08 9.7
Multi-Family Banks NYB New York Community Bancorp Inc. 0.81 8.4% ICBC Independence Community Bank Corp. 0.76 8.1
Thrifts WM Washington Mutual Inc. 0.75 8.1
Median Multi Family 0.89 8.8%
Without the charter, we have assumed that Phineas' business will consist of 38% portfolio, 54% single-family business and 8% multi-family business and the company's blended cost of equity would be: 38% x 8.4% + 54% x 9.7% + 8% x 8.8% = 9.1 %
42 (1) 5 year weekly adjusted Beta. (2) We assumed a risk free rate of 4.34% and an equity market risk premium of 5%.
~
cltlgroUpJ

>-c:In (3 0
§"~ o 0.(1) (1)
o.-:::l ~ 0-. .: ~ ........... en >-c:I .: ..... ~ 0 :::l"C ............ ....... ..... o ~ g:~ .: IJ:j ~ .: :;0 i!J . .: :::l ...... (1) (1) en en en
"TI
§ (ii'
~
~ n o a
1:;0 o o o Vl ...... o w 0\
~ ~ o· :::l
,~,~"!,!'!,!,!,!"",!,'!!,~,!""!,!!,!,!,l",!,!"!"""""""""",,,,,,"""""""""""""""""""""""""""""""""""""""""""""""""""""""""""""""""""""""""""""""""""""" 1> Low cost of funds relative to market: perceived enhanced
GSE-based credit compared to traditional AAA rating
1> Unlimited access to credit markets
4- Lower capital requirements (both regulatory and risk-based)
% High liquidity of securities
1> Leading risk management expertise and infrastructure
4- Strong relationships with originators and mortgage investors
% Expand guaranty business into Alt-A and Sub-prime
1> Take advantage of new business opportunities such as
mortgage insurance and risk analytics
1> Develop direct relationships with mortgage brokers
4- Manage first loss position
% Increase duration risk opportunistically
1> Manage non-mortgage securities through expertise in
managing interest rate risk
43
1> Volatile GAAP accounting for portfolio -7 Investors will
continue to ascribe low valuation to a volatile business
4- Implicit mandate to be in all markets at all times
4- Costs associated with meeting mission goals
% Limitations on products that can be wrapped in the guaranty
business
% Constrained business opportunities and restrained risk
profile
% Investors may continue to focus on accounting returns
rather than total economic returns
% Tight MBS OAS diminishes Phineas' funding margin; and
even tighter OAS is a threat
% Basel II may increase financial institutions demand for
mortgage assets
% Significant demand from U.S. depositories, REITs, hedge
funds, etc. for mortgage assets
1> Mission costs continue to escalate
~
cltlgroUpJ

>-c:In (3 0
§"~ o 0.(1) (1)
o.-:::l ~ 0-. .: ~ ........... en >-c:I .: ..... ~ 0 :::l"C ............ ....... ..... o ~ g:~ .: IJ:j ~ .: :;0 i!J . .: :::l ...... (1) (1) en en en
"TI
§ (ii'
~
~ n o a
1:;0 o o o Vl ...... o w -.l
~ ~ o· :::l
""""""!!,~,!,!""~,~,!!:!,J:.!,!"!:!,l!",,,~,~,!!:!,,I!,!!,!,!,~,,~,,,,~,~,,!!:!,~,!,!!,!,~,!!,,"""""""""""""""""""""""""""""""""""""""""""""",,, ($ in millions)
Price 12006E
L T EPS Growth
On-Balance Sheet Assets
Off-Balance Sheet Assets (a)
Total Common Equity (b)
Net Income
ROAA (c)
ROACE
Capital Measures
Tangible Common Ratio
Equity I Assets
Equity I Risk in
Force Assets
8.3x
10.0%
$1,004,000
$1,311,668
$26,392
$7,804
0.8% /0.3%
35.0%
2.6%
3.5%
1.6%
-.~:~:~:~:~:~:~:~:~:~:~:~:~:~:~:~:~:~:~:~:~:~:~:~:~:~:~:~:~:~:~:~:~:~:~:~:~:~:~:~:~:
9.4x
9.5%
$795,284
852,270
$26,807
$2,937
0.4% /0.2%
10.1%
3.3%
3.9%
1.8%
Source: Company financials, IDO and Powerdata. Market data as of July 11,2005.
8.7x
12.0%
$128,496
NM
$10,310
$2,198
1.9%
23.9%
8.0%
8.0%
NM
As of December 31,2004. Phineas data based on management estimates. Data for peer groups represent medians for each respective peer group.
Thrifts
8.6x 10.1x 11.3x
12.0% 13.0% 11.3%
$6,381 $18,585 $207,403
$30,601 $757,037 NM
$3,689 $5,024 $14,250
$519 $725 $2,079
8.1% / 1.4% 3.9% / 0.1% 1.1%
13.9% 12.7% 15.7%
NM NM 5.9%
NM NM 6.9%
12.1% 0.7% NM
44 ~:~~:~eG~~~~~t~e~~~~~e~~~~~~~ri~:~~~~a!~\~~~~~T~~~~ ~~~~:lgl~!~~=-: ~~~~~I~~~!~~~~~~~~~ 7~6Vv\~TG), Radian Group Inc. (RON) and PMI Group Inc. (PMI); Financial Guarantors include MBIA Inc. (MBI), Ambac Financial Group Inc. (ABK) and ~
(a)Off-Balance Assets: For Phineas and FRE measured as total book of business held by 3rd party investors; for mortgage insurers and financial guarantors measured as total risk-in-force assets. Cit I g ro u p J (b)Equity for Phineas as of 12131/04 provided by management less preferred equity of $9.1 billion. I I (c)Returns measured against on-balance sheet assets (1)1 number) and total managed assets for Phineas, Freddie Mac, mortgage insurers and financial guarantors (2nd number).

>-c:In (3 0
§"~ o 0.(1) (1)
o.-:::l ~ 0-. .: ~ ........... en >-c:I .: ..... ~ 0 :::l"C ............ ....... ..... o ~ g:~ .: IJ:j ~ .: :;0 i!J . .: :::l ...... (1) (1) en en en
"TI
§ (ii'
~
~ n o a
1:;0 o o o Vl ...... o w 00
~ ~ o· :::l
""""""!!,~,!,!""~,~,!,!:!,J:.!,!"!:!,l!,,,,!,!,!,!:!,!!,!,~,!.!,,,,,,!,!!,!'!:!"!'!:!,!,!:l!""""""""""""""""""""""""""""""""""""""""""""""",,"""""""""""",,, 1:~i!ifiii~f@J$.~~f~@~:iM: (((J
Comparable Public CO.'s: Countrywide - Pricel 2006E
Comparable Public CO.'s: Mortgage Insurers - Pricel 2006E (c)
Comparable Public CO.'s: Thrifts - Pricel 2006E (d)
Comparable Public CO.'s: FRE - Pricel 2006E
Whole Company Discounted Cash Flow (I)
1:~@;W~M~~~i~®.i~@t~;~i~~~ ::////1 Price-to-Bookversus ROE (e)
Sum-of-the-Parts - DCF (g)
$30.00 $45.00 $60.00
$62.21
$55.25
$,,:;%
c:.vrre;:t M8rKet R':,:e
SE"19.06
$42.51 III ~~~~~~~~~~~~~~~~~~~~~~~~~~~ $50.10
$32.06 • $35.43
$30.00 $45.00
.~~~~~~~~~~~~~~~~~~~~~~~~~~~~~~~~~~~~ $66.90
~ $70.86
$59.50 I.~~~~~~~~~~~~~~~~~~~~~~~~~~~~~~~~~~~ $65.76
$60.00
$75.00
Cis(';ounted
...--- Current Price
T3 i get
'373.35 (flJ
$75.00
$90.00
$88.55
$90.00 ($ @".2:JJJiM,tM f)JJ"!';'WNm®.r%JljflEKi:':'·.~· @~@@@~@@@~@@@~@@@~@
EquityValuation Multiples 2005 Net Income 1'1
2006 Net Income 1'1
Current Capital Ibl
$6,727
6,921
26,392
4.3x
4.2
1.1
6.5x
6.3
1.7
8.6x
84
2.2
10.8x
10.5
2.8
12.9x
12.6
3.3
N.B. Ranges for comparable public company valuations based on 5% variance from valuation using median P/2006E multiple. Segment valuation without charter based on Citigroup discounted cash flow projections for segment.
(a) Based on IBES estirrates as of July 11, 2005. (b) EqU[y as of 12/31/04 provided by management, adjusted for preferred equity. (c) Companies include MGIC Investment Corp. (MTG), Radian Group Inc. (RDN), and FMI Group Inc. (FMI). (d) Companies include Golden West Financial Corp. (GD\N) and Washington Mutual Inc. (WM). (e) Based on regression analysis of price-to-bookversus ROEfor peer group.
(f) CCF based on 7.7% cost of equity and IBES median net income. Income grow sat 5.0% in 2007-2009.
(g) Based on management projections for Single- and Multifamily businesses. Citigroup projections model driven by management assumptions for the Portfolio business.
(h) Discounted current IBES median price target of $79.00 r:er share over one year at Phineas' cost of equity.
(I) Fair value of existing book of business is approximately $32 billion.
45
Median
$59.25
$58.16
$76.76
$63.71
$79.70
$44.75/$47.72
$33.74/$62.63
~
cltlgroUpJ

>-c:In (3 0
§"~ o 0.(1) (1)
o.-:::l ~ 0-. .: ~ ........... en >-c:I .: ..... ~ 0 :::l"C ............ ....... ..... o ~ g:~ .: IJ:j ~ .: :;0 i!J . .: :::l ...... (1) (1) en en en
"TI ~ :::l :::l (ii'
~ ~ (1)
~ n o a
1:;0 o o o Vl ...... o w '-0
~ ~ o· :::l
~,!:!,!!!,~,!,,"'~,~,,!,!!,!,!,!,,",!,!:!,,!!!,:,~,!:!,~,!,:,~,!,!!,!"",~,~,~"",!!I!:!,!,~,!"~"~"""""""""""""""""""""",,,, $80
70
60
50
40
30
20
10
o
46
Single Family
Valuation
Multi Family
Valuation
Portfolio
Valuation
$33.74
Sum-of-the-Parts
Without Charter
~ ............. I
$28.89
I -
Implied Value of
Charter
$62.63
Sum-of -the- Parts
With Charter
6% premium to the market price
Current Market Price
(7/11/2005)
~
cltlgroUpJ

Confidential Proprietary Business Information Produced Pursuant to House Rules Fannie Mae FM-COGR 00051040

>-c:In (3 0
§"~ o 0.(1) (1)
o.-:::l ~ 0-. .: ~ ........... en >-c:I .: ..... ~ 0 :::l"C ............ ....... ..... o ~ g:~ .: IJ:j ~ .: :;0 i!J . .: :::l ...... (1) (1) en en en
"TI
§ (ii'
~
~ n o a
1:;0 o o o Vl ...... o +......
~ ~ o· :::l
,~,!"!!,S"!"!"",!!,!!:!"!"!,l",,~,~,~,!,,,,!,!.!,,!,,!,l!,,!,!,,,,,,,,"""""""""""""""""""""""""""""""""""""""""""""""""""""""""""""""""""""""""""""",,, -¢ Liquidity of TBA securities
*" Exceptional size and scale
* Relationships with originators
-¢ Capital advantages
-¢ Best execution for 15/30 year fixed rate mortgages
-¢ Process exemptions (ie. SEC and rating agency fees)
* Depth of database covering mortgage loans
* Expand into Alt-A and Sub-prime sectors
* Manage first loss position; establish mortgage insurance division
-¢ Utilize alternative transaction structures (i.e. synthetic transactions)
-¢ Develop direct relationships with mortgage brokers
*" Create JV with mortgage originator to gain more control of
origination process
-¢ Set up a conduit; purchase loans directly and issue proprietary
MBS
47
-¢ Costs associated with meeting mission goals
-¢ Constrained business opportunities
* Implicit restraint on risk profile
4> Limitations on products that can be wrapped
* Consolidation of top originators
4> Inaccurate perception of credit risk
4> Growth of private label market
-¢ Increased volume of ARM originations
-¢ Increased volume of Alt-A and sub-prime originations
* Increased volume of affordability products
4> New legislation may make meeting housing goals tougher and
reduce capital advantage
~
cltlgroUpJ
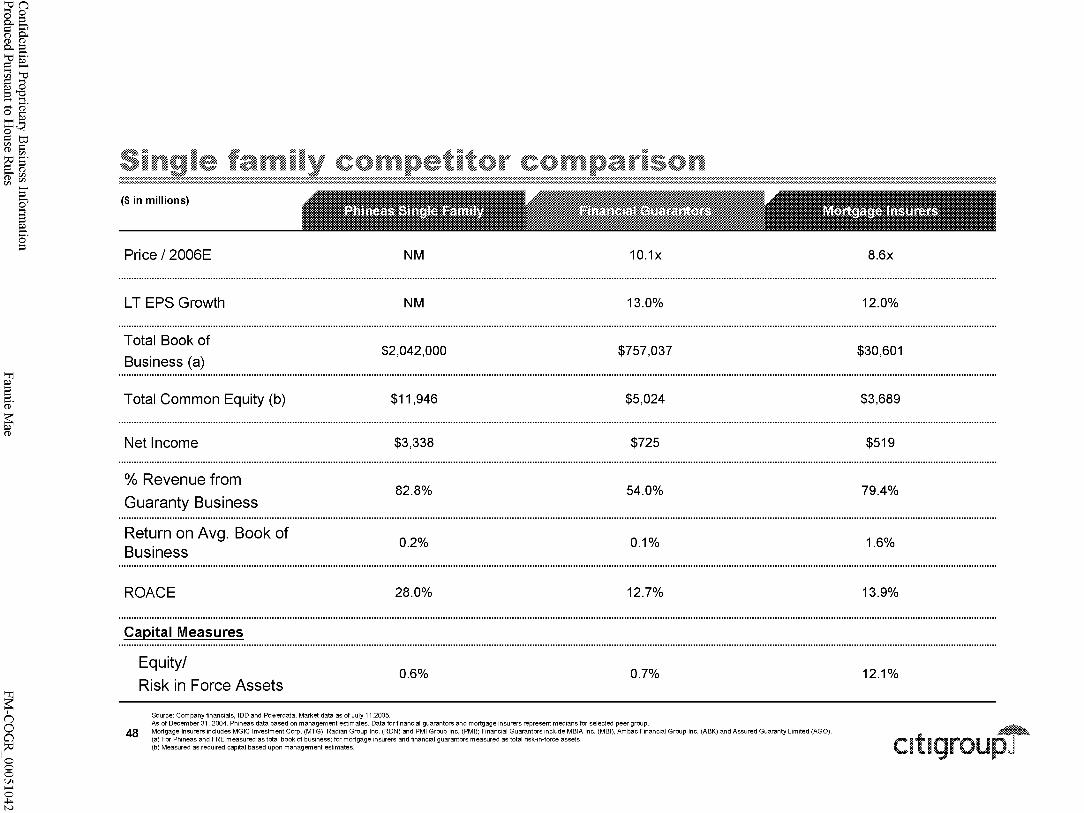
>-c:In (3 0
§"~ o 0.(1) (1)
o.-:::l ~ 0-. .: ~ ........... en >-c:I .: ..... ~ 0 :::l"C ............ ....... ..... o ~ g:~ .: IJ:j ~ .: :;0 i!J . .: :::l ...... (1) (1) en en en
"TI
§ (ii'
~
~ n o a
1:;0 o o o Vl ...... o +N
~ ~ o· :::l
,~,!"!!,S"!"!",,,!!,!!:!,,!,,!,l,,,,~,~,,!.!:!,~,!,!,!,~,~,~,,,,~,~,!.!:!,J:.!,~"~,!,!,~,!!""""""""",,,,,,,,,,,,,,,,,,,,,,,,,,,,,,,,,,,,,,,,,,,,,,,,,,,,,,,,,,,,,,,""""""""""""""""" ($ in millions)
Price / 2006E
L T EPS Growth
Total Book of Business (a)
Total Common Equity (b)
Net Income
% Revenue from
Guaranty Business
Return on Avg. Book of Business
ROACE
Capital Measures
Equity!
Risk in Force Assets
NM
NM
$2,042,000
$11,946
$3,338
82.8%
0.2%
28.0%
0.6%
Source: Company financials, IDO and Powerdata. Market data as of July 11,2005.
10.1x
13.0%
$757,037
$5,024
$725
54.0%
0.1%
12.7%
0.7%
As of December 31, 2004. Phineas data based on management estimates. Data for financial guarantors and mortgage insurers represent medians for selected peer group.
48 Mortgage Insurers includes MGIC Investment Corp. (MTG), Radian Group Inc. (RON) and PMI Group Inc. (PM I); Financial Guarantors include MBIA Inc. (MBI), Ambac Financial Group Inc. (ABK) and Assured Guaranty Limited (AGO). (a) For Phineas and FRE measured as total book of business; for mortgage insurers and financial guarantors measured as total risk-in-force assets. (b) Measured as required capital based upon management estimates.
8.6x
12.0%
$30,601
$3,689
$519
79.4%
1.6%
13.9%
12.1%
~
cltlgroUpJ

>-c:In (3 0
§"~ o 0.(1) (1)
o.-:::l ~ 0-. .: ~ ........... en >-c:I .: ..... ~ 0 :::l"C ............ ....... ..... o ~ g:~ .: IJ:j ~ .: :;0 i!J . .: :::l ...... (1) (1) en en en
"TI
§ (ii'
~
~ n o a
1:;0 o o o Vl ...... o +w
~ ~ o· :::l
,~,!"!!,S"!"!"",!!,!!:!,,!,,!,l,,,,!,!,!,,!!,!,!,!,,~,,!:!,,,,,!,!:!,,!.!:!,!!:!,!,,""""""""""""""""""""""""""""""""""""""""""'"''''''''''''"""""""""""""""""""""""""" $15.00 $20.00 $25.00 $30.00 $35.00
Comparable Public Companies: Financial Guarantors - Price!2006E (a) (b) $28.97 $32.02
Comparable Public Companies: Mortgage Insurers - Price! 2006E (a) (c) $24.65 ::::::::::::::::::::::::::::::::::::::: $27.25
Price-to-Book versus ROE (a) (d) $27.09 :::::::::::::::::::::::::::::::::::::::::: $29.94
Price-to-Book versus ROE - Without Charter (a) (d) $22.36 $24.72
Discounted Cash Flow (e) $16.73 $19.78 $28.61
illiiiiiiiffi Segment Valuation without charter
~~~~~~~~~~~~~~~~m~l~~l~t.~l~m,~~~~~~~~~~~~~~
$15.00 $20.00 $25.00 $30.00 $35.00 ($
Equity Valuation Multiples 2005 Net Income (a)
2006 Net Income (a)
Current Required Capital (a)
2006 Required Capital (a)
MUh~lti:m fuffi:£WJIMUhltllhldiJ1t
$2,806 5.2x 6.9x 8.6x
2,934 4.9 6.6 8.2
11,946 1.2 1.6 2.0
12,285 1.2 1.6 2.0
10.3x 12.1x
9.9 11.5
2.4 2.8
2.4 2.8
N.B. Ranges for comparable public company valuations based on 5% variance from valuation using median P/2006E multiple. Segment valuation without charter based on Citigroup discounted cash flow projections for segment. (a) Based on management projections. (b) Companies include MBIA Inc. (MBI), Ambac Financial Group (ABK) and Assured Guaranty Ltg. (AGO). (c) Companies include MGIC Investment Corp. (MTG), Radian Group Inc. (RDN) and PMI Group Inc. (PM!.) Cd) Based on regression analysis of price-to-oook versus ROEfor peer group. (e) CCF based on company projections. Assumes 7.7% cost of equity, 9.0x terminal multiple in the current configuration.
Median
$30.50
$25.95
$28.51
$23.54
$18.25 $32.23
49 ~
cltlgroUpJ

Confidential Proprietary Business Information Produced Pursuant to House Rules Fannie Mae FM-COGR 00051044

>-c:In (3 0
§"~ o 0.(1) (1)
o.-:::l ~ 0-. .: ~ ........... en >-c:I .: ..... ~ 0 :::l"C ............ ....... ..... o ~ g:~ .: IJ:j ~ .: :;0 i!J . .: :::l ...... (1) (1) en en en
"TI
§ (ii'
~
~ n o a
1:;0 o o o Vl ...... o +Vl
~ ~ o· :::l
""""",!:!,!"!,!"",!!,!.!:!,!"!,I"",~~~,!"",!,!!,!,!,X,!,!,!,,,,""""""""""""""""""""""""""""""""""""""""""""""""""""""""""""""""""""",,,,,,,,,,,,,,,,,,,,,,,,,,,,,,,,, -¢ Contributes substantially more to meeting housing goals than
single family
-¢ Outstanding relationships with DUS lenders
-¢ Market leading position
*" Depth of database covering mortgage loans
* Credit risk management capabilities
* Exceptional size and scale
-¢ Process exemptions (i.e SEC and Rating agency fees)
-¢ Expansion into small balance commercial loans
*" Lead standardization of market / products
* Develop direct relationships with mortgage brokers
* Create JV with mortgage originator to gain more control of
origination process
* Set up a conduit; purchase loans directly and issue proprietary
MBS
-¢ Increase risk taking capacity; new products / programs
*" Manage first loss position
50
-¢ Costs associated with meeting mission goals
-¢ Increasing contribution to housing goals
* Long origination cycle times
4> Implicit restraint on risk profile
-¢ Constrained business opportunities
-¢ Condominium price increases may dissipate if condominiums
purchased are returned to the rental market
4> Multi family delinquencies have been rising while other property
types have either declined or remained stable
* Consolidation of top originators
4> Inaccurate perception of credit risk
4> Growth of CMBS securitization markets
-¢ New legislation may make meeting housing goals tougher and
reduce capital advantage
4> Increased pressure from Freddie Mac
-¢ Growth in conduit market share, tighter pricing
~
cltlgroUpJ

>-c:In (3 0
§"~ o 0.(1) (1)
o.-:::l ~ 0-. .: ~ ........... en >-c:I .: ..... ~ 0 :::l"C ............ ....... ..... o ~ g:~ .: IJ:j ~ .: :;0 i!J . .: :::l ...... (1) (1) en en en
"TI
§ (ii'
~
~ n o a
1:;0 o o o Vl ...... o +-0\
~ ~ o· :::l
""""",!:!,!"!,!"",!!,!.!:!,!"!,I",,~,~,!.!:!,J:.!,!,!,!,!,~,!,,,,~~,!,!:!,,I!,!!,~,!"!,~"!!""""""""""""""""""""""""""""""""""""""",,,,"""""""""""""""""""" ($ in millions)
Price / 2006E
L T EPS Growth
Total Book of Business (a)
Total Common Equity (b)
Net Income
% Revenue from
Guaranty Business
Return on Avg. Book of Business
ROACE
Capital Measures
Equity/
Risk in Force Assets
Tangible Equity/
Tangible Assets
Source: Companyfinancials, IDO and Powerdata. Market data as of July 11,2005.
NM 10.1x
NM 13.0%
$110,023 $757,037
$644 $5,024
$260 $725
95.4% 54.0%
0.3% 0.1%
43.2% 12.7%
0.6% 0.7%
NM NM
As of December 31, 2004. Phineas data for based on management estimates. Data for financial guarantors and mortgage insurers represent medians for selected peer group.
12.0x
10.0%
$20,399
$3,186
$355
NM
NM
12.1%
NM
5.2%
Financial Guarantors include MBIA Inc. (MBI), Ambac Financial Group Inc. (ABK) and Assured Guaranty Limited (AGO); Multi-Family Banks and Thrifts include Washington Mutual Inc. (WM), New York Community Bancorp (NYB) and Independence Community Bank Corp. (leBC). ~
51 (a) For Phineas measured as total book of business; for financial guarantors measured as total risk-in-force assets; for multi-family banks and thrifts measured as total on-balance sheet assets. t--(b) Measured as required capital based upon management estimates. CI I g rou PJ

>-c:In (3 0
§"~ o 0.(1) (1)
o.-:::l ~ 0-. .: ~ ........... en >-c:I .: ..... ~ 0 :::l"C ............ ....... ..... o ~ g:~ .: IJ:j ~ .: :;0 i!J . .: :::l ...... (1) (1) en en en
"TI
§ (ii'
~
~ n o a
1:;0 o o o Vl ...... o +-.l
~ ~ o· :::l
""""",!:!,!"!,!"",!!,!.!:!,!"!,l"".!!,!,!!,,!,!,,!,~,!!,,,,,!,!:!,!.!:!,,!.!:!"!"!:l,:"""""""""""""""""""""""""""""""""""""""""""""""",,,,""""""""""""""""""""""""
Comparable Public CompaniesFinancial Guarantors: Price! 2006E (a) (b)
$0.50
Comparable Public Companies - Thrifts with Significant MF Platform: Price! 2006E (a) (c)
Price-to-Book versus ROE (a) (d)
Price-to-Book versus ROE - Without Charter (a) (d)
Discounted Cash Flow (e)
Private Company Valuation - DCF (f)
$0.50
$1.00 $1.50
$1.19:II::: $1.32 i~;;;;;;;;;;;
$1.10 1$1.21
$2.00 $2.50
$2.73
$2.63
$2.35
1IlliI!!!!llii Segment Valuation without Charter
$1.00 $1.50 $2.00 $2.50
$3.00 $3.50 $4.00
$3.02
$3.21 $3i5
$3.30
$2.97
$3.00 $3.50 $4.00 . ($ In m !IlJOns, exceptpershare data) :m-.:tl::~t.~:_J@ ~~rm~~~*fmrt..~:"WwwWWWWWWWwwwwwwrn
EquityValuation Multiples 2005 Net Income (a)
2006 Net Income (a)
Current Required Capital (a)
2006 Required Capital (a)
$255
277 644
749
1.9x
1.8
0.8 0.6
3.8x
3.5 1.5
1.3
5.7x
5.3 2.3
1.9
7.6x
7.0 3.0
2.6
9.5x
8.8
3.8
3.2
11.4x
10.5
4.5
3.9
13.3x
12.3
5.3 4.5
15.2x
14.0
6.0
5.2
Median
$2.87
$3.38
$1.26
$1.16
$2.97
$2.66
N.B. Ranges for comparable public company valuations based on 5% variance from valuation using median P/2006E multiple. Segment valuation without charter based on Citigroup discounte cash flow projections for segment. (a) Based on management projections. (b) Companies include MBIA Inc. (MBI), Ambac Financial Group (ABK) and Assured Guaranty (AGO). (c) Companies include Washington Mutual Inc. (WM), New York Commun[y Bancorp (NYB), Independence Commun[y Bank Corp. (ICBC), Cd) Based on regression analysis of price-to-book versus ROEfor peer group. (e) CCF based on company projections. (I) OCF based on Citigroup adjusted company projections.
52 ~
cltlgroUpJ

Confidential Proprietary Business Information Produced Pursuant to House Rules
c
Fannie Mae FM-COGR 00051048

>-c:In (3 0
§"~ o 0.(1) (1)
o.-:::l ~ 0-. .: ~ ........... en >-c:I .: ..... ~ 0 :::l"C ............ ....... ..... o ~ g:~ .: IJ:j ~ .: :;0 i!J . .: :::l ...... (1) (1) en en en
"TI
§ (ii'
~
~ n o a
1:;0 o o o Vl ...... o +'-0
~ ~ o· :::l
,~,~"~!~,!"!,~"",!!'!!~,!"",!,!!,!!,!,l,!,!"!""""""""""",,,,,,""""""""""""""""""""""""""""""""""""""""""""""""""""""""""""""""""""""""""""""""""" 1> Lower capital requirements (both regulatory and risk-based)
4- Unlimited access to credit markets
1> Low cost of funds relative to market: perceived enhanced
GSE-based credit compared to traditional AAA rating
% Risk management expertise, experience and infrastructure
4- Phineas' size allows it to benefit from the ability to
opportunistically acquire, and selectively retain assets
4- Phineas assumes duration risk more opportunistically
1> Increased efficiency of derivatives markets means there is
an opportunity for Phineas to optimize their match funding
via enhanced option-based hedges
% Core embedded advantage in managing interest risk allows
Phineas to potentially manage non-mortgage related
portfolios
53
1> GAAP returns are volatile
4- Investors will continue to ascribe lower valuations to volatile
earnings
4- Temptation to be in all markets at all times to facilitate
earnings growth (though this is currently being challenged)
1> Investors may continue to focus on accounting earnings
rather than total economic returns; persistence of GAAP
volatility may erode long-term value
4- Increasing appetite of U.S. depositories (facilitated by Basel
II) and hedge funds for mortgage assets
4- Tight MBS OAS has diminished Phineas' funding margin,
and continued OAS tightening will increase pressure on
returns
~
cltlgroUpJ

>-c:In (3 0
§"~ o 0.(1) (1)
o.-:::l ~ 0-. .: ~ ........... en >-c:I .: ..... ~ 0 :::l"C ............ ....... ..... o ~ g:~ .: IJ:j ~ .: :;0 i!J . .: :::l ...... (1) (1) en en en
"TI
§ (ii'
~
~ n o a
1:;0 o o o Vl ...... o Vl o
~ ~ o· :::l
,~,~"~!~,!"!,~"",~,~,!!!"I!,!!,!,!~,!,,,,~,~,,!!!,,I!,!!,!!,,!,~,!!""""""""""""""""""""""""""""""""""""""""""""""""""""""""""""""""""""""" ($ in millions)
Price / 2006E
L T EPS Growth
Total Assets
Total Common Equity
Net Income
ROAA
ROACE
Capital Measures
Tangible Common Ratio
Equity / Assets
NM 8.3x
NM 5.0%
$904,555 $7,319
$10,453 $637
$3,131 $78
0.3% 1.3%
25.0% 14.7%
NM 14.7%
2.7% 8.3%
Source: Company financials, IDD and Powerdata. Market data as of July 11,2005.
9.9x 11.1x 11.3x
8.0% 9.9% 11.3%
$3,729 $283,564 $207,403
$458 $25,340 $14,250
$43 $4,896 $2,079
2.3% 1.7% 1.1%
11.6% 18.2% 15.7%
24.3% 5.8% 5.9%
16.2% 9.1% 6.8%
As of December 31, 2004. Phineas data on management estimates. Data for Residential RMBS REITs, Commercial CMBS REITs, Banks, Thrifts, and Asset Managers represent medians for selected peer group.
16.9x
11.0%
$636,481 (a)
$585
$156
15.8%
29.4%
NM
NM
REIT: RMBS includes Annaly Mortgage Management (NLY), Redwood Trust Inc. (RWT), MFA Mortgage Investments Inc. (MFA), Anworth Mortgage Asset Corp. (ANH), and Luminent Mortgage Capital Inc. (LUM); REIT: CMBS includes Newcastle Investment Corp. (NCT), Anthracite Capital Inc. (AHR) and Capital Trust Inc. (CT); Banks wi Mortgage Platform include Bank of America Corp. (BAC), Wells Fargo & Co. (WFC), National City Corp. (NCC) and North Fork
54 Bancorp. (NFB); Thrifts include Washington Mutual Inc. (WM) and Golden West Financial (GDW); Fixed Income Asset Managers Include BlackRock Inc. (BLK), Nuveen Investments (JNC) and Federated Investors Inc. (FII). ~
(a) Reflects assets under management (AUM). CIt I g rou p J

>-c:In (3 0
§"~ o 0.(1) (1)
o.-:::l ~ 0-. .: ~ ........... en >-c:I .: ..... ~ 0 :::l"C ............ ....... ..... o ~ g:~ .: IJ:j ~ .: :;0 i!J . .: :::l ...... (1) (1) en en en
"TI
§ (ii'
~
~ n o a
1:;0 o o o Vl ...... o Vl ......
~ ~ o· :::l
,~,~"~!~,!,,!,~,,,,!,!,,!,!:!,,!,!,!,~,!!,,",!,!:!,!!!,,!!!,!,,!:X""""""""""""""""""""""""""""""""""""""""""""""""""""""""""""""""""""""""""""""""""""
$0.00 $10.00 $20.00 $30.00 $40.00 $50.00
RMBS REIT Comparable Companies Price 12006E (c) $30. 01 ~~~~~~~~~~~~~~~~~~~~~~~ $33.17 ~:~:~:~:~:~:~:~:~:~:~:.
CBMS REIT Comparable Companies Price 12006E (c) $35. 70IIIIII:~ $39.45
Bank I Thrift Comparable Companies Price 12006E (c) $40.33 ::IIIIIII $44.58
Price-to-Book versus ROE (a) $19. 60 ~~~~~~~~~~~~~~~ $21.66 :::::::::::::::
Private Company: Bank - Price-to-Book versus ROE (a) $18.13 m $20.04
Private Company: REIT - Price-to-Book versus ROE (a) $13.40 $14.81
RMBS REIT Dividend Yield (b) $43.04 :IIIIIII~:~ $47.57
Discounted Cash Flow (c) $25. 27 ~~~~~~~~~~~~~~~~~~~~~~~~~~~~~~~ $29.60
=:::::::::::::::::::::::::::::=
Private Company Valuation - Bank (d) $11. 92 0$13.75
Private Company Valuation - REIT (d) $10.57 $13.98
!!!!!!H Segment Valuation without Charter: Bank Segment Valuation without Charter: REIT
~~~~~~~~~~~~~m~~~~~,!:f:\q~:~~~~~~~~~~~~~~~~~~~ $10.00 $20.00 $30.00 $40.00 $50.00
($ in millions)
Equity Valuation Multiples 2006 Net Income (c) Current Common Required Capital (c) 2006 Common Required Capital (c)
m;::illlJ::-i. mtti@i?~tmtmiti:
3,663 10,453 15,688
2.6x 0.9 0.6
5.3x 1.9 1.2
7.9x 2.8 1.9
10.6x 3.7 2.5
N.B. Ranges for comparable public company valuations based on 5% variance from valuation using median P/2006E multiple. Segment valuation without charier based on Citigroup discounted cash flaw projections for segment.
(a) Based on Citigroup regression analysis of price-to-book versus ROE for peer group.
(b) Assumes median dividend yield of 11.2% and a range of +/- 5%.
(c) Based on management projections.
(d) Based on management projections assuming portfolio run-off. Private company projections adjusted by Citigroup.
13.2x 4.6 3.1
Median
$31.59
$37.57
$42.45
$20.63
$19.09
$14.11
$45.30
$27.44
$12.83
$12.28
55 ~
cltlgroUpJ

Confidential Proprietary Business Information Produced Pursuant to House Rules Fannie Mae FM-COGR 00051052

>-c:In (3 0
§"~ o 0.(1) (1)
o.-:::l ~ 0-. .: ~ ........... en >-c:I .: ..... ~ 0 :::l"C ............ ....... ..... o ~ g:~ .: IJ:j ~ .: :;0 i!J . .: :::l ...... (1) (1) en en en
"TI ~ :::l :::l (ii'
~ ~ (1)
~ n o a
1:;0 o o o Vl ...... o Vl w
~ ~ o· :::l
verview of the valuation of the charter -:-:-:-:-:-:-:-:-:-:-:-:-:-:-:-:-:-:-:-:-:-:-:-:-:-:-:-:-:-:-:-:-:-:-:-:-:-:-:-:-:-:-:-:-:-:-:-:-:-:-:-:-:-:-:-:-:-:-:-:-:-:-:-:-:-:-:-:-:-:-:-:-:-:-:-:-:-:-:-:-:-:-:-:-:-:-:-:-:-:-:-:-:-:-:-:-:-:-:-:-:-:-:-:-:-:-:-:-:-:-:-:-:-:-:-:-:-:-:-:-:-:-:-:-:-:-:-:-:-:-:-:-:-:-:-:-:-:-:-:-:-:-:-:-:-:-:-:-:-:-:-:-:-:-:-:-:-:-:-:-:-:-:-:-:-:-:-:-:-:-:-:-:-:-:-:-:-:-:-:-:-:-:-:-:-:-:-:-:-:-:-:-:-:-:-:-:-:-:-:-:-:-:-:-:-:-:-:-:-:-:-:-:-:-:-:-:-:-:-:-:-:-:-:-:-:-:-:-:-:-:-:-:-:-:-:-:-:-:-:-:-:-:-:-:-:-:-:-:-:-:-:-:-:-:-:-:-:-:-:-:-:-:-:-:-:-:-:-:-:-:-:-:-:-:-:-:-:-:-:-:-:-:-:-:-:-:-:-:-:-:-:-:-:-:-:-:-:-:-:-:-:-:-:-:-:-:-:-:-:-:-:-:-:-:-:-:-:-:-:-:-:-:-:-:-:-:-:-:-:-:-:-:-:-:-:-:-:-:-:-:-:-:. ........................................................................................................................................................................................................................................................................................................................................................
Value Per Share
Current Without Implied
Charter Value
W/out Charter Implied Charter
"'~,:,~,~,~~,~,I,?,~.Y,,"""""""""""""""""""""""""""""""""""""""""""""""""""""'" ''''''~,?,~,~,iJ~,~,~~,~,i,?,~""'''''''''''''~,~,~,~~:,~J,~,t,,""" "'""J~,i"I,~,~:,~,'"J~,~'''''''''' ",.'!~,I"~,:"J~,i,,I,~,~:,~),"
Sum-of-the-parts DCF Valuation
Single Family $32.23 $19.21 $13.01 $18.25
Multi-Family 2.97 2.80 0.17 2.66
Portfolio 27.44 13.51 13.93 12.83
Total $62.63 $35.52 $27.11 $33.74
Whole Company DCF (b) $79.41 $35.52 $43.89 $33.74
Franchise Factor Model $19.72
Event studies of restatement, late filing and SEC investigation $5.46
Note: Valuations based on 967.904 million shares outstanding and median of respective valuation range. (a) Based on management estimates and Citigroup assumptions. Reflects higher capital requirements, representative growth rates or portfolio
size, and representative cost of funds as a non-GSE company. (b) Whole company projections based on IBES estimates. Implied charter value is calculated by subtracting the valuation of the company
without the charter. (c) Assumes 50.852 million common shares are issued at market price to meet the additional capital requirement as a bank (5% tangible equity ratio).
$13.97
$0.31
$14.61
$28.89
$45.67
56 ~
cltlgroUpJ

>-c:In (3 0
§"~ o 0.(1) (1)
o.-:::l ~ 0-. .: ~ ........... en >-c:I .: ..... ~ 0 :::l"C ............ ....... ..... o ~ g:~ .: IJ:j ~ .: :;0 i!J . .: :::l ...... (1) (1) en en en
"TI
§ (ii'
~
~ n o a
1:;0 o o o Vl ...... o Vl +-
~ ~ o· :::l
Tipping point scenarios:
I!!!J~,!,~,!"",~,!:!"""~"~I!:!,!,!,!""S,!~,!!!,~"",,~,,,,,F!,~,~!!"!,!!"~,!"!"!,!l"""""""""""""""""""""""""""""""""""",,,,,,"""""" 11- No material changes to current capital
requirements
* 2.67% capital requirement
* 5% total capital requirement for the portfolio
* No portfolio reduction
* Assumes 232mm common shares are issued at market price
11- Portfolio capitalized using median capital levels of largest financial institutions
* 6.9% total capital requirement!e)
* 490mm common shares issued at market price
* Existing portfolio assets are run-off (no new business)
* No change in capital requirements
* 5bps after-tax user fee imposed on the total book of business
* 11 bps after-tax user fee imposed on the total book of business
11- Reduces value of charter to zero
After-Tax ROACE (a) Dividend Payout Ratio (b) YOY EPS Growth (Fully Diluted)
2006 24.7% 73.3% 10.6%
2007 25.8% 90.2%
9.2%
2008 25.8% 81.7%
3.6%
2009 25.1% 94.1%
0.7%
Total Change in Value Capital Raised (0) NPV I Share (d)
1:$.(iijj#'@~W:iiif:l)fV.jji)i:ii:iL}}}}}}}}}}}}}}}~~;~: ::}}}}}}}}i;i }}}}}}}}}}}}}:;;: ::::::::::::::::::::::::::::::::::::::::::::}}:~~;W.}}I
After-Tax ROACE (a) Dividend Payout Ratio (b) YOY EPS Growth (Fully Diluted)
2006 19.9%
(1839%) (32%)
2007 16.7% 91.0%
8.7%
2008 16.9% 83.1%
3.4%
2009 16.7% 94.6%
0.7%
Total Change in Value Capital Raised (0) NPV I Share (d) Impact I Share 1::$iii'i'i4.#:i~W&.ifV$.I(ii!q::::}}}}}}}}}}}}}})I~~;'M;iP:}}}}}}}t~t:'M~I: ::::}}}}}})lt~~1:H }}}}}}}}}~i:lI,~L????????!$1~A~f?1
After-Tax ROACE (a) Dividend Payout Ratio (b) YOY EPS Growth (Fully Diluted)
2006 17.5%
(3645%) (152%)
2007 13.4% 91.5%
8.3%
2008 13.6% 84.0%
3.4%
2009 13.5% 94.9%
0.8%
Total Change in Value Capital Raised (0) NPV I Share (d) Impact I Share 1:$.~ijj:#i!jj~~f.j!iijj(Y.@iii!L((((((((((((((A~~~t ((((((((i~M!Mi (((((((:~~~J.ij~: ::::::::::::::::::::::::::::::::::~«'Mr ((((((((:i~~~~f}1
After-Tax ROACE (a) Dividend Payout Ratio (b) YOY EPS Growth (Fully Diluted)
2006 25.7%
153.7% (138%)
2007 27.9%
145.9% (49%)
2008 29.0%
114.4% (46%)
2009 29.1%
122.9% (51%)
Total Change in Value Capital Raised (0) NPV I Share (d) Impact I Share 1:$.(iijj#'@~~@f:I)fV.ijili:ii:iL}}}}}}}}}}}}}}}l!;ifr.\'$'$~: ::::}}}}}}($t~;~~F:}}}}}})C:::::::}}}}}}}}}}}$~1'!';~~ ::}}}}}}}J$.~~,j)1:r{1
After-Tax ROACE (a) Dividend Payout Ratio (b) YOY EPS Growth (Fully Diluted)
2006 20.7% 68.1% (73%)
2007 21.8% 88.5% 10.3%
2008 21.8% 78.5%
3.6%
2009 21.2% 93.0%
0.2%
Total Change in Value Capital Raised (0) NPV I Share (d) Impact I Share 1::$i:ii'i'i:;mM~~r&'i:iV$.((ii!L}}}}}}}}}}}}}}})li!!~w.~ }}}}}}}ll!~:~iID.WL::::::}}}}}}P:::::::::::}}}}}}}}}}~i:lI'Jlj): ::::}}}}}}}!$1%.~~r:}1
After-Tax ROACE (a) Dividend Payout Ratio (b) YOY EPS Growth (Fully Diluted)
2006 15.7% 57.9%
(29.7%)
2007 16.9% 85.1% 12.5%
2008 16.9% 72.2%
3.7%
2009 16.3% 90.9% (07%)
Total Change in Value Capital Raised (0) NPV I Share (d) Impact I Share 1:$.(iijji.i(®~~P.ij@iiNii!i:i~q}}}}}}}}}}}}}}}$~~;~$. }}}}}}}{n:'M~~1L}}}}}}}';;: ::::}}}}}}}}}}}}~~;r.4. }}}}}}}}($~~~$.l }I
57 (a) Based on common equity. (b) Assumes all net income in excess of that required to maintain minimum capital levels is paid to shareholders as a dividend. (c) Assumes any shortfall in capital required is funded through the issuance of new shares of common equity in the market. (d) Calculated on a fully diluted basis.
(e) Median of Citigroup (C), Bank of America (BAC), JP Morgan Chase (JPM), American Int'I Group (AIG), Morgan Stanley (MWO), Goldman Sachs (GS), Lehman Brothers (LEH), Washington Mutual (WM), Golden West Financial (GOVV).
~
cltlgroUpJ

>-c:In (3 0
§"~ o 0.(1) (1)
o.-:::l ~ 0-. .: ~ ........... en >-c:I .: ..... ~ 0 :::l"C ............ ....... ..... o ~ g:~ .: IJ:j ~ .: :;0 i!J . .: :::l ...... (1) (1) en en en
"TI
§ (ii'
~
~ n o a
1:;0 o o o Vl ...... o Vl Vl
~ ~ o· :::l
"""""!,!,!:!,!"!,!!"",~!""!!I!,!,~!!,,!!,!I!,!,,,,,~,!!,!!,,!:!,!,,~,,"!,!I~,!,~,!"~"~"",!!"~,r~,~,~,!!,!!,~,!,!",,,,,,,, > Our proprietary credit rating model suggests that without the implicit government guarantee Phineas' S&P
rating would be downgraded from AAA to A
» This is broadly consistent with some preliminary S&P comments on the downgrade of WestLB, a somewhat comparable case in Europe
> Assuming the loss of the implicit government guarantee, Phineas would have to issue $18bn new common equity to improve its credit rating by 1 notch
> The loss of the implicit government guarantee will also have potentially an impact on the cost of equity. Our estimates suggest that Phineas costs of equity would change from 7.7% to 9.1 %
» Taken together, the reduction in ROE and the increase in cost of capital yield a reduction in PIE by 2.6x which implies a reduction in value by $17.8 billion. This would be an estimate of the value of the implicit government guarantee
> Our model also suggests that the market currently perceives a negative earnings growth rate for Phineas going forward (assuming no charter change), in stark contrast to the positive growth predicted 5 years ago. Similar growth estimates are also observed for firms in the mortgage sector
> The value of the implicit government guarantee is also shown to be present when we evaluate the response of Phineas stock price to negative announcements such as delay in filing, restatements, and SEC investigations which occurred during the last two years. In all cases, Phineas' stock dropped significantly less than companies that experienced similar events but had no government guarantees
58 ~
cltlgroUpJ

>-c:In (3 0
§"~ o 0.(1) (1)
o.-:::l ~ 0-. .: ~ ........... en >-c:I .: ..... ~ 0 :::l"C ............ ....... ..... o ~ g:~ .: IJ:j ~ .: :;0 i!J . .: :::l ...... (1) (1) en en en
"TI
§ (ii'
~
~ n o a
1:;0 o o o Vl ...... o Vl 0\
~ ~ o· :::l
,~,~"!,!'!,!,!,!,:"""!,!!:!"I!"!,!"!~",,,~,~,!,!!,!,,!,,,,,~,!,!,,!,!'!,U"""""""""""""""""""""""""""""""""""""""""""""""""""""""""""""""""""""""""""""""" ~
~
!W
AAA
AA+
AA
AA-
'" A+ .!:
~ A
'" " ~ A-U 0.. ~ BBB+
BBB
BBB-
The combination of size, the ratio of tangible equity to tangible assets and core return on assets explains about 85% of the ratings variation in the peer group
We built two models using a different measure for size: tangible common equity and total assets. We used Phineas' financial metrics as of FYE2004 provided by management; for the peers we used the most recent financial data
Provided that in a post charter period Phineas is rated by S&P as a mortgage issuer/bank, we find that its implied S&P credit rating would be A
R@ii@t:MA::i.):;l.ffij
,I' ..,
tlO Phmeas 1 .... ~
MRBK GOVII
BAC ~ ~ C
~ 9" ~ BBTNC? ' ' ' 'USB JPM
<- .... $: ~
VL Y UMBfNC ~Ey, ' ' CMA ~ ~ ... ~ "';" ~ ~
CFR BP<)fS,BCNFIj,'B UB V\iM TCB M .. ~OKF l'.jl'jl$i ~ HBAN
ONB SKYF ' CBSS ZION BNK OZ* ;.: .... .. 'X .. -:.:.; BXS
" ICBC ,SOSQ CBCF
FRC *.. .. ~ 'O!'i NYB
HU CNB
AAA
AA+
AA
AA-
'" A+ " ~ 0:: A
" 2:! A-U 0.. 06 BBB+ Cf)
BBB
BBB-
'" ."
f,iMMWWWlMM ~ ~ Phineas \ .... ;-.. '"
VLY
GOVII
M MRBK
BBT J$I .... ",,;
UMBF Ko'" 08 NCC 10 -=-" 10 10 .:.
CFftBSS ~~~;i;N I'NC V\iM TCB t)t) .. wA ASBW> 6:' HBAN
SUSQ CBCP' 'BPOP NFEJi'B BNK ~!io:"=".:J.: .. " ">:;..:;.::.:;. BXS
.QNIIKYF ICBC
FRC 10 ~ .. eNB ~ .:.
HU NYB
BAC
» ~ C
USB ?" ~ ..
JPM
" CMA
BB+ ~I------------------------------------------------------------------- BB+ BB+ BB+ BBB- BBB BBB+ A- A A+ AA- BBB- BBB BBB+ A- A A+ AA-
Implied S&P Credit Rating Implied S&P Credit Rating
Note 1: Gredit rating is expressed as a number ranging from 18 (AAA) to 1 (GGG). 59 Note 2: Data used for Phineas as of 12/31/04 (provided by management): Tangible GAAP Equity = $35.5bn, Total Assets = $1 ,004bn
~
cltlgroUpJ

>-c:In (3 0
§"~ o 0.(1) (1)
o.-:::l ~ 0-. .: ~ ........... en >-c:I .: ..... ~ 0 :::l"C ............ ....... ..... o ~ g:~ .: IJ:j ~ .: :;0 i!J . .: :::l ...... (1) (1) en en en
"TI
§ (ii'
~
~ n o a
1:;0 o o o Vl ...... o Vl -.l
~ ~ o· :::l
,~,~"!,!,!,!,!,!,:"""~,~,!,!!,!"!"",!"!.!:!,~!,~,!""""""",,,,,,,,"""""""""""""""""""""""""""""""""""""""""""""""""""""""""""""""""""""""""""""""""""""""""" )0 We estimate that Phineas would have to issue $18bn of common equity to increase its A S&P credit
rating by one notch to an A+
)0 Alternatively if Phineas were to reduce its total assets to approximately $560bn, we estimate that the Company would get a one notch upgrade to an A+ S&P rating
1,100
1,000
_ 900 c .0 ~ (/)
ill (/) (/)
« ro (5 f--
800
700
600
500
AA-
/ (
I /
j ;' Post-Charter
EquityIssuance: $ 18bn / hnplied Rating
"':' ... -----t.-------+ , " A+ / ,/ , "
( " } //
I " , " ( " , "
I ,," / " A
, /
,I ~V ,,/
" I /// /
/
" , ,./ / // /
" I it / :;::' ;'
I I
/1 I
! /1
A-
; !
; !
i !
/ /
/ / BBB+
~ / / , //
/ As s et reduction to /"
$560bn /
/
7 5 3
Tangible Equity / Tangible Assets (%)
/
Targeted Post Charter S&P Credit Rating
AAA AA+ AA AA- A+ A
1,004 82 66 50 34 18 2
~I 904 72 58 43 29 14 (0) e ~I Cf)
803 62 49 36 23 10 (2) Cf)
~I 703 51 40 29 18 6 (5) 0 1-.
602 41 31 21 12 2 (8)
502 29 21 13 5 (3) (11 )
Note: the above numbers do not take into account any proceeds Phineas might get from selling some of its assets
Note: Data used for Phineas as of 12/31/04 (provided by management): Tangible GAAP Equity = $35.5bn, Total Assets = $1 ,004bn
A-
(14)
(15)
(15)
(16)
(17)
(19)
60 ~
cltlgroUpJ
Confidential Proprietary Business Information Produced Pursuant to House Rules Fannie Mae FM-COGR 00051058

>-c:In (3 0
§"~ o 0.(1) (1)
o.-:::l ~ 0-. .: ~ ........... en >-c:I .: ..... ~ 0 :::l"C ............ ....... ..... o ~ g:~ .: IJ:j ~ .: :;0 i!J . .: :::l ...... (1) (1) en en en
"TI
§ (ii'
~
~ n o a
1:;0 o o o Vl ...... o Vl '-0
~ ~ o· :::l
,~,~,!,!""E:,!!,!,!!,!,~",!,!,!,!:!,!"",!,!!:!"I!,!!,~!,~"",,~~,~""'!:""'~,~,,~""""""""""""""""""""""""""""""""""""""""""""""""""""
I
61
0.8% 0.12 7.7% - 0.8%
x X X
-- 33.4% - 7.7% = 9.9
(33.4%) * (7.7%)
+ + +
12.9 7.7%
(1): Growth: we use Phineas median implied growth for the 1998-2004 period. (2): We assumed a risk free rate of 4.34% and an equity market risk premium of 5%. (3): ROE: 3 - year average ROE as of June 2004 (pre-restatement) (4): NTM EPS estimate: $6.95 per share, number of shares outstanding: 968mm.
I
0.8% 0.10 9.1% -0.8%
X X X
-=- 16.5% - 9.1% = 4.9
(16.5%) * (9.1 %)
+ + +
11.0 9.1%
.6.P/E(4) = 2.6x or .6. Value = $17.8bn
~
cltlgroUpJ

Confidential Proprietary Business Information Produced Pursuant to House Rules Fannie Mae FM-COGR 00051060

>-c:In (3 0
§"~ o 0.(1) (1)
o.-:::l ~ 0-. .: ~ ........... en >-c:I .: ..... ~ 0 :::l"C ............ ....... ..... o ~ g:~ .: IJ:j ~ .: :;0 i!J . .: :::l ...... (1) (1) en en en
"TI
§ (ii'
~
~ n o a
1:;0 o o o Vl ...... o 0\ ......
~ ~ o· :::l
Estimate of the value savings due to implied
S,~!,!"~,!!,!!!,!,!,!,!"",S,!:!,!,~!,!,!,!,!,!"""""""""""""""",,""""""""""""""""""""""""""""""""""""""""""""""""""""""""""""""""""""""""""""""""""",,, >- We estimate the stock price reaction of Phineas and a sample of comparable firms for 3
particular events (delay in filing, restatement of financials, inquiry by SEC) that occurred during the last year for both Phineas and the benchmark firms
ib Out of a sample of 88 companies, which delayed filing, 8 companies had been delisted, 47 companies delayed filings with SEC, 24 restated their financial statements and 20 were investigated. (a)
>- The event study methodology employed suggests that for all three events the stock price reaction of Phineas was less negative than the average of the benchmark firms, implying that there were value savings for Phineas presumably due to the implied guarantee
ib In total, for all three events combined, Phineas' stock price reaction over the 2 days around the announcement averages -5.620/0 versus -15.020/0 for the benchmark firms
>- The total dollar value savings for Phineas (based on today's equity market value) for the above three events is $5.28 billion, or $5.46 per share
(aJ Companies included the top third of the com parables ranked by total assets: Delay in Filing: Veritas Software (VRTS), Navistar International (NAV), United Rentals (URI), Saks (SKS), DPL (DPL), BJ Services (BJS), King Pharmaceuticals (KG), UTStarcom (UTSI), Interpublic (IPG), Healthcare Realty Trust (HR), Nortel Networks (NT), Key Energy Services (KEGS), OM Group (OMG), Bally Total Fitness (BFT), Cardinal Health (CAH), Financial Industries (FNIN), Offshore Logistics (OLG), Krispy Kreme (KKD), Integrated Electrical Services (IES), Asyst Technologies (ASYT), Sourcecorp. (SRCP), MDC Partners (MDCAE) Restatement: VRTS, NAV, URI, DPL, UTSI, lPG, MBIA (MBI), NT, OMG, BFT, KKD, ASYT, SRCP Investigation: URI, SKS, KG, OMG, BFT, CAH, KKD, IES, SRCP
62 ~
cltlgroUpJ

>-c:In (3 0
§"~ o 0.(1) (1)
o.-:::l ~ 0-. .: ~ ........... en >-c:I .: ..... ~ 0 :::l"C ............ ....... ..... o ~ g:~ .: IJ:j ~ .: :;0 i!J . .: :::l ...... (1) (1) en en en
"TI ~ :::l ~. (1)
~ ~ (1)
"TI ~ I n 0 I: 0 0 Vl ...... 0 0\ N
~ ~ o· :::l
,~,!,~,~,!!:"",I!,!,!,~,!"",!!,!,~,~,!'!"!,!"",!,~"",~,!,!,,!,l,:""!,!'!"",!!"!"!"!'!,S"!",,,,,,,,,,,,,,,,,,,,,,,,,,,,,,,,,,,,,,,,,,,,,,,,,,,,,,,,,,,"""""""""""""""""",,, >- The market's reaction to delay in filings announcements averages -4.15% over the 2
days before and after the announcement, while for Phineas it averages -2.45%. The difference of 1.70% is an estimate of the value savings in this particular event of the implied government guarantee
I 0.0%
-0.5% CJ)
E -1.0% :::l Q) 0::: -1.5%
CJ) CJ) Q) -2.0% u X
W -2.5% Cumulative Excess Returns
Q)
> ~ -3.0% "S ~ -3.5%
0 -4.0%
CJ) c
1.0%
0.5%
.a 0.0% , Q)
0::: CJ) -0.5% CJ) Q)
~-1.0% Q)
:6 -1.5% III
~ -2.0% :::l o
-2.5%
Cumulative Excess Returns
-4.5% -3.00k LI ______________________________ ~ ____________________________ ~
-2 -1 0 1 Days Relative to Announcement (Day 0) ~
2 -1 0 Days Relative to Announcement (Day 0)
2
Cumulative return of -4.15% from t-2 days to t+2 days Cumulative return of -2.45% from t-2 days to t+2 days
63 ~
cltlgroUpJ
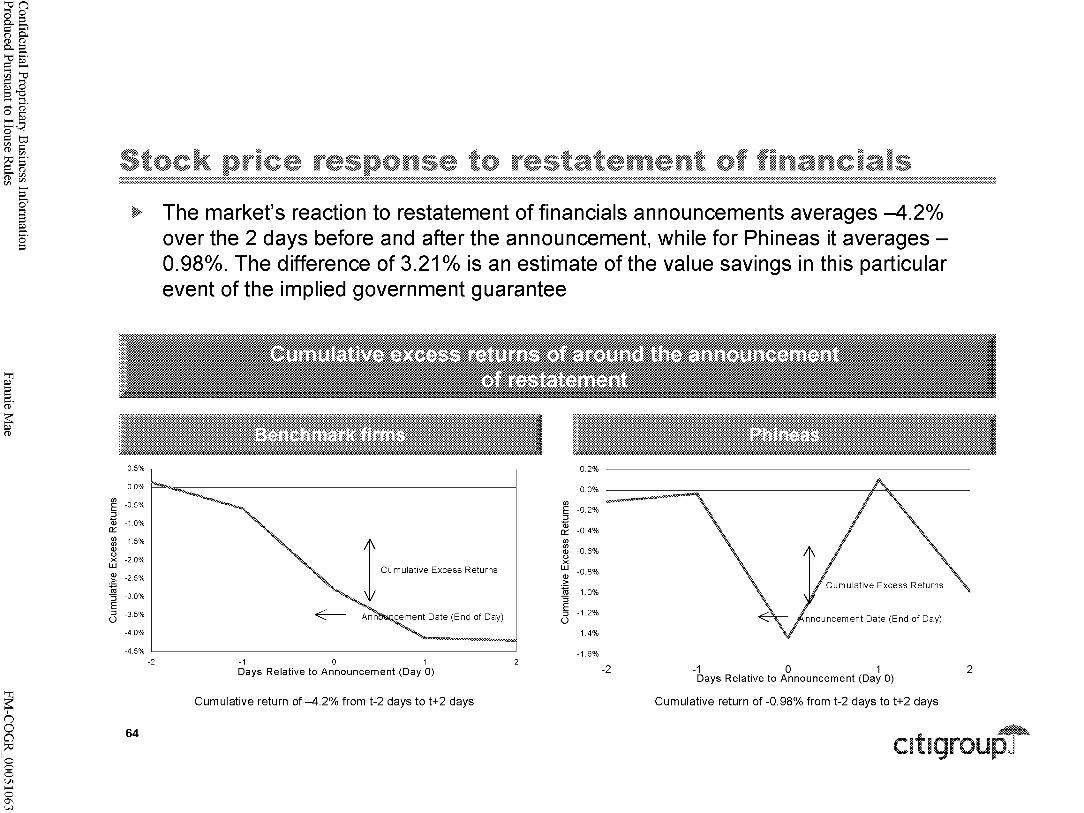
>-c:In (3 0
§"~ o 0.(1) (1)
o.-:::l ~ 0-. .: ~ ........... en >-c:I .: ..... ~ 0 :::l"C ............ ....... ..... o ~ g:~ .: IJ:j ~ .: :;0 i!J . .: :::l ...... (1) (1) en en en
"TI ~ :::l :::l (ii'
~ ~ (1)
"TI ~ I n 0 a
1:;0 0 0 0 Vl ...... 0 0\ w
~ ~ o· :::l
Cf) c :; Q) et:: Cf) Cf) Q) u x
UJ Q)
.;:: iii :; E ::J 0
,~,!,~,!!,~"",e,!,!,!!,!"",!!,!,~,~,!!"!,!"",!,~",,,~,!,!!,!!!,!,!,!!!,!,!!,!""~,!""!,!"~,!,!:!,!!I!!I!"""""""""""""",,,,,, >- The market's reaction to restatement of financials announcements averages -4.2%
over the 2 days before and after the announcement, while for Phineas it averages -0.98%. The difference of 3.21 % is an estimate of the value savings in this particular event of the implied government guarantee
::: :~:~:~:~:~:~:~:l 0.5%
0.0%
-0.5%
-1.0%
-1.5%
-2.0%
-2.5%
-3.0%
1 Com","'" ",," C"o,",
-3.5%
-4.0%
0.2%
00% I ~. ~ . - ~ I , Cf)
E ~.2% ::J
~ ~.4% Cf) Cf)
~ ~.6% x ~ ~.8% > ~ -1.0% ::J
~ -1.2% o
-1.4%
Cumulative Excess Returns
nnouncement Date (End of Day)
-4.5% -1.6% LI __________________________________ ~ ________________________________ ~
-2 -1 0 1
Days Relative to Announcement (Day 0) -2 -1 0 1 Days Relative to Announcement (Day 0)
2
Cumulative return of -4.2% from t-2 days to t+2 days Cumulative return of -0.98% from t-2 days to t+2 days
64 ~
cltlgroUpJ

>-c:In (3 0
§"~ o 0.(1) (1)
o.-:::l ~ 0-. .: ~ ........... en >-c:I .: ..... ~ 0 :::l"C ............ ....... ..... o ~ g:~ .: IJ:j ~ .: :;0 i!J . .: :::l ...... (1) (1) en en en
"TI ~ :::l :::l (ii'
~ ~ (1)
"TI ~ I n 0 a
1:;0 0 0 0 Vl ...... 0 0\ +-
~ ~ o· :::l
,~,!,~,~,!!:"",I!,!,!,~,!"",!!,!,~,~,!.!"!,!"",!,~"",!,,!!,g,,!:!"!,!:'l!:""""""""""""""""""""""""""""""""""""""""""",,,,,,,,,,,"""""""""""""""""""""""",,: >- The market's reaction of benchmark sample firms to inquiry announcements averages
-6.67% over the 2 days before and after the announcement, while for Phineas it averages -2.19%. The difference of 4.48% is an estimate of the value savings in this particular event of the implied government guarantee
iI 1.0%
0.0%
(/)
E -1.0% ::J
~ -2.0% (/) (/)
~ -3.0% Cumulative Excess Returns ><
UJ Q) -4.0% > ~ -5.0% E (5 -6.0%
-7.0%
CJ) c
0.0%
-0.5%
:::; -10% Q) . 0::: ~ -1.5% Q)
~ -2 0% UJ .
Q)
:6 -2.5% ..!!! ::J
E -3.0% ::J u
-3.5%
1 C"m,'''''," E,,"~ R"'"m,
-8.0% -4.0% LI --------------------------~------------------------~
-2 -1 0 Days Relative to Announcement (Day 0)
2 ~ -1 a 1
Days Relative to Announcement (Day 0) 2
Cumulative return of -6.67% from t-2 days to t+2 days Cumulative return of -2.19% from t-2 days to t+2 days
65 ~
cltlgroUpJ

; ••........
......... .......
"""""":
"""""":
..........
....... , .
....... , .
....... ,.
.~ ...... "
.... ~.
.•..•..•..•. ~.
.............
.•..•..•..•. ~.
:~ ......... ~. ,' ....•.••• ~"'" .' .
". ~'.
::""""'"
L. \ ... ,
Confidential Proprietary Business Information Produced Pursuant to House Rules
::: ...... ,
"""""':
'.' ': .•.•.•. ';:
':"'"
. ~'.... ':.
:; ....... .
........
:~ .:'
..': •...... ,':
~: .... '.
t .....
\ .... .. '~""" "
...•...•.. : L. \ ....
Fannie Mae
CJ) c: o
.'-.......,
co co
FM-COGR 00051065

>-c:In (3 0
§"~ o 0.(1) (1)
o.-:::l ~ 0-. .: ~ ........... en >-c:I .: ..... ~ 0 :::l"C ............ ....... ..... o ~ g:~ .: IJ:j ~ .: :;0 i!J . .: :::l ...... (1) (1) en en en
"TI
§ (ii'
~
~ n o a
1:;0 o o o Vl ...... o 0\ 0\
~ ~ o· :::l
,~,!,!"!,S"~,~,!!,I:!"",~,!,E:,~,!.!:!,!.!:!,!,!.!,'!!,!,!,!"~"!!,!,,,,,,,,""""""""""""""""""""""""""""""""""""""""""""""",,,,,,,,,,,,,"""""""""""""""""""""""""""" Recommendation
Optimize value of Portfolio business
1) Manage growth in portfolio to optimize returns
2) Structural alternative -7 Portfolio tracking stock
New business opportunities
1) Extension of the Guaranty business into new products
2) Asset management & risk analytics
3) Mortgage insurance
Consider comprehensive investor relations program
.:::. Manage business to total returns on invested capital and not EPS growth
.::::. Optimize investor interest by isolating the Portfolio's value and returns for investors that place the highest value on the resulting economic earnings stream
':::' Target investors who understand the portfolio business and are comfortable with volatile GAAP results
.:::. Utilize existing core competency in evaluating mortgage credit risk to expand the guaranty business into non-traditional products (Jumbo(a), Alt-A, Sub-prime,
HELOCs)
":::' Non-traditional markets have recently experienced significant growth. Expansion into these products should provide Phineas with more diversified sources of revenue and higher earnings growth
.::::. Profit from selling market-leading portfolio management skills to institutional
investors including banks, REITs, pension funds, insurance companies, etc.
.:::. Leverage existing relationships with mortgage originators and leading understanding
of mortgage credit risk to expand into mortgage insurance
::::. Use a variety of descriptive and quantitative tools to highlight how the businesses are managed to shareholder maximize value
.::::. Focus on reinvigorating existing and new investors, and to reconciling GAAP results with management of the business and "core" results
(a) Expanding the guaranty business into Jumbos would require an amendment to the charter.
67
.. - $6 billion / $5.72 per share
.. - $2 billion / $2.31 per share
.. - $3 billion / $3.07 per share
~
cltlgroUpJ

>-c:In (3 0
§"~ o 0.(1) (1)
o.-:::l ~ 0-. .: ~ ........... en >-c:I .: ..... ~ 0 :::l"C ............ ....... ..... o ~ g:~ .: IJ:j ~ .: :;0 i!J . .: :::l ...... (1) (1) en en en
"TI
§ (ii'
~
~ n o a
1:;0 o o o Vl ...... o 0\ -.l
~ ~ o· :::l
68
act of business initiatives
+ No additional business initiatives
* No additional equity requirement
¢- Expansion into non-traditional mortgage guaranty business
* Guarantee fee of 30bp, losses of 5bp, admin expenses of 3bp
+ Capital requirement of 59bp of book of business
¢- Expansion into asset management and risk analytics
* Fees of 28bp of AuM, costs of 18bp for asset management
* Fees of 6bp of AuM, costs of 3bp for risk analytics
¢- No additional capital requirement
* Disintermediation of mortgage insurers
* Guarantee fee of 70bp, losses of 30bp, admin expenses of 3bp
* Capital requirement of 59bp of book of business
After-Tax ROACE Dividend Payout Ratio (a) YOY EPS Growth
2006 24.7% 73.3% 10.6%
2007 25.8% 90.2%
9.2%
2008 25.8% 81.7%
3.6%
2009 25.1% 94.1%
0.7%
NPV Per Total Chanae in Value Capital Rea'd Share
1:$.WMM~mw.ijii~Mii#i)iii: (((((()j;:~g;~;W:::: ::}}}}}}}}}}}}}:;;: }}}}}}}}}}}}}}}:;;: }}}}}}}}}}}im~~~~}}
2006 After-Tax ROACE 24.9% Dividend Payout Ratio (a) 70.2% YOY EPS Growth 11.6%
Total Chan 1:$.WMM~mw.ijii~MiiiMiii: :::::::::::::::::}}}$.~~;~:~t(({::::::::::::::·:·:········
After-Tax ROACE Dividend Payout Ratio (a) YOY EPS Growth
2006 24.9% 73.4% 11.2%
2007 26.1% 86.2% 10.8%
2007 26.0% 90.3%
9.4%
2008 26.4% 74.0%
6.8%
2008 26.0% 81.9%
3.8%
2009 26.1% 84.2%
4.5%
2009 25.5% 94.2%
1.0%
Incremental NPV I Per share Total Change in Value Capital Req'd Share (b) Impact
1{!i~if:iM%'[email protected]~iiiC}}}}}}}}$i!~;~~f~d(((((((((($~;~#.d((((((((((((((fi ((((((((((($~¥$:,i( (((((((((((:$.~~~(}j
After-Tax ROACE Dividend Payout Ratio (a) YOY EPS GrolAAh
2006 24.9% 71.9% 11.5%
2007 26.1% 88.7% 10.1%
2008 26.3% 79.0%
5.5%
2009 26.0% 90.7%
2.8%
Incremental NPV I Per share
1:$~iiimf:;jiim.P.iii~Mi.ii\i@ ((((((::~;~J. ((::::::j:~:~:;f:~::$.1j~t.W.~::::::}}}:~~:j::~~:::::~~~~'~:::::::::::::}}}:~:~~:~;~~!r:Q: ::::::::::::::}:{:::::::~:~~~~;~rr j Source: Base earnings based on management projections. (a) Assumes all net income in excess of that required to maintain minimum capital levels is paid to shareholders as a dividend. (b) Assumes any shortfall in capital required that cannot be covered by retained earnings of all business lines is funded through the issuance of new shares of common equity in
the market at the current share price.
~
cltlgroUpJ

Confidential Proprietary Business Information Produced Pursuant to House Rules Fannie Mae FM-COGR 00051068

Confidential Proprietary Business Information Produced Pursuant to House Rules Fannie Mae FM-COGR 00051069

>-c:In (3 0
§"~ o 0.(1) (1)
o.-:::l ~ 0-. .: ~ ........... en >-c:I .: ..... ~ 0 :::l"C ............ ....... ..... o ~ g:~ .: IJ:j ~ .: :;0 i!J . .: :::l ...... (1) (1) en en en
"TI
§ (ii'
~
~ n o a
1:;0 o o o Vl ...... o -.l o
~ ~ o· :::l
!!,!,!,!,!,!,!!,S"",I:!,~"!:!,!~"!"!,~"",~,!,!,!:!,~!!"!"",,,,,,,,""""""""""""""""""""""""""""""""""""""""""""""""""""""""""""""",,,,,,,,,,,,,,,,,,,,,,,,,,,,,,,,,,,,, Phineas Management Estimates
II;aaI11;Liiim_@AiMilwdithliEtJtaI111;a2 ;;;;;;;;;;;;;;;;;;;;;;i\ki .• iliiiii¥JiiiiMM&iiMiiU;;;;;;;;;;;;;;;;;;;;;. ($ in billions) 2000 2001 2002 2003 2004 2005 2006 2007 2008 2009
Portfolio Balance (a) $605 $717 $805 $914 $954 $828 $828 $828 $828 $828 Financial Leverage Assumption 2.05% 2.05% 2.05% 2.05% 2.05% 2.67% 2.67% 2.67% 2.67% 2.67% Total Capital Required (Inc. Preferreds) 12.4 14.7 16.5 18.7 19.6 22.1 22.1 22.1 22.1 22.1 Common Equity (b) 10.1 12.4 13.8 14.6 10.5 14.3 15.7 16.0 17.0 17.0 ($ in millions)
Historical Total Returns
Pretax Total Returns (c) $484 $860 ($1,126) $7,863 $4,771 After-tax Total Returns (a) 324 571 (755) 5,122 3,131
Historical Core Earnings {d)
Pretax Core Earnings (e) $4,235 $5,378 $6,517 $6,674 $6,489 After-tax Core Earnings (a) 2,745 3,489 4,215 4,358 4,230
Projected "Core Earnings"
Pretax Core Earnings $4,970 $5,589 $6,271 $6,456 $6,325 After-tax Core Earnings 3,152 3,663 4,203 4,355 4,308
Profitabilitll Ratios:
Total Return On Equity (ROE) (a) 2.30% 4.00% (5.00%) 35.20% 15.80% Core Earnings / Avg. Common Equity (After-tax) 27.11% 28.15% 30.51% 29.78% 40.47% Core Earnings / Avg. Common Equity (Pretax) 40.14% 37.26% 39.60% 39.19% 37.30% Core Earnings / Avg. Common Equity (After-tax) 25.46 27.20 28.91 28.61 27.23 N.B. 2004 retums as provided by management. Management projections from 06/2005. (a) Provided by management. (b) Assumes callable preferred equity is called at earliest call date. (c) Calculated based on pre-tax ROM of 0.08%,0.12%, (0.14%), 0.86% and 0.50% in 2000 - 2004, respectively, provided by management.
(d) Pre-restatem ent. (e) Calculated based on pre-tax ROM of 0.70%,0.75%,0.81%,0.73% and 0.68% in 2000 - 2004, respectively, provided by management.
.......................... ~!. .. I.~.~.!!.~.~.g.~~.~.i.~ ... ~.~~.i.~.~......................... Equityl ............................ ~.~ .. .x.~ .. ~~.~.i.~~ ... ~.c::>.~9.~ ............................ Total Annualized Return Institutions S&P Moodv's Assets Pre-Tax After Tax Since 1/1/2000 tal
REIT: RMBS Porlfolio Managers REIT: CMBS Porlfolio Managers
Banks with Mortgage Platform
Thrifts Fixed Income Asset Manager
NR
NR
A+
A
NR
NR
NR
Aa3
A2
NR
Source: 100. SNL Oatasource. Based on company filings as on 12.31.2004 and market data as on 07.11.2005.
8.5%
16.2
9.1
6.9
NA
N.B. REIT: RMBS Portfolio Managers data since 1999. REIT: CMBS Portfolio Managers data since 2000 and Fixed Income Asset Managers since 1997.
(a) Reflects share price appreciation plus reinvested dividends.
14.3%
13.6
30.0
27.9
47.8
14.3%
13.6
19.0
17.5
29.2
28.1%
22.2
13.8
24.9
26.2
69 ~
cltlgroUpJ

>-c:In (3 0
§"~ o 0.(1) (1)
o.-:::l ~ 0-. .: ~ ........... en >-c:I .: ..... ~ 0 :::l"C ............ ....... ..... o ~ g:~ .: IJ:j ~ .: :;0 i!J . .: :::l ...... (1) (1) en en en
"TI
§ (ii'
~
"TI ~ I n 0 a
1:;0 0 0 0 Vl ...... 0 -.l ......
~ ~ o· :::l
!,!,!,!,~!!"!!,!"!,!,!"",~,~,!!,!~I!,,~,,,,,!!!,,!!,,!!,!S,!,!!!,!,!:!,!""!,!"~!!,!,!,U,:l""""""",,,,,,,,,,,,,,,,,,,,,,,,,,,,,,,,,,,,,,,,,,,,,,,,,,,,,,,,,""" ¢ We used a regression analysis of Phineas' monthly purchase data from January 1998 to early 2005 to
attempt to measure the statistical correlation of portfolio activity and movements in the option-adjusted spreads (OASs) of Phineas current coupon MBSs
" We believe that in times of market stress Phineas can achieve its mission and its shareholder return goals by being an active buyer of mortgages; Phineas can be far more selective in normal markets
" Throughout this period there seems to have been little correlation between portfolio activity and OAS spreads. However, we also observe that in certain periods of high market volatility an increase in Phineas portfolio has been followed by a tightening of spreads
.. Market participants believe, however, that Phineas will be an active participant in the mortgage market in times of market stress, likely stabilizing market spreads
¢ As a result we recommend that Phineas only pursues trades that fulfill its cost of equity requirement of 7.7%. Phineas may also consider reducing its derivatives activity, which would reduce mark-to-market accounting adjustments and would lead to more transparent GAAP earnings. While a reduction in synthetic trades may reduce economic returns, investors may value a more transparent and predictable earnings stream with a higher multiple
¢ Selling into a Phineas MBS is easily the best alternative for lenders when there is a TBA market. Currently, Phineas includes non-prime loans (low FICOs, investor properties, alt documentation, etc) into its standard pools. We recommend that Phineas segregate such loans, and create TBA markets for investor loans, for low FICO loans, etc. This will provide an incentive for lenders to sell such pools into Phineas pools
¢ Phineas should lobby to have the designation of high cost areas updated regularly (as in the recent proposed House legislation), so that average size loans in places like CA (which accounts for a quarter of U.S. mortgage originations) are not excluded from Phineas pools
70 ~
cltlgroUpJ

>-c:In (3 0
§"~ o 0.(1) (1)
o.-:::l ~ 0-. .: ~ ........... en >-c:I .: ..... ~ 0 :::l"C ............ ....... ..... o ~ g:~ .: IJ:j ~ .: :;0 i!J . .: :::l ...... (1) (1) en en en
"TI
§ (ii'
~
~ n o a
1:;0 o o o Vl ...... o -.l N
~ ~ o· :::l
GSEs have positively impacted the mortgage market -:-:-:-:-:-:-:-:-:-:-:-:-:-:-:-:-:-:-:-:-:-:-:-:-:-:-:-:-:-:-:-:-:-:-:-:-:-:-:-:-:-:-:-:-:-:-:-:-:-:-:-:-:-:-:-:-:-:-:-:-:-:-:-:-:-:-:-:-:-:-:-:-:-:-:-:-:-:-:-:-:-:-:-:-:-:-:-:-:-:-:-:-:-:-:-:-:-:-:-:-:-:-:-:-:-:-:-:-:-:-:-:-:-:-:-:-:-:-:-:-:-:-:-:-:-:-:-:-:-:-:-:-:-:-:-:-:-:-:-:-:-:-:-:-:-:-:-:-:-:-:-:-:-:-:-:-:-:-:-:-:-:-:-:-:-:-:-:-:-:-:-:-:-:-:-:-:-:-:-:-:-:-:-:-:-:-:-:-:-:-:-:-:-:-:-:-:-:-:-:-:-:-:-:-:-:-:-:-:-:-:-:-:-:-:-:-:-:-:-:-:-:-:-:-:-:-:-:-:-:-:-:-:-:-:-:-:-:-:-:-:-:-:-:-:-:-:-:-:-:-:-:-:-:-:-:-:-:-:-:-:-:-:-:-:-:-:-:-:-:-:-:-:-:-:-:-:-:-:-:-:-:-:-:-:-:-:-:-:-:-:-:-:-:-:-:-:-:-:-:-:-:-:-:-:-:-:-:-:-:-:-:-:-:-:-:-:-:-:-:-:-:-:-:-:-:-:-:-:-:-:-:-:-:-:-:-:-:-:-:-:-:-:. ........................................................................................................................................................................................................................................................................................................................................................
600 bps
500
W 400 0..
e -g 300 Q)
0.. en 200
100
o
20% Rates in
! .--- Double Digits
! J\" Thrift Crisis 1998 Hedge n ;.:.... ,. '; '.. ~ Fund Cnsls
, ' '::/( i'\!\Vt;," ;"::d~~< /""':: '" "'v y ." / :,,:'/ "tc{tdJ';'\P\~~\/:'\;,':::;~yyl 5 ~ ........... . . 1:\ i \ I \ i W l '(J"" > ; \, j\( 'i '\I \ 10\ , ., ~r v,: \ i'\!, . HI;\ /\,~ . ./7"" hj,j\f" ,; v,rf"V'{0 ,.' v ......... ' q '.: i . 1 'I !' ") ! l '" v v 1 oJ \( j. '" i \: \, ,.;-' , : k ' . \ ( , '.'. <" 'j ~ \., .i.-. t / V\ i'o (>-~i'SYI.!' ~ I \
(' '\/' ·.v' v ~ : .
15 0
-< CD
~ --l
10 CD OJ CJ) C
-<
\i l
~----------------------------------------------------------------------------------------------------------______________ ~I 0
May-75 May-78 May-81 May-84 May-87 May-90 May-93 May-96 May-99 May-02 May-05
~~ 30 Year IIIbrtgage Rate Spread········· 10 Year Treasury
.. The wide fluctuations in mortgage spreads during periods of stress in the 1980s have been largely absent since the early 1990s. The widening during the hedge fund crisis in 1998 was much smaller, and has been largely reversed, despite huge refinancing waves from 2001 to 2004
.. The prepayment option has become much more efficient during the last 20 years, which implies that nominal mortgage spreads should have widened (assuming that investors demand a constant ~AS). The absence of such a widening could be explained through the presence of GSE activity
71 ~
cltlgroUpJ

>-c:In (3 0
§"~ o 0.(1) (1) o.-g >-c:I ..... .: e:.. ~ >-c:I .: ..... ~ 0 :::l"C ~ ~ . ....... (1) o ....... ::r::~ o~ .: IJ:j
~~. limitations on analytical framework ~ c.n :::::::::::::::::::::::::::::::::::::::::::::::::::::::::::::::::::::::::::::::::::::::::::::::::::::::::::::::::::::::::::::::::::::::::::::::::::::::::::::::::::::::::::::::::::::::::::::::::::::::::::::::::::::::::::::::::::::::::::::::::::::::::::::::::::::::::::::::::::::::::::::::::::::::::::::::::::::::::::::::::::::::::::::::::::::::::::::::::::::::::::::::::::::::::::::::::::::::::::::::::::::::::::::::::::::::::::::::::::::::::::::::::::::::::::::::::::::::::::::::::::::::::::::::::::::::::::::::::::::::::::::::::::::::::::::::::::::::::::::::::::::::::::::::::::::::::::::::::::::::::::::::::::::::::::::::::::::::::::::::::::::::::::::::::::::::::::::::::::::::::::::::
"TI
§ (ii'
~
~
~ ~ ? There are significant data limitations in connection with our analysis: o· :::l
1, We have only monthly purchase data, whereas OASs change constantly;
2. There are variable and unpredictable lags between purchase decisions (when the market would react) and reported purchases
+- An absence of statistical correlation does not imply an absence of a relationship between two variables. The relationship could be complicated and non-linear, and perhaps present only at certain times (such as the stressed markets of late 1998 and mid-2003)
+- The data is from a period when there was already a substantial retained portfolio - we cannot extrapolate to a situation with no retained portfolio
+- The perception of the GSEs as opportunistic buyers likely has a psychological impact on MBS investors
n o a
1:;0 o o o Vl ...... o -.l w
72 ~
cltlgroUpJ

>-c:In (3 0
§"~ o 0.(1) (1)
o.-:::l ~ 0-. .: ~ ........... en >-c:I .: ..... ~ 0 :::l"C ............ ....... ..... o ~ g:~ .: IJ:j ~ .: :;0 i!J . .: :::l ...... (1) (1) en en en
"TI
§ (ii'
~
~ n o a
1:;0 o o o Vl ...... o -.l +-
~ ~ o· :::l
We could find no statistical correlation between
,~,~"!,!!,!,!!,!"",J!~,!!,!~I!,~""!!,!!!,t!,!,!:l",,!!,~,~,,,,,~!,~""!:,!!,!!,,~,S,,!,!,,'"'''''''''''''''''''''''''''''''''''''''''''''''''''''''''''''''''''" 40 bps
"' a. co
~ 30 Cf)
g 8 20
'" co Q)
" i: 10 0..
ciJ " J:: U 0 :;:: :E
-10
-20
"' g- 40 bps
R@@re.§.(i@)11
-1
~ 30 I g~M~W§():()()# « o 8 20
'" co Q)
~ 10 0..
ciJ i: 0 u :;:: :E -10
-20
73
~
2C
Jan 1998 - March 2005
0< {I-~ ..;.. ""
~ % ..;.. "!r~o} ~ ..;..
'l ~ y";" -:>'" ~ ~ ~4 ~ -:. .;. ..;.. ~ ~ q *«.,. .... ~ ..;..
y .... -..: '" . '" . , ...
2 4 5
Monthly Percentage Change Portfolio Balance (Lag 1 Month)
Jan 1998 - March 2005
~
0- l< *0} >( .s
~ 0} l<¢. #~ ;. l\ *" 0- 1< '% ....
:o}~s- :~ .... ~¢. 0- ~~J!y~ ¢'
'9 Q> .0. ¢'
~
• • ~
4C 60 BC 10C
((SF Purchases) I (Total Phineas Gross Issuance)) (Lag 1 Month)
4-
4-
4-7%
12C 140%
Our analysis uses two measures of portfolio activity: the % change in the portfolio size (top graph), and the ratio of purchases to issuance during a month (bottom graph)
The lag refers to the assumed time between the decision to buy M BS and the transaction being reported as a purchase
The results are similar for varying lag periods
~
cltlgroUpJ

>-c:In (3 0
§"~ o 0.(1) (1)
o.-:::l ~ 0-. .: ~ ........... en >-c:I .: ..... ~ 0 :::l"C ............ ....... ..... o ~ g:~ .: IJ:j ~ .: :;0 i!J . .: :::l ...... (1) (1) en en en
"TI
§ (ii'
~
~ n o a
1:;0 o o o Vl ...... o -.l Vl
~ ~ o· :::l
nalysis for just 1998 also shows no overall correlation, but Phineas purchase activity in the Q4
,!.!:!,!X"",!!,!!,!"",!,!,!.!:!"I!,!,~!,!!"""~,~!",,,~,!,,~,!,!.!,,!,,!!,liL""""""""""""""""""""""""""""""""""""""""""""""""""""""""""""""""
"' ~ 35 bps I ~,~jji#E;,,();(i(i:31S !!!. 30
~ 25 o U 20
~ 15 co ~ 10
~ 5
~ 0
~ -5
~ -10
-15
-20 0.00 0.5C
~ 35 bps Ig;~qliiiiii"'M$(i1 ~ 30
~ 25
~ 20
~ 15 co ~ 10
~ 5
~ 0
13 -5
~ -10
-15
-20 3C 40
1.0C
1998
~
"
1.5C 2.0C 2.5C
Monthly Percentage Change Portfolio Balance (Lag 1 Month)
1998
50 6C 70 80
3.0C
< ~
((SF Purchases) I (Total Phineas Gross Issuance)) (Lag 1 Month)
3.5C 4.00%
90 100%
-0 Analysis of just 1998 also shows little statistical correlation overall
-0 However, there are indications that Phineas activity impacted OASs in late 1998: from September 98 to January 99, the portfolio grew from $375b to $420b, and OASs, which had spiked in the fall, tightened almost 40bps over this period
-0 General market perception at the time was that the GSEs' buying tempered and reversed the widening caused by the hedge fund crisis
-0 Spreads of other fixed income products which had widened dramatically in the 2nd
and 3rd quarter, such as corporate bonds, also tightened during the 4th quarter of 1998
74 ~
cltlgroUpJ

>-c:In (3 0
§"~ o 0.(1) (1)
o.-:::l ~ 0-. .: ~ ........... en >-c:I .: ..... ~ 0 :::l"C ............ ....... ..... o ~ g:~ .: IJ:j ~ .: :;0 i!J . .: :::l ...... (1) (1) en en en
"TI
§ (ii'
~
~ n o a
1:;0 o o o Vl ...... o -.l 0\
~ ~ o· :::l
n analysis for 2003 similar~y shows little overall correlation between portfolio activity ~eve~s and
~,!:!,~"!!,IJI,!,!"",!"!!"",E:,!!"~,~,!"!!,~",,,~,~,!!,,I!,~,!!,,,,,~,!,!,!"""""""""""""""""""""""""""""""""""""""""""""""","""""""""""""""""""",,,
"' g. 10bps
~ ~ 5 o 8 0
'" co Q)
~ -5 DC,
~ -10 U
:;:: :E -15
-20
~ 10 bps co
~ Cf) 5 g U U 0
'" co Q)
~ -5 DC,
~ -10 U
J::
:E -15
-20
75
~
-1
20
2003 RP,;@~t~§q·q'@3
~
Monthly Percentage Change Portfolio Balance (Lag 1 Month)
2003
..
40 60
((SF Purchases) I (Total Phineas Gross Issuance)) (Lag 1 Month)
7%
~"sqU~N.#.Q.Q@4
80 100%
-+ However, there are again signs of Phineas portfolio impact on OASs during a brief period of heavy growth: between July and September 2003, the portfolio increased from $838 billion to $917 billion, while OASs declined by about 20bps from August to October 2003
~
cltlgroUpJ

>-c:In (3 0
§"~ o 0.(1) (1)
o.-:::l ~ 0-. .: ~ ........... en >-c:I .: ..... ~ 0 :::l"C ............ ....... ..... o ~ g:~ .: IJ:j ~ .: :;0 i!J . .: :::l ...... (1) (1) en en en
"TI
§ (ii'
~
~ n o a
1:;0 o o o Vl ...... o -.l -.l
~ ~ o· :::l
It is difficult to discern any relationship between relative current coupon OASs and portfolio growth rates
-:-:-:-:-:-:-:-:-:-:-:-:-:-:-:-:-:-:-:-:-:-:-:-:-:-:-:-:-:-:-:-:-:-:-:-:-:-:-:-:-:-:-:-:-:-:-:-:-:-:-:-:-:-:-:-:-:-:-:-:-:-:-:-:-:-:-:-:-:-:-:-:-:-:-:-:-:-:-:-:-:-:-:-:-:-:-:-:-:-:-:-:-:-:-:-:-:-:-:-:-:-:-:-:-:-:-:-:-:-:-:-:-:-:-:-:-:-:-:-:-:-:-:-:-:-:-:-:-:-:-:-:-:-:-:-:-:-:-:-:-:-:-:-:-:-:-:-:-:-:-:-:-:-:-:-:-:-:-:-:-:-:-:-:-:-:-:-:-:-:-:-:-:-:-:-:-:-:-:-:-:-:-:-:-:-:-:-:-:-:-:-:-:-:-:-:-:-:-:-:-:-:-:-:-:-:-:-:-:-:-:-:-:-:-:-:-:-:-:-:-:-:-:-:-:-:-:-:-:-:-:-:-:-:-:-:-:-:-:-:-:-:-:-:-:-:-:-:-:-:-:-:-:-:-:-:-:-:-:-:-:-:-:-:-:-:-:-:-:-:-:-:-:-:-:-:-:-:-:-:-:-:-:-:-:-:-:-:-:-:-:-:-:-:-:-:-:-:-:-:-:-:-:-:-:-:-:-:-:-:-:-:-:-:-:-:-:-:-:-:-:-:-:-:-:-:-:-:-:-:-:-:-:-:-:-:-:-:-:-:-:-:-:. ........................................................................................................................................................................................................................................................................................................................................................
140~------------------------------------------------~
120 --Phineas
~ Jl~ -0: 100 ··········Freddie Mac \~. lfl ~1~ , :e- 80 1 J I~ r ~ If' ¥jI\ Jv (f) ! ~, \ 1,A C3 60 l~~;\' I' .. A .. ~~. . J ~ Vo*~ t*.,*\ .' k,
40 'J ~ l~~r vr/·~\\Jr ~' i'\ 20
O+I-------,-------,-------,-------,-------,------~
Jan-93 Jan-95 Jan-97 Jan-99 Jan-01 Jan-03 Jan-05 Portfolio Size ($bn) $419 $621 $812 $891
10
5
c: e 0 "C ra ~ -5 c.. II)
-10
-15 +I--------,---------,--------,--------~--------,_-------,
Jan-93 Jan-95 Jan-97 Jan-99 Jan-01 Jan-03 Jan-05
76
..
..
Phineas MBSs did become more attractive to investors during the first half of the 1990s, but portfolio growth rates were similar
The relationship between Phineas and Freddie Mac current coupon OASs has been relatively stable since then
~
cltlgroUpJ

Confidential Proprietary Business Information Produced Pursuant to House Rules Fannie Mae FM-COGR 00051078
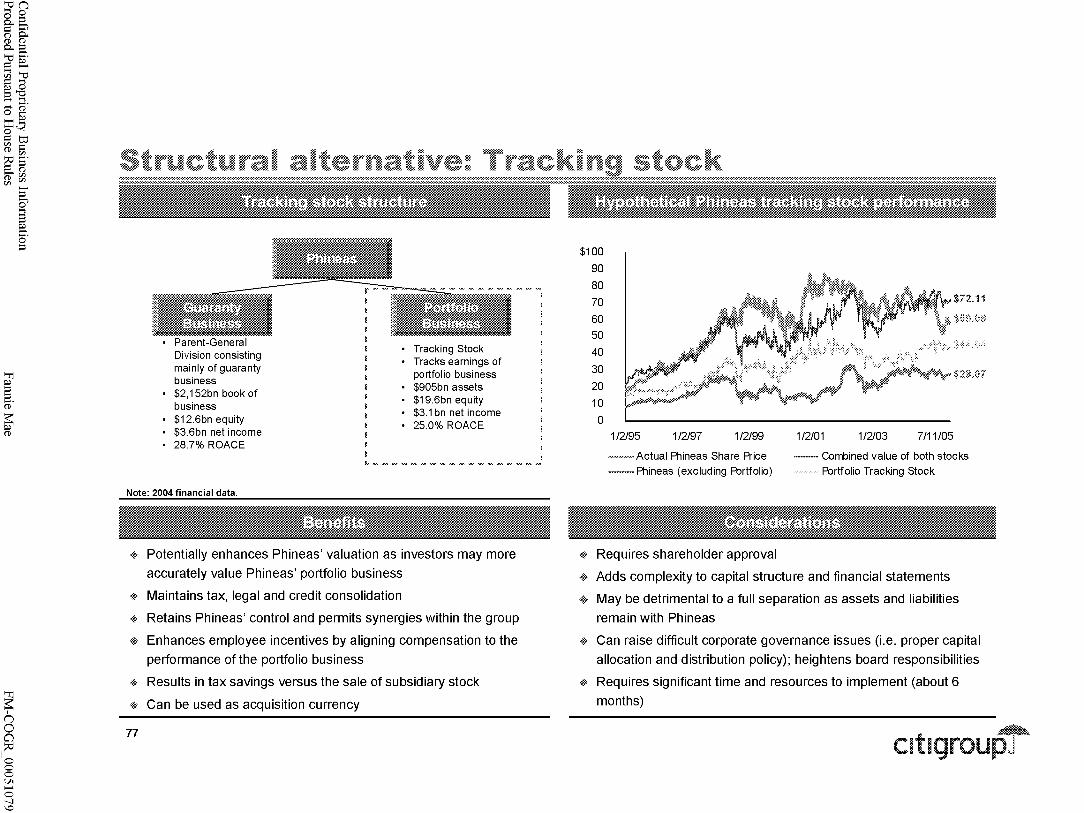
>-c:In (3 0
§"~ o 0.(1) (1)
o.-:::l ~ 0-. .: ~ ........... en >-c:I .: ..... ~ 0 :::l"C ............ ....... ..... o ~ g:~ .: IJ:j ~ .: :;0 i!J . .: :::l ...... (1) (1) en en en
"TI
§ (ii'
~
~ n o a
1:;0 o o o Vl ...... o -.l '-0
~ ~ o· :::l
Structural alternative: Trackin
Parent-General Division consisting mainly of guaranty business $2, 152bn book of business $12.6bn equity $3.6bn net income 28.7% ROACE
Tracking Stock Tracks earnings of portfolio business $905bn assets $19.6bn equity $3.1 bn net income 25.0% ROACE
_________________ 1
Note: 2004 financial data.
* Potentially enhances Phineas' valuation as investors may more
accurately value Phineas' portfolio business
*" Maintains tax, legal and credit consolidation
* Retains Phineas' control and permits synergies within the group
4- Enhances employee incentives by aligning compensation to the
performance of the portfolio business
* Results in tax savings versus the sale of subsidiary stock
* Can be used as acquisition currency
77
$72.11
$100
90
80
70
60
50
40
30
20
10
o
~m", 1/2/95 1/2/97 1/2/99
.,.,.,.,.,.,.,.,.,. Actual Alineas Share Price
~= Phineas (excluding Portfolio)
* Requires shareholder approval
1/2/01 1/2103 7111/05
-~. Combined value of both stocks
. Portfolio Tracking Stock
4- Adds complexity to capital structure and financial statements
4 May be detrimental to a full separation as assets and liabilities
remain with Phineas
4- Can raise difficult corporate governance issues (i.e. proper capital
allocation and distribution policy); heightens board responsibilities
* Requires significant time and resources to implement (about 6
months)
~
cltlgroUpJ

Confidential Proprietary Business Information Produced Pursuant to House Rules Fannie Mae FM-COGR 00051080

>-c:In (3 0
§"~ o 0.(1) (1)
o.-:::l ~ 0-. .: ~ ........... en >-c:I .: ..... ~ 0 :::l"C ............ ....... ..... o ~ g:~ .: IJ:j ~ .: :;0 i!J . .: :::l ...... (1) (1) en en en
"TI ~ :::l :::l (ii'
~ ~ (1)
"TI ~ I n 0 a
1:;0 0 0 0 Vl ...... 0 00 ......
~ ~ o· :::l
,~,~,,!,!!,!,!!,!,~""'~,~,,!!!,~,!,!,!,~,!,!,!,,",!!,!!,!!!,!!,!,!!,S,!,!""!~"",!!l~,!,~,~"""~,!!"!,!"~,!,!,!"",,,,,,,,
Credit Guarantee I Conduit
Non-conventional Mortgage
Other Consumer
Asset Management
Conventional Mortgage
Sub-prime I Home Equity
Fixed Income
Mortgage Insurance
Title Insurance
Financial Guarantor
Mortgage Origination
Mortgage Servicing
International Mortgage
Banking
Mortgage REIT
Homeowner's Insurance
78
Origination I Customer Relationship I Brand I
""""""""""""""p,i,~tn,~,\!,~!g,!:1"""""""""""""" Direct Branch Wholesale
@
(D
@
'* (&
~ (b
CD 0 0 '* @
CD 0 0 (5
(b
0 0 0
Portfolio Management
Mortgage Interest Rate Other
~ 0
~ '* 0 0 CD (b (3
(& 0
'* 0 (b 0
(D CD @ (b 0 @ (&
0 0
Phineas Relative Skill Level
Credit Risk Servicing
Mortgage Bond Other Mortgage Other
fb ()
0 0
@
CD
0 0 (b
(& 0 0 EID
(3
CD (3
EID 0 (3 0 EID 0
@High o Low
Insurance Underwriting
P&C Title
CD
0
Constraints?
Charter
Charter
Customer Conflict, HUD approval?
Customer Conflict, HUD approval?
HUD approval?
Charter
Charter
Charter
HUD approval?
Charter
Charter
Charter
Charter
~
cltlgroUpJ

>-c:In (3 0
§"~ o 0.(1) (1)
o.-:::l ~ 0-. .: ~ ........... en >-c:I .: ..... ~ 0 :::l"C ............ ....... ..... o ~ g:~ .: IJ:j ~ .: :;0 i!J . .: :::l ...... (1) (1) en en en
"TI
§ (ii'
~
~ n o a
1:;0 o o o Vl ...... o 00 N
~ ~ o· :::l
,!!!,!,!;!"",I!,~~,~,!:!,~!,!""""""""""""""""""""""""""""""""""""""""""""""""""""""""""""""""""""""""""""""""""""""""""""""""""""""""""""""""""""""""""""""",,, Current Customers .~~~~~~~~~~:~:~:~:~:~:~:~:~:~:~ Phi n e a s New Customers
(Non-Conforming Originators) (Conforming/Non-Conforming Originators) ~~~~~~~~:~:~:~:~:~:~:~.
~ Countrywide
,.. Wells Fargo
» Washington Mutual
~ GMAC Mortgage (RFC)
Conforming
I Conventional Jumbo
f> Ameriquest » First Franklin
'" New Century ~ Option One
Non-Conforming
Alt-A Sub-prime HELOC 2004 Issuance: $1,112b
(53%) yay Growth 7% 5yrCAGR
2004 Issuance: $233b 2004 Issuance: $15Bb 2D04~suance: $3B3b 2004lssuance: $3Bb (14%) YOY Growth 114% yay GmwUl aB% YOY Growth 283% yay Growth
12%, 5yr CAGR 63% ZyrCAGR 45% 5yrCAGR BO% 2yr CAGR 80% issuance mte(al 43% Issuance Rilte 56% !ssuilflce RClte 56% Issuance R.ate Low Issuance Rilte
l» Strong growth in the non-conforming market
~ Provides ability to hedge downtu rn in one seg ment of the market
l» Phineas can leverage relationships it has with current customers to tap into their non-conforming production
l» Phineas has core competency in evaluating credit risk
~. The formation of a liquid outlet for non-conforming loans may encourage more non-conforming originations from traditional lenders
~. Success will be based on ability to compete on price versus private label markets
w Issuance rates low compared to conventional mortgages; Phineas has ability to expand its mission to non-conforming sector
w Supports mission goals
~ Increased credit risk; must charge higher fees in anticipation of higher losses
w Potential regulatory scrutiny as Phineas increases its risk profile; capital requirement may increase
IS- Jumbo loans not allowable under charter; participation in this segment would require regulatory approval
IS- Long-term strength of non-conforming market is questionable; space is crowded and margins have been shrinking
~ Market competition has led to riskier products; lack of credit history limits Phineas' competitive advantage
w Most sub-prime loans are originated without mortgage insurance, so Phineas may incur significant credit enhancement fees
79 Source: Inside MBS & ABS. (a) Issuance rate is the percentage of originations that are securitized.
~
cltlgroUpJ

>-c:In (3 0
§"~ o 0.(1) (1)
o.-:::l ~ 0-. .: ~ ........... en >-c:I .: ..... ~ 0 :::l"C ............ ....... ..... o ~ g:~ .: IJ:j ~ .: :;0 i!J . .: :::l ...... (1) (1) en en en
"TI
§ (ii'
~
~ n o a
1:;0 o o o Vl ...... o 00 w
~ ~ o· :::l
,!!!,!,!;!"",I!,~~,~,!:!,~!,!""!!,!"!!,!,!,!,~,!!,,,,,!,!,!,!!,,!.!:!,~,!,!,~,!!,,!,,"""""""""""""""""""""""""'"''''''''''''''''''''''''''''''''''"""""""""",,: '* Business is operated within the GSE charter
'* Non-conforming mortgage debt outstanding grows at 15% in 2006, 10% in 2007 and 5% in 2008-2009
'* Issuance rate (securitizations / originations) is 50% in 2006, 55% in 2007, 60% in 2008 and 65% in 2009
'* Phineas' market share of securitized non-conforming mortgage debt outstanding is 2.5% in 2006, 5.0% in 2007, 10% in 2008 and 15% in 2009
¢ Guaranty fees are 30bps in 2006-2009 and losses are 5bps over same period
¢ Administrative expenses, which include mission costs (franchise fee assumed to be captured in mission costs), are 3bps of 2006 non-conforming book of business, based upon similar management estimates for existing book of business. Administrative costs grow at 5% per annum from 2007-2009
¢ Corporate overhead allocation is 3bps of 2006 non-conforming book of business, based upon similar management estimates for existing book of business. Corporate overhead expense costs grow at 5% per annum from 2007-2009
¢ Income on capital and related interest income are calculated using the same assumptions as used for the existing business estimates
80 ~
cltlgroUpJ

>-c:In (3 0
§"~ o 0.(1) (1)
o.-:::l ~ 0-. .: ~ ........... en >-c:I .: ..... ~ 0 :::l"C ............ ....... ..... o ~ g:~ .: IJ:j ~ .: :;0 i!J . .: :::l ...... (1) (1) en en en
"TI ~ :::l :::l (ii'
~ ~ (1)
~ I n 0 a
1:;0 0 0 0 Vl ...... 0 00 +-
~ ~ o· :::l
Expansion into nOi1mconforming products creates
!J!,~"~~,~,!"!!!,!!,!I~"",!,!"",~,!"!I!,~,~,,,,,~!,,,,!,,!:!,!!,~!,!!!,!,!:!,!,!I",!,!!I!!"!"""""""""""""""""""""""""""""",, Valuation Date 31-Dec-2005
Terminal Multiple 10.0x Phineas Cost of Equity (a) 7.7%
Shares Outstanding (m) 968
Diluted Shares Outstanding 968
($ in millions) 2006 2007
Pretax Income $88 $245
Income Taxes (24) (66)
Net Income $64 $179
Capital Retention Requirement (b) ($228) ($323)
Free Cash Flow ($164) ($144)
Terminal Value
Free Cash Flow/Net Income (255.64%) (80.86%)
1:'~~fflm~Q~~f§q9.i.~)i::v~i.y.~:::i¥.i.r::§:Mr~n::::::::::::::::iii::::::::::::::::::::::::::::::::::::::::::::::::::::::::::::::::::::::"~:l.rJ.:::::::::::l Source: Bloomberg. Based on projections and assumptions provided by Phineas management, adjusted by Citigroup.
(a) Calculated using the capital asset pricing model as of 07.11.05.
(b) Capital required calculated as 58.5 basis points against the single -family book of business.
Risk Free Rate
Market Risk Premium
Adjusted Beta
Marginal Tax Rate
2008
$593
(160)
$433
($711)
($279)
(64.39%)
"""""""""""""""""""""""""""""""""""""""""""""""""""""""!.~,~,'!I"i,r:!,c:t,I""IYI,~,I,~,i,p'I,~"""""""""""""""""""""",,""""""""""""""""""""""""""""""'"
:f'i 5.7% ::::JI 6 0-: .7 W, '0: 7.7 u;! 8.7 01 ()! 9.7
8.0x 9.0x 10.0x 11.0x 12.0x $4.82 $5.50 $6.18 $6.87 $7.55
4.63 4.45 4.28 4.12 4.71 5.30 5.89
7.26 6.99
6.73 6.48
2009
$1,030
(278)
$752
($891)
($139)
8,271
(18.52%)
0.28% 0.48 0.68 0.88 1.08
3" "E iii' c. OJ !2. III
4.34%
5.00
0.68
27.0%
CAGR
127%
81 ~
cltlgroUpJ
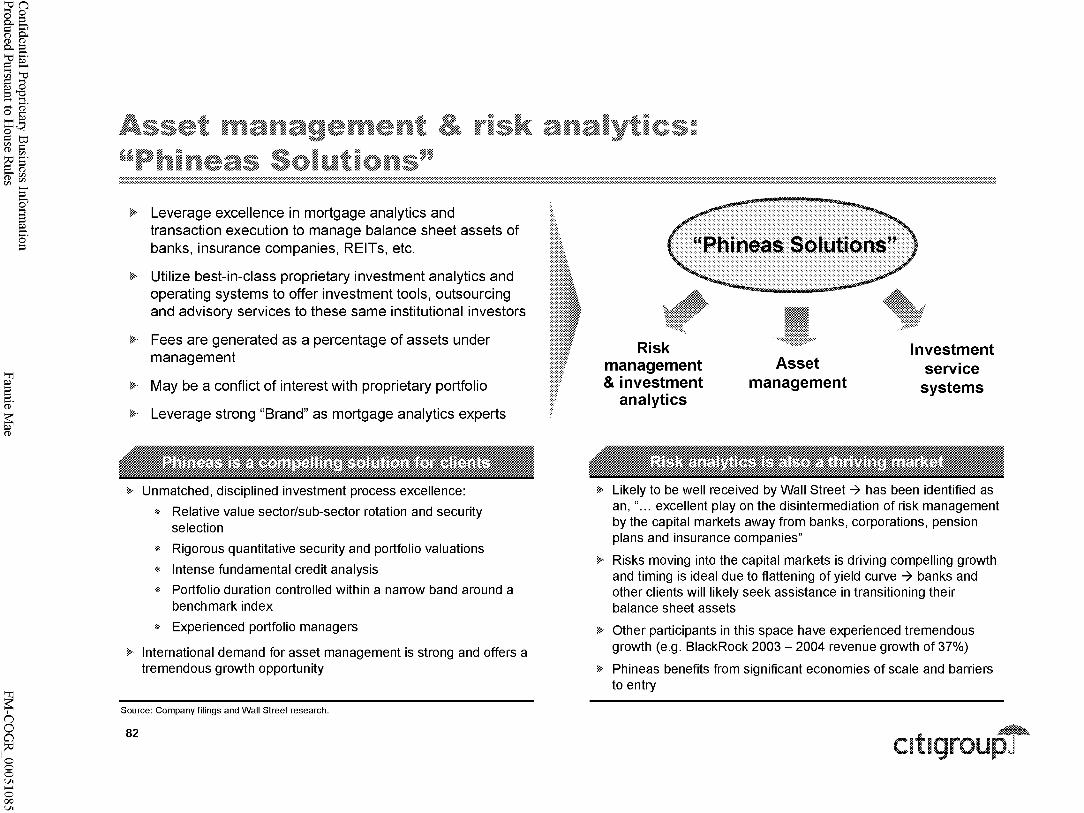
>-c:In (3 0
§"~ o 0.(1) (1)
o.-:::l ~ 0-. .: ~ ........... en >-c:I .: ..... ~ 0 :::l"C ............ ....... ..... o ~ g:~ .: IJ:j ~ .: :;0 i!J . .: :::l ...... (1) (1) en en en
"TI
§ (ii'
~
~ n o a
1:;0 o o o Vl ...... o 00 Vl
~ ~ o· :::l
Asset management & risk anal "Phineas Solutions"
'" rues:
-:-:-:-:-:-:-:-:-:-:-:-:-:-:-:-:-:-:-:-:-:-:-:-:-:-:-:-:-:-:-:-:-:-:-:-:-:-:-:-:-:-:-:-:-:-:-:-:-:-:-:-:-:-:-:-:-:-:-:-:-:-:-:-:-:-:-:-:-:-:-:-:-:-:-:-:-:-:-:-:-:-:-:-:-:-:-:-:-:-:-:-:-:-:-:-:-:-:-:-:-:-:-:-:-:-:-:-:-:-:-:-:-:-:-:-:-:-:-:-:-:-:-:-:-:-:-:-:-:-:-:-:-:-:-:-:-:-:-:-:-:-:-:-:-:-:-:-:-:-:-:-:-:-:-:-:-:-:-:-:-:-:-:-:-:-:-:-:-:-:-:-:-:-:-:-:-:-:-:-:-:-:-:-:-:-:-:-:-:-:-:-:-:-:-:-:-:-:-:-:-:-:-:-:-:-:-:-:-:-:-:-:-:-:-:-:-:-:-:-:-:-:-:-:-:-:-:-:-:-:-:-:-:-:-:-:-:-:-:-:-:-:-:-:-:-:-:-:-:-:-:-:-:-:-:-:-:-:-:-:-:-:-:-:-:-:-:-:-:-:-:-:-:-:-:-:-:-:-:-:-:-:-:-:-:-:-:-:-:-:-:-:-:-:-:-:-:-:-:-:-:-:-:-:-:-:-:-:-:-:-:-:-:-:-:-:-:-:-:-:-:-:-:-:-:-:-:-:-:-:-:-:-:-:-:-:-:-:-:-:-:-:-:. ........................................................................................................................................................................................................................................................................................................................................................
»> Leverage excellence in mortgage analytics and transaction execution to manage balance sheet assets of banks, insurance companies, REITs, etc.
»> Utilize best-in-class proprietary investment analytics and operating systems to offer investment tools, outsourcing and advisory services to these same institutional investors
~ Fees are generated as a percentage of assets under management
~ May be a conflict of interest with proprietary portfolio
~ Leverage strong "Brand" as mortgage analytics experts
w Unmatched, disciplined investment process excellence:
~ Relative value sector/sub-sector rotation and security selection
'i< Rigorous quantitative security and portfolio valuations
'i< Intense fundamental credit analysis
'i< Portfolio duration controlled within a narrow band around a benchmark index
~ Experienced portfolio managers
~. International demand for asset management is strong and offers a tremendous growth opportunity
Source: Company filings and Wall Street research.
82
Risk management & investment
analytics
.... ::.:: .... Asset
management
Investment service
systems
w Likely to be well received by Wall Street -7 has been identified as an, " ... excellent play on the disintermediation of risk management by the capital markets away from banks, corporations, pension plans and insurance companies"
»> Risks moving into the capital markets is driving compelling growth and timing is ideal due to flattening of yield curve -7 banks and other clients will likely seek assistance in transitioning their balance sheet assets
w Other participants in this space have experienced tremendous growth (e.g. BlackRock 2003 - 2004 revenue growth of 37%)
w Phineas benefits from significant economies of scale and barriers to entry
~
cltlgroUpJ

>-c:In (3 0
§"~ o 0.(1) (1)
o.-:::l ~ 0-. .: ~ ........... en >-c:I .: ..... ~ 0 :::l"C ............ ....... ..... o ~ g:~ .: IJ:j ~ .: :;0 i!J . .: :::l ...... (1) (1) en en en
"TI
§ (ii'
~
"TI ~ I n 0 a
1:;0 0 0 0 Vl ...... 0 00 0\
~ ~ o· :::l
!!!,!!,!,!"",!,~,~"""~,!"!,!!",,!!!,!,!!,,!!,ll,!,!!!,!,~,!,,,,,!,!,!,!:!"!!!,J!!,!,~,!!"!"""""""""""""""""""""""""""""""""""",,,,""""" .. Business is operated within the GSE charter
.. No additional required capital
Asset Management
.. Phineas' market share of 2006E MBS managed by institutional asset managers is 3% in 2006 and assets under management (AUM) grow at 50% per year through 2009, reaching 8% market share in 2009
.. Fees are a percentage of AUM - 28bps - and are based on the median of all 2004 institutional MBS asset managers
.. Operating margin of 35% is based on asset management industry
Risk Analytics
.. Phineas assumed to capture 3% of relevant mortgage debt outstanding(a) 2006
% Fair value of assets managed by Phineas Solutions grows at 40% per year in 2007 then 30% through 2009, based on industry growth rates. 2009 share of MOO is projected at 5%
% Fees are a percentage of AUM - 6 bps - based on Citigroup estimates .. Operating margin of 50% is assumed given Phineas' scale and low incremental costs to start up and operate the business
(a) Single and multi-family projected MDO, less GSE portfolio balances (which are assumed to equal current May/05 balances).
83 ~
cltlgroUpJ

>-c:In (3 0
§"~ o 0.(1) (1)
o.-:::l ~ 0-. .: ~ ........... en >-c:I .: ..... ~ 0 :::l"C ............ ....... ..... o ~ g:~ .: IJ:j ~ .: :;0 i!J . .: :::l ...... (1) (1) en en en
"TI
§ (ii'
~
"TI ~ I n 0 a
1:;0 0 0 0 Vl ...... 0 00 -.l
~ ~ o· :::l
Expansion into asset and risk management creates over $2 bi~lion of incremental value -:-:-:-:-:-:-:-:-:-:-:-:-:-:-:-:-:-:-:-:-:-:-:-:-:-:-:-:-:-:-:-:-:-:-:-:-:-:-:-:-:-:-:-:-:-:-:-:-:-:-:-:-:-:-:-:-:-:-:-:-:-:-:-:-:-:-:-:-:-:-:-:-:-:-:-:-:-:-:-:-:-:-:-:-:-:-:-:-:-:-:-:-:-:-:-:-:-:-:-:-:-:-:-:-:-:-:-:-:-:-:-:-:-:-:-:-:-:-:-:-:-:-:-:-:-:-:-:-:-:-:-:-:-:-:-:-:-:-:-:-:-:-:-:-:-:-:-:-:-:-:-:-:-:-:-:-:-:-:-:-:-:-:-:-:-:-:-:-:-:-:-:-:-:-:-:-:-:-:-:-:-:-:-:-:-:-:-:-:-:-:-:-:-:-:-:-:-:-:-:-:-:-:-:-:-:-:-:-:-:-:-:-:-:-:-:-:-:-:-:-:-:-:-:-:-:-:-:-:-:-:-:-:-:-:-:-:-:-:-:-:-:-:-:-:-:-:-:-:-:-:-:-:-:-:-:-:-:-:-:-:-:-:-:-:-:-:-:-:-:-:-:-:-:-:-:-:-:-:-:-:-:-:-:-:-:-:-:-:-:-:-:-:-:-:-:-:-:-:-:-:-:-:-:-:-:-:-:-:-:-:-:-:-:-:-:-:-:-:-:-:-:-:-:-:-:-:-:-:-:-:-:-:-:-:-:-:-:-:-:-:-:-:. ........................................................................................................................................................................................................................................................................................................................................................
Valuation Date Terminal Multiple (a) Phineas Cost of Equity (b) Shares
Growth in FCF 2010
Revenues
Pretax Income
Income Taxes
Franchise Fee
Net Income
Capital Retention Requirement
Free Cash Flow Terminal Value
Free Cash Flow I Net Income
(b) Calculated using the capital asset pricing model.
~: 6.7% :::I' 0-' 6.7 w: -' 0: 7.7
-' 8.7 CI)'
31-Dec-2005 Rf 4.34% 19.6x Market Risk Premium 5.00 7.7% Beta 0.68
968 Tax Rate 27.0%
38.09%
~Bw:ttln;m
2006 2007 2008 2009
$55 $79 $106 $145
(15) (21) (29) (39)
(2) (3) (4) (5)
$38 $54 $74 $101
$0 $0 $0 $0
$38 $64 $74 $101 $2,716
100% 100% 100% 100%
""""""""""""""""""""""""""""""""""""""""""""""",!~,~~,i"':I,~,I",IYI,':!,I,~,i.P,I,~"",,,,"""""""""""""""""""""""""""""""""""""""""'" 17.6x 18.6x 19.6x 20.6x 21.6x
$2.25 $2.37 $2.48 $2.60 $2.71 2. 17 tttttt:];M28 mm))))))))j:mMlI mm))))))))jMsi!r))( 2.61
84 0' O~ 9.7
2.09 2.02 1.95 2.05 2.15 2.25
2.52 2.43 2.35
~
cltlgroUpJ

>-c:In (3 0
§"~ o 0.(1) (1)
o.-:::l ~ 0-. .: ~ ........... en >-c:I .: ..... ~ 0 :::l"C ............ ....... ..... o ~ g:~ .: IJ:j ~ .: :;0 i!J. .: :::l ...... (1) (1) en en en
"TI
§ (ii'
~
~ n o a
1:;0 o o o Vl ...... o 00 00
~ ~ o· :::l
.. e Insurance
2004 MI Market Share Insurer Market Share Risk in Force
(a) Originators will be able to sell loans directly to Phineas without using mortgage insurers as intermed iaries
(b) Phineas no longer has to use mortgage insurers on loans with L TVs greater than 80%
MGIC PMI Radian AIG Genworth Republic Triad
23.2% $168 18.7 136 15.9 115 13.5 98 13.5 98 10.3 75 4.8 35
"* Ability to leverage existing relationships with mortgage originators "* Phineas can utilize core competency in evaluating mortgage
credit risk 4> Vertical integration allows disintermediation of mortgage insurers;
elimination of third-party may reduce originator costs and lead to lower mortgage rates
"* IBES analysts predict long-term growth of approx. 12% 4> Historical mortgage insurer forward PIE multiples have ranged
from 6.0-13.0x and are currently at 8.6x "* Attractive margins - mortgage insurer guaranty fees are
approximately 70bps versus losses of 30bps
85 Source: Inside MBS & ABS.
"* Growth in net insurance in force has been stagnant since 2000 ($ in Billions)
$800 $739 $733 $725
$698 -700
600
500
I $406 400
300
200
100
I- ------• • • m 1994 1995 1996 1997 1998 1999 2000 2001 2002 2003 2004
"* Industry growth has slowed in 2004; business is highly cyclical, tied to growth of conforming originations
4> As such, entrance into mortgage insurance does not provide a hedge against Phineas' current business
"* May not be allowable under charter; participation may require regulatory approval
4> Increased risk profile due to first loss position may increase capital requirement
"* Industry is comprised of well-established players who have maintained consistent market shares
4> Growth of sub-prime market and new products (piggyback seconds) marginalizing mortgage insurers
"* May endanger relationships with originators with captive reinsurers
~
cltlgroUpJ

>-c:In (3 0
§"~ o 0.(1) (1)
o.-:::l ~ 0-. .: ~ ........... en >-c:I .: ..... ~ 0 :::l"C ............ ....... ..... o ~ g:~ .: IJ:j ~ .: :;0 i!J . .: :::l ...... (1) (1) en en en
"TI
§ (ii'
~
~ n o a
1:;0 o o o Vl ...... o 00 '-0
~ ~ o· :::l
""""",~,~!"J"!!,II,!"",!,!!,!,!:!"~!,!!,!!,!,,,,!,!!I!!,!!,!,~,!!,,",!,!,!,~"!!!J!,!,!"~"!!,!""""""""",,,,,,,,,,,,,,,,,,,,,,,,,,,,,,,,,,,,,,,,,,,""""""" '* Business is operated within the GSE charter
'* Single family mortgage debt outstanding based upon Phineas' estimates
'* Mortgage insurer penetration rate is 9% 2006-2009
'* Phineas' market share of insured mortgage debt outstanding is 2.5% in 2006, 5.0% in 2007, 10% in 2008 and 15% in 2009
'* Guaranty fees are 70bps in 2006-2009 and losses are 30bps over the same period
¢ Administrative expenses, which include mission costs (franchise fee assumed to be captured in mission costs), are 3bps of 2006 mortgage insurance book of business, based upon similar management estimates for existing book of business. Administrative costs grow at 5% per annum from 2007-2009
¢ Corporate overhead allocation is 3bps of 2006 mortgage insurance book of business, based upon similar management estimates for existing book of business. Corporate overhead expense costs grow at 5% per annum from 2007-2009
¢ Income on capital and related interest income are calculated using the same assumptions as used for the existing business estimates
86 ~
cltlgroUpJ

>-c:In (3 0
§"~ o 0.(1) (1)
o.-:::l ~ 0-. .: ~ ........... en >-c:I .: ..... ~ 0 :::l"C ............ ....... ..... o ~ g:~ .: IJ:j ~ .: :;0 i!J . .: :::l ...... (1) (1) en en en
"TI ~ :::l :::l (ii'
~ ~ (1)
"TI ~ I n 0 a
1:;0 0 0 0 ~ -0 ~ 0
~ ~ o· :::l
Expansion into mortgage insurance creates
!J!,~"~~,~,!"!!!,!!,!I~"",!~"",~,!"!I!,~,~,,,,,~!,,,,!,,!:!,!!,~!,!!!,!,!:!,!,!I",!,!!I!;!"!"""""""""""""""""""""""""""""",, Valuation Date 31-Dec-2005 Risk Free Rate 4.34%
Terminal Multiple 8.5x Market Risk Premium 5.00 Phineas Cost of Equity (a) 7.7% Adjusted Beta 0.68
Shares Outstanding (m) 968 Marginal Tax Rate 27.0%
Diluted Shares Outstanding (m) 968
mmmmmmmmmmmmmmmmmmmmmmmmmmmmmmmmmmmmw.V~WlTIillfmNr~~tlW· mmmmmmmmmmmmmmmmmmmmmmmmmmmmmmmmmmmm ($ in millions) 2006
Pretax Income $74
Income Taxes (20)
Net Income $54
Capital Retention Requirement (b) ($112)
Free Cash Flow ($58) Terminal Value
Free Cash Flow/Net Income (108.42%)
1:!~~tim.~~~~tg~~!~~J(#.!~~]mt::~:11 iii:::::::::::::::::::::::::::::::::::::::::::::::::::::::::::::::::::::::::::::::::::::::]i,~:l.p.l::::::::] Source: Bloomberg. Based on Phineas estimates, adjusted by Citigroup.
(a) Calculated using the capital asset pricing model as of 07.11.05.
(b) Capital required calculated as 58.5 basis points against the single -family book of business.
2007 2008
$170 $377
(46) (102)
$124 $275
($127) ($272)
($3) $3
(2.48%) 1%
"""""""""""""""""""""""""""""""""""""""""""""""""""""""!.~,~,'!I"i,~"c:t,I""IYI"~,I,~,ip,I,~",,,,,,,,,,,,,,,,,,,,,,,,,,,,,,,,,,,,,,,,,,,"""""""""""""""""""""""""""""""" 6.5x 7.5x 8.5x 9.5x 10.5x
b; ~7% -. $2.55 $2.93 $3.32 $3.70 $4.08
~: 6.7 w' _: 7.7 o· u! 8.7
2009
$611
(165)
$446
($307)
$139 3,941
31%
3" "E iii' c. OJ t1) 87 81 9.7
2.45 2.36 2.27 2.19 2.52 2.85 3.18
3.93 3.78 3.64 3.51
0.28% 0.48 0.68 0.88 1.08 iii ~
cltlgroUpJ

Confidential Proprietary Business Information Produced Pursuant to House Rules Fannie Mae FM-COGR 00051091

>-c:In (3 0
§"~ o 0.(1) (1)
o.-:::l ~ 0-. .: ~ ........... en >-c:I .: ..... ~ 0 :::l"C ............ ....... ..... o ~ g:~ .: IJ:j ~ .: :;0 i!J . .: :::l ...... (1) (1) en en en
"TI
§ (ii'
~
~ n o a
1:;0 o o o Vl ...... o '-0 N
~ ~ o· :::l
,~,~"!,!!,!,!!,!"",!,~,~,!!"!,~"",!,!,!"~",,,!!,,!!,,,,,~,,~,!I!!!,!!,!"""!,!,!,!I",~,!""~,!"!,~I~,!,!:!"~!"""""""""",,,,,,,, .. In light of recent accounting issues as well as inherent complexities of Phineas' business, Phineas should
take the following steps to restore investor relations
... Quarterly earnings release statements * Include discussion connecting fair value and core earnings and how management runs the business @ Extensive discussion of changes in fair value and core earnings (include non-restated periods) * Define non-GAAP operating measure
... Investor day discussion ~ Describe mission / charter e; Outline and describe key business lines
@
How does Phineas make money? o Business description o Steps in the process
What are the key risks? Discuss management philosophy
Growth / mission Risk management
~ Credit risk management Underwriting guidelines Collateral protection Diversification
~ Interest rate risk management Define risks - convexity, duration, prepayment, etc. How does active management of duration gap maximize shareholder value? Chart aligning key risks with primary hedge techniques (includes resecuritization), including summary description of payout in various interest rate scenarios Define duration gap
88 ~
cltlgroUpJ

>-c:In (3 0
§"~ o 0.(1) (1)
o.-:::l ~ 0-. .: ~ ........... en >-c:I .: ..... ~ 0 :::l"C ............ ....... ..... o ~ g:~ .: IJ:j ~ .: :;0 i!J . .: :::l ...... (1) (1) en en en
"TI
§ (ii'
~
~ n o a
1:;0 o o o Vl ...... o '-0 w
~ ~ o· :::l
,~,~"!,!!,!,!!,!"",!,~,~,!!"!,~"",!,!,!"~",,,!!,,!!,,,,,~,,~,!I!!!,!!,!"""!,!,!,!I",~,!""~,!,,!,~,,!,~,!,!:!,,~!,,,,l:~!:,!::d} .. Financial disclosure (purely objective and analytical discussion)
89
@ Required accounting disclosures
@
Simple description of how Phineas conducts business
Restated financial statements and footnotes
o Include in a series of tables or charts
New accounting policies
Other information required by accounting / legal
Comparison of pre- and post restatement results for 2002, 2003, and 2004
Detailed accounting errors and other changes
o Description of each category
o Reconciliation by category
Line-by-line statement income statement reconciliation
Qualitative and quantitative
*' Core earnings or the non-GAAP measure discussion
Description of how core earnings non-GAAP measure is calculated
Effect of the restatement on core earnings non-GAAP measure
*' Key interest rate risk metrics
Definitions
Effect of the restatement on key interest rate metrics
~
cltlgroUpJ

Confidential Proprietary Business Information Produced Pursuant to House Rules Fannie Mae FM-COGR 00051094

Confidential Proprietary Business Information Produced Pursuant to House Rules Fannie Mae FM-COGR 00051095

>-c:In (3 0
§"~ o 0.(1) (1)
o.-:::l ~ 0-. .: ~ ........... en >-c:I .: ..... ~ 0 :::l"C ............ ....... ..... o ~ g:~ .: IJ:j ~ .: :;0 i!J . .: :::l ...... (1) (1) en en en
"TI
§ (ii'
~
~ n o a
1:;0 o o o Vl ...... o '-0 0\
~ ~ o· :::l
,~~,!!!"I!,!,~,~,!,!,!!"",!!!,!,~~!,!"",!,!,!,!,!"!!,!,,~,!,,"""""""""""""""""""""""""""""""""""""""""""""""""""""""""""""""""""""""""""" Institution Ticker
Government Sponsored Enterprises
7/1112005 Forward Price I Market Cap 2006 PIE Book(a)
2006 PEG
current Dividend Yield (b)
I Phineas $57,164 8.3x 2.2x 83% 1.8% I
Freddie Mac FRE $45,529 9.4x 1.7x 99% 1.8%
Mortgage Banks Countrywide Financial Corp. CFC $23,067 8.7x 2.2x 73% 1.4% Indymac Bancorp Inc. NDE 2,655 8.9 2.1 59 3.4 PHH Corp. PHH 1,408 NA 0.7 NA NM
Depositories wi Mortgage Platforms Bank Of America Corp. BAC $181,839 10.2x 1.8x 113% 4.0% Wells Fargo & Co. WFC 104,159 12.2 2.8 111 3.1 National City Corp. NCC 22,425 10.8 1.8 135 4.0 North Fork Bancorporation NFB 13,989 11.4 1.6 106 3.0
MuJti-Famify Banks New York Community Bancorp Inc. NYB $4,902 12.0x NM 120% 14.7% Independence Community Bank Corp. ICBC 3,110 12.0 1.4 120 7.6
Thrifts Washington Mutual Inc. WM $35,895 10.3x 1.7x 103% 4.5% Golden West Financial Corp. GDW 20,223 12.3 2.8 98 0.4
Financial Guarantors MBIA Inc. MBI $8,479 10.0x 1.3x 80% 1.8% Ambac Financial Group ABK 7,682 10.1 1.5 75 0.7 Assured Guaranty Ltd. AGO 1,741 10.2 1.2 79 0.5
Mortgage Jnsurers MGIC Investment Corp. MTG $6,153 9.7x 1.5x 81% 0.5% Radian Group Inc. RDN 4,146 8.4 1.2 70 0.2 PMI Group Inc. PMI 3,703 8.6 1.2 71 0.5
Residential MBS REITs Annaly Mortage Mgmt Inc. NLY $2,131 10.2x 1.4x 203% 10.2% Redwood Trust Inc. RWT 1,313 7.8 1.5 97 15.6 MFA Mortgage Investments Inc. MFA 592 8.8 0.9 195 10.0 Anworth Mtg Asset Corp. ANH 467 8.3 1.0 NA 11.0 Luminent Mortgage Capital LUM 417 8.3 1.0 NA 13.2
Commercial MBS REITs Newcastle Investment Corp. NCT $1,323 9.9x 130.0x 105% 8.3% Anthracite Capital Inc. AHR 639 9.5 1.4 191 9.3 Capital Trust Inc. CT 522 12.6 1.7 158 6.4
Source: 100, SNL Datasource.
(a) Book Value as on December 31, 2004. Phineas book value equals $35.5 billion total equity less $9.108 billion in preferred shares, per Phineas management.
(b) Last quarter annualized. 90 ~
cltlgroUpJ
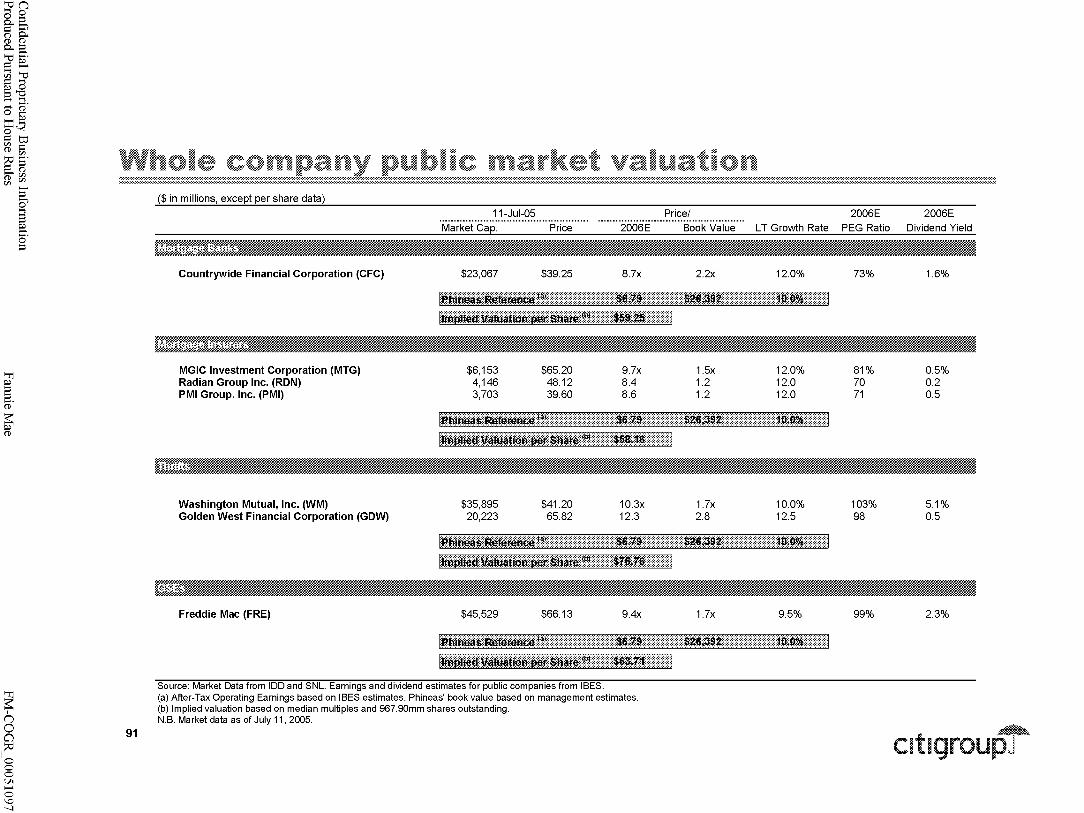
>-c:In (3 0
§"~ o 0.(1) (1)
o.-:::l ~ 0-. .: ~ ........... en >-c:I .: ..... ~ 0 :::l"C ............ ....... ..... o ~ g:~ .: IJ:j ~ .: :;0 i!J . .: :::l ...... (1) (1) en en en
"TI
§ (ii'
~
~ n o a
1:;0 o o o Vl ...... o '-0 -.l
~ ~ o· :::l
""""""!!,~,!,!""~,~,!!:!,J:.!,!"!:!,l!",,,~,,!:!,!:!,!,,!,~,,,,,!!:!,!,~,~!,!,,",!,!,!,,!:!,!,!,!,,~,,!:!"'"''''''''''''''''''''''''''''''''''''''''''''''''''''''''''''""""""""""""",,,
91
($ in millions, except per share data)
Countrywide Financial Corporation (CFC)
MGIC Investment Corporation (MTG) Radian Group Inc. (RON) PMI Group, Inc. (PMI)
Washington Mutual, Inc. (WM) Golden West Financial Corporation (GOW)
Freddie Mac (FRE)
11-Jul-05 Price/
$23,067 $39.25 8.7x 2.2x 12.0%
wmiMiiMR~f&t&i~Mm :\\\\\\\\\\\\]i.ij~'t$.=: :\\\\\\]I~~M~~~: :\\\\\\\\mdijJ).%)\\\1 l:miPimdWiiWit16iiiifsfiii.:m: )))Jm.U~ ::)))H
$6,153 4,146 3,703
$65.20 48.12 39.60
9.7x 8.4 8.6
1.5x 1.2 1.2
12.0% 12.0 12.0
Il#:6jijMiiJiiiiMMEW1U))))))))))::::::::$.ijW, ))))))):I~ij@~1 )))))))))Aij;jM4 ))))1
I:MlmmWvMMMWWM~ijw.M~1: )))::$,~g;", ))):::::1
$35,895 20,223
$41.20 65.82
10.3x 12.3
1.7x 2.8
10.0% 12.5
1:#ijMWi~]$.f~f:$.ijMfU::::::::::::::::::::::::::::::::::::::::::::::::~~*-t~ :::::::::::::::::::::::::::]i.g~;j~g ::::::::::::::::::::::::::::?::::@ij;qijU??:::J I:tMPimij]diiiitjijWPiFijMMn~ ))):::lIM~: ))))1
$45,529 $66.13 9.4x 1.7x 9.5%
1:#ijMWiijiif~f$.ij~JfU?:::m:::m:::m:::m:::m:::m??~~§l~ ?:::m:::m:::m?:::~g~@~g :::m:::m:::m:::m:::m:::m@ij@i ???:J IJffipijdNiiiidijifWfs.6iiijWr: ::::::::)J@.~m1 ::))))1
Source: Market Data from IDD and SNL. Earnings and dividend estimates for public companies from IBES. (a) After-Tax Operating Earnings based on IBES estimates. Phineas' book value based on management estimates. (b) Implied valuation based on median multiples and 967.90mm shares outstanding. N.B. Market data as of July 11, 2005.
2006E
73%
81% 70 71
103% 98
99%
2006E
1.6%
0.5% 0.2 0.5
5.1% 0.5
2.3%
~
cltlgroUpJ

>-c:In (3 0
§"~ o 0.(1) (1)
o.-:::l ~ 0-. .: ~ ........... en >-c:I .: ..... ~ 0 :::l"C ............ ....... ..... o ~ g:~ .: IJ:j ~ .: :;0 i!J . .: :::l ...... (1) (1) en en en
"TI
§ (ii'
~
"TI ~ I n 0 a
1:;0 0 0 0 ~ -0 ~ 00
~ ~ o· :::l
Price to book liS ROE analysis for whole company,
,!,!"!'!,iI"!,'!""!!!,!!'!"!,!,l!"",!,!'!,!!",,,,!!'!,!;!,,!,!,!,,,,,!!,,!!'!,,!,,!,l,:""""""""""""""""""""""""""""""""""""""""""""""""""""""""""""""""""""""""""""""""
2.0
E1.5 ~ 0 0 1.0 CIl
CII U ~ 0.5
0.0
0.0
'1 '" 9047%.'< + 4.86% R2 '" 37.87%
2.0 4.0 6.0
3.0
2.5
>< :; 2.0 0 0 CIl 1.5
CII .!:! 1.0 ... a.
0.5
0.0
0.0
y" O.04K + 0.9975 R' '" i6.67%
GDW .::,- .:,. WFC
.:" CFC
NF;~~-~ ICBC .:,.,:.·:·:'PMI::;' RDN
RWT
MFA ANH LUM
5.0 10.0
MTG _ .::. ABK
~,,:I:::, ........... ::: ..... ::: ...... RDN
15.0
ROE(%)
20.0
2.0
E 1.5 ~ 0
25.0 30.0
y '" 2.00%x + -1 i 5.14%
R2 '" 3.18%
PMI AGO g 1.0
CII u ~ 0.5
0.0
8.0 10.0 12.0 14.0 16.0 0.0 2.0 4.0 6.0
ROE(%)
.::,- WM :;:. NYB .::. ABK
':::: .......... -.............. -.............. -.............. -.............. -•.•.•.....
'::'- MBI ICBC
AGel'"
8.0 10.0 12.0 14.0 16.0
ROE(%)
92 Note: Current Price to Book regressed against 2006E ROE. ~
cltlgroUpJ

>-c:In (3 0
§"~ o 0.(1) (1)
o.-:::l ~ 0-. .: ~ ........... en >-c:I .: ..... ~ 0 :::l"C ............ ....... ..... o ~ g:~ .: IJ:j ~ .: :;0 i!J . .: :::l ...... (1) (1) en en en
"TI
§ (ii'
~
"TI ~ I n 0 a
1:;0 0 0 0 Vl ...... 0 '-0 '-0
~ ~ o· :::l
,~,~,!"~,!"",!,~"""!!,~~,!!:"".!,!"",~~,~",,,!,!!,!!,!,l,!,!,,!""!~,~"",I!,~,!:!""""""""""""""""""""""""""""""",,,,,,,,,,,,,,,"""""""""""""""
2.0
E 1.5 .>0: 0 0
1.0 CIl
CII U
~ 0.5
0.0
0.0
93
3.0
2.5
>< :; 2.0 0
g 1.5
CII .!:! 1.0 ... a.
0.5
0.0
0.0
.:::. CT .::. NCT
y z:. 3J)7'1.x + 1 "H'1.32% R2 "1D.23%
GDIN .::. "::' WFC
NFB .:: ... :::: .... :.~ .. ::: .. ··:.;k··}·····~~:~·~~~······ .... ······::::··NCC"·············.:. RWT
5.0
.::::::. AHN'::' LUM MFA
10.0 15.0
ROE(%)
ao 25
20.0 25.0 30.0
y == :U16'%x + 135.45% RL == 2<Ul7%
.::. WFC
>< :; 20 0 0 CIl 1.5
.:::. AHR .:. NL Y .:" RWT .,.,.,.-.-.-.-.-•.•.•.•.•.•..•.•.•.•.•.• ,.,.,.,., .................................. ,.,.,.,.,.: .................................. ;.;.;.;.; .................................. ;.;.; .
MFA :;::::: ANH'::' LUM
,r .. 'j\i'i=ii .............. ·.·.·························· ... ::: .. ·.BA·c·· .... ······························· .... ·:::: NCC
y z:. D.40%x + 126.SJ% R2 z:.(U16%
5.0 10.0 15.0
ROE(%)
20.0 25.0
Note: Current Price to Book regressed against 2006E ROE.
30.0
~ 1.0 ... a.
Q5
QO QO 5.0 10.0 15.0
ROE(%)
20.0 25.0
~
cltlgroUpJ

>-c:In (3 0
§"~ o 0.(1) (1)
o.-:::l ~ 0-. .: ~ ........... en >-c:I .: ..... ~ 0 :::l"C ............ ....... ..... o ~ g:~ .: IJ:j ~ .: :;0 i!J . .: :::l ...... (1) (1) en en en
"TI ~ :::l :::l (ii'
~ ~ (1)
~ 1 n 0 a
1:;0 0 0 0 Vl ...... ...... 0 0
~ ~ o· :::l
""""""!!,~,!,!""~,~,!!:!,J:.!,!"!:!,l!",,,~,,!,!,~,~,!!,!'!!,!,~,,,,,~!,!,!!,,",!!,,~,~"""""""""""""'"''''''''''''''''''''''''''''''''''''''''''''''''''''"""""""""""",,,
94
Valuation Date 31-Dec-2005 Risk Free Rate
Terminal Multiple 10.0x Market Risk Premium Phineas Cost of Equity (a) 7.7% Beta
Projected Long Term Growth 5.0 Marginal Tax Rate
Shares Outstanding (m) 968 Franchise Fee (After-tax)
($ in millions) 2006 2007 2008
Projected EPS (b) $7.15 $7.51 $7.88
Implied Net Income 6,921 7,267 7,630
Franchise Fee (5% After-tax) (346) (363) (381)
Net Income $6,574 $6,903 $7,248
Capital Retention Requirement (e) (1,837) (1,811) (1,826)
Free Cash Flow $4,737 $5,092 $5,422
Terminal Value
Free Cash Flow/Net Income 68% 70% 71%
1::§q~ff.~Wi;9.ijj~ij@~ij~~~ iii:::::::::::::::::::::::::::::::::::::::::::::::::::iii:::::::::::::::::::::::::::::::::::::::::::::::::::::::::::::::::::::::::::::::::::::::::::::~l~WJ,:f::::::::::1 Source: Bloomberg and IBES. Market data as of July 11,2005. Capital projections based on projections and assumptions provided by Phineas management.
(a) Calculated using the capital asset pricing model.
(b) 2007-2009 EPS based on growth rate of 5.0%.
(c) Capital required calculated as 58.5 basis points against each of the single and multi-family books of business and 2.05% against assets in the portfolio.
:f'i 5.7% g.: 6.7 w: '0: 7.7 u;! 8.7 01 ()! 9.7
"""""""""""""""""""""""""""""""""""""""""""""""""""""""!~,~,'!I"i,~,c:l,I""IYI"~,I,~,i,p'I,~""""""""""""""""""""",,,,""""""""""""""""""""""""""""""'" 8.0x 9.0x 10.0x 11.0x 12.0x
$71.81 $78.43 $85.06 $91.68 $98.30 69.42 67.13 64.94 62.84 68.55 74.25 79.96
94.92 91.70 88.62 85.67
2009
$8.28
8,011
(401)
$7,611
(1,837)
$5,773
80,113
72%
0.28% :3" 0.48 ~"E
0.68 0.88 1.08
iii' c. OJ t1)
iii
4.34%
5.00
0.68
27.0%
5.0
~
cltlgroUpJ

>-c:In (3 0
§"~ o 0.(1) (1)
o.-:::l ~ 0-. .: ~ ........... en >-c:I .: ..... ~ 0 :::l"C ............ ....... ..... o ~ g:~ .: IJ:j ~ .: :;0 i!J . .: :::l ...... (1) (1) en en en
"TI ~ :::l :::l (ii'
~ ~ (1)
~ n o a
1:;0 o o o Vl ...... ...... o ......
~ ~ o· :::l
,~,!"!!,S"!"!"",!!,!!:!"!,,!,l,~,,,,,~,!:!,,~,,!,,!,~,,,,,!!:!,!,~,~!,~",,!,~,,!,!:!,!!,!,~,!.!"'"''''''''''''''''''''''''''''''''''''''''''''''''''''''''''''''''''""""""""""""""""",,, ($ in millions, except per share data)
MBIA, Inc. (MBI) Ambac Financial Group (ABK) Assured Guaranty Ltd (AGO)
MGIC Investment Corp. (MTG) Radian Group, Inc. (RON) PMI Group, Inc. (PMI)
11-J ul-05 Price/
$8,479 7,682 1,741
$62.62 70.94 23.22
10.Ox 10.1 10.2
1.3x 1.5 1.2
12.5% 13.5 13.0
1:~:I.@:W@~i.i.@i?Ri.i~f:~@W@ )))))))))):::#@;M: ))))))):::~1@;"~ )))))))))):::~;i.:w.dmmmmmmJ IMiiMim.lW~Mit@M@tjmitM!1lU)))))):)~@';$.~ )))))J
$6,153 $65.20 9.7x 1.5x 12.0% 4,146 48.12 8.4 1.2 12.0 3,703 39.60 8.6 1.2 12.0
1:$.:i@ijffj@Mj~iiMiffiM@ )))))))))):::::$.Mm )))))))):O~;@.~: ))))))))))::~;w4: )))):::H l#iiP:Mjfv~Wjt@MImMm@H~L)mm))))m~~;~~: :)))):J
Source: Market Data from IDD and SNL. Earnings and dividend estimates for public companies from IBES. (a) After-Tax Operating Earnings and Book Value based on company projections. (b) Implied valuation based on median multiples and 967.90mm shares outstanding. N.B. Market data as of July 11,2005.
95
2006E
80% 75 79
81% 70 71
2006E
1.8% 0.7 0.5
0.5% 0.2 0.5
~
cltlgroUpJ
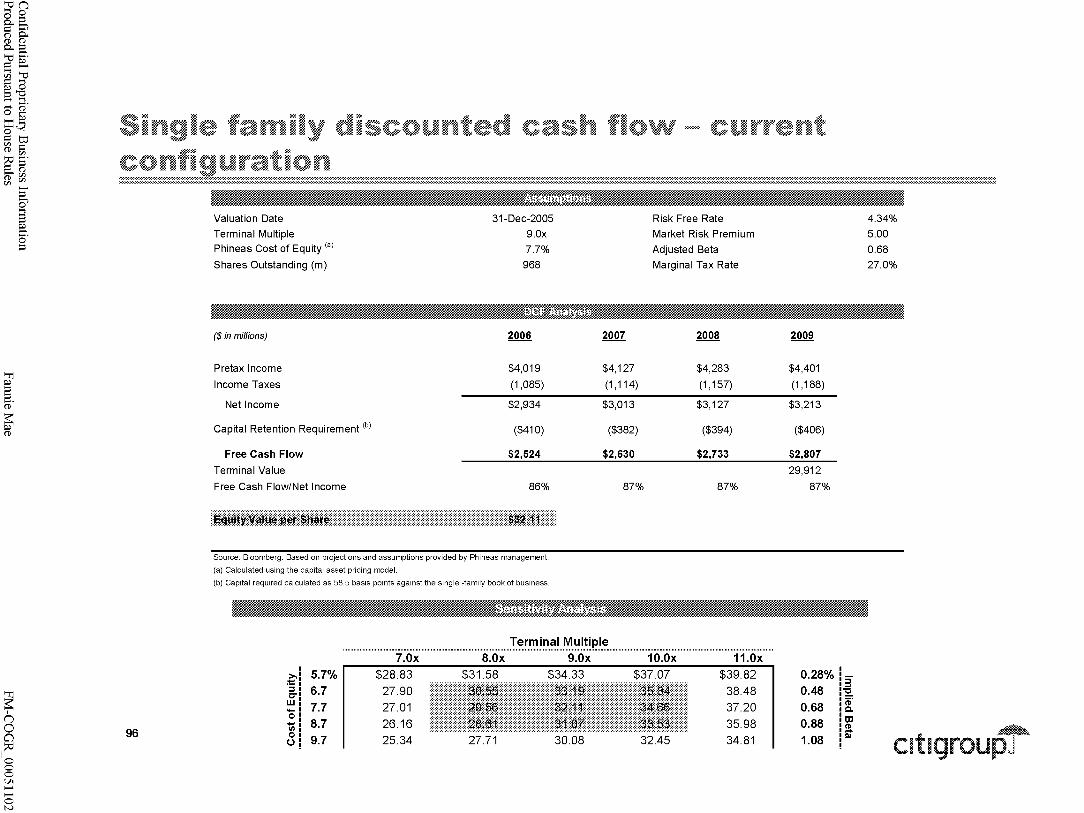
>-c:In (3 0
§"~ o 0.(1) (1)
o.-:::l ~ 0-. .: ~ ........... en >-c:I .: ..... ~ 0 :::l"C ............ ....... ..... o ~ g:~ .: IJ:j ~ .: :;0 i!J . .: :::l ...... (1) (1) en en en
"TI ~ :::l :::l (ii'
~ ~ (1)
"TI ~ I n 0 a
1:;0 0 0 0 ~ --0 N
~ ~ o· :::l
Singie family discounted cash flow ~ current
~,~,!!,!!"S,!:!,~,!!,!,~,!!,,""""""""""""""""""""""""""""""""""""""""""""""""""""""""""""""""""""""""""""""""""""""""""""""""""""""""""""""""""""""""""""""""""
96
Valuation Date 31-Dec-2005
Terminal Multiple 9.0x Phineas Cost of Equity (a) 7.7%
Shares Outstanding (m) 968
($ in millions) 2006
Pretax Income $4,019
Income Taxes (1,085)
Net Income $2,934
Capital Retention Requirement (b) ($410)
Free Cash Flow $2,524
Terminal Value
Free Cash Flow/Net Income 86%
1:~qiji.~Y:Y~I.y.~::p.~f:§hijr.H:::::::::::::::::::::::::::::iii::::::::::::::::::::::::::::::::::::::::::::::::::::::::::::::::::::::::::::::::::::::::::::::::::::~~gA:H::]
Source: Bloomberg. Based on projections and assumptions provided by Phineas management.
(a) Calculated using the capital asset pricing model.
(b) Capital required calculated as 58.5 basis points against the single -family book of business.
Risk Free Rate
Market Risk Premium
Adjusted Beta
Marginal Tax Rate
2007 2008
$4,127 $4,283
(1,114) (1,157)
$3,013 $3,127
($382) ($394)
$2,630 $2,733
87% 87%
"""""""""""""""""""""""""""""""""""""""""""""""""""""""!~,~,':I::I,i,~,~,I""IYI"~"I,~,i"pl,~""""""""""""""""""""",,,,""""""""""""""""""""""""""""""'"
~i ~7% ~: 6.7 w: ~: 7.7 u! 8.7 o. u! 9.7
7.0x 8.0x 9.0x 10.0x 11.0x $28.83 $31.58 $34.33 $37.07 $39.82
27.90 27.01 26.16 25.34 27.71 30.08 32.45
38.48 37.20 35.98 34.81
2009
$4,401
(1,188)
$3,213
($406)
$2,807
29,912
87%
0.28% :3" 0.48 ~"E
0.68 0.88 1.08
iii' c. OJ t1)
iii
4.34%
5.00
0.68
27.0%
~
cltlgroUpJ

>-c:In (3 0
§"~ o 0.(1) (1)
o.-:::l ~ 0-. .: ~ ........... en >-c:I .: ..... ~ 0 :::l"C ............ ....... ..... o ~ g:~ .: IJ:j ~ .: :;0 i!J. .: :::l ...... (1) (1) en en en
"TI ~ :::l :::l (ii'
~ ~ (1)
~ I n 0 a
1:;0 0 0 0 Vl ...... ...... 0 W
~ ~ o· :::l
Singie family discounted cash flow as a private
~,~,!!!,J:.!,~"!!,l!"""""""""""""""""""""""""""""""""""""""",,"""""""""""""""""""""""""""""""""""""""""""""""""""""""""""""""""""""""""""""""""""""""""""""""""""""""
97
Valuation Date 31-Dec-2005
Terminal Multiple 9.0x Phineas Cost of Equity (a) 9.7%
Shares Outstanding (m) 968
Diluted Shares 1,019
WPYFf3Wff% ($ in millions) 2006
Pretax Income $3,384
Income Taxes (1,049)
Franchise Fee (5% After-tax) 117
Net Income $2,452
Capital Retention Requirement (b) $23
Free Cash Flow $2,475
Terminal Value
Free Cash Flow/Net Income 101%
Source: Bloomberg. Based on projections and assumptions provided by Phineas management.
(a) Calculated using the capital asset pricing model.
(b) Capital required calculated as 66.4 basis points against the single -family book of business.
Risk Free Rate
Market Risk Premium
Adjusted Beta
Marginal Tax Rate
Franchise Fee (After-tax)
2007 2008
$3,017 $2,482
(935) (769)
104 86
$2,186 $1,798
$1,464 $1,284
$3,650 $3,082
167% 171%
(c) Assumes 50.852mm common shares are issued at market price to meet the additional capital requirement for the portfolio business.
~ 7.7% ::::s 8.7 0" w 9.7 '0 U; 10.7 0 11.7 u
"""""""""""""""""""""""""""""""""""""""""""""""""""",!~,~,'!I"i"':I,c:l,I""I\II"':I,I,~,i'p,I,,:!,,,,,,,,,,,,,,,,,,,,,,,,,,,,,,,,,,,,,,,,,,,,,,,,,,""""""""""""""""""""""""""" 7 .Ox 8.0x 9.0x 10.0x 11.0x
$17.16 $18.23 $19.31 $20.38 $21.46 16.67 )))))))]jtiil )))))))))iHEis :::))))))))]@@8((( 20.82
16.21 15.76 15.33 16.26 17.19 18.12
20.20 19.62 19.05
2009
$1,974
(612)
68
$1,430
$1,125
$2,555
13,257
179%
0.67% i-.3
0.87 :~
1.07 1.27 1.47
iii' c. ID II)
iii
4.34%
5.00
1.07
31.0%
5.0
~
cltlgroUpJ

>-c:In (3 0
§"~ o 0.(1) (1)
o.-:::l ~ 0-. .: ~ ........... en >-c:I .: ..... ~ 0 :::l"C ............ ....... ..... o ~ g:~ .: IJ:j ~ .: :;0 i!J . .: :::l ...... (1) (1) en en en
"TI
§ (ii'
~
~ n o a
1:;0 o o o Vl ...... ...... o +-
~ ~ o· :::l
,~,!"~,S"!"!"",!!,!!!"!Il"",~"~,,!:,,,,:,,,,!:,!!,,~,~,!,~,!,,,,,!!,~"!!,!,!"J"~"~!,!'!'~,~"""""""""""""""""""""""""""""""",,,,,,"""""""""
98
m~~mm~~mm~~mm~~mm~~mm~f:S:·:J:WI~:MjJljjj&,@f.~.~. ~~@m~~@m~~@m~~@m~~@m~~
Projected for the year ended December 31.
P&L Drivers ($Billion) 2004
Ending SF MOO (a) $7.213
Ending Fannie Mae SF BOB (b) 2.042
Average Book of Business 2,019
Required Regulatory Capital (c) $12
P&L ($Million)
Revenues 2004
G-Fee Income (Includes AliocatedG-Fees) (d) $4,452
Net Fees/Other Inc. (CE expenses, Technology Fees) (e) 108
Total Non Interest Income $4,560
I nco on Capital (I) $806
Other Nil (Float, Stopped Interest, Other interest inc/exp) (g) 140
Total Interest Income $947
Total Revenues $5,506
Expenses
Credit Loss Expense {h) $134
Administrative Expenses (i) (533)
Corporate Expense Allocation (i) (534)
Total Expenses ($934)
Pretax Income $4,572
Tax Ul (1,235)
Net Income $3,338
Source: Based on projections and assumptions provided by Phineas management.
(a) Projections reflect growth of9.8% in 2005, 7.5% in 2006 and 6.7% thereafter.
2005 2006 2007
$7,S23 $8.515 $9.089
2J)30 2.100 2,165
2,036 2,065 2,133
$12 $12 $13
2005 2006 2007
$4.686 $4,83S $5,067
107 111 114
$4,794 $4,950 $5,182
$430 $509 $538
75 88 93
$504 $598 $631
$5,298 $5,548 $5,813
{$333) ($352) ($450)
(560) (588) (617)
(561) (589) (618)
($1,454) ($1,529) ($1,686)
$3,844 $4,019 $4,127
(1,038) (1,085) (1,114)
$2,806 $2,934 $3,013
(b) Projections reflect a 6.0% decline in 2005 and that Phineas captures a 46.1% share in the growth of single family MOO thereafter.
(c) Projections assume 0.45% + 30% surplus of end of year book of business. (d) Projections assume guaranty lees 01 22.1. 23.0. 23.4. 23.8. 24.0 and 24.2 basIs pOints In 2004-2009. (e) Projections assume growth at same rate as book of business.
(I) Based on lorward 1-month LlBOR. Source: Bloomberg. (g) Projections assume 17.33% on income on capital.
(h) Projections assume losses 01(0.6).1.6.1.7.2.1.2.2 and 2.4 basis paints in 2004-2009. (i) Projections assume 5.0% growth rate.
(j) 27% tax rate.
Key Metrics 2004
Guaranty Fees (% of Avg. Book of Business, bps) 22
Losses (% of Avg. Book of Business, bps)
Margin (% of Avg. Book of Business, bps) 23
Return on Required Capital (Pre-tax) 38.3%
Return on Required Capital (After-tax) 27.9%
2005
23
(2)
21
32.4%
23.6%
2006 2007
23 24
(2) (2)
22 22
32.7% 32.6%
23.9% 23.8%
2008
$9.702
2.233
2,199
$13
2008
$5,282
118
$5,399
$566
98
$664
$6,064
($483)
(648)
(649)
($1,780)
$4,283
(1,157)
$3,127
2008
24
(2)
22
32.8%
23.9%
2009 CAGR 05-09
$10.356 6.9%
2,302 32
2,267 2.7
$13 3.2
2009 CAGR 05-09
$5,4S2 4.0%
122 3.2
$5,614 4.0%
$595 8.5%
103 8.5
$698 8.5%
$6,312 4.5%
($548) 13.3%
(681) 5.0
(682) 5.0
($1,911) 7.1%
$4,401 3.4%
(1,188) 3.4
$3,213 3.4%
2009
24
(2)
22
32.7%
23.9% ~
cltlgroUpJ

>-c:In (3 0
§"~ o 0.(1) (1)
o.-:::l ~ 0-. .: ~ ........... en >-c:I .: ..... ~ 0 :::l"C ............ ....... ..... o ~ g:~ .: IJ:j ~ .: :;0 i!J . .: :::l ...... (1) (1) en en en
"TI
§ (ii'
~
"TI ~ I n 0 a
1:;0 0 0 0 Vl ...... ...... 0 Vl
~ ~ o· :::l
,~,!"!!,S"!"!"",!!,!!:!"!"!,l"",~,,~,,!:,,,,,!,!,,,,!,,,,,~,~,!,!!,!,!""~,~,!!:!,J:.!,~"!!,l!",,,,,,,,,,,,,,,,,,,,,,,,,,,,,,,,,,,,,,,,,,,,,,,,,,,,,,,,,,,,,,,,,,,,"""""""""""""
99
m::l~~m::lm::l~~m::lm::l~~m::lm::l~~m::l~;ErtiFt:U!olw.:.'M.~;JHjjT:~~J.~WMI:':l. m::lm::l~~m::lm::l~~m::lm::l~~m::lm::l~~
P&L Drivers ($Billion) 2004 Ending SF MOO (a) $7,213 Ending Fannie Mae SF BOB (b) 2.042 Average Book of Business 2,019
Required Regulalory Capital (c) $12
P&L ($Million)
Revenues 2004 G-Fee Income (Includes Allocated G-Fees) (d) $4,452 Net Fees/Other Inc. (CE expenses, Technology Fees) (e) 108 Total Non Interest Income $4,560
Inc. on Capital (f) $806 Other Nil (Float, Stopped Interest, Other interest inc/exp) (g) 140 Total Interest Income $947
Total Revenues $5,506
Expenses Credit Loss Expense (h) $134 Administrative Expenses (i) (533) Corporate Expense Allocation (i) (534) Total Expenses ($934)
Pretax Income $4,572
Tax OJ (1,235) Add Back. Frnnchise Fee (5% after-lax) 0
Net Income $3,338
Source: Based on projections and assumptions provided by Phineas management.
(a) Projections reflect growth of 9.3% in 2005 and 6.6% thereafter.
(b) Projections reflect reduction in book of business by 15% per annum beginning in 2006.
(c) Projections assume 0.66% of end of year book of business.
2005 $7,923
2,030 2,036
$12
2005 $4,686
107 $4,794
$430 75
$504
$5,298
($333) (560) (561)
($1,454)
$3,844 (1,192)
0
$2,652
(d) Projections assume guaranty fees of 22.1, 23.0, 23.4, 23.S, 24.0 and 24.2 basis paints in 2004-2009. (e) Projections assume growth at same rate as book of business.
(f) Based on forward 1-month LlBOR. Source: Bloomberg. (g) Projections assume 17.33% on income on capital.
(h) Projections assume losses of (0.6), 1.6, 1.7,2.1, 2.2 and 2.4 basis paints in 2004-2009. (i) Projections assume 5.0% growth rate.
U) 31% tax rate.
Key Metrics
Guranty Fees (% of Avg. Book of Business, bps) 22
Losses (% of Avg. Book of Business, bps)
Margin (% of Avg. Book of Business, bps) 23
Return on Required Capital (Pre-tax) 38.7%
Return on Required Capital (After-tax) 28.3%
23
(2)
21
32.4%
22.3%
Pvt. Co. Projections for the yr ended Dec. 31, 2006 2007 2008 2009
$8,515 $9,089 $9,702 $10,356
1J85 1,564 1,371 1.202 1,908 1,675 1,468 1,286
$12 $10 $9 $8
2006 2007 2008 2009
$4J77 $3,973 $3,520 $3,111 111 114 118 122
$4,288 $4,088 $3,638 $3,233
$491 $441 $395 $353 85 76 68 61
$577 $518 $463 $414
$4,864 $4,605 $4,101 $3,647
($303) ($352) ($321) ($310) (588) (617) (648) (681) (589) (618) (649) (682)
($1,480) ($1,588) ($1,619) ($1,673)
$3,384 $3,017 $2,482 $1,974 (1,049) (935) (769) (612)
117 104 86 68
$2,452 $2,186 $1,798 $1,430
22 24 24 24
(2) (2) (2) (2)
20 22 22 22 I 28.6% 29.0% 27.3% 24.7%
20.7% 21.0% 19.8% 17.9%
~
cltlgroUpJ

>-c:In (3 0
§"~ o 0.(1) (1)
o.-:::l ~ 0-. .: ~ ........... en >-c:I .: ..... ~ 0 :::l"C ............ ....... ..... o ~ g:~ .: IJ:j ~ .: :;0 i!J . .: :::l ...... (1) (1) en en en
"TI
§ (ii'
~
~ n o a
1:;0 o o o Vl ...... ...... o 0\
~ ~ o· :::l
""""",!:!,!"!,!"",!!,!.!:!,!"!,l,~"",,~,,!:!,,!!,!,,!,~,,,,,!.!:!,!,!!!:,!,!,,",!!,!,,!:!,!,~,!,,~,,!!,,"""""'"''''''''''''''''''''''''''''''''''''''''''''''''''''"""""""""""""""""""""""" ($ in millions, except per share data)
MBIA Inc. (MBI) Ambac Financial Group, Inc. (ABK) Assured Guaranty Limited (AGO)
$8,479 7,682 1,741
11-Jul-05
$62.62 70.94 23.22
10.Ox 10.1 10.2
Price /
1.3x 1.5 1.2
12.5% 13.5 13.0
IMMHJ.iiiiijMjY\:f~Mj!it.~M&iIi!iP)))))))))j5j;di!C(((((((:::ji4.ij>:)))))))))))j;oo.c:m:m:m:mn
IWiilMiiiiViiilWmSiliijimsfii!ifMJ:if(((((jb.iai ))))):1
Washington Mutual, Inc. (WM) New York Community Bancorp, Inc. (NYB) Independence Community Bank Corp. (IBCB)
$35,895 4,902 3,110
$41.20 18.46 37.05
10.3x 12.0 12.0
1.7x NM 1.4
10.0% 10.0 10.0
IMwmimlHhtjij~&'f:M&'HiiiL)))))))))::$i;~~: )))))))):ifM: ))))))))))::::::::~WW ))))):1
l#ijp.MWvM@MMijijfij@~lNijU))))):t¥¥:U))))J Source: Market Data from 100 and SNL. Earnings and dividend estimates for public companies from IBES. (a) After-Tax Operating Earnings based on company projections. (b) Implied valuation based on median multiples and 967.90mm shares outstanding. N.B. Market data as of July 11,2005.
100
2006E
80% 75 79
103% 120 120
2006E
1.8% 0.7 0.5
5.1% 5.5 3.1
~
cltlgroUpJ

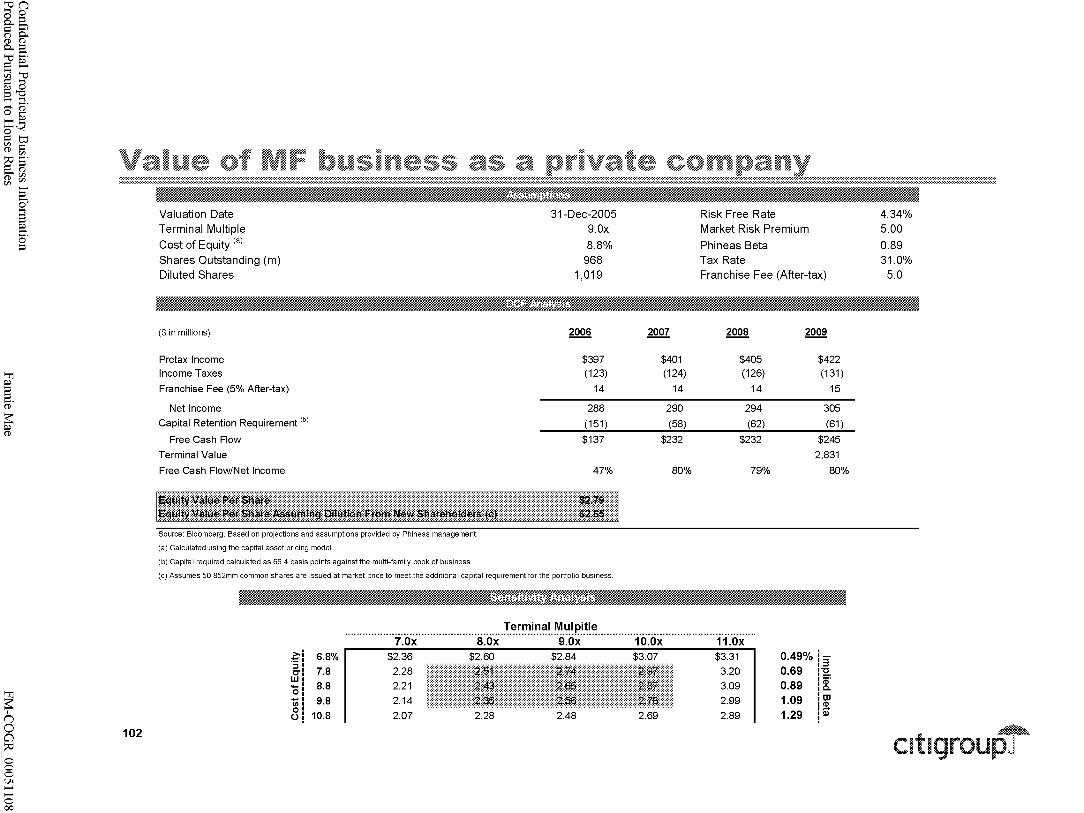
>-c:In (3 0
§"~ o 0.(1) (1)
o.-:::l ~ 0-. .: ~ ........... en >-c:I .: ..... ~ 0 :::l"C ............ ....... ..... o ~ g:~ .: IJ:j ~ .: :;0 i!J . .: :::l ...... (1) (1) en en en
"TI ~ :::l :::l (ii'
~ ~ (1)
"TI ~ I n 0 a
1:;0 0 0 0 Vl ...... ...... 0 00
~ ~ o· :::l
102
Valuation Date Terminal Multiple Cost of Equity Cal
Shares Outstanding (m) Diluted Shares
($ in millions)
Pretax Income Income Taxes
Franchise Fee (5% After-tax)
Net Income Capital Retention Requirement (b)
Free Cash Flow
Terminal Value
Free Cash Flow/Net Income
(a) Calculated using the capital asset pricing model.
(b) Capital required calculated as 66.4 basis pOints against the multi-family book of business.
31-Dec-2005 9.0x
8.8% 968
1,019
2006
$397 (123)
14
288
(151)
$137
47%
(c) Assumes 50.852mm common shares are issued at market price to meet the additional capital requirement for the portfolio business.
""!.fi!,~~,i,':I,~,I",II:'I,~,I'p,i"~I,~,,,,,
Risk Free Rate Market Risk Premium
Phineas Beta Tax Rate Franchise Fee (After-tax)
2007 2008 2009
$401 $405 $422 (124) (126) (131)
14 14 15
290 294 305
(58) (62) (61)
$232 $232 $245
2,831
80% 79% 80%
7.0x 8.0x 9.0x 10.0x 11.0x
~ 6.8% $2.36 $2.60 ::::s
7.8 2.28 0-W
'0 8.8 2.21
1i) 9.8 2.14 0 u 10.8 2.07 2.28
$2.84 $3.07
2.48 2.69
$3.31
3.20
3.09
2.99
2.89
0.49% i3" 0.69 r~
0.89 1.09 1.29
iii' c. ID II)
iii
4.34% 5.00
0.89 31.0%
5.0
~
cltlgroUpJ

>-c:In (3 0
§"~ o 0.(1) (1)
o.-:::l ~ 0-. .: ~ ........... en >-c:I .: ..... ~ 0 :::l"C ............ ....... ..... o ~ g:~ .: IJ:j ~ .: :;0 i!J . .: :::l ...... (1) (1) en en en
"TI
§ (ii'
~
~ n o a
1:;0 o o o Vl ...... ...... o '-0
~ ~ o· :::l
""""",!:!,!"!,!"",!!,!.!:!,!"!,l"",~,!:,~",,:,,,,~,!!,!,~!,!!,!,,,,~,~,!!,!!,S,!:!,,~,~,!,!,~,!!,,"'"''''''''''''''''''''''''''''''''''''''''''''''''''''''"""""""""""""""",,,
103
;W@i!@~4
P&L Drivers ($Billionl 2004
Multifamily MOO, End Balance (a) $601
MF Book of Business, End Balance (b) {e) 110
Average Book of Business 103
Regulatory Capital (d) 0.6
P&L ($Millionl
Revenues 2004
Guaranty Fees (incl. CE Fee which was included in Other income) (e) $419
Other Income (excl. CE fee) (I) 96
Total Non Interest Income $514
I ncome on Capital (g) $16
Float (h) 9
Total Interest Income $25
Total Revenue $539
Expenses
Credit Loss Expense (i) ($45)
Administrative Expenses OJ (60)
Corporate Expense Allocation (k) (78)
Total Expenses ($184)
Pretax Income - Before Franchise Fee $356
Tax (I) (96)
Net Income $260
Source: Based on assumptions provided by Phineas management. (a) Based on 6% growth in 2005 and 5% thereafter. (b) Liquidations projected by management to be 6.1 %, 5.8%, 5.4%, 6.0% and 4.7% from 2005 to 2009. (c) Assumes Phineas has 20% market share of future acquisitions and 45% share of MF BOB churn. (d) Projections assume 0.45% + 30% surplus of end of year book of business. (e) Based on projected guaranty fees of 0.38% for 2004, 0.37% for 2005 and 2006, 0.36% thereafter. (f) Assumed to be 22.8% of guaranty fees. (g) Based on forward l-month LlBOR. Source: Bloomberg. (h) Based on prior year income on capital. (i) Assumed to be 0.07% from 2005 to 2007, and 0.08% from 2008 to 2009. U) Assumed to be 0.06% from 2005 to 2006, 0.07% from 2007 to 2008, and 0.8% thereafter. (k) Assumed to be 0.07%. (I) Assume tax rate of 27%.
Key Metrics
Guranty Fees (% of End Book of Business, bps)
Losses (% of End Book of Business, bps)
Margin (% of End Book of Business, bps)
Return on Required Capital (Pre-tax)
Return on Required Capital (After-tax)
38
(4)
34
55.2%
40.3
2005
$637
120
115
0.7
2005
$446
102
$548
$20
20
$41
$589
($84)
(70)
(85)
($239)
$350
(94)
$255
37
(7)
30
50.0%
36.5
2006 2007 2008 2009 CAGR05-09
$669 $703 $738 $775 5.0%
128 137 146 155 6.8
124 132 141 151 7.0
0.7 0.8 0.9 0.9 6.8
2006 2007 2008 2009 CAGR05-09
$471 $499 $529 $559 5.8%
107 114 121 128 5.8
$578 $613 $650 $687 5.8%
$31 $34 $37 $40 18.5%
31 34 37 40 18.5
$62 $68 $74 $80 18.5%
$640 $681 $724 $767 6.8%
($90) {$96) ($117) ($124) 10.4%
(80) (92) (105) (120) 14.2
(91) (97) (104) (110) 6.8
($261) ($285) ($326) ($354) 10.4%
$379 $396 $398 $413 4.2%
(102) (107) (107) (112) 4.2
$277 $289 $290 $302 4.2%
37 36 36 36
(7) (7) (8) (8)
30 29 28 28
50.6% 49.4% 46.5% 45.5% I ~ 36.9 36.1 34.0 33.2 cltlgroUpJ

>-c:In (3 0
§"~ o 0.(1) (1)
o.-:::l ~ 0-. .: ~ ........... en >-c:I .: ..... ~ 0 :::l"C ............ ....... ..... o ~ g:~ .: IJ:j ~ .: :;0 i!J . .: :::l ...... (1) (1) en en en
"TI
§ (ii'
~
~ n o a
1:;0 o o o Vl >-' >-' >-' o
~ ~ o· :::l
""""",!:!,!"!,!"",!!,!.!:!,!"!,1"",~,!:,~""!!,!",,,~,,,,,,1!,~!,!,~,!!"",~~,!.!:!"I!,!!,!!,X"""""""""""""""""""""""""""""""""""""""""""""""""",,, ammmmmmrw@
P&L Drivers ($Billion) 2004 2005 2006 2007 2008 2009 CAGR 05-09
Multifamily MOO, End Balance (a) $601 $637 $602 $632 $664 $697 2.3%
MF Book of Business, End Balance (b) (c) 110 120 126 137 146 155 6.6
Average Book of Business 103 115 124 132 141 151 7.0
Regulatory Capital (d) 0.6 0.7 0.9 0.9 1.0 1.0 10.2
P&L ($Million)
Revenues 2004 2005 2006 2007 2008 2009 CAGR 05-09
Guaranty Fees (Incl. CE Fee lIIA1ichwas included in Dther income) (e) $419 $446 $474 $493 $526 $559 5.6%
Dther Income (excl. CE fee) (I) 96 102 108 112 120 128 5.8
Total Non Interest Income $514 $548 $582 $605 $646 $687 5.8%
I ncome on Capital (g) $16 $20 $35 $39 $42 $46 22.3%
Float (h) 9 20 31 34 37 40 18.5
Total Interest Income $25 $41 $66 $73 $79 $86 20.4%
Total Revenue $539 $589 $648 $678 $725 $772 7.0%
Expenses
Credit Loss Expense (I) ($45) ($64) ($90) ($96) ($117) ($124} 10.4%
Administrative Expenses UJ (60) (70) (57) (62) (67) (72) 0.5
Corporate Expense Allocation (k) (78) (85) (104) (119) (136) (155) 16.2
Total Expenses ($184) ($239) ($251) ($277) ($320) ($351) 10.1%
Pretax Income $356 $350 $397 $401 $405 $422 4.8%
Tax (I) (110) (94) (123) (124) (126) (131) 8.5
Add Back: Mission Costs (5% After-tax) 0 0 14 14 14 15 NM
Net Income $245 $255 $288 $290 $294 $305 4.6%
Source: Based on assumptions provided by Phineas management. (a) Based on 10% reduction after a 6% annual growth in 2005 and 5% thereafter.
(b) Liquidations projected by management to be 6.1 %,5.8%,5.4%,6.0% and 4.7% from 2005 to 2009. (c) Assumes Phineas has 20% market share of future acquisitions and 45% share of MF BOB churn. (d) Projections assume 0.45% + 30% surplus of end of year book of business.
(e) Based on projected guaranty fees of 0.38% for 2004,0.37% fO" 2005 and 2006, 0.36% thereafter. (f) Assumed to be 22.8% of guaranty fees. (g) Based on forward 1-month LlBOR. Source: Bloomberg.
(h) Based on prior year income on capital. (i) Assumed to be 0.07% from 2005 to 2007, and 0.08% from 2008 to 2009.
U) Assumed to be 0.06% from 2005 to 2006,0.07% from 2007 to 2008, and 0.8% thereafter. (k) Assumed to be 0.08% from 2005 to 2006, 0.09% from 2007 to 2008, and 0.10% thereafter.
(I) Assume tax rate of 31 %.
Key Metrics
Guranty Fees (% of End Book of Business, bps) 38 37 37 36 36 36
Losses (% of End Book of Business, bps) (4) (7) (7) (7) (8) (8)
IMargin (% of End Book of Business, bps) 34 30 30 29 28 28 I ~ 104 Return on Required Capital (Pre-tax) 55.2% 50.0% 46.7% 44.1% 41.8% 40.9% cltlgroUpJ Return on Required Capital (After-tax) 38.1 36.5 33.8 32.0 30.3 29.6

>-c:In (3 0
§"~ o 0.(1) (1)
o.-:::l ~ 0-. .: ~ ........... en >-c:I .: ..... ~ 0 :::l"C ............ ....... ..... o ~ g:~ .: IJ:j ~ .: :;0 i!J . .: :::l ...... (1) (1) en en en
"TI
§ (ii'
~
~ n o a
1:;0 o o o Vl ...... ...... ...... ......
~ ~ o· :::l
Portfo~io: Public market valuation -:-:-:-:-:-:-:-:-:-:-:-:-:-:-:-:-:-:-:-:-:-:-:-:-:-:-:-:-:-:-:-:-:-:-:-:-:-:-:-:-:-:-:-:-:-:-:-:-:-:-:-:-:-:-:-:-:-:-:-:-:-:-:-:-:-:-:-:-:-:-:-:-:-:-:-:-:-:-:-:-:-:-:-:-:-:-:-:-:-:-:-:-:-:-:-:-:-:-:-:-:-:-:-:-:-:-:-:-:-:-:-:-:-:-:-:-:-:-:-:-:-:-:-:-:-:-:-:-:-:-:-:-:-:-:-:-:-:-:-:-:-:-:-:-:-:-:-:-:-:-:-:-:-:-:-:-:-:-:-:-:-:-:-:-:-:-:-:-:-:-:-:-:-:-:-:-:-:-:-:-:-:-:-:-:-:-:-:-:-:-:-:-:-:-:-:-:-:-:-:-:-:-:-:-:-:-:-:-:-:-:-:-:-:-:-:-:-:-:-:-:-:-:-:-:-:-:-:-:-:-:-:-:-:-:-:-:-:-:-:-:-:-:-:-:-:-:-:-:-:-:-:-:-:-:-:-:-:-:-:-:-:-:-:-:-:-:-:-:-:-:-:-:-:-:-:-:-:-:-:-:-:-:-:-:-:-:-:-:-:-:-:-:-:-:-:-:-:-:-:-:-:-:-:-:-:-:-:-:-:-:-:-:-:-:-:-:-:-:-:-:-:-:-:-:-:-:-:-:-:-:-:-:-:-:-:-:-:-:-:-:-:-:. ........................................................................................................................................................................................................................................................................................................................................................
($ in millions, except per share data)
11-Jul-05
Market Cap Price
Annaly Mortgage Management, Inc. (NL Y) $2,131 $17.57 Redwood Trust, Inc. (RWT) 1,313 53.37 MFA Mortgage Investments, Inc. (MFA) 592 7.19 Anworth Mortgage Asset Corporation (ANH) 467 9.85 Luminent Mortgage Capital, Inc. (LUM) 417 10.90
Price!
2006E
10.2x 7.8 8.8 8.3 8.3
Long Term
Growth Rate
5.0% 8.0 4.5 NM NM
2006E PEG Ratio
203% 97
195 NM NM
2006E Dividend Yield
9.5% 12.4 10.3 11.2 12.6
l:ij9.##m¥]:{~f:ijr.Miii.::~~U)))))))))))))))))))))))))):».M?~: ))))))))))))))))))))))))))))))))))))))))))))))))):::::@jM$.JJ
l#m~)li!fVi!iW~mijijjii!in$.hi!iti!i i(((((((((((((((((((((@1JIH((((((((((((((((((((((((((((((((((((((((((((((((((Git~t )J
;;~::':
Newcastle Investment Corp. (NCT) Anthracite Capital, Inc. (AHR) Capital Trust, Inc. (CT)
·6-)~~·ttr~~:::::::::::o.:.-~
Bank of America Corporation (BAC) Wells Fargo & Company (WFC) National City Corporation (NCC) North Fork Bancorporation, Inc. (NFB)
$1,323 639 522
$30.23 11.98 34.50
9.9x 9.5
12.6
l:e~:W.t.ii.¥?~~~ij.Mij@@H))))))))))))))))))))))))))::~W1~ ?]
l#m~)[email protected]!in~mi!iti!i i(((((((((((((((((((((@ti$:t )J
$181,839 104,159 22,425 13,989
$45.17 61.73 35.22 29.29
10.2x 12.2 10.8 11.4
l:e~:W.t.ii.¥?~~~ij.Mij@@H))))))))))))))))))))))))))::~W1~ ?]
l#m~)[email protected]!in~mi!iti!i )))))))))))))))))))))J@M~ )J
Source: Market Data from 100 and SNL. Earnings Estimates for public companies from IBES.
9.5% 5.0 8.0
9.0% 11.0 8.0
10.8
105% 191 158
113% 111 135 106
(a) After-tax net income:Citigroup projections model based on management assumptions. Reference income for dividend yield valuation equals 2006E pre-tax income'95%, less franchise less preferred dividends. N.B. Market data as of July 11, 2005.
7.8% 9.8 7.3
4.5% 3.5 4.3 3.5
105 ~
cltlgroUpJ

>-c:In (3 0
§"~ o 0.(1) (1)
o.-:::l ~ 0-. .: ~ ........... en >-c:I .: ..... ~ 0 :::l"C ............ ....... ..... o ~ g:~ .: IJ:j ~ .: :;0 i!J . .: :::l ...... (1) (1) en en en
"TI
§ (ii'
~
~ n o a
1:;0 o o o Vl ...... ...... ...... N
~ ~ o· :::l
,~,~"!:!!~,!"!,~,;"""~,!:!,,~I!,,~,,,,,!!!,!,!,~,!!,,,,!!I!:!,!,!'!'~,~"",i,!!,~,!:!,!,~,~,l,,,,,,,,,,,,,,,,,,,,,,,,,,,,,,,,,,,,,,,,,,,,,,,,,,,,,,,,,,,,,,,,,,,,,,,""""",,: ($ in millions, except per share data)
Washington Mutual, Inc. (WM) Golden West Financial Corporation (GDW)
11-Jul-05 Market Cap Price
$35,895 20,223
$41.20 65.82
Price! 2006E
10.3x 12.3
l:ijijmmWJ~~t.~f:M&'H~L))))))))))))))))))))))))::::)iijm~»1
l#[email protected]!iWij:m:iifp.i!it$.tiijl~Li(((((((((((((((((((:::$4.~;tt )il
Source: Market Data from 100 and SNL. Earnings Estimates for public companies from IBES.
Long Term Growth Rate
10.0% 12.5
2006E PEG Ratio
103% 98
2006E Dividend Yield
5.1% 0.5
(a) After-tax net income:Citigroup projections model based on management assumptions. Reference income for dividend yield valuation equals 2006E pre-tax income'95%, less franchise less preferred dividends. N.B. Market data as of July 11, 2005.
106 ~
cltlgroUpJ
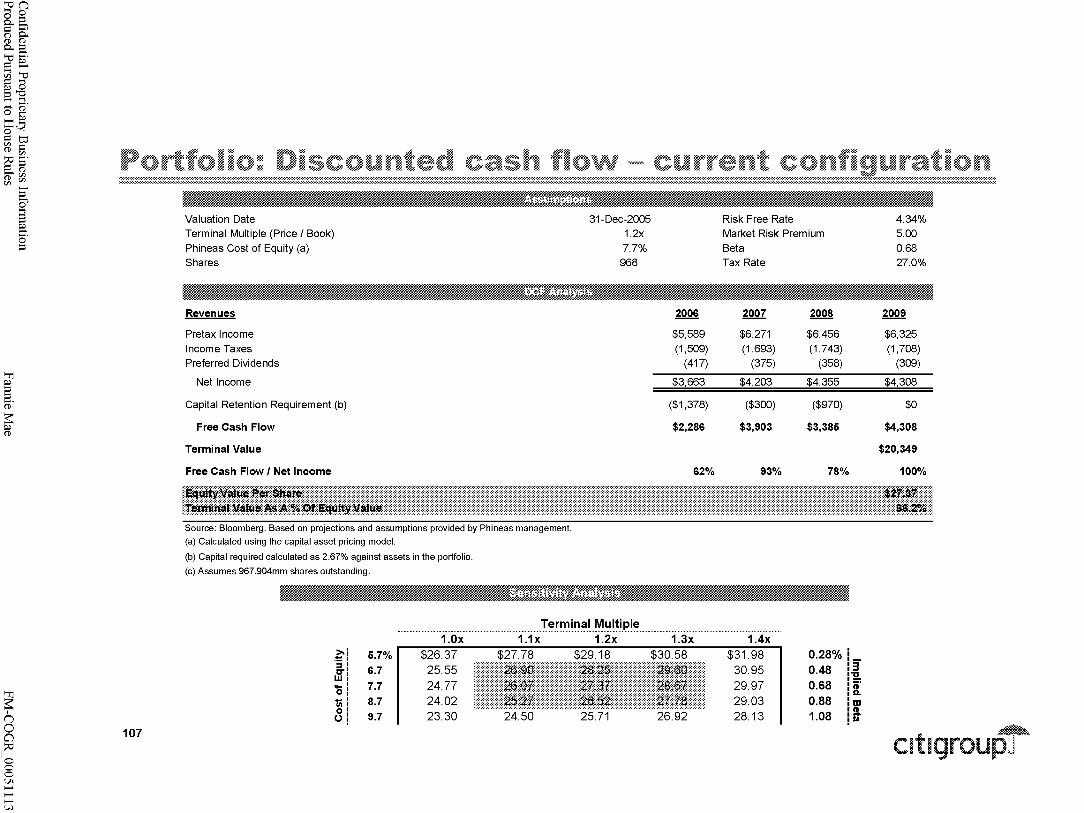
>-c:In (3 0
§"~ o 0.(1) (1)
o.-:::l ~ 0-. .: ~ ........... en >-c:I .: ..... ~ 0 :::l"C ............ ....... ..... o ~ g:~ .: IJ:j ~ .: :;0 i!J . .: :::l ...... (1) (1) en en en
"TI ~ :::l :::l (ii'
~ ~ (1)
"TI ~ I n 0 a
1:;0 0 0 0 Vl ...... ...... ...... w
~ ~ o· :::l
,~,~"!:!!~,!"!,~,;"""~,,!,!,!!,~,!:!,!!,!,!,~,,,,,~!,!,!!,,,,!!,,~,!!"":"",~,!!"~~!,!:!,!,,,,,!!,~,,~,!,!,II,!:!,,~!,!I~,!:!,,:
107
Valuation Date Terminal Multiple (Price I Book) Phineas Cost of Equity (a) Shares
Revenues
Pretax Income Income Taxes Preferred Dividends
Net Income
Capital Retention Requirement (b)
Free Cash Flow
Terminal Value
Free Cash Flow I Net Income
31-Dec-2005 1.2x 7.7%
968
2006
$5,589 (1,509)
(417)
$3,663
($1,378)
$2,286
62%
Risk Free Rate Market Risk Premium Beta Tax Rate
2007 2008
$6,271 $6,456 (1,693) (1,743)
(375) (358)
$4,203 $4,355
($300) ($970)
$3,903 $3,386
93% 78%
(b) Capital required calculated as 2.67% against assets in the portfolio.
(c) Assumes 967.904mm shares outstanding.
~i ._' 6.7% :::I' 0-' 6.7 w: -' 7.7 0' , -' 8.7 CI)' 0' O~ 9.7
""""""""""""""""""""""""""""""""""""""""""""""",T,~,~,'!I"i,':I,~,I",!'!I,,:!,I,~,i'p,I,~,,,,,,,,,,,,,,,,,,,,,,,,,,,,,,,,,,,,,,,,,,,,,,,,,,,,,,,,,"""""""""""""""""'" 1.0x 1.1x 1.2x 1.3x 1.4x
$26.37 $27.78 $29.18 $30.58 $31.98 25.55 ))))):::2jjmj :))))))):alS@is. :))))))):algj$if()) 30.95
24.77 24.02 23.30 24.50 25.71 26.92
29.97 29.03 28.13
0.28% 0.48 0.68 0.88 1.08
3" ~ iii' Il.
DJ !a-lii
4.34% 5.00 0.68 27.0%
2009
$6,325 (1,708)
(309)
$4,308
$0
$4,308
$20,349
100%
~
cltlgroUpJ

>-c:In (3 0
§"~ o 0.(1) (1)
o.-:::l ~ 0-. .: ~ ........... en >-c:I .: ..... ~ 0 :::l"C ............ ....... ..... o ~ g:~ .: IJ:j ~ .: :;0 i!J . .: :::l ...... (1) (1) en en en
"TI
§ (ii'
~
"TI ~ , n 0 a
1:;0 0 0 0 Vl ...... ...... ...... +-
~ ~ o· :::l
"""",!!I~,!"",~!""~,~,!!,!~I!"~",,,~,~,,!,!,,~,!,!,!,,,,!!,!,!,!!,~,,~,!,,"'~,!!,,!,,",!!,~,!!,~!,!,~,~"",,!,!!,!!,,~""""""
108
Valuation Date 31-Dec-2005 Terminal Multiple (Price / Book) 1.2x Phineas "Bank" Cost of Equity (a) 8.4% Shares 968 Diluted Shares 1,019
Revenues 2006
Pretax Income $3,861 Income Taxes (1,197) Preferred Dividends (417)
Net Income $2,247
Capital Retention Requirement ($7,862)
Free Cash Flow ($5,615) Terminal Value Free Cash Flow / Net Income (250%)
(b) Capital required calculated as 5.00% against assets in the portfolio.
(c) Assumes 50.852mm common shares are issued at market price to meet the additional capital requirement.
>- 6.4% -::::s 0" 7.4 w '0 8.4
U; 9.4 0 u 10.4
""""""""""""""""""""""""""""""""""""""",!~,~,'!I,i,':1,,~,1",IYI,~,I,~,i'pI,~""""""""""""""""""""""""""""""""""""""", 1.0x 1.1x 1.2x 1.3x 1.4x
$12.82 $13.30 $13.78 $14.26 $14.74 12.36 (((({jggji ))))))i!:iEia: ))))))i!:jWS))}: 14.21
11.91 11.49 11.08 11.49 11.91 12.32
13.70 13.21 12.74
Rf Market Risk Premium Beta Tax Rate
2007
$3,243 (1,005)
(375)
$1,863
$5,462
$7,325
393%
0.44% ._ '3 0.64 :-0 ,-
0.84 : iii' ,e. 1.04 : ID
,11) 1.24 : iii
2008
$2,803 (869) (358)
$1,576
$3,002
$4,578
291%
4.34% 5.00 0.82 31.0%
2009
$2,204 (683) (309)
$1,212
$2,847
$4,059 $7,544
335%
~
cltlgroUpJ

>-c:In (3 0
§"~ o 0.(1) (1)
o.-:::l ~ 0-. .: ~ ........... en >-c:I .: ..... ~ 0 :::l"C ............ ....... ..... o ~ g:~ .: IJ:j ~ .: :;0 i!J . .: :::l ...... (1) (1) en en en
"TI
§ (ii'
~
"TI ~ I n 0 a
1:;0 0 0 0 Vl ...... ...... ...... Vl
~ ~ o· :::l
"""",!!I~,!"",~!""~,~,!!,!~I!"~",,,~,~,,!,!,,~,!,!,!,,,,!!,!,!,!!,~,,~,!,,"'~,!!,,!,,",!!,~,!!,~!,!,~,~"",,!!,~,!,!,,"""""":
109
Valuation Date 31-Dec-2005 Rf 4.34% Terminal Multiple (Price / Book) Phineas "REIT" Cost of Equity (a) Shares
1.2x Market Risk Premium 5.00
Diluted Shares
Revenues
Pretax Income Income Taxes Preferred Dividends
Net Income
Capital Retention Requirement
Free Cash Flow Terminal Value Free Cash Flow / Net Income
7.4% 968
1,398
Source: Bloomberg. Based on projections and assumptions provided by Phineas management.
(a) Calculated using the capital asset pricing model.
(b) Capital required calculated as 10.00% against assets in the portfolio.
2006
$4,238 0
(417)
$3,821
($31,841)
($28,020)
(733%)
(c) Assumes 430.211 mm common shares are issued at market price to meet the additional capital requirement.
Beta Tax Rate
2007
$3,497 0
(375)
$3,123
$11,224
$14,347
459%
""""""""""""""""""""""""""""""""""""""""""",!.~,~,,!,,,i,~,~,I",IYI,~,I,~,i'p,I,~"""""""""""""""""""""""""""""""""""""""""'"
Z. 5.4% .:; c- 6.4 W - 7.4 0
1ii 8.4 0 0 9.4
1.0x 1.1x 1.2x 1.3x 1.4x $11.76 $12.78 $13.81 $14.83 $15.86
11.02 fffffff@@@j :ffffffdj]jjQ ffffffJJ%t91:f((( 14.97 10.32 9.65 9.02 9.90 10.78 11.67
14.13 13.32 12.55
0.62 0.0%
2008 2009
$3,852 $3,046 0 0
(358) (309)
$3,493 $2,737
$6,975 $5,695
$10,468 $8,432 $21,220
300% 308%
0.21% ._ 0.41% 0.61% 0.81% 1.01%
3 ~ iD' e. OJ !a-D>
~
cltlgroUpJ

>-c:In (3 0
§"~ o 0.(1) (1)
o.-:::l ~ 0-. .: ~ ........... en >-c:I .: ..... ~ 0 :::l"C ............ ....... ..... o ~ g:~ .: IJ:j ~ .: :;0 i!J . .: :::l ...... (1) (1) en en en
"TI
§ (ii'
~
~ n o a
1:;0 o o o Vl ...... ...... ...... 0\
~ ~ o· :::l
,~,~"~!~,!,,!,~""'~,~,~"":""~,!:!,,~,~!,!.!,!,,"~,~,!.!,!!,,s,!:!,~!!,!,~,!.!""""""""""""""""""""""""""""""""""""""""""""""""""""""""""
P&L Drivers ($ billion)
Portfolio Balance (a)
Required Capital (b)
Preferred Stock
Common Stock
P&L ($ million)
Revenues
Net Interest Income
Administrative Expenses (c)
Corporate Expense Allocation (c)
Total Expenses
Pretax Income
Income Taxes
Core Earnings Before Pref. Dividends
Preferred Dividends (d)
Core Earnings After Pref. Dividends
2006
$828
$22.1
6.4
$15.7
$5,930
($176)
~ ($341)
$5,589
(1,509)
$4,080
($417)
$3,663
2007
$828
$22.1
6.1
$16.0
$6,623
($186)
(166)
($352)
$6,271
(1,693)
$4,578
($375)
$4,203
2008
$828
$22.1
5.1
$17.0
$6,819
($197)
(166)
($363)
$6,456
(1,743)
$4,713
($358)
$4,355
2009
$828
$22.1
5.1
$17.0
$6,700
($209)
(166)
($375)
$6,325
(1,708)
$4,617
($309)
$4,308
Source: 2000 - 2004 data provided by Phineas management on 04.27.2005 and projections based on assumptions as outlined by Phineas management. Forward interest & swap rates from Bloomberg.
(a) 2000 - 2004 reflects average annual balance, Projections reflects no growth in portfolio balance, beginning with an $828 billion balance at May 31, 2005.
(b) Projections assume 2.05% + 30% surplus, of end of year portfolio balance.
CAGR '06 - '09
0.0%
0.0%
(7.1%)
2.6%
CAGR '06 - '09
4.2%
6.0%
0.0
3.2%
4.2%
4.2
4.2%
(9.5%)
5.6%
(c) Assumes 2 bps (as a % of end of year portfolio balance) beginning in 2005, and that administrative expenses grow at 6.00% per year and corporate expenses remain at 2 bps. Includes the 5.0% after-tax franchise fee
in 2006 - 2009.
(d) Based on actual dividends reported for the nine months ended 09.30.2004 of $124mm plus $42 in estimated dividends for the fourth quarter. Assumes callable preferreds are called by Phineas.
110 ~
cltlgroUpJ

>-c:In (3 0
§"~ o 0.(1) (1)
o.-:::l ~ 0-. .: ~ ........... en >-c:I .: ..... ~ 0 :::l"C ............ ....... ..... o ~ g:~ .: IJ:j ~ .: :;0 i!J . .: :::l ...... (1) (1) en en en
"TI
§ (ii'
~
"TI ~ I n 0 a
1:;0 0 0 0 Vl ...... ...... ...... -.l
~ ~ o· :::l
Portfo~io P l without charter: Bank -:-:-:-:-:-:-:-:-:-:-:-:-:-:-:-:-:-:-:-:-:-:-:-:-:-:-:-:-:-:-:-:-:-:-:-:-:-:-:-:-:-:-:-:-:-:-:-:-:-:-:-:-:-:-:-:-:-:-:-:-:-:-:-:-:-:-:-:-:-:-:-:-:-:-:-:-:-:-:-:-:-:-:-:-:-:-:-:-:-:-:-:-:-:-:-:-:-:-:-:-:-:-:-:-:-:-:-:-:-:-:-:-:-:-:-:-:-:-:-:-:-:-:-:-:-:-:-:-:-:-:-:-:-:-:-:-:-:-:-:-:-:-:-:-:-:-:-:-:-:-:-:-:-:-:-:-:-:-:-:-:-:-:-:-:-:-:-:-:-:-:-:-:-:-:-:-:-:-:-:-:-:-:-:-:-:-:-:-:-:-:-:-:-:-:-:-:-:-:-:-:-:-:-:-:-:-:-:-:-:-:-:-:-:-:-:-:-:-:-:-:-:-:-:-:-:-:-:-:-:-:-:-:-:-:-:-:-:-:-:-:-:-:-:-:-:-:-:-:-:-:-:-:-:-:-:-:-:-:-:-:-:-:-:-:-:-:-:-:-:-:-:-:-:-:-:-:-:-:-:-:-:-:-:-:-:-:-:-:-:-:-:-:-:-:-:-:-:-:-:-:-:-:-:-:-:-:-:-:-:-:-:-:-:-:-:-:-:-:-:-:-:-:-:-:-:-:-:-:-:-:-:-:-:-:-:-:-:-:-:-:-:-:. ........................................................................................................................................................................................................................................................................................................................................................
111
P&L Drivers ($ billion)
Portfolio Balance (a)
Required Capital (b)
Preferred Stock
Common Stock
P&L ($ million)
Revenues
Interest Income On Capital
Net Interest Income On Assets
Net Interest Income
Expenses
Administrative Expenses (c)
Corporate Expense Allocation (c)
Total Expenses
Pretax Income
Income Taxes
Core Earnings Before Pref. Dividends
Preferred Dividends (d)
Core Earnings After Pref. Dividends
2006
$480
$24.0
$6.4
$17.6
$464
$3,627
$4,091
($117)
~ ($231)
$3,861
(1,197)
$2,664
($417)
$2,247
2007
$364
$18.2
$6.1
$12.1
$361
$3,055
$3,417
($90)
(84)
($174)
$3,243
(1,005)
$2,238
($375)
$1,863
2008
$285
$14.2
$5.1
$9.1
$288
$2,650
$2,939
($71)
(65)
($136)
$2,803
(869)
$1,934
($358)
$1,576
2009
$228
$11.4
$5.1
$6.3
$235
$2,078
$2,313
($58)
(51)
($109)
$2,204
(683)
$1,521
($309)
$1,212
CAGR '06 - '09
(22.0%)
(22.0%)
CAGR '06 - '09
(20.3%)
(16.9%)
(16.9%)
(21.0%)
(23.3%)
(22.1%)
(17.0%)
(17.0%)
(17.0%)
(9.5%)
(18.6%)
Source: 2000 - 2004 data provided by Phineas management on 04.27.2005 and projections based on assumptions as outlined by Phineas management. Forward interest & swap rates from Bloomberg.
(a) 2000 - 2004 reflects average annual balance, Projections reflect a run-off scenario, beginning with a $656 billion balance at year-end 2005.
(b) Assumes that 2000 - 2004 reflects annual balance, Projections assume 5.00% of end of year portfolio balance.
(c) Assumes 2 bps (as a % of end of year portfolio balance) beginning in 2005, and that administrative expenses grow at 6.00% per year and corporate expenses remain at 2 bps. Assumes that a 5.0% after-tax franchise fee
is included in administrative expenses beginning in 2006.
(d) Based on actual dividends reported for the nine months ended 09.30.2004 of $124mm plus $42 in estimated dividends for the fourth quarter. Assumes callable preferreds are called by Phineas.
~
cltlgroUpJ

>-c:In (3 0
§"~ o 0.(1) (1)
o.-:::l ~ 0-. .: ~ ........... en >-c:I .: ..... ~ 0 :::l"C ............ ....... ..... o ~ g:~ .: IJ:j ~ .: :;0 i!J . .: :::l ...... (1) (1) en en en
"TI
§ (ii'
~
"TI ~ I n 0 a
1:;0 0 0 0 Vl ...... ...... ...... 00
~ ~ o· :::l
Portfo~io P l without charter: REIT -:-:-:-:-:-:-:-:-:-:-:-:-:-:-:-:-:-:-:-:-:-:-:-:-:-:-:-:-:-:-:-:-:-:-:-:-:-:-:-:-:-:-:-:-:-:-:-:-:-:-:-:-:-:-:-:-:-:-:-:-:-:-:-:-:-:-:-:-:-:-:-:-:-:-:-:-:-:-:-:-:-:-:-:-:-:-:-:-:-:-:-:-:-:-:-:-:-:-:-:-:-:-:-:-:-:-:-:-:-:-:-:-:-:-:-:-:-:-:-:-:-:-:-:-:-:-:-:-:-:-:-:-:-:-:-:-:-:-:-:-:-:-:-:-:-:-:-:-:-:-:-:-:-:-:-:-:-:-:-:-:-:-:-:-:-:-:-:-:-:-:-:-:-:-:-:-:-:-:-:-:-:-:-:-:-:-:-:-:-:-:-:-:-:-:-:-:-:-:-:-:-:-:-:-:-:-:-:-:-:-:-:-:-:-:-:-:-:-:-:-:-:-:-:-:-:-:-:-:-:-:-:-:-:-:-:-:-:-:-:-:-:-:-:-:-:-:-:-:-:-:-:-:-:-:-:-:-:-:-:-:-:-:-:-:-:-:-:-:-:-:-:-:-:-:-:-:-:-:-:-:-:-:-:-:-:-:-:-:-:-:-:-:-:-:-:-:-:-:-:-:-:-:-:-:-:-:-:-:-:-:-:-:-:-:-:-:-:-:-:-:-:-:-:-:-:-:-:-:-:-:-:-:-:-:-:-:-:-:-:-:-:-:. ........................................................................................................................................................................................................................................................................................................................................................
P&L Drivers ($ billion)
Portfolio Balance (a)
Required Capital (b)
Preferred Stock
Common Stock
P&L ($ million)
Revenues
Interest Income on Capital (c)
Net Interest Income On Assets
Net Interest Income
Expenses
Administrative Expenses (c)
Corporate Expense Allocation (c)
Total Expenses
Pretax Income
Income Taxes (d)
Core Earnings Before Pref. Dividends
Preferred Dividends (e)
Core Earnings After Pref. Dividends
2006
$480
$48.0
$6.4
$41.6
$1,458
3,010
$4,469
($117)
(114)
($231)
$4,238
0
$4,238
($417)
$3,821
2007
$364
$36.4
$6.1
$30.4
$1,135
2,536
$3,671
($90)
(84)
($174)
$3,497
0
$3,497
($375)
$3,123
2008
$285
$28.5
$5.1
$23.4
$906
3,082
$3,987
($71)
(65)
($136)
$3,852
0
$3,852
($358)
$3,493
2009
$228
$22.8
$5.1
$17.7
$739
2,416
$3,155
($58)
(51)
($109)
$3,046
0
$3,046
($309)
$2,737
CAGR '06 - '09
(22.0%)
(22.0%)
CAGR '06 - '09
(7.8%)
(20.3%)
(7.1%)
(21.0%)
(23.3%)
(22.1%)
(10.4%)
NM
(10.4%)
(9.5%)
(10.5%)
Source: 2000 - 2004 data provided by Phineas management on 04.27.2005 and projections based on assumptions as outlined by Phineas management. Forward interest & swap rates from Bloomberg.
(a) 2000 - 2004 reflects average annual balance, Projections reflect a run-off scenario, beginning with a $656 billion balance at year-end 2005.
(b) Assumes that 2000 - 2004 reflects annual balance, Projections assume 10.00% of end of year portfolio balance.
(c) Assumes 2 bps (as a % of end of year portfolio balance) beginning in 2005, and that administrative expenses grow at 6.00% per year and corporate expenses remain at 2 bps.
Assumes that a 5.0% after-tax franchise fee is included in administrative expenses beginning in 2006.
(d) Assumes 100% of income is distributed to shareholders.
(e) Based on actual dividends reported for the nine months ended 09.30.2004 of $124mm plus $42 in estimated dividends for the fourth quarter. Assumes callable preferreds are called by Phineas.
112 ~
cltlgroUpJ

Confidential Proprietary Business Information Produced Pursuant to House Rules Fannie Mae FM-COGR 00051119

>-c:In (3 0
§"~ o 0.(1) (1)
o.-:::l ~ 0-. .: ~ ........... en >-c:I .: ..... ~ 0 :::l"C ............ ....... ..... o ~ g:~ .: IJ:j ~ .: :;0 i!J . .: :::l ...... (1) (1) en en en
"TI
§ (ii'
~
~ n o a
1:;0 o o o Vl ...... ...... N o
~ ~ o· :::l
,~!,!,!"",~,!,!:!,~,l!::""~!,!,~,~,~""""""""""""""""""""",,""""""""""""""""""""""""""""""""""""""""""""""""""""""""""""""",,,,,,,,,,,,,,,,,,,,,,,,,,,,,,,,,,,,,,,,,,,,,,,,, )0- WestLB is one of Germany's leading financial services providers with total assets of € 253.8BN
as at December 31, 2004, WestLB focuses on lending, structured finance, capital market and private equity products, private banking, asset management, transaction services and real estate finance.
0- In July 2001, as a result of a state aid inquiry of the EU Commission the German government abolished the state guarantee provided to German Landesbanks granting them a transition phase of four years until July 18, 2005. Most liabilities outstanding on July 18, 2005 will be "grandfathered" with the state guarantee.
)0- S&P believes that the credit rating of WestLB will decrease by 3 notches from AA- to A- after the elimination of guarantor liability.
)0- Fitch believes that the long term rating of West LB is likely to fall in a A- while Moody's indicated that non-guaranteed long term rating of West LB will decrease by 2 notches from Aa2 to A 1.
With guarantor liability
_S!J2t!. ~r:.m): .. o£19. ~!:'1lJ. __
Without guarantor liability 3/31/2005 12/31/2004 Change € billions
Moody's P .. 1 Aa2
Standard & Poor's A .. 1 + AA ..
Fitch Ratings F1+ AAA
113
___ ,"=-0£19. ~!:'Il] A1
A ..
A ..
Core capital (€ billions)
Capital and reserves (€ billions)
Risk-weighted assets (€ billions)
Core capital ratio (%)
Equity ratio (%)
7.5 7.6 -0.1
14.3 14.6 -0.3
122.4 118 4.4
7.8 8.1
11.7 12.4
~
cltlgroUpJ

W 0:: Q)
'" :.c " " ~
LL :::::: W 0:: Q)
'" '" OJ l:l:l
ri'il!l
= (t 1!1 0 E &m 0
tJ 4# Y E ~ ~= ~ 4#
tt k:::s
~ (t ~= > J: C 0 C ~ m t@ fuss ~ ~ t: W ~= J: ~
~ ~
Confidential Proprietary Business Information Produced Pursuant to House Rules
>< '" 0 0
~ 0 N 0 f0->-
"" 0 0 N
'" 0 0 N
N 0 0 N
;; 0 N
0 0 0 N
(J) (J) (J)
>< 00 It! (J)
N (J)
>< >< >< >< >< >< >< >< >< 0 '" 0 '" 0 '" 0 u;> 0
'" N N ~ ~ ";"
3/d as!4:JueJ:I + 3/d asea = 3/d Nl:l
Fannie Mae
co 0 0 [j r-->-
" .rn "0
"" " ~ 0 rn 0 "0 ill N Q) :;;; & ill Q)
& Ol '" ro ro .0< -§' Q)
" .~ ro :!1' II': OJ
t f (')
::~:: 0 0 N
N .~:::: 0
0 N
0 0 N
0
f"
0 0 N
OJ OJ OJ
ro OJ OJ
~ ~ ~ ~ ~ ~ ~ CO 0 CO 0 "( 0 CO
..r ..... .....
FM-COGR 00051121

>-c:In (3 0
§"~ o 0.(1) (1)
o.-:::l ~ 0-. .: ~ ........... en >-c:I .: ..... ~ 0 :::l"C ............ ....... ..... o ~ g:~ .: IJ:j ~ .: :;0 i!J . .: :::l ...... (1) (1) en en en
"TI
§ (ii'
~
"TI ~ I n 0 a
1:;0 0 0 0 Vl ...... ...... N N
~ ~ o· :::l
,~,~,!,!""E:,!!,!,!!,!,~",!,!,!,!:!,!"",!,!!:!"I!,!!,~!,~"""~",,""""""""""""""""""""""""""""""""""""""""""""""""""""""""""""""""""""""""""""""",,,
.::.:.:.:.:.:.:.:.:.:.:.:.:.:.:.:.:.:.:.:~ 11'11:!I!:!II:!I!:I!:I!I:!IIII!I!:!!IIII!:!!!II:!I!:11!1!:II!I!:!II!!:!llill
Phineas 0.68 7.7%
0.8% 0.12 7.7% - 0.8%
x x X
11II1II- 33.4% - 7.7% = 9.9
(33.4%) * (7.7%)
115
+ + +
12.9 7.7%
(1): 5 year weekly adjusted Beta. (2): We assumed a risk free rate of 4.34% and an equity market risk premium of 5%. (3): Growth: we use Phineas median implied growth for the 1998-2004 period. (4): ROE: 3 - year average ROE as of June 2004 (pre-restatement) (5): NTM EPS estimate: $6.95 per share, number of shares outstanding: 968mm.
\}>
\}>
Assumes that ratings downgrade from AAA to A would decrease Phineas net interest margin by c. 12.5bps
Our model predicts that such an increase in the cost of debt would result in reduction of ROE of approximately 50% or an ROE of 16.5%
0.8% 0.12 7.7% -0.8%
X X X
11II1II=- 16.5% - 7.7% = 6.8
(16.5%) * (7.7%)
+ + +
12.9 7.7%
.6.P/E = O.4x or .6. ValueS = $2.4bn
~
cltlgroUpJ

>-c:In (3 0
§"~ o 0.(1) (1)
o.-:::l ~ 0-. .: ~ ........... en >-c:I .: ..... ~ 0 :::l"C ............ ....... ..... o ~ g:~ .: IJ:j ~ .: :;0 i!J . .: :::l ...... (1) (1) en en en
"TI
§ (ii'
~
"TI ~ I n 0 a
1:;0 0 0 0 Vl ...... ...... N w
~ ~ o· :::l
Although the information contained in this presentation is believed to be reliable, we make no representation or warranty as to the accuracy or completeness of any information contained in this presentation or otherwise provided by us and we accept no liability for the accuracy or completeness of such information. Prior to entering into any transaction contemplated hereby (a "Transaction") you should determine, without reliance upon us or our affiliates, the economic risks and merits (and independently determine that you are able to assume these risks), as well as the legal, tax and accounting characterizations and consequences of any such Transaction. In this regard, by accepting this presentation, you acknowledge that (a) we are not in the business of providing (and you are not relying on us for) legal, tax or accounting advice, (b) there may be legal, tax or accounting risks associated with any Transaction, (c) you should receive (and rely on) separate and qualified legal, tax and accounting advice and (d) you should apprise senior management in your organization as to such legal, tax and accounting advice (and any risks associated with any Transaction) and our disclaimer as to these matters.
Any terms set forth in this presentation are intended for discussion purposes only and are subject to the final expression of the terms as set forth in separate definitive written agreements. Notwithstanding anything herein or in any agreement we may enter into to the contrary, you (and each of your employees, representatives or other agents) may disclose to any and all persons, without limitation of any kind, the U.S. tax treatment and U.S. tax structure of any Transaction and all materials of any kind (including opinions or other tax analyses) that are provided to you relating to such U.S. tax treatment and U.S. tax structure, other than any information for which nondisclosure is reasonably necessary in order to comply with applicable securities laws.
Although this material contains publicly available information about Smith Barney Research, Citigroup policies prohibit analysts from participating in any efforts to solicit investment banking business; accordingly, Smith Barney research analysts may not have any communications with companies for the purpose of soliciting investment banking business. Moreover, Citigroup policy (i) prohibits research analysts from participating in road show meetings and (ii) prohibits investment banking personnel from having any input into company-specific research coverage decisions and from directing research analysts to engage in marketing or selling efforts to investors with respect to an investment banking transaction. So as to reduce the potential for conflicts of interest, as well as to reduce any appearance of conflicts of interest, Citigroup has enacted policies and procedures designed to prohibit all communications between its investment banking and research personnel except in narrowly prescribed circumstances.
© 2005 Citigroup Global Markets Inc. Member SIPC. CITIGROUP and Umbrella Device are trademarks and service marks of Citicorp or its affiliates and are used and registered throughout the world.
116