Fault tolerant distributed real time computer systems for I&C of prototype fast breeder reactor
8
Nuclear Engineering and Design 268 (2014) 96–103 Contents lists available at ScienceDirect Nuclear Engineering and Design j ourna l h om epa ge: www.elsevier.com/locate/nucengdes Fault tolerant distributed real time computer systems for I&C of prototype fast breeder reactor M. Manimaran ∗ , A. Shanmugam, P. Parimalam, N. Murali, S.A.V. Satya Murty Real Time Systems Division, Electronics, Instrumentation & Radiological Safety Group, Indira Gandhi Centre for Atomic Research (IGCAR), Kalpakkam 603102, India h i g h l i g h t s • Architecture of distributed real time computer system (DRTCS) used in I&C of PFBR is explained. • Fault tolerant (hot standby) architecture, fault detection and switch over are detailed. • Scaled down model was used to study functional and performance requirements of DRTCS. • Quality of service parameters for scaled down model was critically studied. a r t i c l e i n f o Article history: Received 2 September 2013 Received in revised form 9 December 2013 Accepted 17 December 2013 a b s t r a c t Prototype fast breeder reactor (PFBR) is in the advanced stage of construction at Kalpakkam, India. Three- tier architecture is adopted for instrumentation & control (I&C) of PFBR wherein bottom tier consists of real time computer (RTC) systems, middle tier consists of process computers and top tier constitutes of display stations. These RTC systems are geographically distributed and networked together with process computers and display stations. Hot standby architecture comprising of dual redundant RTC systems with switch over logic system is deployed in order to achieve fault tolerance. Fault tolerant dual redun- dant network connectivity is provided in each RTC system and TCP/IP protocol is selected for network communication. In order to assess the performance of distributed RTC systems, scaled down model was developed with 9 representative systems and nearly 15% of I&C signals of PFBR were connected and mon- itored. Functional and performance testing were carried out for each RTC system and the fault tolerant characteristics were studied by creating various faults into the system and observed the performance. Various quality of service parameters like connection establishment delay, priority parameter, transit delay, throughput, residual error ratio, etc., are critically studied for the network. © 2014 Elsevier B.V. All rights reserved. 1. Introduction Distributed systems are ubiquitous in modern process and power plants. Advancements in processing power and communi- cation technologies have led to the employment of such systems in modern plants. Distributed systems have many advantages compared to centralized systems like physically inherent, fault tol- erance, flexibility and high performance (Yook et al., 2001). A real-time system is popularly defined as a system where the correctness of an output not only relies on the correctness of the logical results, but also on the point in time at which these results are delivered (Sanfridson, 2000). Real time systems are predom- inantly used in safety critical or time critical applications. If the ∗ Corresponding author. Tel.: +91 44 27480500x22337; fax: +91 44 27480228. E-mail addresses: [email protected], [email protected] (M. Manimaran). timing requirements of the system are violated then the results could be catastrophic, called hard real-time systems. By contrast, there are applications that also have time deadlines, but are non- critical. Failures of such systems are not catastrophic, called soft real-time systems. Real time applications on distributed systems are becoming widespread by means of technological development. Distributed real-time systems are implemented using architectures where each node is dedicated to the implementation of a sin- gle function or class of functions. The complete system can be, in general, composed of several networks interconnected with each other (Pop et al., 2006). Distributed real time computer systems are extensively employed in process plants, automotive, avionics, defense and nuclear applications. A distributed real-time system is desired to be fault-tolerant, reliable and efficient in both computing and communication. A system is said to be fault tolerant when it continues to do its intended function even when there are some faults in the sys- tem (Paoli, 2004). Studies on distributed real-time systems are 0029-5493/$ – see front matter © 2014 Elsevier B.V. All rights reserved. http://dx.doi.org/10.1016/j.nucengdes.2013.12.040
Transcript of Fault tolerant distributed real time computer systems for I&C of prototype fast breeder reactor

Fp
MRK
h
••••
a
ARRA
1
pcice
clai
(
0h
Nuclear Engineering and Design 268 (2014) 96– 103
Contents lists available at ScienceDirect
Nuclear Engineering and Design
j ourna l h om epa ge: www.elsev ier .com/ locate /nucengdes
ault tolerant distributed real time computer systems for I&C ofrototype fast breeder reactor
. Manimaran ∗, A. Shanmugam, P. Parimalam, N. Murali, S.A.V. Satya Murtyeal Time Systems Division, Electronics, Instrumentation & Radiological Safety Group, Indira Gandhi Centre for Atomic Research (IGCAR),alpakkam 603102, India
i g h l i g h t s
Architecture of distributed real time computer system (DRTCS) used in I&C of PFBR is explained.Fault tolerant (hot standby) architecture, fault detection and switch over are detailed.Scaled down model was used to study functional and performance requirements of DRTCS.Quality of service parameters for scaled down model was critically studied.
r t i c l e i n f o
rticle history:eceived 2 September 2013eceived in revised form 9 December 2013ccepted 17 December 2013
a b s t r a c t
Prototype fast breeder reactor (PFBR) is in the advanced stage of construction at Kalpakkam, India. Three-tier architecture is adopted for instrumentation & control (I&C) of PFBR wherein bottom tier consists ofreal time computer (RTC) systems, middle tier consists of process computers and top tier constitutes ofdisplay stations. These RTC systems are geographically distributed and networked together with processcomputers and display stations. Hot standby architecture comprising of dual redundant RTC systemswith switch over logic system is deployed in order to achieve fault tolerance. Fault tolerant dual redun-dant network connectivity is provided in each RTC system and TCP/IP protocol is selected for network
communication. In order to assess the performance of distributed RTC systems, scaled down model wasdeveloped with 9 representative systems and nearly 15% of I&C signals of PFBR were connected and mon-itored. Functional and performance testing were carried out for each RTC system and the fault tolerantcharacteristics were studied by creating various faults into the system and observed the performance.Various quality of service parameters like connection establishment delay, priority parameter, transitdelay, throughput, residual error ratio, etc., are critically studied for the network.. Introduction
Distributed systems are ubiquitous in modern process andower plants. Advancements in processing power and communi-ation technologies have led to the employment of such systemsn modern plants. Distributed systems have many advantagesompared to centralized systems like physically inherent, fault tol-rance, flexibility and high performance (Yook et al., 2001).
A real-time system is popularly defined as a system where theorrectness of an output not only relies on the correctness of the
ogical results, but also on the point in time at which these resultsre delivered (Sanfridson, 2000). Real time systems are predom-nantly used in safety critical or time critical applications. If the∗ Corresponding author. Tel.: +91 44 27480500x22337; fax: +91 44 27480228.E-mail addresses: [email protected], [email protected]
M. Manimaran).
029-5493/$ – see front matter © 2014 Elsevier B.V. All rights reserved.ttp://dx.doi.org/10.1016/j.nucengdes.2013.12.040
© 2014 Elsevier B.V. All rights reserved.
timing requirements of the system are violated then the resultscould be catastrophic, called hard real-time systems. By contrast,there are applications that also have time deadlines, but are non-critical. Failures of such systems are not catastrophic, called softreal-time systems. Real time applications on distributed systemsare becoming widespread by means of technological development.Distributed real-time systems are implemented using architectureswhere each node is dedicated to the implementation of a sin-gle function or class of functions. The complete system can be, ingeneral, composed of several networks interconnected with eachother (Pop et al., 2006). Distributed real time computer systemsare extensively employed in process plants, automotive, avionics,defense and nuclear applications.
A distributed real-time system is desired to be fault-tolerant,
reliable and efficient in both computing and communication. Asystem is said to be fault tolerant when it continues to do itsintended function even when there are some faults in the sys-tem (Paoli, 2004). Studies on distributed real-time systems are
ineerin
cmisweraa
coo(Isscpscc(oatoSn
sRsdao
atScm6
2
tftft(ntrpp
sbnt(T
M. Manimaran et al. / Nuclear Eng
oncerned mostly with improving the real-time constraints of com-unication protocol (Akgün, 2001). Transmission control protocol
s designed to allow reliable two-way communication in a packet-witched network, even in the presence of communications linkshich are imperfect or overloaded. It does this by requiring the
ndpoints of the communication to expect packet loss, duplication,eordering and corruption, so that these conditions do not dam-ge data integrity, and only reduce throughput by a proportionalmount.
Prototype fast breeder reactor (PFBR) is a 500MWe, sodiumooled, pool type, mixed oxide fueled reactor having two sec-ndary loops (Chetal et al., 2006), and it is in the advanced stagef construction at Kalpakkam, India. Instrumentation & controlI&C) systems play vital role for safe and smooth plant operation.n nuclear reactors, I&C systems are used for protection, control,upervision and monitoring. I&C systems are classified, based onafety considerations, into three classes namely IA (I and C safetylass A), IB (I and C safety class B) and IC (I and C safety class C) aser Atomic Energy Regulatory Board (AERB) safety guide for pres-urized heavy water reactors (AERB SG D-1, 2002). In PFBR, thelass IA, IB and IC systems are termed as safety class-1 (SC1), safetylass-2 (SC2) and non-nuclear safety (NNS) systems respectivelyFSAR, 2010). SC1 systems play a principal role in achievementr maintenance of nuclear power plant safety. SC2 systems play
complementary role to the SC1 systems in achievement or main-enance of nuclear power plant safety. NNS systems play auxiliaryr indirect role in achievement of nuclear power plant safety (AERBG D-25, 2010). The proper operation of SC2 systems may avoid theeed to initiate safety actions by SC1 system.
Versa Module Europa (VME) bus based real time computer (RTC)ystems are deployed for I&C of SC1, SC2 and NNS systems of PFBR.TC systems used in PFBR are hard real-time systems. These RTCystems are placed in various buildings (which are geographicallyistributed) and interconnected together via an integrated localrea network. The distributed architecture followed in PFBR is firstf its kind in Indian fast breeder reactor.
The organization of this paper is as follows: Section 2 describesbout the related work. Section 3 discusses the architecture of dis-ributed real time computer systems (DRTCS) and its advantages,ection 4 details about fault tolerance in RTC systems and networkonnectivity, Section 5 describes a case study about scaled downodel of DRTCS and quality of service (QoS) parameters and Section
provides the conclusion.
. Related work
Few literatures are available related to instrumentation & con-rol for nuclear reactors. Maillart (1999) presented the design of I&Cor the European pressurized water reactor. The author has detailedhe overall I&C architecture and the requirements specificationsor I&C design with respect to role of operator, degree of automa-ion, safety classification and equipment qualifications. Kim et al.2001) have reported the development of advanced I&C for Koreanuclear power plants. They described about intelligent control sys-em for automatic startup of reactor from cold shutdown to 5% ofeactor power. They have also illustrated integrated operator sup-ort system for alarm processing and diagnostics and evaluated theerformance of these computer based systems.
Suh et al. (2008) presented the overview of I&C systems of Koreatandard nuclear power plant. They have analyzed I&C systemsased on top down approach and detailed various I&C system cabi-
ets and the interface of plant signals with the cabinets with respecto Yonggwang (unit 3) pressurized water reactor. Chuang et al.2008) discussed the regulatory overview of digital I&C system inaiwan Lungmen nuclear power plant. They have presented overallg and Design 268 (2014) 96– 103 97
architecture of Lungmen I&C systems, major regulatory issues withrespect to software safety analysis, data communication network,cyber security and verification and validation of main control roomhuman factor engineering.
3. Distributed approach
I&C signals of PFBR originate from five buildings namely reactorcontainment building, steam generator building, control building,fuel building and turbine building which are geographically dis-tributed. PFBR plant layout is given in Chetal et al. (2006). Eachbuilding contains minimum of one local control centre (LCC) andmaximum of four LCCs depending upon the density of signals, intotal there are 11 LCCs (FSAR, 2010) and about 20,000 signals arehandled. RTC system cabinets and network cabinets are housed inLCCs.
Plant signals from sensors and final control elements are ter-minated at nearest LCC of respective building. Each RTC systemperforms a dedicated function like core temperature monitoring,sodium purification control and monitoring, absorber rod drivemechanism control, failed fuel location, argon and nitrogen pres-sure control, reactor startup, etc. (FSAR, 2010).
3.1. Three-tier architecture
Three-tier architecture is adopted for instrumentation & controlof PFBR (Fig. 1). RTC systems form bottom tier, process computerscreate middle tier, operator display stations compose top tier andthe systems present in all the three tiers are networked. Processcomputers (PC) are server class machines, have the network con-nectivity to all the RTC systems, used to store plant parameters forhistorical data logging and also serve as the nodal point for datatransfer among RTC systems.
RTC system intrinsically contains four important functions:scanning the inputs from sensors, processing logics, generation ofoutputs for actuators/final control elements, sending the processeddata for storage and display purpose. SC1 systems have to completeall the four functions in 1 s, SC2 systems have to complete in 1 or5 s based on the process requirements and NNS systems have tocomplete in 20 s. In PFBR, many of the RTC systems have to gen-erate the outputs not only based on the sensor inputs which aredirectly connected to them, but also based on the inputs whichare connected to other RTC systems. Data transfers across RTC sys-tems are made available through PC. Process computer bundles therequired soft data as a packet (termed as soft inputs) and sends it tothe respective RTC system through the network during each scaninterval. Process computer also sends process thresholds (for ana-log sensors), Proportional-integral-derivative (PID) constants andalarm thresholds to RTC systems through the network. Hence thecommunication network plays a very important role for safe andtimely operation of the nuclear reactor.
Supervisory control is carried out from the operator display sta-tions. When the commands are issued to open/close the valves,start/stop the blowers or pumps, switch on/off the heaters, the com-mands have to properly reach the intended RTC system and theresponse to those commands has to be given in real time. Hencethe network shall be fast and highly reliable.
3.2. Communication protocol
TCP/IP protocol is selected for network communication in orderto cater to the above mentioned requirements. Dual redundant
communication network is provided among all the nodes in orderto enhance the dependability of communication network.TCP is connection-oriented protocol. TCP provides reliabletransmission of data in an IP environment. Among the services

98 M. Manimaran et al. / Nuclear Engineering and Design 268 (2014) 96– 103
buted
tiHt
3
tBos
fLraecba
AHcscpsct
3
so
Fig. 1. Architecture of distri
hat TCP provides, few important are stream data transfer, reliabil-ty, efficient flow control, full-duplex operation and multiplexing.andshaking signals are used for making and breaking the connec-
ion (Cerf et al., 1974).
.3. Architecture of distributed RTC systems
Fig. 1 shows the simplified architecture of distributed RTC sys-ems with two buildings and each building contains only one LCC.oth the LCCs (LCC1, LCC2) consist of three types (SC1, SC2 and NNS)f RTC systems. Each RTC system is connected to dual redundantwitches present in the LCC via category 5 UTP cable.
In each LCC, independent dual redundant switches are providedor SC1, SC2 and NNS systems respectively. Switches placed in theCC are called as ‘edge switches’ and the switches placed in controloom (CR) of control building are called as ‘core switches’. SC1, SC2nd NNS systems located at each LCC are connected to respectivedge switches present in the LCC. Edge switches of each LCC areonnected to the core switches using optical fiber cable. Distanceetween LCCs and CR is more than 200 m. Hence fiber optic cablesre used to connect switches across buildings.
SC1 and SC2 core switches are connected to NNS core switches.ll plant parameters can be monitored through NNS core switches.ence it is named as ‘Plant Backbone’. Process computers are alsoonnected to NNS core switches wherein all plant parameters aretored. Many operator display stations are connected to processomputer in order to retrieve the plant parameters for display pur-oses. Dedicated display stations are provided for SC1, SC2 and NNSystems to monitor the plant parameters even when the processomputers are not available. These display stations are connectedo respective core switches.
.4. Switched ethernet
Fig. 1 also depicts the switched ethernet architecture. Dedicatedegments are used to connect RTC systems and switches. Since thenly devices on the segments are the switch and the RTC system, the
real time computer system.
switch picks up every transmission before it reaches another node.The switch then forwards the frame over the appropriate segment,just like a bridge, but since any segment contains only a single node,the frame only reaches the intended recipient.
Data rate of RTC systems is 100 Megabits per second (Mbps).Layer 3 switches are deployed in PFBR whose data rate is in Gigabitsper second (Gbps). Three levels of switches are provided betweenRTC systems and process computer.
3.5. Advantages of distributed RTC systems
Distributed RTC systems have been deployed in PFBR becauseof the following advantages:
1. Cabling across buildings are avoided which helps to minimize thepenetrations in buildings; represses EMI/EMC issues; reducescable cost;
2. Since the cables are terminated within the building, maintenancewill be easier.
3. RTC systems perform dedicated functions. Hence number of sig-nals handled by each RTC system is less; hardware componentsneeded for each RTC is minimized which reduces the softwarecomplexity and simplifies software maintenance.
4. Failure of a RTC leads to non-availability of only a single function.By deploying fault tolerance for RTC takes care of the RTC failure.
4. Fault tolerance characteristics
Fault tolerance is a very important safety feature, must be engi-neered in safety systems. In order to meet the single failure criterionas stipulated by AERB SG D-10 (2005); AERB SG D-25 (2010), imple-mentation of fault tolerance in RTC systems is highly required.Diversity and redundancy are the two most widely used meth-
ods for fault tolerance. When two or more systems are used withdiverse technologies for the same application is called diversity,whereas two or more similar systems are used for the same appli-cation is called redundancy. Neema et al. (2004) described about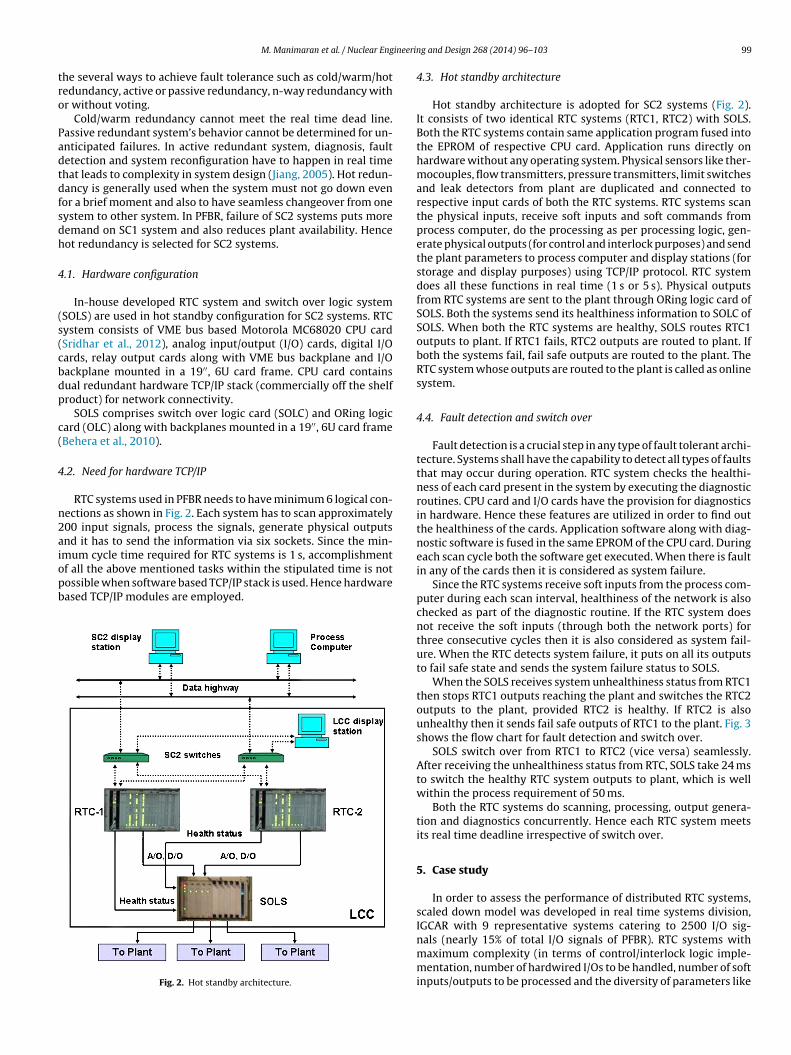
ineerin
tro
Padtdfsdh
4
(s(cbdp
c(
4
n2aiopb
M. Manimaran et al. / Nuclear Eng
he several ways to achieve fault tolerance such as cold/warm/hotedundancy, active or passive redundancy, n-way redundancy withr without voting.
Cold/warm redundancy cannot meet the real time dead line.assive redundant system’s behavior cannot be determined for un-nticipated failures. In active redundant system, diagnosis, faultetection and system reconfiguration have to happen in real timehat leads to complexity in system design (Jiang, 2005). Hot redun-ancy is generally used when the system must not go down evenor a brief moment and also to have seamless changeover from oneystem to other system. In PFBR, failure of SC2 systems puts moreemand on SC1 system and also reduces plant availability. Henceot redundancy is selected for SC2 systems.
.1. Hardware configuration
In-house developed RTC system and switch over logic systemSOLS) are used in hot standby configuration for SC2 systems. RTCystem consists of VME bus based Motorola MC68020 CPU cardSridhar et al., 2012), analog input/output (I/O) cards, digital I/Oards, relay output cards along with VME bus backplane and I/Oackplane mounted in a 19′′, 6U card frame. CPU card containsual redundant hardware TCP/IP stack (commercially off the shelfroduct) for network connectivity.
SOLS comprises switch over logic card (SOLC) and ORing logicard (OLC) along with backplanes mounted in a 19′′, 6U card frameBehera et al., 2010).
.2. Need for hardware TCP/IP
RTC systems used in PFBR needs to have minimum 6 logical con-ections as shown in Fig. 2. Each system has to scan approximately00 input signals, process the signals, generate physical outputsnd it has to send the information via six sockets. Since the min-
mum cycle time required for RTC systems is 1 s, accomplishmentf all the above mentioned tasks within the stipulated time is notossible when software based TCP/IP stack is used. Hence hardwareased TCP/IP modules are employed.Fig. 2. Hot standby architecture.
g and Design 268 (2014) 96– 103 99
4.3. Hot standby architecture
Hot standby architecture is adopted for SC2 systems (Fig. 2).It consists of two identical RTC systems (RTC1, RTC2) with SOLS.Both the RTC systems contain same application program fused intothe EPROM of respective CPU card. Application runs directly onhardware without any operating system. Physical sensors like ther-mocouples, flow transmitters, pressure transmitters, limit switchesand leak detectors from plant are duplicated and connected torespective input cards of both the RTC systems. RTC systems scanthe physical inputs, receive soft inputs and soft commands fromprocess computer, do the processing as per processing logic, gen-erate physical outputs (for control and interlock purposes) and sendthe plant parameters to process computer and display stations (forstorage and display purposes) using TCP/IP protocol. RTC systemdoes all these functions in real time (1 s or 5 s). Physical outputsfrom RTC systems are sent to the plant through ORing logic card ofSOLS. Both the systems send its healthiness information to SOLC ofSOLS. When both the RTC systems are healthy, SOLS routes RTC1outputs to plant. If RTC1 fails, RTC2 outputs are routed to plant. Ifboth the systems fail, fail safe outputs are routed to the plant. TheRTC system whose outputs are routed to the plant is called as onlinesystem.
4.4. Fault detection and switch over
Fault detection is a crucial step in any type of fault tolerant archi-tecture. Systems shall have the capability to detect all types of faultsthat may occur during operation. RTC system checks the healthi-ness of each card present in the system by executing the diagnosticroutines. CPU card and I/O cards have the provision for diagnosticsin hardware. Hence these features are utilized in order to find outthe healthiness of the cards. Application software along with diag-nostic software is fused in the same EPROM of the CPU card. Duringeach scan cycle both the software get executed. When there is faultin any of the cards then it is considered as system failure.
Since the RTC systems receive soft inputs from the process com-puter during each scan interval, healthiness of the network is alsochecked as part of the diagnostic routine. If the RTC system doesnot receive the soft inputs (through both the network ports) forthree consecutive cycles then it is also considered as system fail-ure. When the RTC detects system failure, it puts on all its outputsto fail safe state and sends the system failure status to SOLS.
When the SOLS receives system unhealthiness status from RTC1then stops RTC1 outputs reaching the plant and switches the RTC2outputs to the plant, provided RTC2 is healthy. If RTC2 is alsounhealthy then it sends fail safe outputs of RTC1 to the plant. Fig. 3shows the flow chart for fault detection and switch over.
SOLS switch over from RTC1 to RTC2 (vice versa) seamlessly.After receiving the unhealthiness status from RTC, SOLS take 24 msto switch the healthy RTC system outputs to plant, which is wellwithin the process requirement of 50 ms.
Both the RTC systems do scanning, processing, output genera-tion and diagnostics concurrently. Hence each RTC system meetsits real time deadline irrespective of switch over.
5. Case study
In order to assess the performance of distributed RTC systems,scaled down model was developed in real time systems division,IGCAR with 9 representative systems catering to 2500 I/O sig-
nals (nearly 15% of total I/O signals of PFBR). RTC systems withmaximum complexity (in terms of control/interlock logic imple-mentation, number of hardwired I/Os to be handled, number of softinputs/outputs to be processed and the diversity of parameters like
100 M. Manimaran et al. / Nuclear Engineering and Design 268 (2014) 96– 103
sla
5
i
TI
AA
Fig. 3. Flow chart for fault detection and switch over.
odium/argon/nitrogen signals) are selected for this study, to simu-ate near field conditions. Hardware type and make were the sames used in PFBR.
.1. Scaled down model of distributed RTC systems
Table 1 shows I&C systems used for scaled down model andts corresponding I/O signal details. These I&C systems are SC2
able 1&C systems used in scaled down model of distributed RTC systems.
S. no. Description Scan cycle/time (s) No. ofhardwiredinputs
AI DI
1 Reactor startup authorizationlogic
1 0 90
2 Fuel handling startupauthorization logic
1 0 60
3 Primary sodium main system 5 120 60
4 Primary sodium purificationsystem
1 90 150
5 Top shield cooling 1 180 150
6 Biological shield cooling 5 120 120
7 Service water system 5 60 90
8 Chilled water system 5 60 180
9 Primary sodium fill and drain 5 120 240
I – analog inputs, DI – digital inputs.O – analog outputs, DO – digital/relay outputs.
Fig. 4. Flow chart of typical application software for RTC system.
category. These systems are located at three different laborato-ries, which are geographically distributed. RTC systems 1–3 (fromTable 1) are placed at Lab-A, 4–6 are placed at Lab-B and 7–9 areplaced at Lab-C. Process computer and display stations are placedat Lab-D. These laboratories are equivalent to local control centersof PFBR. Distributed architecture shown in Fig. 1 is followed for thescaled down model and each RTC systems are configured with hotstandby architecture as shown in Fig. 2.
V-model was selected for software development because theverification and validation (V&V) of documents and software startsfrom the requirements stage itself which helps to avoid errorscreeping into the software. MISRA C complaint code was devel-oped for each RTC system and the final executable was fused intothe EPROM of CPU card.
Fig. 4 shows the flow chart of application software executedby each RTC system. Only processing logic was different for eachRTC system. After power-on, the RTC runs power-on self test andinitialization routines wherein the RAM locations of the CPU card
No. of soft inputs No. ofhardwiredoutputs
No. of soft outputs Total no. ofsoft I/Os(bytes)
Analog Digital AO RO Analog Digital Inputs Outputs
912 775 0 45 0 182 4423 182
79 44 0 30 0 112 360 112
747 43 0 45 120 283 3031 763650 87 8 90 105 406 2687 826
900 297 4 90 184 240 3897 976600 145 8 60 128 180 2545 692181 0 0 15 60 113 724 353181 0 0 135 60 332 724 572738 31 16 60 124 505 2983 1001

ineerin
afdAcarsclaa
oiaTRsRu
fsespaathts
5
nbhwRaawwchboirto
omwt
5
Bt
M. Manimaran et al. / Nuclear Eng
re checked with 0 × 5555, 0 × AAAA in order to find the stuck-ataults and then initialization of all peripherals namely timer, watch-og timer, network ports and I/O card addresses are carried out.s part of initialization all interrupts and exceptions of the pro-essor are handled properly and the network ports are configureds server. After initialization, the RTC system waits for configu-ation data from process computer before proceeding with otherteps of application software execution. Typical configuration dataontains the A, B, C coefficients for quadratic equations of sensors,ower/upper process range for each analog input, set points for PIDlgorithms, PID coefficients, alarm thresholds, set points, hysteresisnd integral error.
Configuration data is sent from process computer to RTC systemnly at startup of RTC system and whenever there is any changen the set points or thresholds or PID constants. Process computerlso sends soft inputs to RTC systems during each scan interval.hese soft inputs are the physical plant signals connected to otherTC systems, processed and sent to process computer. The requiredignals are bundled by process computer and sent to the respectiveTC systems. In this study the required soft inputs were simulatedsing process computer.
After receiving the configuration data, the RTC system does theollowing in each scan interval (1 s or 5 s): analog and digital inputscan, receiving soft inputs through network ports, processing, gen-ration of hardwired outputs and generation of soft outputs andending it to process computer and display stations using TCP/IProtocol. Typical soft outputs from RTC system to process computernd display stations contain engineering unit converted values ofnalog inputs, status of digital inputs, values of analog outputs, sta-us of hardwired outputs, status of hardwired/soft alarm outputs,ealthiness of the CPU card and I/O cards of the given RTC sys-em, RTC1/RTC2 healthiness and information regarding the onlineystem.
.2. Socket programming
In case of TCP/IP connection, whenever there is any delay in con-ection establishment between client and server, then retries has toe done by the client. If the RTC system is configured as client then itas to take care of connection establishment and associated retries,hich may lead to non-compliance of real time deadline by theTC system. Hence network module of RTC system was initializednd configured as server. Process computer and display stationsre configured as client. Three sockets are created in each net-ork module in order to communicate with PC and display stationshich are located at Lab-D. TCP connection establishment with the
lient is taken care by network module by following three wayandshake protocols. Though three levels of switches are providedetween server and client (shown in Fig. 1), probability for time-ut during connection establishment, data transmission/receptions negligible because switches and the clients work at much fasterate compared to the RTC systems. Network module is programmedo respond to maximum of six retries before timeout at an intervalf 1 ms, 3 ms, 7 ms, 15 ms, 31 ms and 63 ms.
During data transmission, processor copies the data from SRAMf CPU card to buffer of network module and instructs the networkodule to send the data to the client. During data reception, net-ork module stores the data into its buffer and gives interrupt to
he processor, which copies data from the buffer into SRAM.
.3. Testing of distributed RTC systems
Testing is very important activity in the development process.efore deploying the RTC systems in nuclear reactor, rigorousesting in terms of functional and performance requirements is
g and Design 268 (2014) 96– 103 101
essential. Exhaustive testing was carried out on the RTC systemsof the scaled down model which are detailed below.
5.3.1. Functional testingTest cases were generated for all the functional requirements
of each RTC system, executed the test cases and the functionalitieswere monitored. Equivalence class partitioning and boundary valueanalysis were used to generate the test cases. Number of hardwiredoutputs generated by each RTC system is listed in Table 1. Eachoutput contains associated processing logic. Hardwired outputs canbe broadly categorized as: control outputs, interlock outputs andwindow alarm outputs.
5.3.1.1. Control outputs (analog outputs). Many of the RTC systemsgenerate soft PID based 4–20 mA control outputs. The control algo-rithms were tested by changing the proportional, integral andderivative constants from operator display station and monitoredthe corresponding change in control output. The control algorithmswere also tested by simulating different process values for the givenset point and by changing different set points for the given processvalue. It was observed that the control algorithms were workingsatisfactorily.
5.3.1.2. Interlock outputs (digital outputs). Majority of the outputsgenerated by RTC systems are interlock outputs. These outputsare generated to start/stop the pumps or blowers, open/close thevalves, switch on/off the heaters, etc. Each output was tested bysimulating the required combination of inputs.
5.3.1.3. Window alarm outputs (digital outputs). Window alarmsare generated to draw the operator attention when the criticalprocess parameters cross the thresholds. Simulated the processparameters to cross the threshold values and monitored the win-dow alarm outputs. These outputs were also monitored by keepingthe process parameters at constant value and changed the thresh-old values.
5.3.1.4. CRT alarms. CRT alarms are generated when less criticalprocess parameters cross the thresholds. These alarms are dis-played in display station. Procedures used to generate and monitorthe window alarms were followed for CRT alarms.
5.3.2. Performance testingThe non-functional requirements such as scan time, diagnostic
checks, network healthiness checks and the time elapse betweenthe issue of soft commands and generation of corresponding hard-wired outputs were carried out as part of performance testing.
5.3.2.1. Scan time. The scan time was set as 1 s/5 s based on therequirements and checked the actual time taken by the RTC sys-tem for each cycle, using the timer present in the CPU card. It wasobserved that the RTC systems need less than 500 ms for 1 s scantime and 1 s for 5 s scan time.
5.3.2.2. Diagnostic check. Healthiness of each card present in theRTC system was checked by running the diagnostic routines, whichare executed in each scan cycle along with the application programas shown in Fig. 4. It was observed that RTC system sends its health-iness status to SOLS, when all the cards are healthy. Unhealthinesswas created in the RTC system by switching OFF the power supplyor by removing the address jumpers in anyone of the I/O cards or by
removing a card from the VME backplane and monitored its healthstatus output. It was observed that the RTC system was giving itsstatus to SOLS as unhealthy when anyone of the above mentionedscenario was created.
1 ineering and Design 268 (2014) 96– 103
5wtimo
5iboowafs
5tclaic
5
l
5SuwsRR
5SuSuRh
5SsRtpw
5wbgmrhgtwctt
02 M. Manimaran et al. / Nuclear Eng
.3.2.3. Network healthiness check. Performance of the RTC systemas studied by disconnecting one network cable. It was observed
hat there was no change in the performance of RTC system sincet receives the soft inputs via other network port. Performance was
onitored by disconnecting both the network cables and it wasbserved that the RTC system goes to unhealthy state.
.3.2.4. Time elapse for soft commands. Time elapsed between thessue of a soft command (to open/close the valves, start/stop thelowers or pumps, switch on/off the heaters) and the generationf corresponding output in the RTC system was studied. It wasbserved that maximum time elapse was 500 ms for RTC systemith 1 s scan time and 1 s for RTC system with 5 s scan time which
re well within acceptable limit. Test was repeated several timesor different outputs of same RTC system and also on different RTCystems. It was observed that consistency was maintained.
.3.2.5. Time elapse with higher network traffic. The above men-ioned test was also carried out with more network traffic byonnecting all the RTC systems to general purpose internet enabledocal area network (LAN) where 60 personal computers werelready connected in the LAN and each node was accessing variousnternet applications. It was observed that there was no significanthange in the elapsed time.
.3.3. Testing the fault tolerant characteristics of RTC systemFault tolerant characteristics of RTC system was tested in fol-
owing scenarios.
.3.3.1. Scenario-1. Both the RTC systems were kept as healthy.OLS was routing RTC1 outputs to plant. RTC1 was made asnhealthy and observed that SOLS was routing RTC2 outputs. RTC2as also made as unhealthy and observed that SOLS was routing fail
afe output from RTC2 system since RTC1 was already unhealthy.TC1 was made as healthy and observed that SOLS was routingTC1 outputs.
.3.3.2. Scenario-2. Both the RTC systems were kept as healthy.OLS was routing RTC1 outputs to plant. RTC2 was made asnhealthy and observed that there was no switch over in outputs.OLS was continuing to route RTC1 outputs. RTC1 was made asnhealthy and observed that SOLS was routing fail safe output fromTC1 system since RTC2 was already unhealthy. RTC2 was made asealthy and observed that SOLS was routing RTC2 outputs.
.3.3.3. Scenario-3. Both the RTC systems were kept as healthy.OLS was routing RTC1 outputs to plant. Power supply to SOLS waswitched OFF. It was observed that SOLS was continuing to routeTC1 output to plant. RTC1 was made as unhealthy and observedhat the SOLS was not switching from RTC1 to RTC2 since the SOLSower supply was not available. After a while, SOLS power supplyas made ON and observed that SOLS was routing RTC2 outputs.
.3.3.4. Testing the control output. When both the RTC systemsere healthy, the control output and integral error generated from
oth the systems were found to be identical and the control outputenerated from RTC1 was routed to corresponding control ele-ent. When RTC1 was made as unhealthy then RTC2 output was
outed to the control element. When RTC1 was brought back toealthy status, it was observed that the control output and inte-ral error of RTC1 and RTC2 were different. In order to synchronizehe integral error and control output, integral error accumulation
as sent to process computer from both the RTC systems. Processomputer was configured in such a way that, when the online sys-em (RTC1) fails then it sends the integral error of online systemo the redundant system (RTC2) as part of configuration data. The
i
Fig. 5. Data transfer rate.
redundant system was generating the control output based on theintegral error received from process computer. This synchroniza-tion ensures that the control element obtains the smooth outputirrespective of RTC1 or RTC2 online.
Control output was monitored by creating faults in RTC1 andRTC2 and observed there was unruffled control output irrespectiveof the RTC1 or RTC2 online.
5.4. Quality of service (QoS) parameters
The goal of QoS is to provide guarantees on the ability of anetwork to deliver predictable results. Quantification of QoS fordistributed applications is essential. In order to evaluate the datatransfer rate of distributed RTC systems, different data size weresent/received from/to RTC system to/from the client nodes throughlocal area network. Time required to transfer different data size isshown in Fig. 5.
From Fig. 5, the average data transfer rate between RTC sys-tem and the client node was found to be 640 kbps (80 kB/s). Timerequired for RTC system to send 1 kB data through 6 sockets to 6 dif-ferent client nodes was tested to be 75 ms. Hardware timer presentin CPU card is used to calculate the time required for data transfer.The performances of the distributed RTC system were determinedby the following quality of service parameters:
i) Connection establishment delay is amount of time elapsedbetween time when client request the connection and the timewhen acknowledgment is received from server. It is calcu-lated by closing the socket from client. Network module alsocloses the socket upon close command from client and cre-ates the socket again with same port number and waits inlisten mode. When connection request comes from client thennetwork module accepts the request and connection gets estab-lished. Connection establishment delay was found to be in theorder of milliseconds.
ii) Priority parameter provides a way to indicate that some of itsconnections are more important than other ones in the eventof congestion, to make sure that high-priority connections getserviced before the low priority ones. The packets are markedwith services like routine, priority, immediate, etc., using thetype of service (TOS) register provided in the network modulewhich directly represents the TOS field of IP header. The packetswere observed to be switched according to the priority of the
packets.ii) Throughput parameter measures the number of bytes of datatransferred per second. Throughput of RTC systems was calcu-lated as 640 kbps.

ineerin
i
v
6
wmoPacttQev
A
mhIf
M. Manimaran et al. / Nuclear Eng
v) Residual error ratio is ratio of number of lost data to total datasent. 64 kB of data transferred from server to client more than100 times with different levels of traffic on the network. It wasfound that there was no loss of data. Hence this value is consid-ered as zero.
v) Transit delay measures the time between a message being sentby the client and the time it is received by the server. It was alsoobserved to be in the order of milliseconds.
i) Protection parameter provides a way to protect against unau-thorized third parties reading or modifying the transmitteddata. In PFBR, dedicated LANs are used for SC1, SC2 and NNSsystems and these LANs are not connected to general purposenetwork and the RTC systems work without operating systemand hence virus creepage and unauthorized third party intru-sion into the system is fully avoided.
. Conclusion
Scaled down model of fault tolerant distributed RTC systemsere successfully implemented and the functional and perfor-ance requirements were tested. Fault tolerant characteristics
f RTC systems were analyzed by simulating various faults. SoftID based control algorithms were tested. Six sockets were cre-ted in each RTC system (three from each network port) and TCPonnection establishment, send/receive data and TCP connectionermination were thoroughly studied. Various retry parame-ers were set and tested the connection establishment delays.oS parameters such as priority parameter, throughput, residualrror ratio, transit delay and protection parameter were criticallyiewed.
cknowledgements
First three authors thank the hardware design team of Instru-
entation & Control Group, IGCAR for providing the necessaryardware for scaled down model. The authors thank the officers ofCD, Power Plant Group, IGCAR for providing the I&C requirementsor Real Time Computer systems.
g and Design 268 (2014) 96– 103 103
References
AERB SG D-1, 2002. Atomic Energy Regulatory Board: Safety Classification andSeismic Categorisation for Structures, Systems and Components of PressurisedHeavy Water Reactors. AERB Safety Guide No. AERB/NPP-PHWR/SG/D-1, Mum-bai, India.
AERB SG D-10, 2005. Atomic Energy Regulatory Board: Safety Systems forPressurised Heavy Water Reactors. AERB Safety Guide No. AERB/NPP-PHWR/SG/D-10, Mumbai, India.
AERB SG D-25, 2010. Atomic Energy Regulatory Board: Computer Based Systemsof Pressurised Heavy Water Reactors. AERB Safety Guide No. AERB/NPP-PHWR/SG/D-25, Mumbai, India.
Akgün, B.T., 2001. BAG distributed real-time operating system and task migration.Turk. J. Electr. Eng. 9 (2), 123–136.
Behera, R.P., Murali, N., Swaminathan, P., 2010. Design and Development of Switchover Logic System for PFBR. NSNI, Mumbai, India, pp. 78–82.
Cerf, V., Dalal, Y., Sunshine, C., 1974. Specification of Internet Transmission ControlProgram. RFC, pp. 675.
Chetal, S.C., Balasubramaniyan, V., Chellapandi, P., Mohanakrishnan, P., Puthiyav-inayagam, P., Pillai, C.P., Raghupathy, S., Shanmugham, T.K., Sivathanu Pillai, C.,2006. The design of prototype fast breeder reactor. Nucl. Eng. Des. 236, 852–860.
Chuang, C.F., Chou, H.P., Chen, Y.B., Shiao, H., 2008. Regulatory overview of digitalI&C system in Taiwan Lungmen project. Ann. Nucl. Energy 35, 877–889.
FSAR, 2010. Instrumentation & control, PFBR/FSAR/R-0. In: PFBR Final Safety AnalysisReport (Internal report; Chapter 8).
Jiang, J., 2005. Fault tolerant control systems – an introductory overview. ActaAutom. Sin. 31 (1), 161–174.
Kim, J.-T., Kwon, K.-C., Hwang, I.-K., Lee, D.-Y., Park, W.-M., Kim, J.-S., Lee, S.-J., 2001.Development of advanced I&C in nuclear power plants: ADIOS and ASICS. Nucl.Eng. Des. 207 (1), 105–119.
Maillart, H., 1999. Design of I&C for the European pressurized water reactor. Nucl.Eng. Des. 187, 135–141.
Neema, S., Bapty, T., Shetty, S., Nordstrom, S., 2004. Automatic fault mitigation inembedded systems. Eng. Appl. Artif. Intel. 17 (7), 711–725.
Paoli, A., 2004. Fault detection and fault tolerant control for distributed systems: Ageneral framework. University of Bologna (Ph.D thesis).
Pop, P., Eles, P., Peng, Z., Pop, T., 2006. Analysis and optimization of distributed real-time embedded systems. ACM Trans. Des. Autom. Electron. Syst. 11 (3), 593–625.
Sanfridson, M., 2000. Timing Problems in Distributed Real-Time Computer ControlSystems, Technical Report. Royal Institute of Technology, KTH.
Sridhar, N., Saritha Menon, P., Thirugnana Murthy, D., Madhusoodanan, K., 2012.Design of VME Bus Based CPU Card. PFBR/66120/DN/1045/REV-A, Kalpakkam,India (Internal report).
Suh, Y.S., Park, J.Y., Kang, H.T., Kim, H.S., 2008. An overview of instrumentation and
control systems of a Korea standard nuclear power plant: a signal interfacestandpoint. Nucl. Eng. Des. 238 (12), 3508–3521.Yook, J.K., Tilbury, D.M., Soparkar, N.R., 2001. A design methodology for distributedcontrol systems to optimize performance in the presence of time delays. Int. J.Control 74, 58–76.