Fault seal analysis in Move - petex.com · Fault seal analysis in Move Faults play a critical role...
6
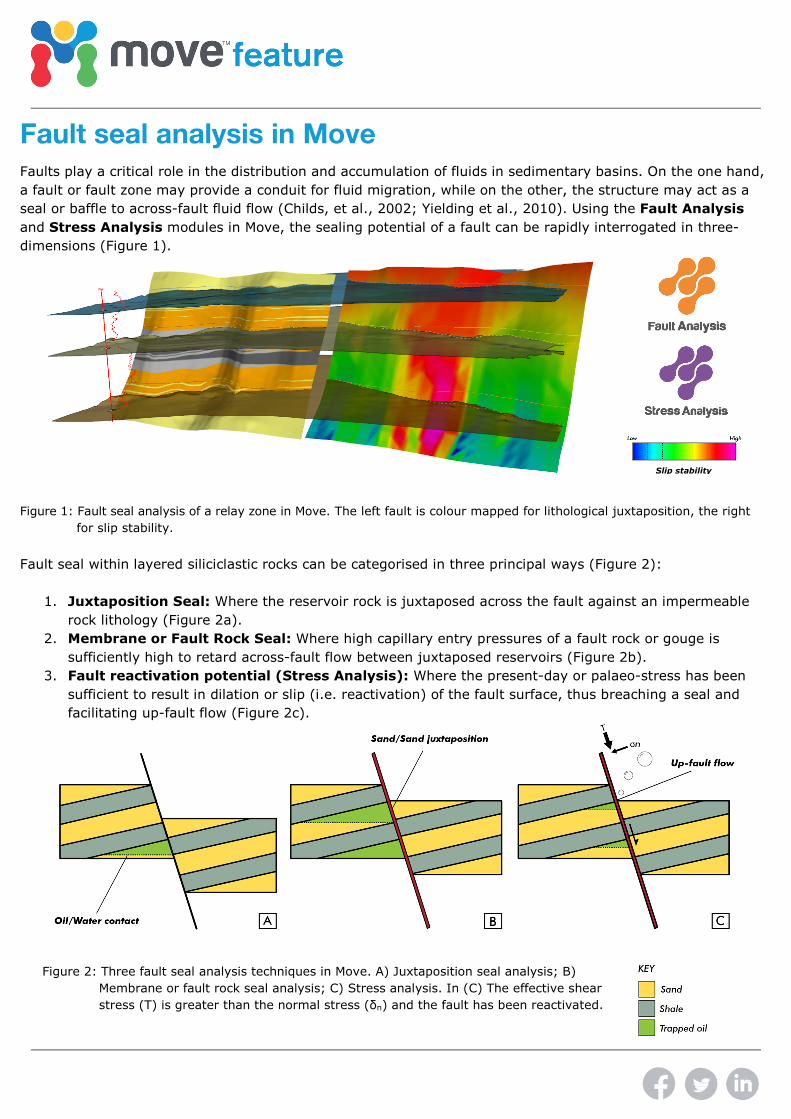
Fault seal analysis in Move Faults play a critical role in the distribution and accumulation of fluids in sedimentary basins. On the one hand, a fault or fault zone may provide a conduit for fluid migration, while on the other, the structure may act as a seal or baffle to across-fault fluid flow (Childs, et al., 2002; Yielding et al., 2010). Using the Fault Analysis and Stress Analysis modules in Move, the sealing potential of a fault can be rapidly interrogated in three- dimensions (Figure 1). Figure 1: Fault seal analysis of a relay zone in Move. The left fault is colour mapped for lithological juxtaposition, the right for slip stability. Fault seal within layered siliciclastic rocks can be categorised in three principal ways (Figure 2): 1. Juxtaposition Seal: Where the reservoir rock is juxtaposed across the fault against an impermeable rock lithology (Figure 2a). 2. Membrane or Fault Rock Seal: Where high capillary entry pressures of a fault rock or gouge is sufficiently high to retard across-fault flow between juxtaposed reservoirs (Figure 2b). 3. Fault reactivation potential (Stress Analysis): Where the present-day or palaeo-stress has been sufficient to result in dilation or slip (i.e. reactivation) of the fault surface, thus breaching a seal and facilitating up-fault flow (Figure 2c). Figure 2: Three fault seal analysis techniques in Move. A) Juxtaposition seal analysis; B) Membrane or fault rock seal analysis; C) Stress analysis. In (C) The effective shear stress (Т) is greater than the normal stress (δn) and the fault has been reactivated. Slip stability
Transcript of Fault seal analysis in Move - petex.com · Fault seal analysis in Move Faults play a critical role...
Fault seal analysis in Move
Faults play a critical role in the distribution and accumulation of fluids in sedimentary basins. On the one hand,
a fault or fault zone may provide a conduit for fluid migration, while on the other, the structure may act as a
seal or baffle to across-fault fluid flow (Childs, et al., 2002; Yielding et al., 2010). Using the Fault Analysis
and Stress Analysis modules in Move, the sealing potential of a fault can be rapidly interrogated in three-
dimensions (Figure 1).
Figure 1: Fault seal analysis of a relay zone in Move. The left fault is colour mapped for lithological juxtaposition, the right
for slip stability.
Fault seal within layered siliciclastic rocks can be categorised in three principal ways (Figure 2):
1. Juxtaposition Seal: Where the reservoir rock is juxtaposed across the fault against an impermeable
rock lithology (Figure 2a).
2. Membrane or Fault Rock Seal: Where high capillary entry pressures of a fault rock or gouge is
sufficiently high to retard across-fault flow between juxtaposed reservoirs (Figure 2b).
3. Fault reactivation potential (Stress Analysis): Where the present-day or palaeo-stress has been
sufficient to result in dilation or slip (i.e. reactivation) of the fault surface, thus breaching a seal and
facilitating up-fault flow (Figure 2c).
Figure 2: Three fault seal analysis techniques in Move. A) Juxtaposition seal analysis; B)
Membrane or fault rock seal analysis; C) Stress analysis. In (C) The effective shear
stress (Т) is greater than the normal stress (δn) and the fault has been reactivated.
Slip stability

Juxtaposition seal analysis
Across-fault lithological juxtaposition can be
quantified by constructing juxtaposition diagrams or
“Allan maps” (Allan, 1989). These diagrams classify
areas of lithological overlap between the hanging
wall and footwall of a fault (Figure 3). User-defined
colour maps can be applied to highlight areas of
reservoir/reservoir or reservoir/seal juxtaposition.
Juxtaposition diagrams can be constructed in the
Fault Analysis module in Move in 2D from well data
(fault triangle diagrams) or in 3D from a complete
geological model (3D juxtaposition diagrams).
Figure 3: Block diagram illustrating across-fault lithological
juxtaposition (after Knipe, 1997).
Fault rock seal analysis
Fault rocks typically have higher capillary entry
pressures than surrounding reservoir host rocks (Sperrevik et al., 2002) and, therefore, will impede flow
between reservoirs containing immiscible fluids (e.g. oil and water). Whilst a sealing fault can be recognised in
well data as a fluid pressure difference, the subsurface properties of a fault rock cannot be interpreted directly
from seismic data. Consequently, a series of published equations have attempted to define the lithology of a
fault rock or gouge for given throw magnitudes. The resultant values represent 3D sealing proxies which can be
empirically calibrated against known reservoir data, e.g. across-fault pressure differences (Yielding et al,. 1997;
Childs et al., 2002; Sperrevik, et al., 2002).
Three sealing proxies are calculated in the Fault Analysis module in Move: Shale Smear Factor (Lindsay et al.
1993); Clay Smear Potential (Bouvier et al., 1989); and Shale Gouge Ratio (Yielding et al., 1997). The latter is
often the most readily applied seal proxy.
Shale Gouge Ratio (SGR) states that the proportion of shale (or clay) within a fault rock will be the same as
the composition of the stratigraphy that has slipped past that point (Yielding et al., 1997). Calibration has
demonstrated that faults with SGR values > 0.2 have a higher chance of seal (Childs et al., 1997; Yielding et
al., 1997). SGR is calculated using the relationship defined in Figure 4 (after Yielding et al., 1997).
Figure 4: Diagram illustrating the calculation of Shale Gouge Ratio for a sequence of variable thicknesses (��) and Vshale
values (�����.

In Move, Vshale is input as an explicit value, calculated from the existing lithological data in the Rock Properties
database or projected from a calculated Vshale curve onto a fault surface.
Fault reactivation potential
Faults that have been critically stressed or reactivated following hydrocarbon charge are more likely to act as
conduits for fluid flow (Sibson, 1994). Consequently, a fault prone to reactivation may provide a poor baffle to
flow despite having favourable juxtaposition and membrane seals. Using the Stress Analysis module in Move,
the risk of fault seal being breached by reactivation can be rapidly assessed.
Stress Analysis calculates the effective shear and normal stresses acting on a 3D surface for a user-defined
triaxial stress state. The resultant values can be combined with pore pressure changes, to quantify the
reactivation potential of a fault. In total, six parameters can be applied in Move to evaluate the probability of
fault reactivation and seal breach. Slip Tendency is often the most commonly applied parameter in fault seal
analysis (Morris et al., 1996; Mildren et al., 2005).
Slip Tendency is the ratio of effective shear stress (Т) to normal stress (σn). Greater values indicate a higher
slip tendency and, therefore, a higher probability of fault reactivation. Calibration suggests that 0.6 is the
critical value above which, a fault will slip, thus breaching the seal and providing a potential conduit for fluid
flow (Cotesta et al., 2007) (Figure 5).
Figure 5: Mohr circle illustrating the calculation of Slip tendency. The red point represents the resolved stress on one triangle
of a fault mesh surface.
Applying fault seal in Move
In the following section, the sealing potential of a fault zone will be evaluated in Move. The model comprises a
relay zone of two normal faults offsetting three horizons (Figure 1). The stratigraphy is constrained by a gamma
log within a hanging wall well.
The Lithological Juxtaposition and Shale Gouge Ratio across the fault zone can be calculated using the
following workflow:
1. Collect the 3D model into Fault Analysis;
2. Use the Horizon sheet to create Cut-off lines at the intersection of the horizons (Figure 6);
3. Convert the gamma log to Vshale in the Wells sheet using a Vshale correction curve (Figure 6);
Figure 6: Fault analysis user interface showing constructed cut-off lines and the gamma log conversion tool.
4. Define a juxtaposition colour map in the Lithological Juxtaposition tab on the Seal Analysis sheet;
5. Create juxtaposition diagram by clicking Create Lithological Juxtaposition;
6. Calculate shale gouge ratio (SGR) in the Seal Proxies tab of the Seal Analysis sheet;
7. Display SGR on the fault surfaces by clicking Create Seal Proxy.
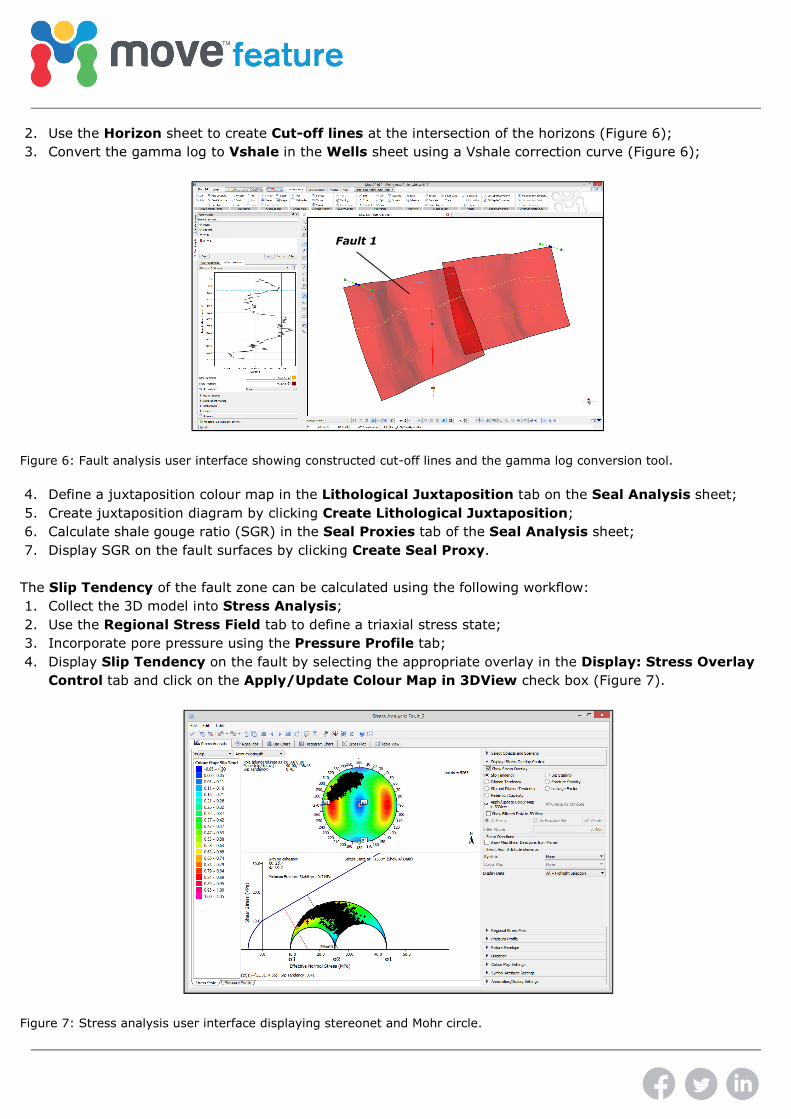
The Slip Tendency of the fault zone can be calculated using the following workflow:
1. Collect the 3D model into Stress Analysis;
2. Use the Regional Stress Field tab to define a triaxial stress state;
3. Incorporate pore pressure using the Pressure Profile tab;
4. Display Slip Tendency on the fault by selecting the appropriate overlay in the Display: Stress Overlay
Control tab and click on the Apply/Update Colour Map in 3DView check box (Figure 7).
Figure 7: Stress analysis user interface displaying stereonet and Mohr circle.
Fault 1

Fault seal analysis results
The results of fault seal analysis for Fault 1 (Figure 6) are summarised in Figure 8. The Fault Analysis results
(Figure 8a and 8b) show that a large area of the fault exhibits juxtaposition and shale gouge ratio values that
would suggest the fault will seal. However, the Stress Analysis results indicate that a significant proportion of
the fault is critical stressed meaning the fault may act as a vertical conduit to fluid flow.
Figure 8: Results of seal analysis on Fault 1 (Figure 6). A) Juxtaposition analysis, B) Shale Gouge Ratio and C) Slip
Tendency. Black box delineates area with preferential juxtaposition and fault rock seal but a high slip tendency.
This work has demonstrated how fault seal analysis is implemented in Move using the Fault Analysis and
Stress Analysis modules. Moreover, the analysis has highlighted the importance of applying multiple methods
during interrogation of seal integrity.

References
Allan, U.S., 1989. Model for hydrocarbon migration and entrapment within faulted structures. AAPG
Bulletin, 73(7), pp.803-811.
Childs, C., Walsh, J.J. and Watterson, J., 1997. Complexity in fault zone structure and implications for fault seal
prediction. Norwegian Petroleum Society Special Publications, 7, pp.61-72.
Childs, C., Manzocchi, T., Nell, P.A.R., Walsh, J.J., Strand, J.A., Heath, A.E. and Lygren, T.H., 2002. Geological
implications of a large pressure difference across a small fault in the Viking Graben. Norwegian Petroleum
Society Special Publications, 11, pp.187-201.
Cotesta, L., Kaiser, P.K., Cai, M. and Vorauer, A., 2007, January. Application of Scientific Visualisation-Stress
Control On Permeability Anisotropy In Moderately Fractured Rock. In 1st Canada-US Rock Mechanics
Symposium. American Rock Mechanics Association.
Bouvier, J.D., Kaars-Sijpesteijn, C.H., Kluesner, D.F., Onyejekwe, C.C. and Van der Pal, R.C., 1989. Three-
dimensional seismic interpretation and fault sealing investigations, Nun River Field, Nigeria. AAPG
Bulletin, 73(11), pp.1397-1414.
Lindsay, N.G., Murphy, F.C., Walsh, J.J. and Watterson, J., 1993. Outcrop studies of shale smears on fault
surfaces. The geological modelling of hydrocarbon reservoirs and outcrop analogues, pp.113-123.
Mildren, S.D., Hillis, R.R., Lyon, P.J., Meyer, J.J., Dewhurst, D.N. and Boult, P.J., 2005. FAST: A new technique
for geomechanical assessment of the risk of reactivation-related breach of fault seals.
Morris, A., Ferrill, D.A. and Henderson, D.B., 1996. Slip-tendency analysis and fault
reactivation. Geology, 24(3), pp.275-278.
Sibson, R.H., 1994. Crustal stress, faulting and fluid flow. Geological Society, London, Special
Publications, 78(1), pp.69-84.
Sperrevik, S., Gillespie, P.A., Fisher, Q.J., Halvorsen, T. and Knipe, R.J., 2002. Empirical estimation of fault rock
properties. Norwegian Petroleum Society Special Publications, 11, pp.109-125.
Yielding, G., Freeman, B. and Needham, D.T., 1997. Quantitative fault seal prediction. AAPG Bulletin, 81(6),
pp.897-917.
Yielding, G., Bretan, P. and Freeman, B., 2010. Fault seal calibration: a brief review. Geological Society,
London, Special Publications, 347(1), pp.243-255.