Fault imaging of Hibernia 3-D seismic data using edge-detection
12
Fault imaging using coherency measures CREWES Research Report — Volume 11 (1999) Fault imaging of Hibernia 3-D seismic data using edge- detection and coherency measures Nicholle Carter and Laurence R. Lines ABSTRACT “Coherency cube” and fault detection technologies have evolved rapidly in recent years as important tools for seismic interpretation. The following paper, developed as a joint project between investigators at Memorial University and the University of Calgary, compares several of the fault detection methods for data from Hibernia field. The results, which are outlined in detail in the Memorial University M.Sc. thesis of Nicholle Carter, support the usefulness of coherency measures prescribed by Marfurt et al. (1998). INTRODUCTION The development of the “coherence cube” and related technologies during recent years has proven to be a valuable interpretive aid for fault detection as evidenced by Nissen et al. (1999). Following the introduction of The Coherence Cube by Bahorich and Farmer (1995) for the interpretation of 3-D seismic data from offshore Trinidad, several papers have described the development and application of algorithms for detecting fault discontinuities. One of these, the paper by Marfurt et al. on 3-D seismic attributes using a semblance-based coherency algorithm received the award for Best Paper in Geophysics in 1998, a testimony to the importance of this technology. The detection of faults in offshore seismic exploration has been enhanced by use of algorithms from two families – those that measure coherency and those that detect discontinuities or “edges” by differencing. (Actually it is more accurate to say that these algorithms reveal a lack of coherency in order to detect faults.) In this study, we apply such “uncoherency” methods to depth migrations from Hibernia field and we compare results for both synthetic and real data. More details of our study are found in the recent M.Sc. thesis of Nicholle Carter of Memorial University of Newfoundland (accepted, September 1999). HIBERNIA GEOLOGY Seismic methods play a key role in exploration and reservoir characterization of offshore Newfoundland’s Hibernia oil field, potentially one of North America’s most important offshore sources of crude oil. Figure 1 gives the geographic location of the field on the East Coast of Canada. As shown in Figure 1, Hibernia field, located about 315 km southeast of St. John’s, Newfoundland, is part of the Jeanne d’Arc Basin which includes a large number of extensional faults. A detailed geological picture of this basin is being developed with the use of 3-D seismic surveys. A Hibernia 3-D seismic survey was made available to the Memorial University Seismic Imaging Consortium (MUSIC) by the Hibernia Management and Development Corporation (HMDC) for research into imaging algorithms.
Transcript of Fault imaging of Hibernia 3-D seismic data using edge-detection
Fault imaging using coherency measures
CREWES Research Report — Volume 11 (1999)
Fault imaging of Hibernia 3-D seismic data using edge-detection and coherency measures
Nicholle Carter and Laurence R. Lines
ABSTRACT“Coherency cube” and fault detection technologies have evolved rapidly in recent
years as important tools for seismic interpretation. The following paper, developed asa joint project between investigators at Memorial University and the University ofCalgary, compares several of the fault detection methods for data from Hibernia field.The results, which are outlined in detail in the Memorial University M.Sc. thesis ofNicholle Carter, support the usefulness of coherency measures prescribed by Marfurtet al. (1998).
INTRODUCTIONThe development of the “coherence cube” and related technologies during recent
years has proven to be a valuable interpretive aid for fault detection as evidenced byNissen et al. (1999). Following the introduction of The Coherence Cube by Bahorichand Farmer (1995) for the interpretation of 3-D seismic data from offshore Trinidad,several papers have described the development and application of algorithms fordetecting fault discontinuities. One of these, the paper by Marfurt et al. on 3-Dseismic attributes using a semblance-based coherency algorithm received the awardfor Best Paper in Geophysics in 1998, a testimony to the importance of thistechnology.
The detection of faults in offshore seismic exploration has been enhanced by useof algorithms from two families – those that measure coherency and those that detectdiscontinuities or “edges” by differencing. (Actually it is more accurate to say thatthese algorithms reveal a lack of coherency in order to detect faults.) In this study, weapply such “uncoherency” methods to depth migrations from Hibernia field and wecompare results for both synthetic and real data. More details of our study are foundin the recent M.Sc. thesis of Nicholle Carter of Memorial University ofNewfoundland (accepted, September 1999).
HIBERNIA GEOLOGYSeismic methods play a key role in exploration and reservoir characterization of
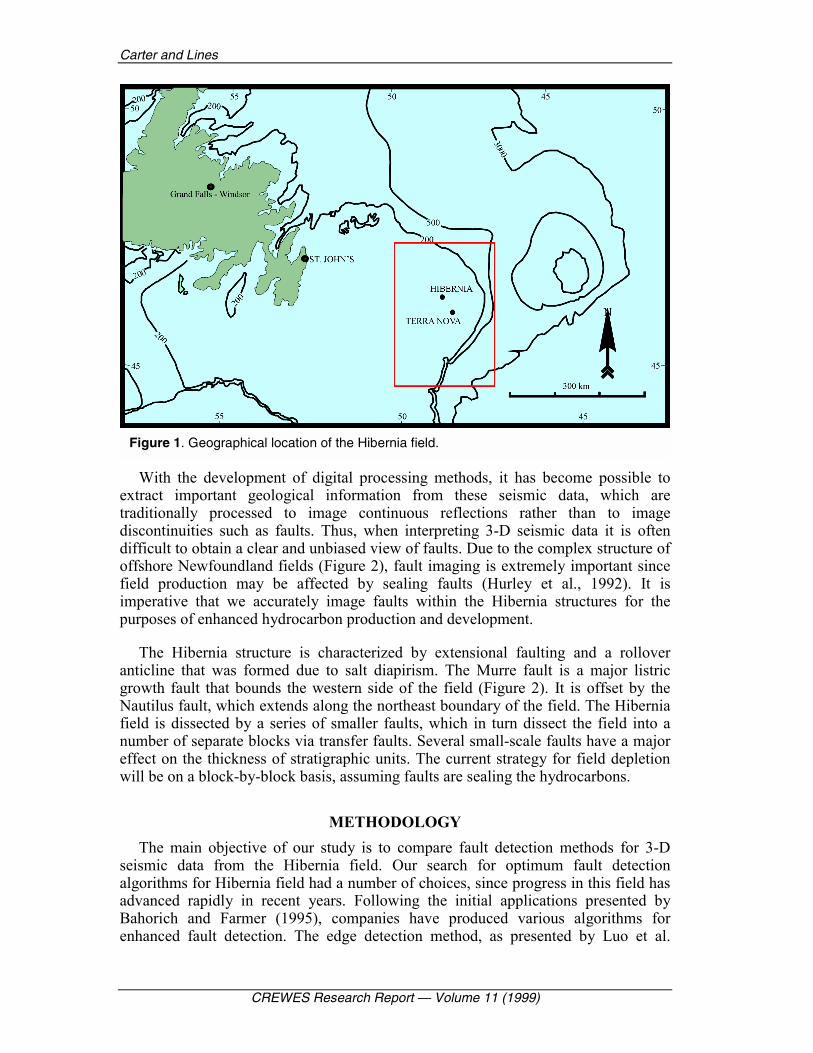
offshore Newfoundland’s Hibernia oil field, potentially one of North America’s mostimportant offshore sources of crude oil. Figure 1 gives the geographic location of thefield on the East Coast of Canada. As shown in Figure 1, Hibernia field, locatedabout 315 km southeast of St. John’s, Newfoundland, is part of the Jeanne d’ArcBasin which includes a large number of extensional faults. A detailed geologicalpicture of this basin is being developed with the use of 3-D seismic surveys. AHibernia 3-D seismic survey was made available to the Memorial University SeismicImaging Consortium (MUSIC) by the Hibernia Management and DevelopmentCorporation (HMDC) for research into imaging algorithms.
Carter and Lines
CREWES Research Report — Volume 11 (1999)
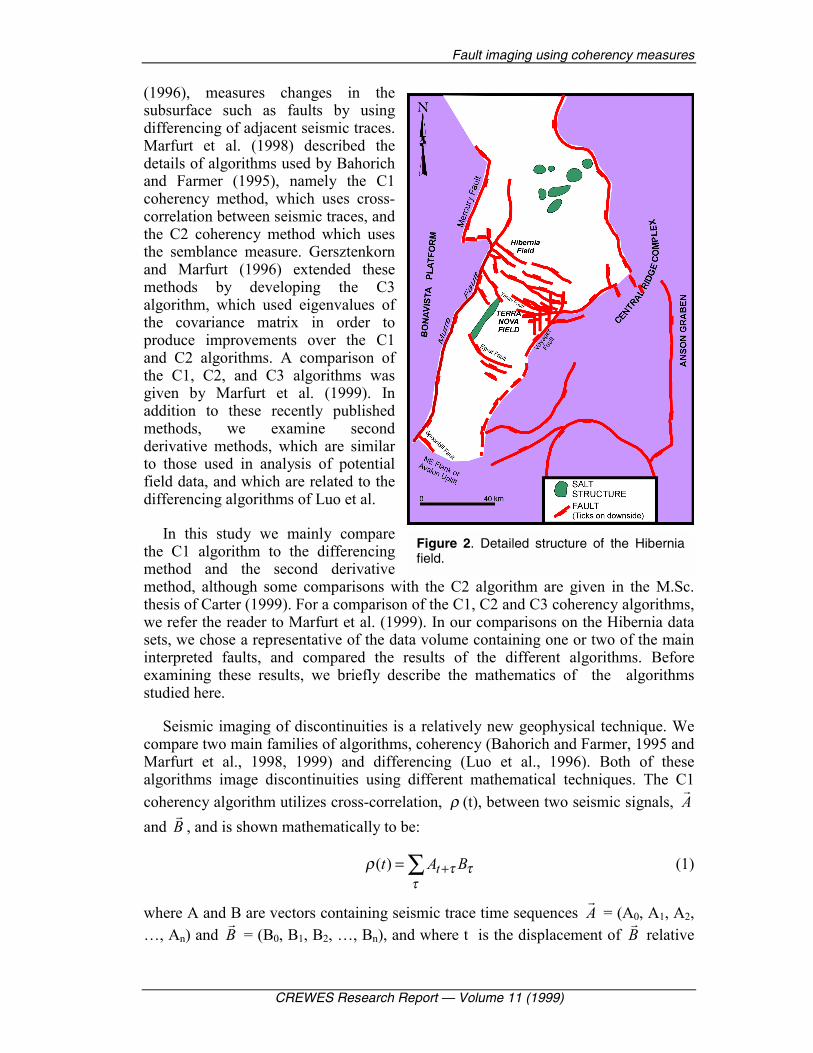
With the development of digital processing methods, it has become possible toextract important geological information from these seismic data, which aretraditionally processed to image continuous reflections rather than to imagediscontinuities such as faults. Thus, when interpreting 3-D seismic data it is oftendifficult to obtain a clear and unbiased view of faults. Due to the complex structure ofoffshore Newfoundland fields (Figure 2), fault imaging is extremely important sincefield production may be affected by sealing faults (Hurley et al., 1992). It isimperative that we accurately image faults within the Hibernia structures for thepurposes of enhanced hydrocarbon production and development.
The Hibernia structure is characterized by extensional faulting and a rolloveranticline that was formed due to salt diapirism. The Murre fault is a major listricgrowth fault that bounds the western side of the field (Figure 2). It is offset by theNautilus fault, which extends along the northeast boundary of the field. The Hiberniafield is dissected by a series of smaller faults, which in turn dissect the field into anumber of separate blocks via transfer faults. Several small-scale faults have a majoreffect on the thickness of stratigraphic units. The current strategy for field depletionwill be on a block-by-block basis, assuming faults are sealing the hydrocarbons.
METHODOLOGYThe main objective of our study is to compare fault detection methods for 3-D
seismic data from the Hibernia field. Our search for optimum fault detectionalgorithms for Hibernia field had a number of choices, since progress in this field hasadvanced rapidly in recent years. Following the initial applications presented byBahorich and Farmer (1995), companies have produced various algorithms forenhanced fault detection. The edge detection method, as presented by Luo et al.
Figure 1. Geographical location of the Hibernia field.
Fault imaging using coherency measures
CREWES Research Report — Volume 11 (1999)
(1996), measures changes in thesubsurface such as faults by usingdifferencing of adjacent seismic traces.Marfurt et al. (1998) described thedetails of algorithms used by Bahorichand Farmer (1995), namely the C1coherency method, which uses cross-correlation between seismic traces, andthe C2 coherency method which usesthe semblance measure. Gersztenkornand Marfurt (1996) extended thesemethods by developing the C3algorithm, which used eigenvalues ofthe covariance matrix in order toproduce improvements over the C1and C2 algorithms. A comparison ofthe C1, C2, and C3 algorithms wasgiven by Marfurt et al. (1999). Inaddition to these recently publishedmethods, we examine secondderivative methods, which are similarto those used in analysis of potentialfield data, and which are related to thedifferencing algorithms of Luo et al.
In this study we mainly comparethe C1 algorithm to the differencingmethod and the second derivativemethod, although some comparisons with the C2 algorithm are given in the M.Sc.thesis of Carter (1999). For a comparison of the C1, C2 and C3 coherency algorithms,we refer the reader to Marfurt et al. (1999). In our comparisons on the Hibernia datasets, we chose a representative of the data volume containing one or two of the maininterpreted faults, and compared the results of the different algorithms. Beforeexamining these results, we briefly describe the mathematics of the algorithmsstudied here.
Seismic imaging of discontinuities is a relatively new geophysical technique. Wecompare two main families of algorithms, coherency (Bahorich and Farmer, 1995 andMarfurt et al., 1998, 1999) and differencing (Luo et al., 1996). Both of thesealgorithms image discontinuities using different mathematical techniques. The C1coherency algorithm utilizes cross-correlation, ρ (t), between two seismic signals, A
r
and Br
, and is shown mathematically to be:
ττ
τρ BAt t∑ +=)( (1)
where A and B are vectors containing seismic trace time sequences Ar
= (A0, A1, A2,…, An) and B
r = (B0, B1, B2, …, Bn), and where t is the displacement of B
r relative
Figure 2. Detailed structure of the Hiberniafield.

Carter and Lines
CREWES Research Report — Volume 11 (1999)
to Ar
. The C1 algorithm computes the crosscorrelation of traces in the x direction,denoted by xρ and the crosscorrelation of traces in the y direction, denoted by yρ .The C1 algorithm normalizes these crosscorrelations with respect to trace energiesand then computes the maximum values for lags in the x and y directions. Thecoherency measure xyρ , is given by the square root of these maximum values, that
is, )max(*)max( yxxy ρρρ = .
The difference method is a simpler technique which subtracts seismic signals(signal A on the target trace and signal B on an adjacent trace) and is given by:
BABAd rr
rrr
+−= (2)
where dr
is the difference at the center sample of the window on the target trace (Luoet al., 1996). In our version of the differencing algorithm we average the absolutedifferences of a grid point and its neighbors. As we will see, the differencing methodis somewhat similar to the use of second derivative computations that are used toenhance high wavenumber variations in data.
There is a close relationship between the differencing method of Luo et al. (1996)and the second derivative method used in potential field mapping, as described byDobrin (1976). This relationship can be shown by use of finite differencing of tracevalues on a grid. Recall that in analysing potential fields, Laplace’s equation gives:
02
2
2
2
2
2=
∂∂+
∂∂+
∂∂
zU
yU
xU (3)
where U is the potential field variation.
Therefore, an analysis of
2
2
2
2
2
2
zU
yU
xU
∂∂−=
∂∂+
∂∂ (4)
is useful for interpreting discontinuities and recognizing the relationship of horizontalchanges to vertical changes. Since horizontal second derivative maps in potential fieldmapping are useful for detecting discontinuities, we consider its possible applicationto seismic wavefields.
The wave equation would replace the potential, U, by the seismic wavefield, u, and
would have an extra term, 2
2
21
tu
v ∂∂ , on the right hand side of the above equation
where v is seismic velocity and t is time. The second derivative of the wavefield canalso be analysed by finite-differences. Consider the wavefield at some particular timeslice and at some specific map location at grid point (i,j). Denote this wavefield value
Fault imaging using coherency measures
CREWES Research Report — Volume 11 (1999)
at some given time by jiu , . If h is the grid size and we use second orderdifferencing, the second derivative in the x direction is given by:
)2(1,,1,122
2jijiji uuu
hxu −+=
∂∂
−+,
(5)
and similarly for the second derivative in the y direction. Therefore, the Laplacian forvariation in the x and y directions is given by:
)4(1,1,1,,1,122
2
2
2jijijijiji uuuuu
hyu
xu −+++=
∂∂+
∂∂
−+−+ (6)
We can show that this second derivative value is closely related to a variation ofthe differencing algorithm. An average of absolute differences with surroundingtraces in the differencing algorithm would consider:
)( ,1,,1,,,1,,1, jijijijijijijijiji uuuuuuuud −+−+−+−= −+−+.
(7)
By comparing the previous two equations, we see that the differencing expression forthe second derivative map would be equivalent to the expression for the averageabsolute differences, dij, if all the quantities within the absolute value signs of dij werepositive. Therefore, it is not surprising that our differencing and second derivativemaps have a somewhat similar appearance. Also, both the differencing and secondderivative measures generally have a higher frequency content than the C1 coherencyalgorithm since, in the Fourier domain, differentiation will multiply the Fouriertransformed wavefield by spatial frequency while producing a 90 degree phase shift.
FAULT MAPPINGThe quality of fault detection images depends on the quality of the input seismic
data (Marfurt et al., 1998). In order to accurately image faults in a spatial sense, it isessential to apply our algorithms to depth migrated data. That is, in order to obtainfaults as discontinuous features, they have to be properly migrated into their correctsubsurface location. Undermigrated faults will produce diffractions and will berelatively coherent events.
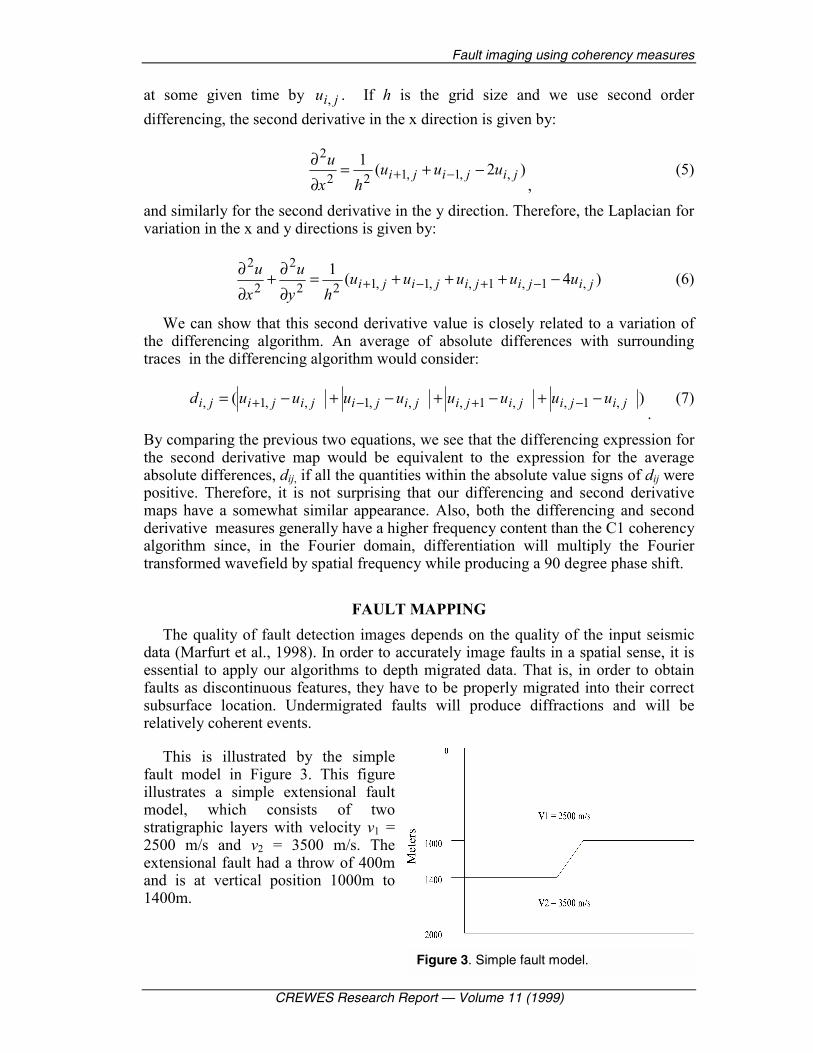
This is illustrated by the simplefault model in Figure 3. This figureillustrates a simple extensional faultmodel, which consists of twostratigraphic layers with velocity v1 =2500 m/s and v2 = 3500 m/s. Theextensional fault had a throw of 400mand is at vertical position 1000m to1400m.
Figure 3. Simple fault model.
Carter and Lines
CREWES Research Report — Volume 11 (1999)
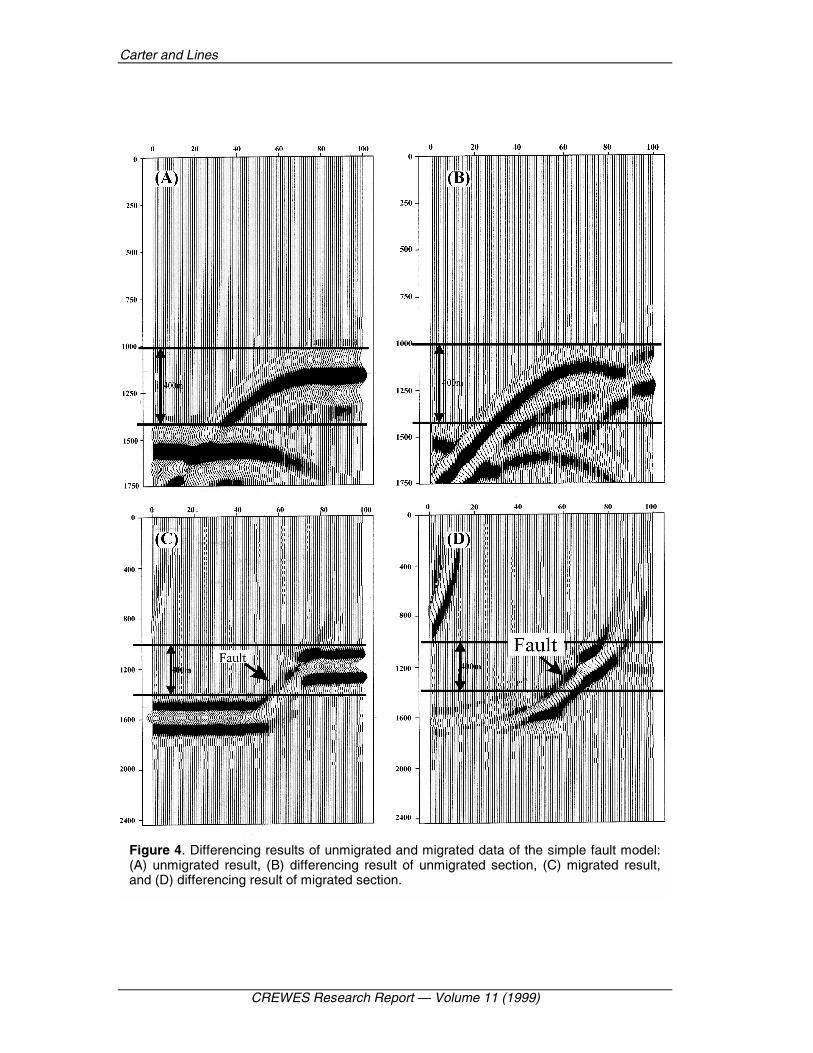
Figure 4. Differencing results of unmigrated and migrated data of the simple fault model:(A) unmigrated result, (B) differencing result of unmigrated section, (C) migrated result,and (D) differencing result of migrated section.
Fault imaging using coherency measures
CREWES Research Report — Volume 11 (1999)
The fault model was used to create an “exploding reflector” synthetic seismogram,which represents an ideal stacked section, as shown in Figure 4a. This seismogramhas considerable diffraction energy, which obscures the fault position. Figure 4billustrates the differencing result of the unmigrated data as compared to the input data.For the unmigrated data, the differencing algorithm did not produce a result thatdefined the correct position of the fault.
Figure 4c shows a reverse time migration of the synthetic seismogram in which thefault’s position is more clearly defined. An application of the differencing algorithmclearly outlines the position of the fault, as shown by Figure 4d.
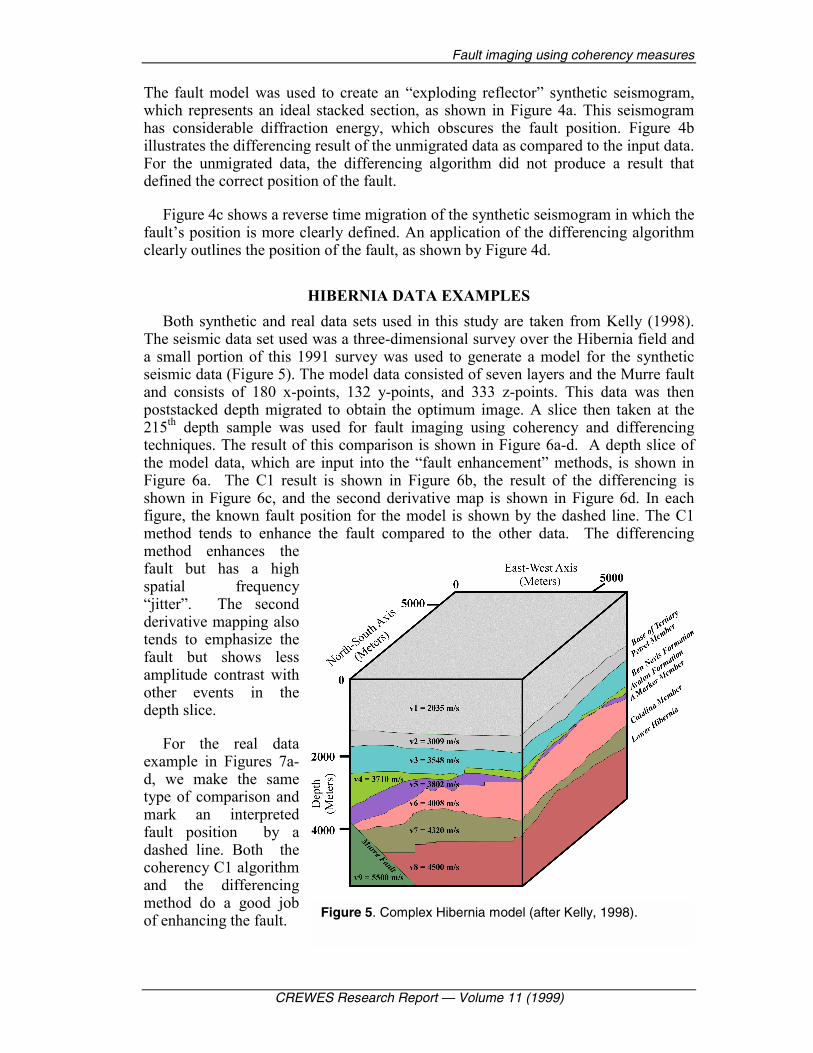
HIBERNIA DATA EXAMPLESBoth synthetic and real data sets used in this study are taken from Kelly (1998).
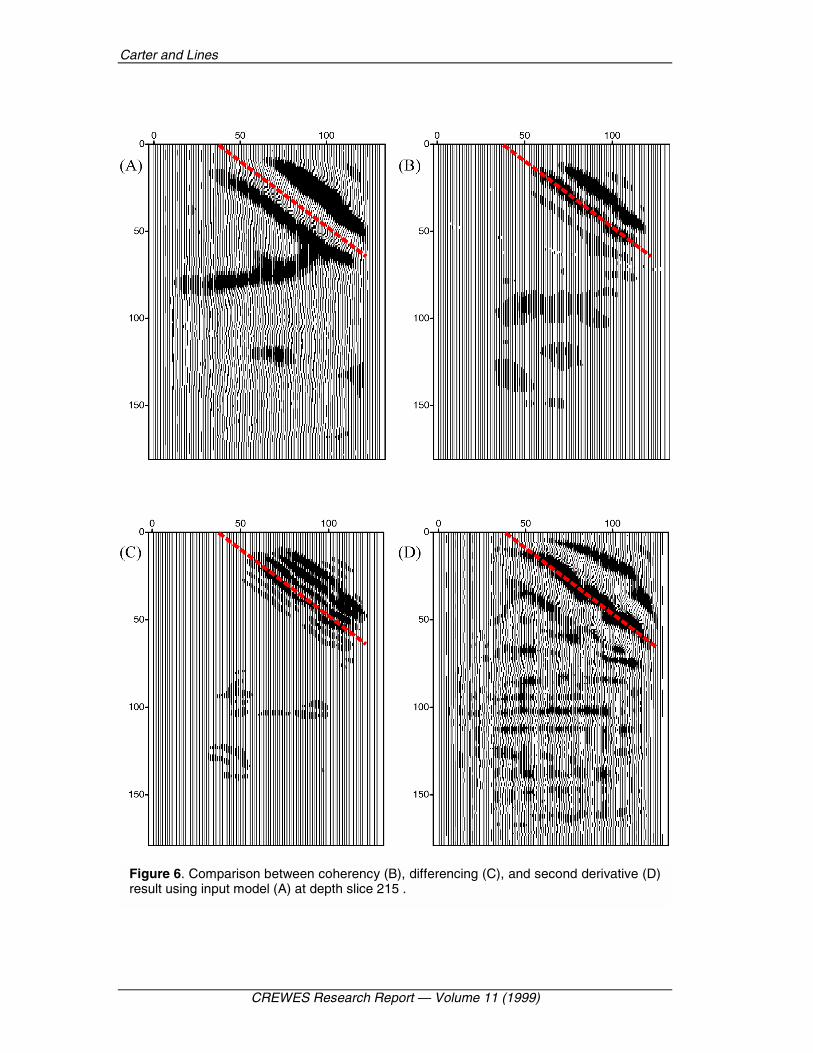
The seismic data set used was a three-dimensional survey over the Hibernia field anda small portion of this 1991 survey was used to generate a model for the syntheticseismic data (Figure 5). The model data consisted of seven layers and the Murre faultand consists of 180 x-points, 132 y-points, and 333 z-points. This data was thenpoststacked depth migrated to obtain the optimum image. A slice then taken at the215th depth sample was used for fault imaging using coherency and differencingtechniques. The result of this comparison is shown in Figure 6a-d. A depth slice ofthe model data, which are input into the “fault enhancement” methods, is shown inFigure 6a. The C1 result is shown in Figure 6b, the result of the differencing isshown in Figure 6c, and the second derivative map is shown in Figure 6d. In eachfigure, the known fault position for the model is shown by the dashed line. The C1method tends to enhance the fault compared to the other data. The differencingmethod enhances thefault but has a highspatial frequency“jitter”. The secondderivative mapping alsotends to emphasize thefault but shows lessamplitude contrast withother events in thedepth slice.
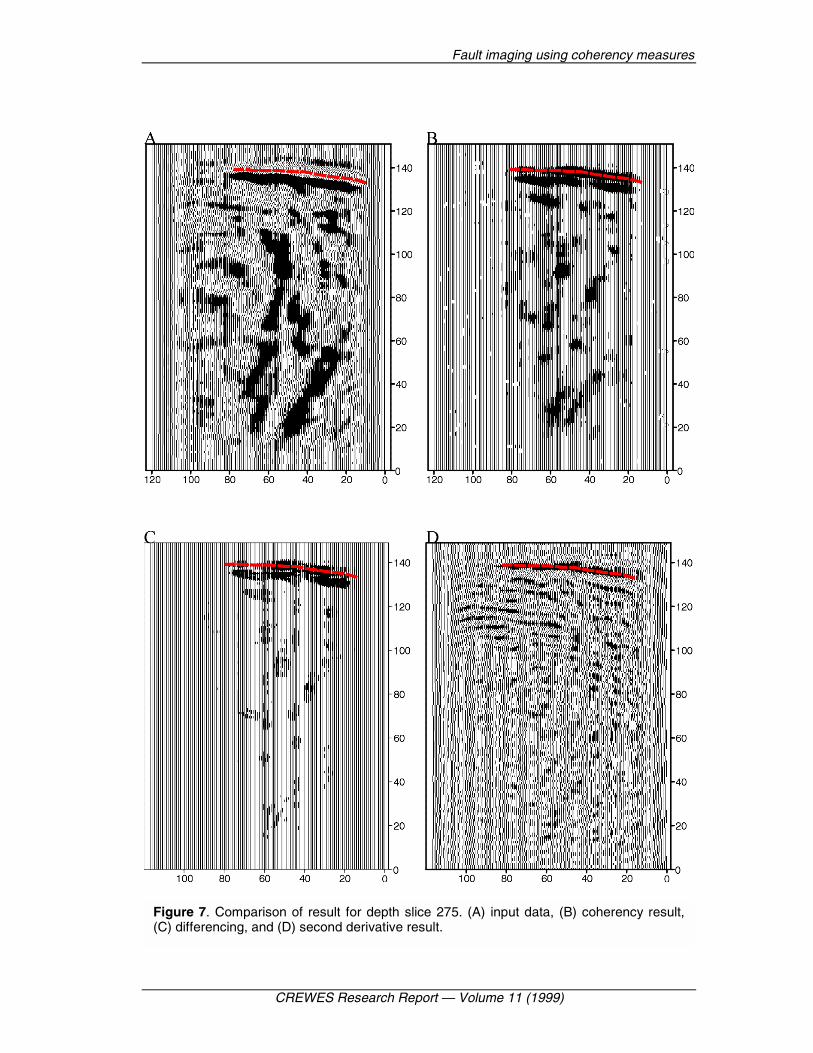
For the real dataexample in Figures 7a-d, we make the sametype of comparison andmark an interpretedfault position by adashed line. Both thecoherency C1 algorithmand the differencingmethod do a good jobof enhancing the fault. Figure 5. Complex Hibernia model (after Kelly, 1998).
Carter and Lines
CREWES Research Report — Volume 11 (1999)
Figure 6. Comparison between coherency (B), differencing (C), and second derivative (D)result using input model (A) at depth slice 215 .
Fault imaging using coherency measures
CREWES Research Report — Volume 11 (1999)
Figure 7. Comparison of result for depth slice 275. (A) input data, (B) coherency result,(C) differencing, and (D) second derivative result.
Carter and Lines
CREWES Research Report — Volume 11 (1999)
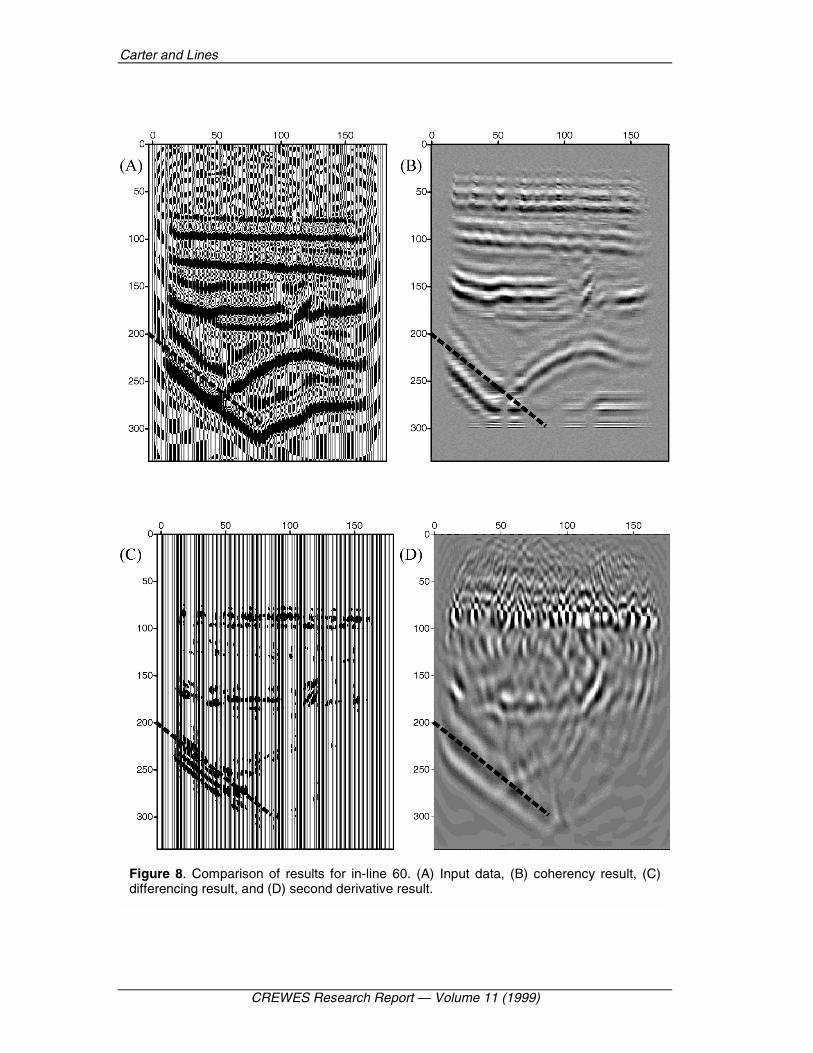
Figure 8. Comparison of results for in-line 60. (A) Input data, (B) coherency result, (C)differencing result, and (D) second derivative result.

Fault imaging using coherency measures
CREWES Research Report — Volume 11 (1999)
The second derivative map does enhance the fault but once again shows less contrastbetween the fault and other events.
While we examined depth slices in map view in Figures 6 and 7, a comparison ofthe cross-sectional views of the Murre fault for the methods also proves interesting asshown in Figures 8a-d. Again, we note that all methods enhance the Murre faultrelative to other reflections with the C1 algorithm and the differencing method doingbetter than the second derivative method. It should be noted that the estimate of thefault location can be displaced from its true location as shown by the dashed line onthe model studies of Figure 6. This is effectively due to wavelet delay and can becured by wavelet deconvolution. The delayed displacement of the Murre fault fromits actual location is due to wavelet delay and can be remedied (or at least lessened) inthe same manner as normal processing – by the use of wavelet deconvolution. Thedeconvolution can work effectively before or after edge enhancement – provided wehave a reliable estimate of the wavelet and its delay characteristics.
CONCLUSIONSThe C1 coherency algorithm, the edge detection differencing method, and the
second derivative method prove useful for detection of faults as exhibited by ourexperience with model and real data. Unlike the C1 algorithm, the differencingmethod and the second derivative method tend to produce high frequency oscillations.In terms of performance, the C1 and differencing algorithms outperformed thesecond derivative mapping in most cases. These techniques are valuable in mappingthe extensional faulting in Hibernia field. In order to be effective, it is recommendedthat fault detection methods be applied to reliable depth migrations and thatdeconvolution be used to prevent wavelet delay.
ACKNOWLEDGMENTSWe thank Hibernia Management and Development Corporation (HMDC) for their
contributions of models and data to this project. We are also grateful to the sponsorsof the Memorial University Seismic Imaging Consortium (MUSIC) for their support.We thank Sven Treitel for encouraging us to write this paper for TLE. Finally, wethank Irene Kelly of PanCanadian Petroleum for providing a 3-D model and migrateddata set for this study.
REFERENCESBahorich, M.S. and Farmer, S.L., 1995, 3D seismic discontinuity for faults and stratigraphic features:
the coherence cube: The Leading Edge, 14, 10, 1053-1058.
Carter, N., 1999, Fault imaging of Hibernia three-dimensional seismic data using edge detection andcoherency measures: M.Sc. thesis, Memorial University of Newfoundland.
Dobrin, M., Introduction to geophysical prospecting: Third edition, McGraw Hill.
Gersztenkorn, A., and Marfurt, K.J., 1996, Eigenstructure based coherence optimization: 66th Ann.Internat. Mtg., Soc. Expl. Geophys., Expanded Abstracts, 328-321.
Carter and Lines
CREWES Research Report — Volume 11 (1999)
Hurley, T.J., Kresia, R.D., Taylor, G.G., and Yates, W.R.L., 1992, The reservoir geology andgeophysics of the Hibernia field, offshore Newfoundland, in Halbouty, M.T., Giant oil andgas fields of the decade, AAPG Memoir 54.
Kelly, I.G., 1998, Modeling and migration of Hibernia seismic data: M.Sc. thesis, Memorial Universityof Newfoundland.
Luo, Y., Higgs, W.G., and Kowalik, W.S., 1996, Edge detection and stratigraphic analysis using 3Dseismic data: 66th Ann. Internat. Mtg., Soc. Expl. Geophys., Expanded Abstracts, 324-331.
Marfurt, K.J., Kirlin, R.L., Farmer, S.L., and Bahorich, M.S., 1998, 3D seismic attributes using asemblance based coherency algorithm, Geophysics, 63, 1150-1165.
Marfurt, K.J., Sudhaker, V., Gersztenkorn, A., Crawford, K.D, and Nissen, S.E., 1999, Coherencycalculations in the presence of structural dip: Geophysics, 64, 104-111.
Nissen, S.E., Haskell, N.L., Steiner, C.T., and Coterill, K.L., 1999, Debris flow outrunner blocks, glidetracks, and pressure ridges identified on the Nigerian continental slope using 3-D seismiccoherency: The Leading Edge, 18, No. 5, 595-599.