Fatigue Tests and Life Estimation with Specimens Extracted from Welded Structures · ·...
8
Procedia Engineering 114 (2015) 437 – 444 Available online at www.sciencedirect.com 1877-7058 © 2015 The Authors. Published by Elsevier Ltd. This is an open access article under the CC BY-NC-ND license (http://creativecommons.org/licenses/by-nc-nd/4.0/). Peer-review under responsibility of INEGI - Institute of Science and Innovation in Mechanical and Industrial Engineering doi:10.1016/j.proeng.2015.08.090 ScienceDirect 1st International Conference on Structural Integrity Fatigue tests and life estimation with specimens extracted from welded structures Sohei Kanna a, *, Yoichi Yamashita a a IHI Corporation, 1, Shin-Nakahara-Cho, Isogo-Ku, Yokohama 235-8501, Japan Abstract In this study, fatigue tests and life prediction method for welded structures are proposed. Specimens were extracted from welded structures including embedded flaws detected by ultrasonic testing. The loading conditions of the fatigue tests were set to be identified as the operating conditions of the structures considering the crack closure effect due to welding residual stress distribution measured by strain gauges. The predicted results are well consisted with the experimental results within the factor of two scatter bands. Hence the fatigue life of the welded structures can be predicted within ±50 % accuracy in life. Keywords: Fatigue test; Fatigue life pridiction; Extracted specimen; Welding residual stress; Stress intensity factor 1. Introduction It is necessary to examine critically the integrity of welded structures by the use of non-destructive testing (NDT) methods. The guide has been proposed for assessing the acceptability of flaws detected with NDT in BS 7910 [1]. However, there remains a need for an assessment of fatigue life of the welded structures containing these flaws by experiments. This study presents the methodology to estimate a remaining life of the structures to fatigue crack initiation by fatigue tests with specimens extracted from the structures. In addition, it is important to evaluate accurately crack closure effects reported by Elber [2]. To consider the crack closure effect, a finite element analysis (FEA) was performed. The flow chart for the assessment of fatigue life is presented in Fig. 1. * Corresponding author. Tel.: +81-45-759-2864; fax: +81-45-759-2206. E-mail address: [email protected] © 2015 The Authors. Published by Elsevier Ltd. This is an open access article under the CC BY-NC-ND license (http://creativecommons.org/licenses/by-nc-nd/4.0/). Peer-review under responsibility of INEGI - Institute of Science and Innovation in Mechanical and Industrial Engineering
Transcript of Fatigue Tests and Life Estimation with Specimens Extracted from Welded Structures · ·...
Procedia Engineering 114 ( 2015 ) 437 – 444
Available online at www.sciencedirect.com
1877-7058 © 2015 The Authors. Published by Elsevier Ltd. This is an open access article under the CC BY-NC-ND license (http://creativecommons.org/licenses/by-nc-nd/4.0/).Peer-review under responsibility of INEGI - Institute of Science and Innovation in Mechanical and Industrial Engineeringdoi: 10.1016/j.proeng.2015.08.090
ScienceDirect
1st International Conference on Structural Integrity
Fatigue tests and life estimation with specimens extracted from welded structures
Sohei Kannaa,*, Yoichi Yamashitaa aIHI Corporation, 1, Shin-Nakahara-Cho, Isogo-Ku, Yokohama 235-8501, Japan
Abstract
In this study, fatigue tests and life prediction method for welded structures are proposed. Specimens were extracted from welded structures including embedded flaws detected by ultrasonic testing. The loading conditions of the fatigue tests were set to be identified as the operating conditions of the structures considering the crack closure effect due to welding residual stress distribution measured by strain gauges. The predicted results are well consisted with the experimental results within the factor of two scatter bands. Hence the fatigue life of the welded structures can be predicted within ±50 % accuracy in life. © 2015 The Authors. Published by Elsevier Ltd. Peer-review under responsibility of INEGI - Institute of Science and Innovation in Mechanical and Industrial Engineering.
Keywords: Fatigue test; Fatigue life pridiction; Extracted specimen; Welding residual stress; Stress intensity factor
1. Introduction
It is necessary to examine critically the integrity of welded structures by the use of non-destructive testing (NDT) methods. The guide has been proposed for assessing the acceptability of flaws detected with NDT in BS 7910 [1]. However, there remains a need for an assessment of fatigue life of the welded structures containing these flaws by experiments.
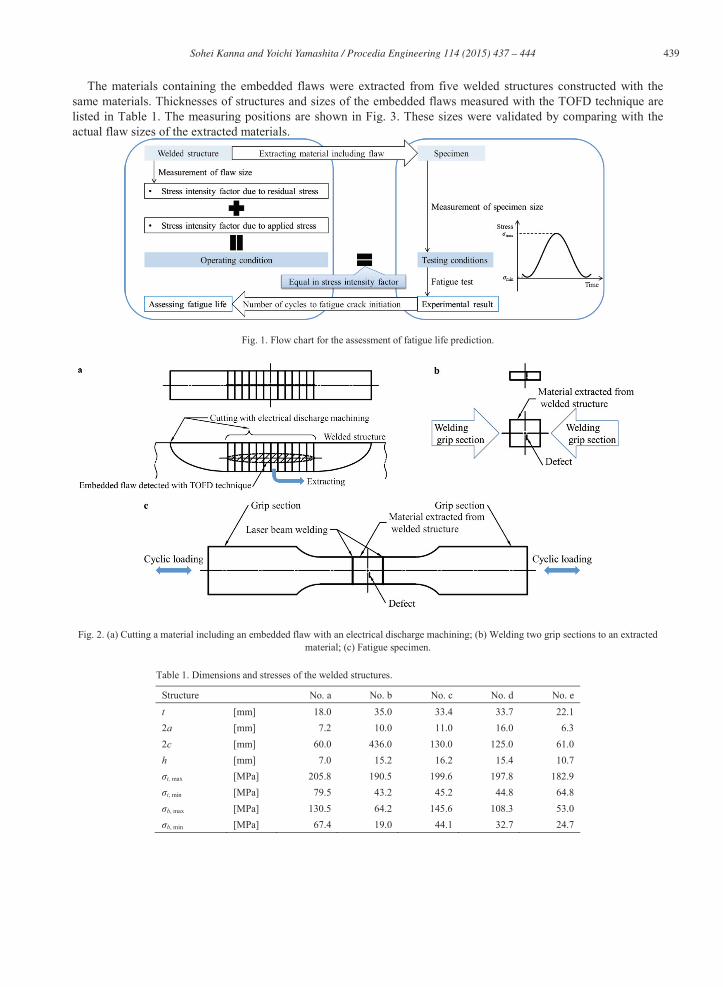
This study presents the methodology to estimate a remaining life of the structures to fatigue crack initiation by fatigue tests with specimens extracted from the structures. In addition, it is important to evaluate accurately crack closure effects reported by Elber [2]. To consider the crack closure effect, a finite element analysis (FEA) was performed. The flow chart for the assessment of fatigue life is presented in Fig. 1.
* Corresponding author. Tel.: +81-45-759-2864; fax: +81-45-759-2206.
E-mail address: [email protected]
© 2015 The Authors. Published by Elsevier Ltd. This is an open access article under the CC BY-NC-ND license (http://creativecommons.org/licenses/by-nc-nd/4.0/).Peer-review under responsibility of INEGI - Institute of Science and Innovation in Mechanical and Industrial Engineering

438 Sohei Kanna and Yoichi Yamashita / Procedia Engineering 114 ( 2015 ) 437 – 444
Nomenclature
a half height for embedded defect or height for surface defect c half-length for embedded defect, through-thickness eccentric defect or surface defect E elastic modulus e shortest distance from material surface to center of defect Fres residual component of tensile force per length for FEA Fσ applied component of tensile force per length for FEA h shortest distance from material surface to center of defect Kb stress intensity factor due to bending stress Kmax maximum stress intensity factor Kmin minimum stress intensity factor Kres stress intensity factor due to residual stress Kσ, max stress intensity factor due to maximum applied stress Kσ, min stress intensity factor due to minimum applied stress Mres residual component of bending moment Mσ applied component of bending moment Ni number of cycles to fatigue crack initiation t section thickness in plane of flaw W structural width in plane of flaw w section width of analytical model with finite element method Z section modulus z distance through the thickness from inner surface ΔK stress intensity factor range Δσb difference between analytical bending stress and experimental bending stress ν Poisson’s ratio σb, ana secondary analytical bending stress due to angular distortion under tensile loading σb, ext secondary experimental bending stress due to angular distortion under tensile loading σb, max maximum bending stress σb, min minimum bending stress σb, res bending component of residual stress σt, max maximum tensile stress σt, min minimum tensile stress σt, res tensile component of residual stress σ1, σ2 extrapolated stresses from residual stress distribution to inner or outer surface ω flexural deformation due to laser beam welding
2. Operating conditions
Operating conditions of the welded structures were investigated through the key-parameter of stress intensity factors for the weld flaws. On the other hand, the fatigue testing conditions were determined as the stress intensity factors of the fatigue specimens were consistent with those of welded structures.
2.1. Extracted samples containing flaws of welded structures
Materials containing embedded flaws were extracted by an electrical discharge machining. These embedded flaws in the welded structures were detected with a time-of-flight diffraction (TOFD) technique. Two grip sections of the same material of the structure were joined with a laser beam welding on both side surface of the material containing the flaw which is shown schematically in Fig. 2.
439 Sohei Kanna and Yoichi Yamashita / Procedia Engineering 114 ( 2015 ) 437 – 444
The materials containing the embedded flaws were extracted from five welded structures constructed with the same materials. Thicknesses of structures and sizes of the embedded flaws measured with the TOFD technique are listed in Table 1. The measuring positions are shown in Fig. 3. These sizes were validated by comparing with the actual flaw sizes of the extracted materials.
Fig. 1. Flow chart for the assessment of fatigue life prediction.
Fig. 2. (a) Cutting a material including an embedded flaw with an electrical discharge machining; (b) Welding two grip sections to an extracted material; (c) Fatigue specimen.
Table 1. Dimensions and stresses of the welded structures.
Structure No. a No. b No. c No. d No. e t [mm] 18.0 35.0 33.4 33.7 22.1 2a [mm] 7.2 10.0 11.0 16.0 6.3 2c [mm] 60.0 436.0 130.0 125.0 61.0 h [mm] 7.0 15.2 16.2 15.4 10.7 σt, max [MPa] 205.8 190.5 199.6 197.8 182.9 σt, min [MPa] 79.5 43.2 45.2 44.8 64.8 σb, max [MPa] 130.5 64.2 145.6 108.3 53.0 σb, min [MPa] 67.4 19.0 44.1 32.7 24.7

440 Sohei Kanna and Yoichi Yamashita / Procedia Engineering 114 ( 2015 ) 437 – 444
Fig. 3. (a) Shapes and stress state of embedded eccentric defect; (b) Cross sectional shape of embedded eccentric defect.
2.2. Welding residual stress distribution
Residual stress is ascribed to welding heat input. Hence an estimation of a stress intensity factor for embedded flaws under residual stress distribution in the thickness direction is vital for a correct assessment of an operating stress states. As shown in Fig. 4 (a), the welding residual stress distribution was measured with strain gauges by using the extracted welded joints with the same materials of the welded structures. The residual stress distribution along line A was scaled by adjusting the thickness of the measured structure to that of every structure for life estimation listed in Table 1 because the flaws were located near not the line B but the line A by microscope. The distribution was separated into tensile and bending stress components on a safety side by using the following equations regularized in the standards [1, 3].
2,2 21res,21res, bt , (1)
where σ1 and σ2 were extrapolated stresses from the line between residual stresses at the embedded defect tips to inner or outer surfaces as detailed in Fig. 4 (b). σt,res and σb,res are listed as Table 2.
Fig. 4. (a) Measured data of welding residual stress distribution with strain gauges; (b) Separating tensile and bending stress components from welding stress distribution in the case of No. e
Table 2. Tensile and bending components of residual stress.
Structure No. a No. b No. c No. d No. e
σt, res [MPa] -92.0 -106.0 -101.0 -101.0 -101.0 σb, res [MPa] -131.0 -217.0 -229.3 -229.3 -229.3
, ,

441 Sohei Kanna and Yoichi Yamashita / Procedia Engineering 114 ( 2015 ) 437 – 444
2.3. Assessment of crack closure using finite element analysis
In order to examine the crack closure effect under minimum loading condition considering residual stress, an elastic FEA for the case of No. e was performed with the Abaqus / Standard version 6.11. As shown in Fig. 5 (a), because of symmetry in the Z-X plane, half of this structure was modeled with quadrilateral shell elements. For the sake of simplicity, the thickness of elements of FEA model was set as 1 mm. The nodes located on the Z-X plane were restrained in the Y-direction. However, displacement of the nodes along the defect was not restrained in order to simulate crack opening. The applied and residual forces per length were loaded to the nodes on the rigid beam. The applied and residual bending moments were set to the center node of the rigid beam. The material properties were set to as the following: E = 206000MPa and ν = 0.3. In the case of No. e, loading conditions were set to as the followings: Fσ = 64.8N/mm, Fres = -101.0N/mm, Mσ= -1.99×10³N·mm and Mres = 1.85×10⁴N·mm. Moreover force per length were obtained from F = σt·w, where σt inserted from σt, res in Table 2 or σt, min in Table 3. Also, bending moments were calculated from M = σb·Z, where σb input from σres in Table 2 or σb, min in Table 3. Furthermore Z was obtained from Z = wt2/6.
2.4. Calculating operating conditions
In this study, the operating conditions of the structures are listed in Table 4. According to the analytical result shown in Fig. 5 (b), crack closure was occurred at the defect tips because the
nodal y-reaction forces on the defect tips were compression and y-displacements of the nodes along the defect line moved to closure. Therefore, considering crack closure, ΔK was determined by the following equation.
0for 0for
minmax
minminmax
KKKKK
K , (2)
where Kmax and Kmin are calculated from the following the equations, according to the superposition principle,
resmin,minresmax,max , KKKKKK . (3)
In the case of the embedded defect illustrated in Fig. 3, Kσ, max, Kσ, min and Kres obtained from the method standardized in WES2805 [3] are listed in Table 3.
Fig. 5. (a) Analytical model; (b) Y-reaction force vector and Y-deformation figure in the case of No. e (deformation: 200x magnification)
442 Sohei Kanna and Yoichi Yamashita / Procedia Engineering 114 ( 2015 ) 437 – 444
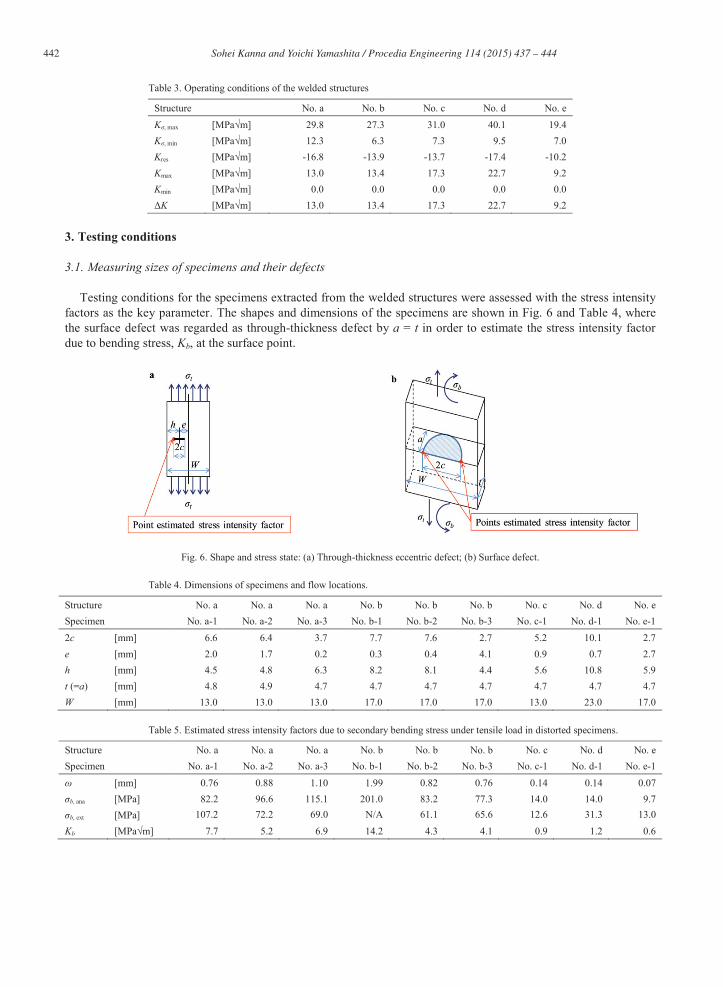
Table 3. Operating conditions of the welded structures
Structure No. a No. b No. c No. d No. e Kσ, max [MPa√m] 29.8 27.3 31.0 40.1 19.4 Kσ, min [MPa√m] 12.3 6.3 7.3 9.5 7.0 Kres [MPa√m] -16.8 -13.9 -13.7 -17.4 -10.2 Kmax [MPa√m] 13.0 13.4 17.3 22.7 9.2 Kmin [MPa√m] 0.0 0.0 0.0 0.0 0.0 ΔK [MPa√m] 13.0 13.4 17.3 22.7 9.2
3. Testing conditions
3.1. Measuring sizes of specimens and their defects
Testing conditions for the specimens extracted from the welded structures were assessed with the stress intensity factors as the key parameter. The shapes and dimensions of the specimens are shown in Fig. 6 and Table 4, where the surface defect was regarded as through-thickness defect by a = t in order to estimate the stress intensity factor due to bending stress, Kb, at the surface point.
Fig. 6. Shape and stress state: (a) Through-thickness eccentric defect; (b) Surface defect.
Table 4. Dimensions of specimens and flow locations.
Structure No. a No. a No. a No. b No. b No. b No. c No. d No. e Specimen No. a-1 No. a-2 No. a-3 No. b-1 No. b-2 No. b-3 No. c-1 No. d-1 No. e-1 2c [mm] 6.6 6.4 3.7 7.7 7.6 2.7 5.2 10.1 2.7 e [mm] 2.0 1.7 0.2 0.3 0.4 4.1 0.9 0.7 2.7 h [mm] 4.5 4.8 6.3 8.2 8.1 4.4 5.6 10.8 5.9 t (=a) [mm] 4.8 4.9 4.7 4.7 4.7 4.7 4.7 4.7 4.7 W [mm] 13.0 13.0 13.0 17.0 17.0 17.0 13.0 23.0 17.0
Table 5. Estimated stress intensity factors due to secondary bending stress under tensile load in distorted specimens.
Structure No. a No. a No. a No. b No. b No. b No. c No. d No. e Specimen No. a-1 No. a-2 No. a-3 No. b-1 No. b-2 No. b-3 No. c-1 No. d-1 No. e-1
ω [mm] 0.76 0.88 1.10 1.99 0.82 0.76 0.14 0.14 0.07 σb, ana [MPa] 82.2 96.6 115.1 201.0 83.2 77.3 14.0 14.0 9.7 σb, ext [MPa] 107.2 72.2 69.0 N/A 61.1 65.6 12.6 31.3 13.0 Kb [MPa√m] 7.7 5.2 6.9 14.2 4.3 4.1 0.9 1.2 0.6
443 Sohei Kanna and Yoichi Yamashita / Procedia Engineering 114 ( 2015 ) 437 – 444
3.2. Considering a warp of flexural deformation due to laser beam welding
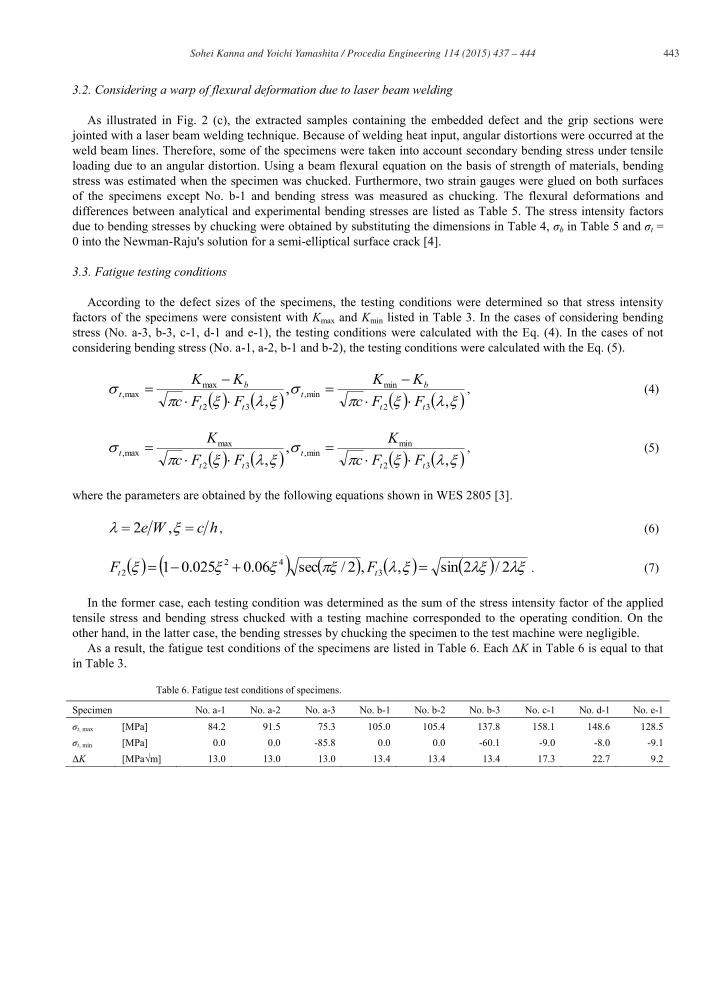
As illustrated in Fig. 2 (c), the extracted samples containing the embedded defect and the grip sections were jointed with a laser beam welding technique. Because of welding heat input, angular distortions were occurred at the weld beam lines. Therefore, some of the specimens were taken into account secondary bending stress under tensile loading due to an angular distortion. Using a beam flexural equation on the basis of strength of materials, bending stress was estimated when the specimen was chucked. Furthermore, two strain gauges were glued on both surfaces of the specimens except No. b-1 and bending stress was measured as chucking. The flexural deformations and differences between analytical and experimental bending stresses are listed as Table 5. The stress intensity factors due to bending stresses by chucking were obtained by substituting the dimensions in Table 4, σb in Table 5 and σt = 0 into the Newman-Raju's solution for a semi-elliptical surface crack [4].
3.3. Fatigue testing conditions
According to the defect sizes of the specimens, the testing conditions were determined so that stress intensity factors of the specimens were consistent with Kmax and Kmin listed in Table 3. In the cases of considering bending stress (No. a-3, b-3, c-1, d-1 and e-1), the testing conditions were calculated with the Eq. (4). In the cases of not considering bending stress (No. a-1, a-2, b-1 and b-2), the testing conditions were calculated with the Eq. (5).
,,
, 32
minmin,
32
maxmax,
tt
bt
tt
bt FFc
KKFFcKK
, (4)
,,
, 32
minmin,
32
maxmax,
ttt
ttt FFc
KFFc
K, (5)
where the parameters are obtained by the following equations shown in WES 2805 [3].
hcWe ,2 , (6)
2/2sin,,2/sec06.0025.01 342
2 tt FF . (7)
In the former case, each testing condition was determined as the sum of the stress intensity factor of the applied tensile stress and bending stress chucked with a testing machine corresponded to the operating condition. On the other hand, in the latter case, the bending stresses by chucking the specimen to the test machine were negligible.
As a result, the fatigue test conditions of the specimens are listed in Table 6. Each ΔK in Table 6 is equal to that in Table 3.
Table 6. Fatigue test conditions of specimens.
Specimen No. a-1 No. a-2 No. a-3 No. b-1 No. b-2 No. b-3 No. c-1 No. d-1 No. e-1 σt, max [MPa] 84.2 91.5 75.3 105.0 105.4 137.8 158.1 148.6 128.5 σt, min [MPa] 0.0 0.0 -85.8 0.0 0.0 -60.1 -9.0 -8.0 -9.1 ΔK [MPa√m] 13.0 13.0 13.0 13.4 13.4 13.4 17.3 22.7 9.2

444 Sohei Kanna and Yoichi Yamashita / Procedia Engineering 114 ( 2015 ) 437 – 444
Fig. 7. Relationship between stress intensity factor range and number of cycles to fatigue crack initiation.
4. Experimental results and conclusion
A summary of the experimental results as the double logarithmic plots is shown in Fig. 7, where the vertical axis represents stress intensity factor range listed in Table 5 and the axis of abscissa represents number of cycles to fatigue crack initiation. All of the experimental results are plotted within the lines representing the factor of two scatter bands. Although the effect of secondary bending stress under tensile loading due to an angular distortion could not remove all the testing condition, the stress intensity factors due to the bending stresses were offset because they were constant. By using the following empirical equation (8),
00.371095.4 KNi , (8)
a remaining life can be well predicted within ±50 % errors in life where the remaining life is defined as the loading cycles from the start of fatigue test to the fatigue crack initiation meaning that fatigue crack can be observed at the defect tips by microscope.
In the welded structures analyzed in this study, cyclic loading has been applied once a day. The number of cycles to initial crack initiation divided by a period per cycle (=365 day/cycle) equals the fatigue life. The red vertical line corresponding to 13 years is drawn in Fig. 7. All of the experimental data are plotted to right side of this line, suggesting that a fatigue crack would not grow in less than 13 years.
In future work, the Eq. (8) should be applied to predictions for fatigue crack initiation of other welded structures of same types containing flaws.
References
[1] The British Standards Institution, BS 7910: Guide to methods for assessing the acceptability of flaws in metallic structures, BSI Standards Limited, 2013.
[2] Elber, W., Fatigue Crack closure under cyclic tension, Engineering Fracture Mechanics, Vol. 2, (1970), 37-45. [3] The Japan Welding Engineering Society, WES 2805: Method of assessment for flaws in fusion welded joints with respect to brittle fracture
and fatigue crack growth, The Japan Welding Engineering Society, Tokyo, 2011 (in Japanese). [4] Newman, J.C., Raju, I.S. Stress-intensity factor equations for crack in there-dimensional finite bodies subjected to tension and bending loads,
NASA Technical Memorandum 85793, 1984.