FATIGUE SERVICE LIFE EVALUATION OF EXISTING STEEL AND ... · Advanced Steel Construction Vol. 11,...
17
Advanced Steel Construction Vol. 11, No. 3, pp. 305-321 (2015) 305 FATIGUE SERVICE LIFE EVALUATION OF EXISTING STEEL AND CONCRETE BRIDGES Chun-sheng Wang 1,* , Mu-sai Zhai 1 , Lan Duan 1 and Qian Wang 1 1 Key Laboratory for Bridge and Tunnel of Shaanxi Province, Chang'an University, Xi'an, Shaanxi Province, China *(Corresponding author: E-mail: [email protected]) ABSTRACT: In recent years, traffic loads and vehicle speeds on both existing steel and concrete bridges have increased to provide fast and sufficient transportation service in China. Chinese government and bridge engineers are paying more attention to the structural fatigue life, service safety, maintenance intervals and the ability to improve capacity of such infrastructure. To study evaluation methods using modern technologies to achieve economical maintenance and extend the sustainable service life, a deterministic evaluation approach was proposed in this paper based on investigation of linear fatigue-damage accumulation theory and fracture mechanics, in which the fatigue failure behaviour of existing steel and concrete bridges was reflected. According to the stochastic fatigue failure mechanism of existing bridges, the member fatigue reliability assessment models were proposed using probabilistic fracture mechanics. Furthermore, based on a Monte-Carlo method, a fatigue reliability analysis program was developed to calculate member fatigue failure probability of existing bridges. The deterministic and probabilistic assessment methods proposed in this paper were applied to evaluate typical existing steel and concrete bridges. According to assessment results, the deterministic and probabilistic remaining fatigue life, safe inspection intervals and maintenance strategies were determined, which can avoid fatigue failure accidents and reduce the life-cycle cost of these bridge structures. Keywords: Existing steel and concrete bridges, Fracture mechanics, Probabilistic fracture mechanics, Fatigue life evaluation, Maintenance strategy DOI:10.18057/IJASC.2015.11.3.5 1. INTRODUCTION Existing steel and concrete bridges are aging and experiencing increased levels of fatigue deterioration due to increased demands in traffic volume, vehicular weights and environmental corrosion. As a result, the service safety of existing steel and concrete bridges is declining. In recent years, bridge engineers are paying more attention to the actual fatigue life, service safety, maintenance intervals and load carrying capacity of such infrastructure. Researchers devoted to develop effective evaluation methods, and then provide structural behavior prediction for existing steel and concrete bridges, which can make reasonable maintenance and management decisions to ensure the structural safety [1-5]. To acquire reliable fatigue life evaluation technique, this paper proposed deterministic and probabilistic evaluation approaches, which reflect fatigue failure behavior of existing steel and concrete bridges. According to the stochastic fatigue failure mechanism of existing bridges, the fatigue reliability assessment models for member were proposed using probabilistic fracture mechanics. Furthermore, based on a Monte-Carlo method, a fatigue reliability analysis program was developed to calculate member fatigue failure probability of existing bridges. To verify the effectiveness of proposed evaluation approaches, five typical existing steel bridges and concrete bridges were selected as case studies. Continuous dynamic monitoring technique was adopted to acquire real fatigue stress spectrum, in order to evaluate the real fatigue life of existing bridges. Based on evaluation results, the deterministic and probabilistic remaining fatigue life, safe
Transcript of FATIGUE SERVICE LIFE EVALUATION OF EXISTING STEEL AND ... · Advanced Steel Construction Vol. 11,...

Advanced Steel Construction Vol. 11, No. 3, pp. 305-321 (2015) 305
FATIGUE SERVICE LIFE EVALUATION OF EXISTING STEEL AND CONCRETE BRIDGES
Chun-sheng Wang 1,*, Mu-sai Zhai1, Lan Duan1 and Qian Wang1
1 Key Laboratory for Bridge and Tunnel of Shaanxi Province,
Chang'an University, Xi'an, Shaanxi Province, China *(Corresponding author: E-mail: [email protected])
ABSTRACT: In recent years, traffic loads and vehicle speeds on both existing steel and concrete bridges have increased to provide fast and sufficient transportation service in China. Chinese government and bridge engineers are paying more attention to the structural fatigue life, service safety, maintenance intervals and the ability to improve capacity of such infrastructure. To study evaluation methods using modern technologies to achieve economical maintenance and extend the sustainable service life, a deterministic evaluation approach was proposed in this paper based on investigation of linear fatigue-damage accumulation theory and fracture mechanics, in which the fatigue failure behaviour of existing steel and concrete bridges was reflected. According to the stochastic fatigue failure mechanism of existing bridges, the member fatigue reliability assessment models were proposed using probabilistic fracture mechanics. Furthermore, based on a Monte-Carlo method, a fatigue reliability analysis program was developed to calculate member fatigue failure probability of existing bridges. The deterministic and probabilistic assessment methods proposed in this paper were applied to evaluate typical existing steel and concrete bridges. According to assessment results, the deterministic and probabilistic remaining fatigue life, safe inspection intervals and maintenance strategies were determined, which can avoid fatigue failure accidents and reduce the life-cycle cost of these bridge structures. Keywords: Existing steel and concrete bridges, Fracture mechanics, Probabilistic fracture mechanics, Fatigue life evaluation, Maintenance strategy
DOI:10.18057/IJASC.2015.11.3.5
1. INTRODUCTION Existing steel and concrete bridges are aging and experiencing increased levels of fatigue deterioration due to increased demands in traffic volume, vehicular weights and environmental corrosion. As a result, the service safety of existing steel and concrete bridges is declining. In recent years, bridge engineers are paying more attention to the actual fatigue life, service safety, maintenance intervals and load carrying capacity of such infrastructure. Researchers devoted to develop effective evaluation methods, and then provide structural behavior prediction for existing steel and concrete bridges, which can make reasonable maintenance and management decisions to ensure the structural safety [1-5]. To acquire reliable fatigue life evaluation technique, this paper proposed deterministic and probabilistic evaluation approaches, which reflect fatigue failure behavior of existing steel and concrete bridges. According to the stochastic fatigue failure mechanism of existing bridges, the fatigue reliability assessment models for member were proposed using probabilistic fracture mechanics. Furthermore, based on a Monte-Carlo method, a fatigue reliability analysis program was developed to calculate member fatigue failure probability of existing bridges. To verify the effectiveness of proposed evaluation approaches, five typical existing steel bridges and concrete bridges were selected as case studies. Continuous dynamic monitoring technique was adopted to acquire real fatigue stress spectrum, in order to evaluate the real fatigue life of existing bridges. Based on evaluation results, the deterministic and probabilistic remaining fatigue life, safe
306 Fatigue Service Life Evaluation of Existing Steel and Concrete Bridges
inspection intervals and maintenance strategies were determined, which can avoid fatigue failure accidents and reduce the life-cycle cost of these bridge structures. 2. OVERVIEW OF THE EVALUATION AND CASE STUDY BRIDGES The general evaluation procedure is conducted by the following eight steps. Firstly, investigation of the existing archives is conducted to collect the original design documents, each repairing record, and the results of each in-situ test. Secondly, three-dimensional finite element models (3D-FEM) of existing bridges are established. Thirdly, derivation of traffic load spectrum is conducted. Fourthly, it is to calculate the stress spectrum by means of both the 3D-FEM and the traffic load spectrum as well as by in-situ measured stress histogram. Fifthly, it is to estimate of the service fatigue life and inspection priority using conventional fatigue method on the basis of stress spectrum. Sixthly, the remaining fatigue life is evaluated using fracture mechanics method. Seventhly, the probable remaining fatigue life is assessed by probabilistic fracture mechanics method. Eighthly, decision of the maintenance strategy is proposed based on the fatigue safety evaluation results of existing steel bridges. The fifth to eighth steps mentioned above are introduced in details in the following sections. The frame of deterministic and probabilistic assessment approaches of existing steel bridges is demonstrated by Ganjiang River Bridge, which is a typical old riveted bridge. The case study structure, Ganjiang River Bridge, is a combined railway and highway riveted steel through-truss bridge with nine simple supported spans of 64m. The two main trusses are spaced 9.7m apart and loaded through a floor system consisting of transverse floor beams and longitudinal stringers. Each side of the main trusses is one 4.5m-width traffic lane. The bridge is part of the Chinese Jingjiu Rail mainline system, built in 1962, and carried only one track before 1995. In 1995, the service status changed greatly and the bridge began to carry double tracks. In recent years, the volume of train and truck has been increased. Therefore, Jiangxi Railway Management Bureau and the bridge owner paid attention to the service safety of this bridge, and decided to evaluate the remaining fatigue life and the service safety. Houdingxiang No.1 Bridge shown in Figure 1 is selected as the typical modern steel box girder bridge with orthotropic steel bridge (OSD) to evaluate the fatigue life of OSD. The steel box girder is composed of three small box chambers with 3.75-meter wide and 3-meter high. The distance between two diaphragms is 3 meters. The thickness of top plate and diaphragm is 16mm and 10mm, respectively. The thickness of U-shaped ribs is 8mm. The structural steel used in the bridge is weathering steel Q345qENH. Weld among deck plate, diaphragm and stiffeners is fillet-weld joint. In-situ deck-to-deck joints are single-surface weld with two-side shaped and field rib-to-rib joints are high-strength bolted connections. Two typical prestressed concrete (PC) T-girder bridges, i.e., a simple-supported PC girder bridge and a continuous PC girder bridge are chosen to evaluate the fatigue life using different methods. The simple-supported PC girder bridge shown in Figure 2(a) is a freeway bridge built in 1992, which contains two separate parts composed of 12 T-girders with the total width of 26.2m. The continuous one was open to traffic in 2013, which is parallelling to the old simple-supported PC girder bridge. As shown in Figure 2(b), the cross-section contains 8 T-girders with the total width of 19.75m. The every span length of both bridges is all 30m. These two bridges are in the same district, the traffic volume and vehicle kinds are similar. The Qilangwo Yellow River Bridge is taken as a case study of existing concrete bridges, which is built in 1971. After having been used for 35 years, the serious fatigue cracks and damages were found in the reinforced concrete deck T-beams. For ensuring the bridge service safety, the old deck T-beams were replaced by the new reinforced concrete deck -beams in 2006. In order to

Chun-sheng Wang, Mu-sai Zhai, Lan Duan and Qian Wang 307
evaluate the fatigue safety of the retrofit bridge decks, the 24-hour in-situ dynamic strains of the bottom concrete surface were monitored at mid-span sections of new concrete deck beams in 2008. According to the monitoring data, the characters and effect of overloading and oversize trucks can be analyzed for the further research. The stress history of reinforced bars could be gained by further calculation, and the stress spectrums of rebar could also be obtained using the rain-flow counting method.
(a) Steel Box Girder with OSD (b) Heavy Truck Crossing the Bridge
Figure 1. Houdingxiang No.1 Bridge with OSD
(a) Simple-supported PC T-girder Bridge (b) Continuous PC T-girder Bridge
Figure 2. The Two PC T-girder Bridges
3. FATIGUE LIFE EVALUATION BY USING S-N CURVE The procedure of fatigue life evaluation for all the tension members in existing steel bridges or the tension steel bar in existing concrete bridges based on S-N curves includes three steps. Firstly, the fatigue strength and parameters for S-N curves should be confirmed. Secondly, the load history and stress spectrum should be developed. Finally, the used life and the remaining fatigue life can be evaluated by using the Miner’s cumulative damage rule as shown in Figure 3. If using the recent traffic load spectrum to evaluate fatigue life, the result is more conservative, because the traffic load in the past is not heavier than present. Nevertheless the inspection priority can be ranked according to the assessment results. Figure 4 shows the S-N curves in Eurocode 3 [6]. 4. FRACTURE MECHANICS EVALUATION MODEL In remaining fatigue life prediction results of the tension members or steel bar in the existing bridges based on S-N curve method are very conservative due to the over-estimated load history. In this section the fracture mechanics to be applied for the calculation of fatigue crack growth from the visualized or detected initial crack in structural members or the assumption, that the crack size is just the limit of visualization or detection. If the traffic load through the existing bridges will not change in future service condition remarkably, the recent traffic load spectrum can be used for the

308 Fatigue Service Life Evaluation of Existing Steel and Concrete Bridges
calculation of remaining fatigue life. The general procedure to determine the remaining fatigue life of existing bridges based on fracture mechanics can be divided into the following four steps: (1) identification of the vital elements or steel bar to be analyzed from bridge system; (2) calculation of the critical crack size; (3) simulation of crack growth from the initial crack size to the critical crack size; (4) determination of the remaining fatigue life and economical inspection intervals as shown in Figure 5.
Figure 3. Fatigue Life Evaluation Based on S-N Curve
10
100
1000
Number of Cycles
m=3
1
Stre
ss R
ange
s(M
Pa) C
Detail Catagory
Constant Amplitude Fatigue Limit
51.0 10 91.0 1081.0 1071.0 1062.0 10
65.0 10
D
Cut-off Limit L
m=5
1
160140125112100908071635650454036
Figure 4. S-N Curves in Eurocode 3[6]
fa
ia
Figure 5. Remaining Fatigue Life Evaluation Based on Fracture Mechanics

Chun-sheng Wang, Mu-sai Zhai, Lan Duan and Qian Wang 309
4.1 Evaluation Approach Based on Fracture Mechanics for the Existing Steel Bridges In the old riveted steel bridges all members are built up by rivet with plates and angles, so the main crack configurations can be simplified into two types of fracture mechanics models: CCT-Centric Crack Tension and DECT-Double Edge Crack Tension. According to the chemical component analysis and the material test results for bridge steel using in the riveted construction time, the
material strength and toughness values can be determined as el 240MPaR ,12
IC 50MPa m K . In
this paper ultrasonic detection is applied to determine the initial crack size. If the fracture occurs before net section yielding with only local yielding at the crack tips, this failure mode commonly is called “brittle” failure. The critical crack size cra can be defined as Eq. (1).
2
ICcr
max
1
π
Ka
Y (1)
Where Y is geometry function for CCT or DECT models; max is the max-stress of dead and live
load. If the fracture failure occurs after net-section yielding, the failure mode is ductile. In this case, cr Na a , the practical values of Na for CCT or DECT can be calculated using Eq. (2) and Eq.
(3).
N max el(1 / ) a W R (2)
N max el2.25 4(1 / ) 1.5 a W R W (3)
Where W is half width of specimen. Based on investigation of riveted members fatigue test results, the fatigue crack propagation cannot exceed the width of angle leg. Though the critical crack size can be proposed as Eq. (4).
f N cr maxmin( , , )a a a a (4)
Where maxa is the width of angle leg.
The fatigue crack growth rate in structural steel may be proposed to follow a power law as Eq. (5).
th
0d
d m m
aC K KN
th
th
K K
K K
(5)
Where d / da N is fatigue crack growth rate; C and m are crack growth coefficients; thK is the
threshold stress intensity factor range; K Y a .The crack growth coefficients can be taken
as 126.889 10 C , 3m according to the experiment results of old riveted steel [7]. The threshold stress intensity factor range can be determined according to the empirical relation in BSI PD 6493 [8], as shown in Eq. (6).
th
170 214 0.5( )
63 0.5
R RK R
R (6)
Where R is the stress ratio.

310 Fatigue Service Life Evaluation of Existing Steel and Concrete Bridges
According to linear elastic fracture mechanics theory and fatigue crack initiates and propagates regularly in modern steel bridges, the stress intensity factor range K , for a surface semi-elliptical crack in welded joints (indicated in Figure 6) subjected to tension and bending loads, can be expressed by Eq. (7) [9-10].
max min m b( ) π .k
aK K K M Y H
Q (7)
For 0 1.0a c , 0 1.0a t , 0.5c b , and 0 π . Where m is membrane stress range; b is shell bending stress range; kM is stress concentration
correction factor considering geometry effection of welded joints ; 1.65
1 1.464a
Qc
;
1 2 1( )sin pH H H H ; 0.2 0.6a a
pc t
; 1 1 0.34 0.11
a a aH
t t c
; 22 1 21 ( ) ( )
a aH G G
t t ;
1 1.22 0.12( )a
Gc
; 0.75 1.52 0.55 1.05( ) 0.47( )
a aG
c c ; a is the crack depth; c is the crack half-length; t
is plate thickness; b is plate half-width; The geometry function Y can calculated by Eq. (8).
2 41 2 3[ ( ) ( ) ] w
a aY M M M gf f
t t (8)
Where 1 1.13 0.09( )
aM
c ;
2 0.54 0.89 /(0.2 )a
Mc
; 243
10.5 14(1 )
0.65 /
aM
a c c
;
221 0.1 0.35 (1 sin )
ag
t
; 1 42
2 2cos sina
fc
; π /sec( )
2w
c a tf
b .
In modern welded steel bridges the other fatigue crack type is the end corner crack subjected to tension and bending loads (indicated in Figure 7). Its stress intensity factor range K can be expressed by Eq. (9) [9, 11].
m b I
π( ) ( , , , )
( )
a a a cK H F
E k c t w (9)
For 0.2 / 2a c , / 1a t ,02
, / 0.5c w .
Where c is the crack length; w = plate width; and FI and H can be calculated by Eq. (10) and Eq. (11).
2 4I 1 2 3 1 2[ ( / ) ( / ) ] wF M M a t M a t g g f f (10)
1 2 1( ) sin .pH H H H (11)

Chun-sheng Wang, Mu-sai Zhai, Lan Duan and Qian Wang 311
For / 1a c :
1 1.08 0.03( / )M a c ; 2
1.060.44
0.3 /M
a c
; 15
3 0.5 0.25( / ) 14.8(1 / )M a c a c ;
2 31 1 [0.08 0.4( / ) ](1 sin )g a t ; 2 3
2 1 [0.08 0.15( / ) ](1 cos )g a t ;
2 2 2 1/ 4[( / ) cos sin ]f a c ; 2 3 41 0.2 9.4 19.4 27wf ;
1/ 2( / )( / )c w a t ; 0.2 / 0.6( / )p a c a t ; 1 1 0.34( / ) 0.11( / )( / )H a t a c a t ;
2
2 21 221 ( / ) ( / )H G a t G a t ; 21 1.22 0.12( / )G a c ;
0.75 1.5
22 0.64 1.05( / ) 0.47( / )G a c a c ; 1.65 1/ 2( ) [1 1.464( / ) ]E k a c .
2ha
2c
Y
X
t
a
2c
φ
A
B
2b
Z
σM
M
σ
2h
ac
w
Y
XZ
t
a
c
φ
A
B
AB
Figure 6. Surface Semi-elliptical Crack Model Figure 7. End Corner Crack Model
4.2 Evaluation Approach Based on Fracture Mechanics for the Existing Concrete Bridges
The remaining service life of reinforced concrete bridges or bridge elements is controlled by the reinforcement when inspection shows that concrete is in good condition. In this section, the fatigue life of reinforced concrete bridges is evaluated based on the steel bar fatigue failure using Paris Law. Fracture of rebar occurs, when the depth of crack reaches cra a or the applied stress is equal
to the resistance of the remaining cross section. The brittle fracture and fracture by yielding are two existing fracture modes. Usually, the depth of critical brittle fracture crack size cra can be calculated
by Eq. (1). If the remaining cross section is yielding, the crack depth ya a is determined by calculating the necessary area-reduction, and ya can be calculated by Eq. (12) [12].
supy 0
y
1
A a Af
(12)
Where 0A is the cross section area of the undamaged rebar; yA a is the cross section area of
yielding state for the damaged rebar. Then the failure crack size is proposed as Eq. (13).

312 Fatigue Service Life Evaluation of Existing Steel and Concrete Bridges
f cr ymin , , 2a a a r (13)
Where r is the radius of the rebar. Parameters of rebar are not well known in fracture mechanics. In order to calculate the crack propagation, the initial flaw on a cylindrical steel bar is assumed as a semi-circular crack (Figure 8), which has a depth of ia a . The plane, in which the semi-circular crack lies, is perpendicular to
the steel axis. The stable crack growth from initial crack is calculated using Paris law.
Figure 8. The Cross Section of Rebar with Initial Flaw and Crack Propagation [12] The number of cycles ijN from the crack depth ia a to ja can be obtained by integrating Eq. (5)
without considering the effect of threshold stress intensity factor range, shown in Eq. (14). Y is assumed to be constant when ranging from ia to ja .
i i
ii /2 /2 /2
i
1 1 1 1d d 1
j ja a
j m m m m m m m ma aj
aN a a
C K CY a C Y a a
(14)
Where is integration constant, and can be expressed as 2 1 m ; Y is correction factor depends on radius r of the rebar and the depth of the crack. BS 7910 [13] gives formulas for Y, shown as Eq. (15).
0.5
31.84 π π
tanπ 4 4 π
0.752 2.02 0.37 1 sinπ 2 4cos4
a ar r a a
Ya r rr
(15)
The remaining fatigue life of steel reinforcement fN , shown in Eq. (16), can be estimated by Eq.
(14) from the initial crack size ia to the critical crack size fa .
if /2
i f
1 11
m m m
aN
C Y a a
(16)
Furthermore, an analysis program based on the linear elastic fracture mechanics evaluation method is developed to calculate the fatigue life of reinforced concrete bridges using monitoring stress data.

Chun-sheng Wang, Mu-sai Zhai, Lan Duan and Qian Wang 313
4.3 Evaluation Approach Based on Probabilistic Fracture Mechanics for Existing Steel Bridges
Uncertainties in the fatigue loading, material fatigue properties, geometry effects, and fatigue crack non-destructive inspection (NDI) are significant and must be considered explicitly in any comprehensive fatigue assessment procedure [14-15], so the probabilistic fracture mechanics model using the Paris equation and the Monte-Carlo simulation technique is developed for determining the fatigue failure probability of existing steel bridges in this study (Figure 9).
Time
Curve
FatigueReliability
ProbabilisticRemaining Fatigue Life
Target FatigueReliability
Fatigue Reliability
Figure 9. Probabilistic Remaining Fatigue Life Evaluation
At first a deterministic fracture mechanics calculation of crack growth with stochastic inputs for crack growth rate, fracture toughness, initial and critical crack size, and load history is proposed. According to the stochastic fatigue failure mechanism of existing steel bridges, the limit-state functions of two probabilistic fatigue failure models – brittle and ductile are defined as Eq. (17) and Eq. (18). For brittle failure:
t
/2B f t cr i
0
( )( ) dn
N
m m m mYZ a a a a CS B Y a a (17)
For ductile failure:
t
/2D f t N i
0
( )( ) dn
N
m m m mYZ a a a a CS B Y a a (18)
Where cra is the critical crack size of brittle failure (random variable); Na is the critical crack size
of ductile failure (random variable); ia is the initial crack size (random variable); a is crack size;
C is Paris coefficient (random variable); m is Paris exponent (constant); S is the stochastic simulation stress range; YB is a random variable defining the random character of geometry
function; tN is the number of cumulative stress cycles. For the reliability analysis, the uncertainties
associated with all the basic variables must be quantified. According to the research results [14-17], the statistical characteristics of the random variables are given in Table 1. According to the fatigue failure mechanism of riveted members, a double-angle probabilistic fatigue failure model (DAPFFM) for riveted bridge members is proposed as shown in Figure 10. For the riveted member fatigue failure models including brittle and ductile, the riveted member must be investigated as parallel systems. Therefore, the fatigue failure probability and fatigue reliability of DAPFFM can be calculated as Eq. (19) and Eq. (20).

314 Fatigue Service Life Evaluation of Existing Steel and Concrete Bridges
Table 1. Statistical Characteristics of the Random Variables Variables Type Mean Value Coefficient
ai Lognormal ia 0.1
aN Lognormal Na 0.1
acr Lognormal cra 0.5
C Lognormal 4.7423×10⁻¹² 0.6 m Constant 3 0
YB Lognormal 1 0.1 S Stochastic Simulation
2 2
f f ,1 1
( )
i ii i
P P F P F P (19)
2 2
r r,1 1
( ) 1 (1 )
i ii i
P P F P F P (20)
Furthermore, a reliability analysis program DAPFFM, based on Monte-Carlo method, is developed to compute the fatigue failure probability of DAPFFM for riveted steel bridges [18].
Gusset PlateRivet
Web
A angle
Crack Failure AngleCrack
DAFFM
B angle
Figure 10. DAPFFM of Riveted Member 5. CASE STUDIES 5.1 Fatigue Life and Service Safety Evaluation of the Existing Steel Bridges 5.1.1 Main Truss Girder of Ganjiang River Bridge According to the analysis of full-scale fatigue experiments [19], the Eurocode Detail Category 71 is adopted to evaluate the fatigue damage of Ganjiang River Bridge, and the cut-off limit is 29 MPa [6]. Fatigue life of all the vital members in Ganjiang River Bridge is evaluated by using the Miner’s cumulative damage rule. The fatigue life of downstream suspender U1L1 of Ganjiang River Bridge (61 years) is the shortest. Therefore, the inspection priority of downriver suspender U1L1 is much higher than others in Ganjiang River Bridge.

Chun-sheng Wang, Mu-sai Zhai, Lan Duan and Qian Wang 315
The remaining fatigue life and safe inspection intervals of members in Ganjiang River Bridge are evaluated using fracture mechanics model and the safety factor is taken as 2.0. The calculation results show that the upriver suspender U1L1 are critical for this riveted truss bridges. It is suggested that the ultrasonic detection intervals of main truss is 3 years for Ganjiang River Bridge. The inspection should be arranged before the coming cold winter. Based on the sensitivity and detection results of ultrasonic instrument and steel mechanical property for Ganjiang River Bridge, the mean values of initial crack size and critical crack size for brittle and ductile failure model shown in Table 2 and Table 3 can be calculated using Eq. (1), Eq.
(2) and Eq. (3), where el 280MPaR and 12
IC 95MPa mK [17].
Table 2. Mean Value of ia , Na , cra for Members at Integrity State (mm)
Members Mean Value of aiMean Value of
aN Mean Value of
acr Upriver U1L1 16.5 64.681 82.201
Downriver U1L1 14.5 63.342 80.960
Table 3. Mean Value of ia , Na , cra for A or B Angle at Fatigue Failure State (mm)
Members After A or B Angle Brittle Failure After A or B Angle Ductile Failure
aN acr aN acr Upriver U1L1 55.885 74.034 59.635 77.514
Downriver U1L1 54.297 72.567 58.047 76.038
2.5 3.0 3.5 4.0 4.5 5.0 5.5 6.0 6.51.00
1.25
1.50
1.75
2.00
2.25
2.50
2.75
3.00 Calculated Fatigue Reliability
Target Fatigue Reliability
t/Year
β
Figure 11. The β- t Curve of Downriver Suspender U1L1
In this paper, the target fatigue reliability index plotted in Figure 11 is assumed to be 2.0 [16]. From Figure 11 the safe inspection intervals can be determined according to the probabilistic remaining fatigue life of downriver suspender U1L1. The safe inspection intervals of upriver and downriver suspender U1L1 are all about 4.5 years. 5.1.2 Orthotropic Steel Decks of Houdingxiang No.1 Bridge In order to acquire real stress histogram, continuous monitoring technique was adopted and different methods were used to calculate the fatigue life of fatigue-sensitive details. Figure 12 shows the 20-day continuous recorded dynamic stress spectrum of four fatigue-sensitive details in OSDs of Houdingxiang No.1 Bridge. S-N curve used in fatigue life evaluation of orthotropic steel bridge deck is suggested in Eurocode 3[6]. For free edges of diaphragm cutouts and bolted splice plate, the initial crack model used in LEFM evaluation is assumed as end corner crack (shown in

316 Fatigue Service Life Evaluation of Existing Steel and Concrete Bridges
Figure 7), when fatigue crack propagates through the diaphragm or bolted splice plate, the model changes into single-edge crack. For rib-to-deck joint and rib-to-diaphragm joint, the initial crack model is assumed as surface semi-elliptical crack (shown in Figure 6), and fatigue failure occurs when the crack propagate through the deck plate or the rib web.
5 10 15 20 25 30 35 40 45 50
1
10
100
1000
10000C
ycle
s
Stress Ranges (MPa) 10 20 30 40 50 60 70 80 90 100
1
10
100
1000
10000
5
Cyc
les
Stress Ranges (MPa) (a) Deck-to-rib Joint (b) Free Edges of Diaphragm Cutout
10 20 30 40 50 60 70 80 90
1
10
100
1000
10000
5
Cyc
les
Stress Ranges (MPa) 5 10 15 20 25 30 35 40 45 50 55 60
1
10
100
1000
10000
Cyc
les
Stress Ranges (MPa) (c) Rib-to-diaphragm Joint (d) Bolted Splice Plate
Figure 12. Recorded Dynamic Stress Spectra for Fatigue Details in OSDs
Recorded dynamic stresses of deck-to-rib joint are smaller than the constant amplitude fatigue limit (CAFL), so the fatigue life is infinity; fatigue life of free edges of diaphragm cutout is 46 years; fatigue life of rib-to-diaphragm joint is 204 years, and bolted splice plate is 3420 years. The steel used in OSDs of Houdingxiang No.1 Bridge is Q345qENH, based on previous research, C can be taken as 124 10C and 128 10C for base metal and weld metal, respectively, and m has the same value of 3m . Based on LEFM models for the typical details in OSDs, the depth of initial cracks is assumed as 0.5mm and 1.0 mm, and fatigue lives evaluation results are shown in Table 4. As monitoring recorded stress spectrum of deck-to-rib joint is relatively low, fatigue life of this detail is 1746 years and 868 years; fatigue life of free edges of diaphragm cutout is 299 years and 109 years; fatigue life of rib-to-diaphragm joint is 186 years and 67 years; and bolted splice plate is infinity and 1820 years. Fatigue life of free edges of diaphragm cutout is far short than design service life based on S-N curves. For LEFM approach, with the depth of initial cracks increase, fatigue life of sensitive details in OSD decrease sharply, so fabrication quality of OSD should be controlled strictly.Actually, fabrication errors, low welding quality and high residual stress are always existed in OSD. If these factors are considered with the increasing traffic volume and overloading together, the fatigue life of sensitive details will be shortened sharply. Therefore, in the future management, regular inspection and continuous monitoring are needed to ensure the service safety of OSD.
Chun-sheng Wang, Mu-sai Zhai, Lan Duan and Qian Wang 317
Table 4. Fatigue Life Evaluation Results of OSDs
Detail
Fatigue life (Year)
S-N Curve LEFM
Depth of initial crack(mm) 0.5 1.0
Deck-to-rib joint Infinity 1746 868 Free edges of
diaphragm cutout 46 299 109
Rib-to-diaphragm joint
204 186 67
Splice plate 3420 Infinity 1820
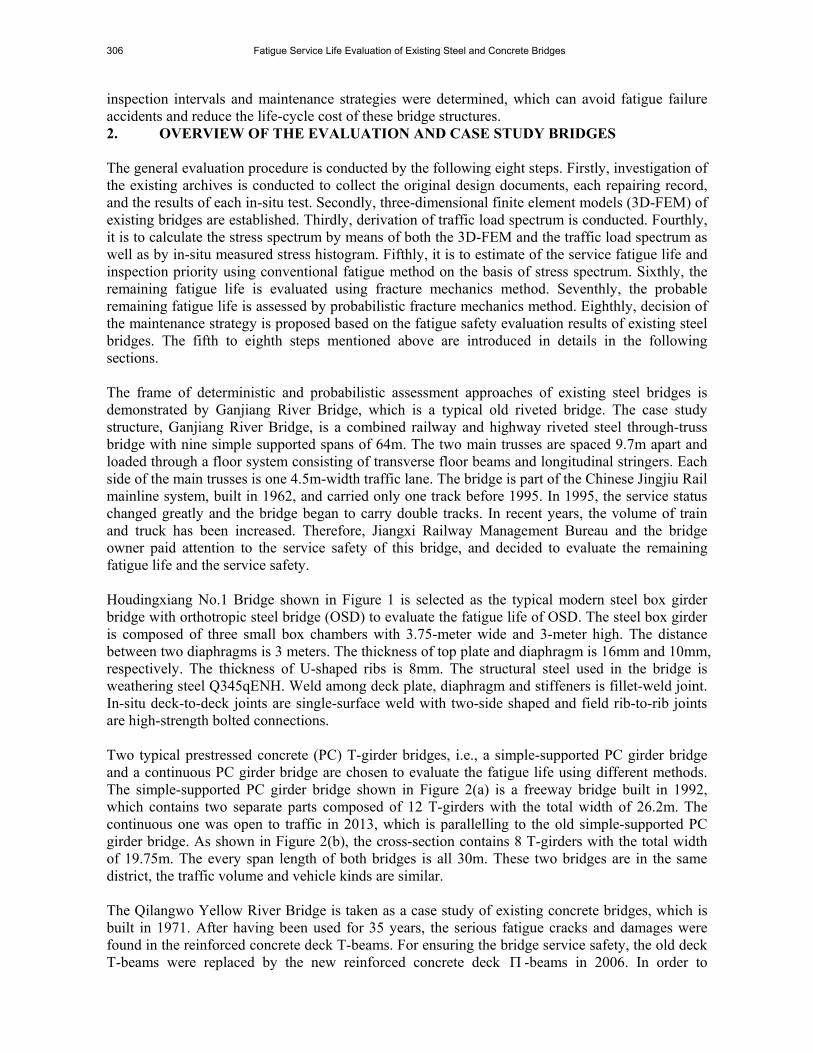
5.2 Fatigue Life and Service Safety Evaluation of the Existing Concrete Bridges 5.2.1 Main Girder of PC Bridges To evaluate the fatigue life of the PC T-girder bridges, in-situ dynamic strain monitoring was conducted continuously over one month, and traffic volume was recorded manually. Figure 13(a) is the cross section of simple supported PC T-girder bridge, which is built in 1992. Carbon steel wires are used in prestressing steel tendons, and every tendon contains 24 wires with 5mm in diameter. Longitudinal steel bar in the bottom part of T-girder is 20mm in diameter. Figure 13(b) is the cross section of continuous PC T-girder bridge, prestressing steel strands (9-7Ф5) and 20-diameter steel bars are used in T-girders. Since the steel bars and prestressing steel tendons or strands in the lower position are subject to more fatigue damage, the lowest longitudinal steel bar and the lowest prestressing steel wires or strands are selected to evaluate the fatigue life. S-N curve for longitudinal steel bar used in this paper is from European Convention for Constructional Steelwork (ECCS) [20], S-N curve for prestressing steel wires is proposed by Song [21], and S-N curve for prestressing steel strand is suggested by Ma [22]. In order to considering contributions of corrosion and low stress ranges, fatigue categories of steel bars and prestressing steel wires or strands are lowered to the 65% [23]. Considering contributions of low stress ranges, fatigue life of the lowest steel bar in simple supported PC girder bridge is 4421 and 9380 years for girders under the heavy lane and light lane, respectively; and fatigue life of lowest prestressing steel wire is 1390 and 1616 years. Fatigue life of lowest steel bar in continuous PC girder bridge is 145389 and 333211 years for girders under the heavy lane and light lane, respectively; and fatigue life of lowest prestressing steel wire is 32100 and 46751 years. Based on LEFM and the depth of initial cracks are assumed as 1.0mm considering the corrosion pit flaws, fatigue life of the lowest steel bar in simple supported PC girder bridge is 1094 and 1287 years for girders under the heavy lane and light lane, respectively; and fatigue life of lowest prestressing steel wire is 1734 and 2326 years. Fatigue life of lowest steel bar in continuous PC girder bridge is 29186 and 39763 years for girders under the heavy lane and light lane, respectively; and fatigue life of lowest prestressing steel wire is 24773 and 26661 years, as indicated in Table 5.
318 Fatigue Service Life Evaluation of Existing Steel and Concrete Bridges
(a) Simple supported PC Girder (b) Continuous PC Girder
Figure 13. Critical Steel Bar and Steel Wire in PC Girder Bridges
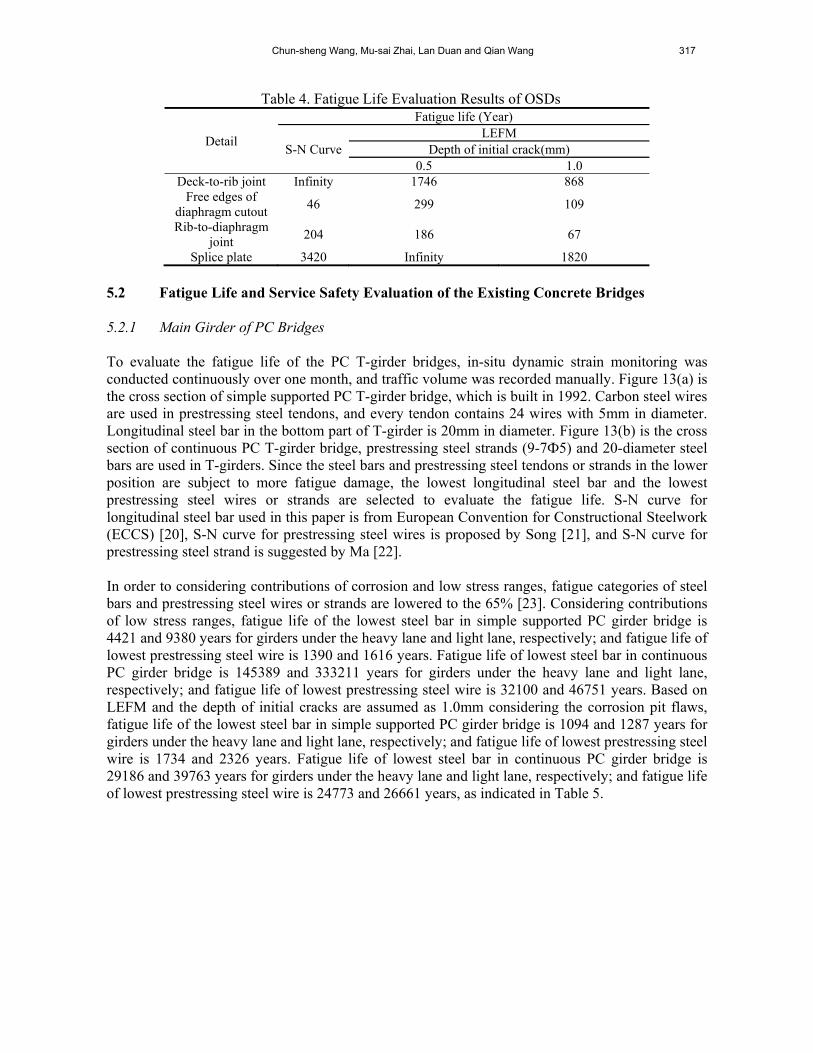
Table 5. Fatigue Life Evaluation Results of PC Bridges
Bridge Position Object Fatigue life (Year)
S-N Curve LEFM
Simple supported PC
bridge
Heavy Lane Prestressing steel wire 1390 1734
Steel bar 4421 1094
Light Lane Prestressing steel wire 1616 2326
Steel bar 9380 1287
Continuous PC bridge
Heavy Lane Prestressing steel wire 32100 24773
Steel bar 145389 29186
Light Lane Prestressing steel wire 46751 26661
Steel bar 333211 39763
From the two PC bridges evaluation results, it can be concluded that under the similar traffic load, the fatigue life of continuous PC girder bridge is longer than simple supported PC girder bridge. For PC girder bridges, fatigue life of steel bar and wire calculated by LEFM method or S-N Curve method is more large than the bridge design service life (100 years), but the fatigue life should be shortened sharply considering the overloading, concrete crack, corrosion fatigue and durability damage. 5.2.2 RC Deck Beams Conservative S-N curve of ECCS [20] is applied to evaluate the fatigue life of Qilangwo Yellow River Bridge. On the basis of monitoring data and considering traffic volume increase prediction, the evaluation result showed that the fatigue life of RC deck beams for Qilangwo Yellow River Bridge is 418 years. Due to reinforced concrete structure is permitted cracking in service life, corrosion of steel reinforcement can cause the reduction of fatigue strength. According to previous research [23], a reduction factor for fatigue strength, which defined as stress range, was 1.35 (pitting causing loss of cross section up to 25 percent). By corrosion fatigue re-evaluation, the fatigue life was reduced to 93 years. Through the calculation above, corrosion of rebar would greatly reduce the fatigue life of RC bridges.
Steel bar(Ф10)
Prestressingsteel tendon
Carbon steel wire 24-Ф5
The loweststeel wire
Prestressingsteel strand
Steel bar(Ф20)
9-7Ф5
The loweststeel strand
The loweststeel wire
7Ф5
Chun-sheng Wang, Mu-sai Zhai, Lan Duan and Qian Wang 319
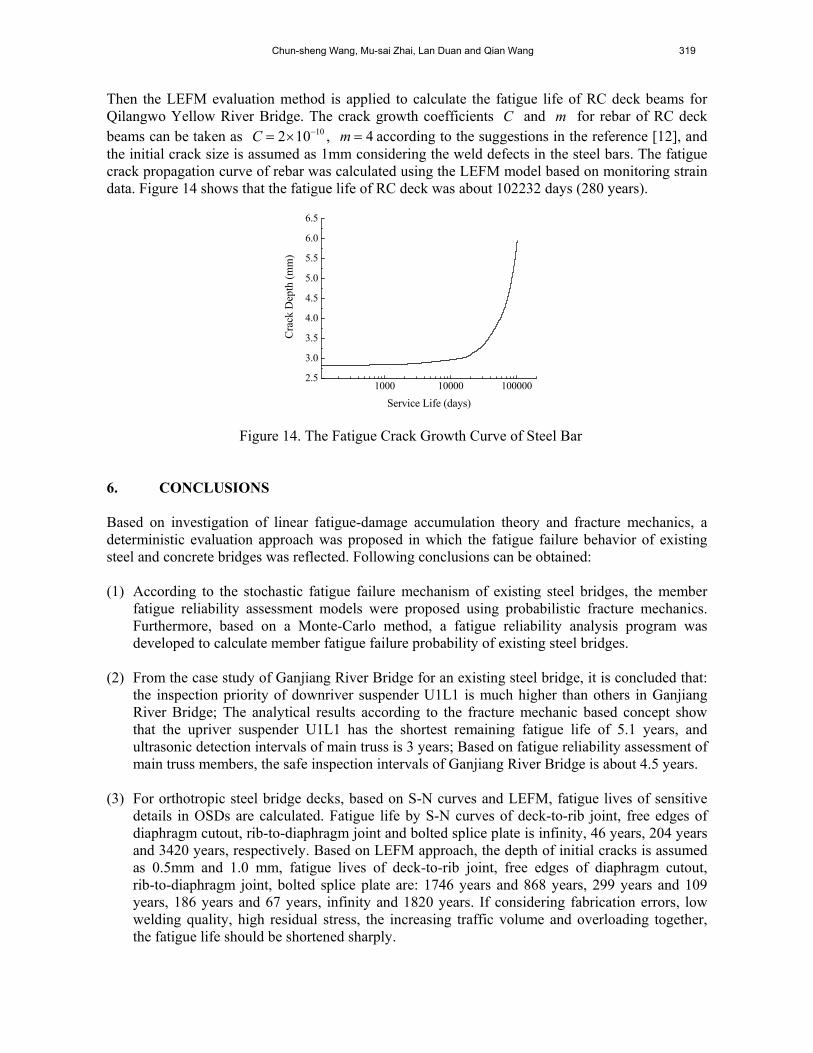
Then the LEFM evaluation method is applied to calculate the fatigue life of RC deck beams for Qilangwo Yellow River Bridge. The crack growth coefficients C and m for rebar of RC deck beams can be taken as 102 10C , 4m according to the suggestions in the reference [12], and the initial crack size is assumed as 1mm considering the weld defects in the steel bars. The fatigue crack propagation curve of rebar was calculated using the LEFM model based on monitoring strain data. Figure 14 shows that the fatigue life of RC deck was about 102232 days (280 years).
1000 10000 1000002.5
3.0
3.5
4.0
4.5
5.0
5.5
6.0
6.5
Cra
ck D
epth
(m
m)
Service Life (days)
Figure 14. The Fatigue Crack Growth Curve of Steel Bar 6. CONCLUSIONS Based on investigation of linear fatigue-damage accumulation theory and fracture mechanics, a deterministic evaluation approach was proposed in which the fatigue failure behavior of existing steel and concrete bridges was reflected. Following conclusions can be obtained: (1) According to the stochastic fatigue failure mechanism of existing steel bridges, the member
fatigue reliability assessment models were proposed using probabilistic fracture mechanics. Furthermore, based on a Monte-Carlo method, a fatigue reliability analysis program was developed to calculate member fatigue failure probability of existing steel bridges.
(2) From the case study of Ganjiang River Bridge for an existing steel bridge, it is concluded that: the inspection priority of downriver suspender U1L1 is much higher than others in Ganjiang River Bridge; The analytical results according to the fracture mechanic based concept show that the upriver suspender U1L1 has the shortest remaining fatigue life of 5.1 years, and ultrasonic detection intervals of main truss is 3 years; Based on fatigue reliability assessment of main truss members, the safe inspection intervals of Ganjiang River Bridge is about 4.5 years.
(3) For orthotropic steel bridge decks, based on S-N curves and LEFM, fatigue lives of sensitive details in OSDs are calculated. Fatigue life by S-N curves of deck-to-rib joint, free edges of diaphragm cutout, rib-to-diaphragm joint and bolted splice plate is infinity, 46 years, 204 years and 3420 years, respectively. Based on LEFM approach, the depth of initial cracks is assumed as 0.5mm and 1.0 mm, fatigue lives of deck-to-rib joint, free edges of diaphragm cutout, rib-to-diaphragm joint, bolted splice plate are: 1746 years and 868 years, 299 years and 109 years, 186 years and 67 years, infinity and 1820 years. If considering fabrication errors, low welding quality, high residual stress, the increasing traffic volume and overloading together, the fatigue life should be shortened sharply.
320 Fatigue Service Life Evaluation of Existing Steel and Concrete Bridges
(4) S-N curves and LEFM approaches are verified by fatigue life evaluation of two PC girder bridges. The simple supported PC bridge fatigue life by S-N curves of is at least 1390 years, and continuous PC girder bridge is 32100 years. Fatigue life by LEFM approach of simple supported PC girder bridge is more than 1094 years, and continuous PC girder bridge is 24773 years. Fatigue life by S-N curves of RC deck beams for Qilangwo Yellow River Bridge is 418 years, which will decrease to 93 years when taking corrosion into consideration; fatigue life by LEFM approach is about 280 years. Based on the fatigue safety evaluation of existing concrete bridges, the following conclusions could be gained: (a) The S-N curve and LEFM approaches could be effectively applied to evaluate the fatigue safety of actual PC girders and RC deck beams. (b) Combined with other factors of deterioration such as corrosion, corrosion fatigue could cause the remarkable reduction of fatigue life for concrete bridges. (c) Furthermore, the effect of overloading and oversize trucks should be investigated in-depth.
(5) The deterministic and probabilistic assessment methods proposed in this paper were verified by fatigue life evaluation of typical existing steel and concrete bridges. According to assessment results, the deterministic and probabilistic remaining fatigue life, safe inspection intervals and maintenance strategies were determined, which can avoid fatigue failure accidents and reduce the life-cycle cost of these transportation structures.
ACKNOWLEDGMENTS The writer gratefully acknowledges the financial support provided by the Major State Basic Research Development program of China (973 Program) Sub-program (2015CB057703), the Special Fund for Basic Scientific Research of Central Colleges of the P.R. China, Chang’an University (10821153501, 310821153401 and 310821153314), the Transportation Science and Technology Project of Transport Ministry of P. R. China (2013318223040), Science and Technology Research Project of China Communications Construction Company Limited (Grant No.2012-ZJKJ-3), the Shaanxi Province Transportation Technology Research Project (Grant No.07-04k) and the Doctoral Postgraduate Technical Project of Chang’an University (2014G5290008). REFERENCES [1] Wang, C.S., Chen, A.R., Chen, W.Z. and Xu, Y. “Application of Probabilistic Fracture
Mechanics in Evaluation of Existing Riveted Bridges”, Journal of Bridge Structures, 2006, Vol.2, No.4, pp. 223-232.
[2] Wang, C.S., Chen, W.Z. and Chen, A.R., “Fatigue Safety Assessment of Existing Steel Bridges in China”, Structural Engineering International, 2009, Vol. 19, No. 2, pp. 174-179.
[3] Wang, C.S., Li G., Dong X.H., Hao L. and Wang J.H., “Fatigue Life Evaluation of Existing Highway Reinforced Concrete Bridges”, Proceeding of the 5th International Conference on Maintenance, Safety and Management, CRC Press, Taylor & Francis Group, 2010, pp.685.
[4] Wang, C.S., Zhou J., Wu Q.Y., Wang Y.J. and Dong X.H., “Fatigue Life and Service Safety Assessment for Existing Concrete Bridges”, China Journal of Highway and Transport, 2012, Vol. 25, No. 6, pp. 101-107. (in Chinese)
[5] Pijpers, R.J.M., Kolstein, M.H., Romeijn, A. and Bijlaard, F.S.K. “Fatigue Experiments on Very High Strength Steel Base Material and Transverse Butt Welds”, Advanced Steel Construction, 2009, Vol. 5, No. 1, pp. 14-32.
[6] EN 1993-2, “Eurocode 3: Design of Steel Structures: Part 2: Steel Bridges”, European Committee for Standardization, Brussels, 2006.

Chun-sheng Wang, Mu-sai Zhai, Lan Duan and Qian Wang 321
[7] Barsom, J.M. and Rolfe, S.T., “Fracture and Fatigue Control in Structures: Applications of Fracture Mechanics, Third Edition”, American Society for Testing and Materials, West Conshohocken, USA, 1999.
[8] British Standards Institution, “Guidance on Methods for Assessing the Acceptability of Flaws in Fusion Welded Structures”, BSI PD 6493, London, UK, 1991.
[9] Newman, J.C. and Raju, I.S., “An Empirical Stress-intensity Factor Equation for the Surface Crack”, Engineering Fracture Mechanics, 1981, Vol. 15, No.1-2, pp. 185-192.
[10] Hobbacher, A., “Stress Intensity Factors of Welded Joints”, Engineering Fracture Mechanics, 1993, Vol. 46, No. 2, pp. 173-182.
[11] China Aerospace Research Institute, “Handbook of Stress Intensity Factor”, Science Press, Beijing, China, 1993. ( in Chinese)
[12] Herwig, A., “Reinforced Concrete Bridges under Increased Railway Traffic Loads”, Ph.D. Thesis, École Polytechnique Fédérale de Lausanne, Lausanne, 2008.
[13] British Standard Institute, “Guide on Methods for Assessing the Acceptability of Flaws in Metallic Structures”, BS7910, London, UK, 2007.
[14] Zhao, Z.W., Haldar, A. and Breen, JR. F.L., “Fatigue Reliability Evaluation of Steel Bridges”, J. Struct. Eng., ASCE, 1994, Vol. 120, No. 5, pp. 1608-1623.
[15] Zhang, R.X. and Mahadevan, S., “Fatigue Reliability Analysis Using Nondestructive Inspection”, J. Struct. Eng., ASCE, 2001, Vol.127, No.8, pp. 957-965.
[16] Yazdani, N. and Albrecht, P., “Risk Analysis of Fatigue Failure of Highway Steel Bridges”, J. Struct. Eng., ASCE, 1987, Vol. 113, No. 3, pp. 483-500.
[17] Geiβler, K., “Beitrag zur Probabilistischen Berechnung der Restnutzungsdauer Stahlerner Brucken”, Ph.D. Thesis, Technische Universitaet Dresden, Dresden, 1995.
[18] Wang, C.S., “Assessment of Remaining Fatigue Life and Service Safety for Riveted Steel Bridges”, Tongji University Press, Shanghai, China, 2007. (in Chinese)
[19] Dibattista, J.D., Adamson D.E.J. and Kulak, G.L., “Fatigue Strength of Riveted Connections”, J. Struct. Eng., ASCE, 1998, Vol. 124, No. 7, pp. 792-797.
[20] ECCS, “Recommendations for the Fatigue Design of Steel Structures”. European Convention for Constructional Steelwork, Brussels, Belgium, 1985.
[21] Song, Y.P., “Fatigue Behavior and Design Principle of Concrete Structures”, China Machine Press, Beijing, China, 2006. ( in Chinese)
[22] Ma, L., “Fatigue Performance Study of 1860 MPa Low Relaxation Prestressing Steel Wires”, Railway Standard Design, 2000, Vol. 20, No.5, pp. 21-23. ( in Chinese)
[23] Walker, E.F., Harrison, I.M. and Morley, J., “Fatigue and Corrosion Fatigue of Reinforcement Bars”, Proc. Conf. Underwater Construction Technology, Department of Civil and Structural Engineering Report, University College, Cardiff, 1975.