
FATIGUE RELIABILITY OF STRUCTURAL CONNECTIONS USING …
10
EMM577-1 Leadership in Sustainable Infrastructure Leadership en Infrastructures Durables Vancouver, Canada May 31 – June 3, 2017/ Mai 31 – Juin 3, 2017 FATIGUE RELIABILITY OF STRUCTURAL CONNECTIONS USING STRESS CONCENTRATION INFORMATION Wokem, Christian 1,2 , Subedi, Jishnu 1 1 Southern Alberta Institute of Technology, Canada 2 [email protected] Abstract: There are mainly two types of structural connections, bolted and welded connections. These connections in many types of structures such as bridges, cranes and buildings are subjected to fatigue loading and mostly fail at stresses that are significantly less than the yield strength of the material. The failure of such connections can be amplified by the presence of stress raisers such as bolt holes and bearing of the bolts against the connection plates, which could significantly reduce the reliability of these connections in terms of their useful fatigue life. This research will focus on identification of the parameters that affect the fatigue reliability of splice bolted connection. This is done through a literature study and the finite element modeling and analysis of various geometric configurations of the connections to obtain the stress concentration, then using reliability and sensitivity techniques to obtain parameters that can adversely affect the reliability of these details. Some parameters that have been shown to affect the stress concentration, and hence the fatigue life, are the plate thickness, the bolt hole diameter, the applied load, the number of line of bolt holes, and the gage and edge distances. Ways to improve the reliability of these connections in terms of fatigue life were investigated and discussed. 1 Introduction Structural components are typically connected using bolts or welds, and both types of structural connections are used in applications where they will be subjected to repeated cycles of loading (i.e. Fatigue loading). Fatigue failure of such connections has been found to occur at significantly lower stresses than the elastic limit of the connection material (Kulak et al. 1987). The reliability of such connections subjected to fatigue loading is reduced primarily because of the presence of stress raisers such as bolt holes and the bearing pressure exerted by the bolts on the main, splice, or lap plates, and discontinuities. The fatigue life of these connections is hence dependent on the amount of stress imposed by such stress raisers, that is, the stress concentration. The higher the stress concentration in the connection detail, the less reliable the connection will be in terms of the fatigue life. The effect of parameters such as stagger, gage and edge distance on the stress concentration and hence the fatigue life was investigated by Josi et al. (1999) for a bearing-type splice plates. Wokem (2010) also investigated the effect of parameters such as the edge and gage distances, stagger, thickness of the plates on the stress concentration and the fatigue life of bearing-type built-up I sections. To date the effect of parameters such as the thickness of the splice plate, end distance, and the number of lines of bolts perpendicular to the axis of loading on the stress concentration and fatigue life of bearing-type shear splice details have either not been investigated or have scarcely been investigated. This work uses a finite element analysis approach to investigate some of the parameters that may affect the stress concentration in a bolted connection and discusses several ways to improve the fatigue reliability of bearing-type shear splice connections.
Transcript of FATIGUE RELIABILITY OF STRUCTURAL CONNECTIONS USING …

EMM577-1
Leadership in Sustainable Infrastructure
Leadership en Infrastructures Durables
Vancouver, Canada
May 31 – June 3, 2017/ Mai 31 – Juin 3, 2017
FATIGUE RELIABILITY OF STRUCTURAL CONNECTIONS USING STRESS CONCENTRATION INFORMATION
Wokem, Christian1,2, Subedi, Jishnu1 1 Southern Alberta Institute of Technology, Canada 2 [email protected]
Abstract: There are mainly two types of structural connections, bolted and welded connections. These connections in many types of structures such as bridges, cranes and buildings are subjected to fatigue loading and mostly fail at stresses that are significantly less than the yield strength of the material. The failure of such connections can be amplified by the presence of stress raisers such as bolt holes and bearing of the bolts against the connection plates, which could significantly reduce the reliability of these connections in terms of their useful fatigue life. This research will focus on identification of the parameters that affect the fatigue reliability of splice bolted connection. This is done through a literature study and the finite element modeling and analysis of various geometric configurations of the connections to obtain the stress concentration, then using reliability and sensitivity techniques to obtain parameters that can adversely affect the reliability of these details. Some parameters that have been shown to affect the stress concentration, and hence the fatigue life, are the plate thickness, the bolt hole diameter, the applied load, the number of line of bolt holes, and the gage and edge distances. Ways to improve the reliability of these connections in terms of fatigue life were investigated and discussed.
1 Introduction
Structural components are typically connected using bolts or welds, and both types of structural connections are used in applications where they will be subjected to repeated cycles of loading (i.e. Fatigue loading). Fatigue failure of such connections has been found to occur at significantly lower stresses than the elastic limit of the connection material (Kulak et al. 1987). The reliability of such connections subjected to fatigue loading is reduced primarily because of the presence of stress raisers such as bolt holes and the bearing pressure exerted by the bolts on the main, splice, or lap plates, and discontinuities. The fatigue life of these connections is hence dependent on the amount of stress imposed by such stress raisers, that is, the stress concentration. The higher the stress concentration in the connection detail, the less reliable the connection will be in terms of the fatigue life. The effect of parameters such as stagger, gage and edge distance on the stress concentration and hence the fatigue life was investigated by Josi et al. (1999) for a bearing-type splice plates. Wokem (2010) also investigated the effect of parameters such as the edge and gage distances, stagger, thickness of the plates on the stress concentration and the fatigue life of bearing-type built-up I sections. To date the effect of parameters such as the thickness of the splice plate, end distance, and the number of lines of bolts perpendicular to the axis of loading on the stress concentration and fatigue life of bearing-type shear splice details have either not been investigated or have scarcely been investigated. This work uses a finite element analysis approach to investigate some of the parameters that may affect the stress concentration in a bolted connection and discusses several ways to improve the fatigue reliability of bearing-type shear splice connections.

EMM577-2
2 Background
Research on bearing-type connections subjected to cyclic tension is scarce. DiBattista and Kulak (1995) conducted fatigue tests on riveted built-up steel members where they observed that failure took place at a plane that was perpendicular to the applied loads. Josi et al. (1999) did some finite element analysis and fatigue testing of several geometries of bearing-type connections. The effect of gage distance, edge distance, and hole stagger on the fatigue life of bearing-type splice connections were investigated by Josi et al. (1999). They concluded that the effect of hole stagger, gauge and edge distance had negligible effect on the stress concentration, and hence the fatigue life of the detail. Josi et al. (1999) proposed an equation for obtaining the fatigue life of bearing-type shear splice details.
[1] 19 74 10 scN
Where N is the fatigue life, and corrected stress range,sc sc gF , and
0sc k SF SCF SCF , kSCF is
the stress concentration factor for any geometry k, and 0SSCF is the stress concentration factor for a
standardized S0 geometry (for plate with no stagger). In Josi et al. (2004), it was suggested that the fatigue strength of bearing-type shear splice be calculated based on the gross sectional stress ranges. Wokem (2010) used a numerical approach to investigate the parameters that had an effect on the stress concentration of bearing-type built-up I sections and concluded that the bolt hole diameter, the gauge distance, the edge distance and the ratio of the total area of the connection to the area of the flange connected to the gusset plate had an influence in the stress concentration and hence the fatigue life of such bearing-type connections. Stephens et al. (2001) and Bannantine (1990) had described how to obtain the stress concentration factor and how to use of the stress concentration to obtain the fatigue life, but again nothing significant was described on the effect of bearing-type bolted connection geometry on the fatigue life of such details.
3 Finite Element Model Development
The finite element modeling of the bearing-type shear splice connection is discussed in this section. The
geometry, material properties, loads, boundary condition, element type, and the mesh used in modeling the
connection are presented in this section.
3.1 Geometry and Material Properties
The geometry of the connection was created in AutoCAD and imported to Autodesk Simulation Mechanical.
The effect of splice thickness, end distance and number of lines of bolts perpendicular to the applied loads
on the stress concentration, were investigated using models developed in Autodesk Simulation Mechanical.
The base geometry used in the investigation of the effect of shear splice thickness was the S0 series
modeled and tested by Josi et al. (1999) and shown in Figure 1. Symmetry was applied and only half of
splice was modeled for all connections. For all analysis the edge distance and the width of the splice plate
was kept constant as 25.4 mm and 95.3 mm, respectively. The thickness of the splice plate was changed
from 9.50, 12.70 and finally to 25 mm. To investigate the effect of end distance, the end distance was
changed from 35 mm to an end distance of 50.8 mm. Details with two, three, and four lines of bolts were
modeled to investigate the effect of number of lines of bolt perpendicular to the applied loads on the stress
concentration. Table 1 shows the dimensions and parameters that were used in creating all the connections
used in this research work. All analysis was linear elastic. The Young’s modulus of the steel material was
210 GPa, and the poison ratio of all analysis was 0.3.

EMM577-3
Table 1: Dimensions and Parameters of all Splice plate connection details
S/N Length** (mm)
End distance (mm)
Thickness (mm)
n*
1 136.5 34.9 9.5 2 2 136.5 34.9 12.7 2 3 136.5 34.9 25 2 4 152.4 50.8 9.5 2 5 75.7 34.9 9.5 1 6 196.8 34.9 9.5 3 7 257.1 34.9 9.5 4
*n is the number of lines of bolts
** This represent half the length for the full splice plate
Figure 1: S0 series (by Josi et al. 1999)
3.2 Loads and Boundary Conditions
Loads of 1000 N was applied to each connection detail, and this was divided equally between all bolts in
the connection. This was done, so that the results of the current research would be verified with the results
presented by Josi et al. (1999). Josi et al. (1999) had shown that whether the bolt loads were applied by a
single load at the holes or 15 equal loads acting over an area there was no observed difference in the
normal stress values. The bolts holes in the current research were split into several surfaces and the bolt
loads were applied at a 60 degrees surface from the centre of each bolt hole as shown in Figure 2. At the
surface of the bolt holes where the bolt loads were applied the displacement in the y and z directions were
restrained. All plates had the ends of the plate completely fixed. Figure 3 shows the schematic of the loads
and boundary conditions applied to each connection detail.

EMM577-4
Figure 2: Connection detail showing loaded surface
Figure 3: loads and boundary conditions
3.3 Finite Element Mesh
The connection was modeled using tetrahedral 2nd order brick elements. To obtain a mesh that is sufficiently
fine enough to obtain accurate stress results, a mesh convergence study was carried out. Figure 4 shows
the results of the mesh convergence study and it can be seen that a normal stress of 4.27 MPa with a mesh
size of 4779 elements and element size of 2 mm gave approximately converged solution. Hence an element
size of 2 mm was used for all finite element analysis for this work.
Figure 4: Mesh convergence Plot
1.2
1.7
2.2
2.7
3.2
3.7
4.2
4.7
0 5000 10000 15000 20000 25000
Pea
k m
axim
um
no
rmal
str
ess
number of elememts

EMM577-5
4 Results and Stress Concentration Information
In this section, the results of the finite element analysis are presented. The stress distributions in some
splice plate geometries were presented and the stress concentration factor (SCF) is obtained using the
peak normal stress and the gross section stress.
4.1 Finite Element Results
To investigate the effect of thickness of the splice plate on the SCF, three splice plate thicknesses of
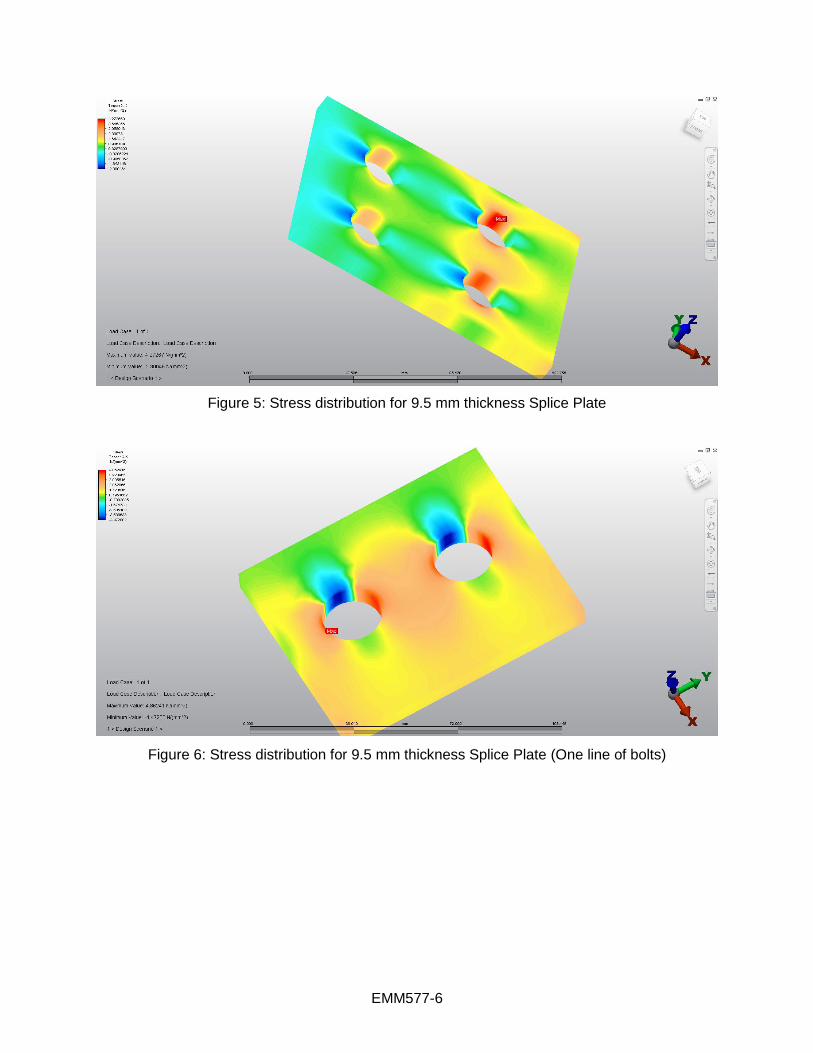
9.50 mm, 12.7 mm and 25 mm were modeled. Figure 5 shows the magnitude and location of the peak
stresses obtained from the finite element analysis for the 9.5 mm thickness splice plate. It can be seen that
the maximum normal stress occurs at the bolt hole closest to the fixed end of the splice plate for the half
connection (which is the bolt holes that is closest to the centre of the splice in the full connection). Josi et
al. (1999) also observed that failure in fatigue of these details took place at a plane that was perpendicular
to the direction of load and that the failure was typically at the bolt holes that were closest to the centre of
the splice plates as was observed in the finite element results shown in Figure 5.
To investigate the effect of end distance, a splice plate with end distance of 50.8 mm was created in
Autodesk Simulation Mechanical and the analysis showed a peak stress of 4.16 MPa. This shows that the
effect of the end distance on the stress concentration is very insignificant within the range of end distance
investigated.
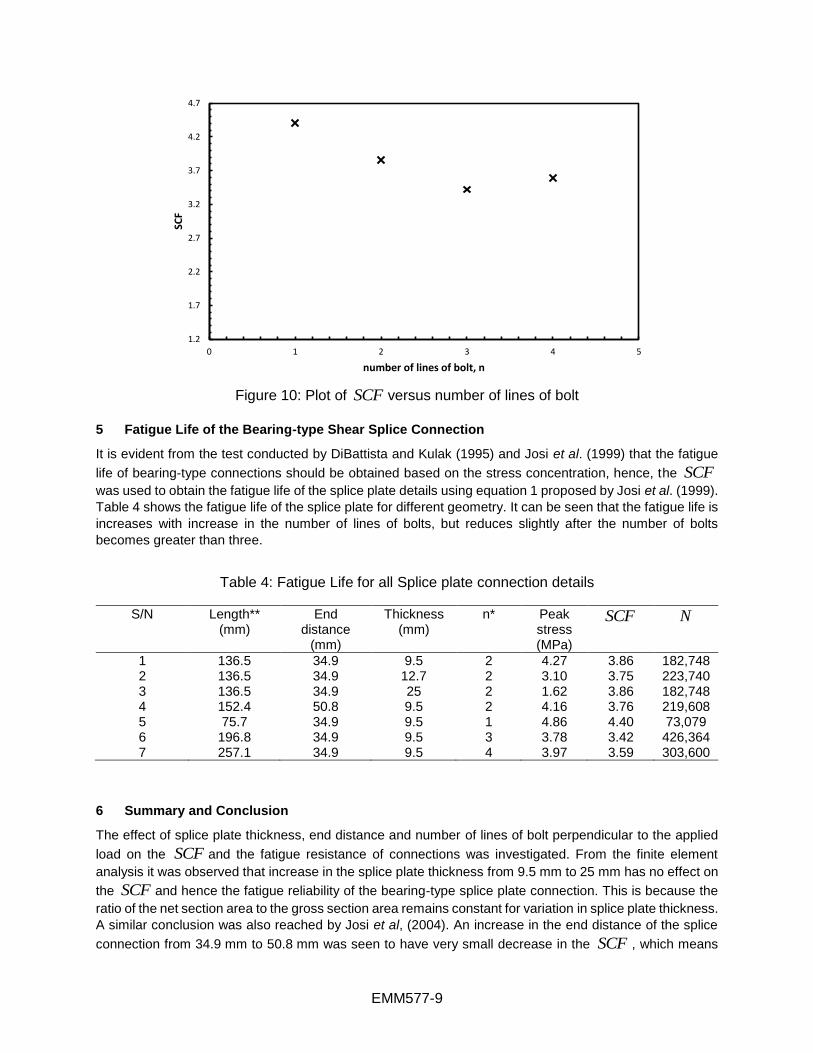
Finally, the effect of number of lines of bolts perpendicular to the applied loads was investigated and the
peak stresses were obtained from the finite element analysis for one, two, three and four lines of bolts. The
location of the peak stress in each case shown was seen to be at the bolt holes that were closest to the
centre of the splice plate. Figure 6 through Figure 8 shows the stress distribution for the splice plate with
one, three and four lines of bolts. Table 2 shows the peak stresses obtained from the finite element for all
the shear splice plate thicknesses, end distance and lines of bolts investigated.
Table 2: Peak stress for splice plate connection details
S/N Length** (mm)
End distance (mm)
Thickness (mm)
n* Peak stress (MPa)
1 136.5 34.9 9.5 2 4.27 2 136.5 34.9 12.7 2 3.10 3 136.5 34.9 25 2 1.62 4 152.4 50.8 9.5 2 4.16 5 75.7 34.9 9.5 1 4.86 6 196.8 34.9 9.5 3 3.78 7 257.1 34.9 9.5 4 3.97
EMM577-6
Figure 5: Stress distribution for 9.5 mm thickness Splice Plate
Figure 6: Stress distribution for 9.5 mm thickness Splice Plate (One line of bolts)

EMM577-7
Figure 7: Stress distribution for 9.5 mm thickness Splice Plate (Three line of bolts)
Figure 8: Stress distribution for 9.5 mm thickness Splice Plate (Four line of bolts)
4.2 Stress Concentration Information
Several research work have proven that in bearing-type details subjected to fatigue loading failure takes
place in a plane that is perpendicular to the axis of the applied loads (Josi et al. 1999 and DiBattista et al.
1998). So it is evident that the Cochrane’s 2 4s g rule that defines the failure in static loading does not
apply to splice plate with staggered bolts subjected to fatigue loading. This clearly indicates that the fatigue
life of details is mainly depended on the stress concentration. To quantify the stress concentration, a SCF
was used. The peak normal stress was used to obtain the SCF using the following equation:

EMM577-8
[2] max
g
SCF
where max is the maximum normal stress, and g is the gross section stress obtained by dividing the total
force acting on the connection by the gross sectional area of the connection (Pilkey 1997).. Table 3 shows
the SCF obtained for all the connection geometry modeled.
Table 3: SCF for all Splice plate connection details
S/N Length** (mm)
End distance (mm)
Thickness (mm)
n* Peak stress (MPa)
SCF
1 136.5 34.9 9.5 2 4.27 3.86 2 136.5 34.9 12.7 2 3.10 3.75 3 136.5 34.9 25 2 1.62 3.86 4 152.4 50.8 9.5 2 4.16 3.76 5 75.7 34.9 9.5 1 4.86 4.40 6 196.8 34.9 9.5 3 3.78 3.42 7 257.1 34.9 9.5 4 3.97 3.59
Figure 9 shows the plot of SCF versus the splice plate thickness, and from the plot it is evident that the
SCF is the same regardless of the splice plate thickness. Josi et al. (1999) also concluded that the SCFwas dependent on the ratio of the net area to the gross area of the detail. The results from this study also
confirms that an increase the splice plate thickness does not change the SCF because, the ratio of the net
area to the gross area remains the same despite a change in the splice plate thickness. The effect of
number of lines of bolts perpendicular to the applied loads were investigated and Figure 10 shows the plot
of the SCF versus the number of lines of bolt holes. It can be seen that the SCF is high with a single line
of bolt, but gradually decreases as the number of lines of bolts is increased to two or three, but as the
number of lines of bolts increases to four, an increase in SCF is observed, although this increase is very
insignificant. It is suspected that this is due to the increased stresses posed by multiple holes situated at
close proximity to each other.
Figure 9: Plot of SCF versus splice plate thickness
1.2
1.7
2.2
2.7
3.2
3.7
4.2
0 5 10 15 20 25 30
SCF
Splice plate thickness (mm)
EMM577-9
Figure 10: Plot of SCF versus number of lines of bolt
5 Fatigue Life of the Bearing-type Shear Splice Connection
It is evident from the test conducted by DiBattista and Kulak (1995) and Josi et al. (1999) that the fatigue
life of bearing-type connections should be obtained based on the stress concentration, hence, the SCFwas used to obtain the fatigue life of the splice plate details using equation 1 proposed by Josi et al. (1999).
Table 4 shows the fatigue life of the splice plate for different geometry. It can be seen that the fatigue life is
increases with increase in the number of lines of bolts, but reduces slightly after the number of bolts
becomes greater than three.
Table 4: Fatigue Life for all Splice plate connection details
S/N Length** (mm)
End distance
(mm)
Thickness (mm)
n* Peak stress (MPa)
SCF N
1 136.5 34.9 9.5 2 4.27 3.86 182,748 2 136.5 34.9 12.7 2 3.10 3.75 223,740 3 136.5 34.9 25 2 1.62 3.86 182,748 4 152.4 50.8 9.5 2 4.16 3.76 219,608 5 75.7 34.9 9.5 1 4.86 4.40 73,079 6 196.8 34.9 9.5 3 3.78 3.42 426,364 7 257.1 34.9 9.5 4 3.97 3.59 303,600
6 Summary and Conclusion
The effect of splice plate thickness, end distance and number of lines of bolt perpendicular to the applied
load on the SCF and the fatigue resistance of connections was investigated. From the finite element
analysis it was observed that increase in the splice plate thickness from 9.5 mm to 25 mm has no effect on
the SCF and hence the fatigue reliability of the bearing-type splice plate connection. This is because the
ratio of the net section area to the gross section area remains constant for variation in splice plate thickness.
A similar conclusion was also reached by Josi et al, (2004). An increase in the end distance of the splice
connection from 34.9 mm to 50.8 mm was seen to have very small decrease in the SCF , which means
1.2
1.7
2.2
2.7
3.2
3.7
4.2
4.7
0 1 2 3 4 5
SCF
number of lines of bolt, n

EMM577-10
the fatigue reliability of the connection will be improved insignificantly. Finally, it was observed that an
increase in the number of lines of bolt perpendicular to the applied loads from single line of bolts to two
lines of bolts and three line of bolts decreased the SCF (i.e. increased the fatigue life), but when the
number of lines of bolts were increased to four the SCF tends to increase although the increase is very
insignificant. This increase in stress is suspected to be because of the stress interaction between multiple
bolts in connections with more number of bolts. From this research work it is evident that the most important
parameters that has a greater influence on the fatigue reliability of bearing-type shear splice connections is
the number of lines of bolts perpendicular to the applied loads, and the ratio of the net area to the gross
area of the splice connection.
7 References
Bannantine, J. A., Corner, J. J., and Handrock, J. L. 1990. Fundamentals of Metal Fatigue Analysis. Prentice-Hall Publishers Inc. Englewood Cliffs, New Jersey.
DiBattista, J. D., and Kulak, G. L. 1995. Fatigue of riveted tension members. Structural Engineering Rep. No. 211, Dept. of Civil and Environmental Engineering.
DiBattista, J. D., Adamson, D. E. J., and Kulak, G. L. 1998. Fatigue strength of riveted connections. J. Struct. Eng. 124(7): 792-797.
Josi, G., Grondin, G. Y., and Kulak, G. L. 1999. Fatigue of bearing type shear splices. Structural Engineering Rep. No. 227, Dept. of Civil and Environmental Engineering. Univ. of Alberta, Edmonton, Canada.
Josi, G., Grondin, G. Y., and Kulak, G. L. 2004. Fatigue of joints with staggered holes. Journal of Bridge Engineering, ASCE. 9(6): 614-622.
Kulak, G. L., Fisher, J. W., and Struik, J. H. A. 1987. Guide to design criteria for bolted and riveted joints, 2nd Ed., Wiley, New York.
Pilkey, W. D. 1997. Peterson’s Stress Concentration Factors, 2nd Ed., John Wiley & Sons, New York. Stephens, R. I., Fatemi, A., Stephens, R. R., and Fuchs, H. O. 2001. Metal fatigue in engineering, 2nd Ed.,
Wiley, New York. Wokem, C. 2010. Stress Concentration in Built-up Steel Members, MSc thesis, Department of Civil &
Environmental Engineering, University of Alberta, Edmonton, Alberta.


