Fatigue of Welds
67
Fatigue of Welds Professor Darrell F. Socie © 2010-2014 Darrell Socie, All Rights Reserved
Transcript of Fatigue of Welds

Fatigue of Welds
Professor Darrell F. Socie
© 2010-2014 Darrell Socie, All Rights Reserved
Fatigue of Welds © 2010-2014 Darrell Socie, All Rights Reserved 1 of 65
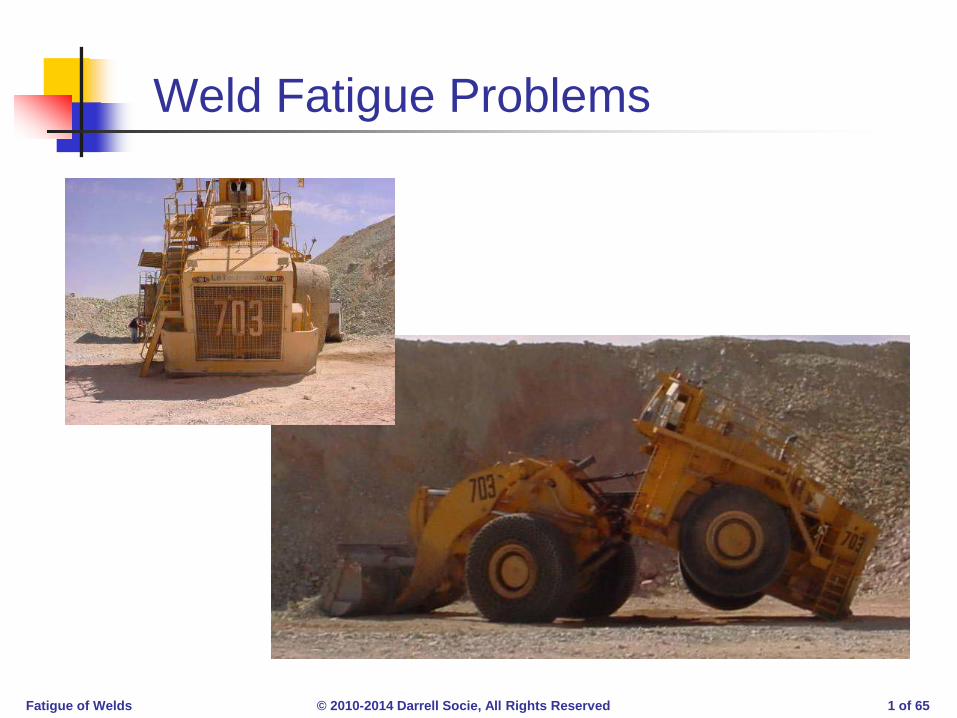
Weld Fatigue Problems
Fatigue of Welds © 2010-2014 Darrell Socie, All Rights Reserved 2 of 65
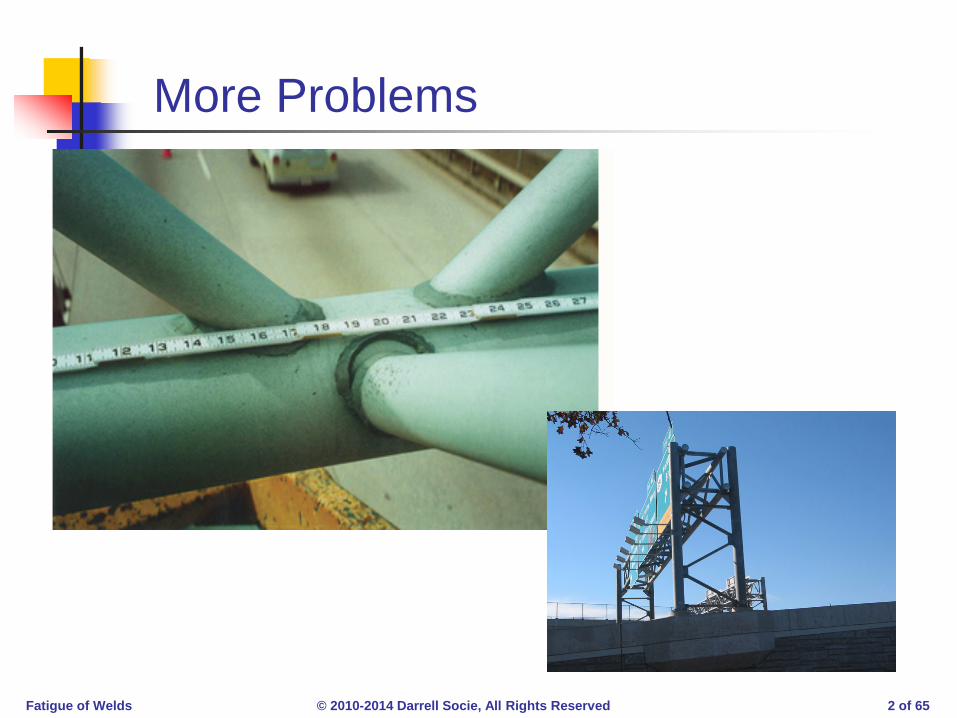
More Problems

Fatigue of Welds © 2010-2014 Darrell Socie, All Rights Reserved 3 of 65
Two Similar Shapes
Fatigue of Welds © 2010-2014 Darrell Socie, All Rights Reserved 4 of 65
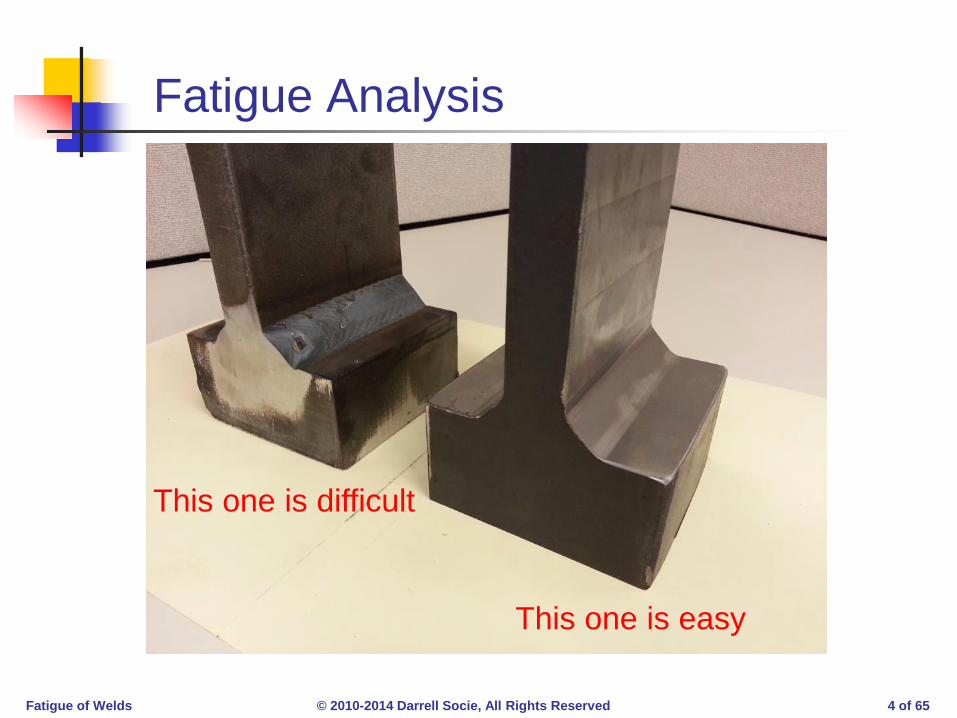
Fatigue Analysis
This one is easy
This one is difficult
Fatigue of Welds © 2010-2014 Darrell Socie, All Rights Reserved 5 of 65
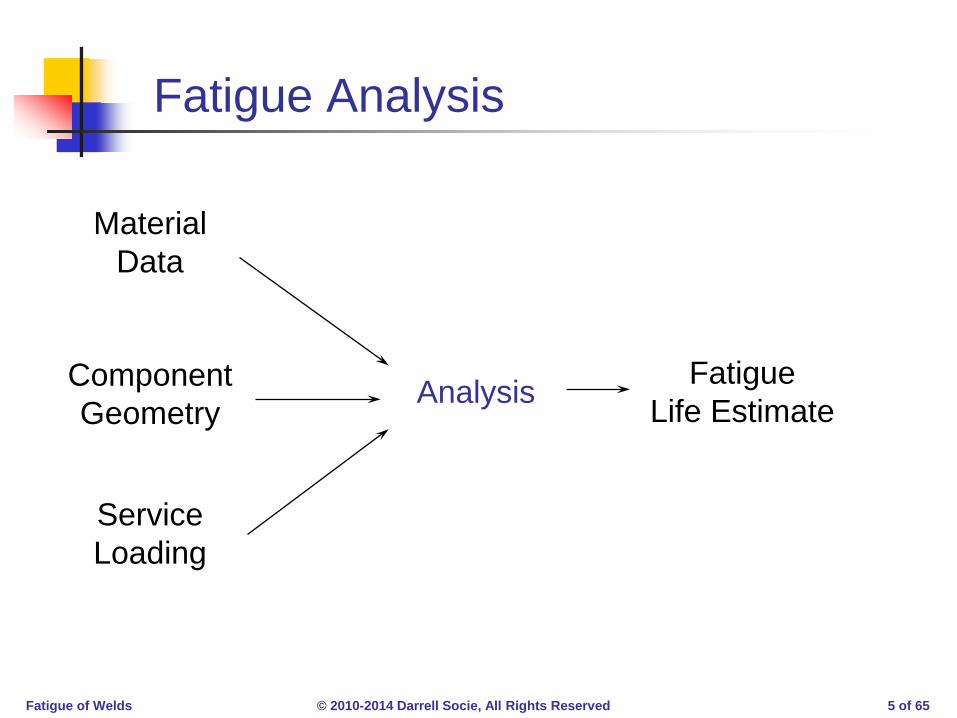
Fatigue Analysis
Material Data
Component Geometry
Service Loading
Analysis Fatigue Life Estimate
Fatigue of Welds © 2010-2014 Darrell Socie, All Rights Reserved 6 of 65
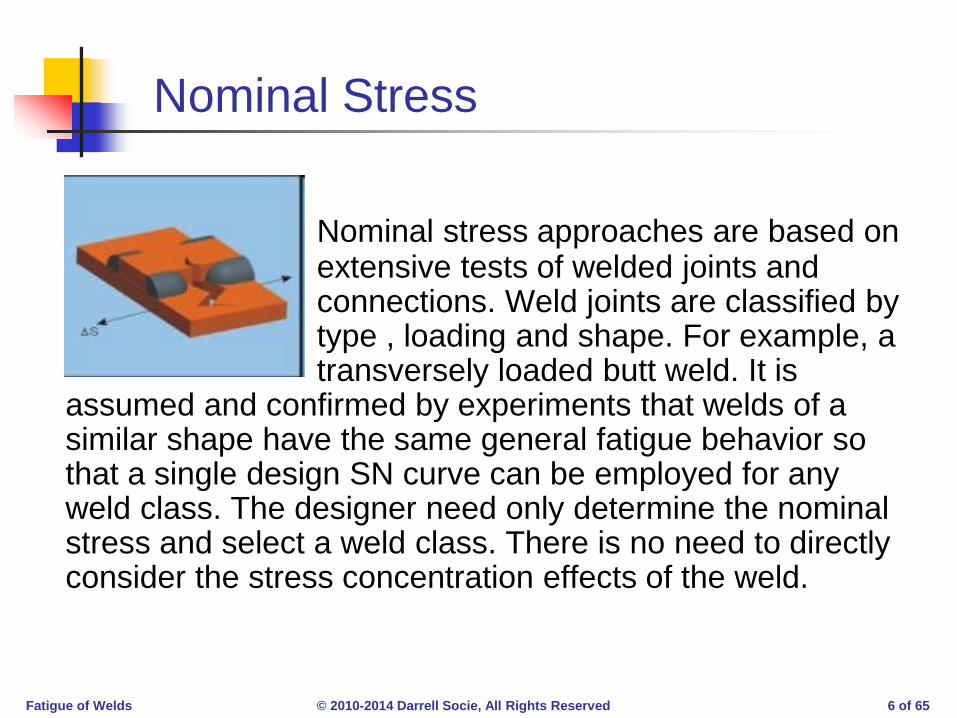
Nominal Stress
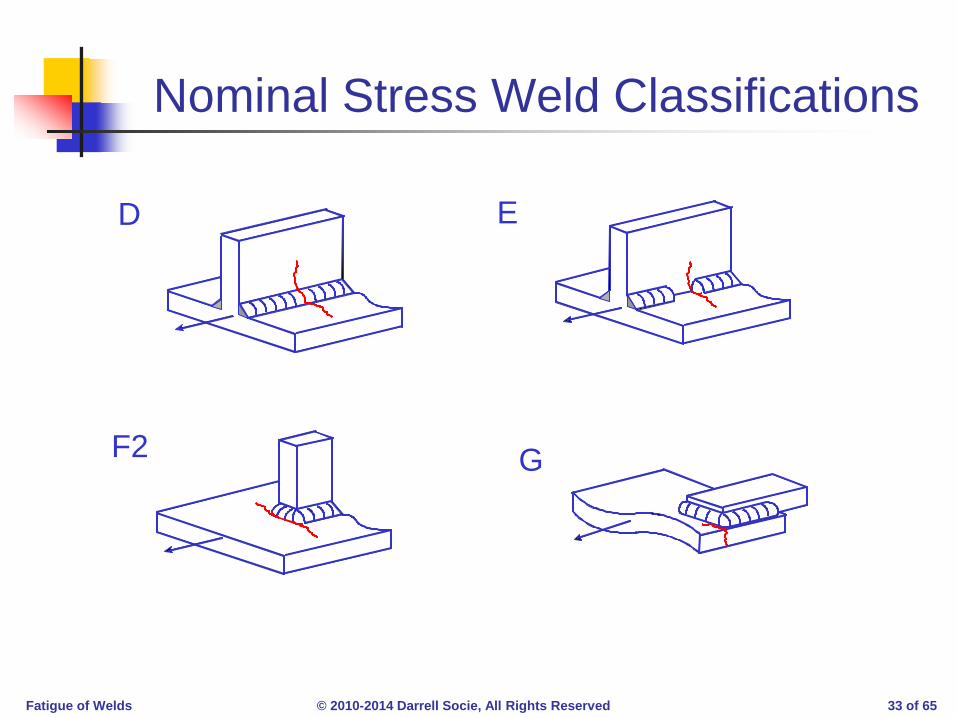
Nominal stress approaches are based on extensive tests of welded joints and connections. Weld joints are classified by type , loading and shape. For example, a transversely loaded butt weld. It is assumed and confirmed by experiments that welds of a similar shape have the same general fatigue behavior so that a single design SN curve can be employed for any weld class. The designer need only determine the nominal stress and select a weld class. There is no need to directly consider the stress concentration effects of the weld.
Fatigue of Welds © 2010-2014 Darrell Socie, All Rights Reserved 7 of 65
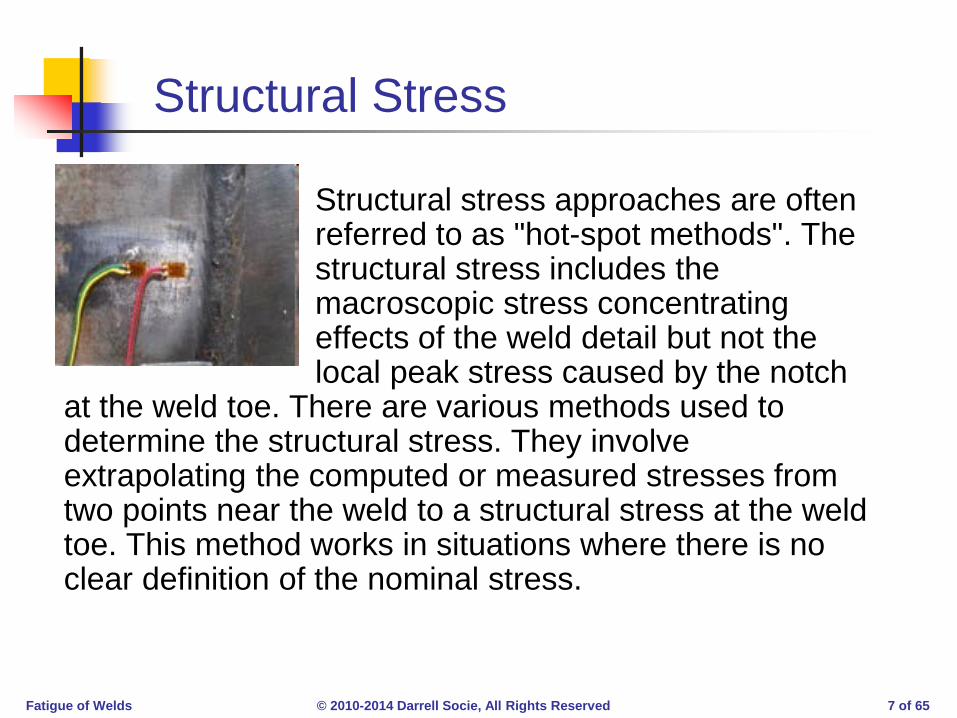
Structural Stress
Structural stress approaches are often referred to as "hot-spot methods". The structural stress includes the macroscopic stress concentrating effects of the weld detail but not the local peak stress caused by the notch at the weld toe. There are various methods used to determine the structural stress. They involve extrapolating the computed or measured stresses from two points near the weld to a structural stress at the weld toe. This method works in situations where there is no clear definition of the nominal stress.

Fatigue of Welds © 2010-2014 Darrell Socie, All Rights Reserved 8 of 65
Local Stress Strain
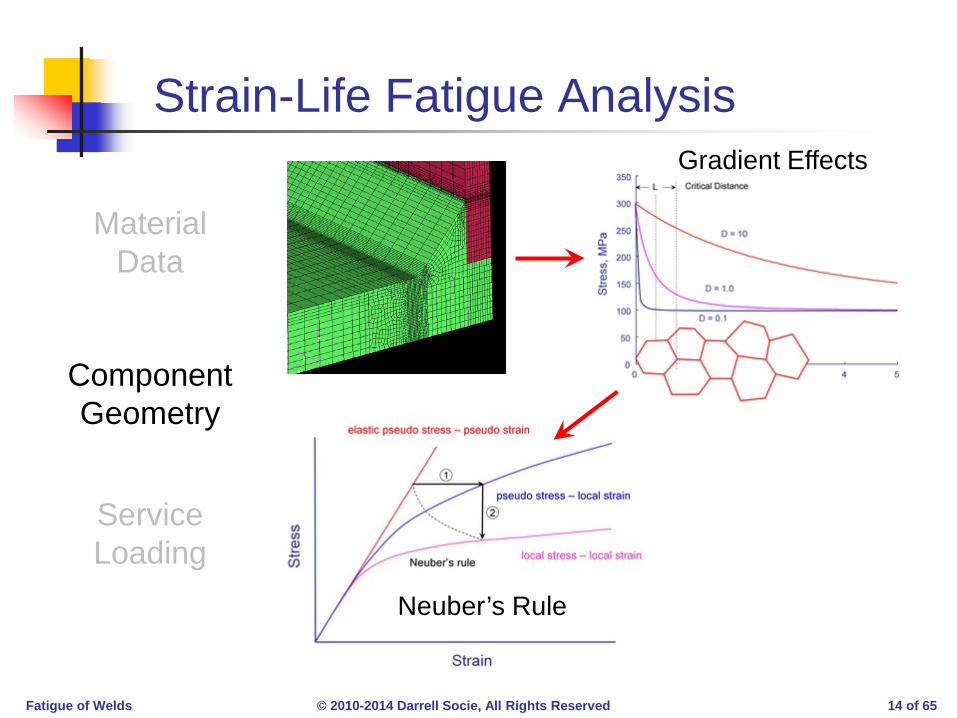
Local stress or strain approaches include both the macroscopic stress concentration due to the weld shape and the local stress concentration at the weld toe. To apply traditional methods of fatigue analysis to welds, an appropriate value of the stress concentration factor and residual stress must be selected. Although the smallest radius produces the largest stress concentration factor, its effect in fatigue is smaller because of the gradient effect. As a result there is a critical radius for fatigue that can be used to compute the fatigue notch factor.
Fatigue of Welds © 2010-2014 Darrell Socie, All Rights Reserved 9 of 65
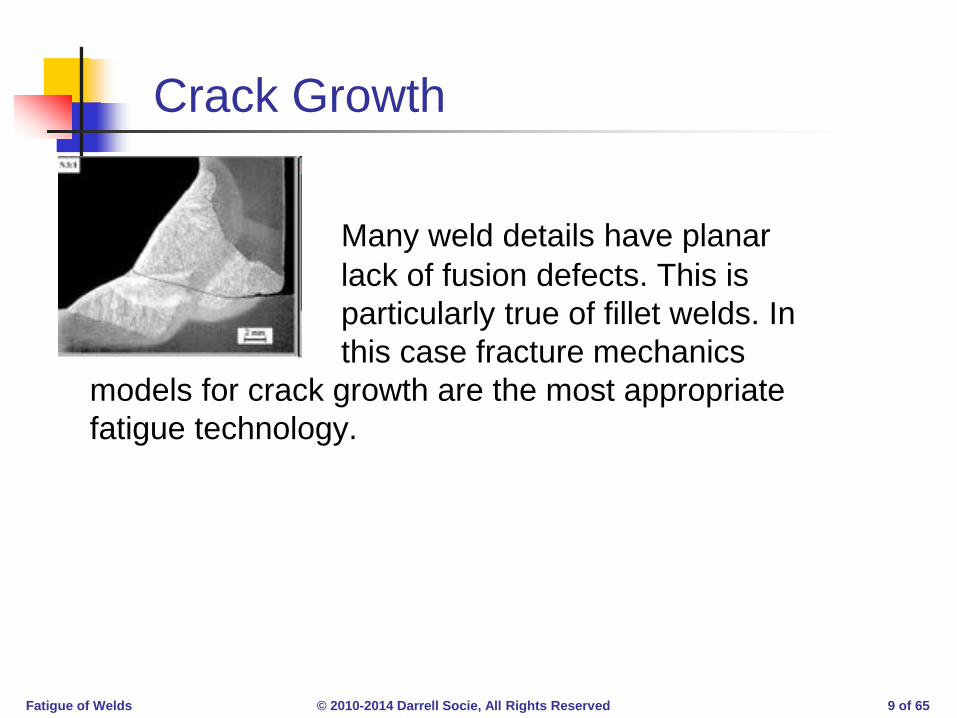
Crack Growth
Many weld details have planar lack of fusion defects. This is particularly true of fillet welds. In this case fracture mechanics models for crack growth are the most appropriate fatigue technology.

Fatigue of Welds © 2010-2014 Darrell Socie, All Rights Reserved 10 of 65
Similitude
Local stresses and strains control the fatigue life
Lifetime to about a 1mm crack
Crack initiation
Fatigue of Welds © 2010-2014 Darrell Socie, All Rights Reserved 11 of 65
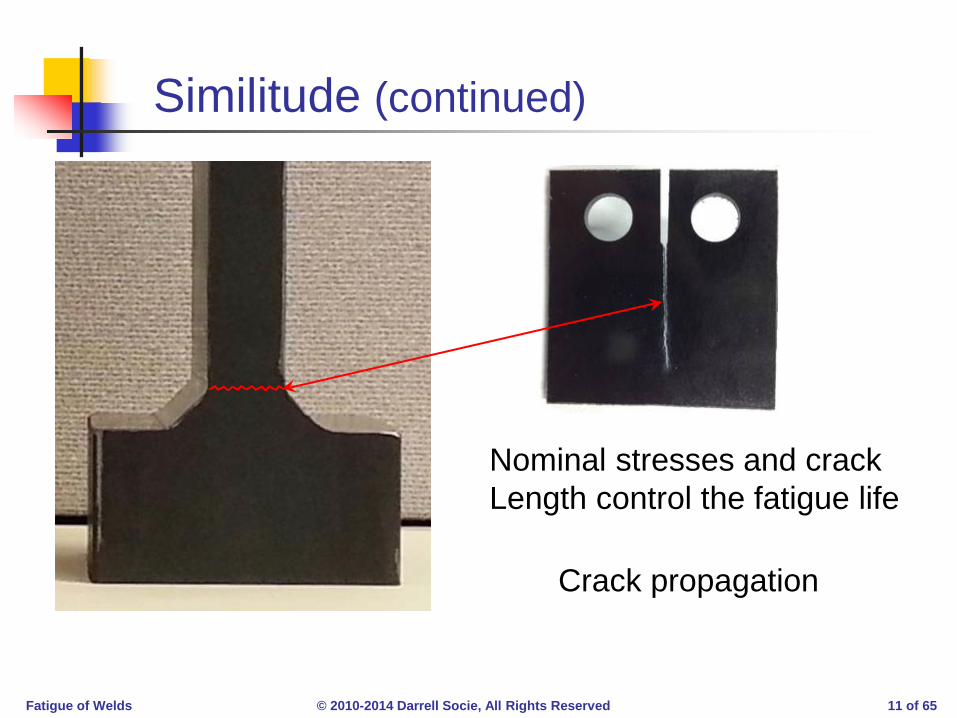
Similitude (continued)
Nominal stresses and crack Length control the fatigue life
Crack propagation

Fatigue of Welds © 2010-2014 Darrell Socie, All Rights Reserved 12 of 65
Vehicles Are Frequently Overloaded
Occasional plastic deformation → strain life analysis

Fatigue of Welds © 2010-2014 Darrell Socie, All Rights Reserved 13 of 65
Strain-Life Fatigue Analysis
Material Data
Component Geometry
Service Loading
0 ε
σ
'1
'
n
E Kσ σε = +
( ) ( )'
'2 22
∆= +
b cff f fN N
Eσε
ε
σe/E
log
(∆ε/
2)
log (2Nf)
σf/E
εf
0 2Ne
2N
ε
σ
3
2,2'
4
5,5' 7,7'
6
8
1,1'
∆σ
σ
ε
∆ε p ∆ε e= ∆σ/Ε
∆ε
0
Cyclic stress strain curve
Strain-life curve
Fatigue of Welds © 2010-2014 Darrell Socie, All Rights Reserved 14 of 65
Strain-Life Fatigue Analysis
Material Data
Component Geometry
Service Loading
Gradient Effects
Neuber’s Rule
Fatigue of Welds © 2010-2014 Darrell Socie, All Rights Reserved 15 of 65
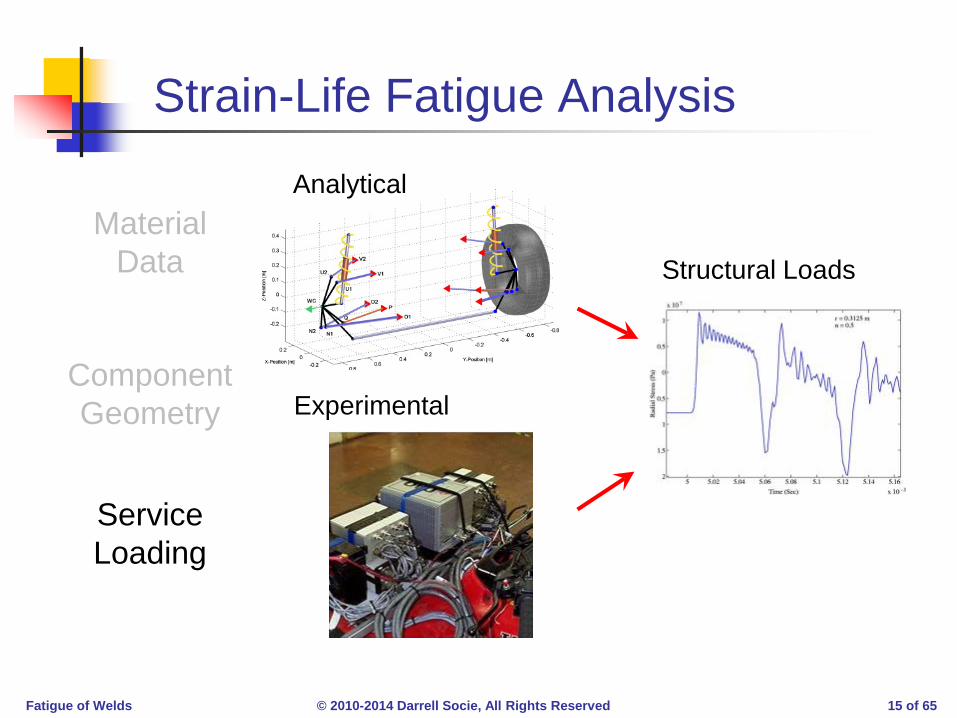
Strain-Life Fatigue Analysis
Material Data
Component Geometry
Service Loading
Analytical
Experimental
Structural Loads

Fatigue of Welds © 2010-2014 Darrell Socie, All Rights Reserved 16 of 65
Crack Growth Fatigue Analysis
Material Data
Component Geometry
Service Loading

Fatigue of Welds © 2010-2014 Darrell Socie, All Rights Reserved 17 of 65
Crack Growth Fatigue Analysis
Material Data
Component Geometry
Service Loading
σ(x)
a a
Stress distribution along crack path in an un-cracked body

Fatigue of Welds © 2010-2014 Darrell Socie, All Rights Reserved 18 of 65
Crack Growth Fatigue Analysis
Material Data
Component Geometry
Service Loading
Analytical
Experimental
Structural Loads
Fatigue of Welds © 2010-2014 Darrell Socie, All Rights Reserved 19 of 65
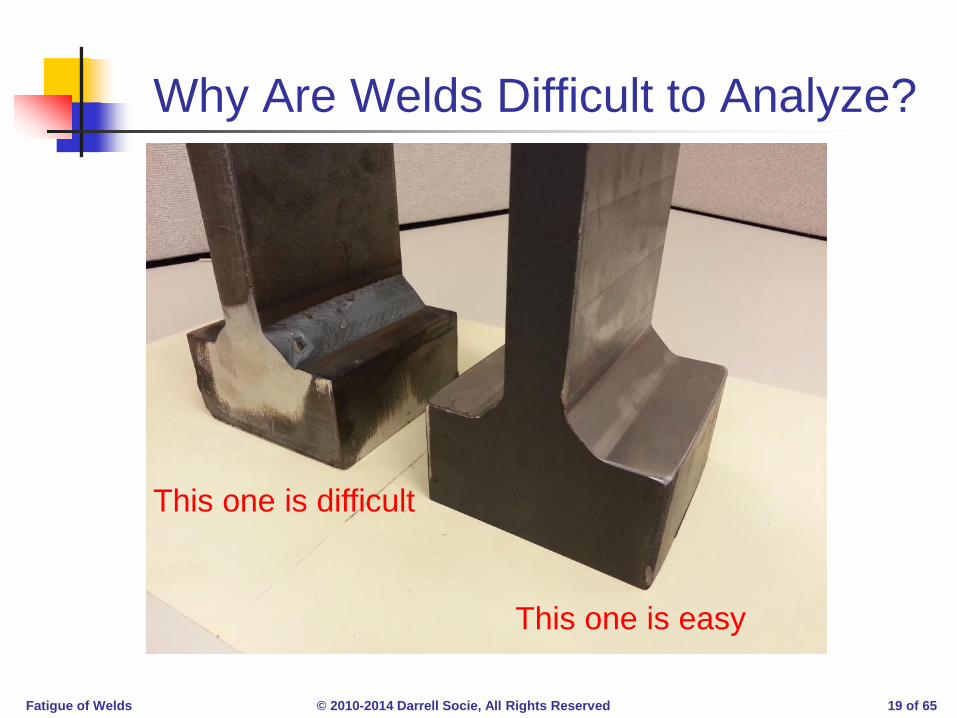
Why Are Welds Difficult to Analyze?
This one is easy
This one is difficult
Fatigue of Welds © 2010-2014 Darrell Socie, All Rights Reserved 20 of 65
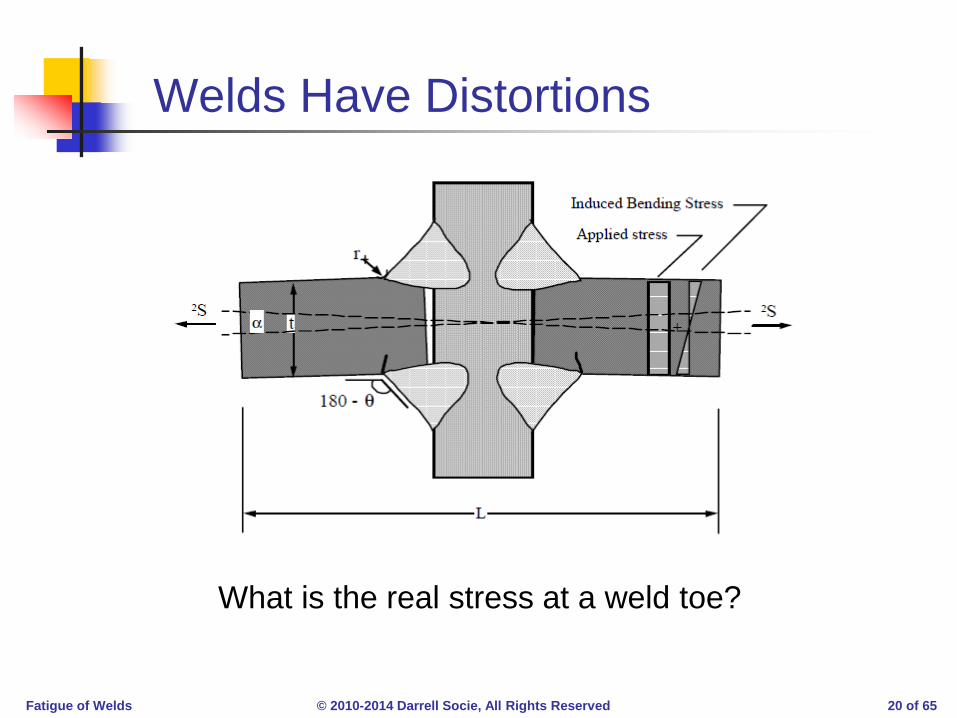
Welds Have Distortions
What is the real stress at a weld toe?

Fatigue of Welds © 2010-2014 Darrell Socie, All Rights Reserved 21 of 65
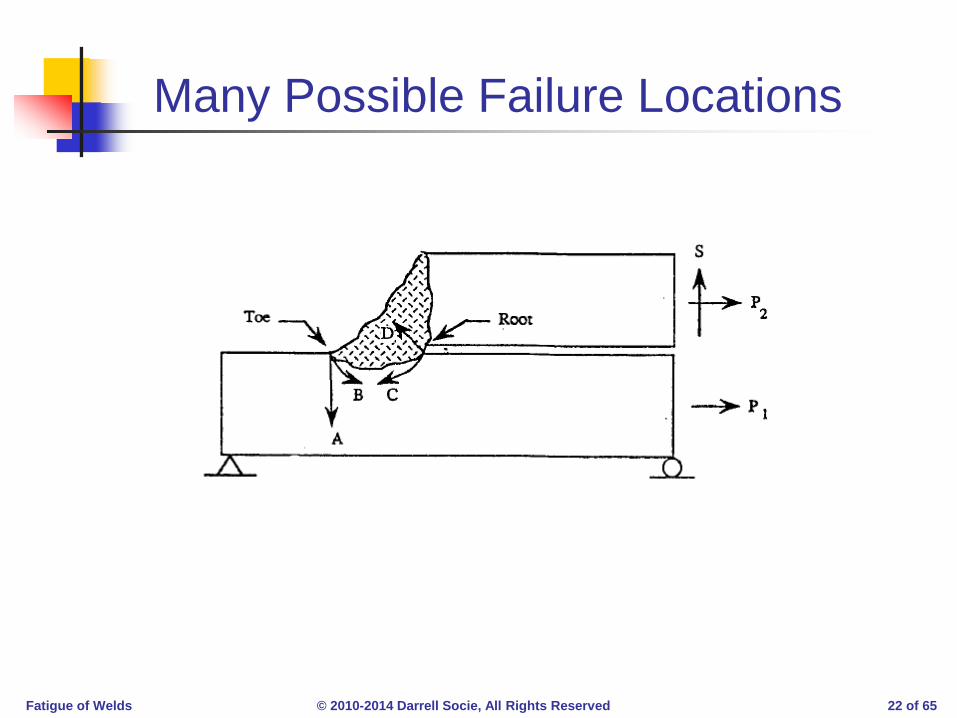
Loading Conditions
How is the weld loaded ?
Fatigue of Welds © 2010-2014 Darrell Socie, All Rights Reserved 22 of 65
Many Possible Failure Locations

Fatigue of Welds © 2010-2014 Darrell Socie, All Rights Reserved 23 of 65
So Many Possibilities !

Fatigue of Welds © 2010-2014 Darrell Socie, All Rights Reserved 24 of 65
What is KT?
Tight fit-up KT = 3
Loose fit-up KT = 7
?
Fatigue of Welds © 2010-2014 Darrell Socie, All Rights Reserved 25 of 65
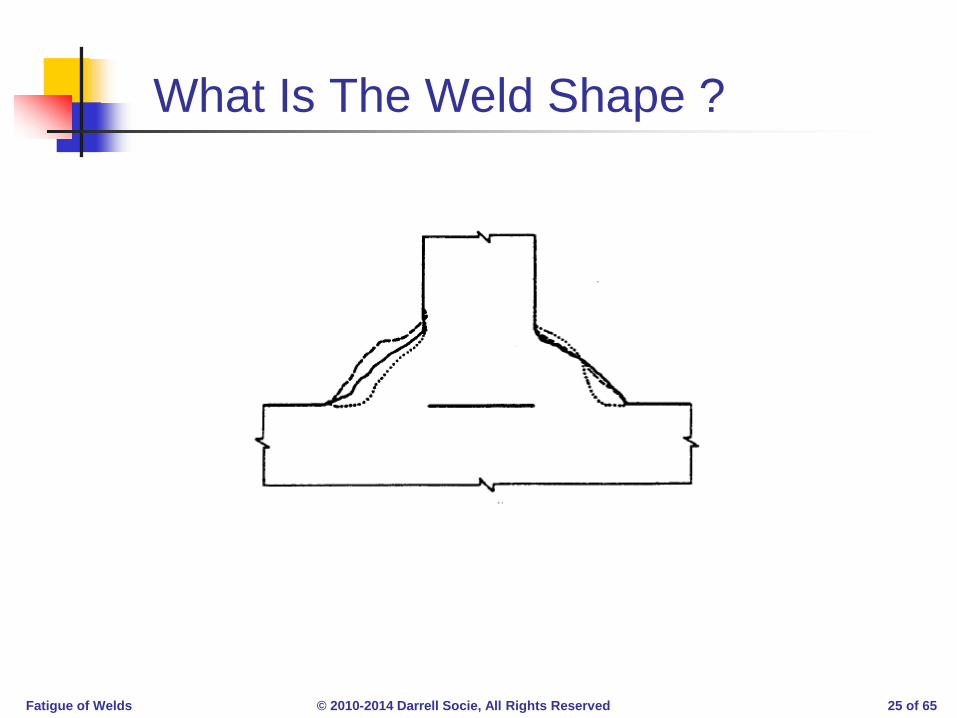
What Is The Weld Shape ?

Fatigue of Welds © 2010-2014 Darrell Socie, All Rights Reserved 26 of 65
Weld Quality ?
Fatigue of Welds © 2010-2014 Darrell Socie, All Rights Reserved 27 of 65
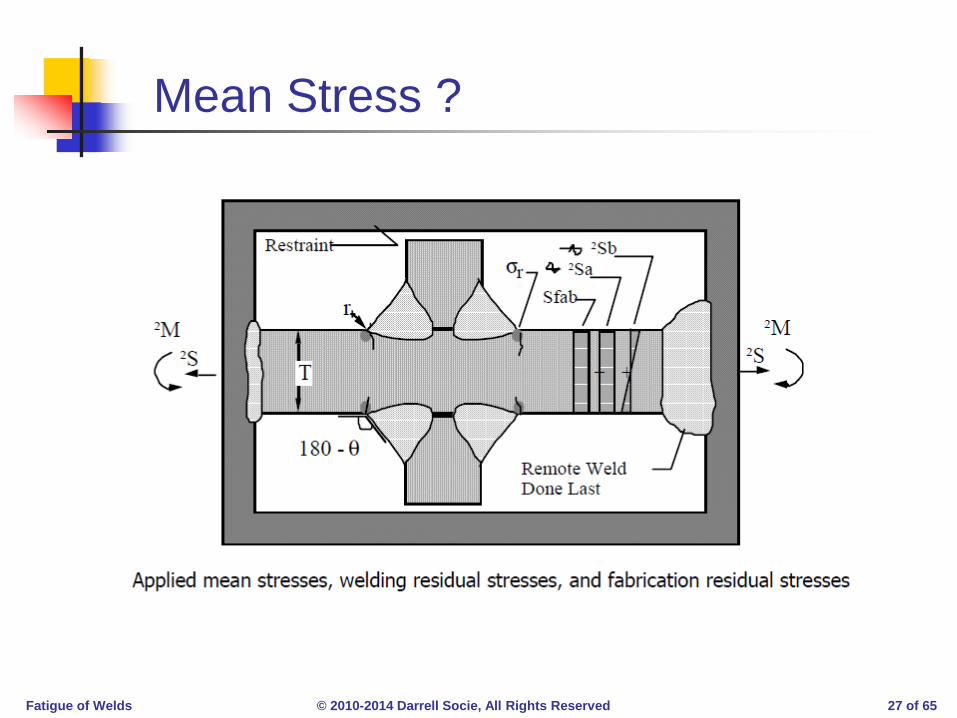
Mean Stress ?
Fatigue of Welds © 2010-2014 Darrell Socie, All Rights Reserved 28 of 65
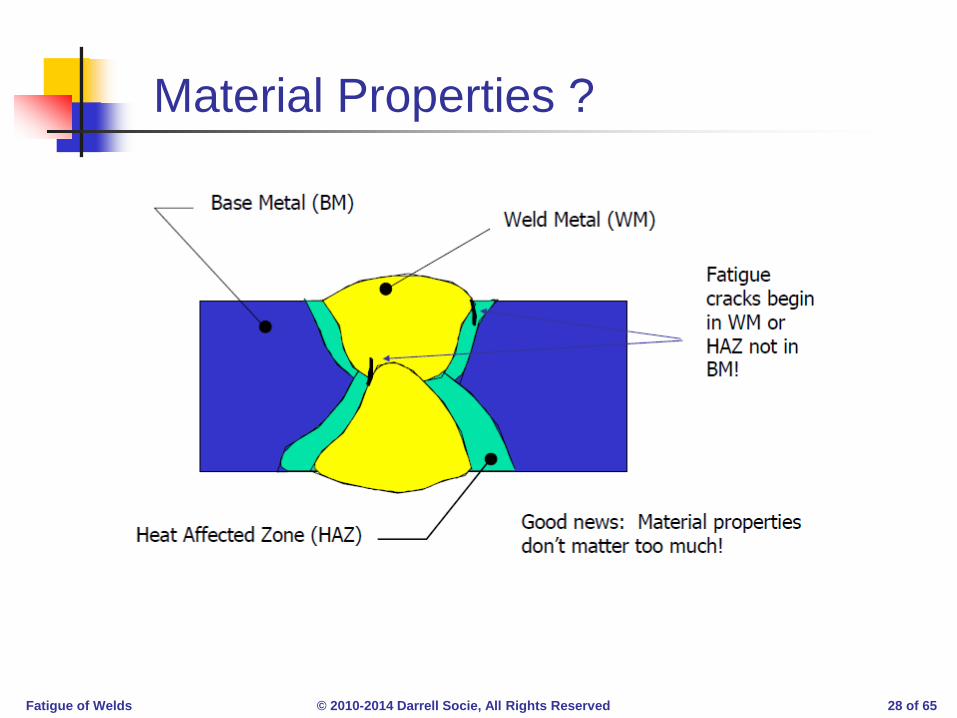
Material Properties ?
Fatigue of Welds © 2010-2014 Darrell Socie, All Rights Reserved 29 of 65
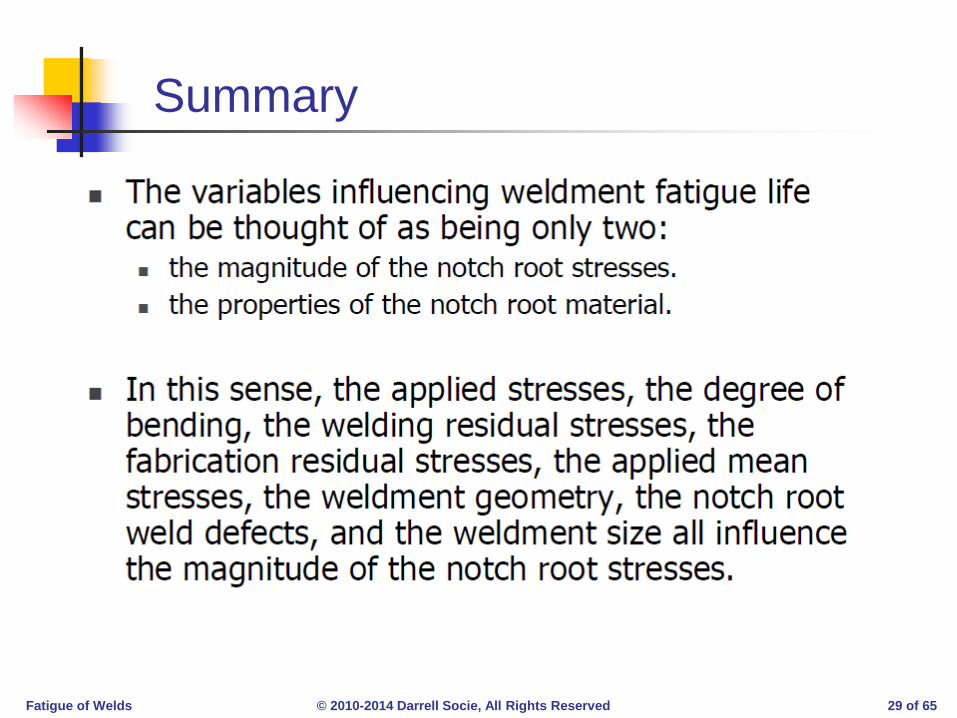
Summary

Fatigue of Welds © 2010-2014 Darrell Socie, All Rights Reserved 30 of 65
Summary (continued)
Fatigue of Welds © 2010-2014 Darrell Socie, All Rights Reserved 31 of 65
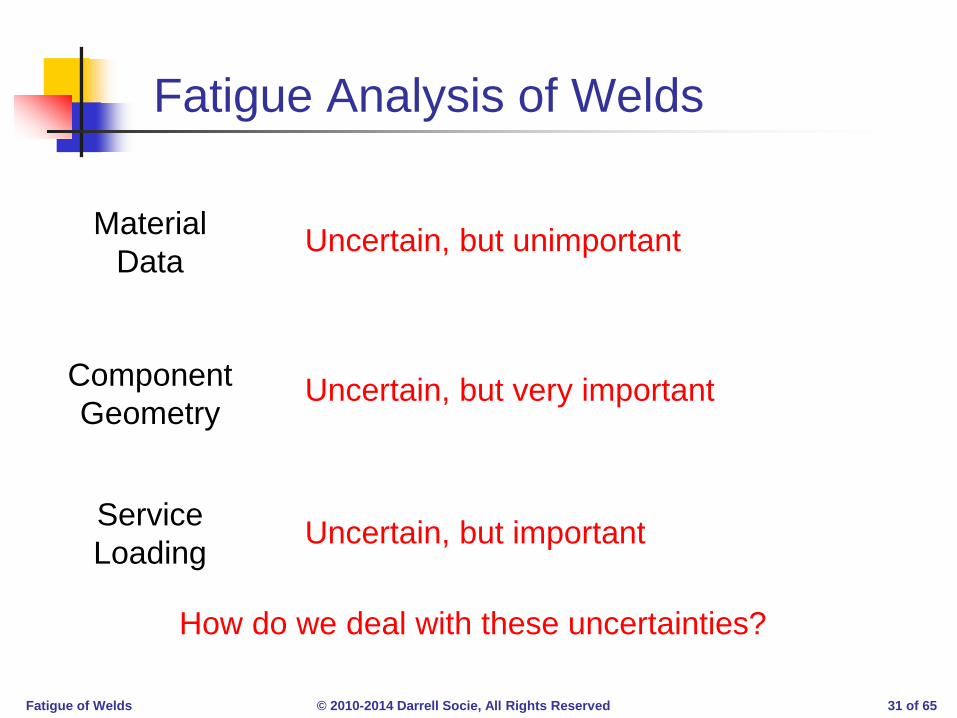
Fatigue Analysis of Welds
Material Data
Component Geometry
Service Loading
Uncertain, but unimportant
Uncertain, but very important
Uncertain, but important
How do we deal with these uncertainties?
Fatigue of Welds © 2010-2014 Darrell Socie, All Rights Reserved 32 of 65
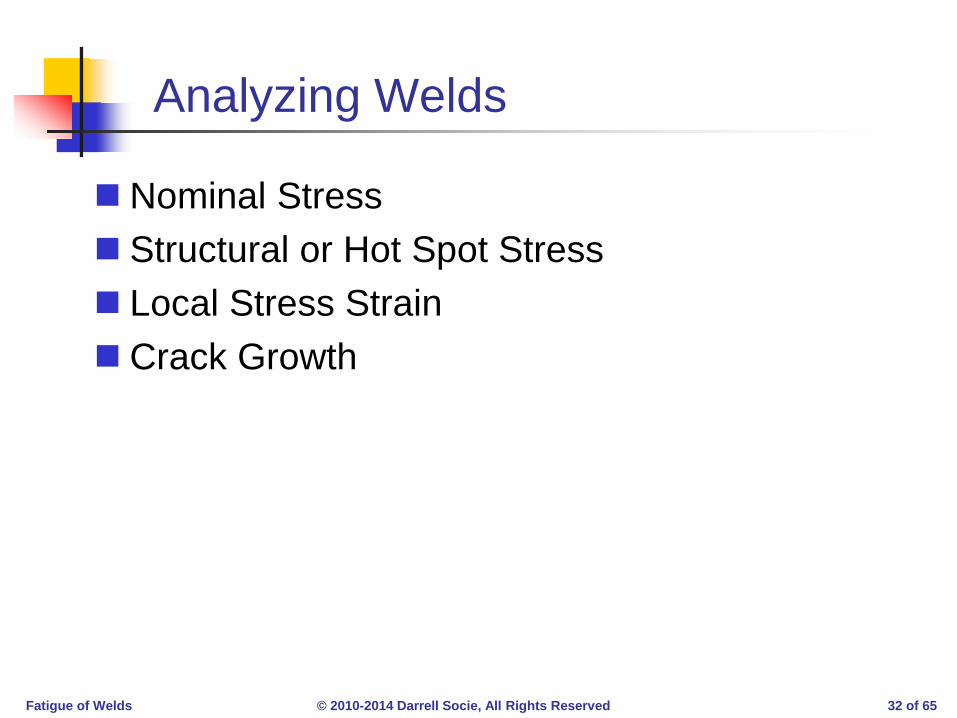
Analyzing Welds
Nominal Stress Structural or Hot Spot Stress Local Stress Strain Crack Growth
Fatigue of Welds © 2010-2014 Darrell Socie, All Rights Reserved 33 of 65
Nominal Stress Weld Classifications
D E
F2 G

Fatigue of Welds © 2010-2014 Darrell Socie, All Rights Reserved 34 of 65
BS 7608 - Steel
100
200
300
400
B
C
D
E
F F2 G W 0
105 106 107 108
Fatigue Life, Cycles

Fatigue of Welds © 2010-2014 Darrell Socie, All Rights Reserved 35 of 65
IIW Classification
( ) ( )
( )
m
m 6
1 1m m
16 m
N CC (FAT) 2 10m 3
C N
2 10FATN
−
∆σ =
= ×=
∆σ =
×∆σ =

Fatigue of Welds © 2010-2014 Darrell Socie, All Rights Reserved 36 of 65
Japan Society of Steel Construction
Fatigue of Welds © 2010-2014 Darrell Socie, All Rights Reserved 37 of 65
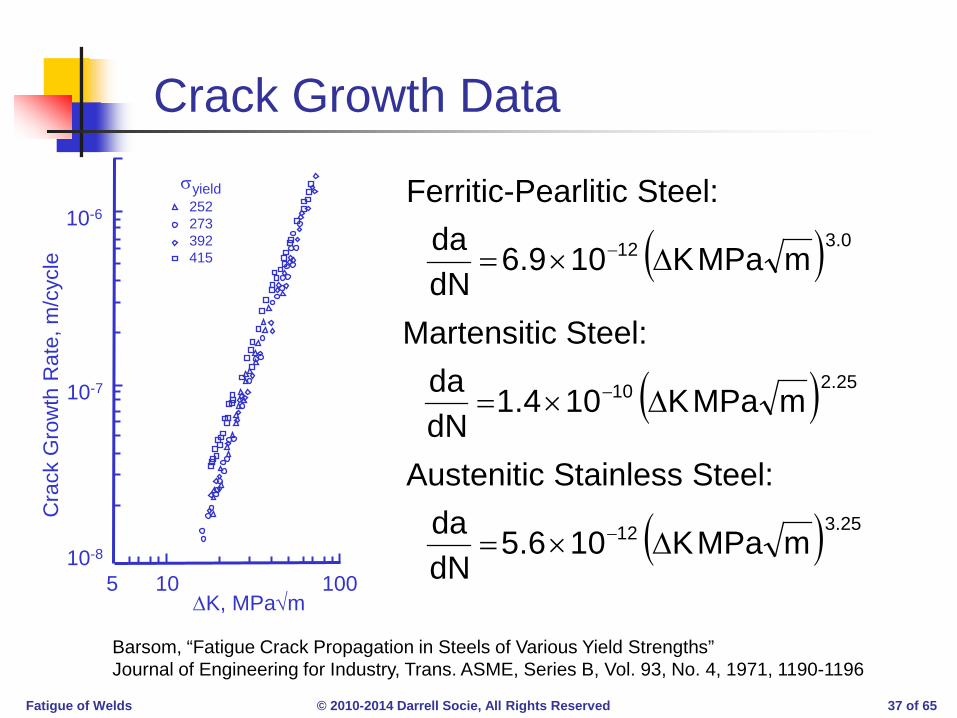
Crack Growth Data
( ) 0.312 mMPaK109.6dNda
∆×= −
( ) 25.210 mMPaK104.1dNda
∆×= −
( ) 25.312 mMPaK106.5dNda
∆×= −
Ferritic-Pearlitic Steel:
Martensitic Steel:
Austenitic Stainless Steel:
Barsom, “Fatigue Crack Propagation in Steels of Various Yield Strengths” Journal of Engineering for Industry, Trans. ASME, Series B, Vol. 93, No. 4, 1971, 1190-1196
5 10 100
10-7
10-6
10-8
Cra
ck G
row
th R
ate,
m/c
ycle
∆K, MPa√m
σyield 252 273 392 415

Fatigue of Welds © 2010-2014 Darrell Socie, All Rights Reserved 38 of 65
0
25
50
75
100
125
105
B
C
D E
F
106 107 108
Nominal Stress - Aluminum
Fatigue Life, Cycles Sharp, “Behavior and Design of Aluminum Structures”,McGraw-Hill, 1992
Fatigue of Welds © 2010-2014 Darrell Socie, All Rights Reserved 39 of 65
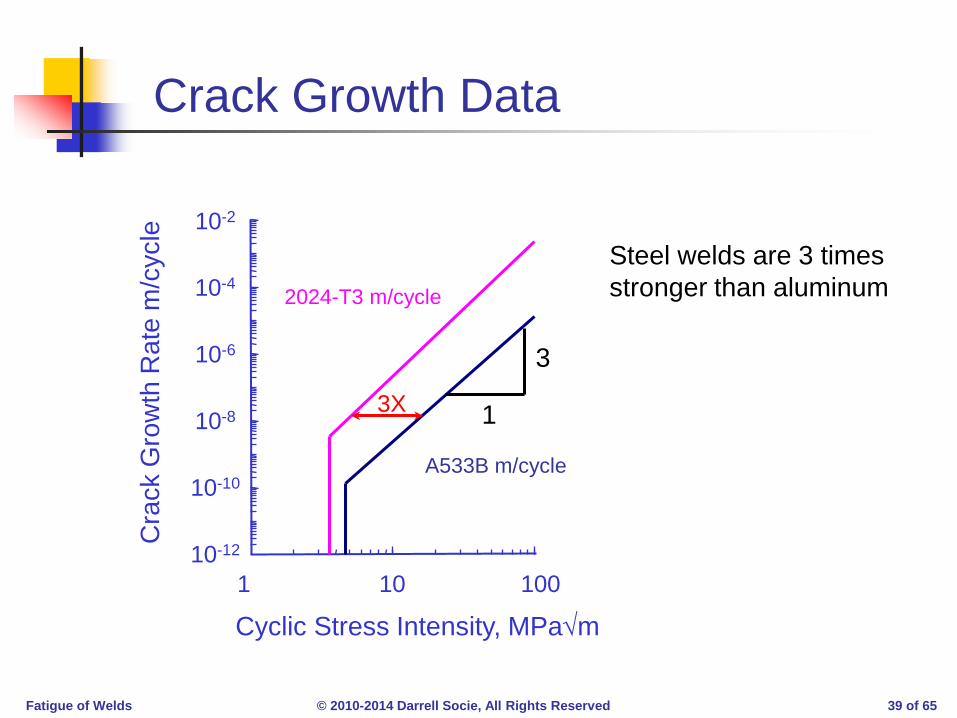
Crack Growth Data
1 10 100
Cyclic Stress Intensity, MPa√m
Cra
ck G
row
th R
ate
m/c
ycle
A533B m/cycle
2024-T3 m/cycle
10-2
10-4
10-6
10-8
10-10
10-12
3X
Steel welds are 3 times stronger than aluminum
1
3

Fatigue of Welds © 2010-2014 Darrell Socie, All Rights Reserved 40 of 65
Residual Stress from Welding

Fatigue of Welds © 2010-2014 Darrell Socie, All Rights Reserved 41 of 65
Weld Distortion
Fatigue of Welds © 2010-2014 Darrell Socie, All Rights Reserved 42 of 65
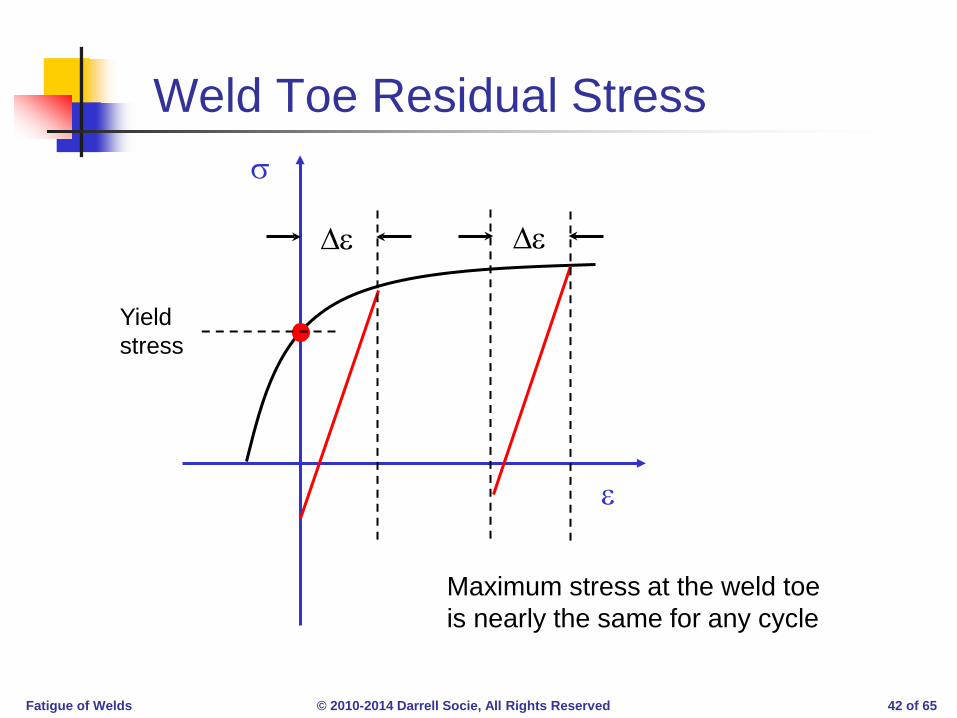
Weld Toe Residual Stress
Yield stress
Maximum stress at the weld toe is nearly the same for any cycle
∆ε
ε
σ
∆ε

Fatigue of Welds © 2010-2014 Darrell Socie, All Rights Reserved 43 of 65
Mean Stress Effects
As welded structures usually have the maximum possible mean stress
Stress relief, peening, etc. will have a substantial effect on the fatigue life

Fatigue of Welds © 2010-2014 Darrell Socie, All Rights Reserved 44 of 65
Butt and Fillet Weld Test Data
99% survival with 95% confidence
1000
Stre
ss R
ange
, MPa
100
10
103 104 105 106 107
Fatigue Life, Cycles
Failures Run outs
The good welds

Fatigue of Welds © 2010-2014 Darrell Socie, All Rights Reserved 45 of 65
Weld Terminations 1000
Stre
ss R
ange
, MPa
100
10
103 104 105 106 107
Fatigue Life, Cycles
Failures Run outs
99% survival with 95% confidence
The bad welds

Fatigue of Welds © 2010-2014 Darrell Socie, All Rights Reserved 46 of 65
Sources of Inherent Scatter
Weld quality Mean, fabrication and residual stresses Stress concentrations (geometry) Weldment size Material properties
Opportunities for Improvement !
Fatigue of Welds © 2010-2014 Darrell Socie, All Rights Reserved 47 of 65
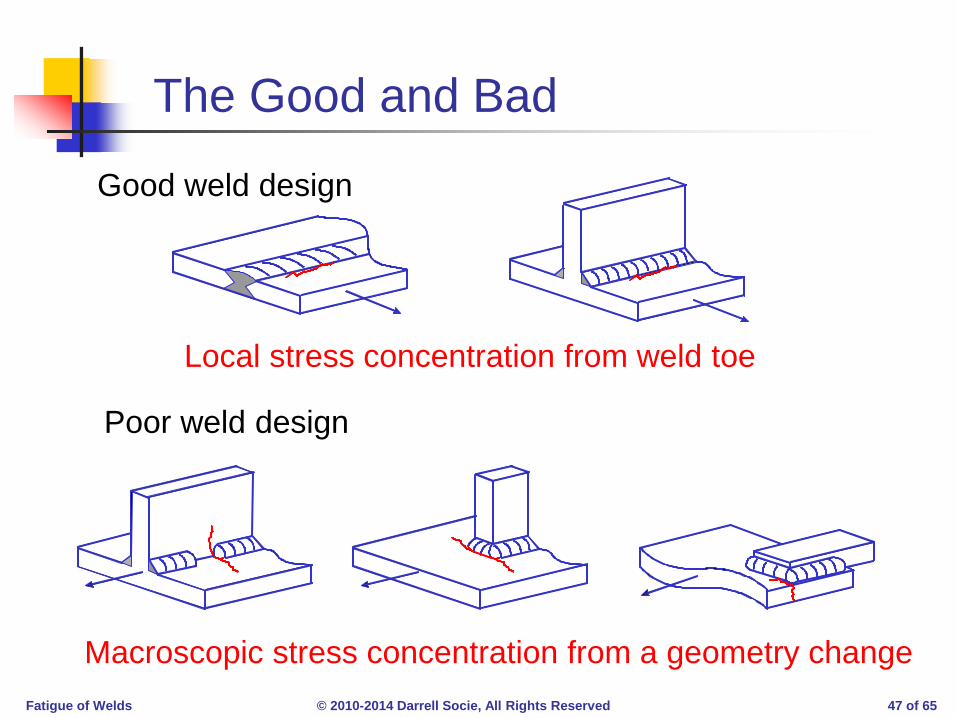
The Good and Bad
Good weld design
Poor weld design
Local stress concentration from weld toe
Macroscopic stress concentration from a geometry change

Fatigue of Welds © 2010-2014 Darrell Socie, All Rights Reserved 48 of 65
Nominal Stress ?
Solution: use structural stress approach

Fatigue of Welds © 2010-2014 Darrell Socie, All Rights Reserved 49 of 65
Typical Butt Weld
Fatigue of Welds © 2010-2014 Darrell Socie, All Rights Reserved 50 of 65
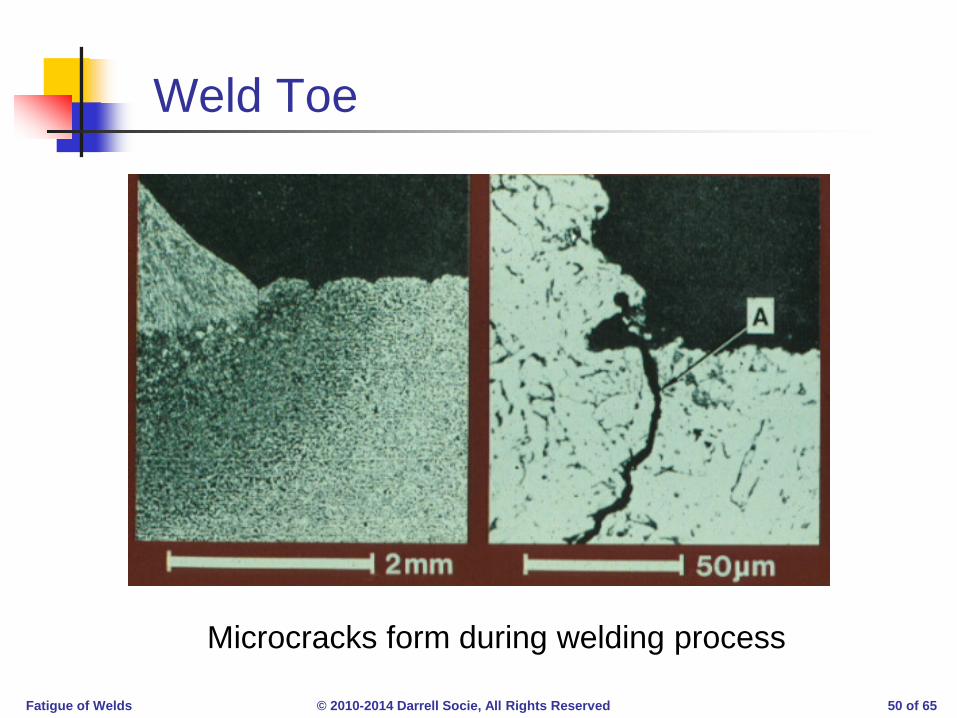
Weld Toe
Microcracks form during welding process

Fatigue of Welds © 2010-2014 Darrell Socie, All Rights Reserved 51 of 65
Cold Lap
Fatigue of Welds © 2010-2014 Darrell Socie, All Rights Reserved 52 of 65
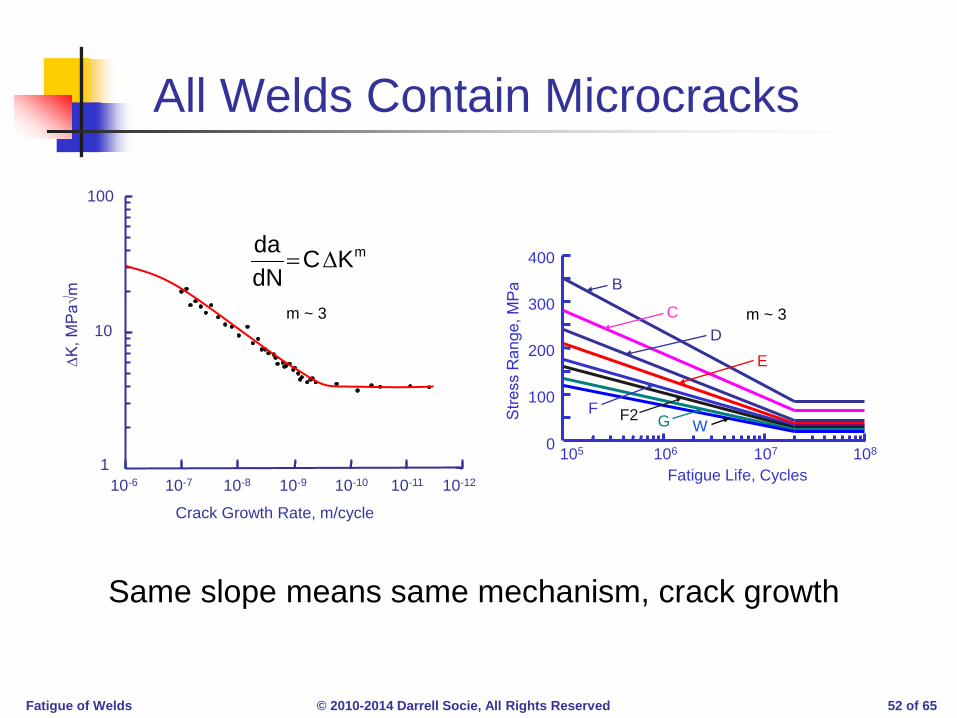
All Welds Contain Microcracks
100
200
300
400 B
C D
E
F F2 G W 0 105 106 107 108
Fatigue Life, Cycles
Same slope means same mechanism, crack growth
10-12 10-11 10-10 10-9 10-8 10-7 10-6 1
10
100
Crack Growth Rate, m/cycle
mKCdNda
∆=
m ~ 3
∆K, M
Pa√
m
m ~ 3
Fatigue of Welds © 2010-2014 Darrell Socie, All Rights Reserved 53 of 65
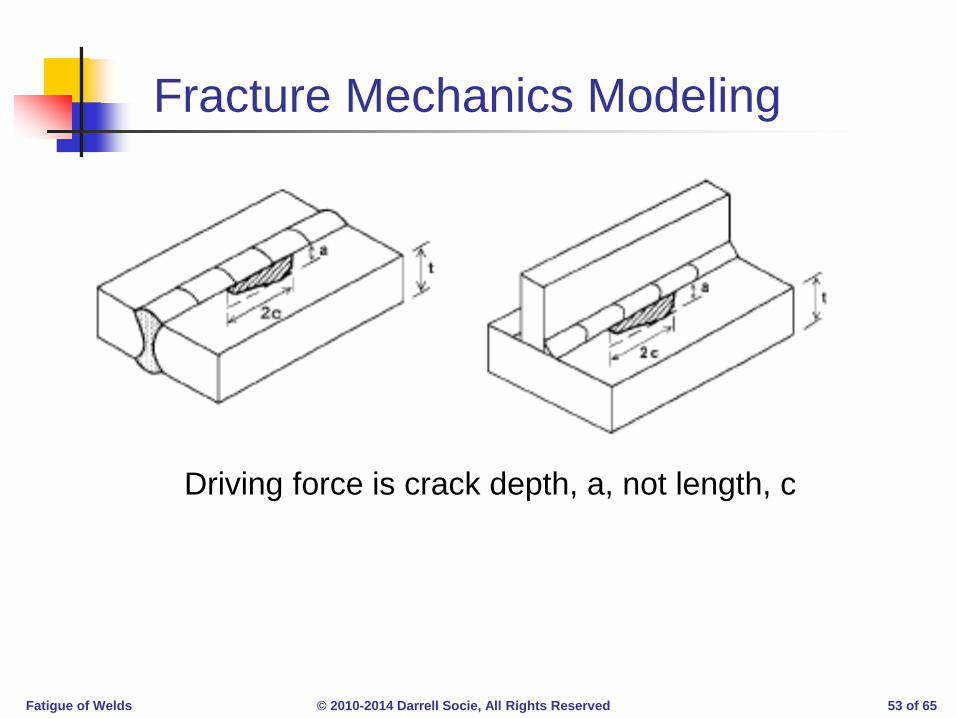
Fracture Mechanics Modeling
Driving force is crack depth, a, not length, c

Fatigue of Welds © 2010-2014 Darrell Socie, All Rights Reserved 54 of 65
Stress Intensity Solution
( )
f
o
a
ma
max min
max applied residual
daNC K
K K KK K K
=∆
∆ = −= +
∫
Fatigue of Welds © 2010-2014 Darrell Socie, All Rights Reserved 55 of 65
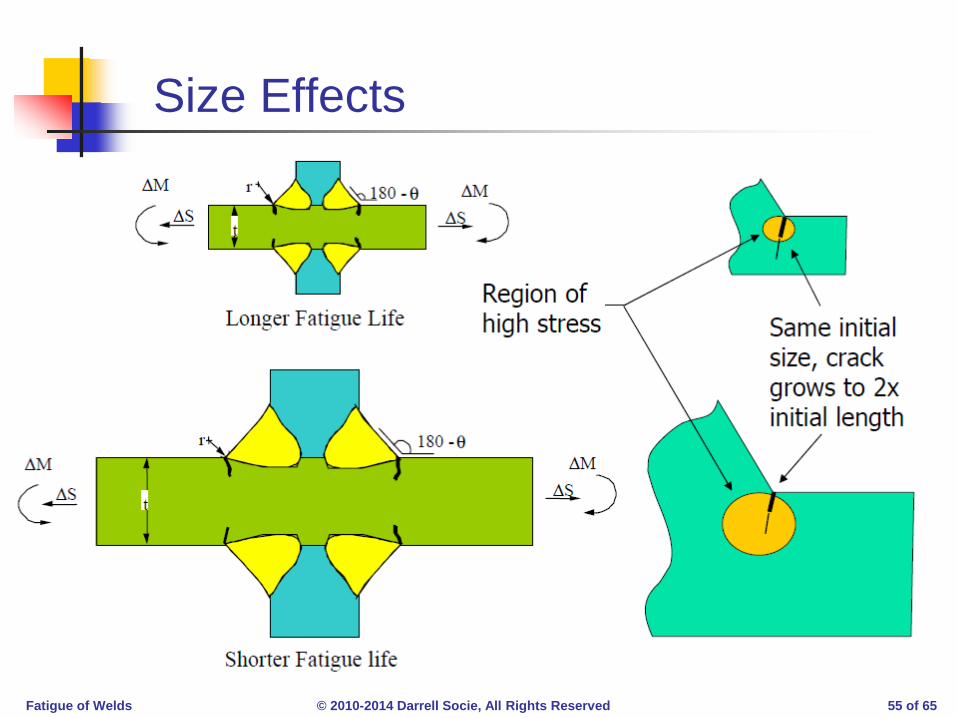
Size Effects
Fatigue of Welds © 2010-2014 Darrell Socie, All Rights Reserved 56 of 65
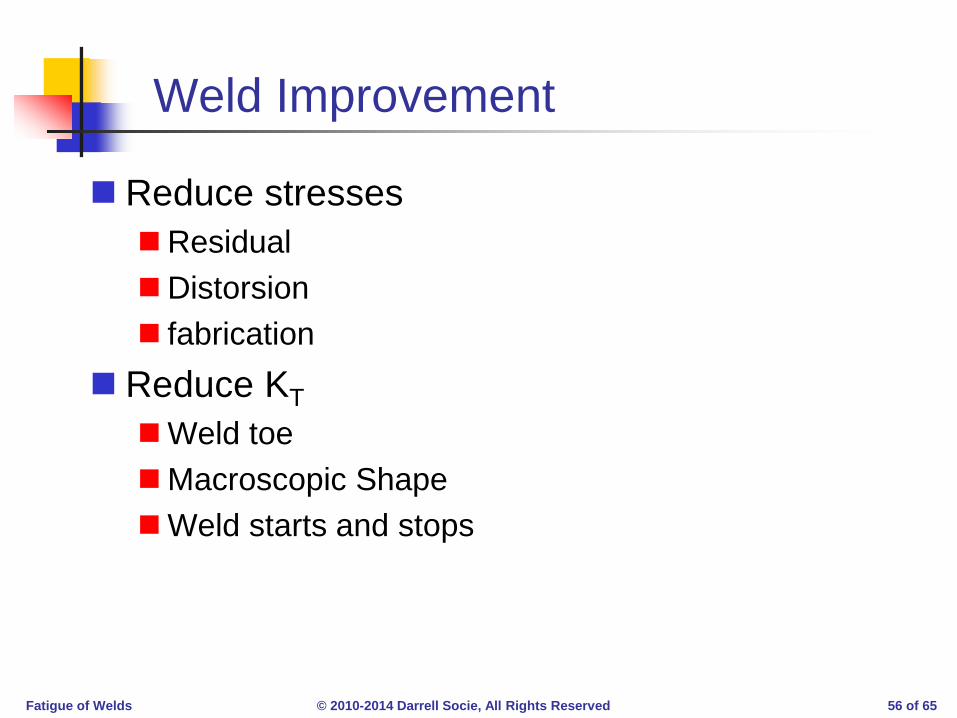
Weld Improvement
Reduce stresses Residual Distorsion fabrication
Reduce KT Weld toe Macroscopic Shape Weld starts and stops
Fatigue of Welds © 2010-2014 Darrell Socie, All Rights Reserved 57 of 65
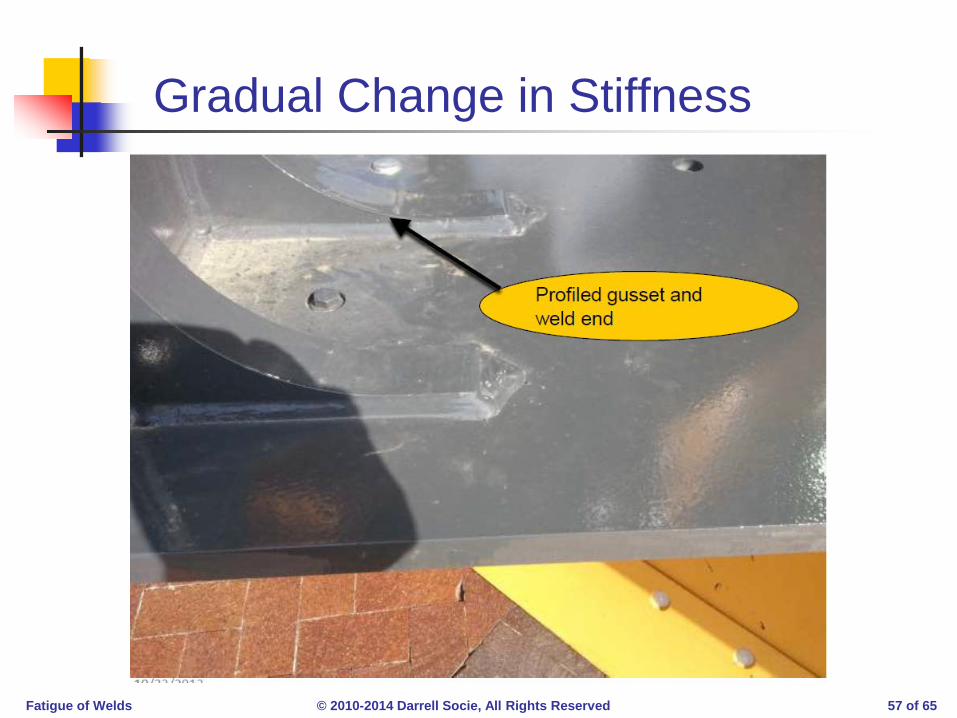
Gradual Change in Stiffness
Fatigue of Welds © 2010-2014 Darrell Socie, All Rights Reserved 58 of 65
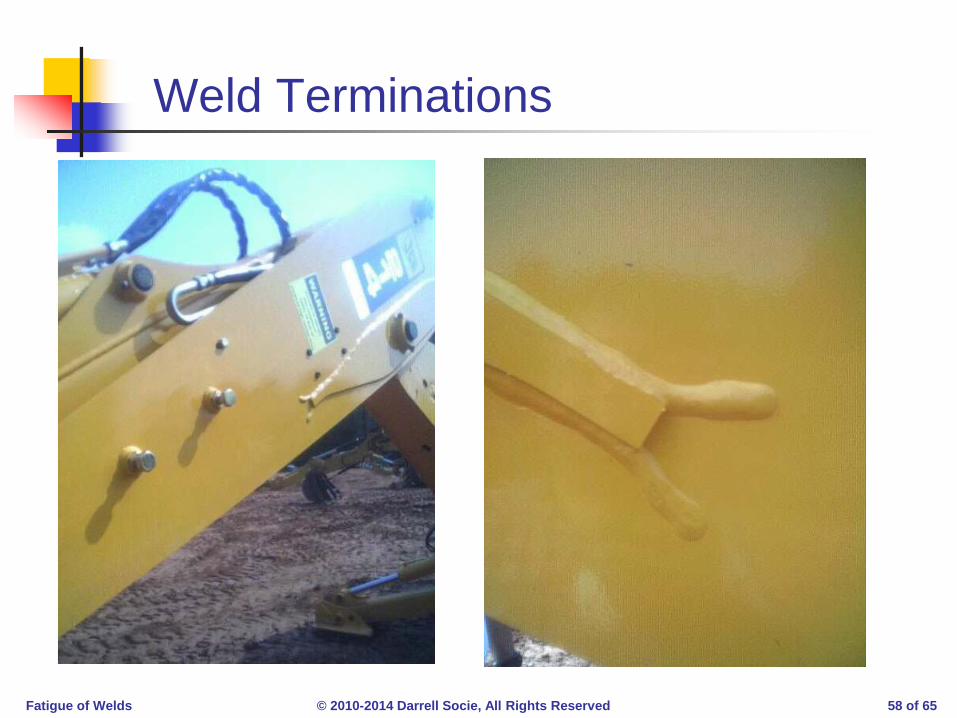
Weld Terminations
Fatigue of Welds © 2010-2014 Darrell Socie, All Rights Reserved 59 of 65
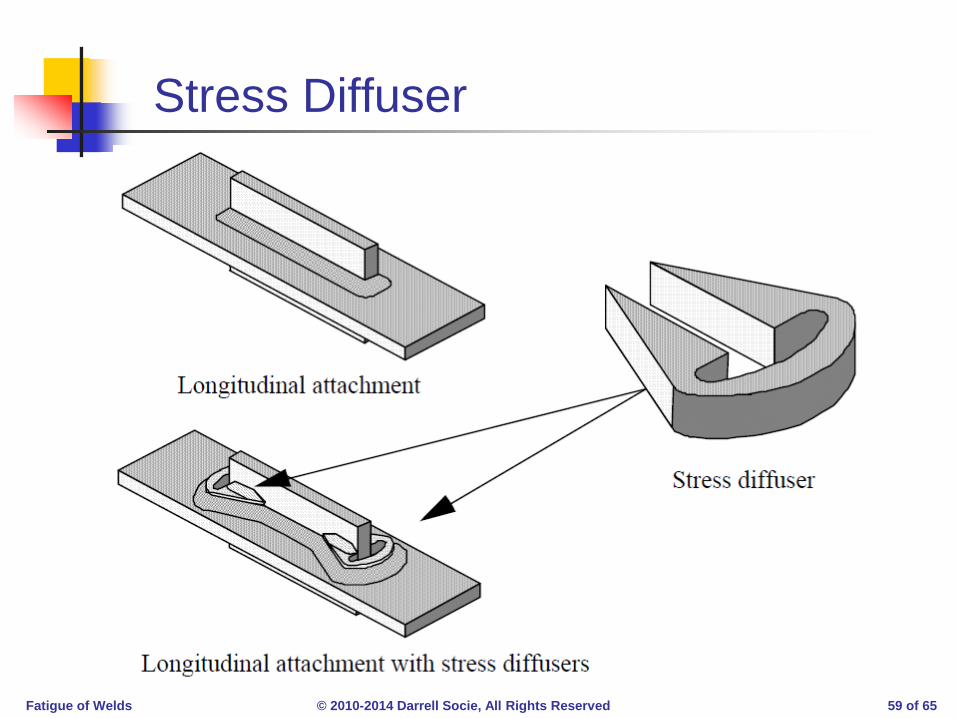
Stress Diffuser

Fatigue of Welds © 2010-2014 Darrell Socie, All Rights Reserved 60 of 65
Stress Diffuser Improvement
Fatigue of Welds © 2010-2014 Darrell Socie, All Rights Reserved 61 of 65
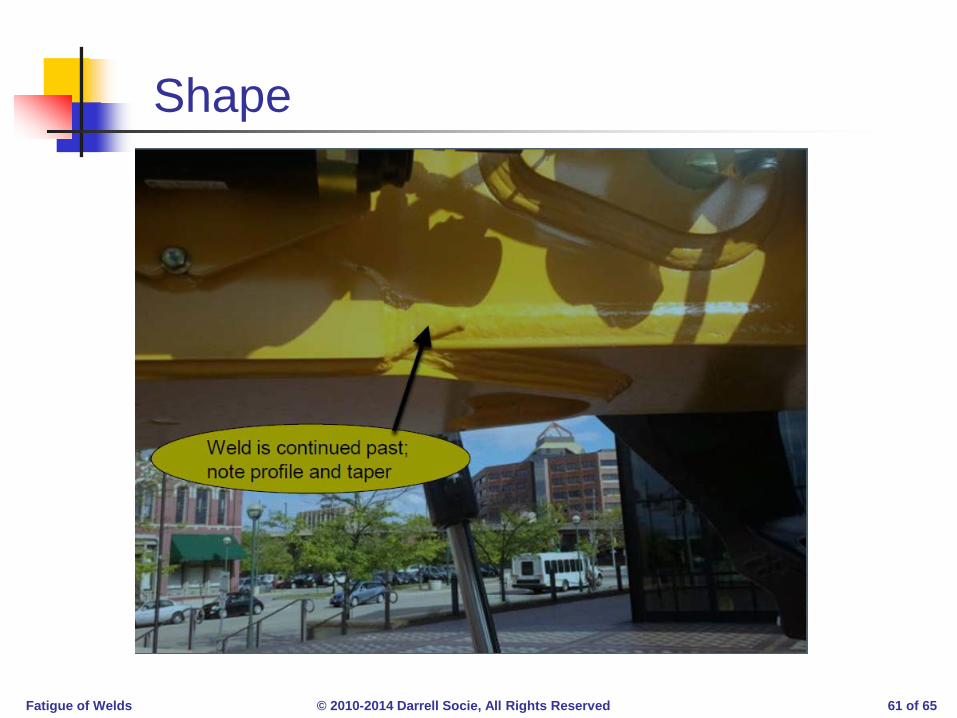
Shape

Fatigue of Welds © 2010-2014 Darrell Socie, All Rights Reserved 62 of 65
Improvement Strategies

Fatigue of Welds © 2010-2014 Darrell Socie, All Rights Reserved 63 of 65
TWI Suggestions
Fatigue of Welds © 2010-2014 Darrell Socie, All Rights Reserved 64 of 65
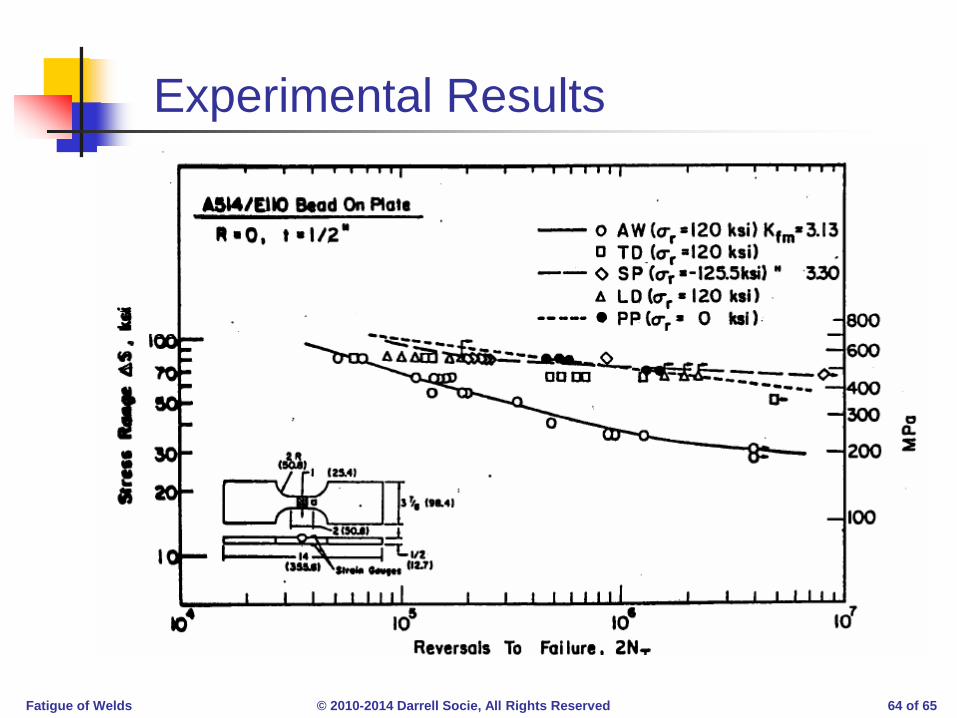
Experimental Results
Fatigue of Welds © 2010-2014 Darrell Socie, All Rights Reserved 65 of 65
Things Worth Remembering
Local weld toe stresses, geometry and flaws control the life of weldments
There are many ways to improve the fatigue strength of welded structures.
Fatigue of Welds