
Crane runways – Fatigue evaluation of crane rail welds using local concepts

FHWA-NJ-2004-014
Fatigue Management, Rail Operations Personnel
FINAL REPORT December 2005
Submitted by
One-Jang Jeng, Ph.D.
Research Associate Professor New Jersey Institute of Technology
Department of Industrial and Manufacturing Engineering Contact: [email protected]
& George Fallat, P.E.
Deputy Director New Jersey Institute of Technology
National Center for Transportation and Industrial Productivity
NJDOT Research Project Manager
Karl Brodtman
In cooperation with
New Jersey Department of Transportation
Bureau of Research and
U.S. Department of Transportation Federal Highway Administration

DISCLAIMER STATEMENT
“The contents of this report reflect the views of the author(s) who is (are) responsible for the facts and the accuracy of the
data presented herein. The contents do not necessarily reflect the official views or policies of the New Jersey Department of Transportation or the Federal Transit
Administration. This report does not constitute a standard, specification, or regulation. “

TECHNICAL REPORT STANDARD TITLE PAGE
1. Report No.
FHWA-NJ-2004-14
2. Government Accession No. 3. Recipient’s Catalog No.
5. Report Date
December 2005
4. Title and Subtitle
Fatigue Management, Rail Operations Personnel
6. Performing Organization Code
7. Author(s)
Dr. One-Jang Jeng, George Fallat; Contact: [email protected]
8. Performing Organization Report No.
10. Work Unit No. 9. Performing Organization Name and Address
National Center for Transportation and Industrial Productivity New Jersey Institute of Technology University Heights Newark, NJ 07102-1982
11. Contract or Grant No.
NJDOT 2004 – 014
13. Type of Report and Period Covered
Final Report Jan 2004 – Dec 2005
12. Sponsoring Agency Name and Address
N.J. Department of Transportation 1035 Parkway Avenue P.O. Box 600 Trenton, NJ 08625-0600
Federal Transit Administration U.S. Department of Transportation Washington, D.C.
14. Sponsoring Agency Code
15. Supplementary Notes
16. Abstract
NJ TRANSIT maintains an Hours of Service (HOS) database for its rail operations personnel and crew assignments. For this study NJIT has partnered with Circadian Technologies Incorporated (CTI), which has developed a computer model that is capable of being interfaced with the HOS database to estimate fatigue and assign a “fatigue score”, which varies from zero (low fatigue) to one hundred (high fatigue). Using the CTI fatigue estimator, “what if” scenarios, i.e. examining schedule parameter changes, can also performed. For example, if the schedule was modified to adjust start and end times, the fatigue estimator is capable of evaluating these changes in terms of fatigue levels. The goal of this study is the development of recommendations that are practical in terms of reducing fatigue, capable of meeting applicable rules and regulations; addressing management and staff personnel concerns, and meeting current and future demands of NJ TRANSIT’s rail passenger customers. Details of our research approach, findings, conclusions and recommendations are detailed in the respective sections of this report. Highlights of the literature review, HOS assessment, survey findings and recommendations are provided in the report.
17. Key Words
Human factors; Human factors in accidents; Fatigue; Rail operations; Rail operator schedules; Rail operations safety
18. Distribution Statement
No Restrictions. This document is available to the public through the National Technical Information Service, Springfield, VA 22161.
19. Security Classification (of this report)
Unclassified
20. Security Classification (of this page)
Unclassified
21. No of Pages
167
22. Price
Form DOT F 1700.7

ii
Acknowledgements
We wish to express our sincere thanks to the New Jersey Department of Transportation and New Jersey Transit Corporation for their dedication to this project. We especially would like to thank Alex Baker of NJ TRANSIT, Jerome Lutin of NJTRANSIT and Karl Brodtman, the NJDOT Project Manager. We would also like to thank the following the United Transportation Union and the Brotherhood of Locomotive Engineers for their assistance and support throughout the study. Finally, we would like to thank Anand Tharanathan, a Masters Degree candidate, as well as several students who assisted us on this project.

iii
TABLE OF CONTENTS Page
SUMMARY ……………………………………………………………………… 1
INTRODUCTION ……………………………………………………………….. 6
RESEARCH APPROACH …………………………………………………….. 9
RESULTS ………………………………………………………………………. 15
CONCLUSIONS ………………………………………………………………... 29
RECOMMENDATIONS ……………………………………………………... 31
APPENDIX A Literature Review ……………………………………………. 33
APPENDIX B October 27 Fatigue Assessment Report …………………. 43
APPENDIX C Operator Survey and Summary of Results ……………..… 93
GLOSSARY ………………………………………………………..…………. 158
REFERENCES ………………………………………………………..………. 159

iv
LIST OF FIGURES Page
Figure 1. NJ TRANSIT Rail Map…………………………………………. 7
Figure 2. Engineers with Regular Assignments………………………… 15
Figure 3. Conductors with Regular Assignments………………………. 15
Figure 4. Extra Board Assignments for Engineers……………………… 16
Figure 5. Extra Board Assignments for Conductors……………………. 17
Figure 6. Shift Start Times by Assignment and Job Category………… 18
Figure 7. Getting Sufficient Quantity of Sleep…………………………... 21
Figure 8. Getting Sufficient Quality of Sleep…………………………….. 21
Figure 9. Difficulty Fighting Fatigue on the Job…………………………. 22
Figure 10. Reported Number of Hours of Sleep for Day Shift Workers………………………………………….
22
Figure 11. Reported Number of Hours of Sleep for Night Shift Workers………………………………………...
23

1
SUMMARY New Jersey Transit Corporation (NJ TRANSIT) operates over 1900 buses and 600 trains and serves over 300,000 customers annually. By the end of 2004, the agency reach a record of rail ridership approaching 64 million passenger trips, bus ridership exceeding 150 million passenger trips, and light rail ridership reaching 11.3 million passenger trips. (1) As an agency that depends upon the capabilities of both its equipment and operators, the ability to effectively manage operator fatigue is essential. NJ TRANSIT currently employs a staff of over 1,500 rail operations personnel which consists of locomotive engineers, who operate the trains; conductors, who are responsible for collecting tickets and fares and ensuring passenger safety and yard masters who are responsible for ensuring that the safety and operation of rail equipment is maintained. Efforts to minimize fatigue associated with work schedules are not only essential to NJ TRANSIT’s business viability, but is a key concern among the workers and their union representatives. NJ TRANSIT maintains an Hours of Service (HOS) database for its rail operations personnel and crew assignments. For this study NJIT has partnered with Circadian Technologies Incorporated (CTI), which has developed a computer model that is capable of being interfaced with the HOS database to estimate fatigue and assign a “fatigue score”, which varies from zero (low fatigue) to one hundred (high fatigue). Using the CTI fatigue estimator, “what if” scenarios, i.e. examining schedule parameter changes, can also performed. For example, if the schedule was modified to adjust start and end times, the fatigue estimator is capable of evaluating these changes in terms of fatigue levels. An important goal of the study is the development of recommendations that are practical in terms of reducing fatigue, capable of meeting applicable rules and regulations; addressing management and staff personnel concerns, and meeting current and future demands of NJ TRANSIT’s rail passenger customers. Details of our research approach, findings, conclusions and recommendations are detailed in the respective sections of this report. Highlights of the literature review, HOS assessment, survey findings and recommendations are provided below. Literature Review The NJIT research team conducted an in-depth literature review, which looks into potential factors that contribute to fatigue related transportation accidents. While a majority of transportation fatigue research focuses on highway operations, these findings also have relevance to rail operations. Some of the major findings are highlighted below:

2
• Poor driving performance is often associated with early morning to dawn driving, even when drivers are well rested; (2)
• Sleep deficits increase the risk of fatigue related accidents and sleep
disorders significantly increase risk of accidents (ibid.); • Operators have difficulty estimating alertness and sleep quality compared to
objective measurements (ibid.); • Crash risk is dependent upon the time of day during which vehicles are
operated. However, research outcomes vary somewhat for fatigue levels related to the number of hours spent on task; (3)
• The length of sleep period prior to performing driving tasks is the most
significant factor affecting fatigue. Length of work, period and the nature of tasks performed during the work period are contributing factors to fatigue, but are less significant. (ibid.) ;
• Fatigue effects are greatly exacerbated during low-demand driving episode. (4) • A person’s tendency to fall asleep during normal waking hours increases if
they have slept less than 6 hours and also increases across successive days of restricted sleep. (5)
• Night driving and circadian influences together are greatest predictors of
fatigue related accidents. (ibid.) • Sleep shortfalls for night start workers much more likely than for day start shift
(ibid.) • Drivers are poor judges of their own fatigue generally rating themselves more
alert. (5) • Eight hours off between duty periods is not adequate-7.2 hours on average is
their ideal sleep time. (ibid.) • The strongest and most consistent factor influencing fatigue and driver
alertness is the time of day. Drowsiness is greater at night. Peak drowsiness occurred during the 8 hours from late evening to dawn. (ibid.)
• Hours of driving (time on task) was not a strong or consistent predictor of
observed fatigue. (ibid.) • The most critical factors in predicting fatigue related accidents are the
duration of the most recent sleep period, the amount of sleep in the past 24 hours and split sleep patterns. (ibid.)

3
The full findings of the literature review are contained in Appendix A, Literature Review. Existing Hours of Service Assessment NJ TRANSIT maintains a comprehensive database for scheduling its 1,500 plus rail operations staff. The database was developed and is routinely updated by Timerica Inc. Circadian Technologies, Incorporated (CTI) has developed a computer-based model that is capable of integrating the rail operations personnel and fatigue parameters to develop “fatigue indices”. CTI developed the model based on its own research of rail operations personnel as well as a comprehensive body of medical research on circadian rhythm patterns. Schedule features, such as start and end times, days on and days off are entered into the model, which is capable of producing “fatigue indices” for individual operators as well as crew assignments. Fatigue indices range from 1 to 100, with low numerical values representing little fatigue producing effects and higher scores correlating to high fatigue levels. In general, the majority of operator schedules produce scores ranging from 20 to 60. Fatigue indices above 60 may be considered problematic for rail operations personnel. Fatigue indices were developed for rail operations personnel having regular assignments as well as “Extra Board” assignments. Regular assignments are generally set schedules consisting of four to five consecutive days with two to three days off between work periods. Regular assignment shifts typically run ten consecutive hours during the day, with a set time period off. Extra Board assignments are available and are used when an employee is unable to work and by their nature, are not set and may or may not be filled. Fatigue indices were then calculated for both assignment categories. Some of the key findings are indicated below: • Fatigue indices both for conductors and engineers were consistently higher
for Extra Board assignments as compared to Regular Assignments. • The percentage of conductors and engineers with high fatigue indices (60 or
higher) was nearly double for Extra Board Assignments as compared to Regular Assignments.
• Fatigue for the regular assignment group arises mostly from overnight/early
morning schedules. • High fatigue indices for Extra Board assignments arise from a combination of
long working hours, variations in start time, lack of scheduled nights off (sometimes no nights off), and multiple days on.

4
The full results were presented to NJ TRANSIT executive personnel on January 30, 2003 and are described in the Findings Section of this report. Rail Operations Personnel Survey Results To better understand fatigue for NJ TRANSIT rail operations personnel, a survey/questionnaire, consisting of 136 multiple-choice questions and four written questions, was prepared and distributed. The results of the surveys were used to identify and document advantages, disadvantages, suggested schedule and guideline improvements from the point of view of the NJ TRANSIT rail operations staff. Potential survey participants were randomly selected from the current list of 1,546 rail operations personnel. The NJIT research team randomly selected from a group of 100 assistant conductors/conductors and 100 assistant engineers/ locomotive engineers and mailed out a comprehensive survey questionnaire form and response sheet. Survey participants also had the opportunity to provide written comments directly on the survey form. The NJIT research team worked very closely with NJ TRANSIT rail operations staff as well as union representatives from the United Transportation Union (UTU) and the Brotherhood of Locomotive Engineers (BLE) in developing and administering the survey. It was extremely important that the NJIT research team maintain a high level of confidentiality to ensure that the survey participants felt comfortable responding to the questions. BLE and UTU representatives were also helpful in following up with their respective members to ensure an adequate number of responses were received. In all, 33 surveys were completed. Respondents also provided written comments to four questions posed at the end of the survey. Some of the key findings of the survey are provided below: • The majority (61 %) of respondents indicated difficulty in obtaining an
adequate amount of sleep. • Over half of the respondents indicated at least some difficulty in maintaining
alertness on the job, and fighting fatigue or drowsiness on the job. • While 84 % of respondents indicated they required 7 to 8 hours of sleep to be
alert and well rested, less than half reported they obtain 7 or more hours of rest.
• More than half (17 of 31) of the respondents indicate they do not use the
napping/resting rooms and the majority (21 or 31) rated the quality of these facilities as “poor”. Written responses also suggest that more consistent work shifts, longer break time between trains, better rest facilities and improved working relationships between crew members and upper level management

5
could help reduce operator fatigue. Lack of job security was also noted as a concern among rail operations personnel.
Recommendations Based on the results of the literature review, CTI’s evaluation of the October 2002 schedule and survey questionnaire responses, several recommendations have been developed and are elaborated upon in the Recommendations of this report: Some of the key recommendations are provided below: Eliminate split shifts where a night shift is followed by a day shift assignment. Schedule combinations that look at start time changes and number of consecutive hours worked should be examined further, both from fatigue index point of view and from actual reports of operators, to gain the maximum benefit of fatigue reduction. Reduce the number of hours worked at night. To the extent possible, working long nighttime hours should be limited. Engage in active discussions to comprehensively examine revamping the Extra Board concept. Extra Board assignments result in the highest fatigue indices and are, according to the body of research, the most fatigue inducing. However, the economic benefits and need to maintain adequate staffing levels when normally scheduled crew members are not available must be balanced with potential safety risks associated with potential fatigue related problems associated with Extra Board assignments. There needs to be an ongoing dialogue among NJ TRANSIT officials and union officials so that an equitable balance between the economic benefits and potential safety risks due to fatigue can be achieved.

6
INTRODUCTION Operator fatigue has serious consequences, not only in terms or impaired service, but can lead to serious injury. Operator fatigue has been identified as a probable factor in a number of major crashes and costly incidents, such the crash of a BWI airport subway train, the Exxon Valdez tanker spill and the collision of New York City subway trains on the Williamsburg Bridge. Not surprisingly, rail operator fatigue is a topic that is receiving national attention. In a cover letter submitted along with the Federal Railroad Safety Enhancement Act of 1999 bill to the U. S. House of Representatives and Senate, then-U.S. Department of Transportation Secretary Rodney E. Slater stated that “fatigue hampers the alertness of employees and causes accidents, one of the most pervasive safety issues in the railroad industry” Experts agree that through better fatigue management, these types of serious incidents can be significantly reduced and that the overall level of safety and performance can be improved. “Fatigue Management Plans” provide scheduling strategies that consider the human body’s natural sleep/wake cycles (circadian rhythm) to optimize service and/or production while minimizing costs. According to Mr. Slater, “Carriers may tailor their fatigue management plans to best meet their various operating needs and these plans can be modified as knowledge of the science of fatigue and its practical applications evolves.” Under provisions of the Federal Railroad Safety Enhancement Act of 1999 bill, Fatigue Management Plans amend the existing hours of service laws under the current United States Code. These changes are aimed at recognizing and reducing on-the-job fatigue and fatigue-caused accidents and injuries. NJ TRANSIT is New Jersey’s principal bus, rail and light rail commuter transit provider with service extending throughout the entire state and into New York City and Philadelphia. NJ TRANSIT currently operates 12 commuter rail lines and 2 light rail lines totaling nearly one thousand directional route miles with 163 rail and 27 light rail stations (See Figure 1). Rail service alone accommodates approximately 225,000 passenger trips per day. (1) NJ TRANSIT’s rail engineers are required to successfully complete a comprehensive training program. In addition, engineers are subject to fitness of duty (FOD) tests and routine drug testing. While fatigue management is an important safety issue for NJ TRANSIT, there are no acceptable methods to quantitatively measure operator fatigue, and testing operators for fatigue is impractical. Therefore, efforts to develop and implement effective fatigue management strategies are essential. NJ TRANSIT maintains an HOS database for its staff of rail operations personnel and crew assignments. They want to use this database for comparison to HOS determinations using existing fatigue management modeling tools. The guidelines developed out of these efforts must be credible and practical in terms

7
of reducing fatigue, that comply with rules and regulations, that addresses management and staff personnel concerns and meet current and future demands of NJ TRANSIT’s rail passenger customers. In its continuing efforts to improve safety and reduce the turnover of skilled operating personnel, NJ TRANSIT and the New Jersey Department of Transportation (NJDOT) have initiated a research project to evaluate NJ TRANSIT’S existing Hours of Service (HOS) guidelines. Ultimately, it would be desirable to readily evaluate fatigue associated with proposed crew scheduling scenarios and make adjustments accordingly. From a practical perspective, this could only be accomplished through the use of a computer model that directly interfaces with NJ TRANSIT’s existing crew scheduling software. This study represents the first phase of an overall implementation plan to address rail operator fatigue, which includes the development of recommendations to minimize fatigue. As part of this study, NJ TRANSIT has also requested the NJIT research team to prepare a technical scope of services from which a Request for Proposal (RFP) could be prepared. The RFP would enable NJ TRANSIT to solicit bids to develop an interactive fatigue management module that would interface with its existing HOS database. The first phase of this study includes a comprehensive literature review of research conducted or sponsored by transportation agencies and professional organizations. The second phase consists of examining existing schedule guidelines, evaluating operator fatigue under a current HOS schedule scenario, evaluating operator fatigue under selected modifications to the schedule, and developing recommendations to minimize operator fatigue.

8
Figure 1. NJ TRANSIT Rail Map

9
RESEARCH APPROACH Overview The research approach provides NJ TRANSIT and NJDOT with a detailed insight and background of ongoing research in fatigue associated with transportation operations. The literature review provides both a general overview of information as to the social, physiological and psychological factors believed to cause fatigue and then specifically addresses fatigue for rail operations personnel. A comprehensive body of research and literature exists for operator fatigue associated with “long haul” transportation operations, such as rail freight and truck freight operations. The nature of long haul freight operations often requires transportation operators to make one-way trips across several states and even through several regions of the country with relatively few stops. Turn-around times and one-way trip lengths are therefore generally much shorter for NJ TRANSIT’s rail operations as compared to typical freight rail operations. Therefore, in examining fatigue for NJ TRANSIT rail operations personnel, appropriate scheduling practices, which have been identified largely for the freight transportation industry, need to be examined within the context of shorter trip lengths and turnaround times. Circadian Technologies Incorporated (CTI) has developed a comprehensive survey/questionnaire largely geared to evaluate fatigue for its long haul freight rail clients. To better understand rail operator fatigue for NJ TRANSIT, the survey/questionnaire was modified based on input from NJ TRANSIT personnel and union officials who represent NJ TRANSIT’s rail operations personnel. The survey was distributed to 200 randomly selected rail operations personnel. The survey consisted of 136 multiple-choice questions. Survey participants were also given the opportunity to provide written responses to general questions concerning fatigue. Survey results were then gathered and tabulated. The results of the survey were used to verify CTI’s quantitative assessment of a selected crew schedule. The assessment uses a computer-based model that integrates a comprehensive body of fatigue research and data. The model is capable of being interfaced with NJ TRANSIT’s crew scheduling database and provides a numerical “fatigue score” for the crew assignments both individually and collectively. The results of the assessment and the results of the survey were discussed (see p. 29). CTI produced a series of fatigue indices for the crew assignments for a specific time period. However, NJ TRANSIT desires to develop an interactive module that would interface directly with the crew scheduling software and evaluate fatigue with changing crew assignments. Such a tool would have to be developed and maintained by outside contractors. Therefore, the study also

10
includes a technical Scope of Services from which a Request for Proposal could be prepared and sent to outside vendors. Finally, the research project includes several recommendations for minimizing operator fatigue while simultaneously maintaining crew assignments that are realistic, implementable and meet applicable guidelines. Following the initial evaluation of the selected crew assignment schedule, CTI performed a series of “what-if” scenarios by modifying selected schedule attributes such as start and end time and the number of contiguous days on. These efforts, the results of the survey and the close collaboration with NJ TRANSIT personnel provided the basis for our recommendations. Details of the research approach for the various phases of the study are provided below. Literature Review The research approach for the literature review was conducted in two phases. Phase I included a general investigation of shiftwork ergonomics and health related issues. The literature search considers the areas of rail fatigue management, fatigue management models, HOS determination for rail operations personnel and for rail transit operations. The NJIT research team also examines existing and proposed operator regulations that pertain to NJ TRANSIT rail operations, such as the NJ TRANSIT rail operators union, Federal Railroad Administration (FRA), Federal Railroad Safety Enhancement Act and Northeast Operating Rules Advisory Council (NORAC). The NJIT research team presented and discussed the results of the literature review with NJ TRANSIT senior executive personnel on January 30, 2003. Fatigue Assessment CTI has developed a computer based fatigue estimator model that assimilates a comprehensive body of medical research in the area of fatigue and human circadian rhythm patterns along with CTI’s own data gathering activities. The model interfaces directly with crew scheduling database software, including the Timera software package used by NJ TRANSIT. Various crew schedule parameters, such as start and end times, days off and consecutive days worked provide inputs to CTI’s fatigue estimator model. Outputs of the model include fatigue “scores”, which range from zero (no fatigue-causing effects) to one hundred (high fatigue causing effects). NJ TRANSIT’s current HOS database develops schedules for its current staff of 1,546 rail operations personnel and is made up of the following job categories:

11
• 1096 Assistant Conductors/Conductors. • 436 Assistant Engineers/Locomotive Engineers. • 14 Yard Masters.
Job functions of assistant engineer/locomotive engineer personnel include operating the trains while assistant conductors/conductors check tickets, collect fares and ensure the safe ingress and egress of passengers. Yard Masters are responsible for the maintenance of equipment and trackage. Output from the HOS database includes a series of “assignments”, which specify the route, start and end times and on/off duty times. New assignment schedules are generated when changes in train schedules and/or changes in personnel occur. Since each assignment must maintain a set number of persons per crew, there are provisions for employees, not normally assigned to a crew, to fill for a scheduled crewmember who may be on scheduled leave or is unable to report to duty. These assignments are termed “Extra Board” assignments. The CTI model calculated fatigue indices for individual workers, grouping employees into their trade and whether they worked on the regular or Extra Board. Fatigue levels for “regular” assignments were evaluated based on NJ TRANSIT’s October 27, 2002 crew assignment schedule. The information for each assignment was converted into the on-duty time for a week period. Each assignment was then repeated for four weeks to demonstrate any cumulative effects. Based on each assignment, the average fatigue indices were plotted. The histogram shows the distribution of employees and respective each fatigue indices for the schedule. The following schedule parameters were used in evaluating the fatigue indices: • Shift Start Time. • Shift End Time. • Shift Duration. • Time Off Between Shifts. • Time Off Between Shift Starts. • Consecutive Scheduled Days On (Day on is a day with a shift start). • Consecutive Scheduled Days Off (Day off is a day without a shift start). • Consecutive Nights Off Between Shift Blocks (Night Off is defined as an 8-
hour period without work between 10 pm and 8 am). Low fatigue indices range from 0-30, average fatigue indices range from 31-60 and high fatigue indices from 61 to 100. The individual data were combined to analyze the average fatigue levels and the distribution of fatigue indices by job type, station terminal and overall. Fatigue levels were also evaluated for “Extra Board” assignments. The analysis extracted information for each individual and was then converted into the on-duty time for the month of November. Based on the each assignment, average fatigue indices were calculated.

12
In addition to estimating fatigue indices for each crew assignment, the following analyses were performed: • Evaluation of operational parameters (e.g., number of working hours per day,
per week, number of consecutive days ‘on’ versus days ‘off’, etc.)
• Evaluation of general fatigue level, and rule violations, accidents, claims, etc. recorded in the HOS database if available.
• Identification of operational and bio-psychosocial weaknesses in the current system, (e.g. variations of shift start and end times, back/forward transitions of shift starts and shifts ends, per week, number of consecutive days ‘on’ versus days ‘off’, identify bad transitions between days ‘on’ and days ‘off’ and vice versa, etc.). The definition and identification of those weaknesses is derived from published research which is not be included in this report.
Results of these analyses are contained in the Results section and in Appendix B of this report. Operator Survey/Questionnaire The CTI fatigue estimator assimilates an extensive database of information collected from rail operations personnel as well as a comprehensive body of medical research. The purpose of the operator survey/questionnaire is to gain input specifically on NJ TRANSIT’s rail operations personnel and also to verify the results of CTI’s fatigue assessment which is solely based on specific schedules of NJ TRANSIT rail operations personnel. CTI has developed a standard survey/questionnaire for gathering information from rail operations personnel. This survey has been used previously for freight and transit operations in North America. CTI’s survey/questionnaire was modified to gather input specific to NJ TRANSIT’s rail operations personnel. For example, it was necessary to include conductors and assistant conductors on the form. However, the vast majority of questions developed by CTI were not altered. The NJIT research team also solicited input from NJ TRANSIT personnel as well as the two rail operator unions, the Brotherhood of Locomotive Engineers (BLE) and the United Transportation Union (UTU) in tailoring the survey. The two unions also notified and encouraged their members to participate in the survey. The survey form used in this project consists of 136 multiple-choice questions and addresses several areas previously being identified known to affect fatigue. There was also a section at the end of the survey where participants could include written comments. For the multiple choice section of the survey, participants were asked to mark their responses on a separate one-page form, which could then be automatically summarized. It would not have been practical to attempt to solicit responses from all 1,546 rail operations personnel. But in

13
order to ensure that there was an adequate sample size and cross section of potential respondents, 200 names were randomly selected from the full list of 1,546 rail operations personnel provided to NJIT. Surveys were sent out to100 UTU members and 100 BLE members. A return address, postage paid envelope was enclosed with the survey package. Of the 200 surveys sent out, five surveys were returned to the NJIT research team due to inaccurate mailing addresses, 33 were completed and returned resulting in a response rate of 17 %. The survey findings are summarized and are discussed in the Results section of this report. Development of Recommendations Findings from the Literature Review, CTI’s fatigue assessment and results of the survey provided the basis for developing recommendations for reducing fatigue for NJ TRANSIT’s rail operations personnel. CTI also performed a series of "What if" scenarios on the October, 2002 crew assignment schedule, which was also selected for assessing fatigue, to determine potential impacts of modifying selected schedule parameters. Specifically, CTI examined the following: • Large number of consecutive days: the effect of imposing a limit on the
number of days that can be worked in a row - especially if the work is carried out in the early morning, evening or night (mostly Extra Board)
• Repeated night work: the effect of using a rotating schedule instead of fixed - e.g. rotate some of the people working days to working nights and vice versa.
• Long hours per week: the effect of placing a limit on the number of hours worked, especially in the evening or night
• Wide variations in start time: the effect of leveling out the start times (mostly Extra Board).
Various modifications and their impact to fatigue indices were examined. In some cases, several changes that address a single issue were examined. For example, three different schedule alterations were examined to reduce fatigue effects associated with long working hours. The results of these changes are included in the Findings section of this report. Performing what-if scenarios also provided an important basis for developing recommendations. Prepare a Technical Scope of Services As part of this study, CTI developed fatigue indices for a specific crew assignment schedule (October 27, 2002). In the future, NJ TRANSIT desires to initiate a subsequent phase to this study that would enable fatigue to be evaluated with changes in their crew assignment HOS database. Implementation of this concept would enable fatigue to be minimized while

14
simultaneously producing crew schedules that are realistic and practical. However, for such a system to be implemented, it is likely that NJ TRANSIT would need to employ the services of an outside contractor. Accordingly, NJ TRANSIT has included as part of the scope of work under this study the preparation of a technical Scope of Services which could be incorporated into a Request for Proposal (RFP) for future implementation of a fatigue estimator model that would interface directly with NJ TRANSIT current HOS crew assignment scheduling software.

15
RESULTS This section of the report includes a summary CTI’s fatigue assessment of a selected crew assignment schedule, key findings from the literature review, results of the survey questionnaire and results of the “What-if” scenario evaluation. The findings are summarized in each of these areas in the sections below. Fatigue Assessment NJ TRANSIT selected the October 27, 2002 crew assignment schedule as the case study for determining fatigue indices. Scores were determined for 290 Conductor Assignments, 260 Engineer Assignments and 112 Extra Board personnel. The analysis examines regular assignments and Extra Board assignments and looks at the engineer and conductor job categories both separately and overall. A full summary and assessment is contained in CTI’s Fatigue Assessment Report, which is provided in Appendix B. Some key highlights of CTI Fatigue Assessment Report including the distribution of fatigue indices for engineers and conductors for both regular assignments and Extra Board assignments are discussed below. Regular Assignments Regular assignments are consistently scheduled work periods with established start and end times. From their analysis of the data, CTI was able to define regular assignments as having the following characteristics: • Regular assignments have shift start times that occur between 4 am and 7
am and between 1 pm and 5 pm. Most shifts last between 9 and 11 hours, with some lasting 13 hours (presumably in utilizing a split shift arrangement - time during split shifts was counted as on-duty for the purposes of the fatigue assessment).
• All assignments (excluding Z assignments) are a consecutive block of 5 days
with 2 off. • All assignments had at least 2 consecutive nights off, with a night off defined
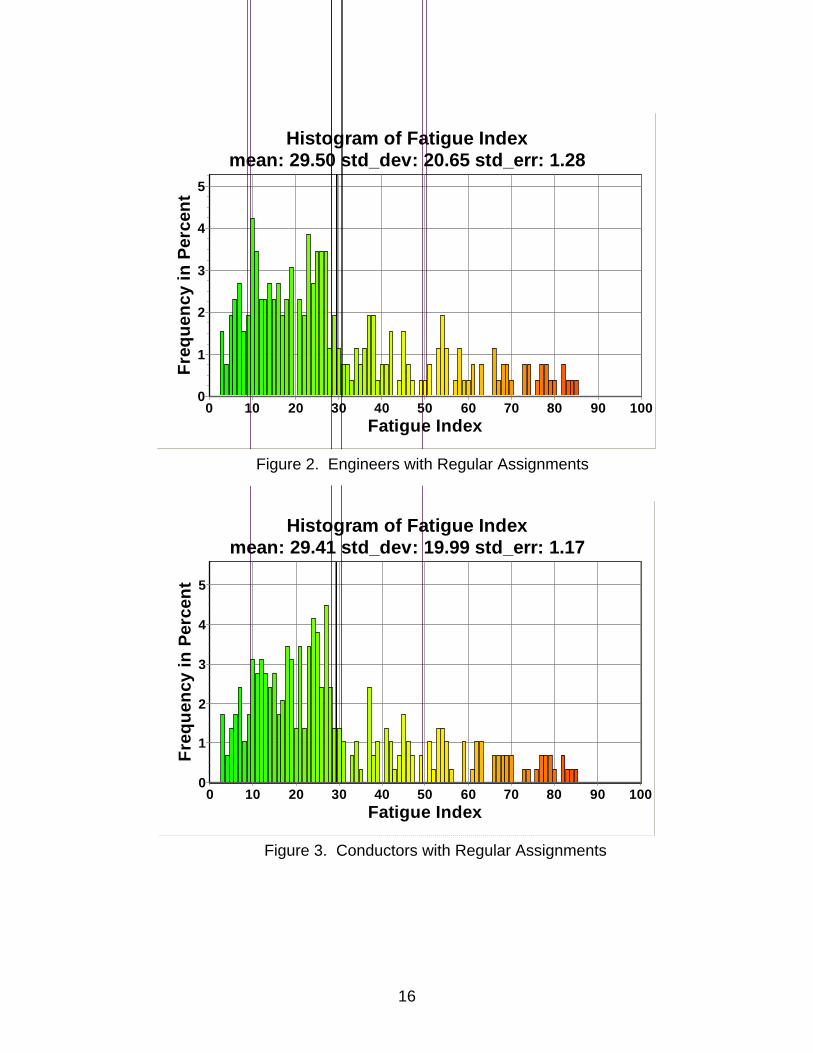
as a period of time off between 10pm and 8am the next morning. Fatigue indices and the frequency associated with each job category are provided in the following figures. Mean fatigue indices, which are noted on the figures, for NJ TRANSIT’s Regular Assignment rail operations personnel are generally consistent with other studies conducted by CTI for other transportation operators.
16
Histogram of Fatigue Indexmean: 29.50 std_dev: 20.65 std_err: 1.28
Fatigue Index1009080706050403020100
Freq
uenc
y in
Per
cent
5
4
3
2
1
0
Histogram of Fatigue Indexmean: 29.41 std_dev: 19.99 std_err: 1.17
Fatigue Index1009080706050403020100
Freq
uenc
y in
Per
cent 5
4
3
2
1
0
Figure 2. Engineers with Regular Assignments
Figure 3. Conductors with Regular Assignments

17
Extra Board Assignments: When a crewmember is absent or is unable to work, it is essential that substitute personnel be available to fulfill the absentee’s duties and responsibilities. Therefore, NJ TRANSIT maintains an “Extra Board”. The provision for Extra Board assignments not only provides a back up in the event a crewmember is absent, but also provides an opportunity for rail operations personnel to earn additional compensation. By their very nature, Extra Board assignments are much less predictable than regular assignments in terms of typical schedule parameters and potentially have an adverse effect on individuals who take on these assignments. In terms of fatigue, working an Extra Board assignment will likely infringe on rest periods normally associated with regular assignments. Therefore, CTI evaluated the same scheduling parameters for Extra Board Assignments that were examined for Regular Assignments and their impact on fatigue for both the engineer and conductor job categories. The distribution of fatigue indices by job category is provided below.
Histogram of Fatigue Indexmean: 39.34 std_dev: 20.09 std_err: 2.55
Fatigue Index1009080706050403020100
Freq
uenc
y in
Per
cent
109876543210
Figure 4. Extra Board Assignments for Engineers
18
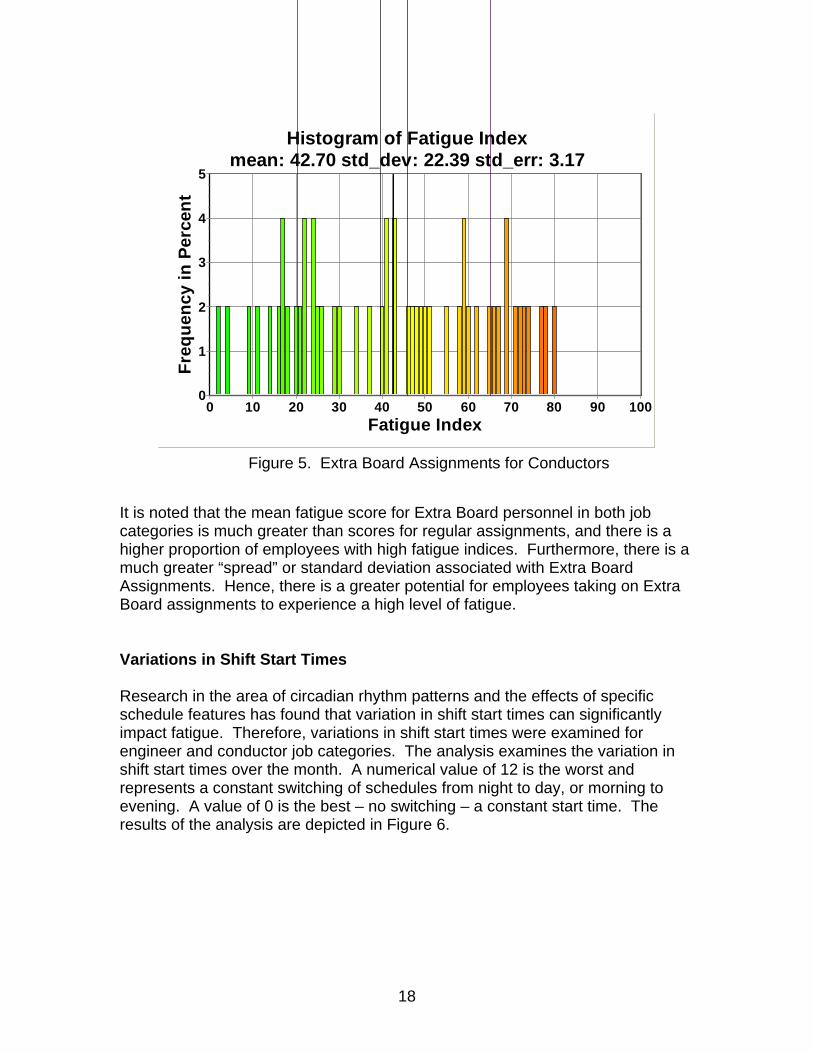
Histogram of Fatigue Indexmean: 42.70 std_dev: 22.39 std_err: 3.17
Fatigue Index1009080706050403020100
Freq
uenc
y in
Per
cent
5
4
3
2
1
0
It is noted that the mean fatigue score for Extra Board personnel in both job categories is much greater than scores for regular assignments, and there is a higher proportion of employees with high fatigue indices. Furthermore, there is a much greater “spread” or standard deviation associated with Extra Board Assignments. Hence, there is a greater potential for employees taking on Extra Board assignments to experience a high level of fatigue. Variations in Shift Start Times Research in the area of circadian rhythm patterns and the effects of specific schedule features has found that variation in shift start times can significantly impact fatigue. Therefore, variations in shift start times were examined for engineer and conductor job categories. The analysis examines the variation in shift start times over the month. A numerical value of 12 is the worst and represents a constant switching of schedules from night to day, or morning to evening. A value of 0 is the best – no switching – a constant start time. The results of the analysis are depicted in Figure 6.
Figure 5. Extra Board Assignments for Conductors

19
A (1) Engineers – Regular Assignments
Shift Start Variation
Value0 1 2 3 4 5 6 7 8 9 10 11 12
Freq
uenc
y190
180
170
160
150
140
130
120
110
100
90
80
70
60
50
40
30
20
10
0
A (2) Engineers – Extra Board
Shift Start Variation
Value0 1 2 3 4 5 6 7 8 9 10 11 12
Freq
uenc
y
14
13
12
11
10
9
8
7
6
5
4
3
2
1
0

20
B (1) Conductors-Regular Assignment
Shift Start Variation
Value0 1 2 3 4 5 6 7 8 9 10 11 12
Freq
uenc
y
220210200190
180170160150140
1301201101009080
7060504030
20100
B (2) Conductors –Extra Board
Shift Start Variation
Value0 1 2 3 4 5 6 7 8 9 10 11 12
Freq
uenc
y
14
13
12
11
10
9
8
7
6
5
4
3
2
1
0
Figure 6. Shift Start Times by Assignment and Job Category: A (1) Engineers – Regular Assignments, A (2) Engineers – Extra Board B (1) Conductors-Regular Assignment B (2) Conductors –Extra Board
Based on the analysis, shift start times were found to be highly consistent for regular assignments and much less consistent for Extra Board assignments in both job categories. These findings are also consistent with the lower fatigue

21
indices for regular assignments for all job categories. Other key findings of the Fatigue Evaluation are highlighted below: Regular Assignments:
• The average fatigue score for conductors (all terminals) was 29.4.
• The average fatigue score for engineers (all terminals) was 29.5.
• The percentage of conductors and engineers with low fatigue indices (30 or lower) was 65.8%.
• The percentage of conductors and engineers with high fatigue indices (60 or higher) was 11.1%.
Extra Board
• The average fatigue score for Extra Board conductors was (all terminals) was 42.7.
• The average fatigue score for Extra Board engineers was (all terminals) was 39.3.
• The percentage of conductors and engineers with low fatigue indices (30 or lower) was 33%.
• The percentage of conductors and engineers with high fatigue indices (60 or higher) was 19.6%.
• Fatigue in regular assignment group arises mostly from overnight/early morning schedules.
• Fatigue in Extra Board likely arises from long work hours, variations in start time, lack of scheduled nights off (sometimes no nights off), and multiple days on.
Overall, it was found that fatigue in the regular assignment group arises mostly from overnight/early morning schedules and fatigue in Extra Board likely arises from long work hours, variations in start time, lack of scheduled nights off (sometimes no nights off), and multiple days on. Operator Survey The results of the operator surveys were used to identify and document advantages, disadvantages, and suggested schedule and guideline improvements from the point of view of the NJ TRANSIT rail operations staff. Potential survey participants were randomly selected from the current list of 1,546 rail operations personnel. The NJIT research team randomly selected from a group of 100 assistant conductors/conductors and 100 assistant engineers/locomotive engineers and mailed out a comprehensive survey questionnaire form and response sheet. Survey participants also had the opportunity to provide written comments directly on the survey form.

22
The NJIT research team worked very closely with NJ TRANSIT rail operations staff as well as union representatives from the United Transportation Union (UTU) and the Brotherhood of Locomotive Engineers (BLE) in developing and administering the survey. It was extremely important that the NJIT research team maintain a high level of confidentiality to ensure that the survey participants felt comfortable responding to the questions. BLE and UTU representatives were also helpful in following up with their respective members to ensure an adequate number of responses were received. The final survey consisted of 136 multiple-choice questions and was divided into three basic sections. The first part of the survey seeks specific personal and job-related information such as age, gender, job title and number of years on the job. The second part asks respondents to provide personal information in a number of different areas, including health issues, sleeping habits, off-duty activities as well as their personal assessment of sleep. Some questions applied a rating system where respondents were asked to rank difficulty or importance to a specific question. For example, one question asks, “How difficult is it to get an adequate level of sleep?” Respondents are then asked to mark “A” for “Very Difficult”, “B” for “Difficult”, “C” for “Somewhat Difficult” and so on. Other questions ask more objective questions. The third part of the survey provides an opportunity for respondents to provide written responses to somewhat open-ended questions. A copy of the survey form is provided in Appendix C. Of the 200 surveys sent out, 5 were returned to senders due to inaccurate mailing addresses, and a total of 31 surveys were completed and returned. Although the response rate of approximately 16 per cent is somewhat disappointing, the surveys provide some interesting insights and findings. Nearly half of the respondents who completed the surveys also provided written comments to four questions posed at the end of the survey. Some of the survey results are highlighted below:
• The average age of the respondents is 42.7 years;
• There were 25 males and 5 females who responded (the gender for 1 respondent is unknown).
• In all, 13 respondents were conductors and 18 were locomotive engineers.
• Approximately one-third of the respondents are on the Extra Board list. Among them, 6 were called 1-2 times, 2 were called 3-4 times, and one was called 7 or 8 times in the last month.
Other key findings are provided below.

23
Multiple Choice Response Section Participants were asked to rate their ability to get a sufficient quantity of sleep. 28% of the respondents indicated “very difficult”, 33% “difficult”, and 23% “sometimes difficult”.
0
5
10
15
20
25
30
35
Very Difficult Difficlt SometimesDifficult
SeldomDifficult
NeverDifficult
Perc
ent o
f Res
pond
ents
Figure 7. Getting Sufficient Quantity of Sleep
Results were somewhat similar for getting a good quality of sleep: 33% indicated “very difficult”; 23% “difficult” and 28% “sometimes difficult.”
0
5
10
15
20
25
30
35
Very Difficult Difficlt SometimesDifficult
SeldomDifficult
NeverDifficult
Perc
ent o
f Res
pond
ents
Figure 8. Getting Sufficient Quality of Sleep
24
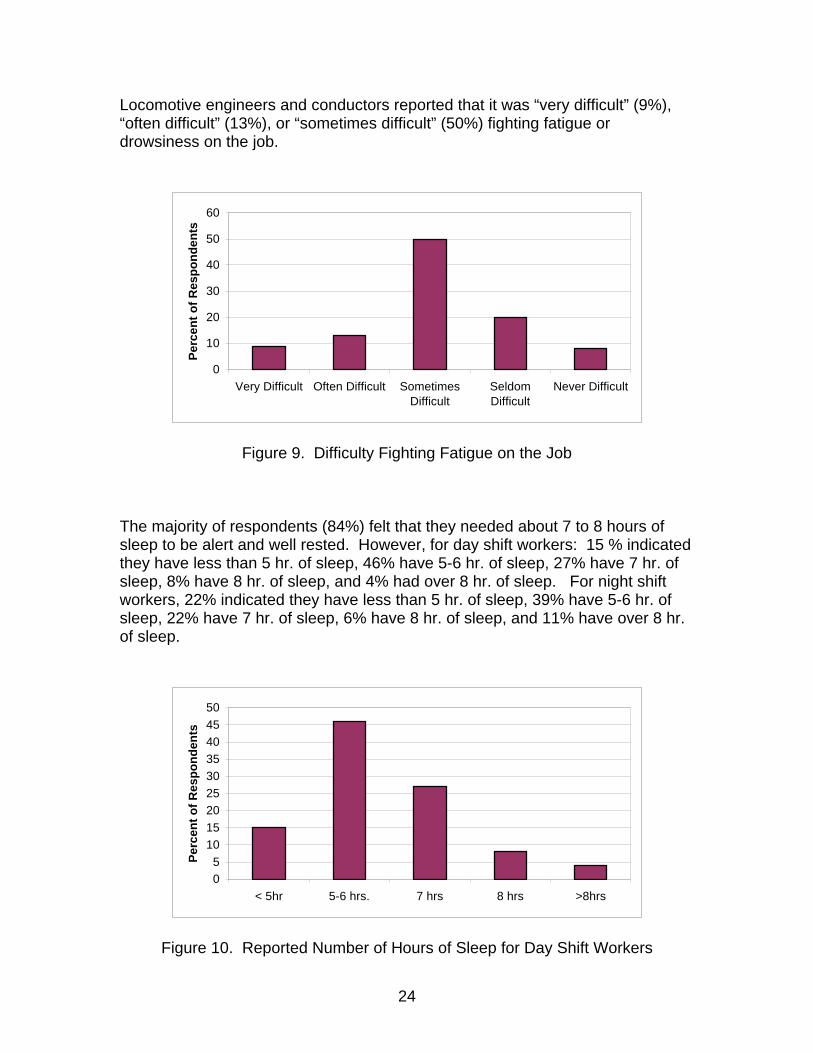
Locomotive engineers and conductors reported that it was “very difficult” (9%), “often difficult” (13%), or “sometimes difficult” (50%) fighting fatigue or drowsiness on the job.
0
10
20
30
40
50
60
Very Difficult Often Difficult SometimesDifficult
SeldomDifficult
Never Difficult
Perc
ent o
f Res
pond
ents
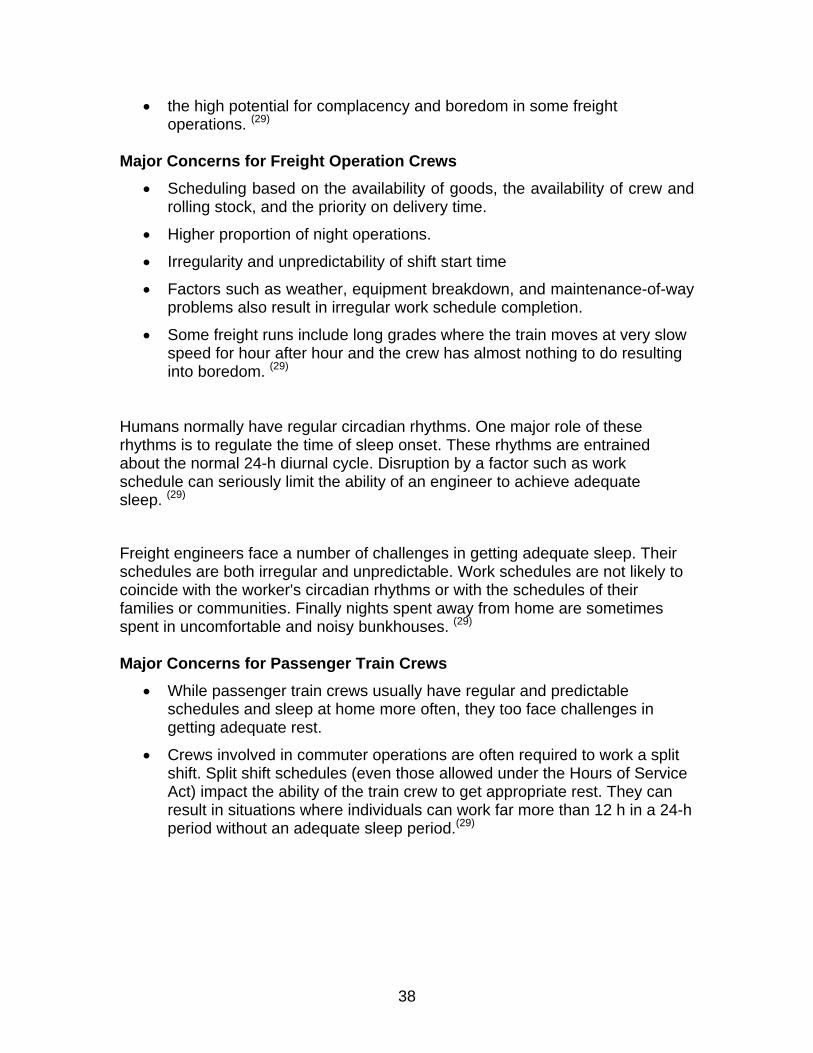
Figure 9. Difficulty Fighting Fatigue on the Job The majority of respondents (84%) felt that they needed about 7 to 8 hours of sleep to be alert and well rested. However, for day shift workers: 15 % indicated they have less than 5 hr. of sleep, 46% have 5-6 hr. of sleep, 27% have 7 hr. of sleep, 8% have 8 hr. of sleep, and 4% had over 8 hr. of sleep. For night shift workers, 22% indicated they have less than 5 hr. of sleep, 39% have 5-6 hr. of sleep, 22% have 7 hr. of sleep, 6% have 8 hr. of sleep, and 11% have over 8 hr. of sleep.
05
101520253035404550
< 5hr 5-6 hrs. 7 hrs 8 hrs >8hrs
Perc
ent o
f Res
pond
ents
Figure 10. Reported Number of Hours of Sleep for Day Shift Workers

25
05
1015202530354045
< 5hr 5-6 hrs. 7 hrs 8 hrs >8hrs
Perc
ent o
f Res
pond
ents
Figure 11. Reported Number of Hours of Sleep for Night Shift Workers For the number of consecutive days worked when respondents felt most fatigued, 20 % responded they felt most fatigued on the fourth consecutive day and 47 % felt most fatigued on the fifth consecutive day. Respondents were asked about the “napping” or “resting“ rooms. More than half (17 of 31) do not use the napping/resting rooms and the majority (21 or 31) rated the quality of these facilities as “poor”. No further information was provided from the survey respondents why they had those facilities received such poor ratings. A full summary of multiple-choice responses is contained in Appendix C. Written Response Section Survey respondents were asked to provide written comments to the four questions included at the end of the multiple-choice section. The essay questions along with a summary of responses are provided below. 1. What do you find is the most fatiguing aspect of your job and what jobs do you find most difficult? Several responses directly related to working hours, including inconsistent work shift, inadequate break time between trains (short “turns”), and shifts that begin early in the morning and end late in the day (split shifts). Other comments pertained to actual working conditions, including poor equipment conditions, stress from management and co-workers and poor rest facilities.

26
2. What measures do you think would be most likely to improve the overall alertness of the train crews? Responses were somewhat similar to those provided in Question 1. They included more consistent work shifts, in terms of both starting and ending time of shifts, and increased rest periods between trains. Several also suggested uninterrupted work periods. 3. What methods do you currently use to help you reduce your fatigue and increase alertness? Respondents provided a number of suggestions both on and off the job. Some respondents indicated they use caffeine and nicotine and take short naps on their breaks to help them stay awake and alert on the job. One respondent also indicated staying focused on job responsibilities helped them to stay alert. Other suggestions included exercise, maintaining a balanced life and getting an adequate nights’ sleep. 4. Is there any other important information that you wish to share with us relative to your personal preferences, problems, or recommendations regarding working on the trains? Responses to Question 4 varied considerably. However, transit security and dealing with the public was consistently raised as a matter of concern among the respondents. Other comments included the need to provide cleaner windows and crew cabs, standard cab controls and better rest facilities. In general, it was suggested from the written comments of the survey results that work environment may need to be improved. What-If Scenarios As indicated above, CTI identified a number of schedule features that negatively impact fatigue. Throughout the body of general literature and research concerning operator fatigue, there are a number of schedule features known to induce fatigue. For the “what-if” case study evaluation, it is hypothesized that the majority of the severe fatigue problems were caused by four possible scenarios: 1. Large number of consecutive days with assignment times that affect sleep 2. Repeated night work 3. Long hours per week 4. Wide variations in start time affecting length of sleep In order to qualify and quantify the validity of the four scenarios, CTI evaluated schedule modifications that focus on altering these parameters and determining their impact on reducing fatigue for engineers and conductors. A cross-section of employees for whom the initial fatigue assessment showed high scores was

27
selected. Fatigue modeling was carried out on their assignments to determine the impacts of implementing various what-if scenarios. Potential causes for high fatigue indices and CTI’s proposed modifications to specific parameters are indicated below:
1. Large number of consecutive days: Examine the effect of imposing a limit on the number of days that can be worked in a row - especially if the work is carried out in the early morning, evening or night (mostly Extra Board).
2. Repeated night work: Examine the effect of using a rotating schedule instead of fixed - e.g. rotate some of the people working days to working nights and vice versa (mostly yard work).
3. Long hours per week: Examine placing a limit on the number of hours worked, especially in the evening or night.
4. Wide variations in start time affecting length of sleep: Examine leveling out the start times (mostly Extra Board).
The first scenario examines the impact of too many consecutive days worked. For example, in one case an employee was found to work 25 out of 27 days. Since lack of recuperation generally leads to fatigue, the fatigue index for this employee was 77.5. By instituting a modification that would require 2 days off in every 7-day block, the fatigue index drops to 61. This is a significant reduction in fatigue, especially for those who work variable and night shift schedules. Impacts associated with modifications to address repeated night work were examined in the second scenario. In one instance, an employee was found to consistently work night shifts with a resulting fatigue index of 77.4. CTI proposed to modify the schedule so that every other week the employee would work a similar shift length for day hours. Again, the results were significant, reducing the fatigue index to 64.0 The third scenario examines the impacts of long work hours. Long hours alone do not necessarily lead to fatigue. For example, 64 hours per week worked on average, resulted in a fatigue index of 25.8, which is considered low fatigue inducing. Furthermore, long hours worked in the day only, with little variation in start time may not be fatigue inducing. However, when long hours are combined with night/evening shifts and changes in start times, fatigue occurs. For example, 76 hours per week worked on average combined with night/evening shifts, resulted in a fatigue index 77.6, which is well into “red zone”, i.e. high fatigue. Three different schedule alterations were examined to reduce fatigue effects associated with long working hours combined with evening shift work and changes in start times. The first alteration simply removed a day per week. This resulted in a slight improvement to the fatigue index, reducing it to 69.4. The

28
second modification removed a night shift a week. However, the fatigue index only drops to 69.2. A third modification removed some of the night shifts that are causing high levels of fatigue, resulting in a significant reduction of the fatigue index to 58.6. While the large decrease in the fatigue index indicates that using software based rules developed by CTI work well, this alteration may actually be difficult to implement as the future work schedule of the Extra Board is unknown. In general, it was found that high fatigue is being caused when a day or afternoon shift is followed by a 4-6 hour break, than an evening/night shift. Adding a minimum recovery time between shifts would help to alleviate fatigue, particularly for those on the Extra Board. The fourth scenario looked at the effects of variable start times. CTI’s fatigue estimator does not use start time variation as a determinant of fatigue. Therefore, even though start times may vary, fatigue indices would only be affected if night/early start times were reduced. However, wide variations in start times in conjunction with night/early start times resulted in a fatigue index of 71.3 for one individual modeled. Decreasing the variation in start time (with the same approximate length of shifts) resulted in a significant reduction in the fatigue index to 44.5. However, it is noted that this dramatic reduction is largely a result of increasing nighttime sleep, and removing afternoon followed by night shifts (as per the third scenario). Decreasing the variation in start time, again with the same approximate length of shifts, but making more shifts begin at night actually increased the fatigue index to 82.1. Therefore, reductions in shift start variation may help, but an increase in poorly planned night shifts could increase fatigue indices.

29
CONCLUSIONS CTI’s fatigue assessment of selected operator schedules, the impact of schedule modifications on operator fatigue and a comprehensive survey of NJ TRANSIT’s rail operations personnel provided the basis for several interesting conclusions, which are described in detail below. Existing Schedules Overall, schedules for NJ TRANSIT’s rail operations personnel were not found to be significantly fatigue inducing for regularly scheduled assignments as compared to fatigue indices for other rail operations personnel. For example, the mean fatigue index for NJ TRANSIT’s engineers’ regular assignments was 29.5. This is very similar to other CTI fatigue assessment study results. Furthermore, fatigue indices for engineers and conductors, on average, were found to be very similar. For regular assignments, therefore, there does not appear to be a particular distinction between the engineer and conductor job categories in terms of fatigue indices. Extra Board assignments have the highest fatigue indices, with mean scores of 39.3 and 42.7 for engineers and conductors, respectively. As with fatigue indices associated with regular assignments, the fatigue indices for engineer and conductor job category are very similar. It is therefore hypothesized that the major factor affecting rail operation personnels at NJ Transit is the scheduling, including day/night shifts, weekly working hours, and variation of shift starting time. It also suggests that use of fatigue management models which take all aspect of scheduling variables into consideration may effectively reduce fatigue of rail operation personnel. What-If Scenarios While fatigue indices for regular schedule NJ TRANSIT rail operations personnel were found to be comparable to those throughout the rail transportation operations sector, there were a number of concerns brought out regarding Extra Board assignments as well as split and nighttime assignments. Therefore, various schedule modifications or “what-if scenarios”, were examined that focused specifically on the effects of fatigue indices. All of the scenarios were found to have an impact on fatigue, with some scenarios having greater impact than others. Interestingly, implementing some of these scenarios led to an increase in fatigue. Based on the results of CTI’s evaluation, the most significant reductions in fatigue occurred where there is a set maximum number of consecutive days worked. CTI examined, for instance the effect of instituting a five- day work block

30
followed by a two-day rest period for Extra Board personnel. The reductions in fatigue were dramatic, with the fatigue index going from 77.4 to 61. Results were similar for rail operations personnel working consecutive night shifts. Reducing shift start variation is also an area that NJ TRANSIT should examine further. CTI found reductions when shift start times were more consistent. However, schedulers are cautioned that while consistent shift start times are more conducive to reduce fatigue, night start times, even if consistent, would actually increase fatigue indices. Operator Survey The results of the operator survey paint a less positive picture of fatigue and overall stress of NJ TRANSIT rail operations personnel. For example, CTI’s quantitative assessment of fatigue indicates low mean fatigue indices (30 or less) for nearly two-thirds of the total rail operations personnel assignments. However, the majority of survey respondents Indicated difficulty in maintaining alertness on the job. Written responses to questions point to other fatigue related concerns. Several respondents indicated short turn around times are fatigue inducing. No further information was provided by those respondents as how short is considered to become fatigue inducing. This was not raised as an issue in CTI’s evaluation as it examines merely hours on duty. Written responses also pointed out that split shifts are as problematic as a fatigue related issue. Again, this was not specifically addressed CTI’s schedule evaluation. However, this is consistent with CTI’s what-if scenario evaluation where fatigue indices were shown to increase for nighttime starts. Other fatigue inducing issues specifically raised in the survey included lack of adequate rest facilities, security concerns and dealing with the public. Further studies are needed in order to investigate those concerns with quantitative and objective data.

31
RECOMMENDATIONS Results of CTI’s evaluation, what if scenario development and the operator survey provide the basis for several study recommendations. 1. Decrease the number of consecutive days on. Long hours alone are
generally not fatigue inducing. However, long hours combined with night shift starts can significantly increase fatigue indices. As an initial step, it is recommended that the number of consecutive days off be reduced so that as a minimum at least two days off are provided for every seven days (i.e. two days off, five consecutive days worked).
2. Eliminate split shifts where a night shift is followed by a day shift
assignment. This recommendation follows up the previous recommendation. Again, it is not so much the number of consecutive hours, but whether the start times occurred at night and the consistency of start times in the day and evening. However, while better consistency of start times and elimination of one or two night starts was found to reduce fatigue, the reduction in fatigue indices was not found to be significant. Several combinations of scheduling that look at start times changes and number of consecutive hours worked should be examined further, both from fatigue index point of view and from actual reports of operators, to gain the maximum benefit of fatigue reduction.
3. Modify schedules so that personnel working nighttime shifts can be
shifted to days every other week. Nighttime starts are noted to be particularly fatigue inducing and the switch to days every other week can have very positive benefits on reducing fatigue.
4. Reduce the number of hours worked at night. Again, long hours in and of
itself may not be fatigue inducing, but working long nighttime hours can adversely affect alertness. To the extent possible, therefore, working long nighttime hours should be limited.
5. Engage in active discussions to comprehensively examine revamping
the Extra Board concept. Extra Board assignments provide the opportunity for rail operations personnel to earn additional pay and enable trains to operate on their required near 24/7 basis. However, it is these very assignments that produce the highest fatigue indices and are, according to the body of research, the most fatigue inducing. Therefore, the economic benefits and necessity of maintaining Extra Board assignments to NJ TRANSIT and its rail operations personnel must be balanced with potential safety risks associated with the host of fatigue related problems associated with Extra Board assignments. As a follow up to this study, it is also recommended that this issue be examined in further detail and that there be extensive dialogue with both the UTU and BLE so that an equitable balance can be achieved.

32
6. Define new rules and model. Finally, implementation of the
recommendations above would require defining new rules and a new model that results in reduced number of hours worked at night and moves shifts around to create more even pattern. Due to the complexity of assignments and work schedules, this would be achieved by effectively integrating a computer-based module that works interactively with existing schedule software.

33
APPENDIX A
Literature Review

34
LITERATURE REVIEW What is Fatigue? Traditionally, fatigue was viewed as a simple condition related to the amount of time spent working on a given task. (7) Scientific research, however, has shown that fatigue is related to much more than just the time on a task. (8) Researchers have studied factors that affect fatigue, such as duration and quality of sleep (9, 10, 11), shiftwork and work schedules (12, 13), circadian rhythms (14), and time of day. (15) Others have examined the influence of drugs and alcohol on fatigue and compared performance impaired by fatigue. (16, 17) Sleep disorders and the characteristics of sleep patterns at different ages have also been studied. (18, 19) Cumulative sleep loss and circadian disruption can lead to a physiological state characterized by impaired performance and diminished alertness. (20) Fatigue can impair information processing and reaction time, increasing the probability of errors and ultimately leading to transportation accidents. (21, 22)
Causes and Remedies of Fatigue: A USDOT/FRA report in 1991 identified causes of fatigue. (23) These are:
• uncertainty about the time of one’s next assignment,
• excessive working hours,
• long commutes and waiting times before beginning work,
• unsatisfactory conditions for sleeping at some terminals, and
• the decision not to rest during the day even when subject to call the next night.
Suggestions for remedying the situation included:
• a minimum of eight hours notice before being called to work,
• greater predictability in scheduling trains,
• division of assignments according to blocks of time. According to NTSB, about one-third of train accidents, employee injuries, and deaths are caused by human factors. (24) Accidents are attributed to a significant extent by the loss of alertness associated with fatigue. It has been reported that work and rest schedules of railroad and train crews are often more irregular and unpredictable than they are in other transportation modes.

35
Results Related to Fatigue and Rest in Occupational Setting Involving Continuous Operations A number of key findings have been summarized by various authors over the past few years relating to fatigue and rest in the occupational setting involving continuous operations. The following list was generated from a review of several articles published by Rosekind (25), Rosekind, et al. (26), Dinges and Kribbs (27) and Dinges (28). They are listed in the form of points to aid in grasping the significance of the findings. Those interested in a more detailed review of the findings should consult the original sources.
• Sleep deprivation results in cognitive performance deficits.
• Disruption of circadian rhythms leads to a decrease in performance.
• Human beings are not very good at estimating their current level of alertness.
• Repeated disruption of sleep schedules can lead to decreased performance.
• Sleep inertia can lead to performance decrements.
• Inability to get regular sleep may lead to disruption of the circadian rhythm.
• Short naps have been found to restore an individual’s capacity for performance under certain conditions.
• Time off alone may not guarantee a rested workforce. Education, planning, and predictability are needed to maximize utilization of work/rest schedules.
• With repeated loss of sleep a sleep debt builds up over time.
• With increased sleep loss and increased sleepiness a person may become vulnerable to performance problems.
• Quality of sleep is an important factor. Poor quality sleep can leave a person feeling fatigued and non-restored.
• There can be a discrepancy between how people are feeling and how sleepy they are physiologically.
• Scientific evidence suggests that being on an altered shift schedule, like nights, does not lead to an altered internal circadian pattern.
• Shift workers that go back and forth between shifts experience more difficulties between the circadian rhythms and sleep times.
• Moving a shift schedule forward involves easier physiological adaptations.

36
Effects of Sleep Loss and Sleepiness: The following conclusions regarding the effects of sleep loss and sleepiness were abstracted from several articles written by David Dinges of the University of Pennsylvania. (26, 27) They cover several aspects of research which are relevant to transportation operations.
1. Fatigue affects performance. Fatigue erodes performance such as vigilance, sustained attention.
• Four main processes affect performance decrements: circadian phase, acute sleep loss, cumulative sleep loss, and sleep inertia.
• Fatigue can cause lapses or micro sleeps.
• Night work which interferes with the circadian rhythm can cause lapses to increase 4 to 10 fold.
• The longer one is awake beyond 14-16 hours the greater the occurrence of lapses.
• Chronic under-sleeping creates a cumulative sleep debt, which can produce a cumulative increase in lapses on vigilance tasks.
• Sleep inertia creates lapses.
2. Fatigue produces a variety of performance decrements:
• performance variability,
• slowed physical and mental reaction time,
• increase in number of work related errors,
• increased tendency to persistently repeat behaviors,
• increase in false responding,
• increases memory errors,
• decreased vigilance, and
• reduced motivation and laxity.
3. Magnitude of fatigue effects vary by individual This limited review should serve to alert readers that the "science of fatigue and alertness" is still in its infancy. Those looking for definitive "proof" of a particular point of view are likely to be disappointed. The results of investigations to this point can only be used to generate basic guidelines to follow in developing fatigue countermeasures.
The railroad industry must actively manage employee fatigue and alertness problems to maintain an optimal level of operational safety and productivity.

37
Given the necessity to operate nights and irregular hours, weekends and holidays under a wide range of physical conditions and service demands, we must explore every reasonable avenue to ensure employees are fit, alert, and well-rested. Effective fatigue management programs must address train crews, dispatchers, signalmen, track workers, and others - both operating and non-operating personnel. Work scheduling is a particular problem in on-call operations because of start-time variability, "call" predictability, and the common use of "shorter-than 24-h work/rest schedules". (29) In a 1999 speech, US Secretary of Transportation Rodney Slater stated, " We know that alertness is a key to safe vehicle operation. To reduce crashes and accidents and their personal and financial consequences, we need to ensure that vehicle operators are ready and capable of operating their vehicles or other transportation equipment". In testimony before the Senate Subcommittee on Surface Transportation and Merchant Marine 22 on 16 September 1998, the Administrator of the Federal Railroad Administration (FRA), Jolene Molitoris, stated, "About one-third of train accidents and employee injuries and deaths are caused by human factors. We know fatigue underlies many of them". The (US) Hours of Service Act (law)
• Enacted in 1907 and revised in 1969,
• Intended to promote the safety of employees and travelers upon railroads by limiting the hours of service of certain railroad employees.
As per Section 2 (45 United States Code Section 62), for "train and engine service",
• An employee may not be required or allowed to remain or go on duty after 12 continuous hours on duty, or 12 h in broken service in a 24-h period starting at beginning of work tour; or at the end of that 24-h period, if there has not been at least eight consecutive hours of off duty time even if the employee had fewer than 12 h on duty. The minimum off-duty periods are 8 or 10 consecutive hours, depending on whether 12 continuous hours were worked. There is a 4-hour minimum for interim rest period.
There are several aspects of railroad operations that can cause fatigue and alertness problems:
• the irregularity of work schedules in freight operations,
• the need for split-shifts in commuter and urban operations, and
38
• the high potential for complacency and boredom in some freight operations. (29)
Major Concerns for Freight Operation Crews
• Scheduling based on the availability of goods, the availability of crew and rolling stock, and the priority on delivery time.
• Higher proportion of night operations.
• Irregularity and unpredictability of shift start time
• Factors such as weather, equipment breakdown, and maintenance-of-way problems also result in irregular work schedule completion.
• Some freight runs include long grades where the train moves at very slow speed for hour after hour and the crew has almost nothing to do resulting into boredom. (29)
Humans normally have regular circadian rhythms. One major role of these rhythms is to regulate the time of sleep onset. These rhythms are entrained about the normal 24-h diurnal cycle. Disruption by a factor such as work schedule can seriously limit the ability of an engineer to achieve adequate sleep. (29)
Freight engineers face a number of challenges in getting adequate sleep. Their schedules are both irregular and unpredictable. Work schedules are not likely to coincide with the worker's circadian rhythms or with the schedules of their families or communities. Finally nights spent away from home are sometimes spent in uncomfortable and noisy bunkhouses. (29) Major Concerns for Passenger Train Crews
• While passenger train crews usually have regular and predictable schedules and sleep at home more often, they too face challenges in getting adequate rest.
• Crews involved in commuter operations are often required to work a split shift. Split shift schedules (even those allowed under the Hours of Service Act) impact the ability of the train crew to get appropriate rest. They can result in situations where individuals can work far more than 12 h in a 24-h period without an adequate sleep period.(29)

39
Causes for Mental Lapses Affecting Alertness or Vigilance Resulting in Unsafe Performance
• Reduced sleep or physical or mental fatigue,
• Lack of stimulation,
• Cognitive under-load or overload,
• Repetitiveness. Engineers often operate over the same territory over years or decades. This repetitiveness can breed complacency because the engineer is likely to encounter the same signal conditions run after run. A change in a critical signal may go undetected. (29)
Alerters The dangers of accidents caused by non-alert, incapacitated, or sleeping train crews have been evident from the beginning of railroading, but measuring, or even detecting, reduced alertness in revenue service has been very difficult. Alerters are used to alert the engineers. Alerters function by detecting activities made by the engineer. They are based on the idea that a non-responding engineer is likely to be an incapacitated engineer. Failure to touch the alerter or in some systems to touch the operating controls is taken as an indication that the engineer is asleep or otherwise indisposed. In general, if the engineer fails to provide a measurable movement within a preset time, an alarm goes off. If no appropriate movement occurs in response to the alarm, a penalty brake application is made. (29) Shortcomings of Alerters
• In learning to work with an alerter the engineer has learned to take a periodic action in the absence of a stimulus. Such movements are certainly possible at very low states of arousal.
• Alerters can be designed to require that an engineer make a timely response to a stimulus, but there is concern that systems that require even moderately complex responses may distract the engineer from planning or conducting cognitive activities critical for safety.(29)
Positive Train Control (PTC) Systems: The future holds the potential for significant improvement in preventing fatigue-related problems. One emerging factor that can alleviate many fatigue-related problems is the adoption of positive train control (PTC) systems. As PTC is perfected and comes on line, the regularity and predictability of train movements should improve markedly. The detection of the onset of diminished alertness will also become more practical. This will be possible because data will be available on the actual performance of the train and the train operator. In theory, real time monitoring, and recording of this data stream, would allow a comparison of the locomotive operators' actual performance with the expected performance of the engineer for a given train, train position, route, and operating

40
conditions. If the performance of the train is substandard (falls outside anticipated boundaries), it will be detected that the engineer is impaired. (29)
Fatigue Management: Lessons from Research A study (2) on 221 serious truck accidents conducted by American Automotive Association in 1985, estimated that fatigue was the primary cause in 40% of the accidents and a contributing cause in 60% of the total accidents. Here serious accident meant that the truck had to be towed from the scene of the accident. Many physiological functions, as well as mental alertness, follow a general pattern of rising during the day and falling during the night. Performance, particularly on vigilance tasks, is the poorest in the early morning hours- 2:00 to 6:00 a.m. It coincides with the pattern of circadian rhythm which suggests that the early morning hours are around the circadian low point. Our circadian rhythm is kept to a 24 hour cycle by time-givers: namely, the rising and setting of the sun, knowledge of clock time, and work time. When a person works at night, the circadian rhythm will adjust so that physiological activity is higher during the work period, and lower during sleep. However, this adjustment is slow, taking up to 10 days, and incomplete, because the usual time giving cues of sun rising and setting and work time are in conflict with one another (30). The performance rhythms adjust only partially. The data collected by Kogi (31), suggests that most sleep is obtained when sleep is initiated in the evening around 9:00 p.m. It decreases if initiated after 1:00 a.m. The sleep amount is least if it is initiated in the afternoon. Sleep obtained at the optimum time of day typically lasts 7.5-8 hours. Guidelines for regulators, managers, and drivers:
• Driving should be avoided during the circadian low point of the day (2:00-6:00 a.m.).
• If driving must be done during this period, it is critical that drivers be well-rested and that they not enter this time period towards the end of a long trip.
• Rest is most restorative it taken starting 9:00 p.m. to 1:00 a.m. • Since daytime sleep is shorter and poorer quality than night sleep, drivers
working at night should avoid successive night shifts. • Drivers are poor judges of their own condition. Hence others should be
involved in the determination of whether a driver is adequately rested. Fatigue Data Collection: Like most industries, consistent and reliable fatigue data is often lacking in the railroad industry.( 29)

41
Because there is limited fatigue-related data available for conducting good quality statistical analyses, the Federal Railroad Administration (FRA) is planning to modify its incident reporting system to include fatigue related factors. FRA is also planning to modify its incident investigation methods and training to recognize fatigue as a possible contributing factor to incidents. Efforts are also being made to evaluate the feasibility of developing a near-miss incident reporting system in the railroad industry. For every actual incident, many more near-miss incidents occur. This way with a larger database assumptions can be minimized, additional analyses can be made, and results can be interpreted with a greater amount of confidence. FRA’s Office of Research and Development (OR&D) has begun a project to develop a database of railroad work schedules so that ergonomic assessments and comparisons of different work schedules on fatigue and performance can be conducted. Event recorders on locomotives record most performance activity, including speed, throttle position, dynamic braking, air braking etc. Hence these devices may be a useful source of data for evaluating the effects of different pilot projects on fatigue. OR&D also collects fatigue data from other sources like structured interviews, surveys, focus groups, work/rest activity diaries, wrist actigraphs, meta-analysis, naturalistic observations, cognitive task analysis, and literature reviews. OR&D has compiled a comprehensive bibliography of scientific research on fatigue in railroad operations which is available on the FRA website. http://www.volpe.dot.gov/frarnd/rndpubs.htm Research is being conducted in four major areas to develop valid and reliable tools that can aid in the measurement of fatigue and its effects on operational performance:
1. Cognitive workload, task load, and performance modeling, 2. Job analysis and staffing analysis, 3. Work schedule evaluation, and 4. Locomotive simulator experiments.
Fatigue Countermeasure Strategies: NARAP(North American Rail Alertness Partnership) has identified eight key components for an effective countermeasure program in its North American Rail Alertness Partnership strategic plan (1997).
1. Education and training, 2. Employee scheduling practices,

42
3. Emergency response requirements, 4. Alertness strategies, 5. Evaluation of policies and procedures, 6. Adequate rest environment, 7. Work environment, and 8. Implementation strategies.

43
APPENDIX B
October 27 Fatigue Assessment Report

New Jersey TransitFatigue Risk
Report
Assignments for 27th October 2002
19 December 2002
44

Introduction
• CTI conducted an analysis of Conductor and Engineer assignments from the October 27th bid. The results of the analysis are summarized in this Fatigue Risk Report.
• This report provides the overall fatigue index for New Jersey Transit conductors and engineers, and the fatigue indices by terminal.
• The purpose of this report is to serve as a benchmark of fatigue indices for assessment of assignments, both between terminals and for comparison to future modeled assignments.
45
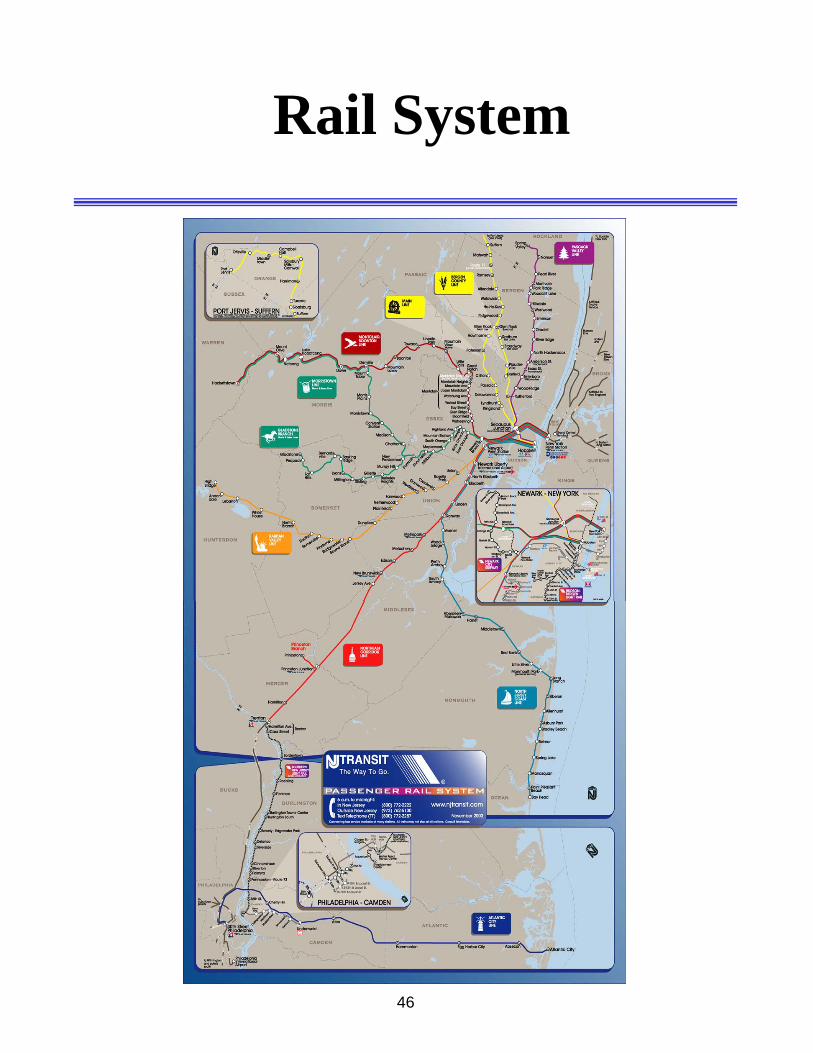
Rail System
46
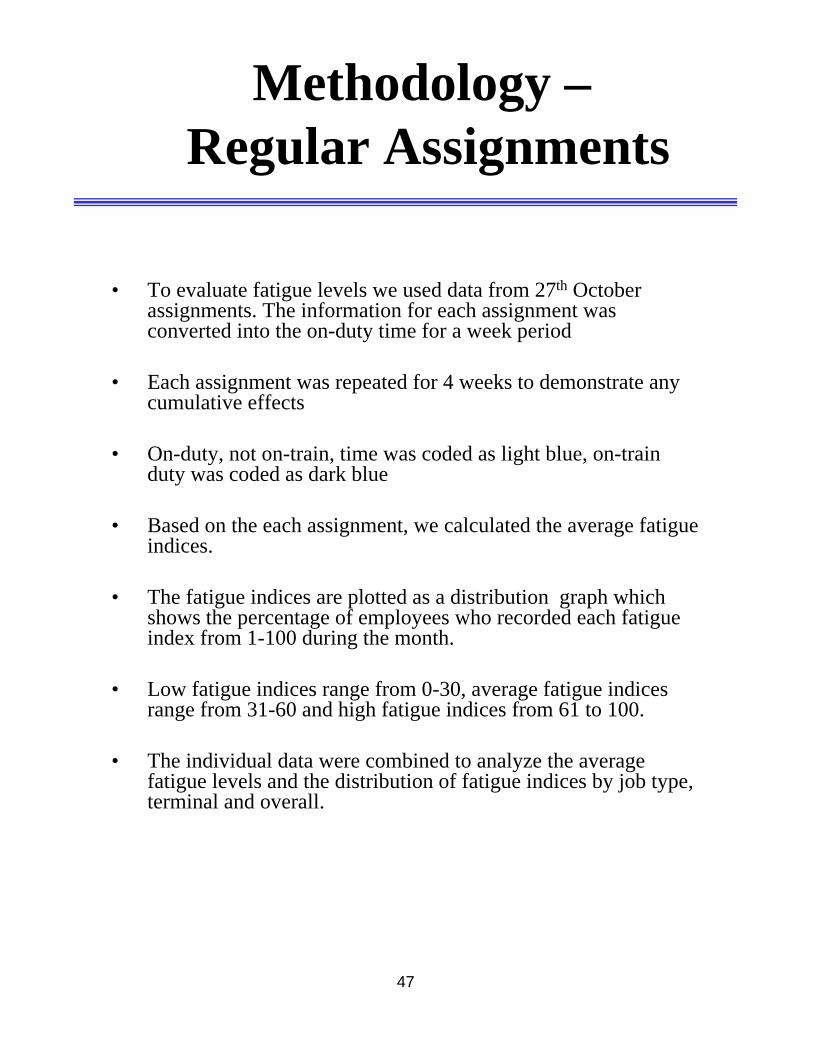
Methodology –Regular Assignments
• To evaluate fatigue levels we used data from 27th October assignments. The information for each assignment was converted into the on-duty time for a week period
• Each assignment was repeated for 4 weeks to demonstrate any cumulative effects
• On-duty, not on-train, time was coded as light blue, on-train duty was coded as dark blue
• Based on the each assignment, we calculated the average fatigue indices.
• The fatigue indices are plotted as a distribution graph which shows the percentage of employees who recorded each fatigue index from 1-100 during the month.
• Low fatigue indices range from 0-30, average fatigue indices range from 31-60 and high fatigue indices from 61 to 100.
• The individual data were combined to analyze the average fatigue levels and the distribution of fatigue indices by job type, terminal and overall.
47

MethodologyParameters Evaluated
• Fatigue Index• Shift Start Time• Shift End Time• Shift Duration• Time Off Between Shifts• Time Off Between Shift Starts• Consecutive Scheduled Days On (Day on is
a day with a shift start)• Consecutive Scheduled Days Off (Day off
is a day without a shift start)• Consecutive Nights Off Between Shift
Blocks (Night Off is defined as an 8-hour period without work between 10 pm and 8 am)
48

Sample Assignment Data - One Person
Activity Data for: ONYE10EN
Time of Day00:0023:0022:0021:0020:0019:0018:0017:0016:0015:0014:0013:0012:0011:0010:0009:0008:0007:0006:0005:0004:0003:0002:0001:0000:00
Dat
e
1/2/2003
1/4/2003
1/6/2003
1/8/2003
1/10/2003
1/12/2003
1/14/2003
1/16/2003
1/18/2003
1/20/2003
1/22/2003
1/24/2003
1/26/2003
1/28/2003
1/8/2003
1/15/2003
1/22/2003
1/29/2003
1/3/2003
1/5/2003
1/7/2003
1/10/2003
1/12/2003
1/14/2003
1/17/2003
1/19/2003
1/21/2003
1/24/2003
1/26/2003
1/28/2003
1/3/2003
1/5/2003
1/10/2003
1/12/2003
1/17/2003
1/19/2003
1/24/2003
1/26/2003
1/7/2003
1/14/2003
1/21/2003
1/28/2003
1/3/2003
1/5/2003
1/10/2003
1/12/2003
1/17/2003
1/19/2003
1/24/2003
1/26/2003
1/3/2003
1/5/2003
1/10/2003
1/12/2003
1/17/2003
1/19/2003
1/24/2003
1/26/2003
1/7/2003
1/14/2003
1/21/2003
1/28/2003
1/2/2003
1/8/2003
1/15/2003
1/22/2003
1/29/2003
1/7/2003
1/14/2003
1/21/2003
1/28/2003
1/3/2003
1/5/2003
1/10/2003
1/12/2003
1/17/2003
1/19/2003
1/24/2003
1/26/2003
1/3/2003
1/5/2003
1/10/2003
1/12/2003
1/17/2003
1/19/2003
1/24/2003
1/26/2003
1/7/2003
1/14/2003
1/21/2003
1/28/2003
1/7/2003
1/14/2003
1/21/2003
1/28/2003
1/3/2003
1/10/2003
1/17/2003
1/24/2003
1/5/2003
1/12/2003
1/19/2003
1/26/2003
1/6/2003
1/13/2003
1/20/2003
1/27/2003
1/4/2003
1/11/2003
1/18/2003
1/25/2003
1/7/2003
1/14/2003
1/21/2003
1/28/2003
1/3/2003
1/10/2003
1/17/2003
1/24/2003
1/4/2003
1/6/2003
1/11/2003
1/13/2003
1/18/2003
1/20/2003
1/25/2003
1/27/2003
1/7/2003
1/14/2003
1/21/2003
1/28/2003
1/2/2003
1/4/2003
1/6/2003
1/9/2003
1/11/2003
1/13/2003
1/16/2003
1/18/2003
1/20/2003
1/23/2003
1/25/2003
1/27/2003
1/2/2003
1/4/2003
1/6/2003
1/9/2003
1/11/2003
1/13/2003
1/16/2003
1/18/2003
1/20/2003
1/23/2003
1/25/2003
1/27/2003
1/2/2003
1/4/2003
1/6/2003
1/9/2003
1/11/2003
1/13/2003
1/16/2003
1/18/2003
1/20/2003
1/23/2003
1/25/2003
1/27/2003
1/8/2003
1/15/2003
1/22/2003
1/29/2003
1/2/2003
1/4/2003
1/6/2003
1/9/2003
1/11/2003
1/13/2003
1/16/2003
1/18/2003
1/20/2003
1/23/2003
1/25/2003
1/27/2003
1/2/2003
1/4/2003
1/6/2003
1/8/2003
1/10/2003
1/12/2003
1/14/2003
1/16/2003
1/18/2003
1/20/2003
1/22/2003
1/24/2003
1/26/2003
1/28/2003
1/7/2003
1/14/2003
1/21/2003
1/28/2003
1/2/2003
1/4/2003
1/6/2003
1/9/2003
1/11/2003
1/13/2003
1/16/2003
1/18/2003
1/20/2003
1/23/2003
1/25/2003
1/27/2003
1/2/2003
1/4/2003
1/9/2003
1/11/2003
1/16/2003
1/18/2003
1/23/2003
1/25/2003
1/6/2003
1/13/2003
1/20/2003
1/27/2003
1/2/2003
1/4/2003
1/9/2003
1/11/2003
1/16/2003
1/18/2003
1/23/2003
1/25/2003
1/2/2003
1/4/2003
1/9/2003
1/11/2003
1/16/2003
1/18/2003
1/23/2003
1/25/2003
1/6/2003
1/13/2003
1/20/2003
1/27/2003
1/7/2003
1/14/2003
1/21/2003
1/28/2003
1/6/2003
1/13/2003
1/20/2003
1/27/2003
1/2/2003
1/4/2003
1/9/2003
1/11/2003
1/16/2003
1/18/2003
1/23/2003
1/25/2003
1/2/2003
1/4/2003
1/9/2003
1/11/2003
1/16/2003
1/18/2003
1/23/2003
1/25/2003
1/6/2003
1/13/2003
1/20/2003
1/27/2003
1/6/2003
1/13/2003
1/20/2003
1/27/2003
1/2/2003
1/9/2003
1/16/2003
1/23/2003
1/4/2003
1/11/2003
1/18/2003
1/25/2003
1/5/2003
1/12/2003
1/19/2003
1/26/2003
1/3/2003
1/10/2003
1/17/2003
1/24/2003
1/6/2003
1/13/2003
1/20/2003
1/27/2003
1/2/2003
1/9/2003
1/16/2003
1/23/2003
1/3/2003
1/5/2003
1/10/2003
1/12/2003
1/17/2003
1/19/2003
1/24/2003
1/26/2003
1/6/2003
1/13/2003
1/20/2003
1/27/2003
1/2/2003
1/4/2003
1/8/2003
1/10/2003
1/12/2003
1/15/2003
1/17/2003
1/19/2003
1/22/2003
1/24/2003
1/26/2003
1/2/2003
1/4/2003
1/8/2003
1/10/2003
1/12/2003
1/15/2003
1/17/2003
1/19/2003
1/22/2003
1/24/2003
1/26/2003
1/2/2003
1/4/2003
1/8/2003
1/10/2003
1/12/2003
1/15/2003
1/17/2003
1/19/2003
1/22/2003
1/24/2003
1/26/2003
1/7/2003
1/14/2003
1/21/2003
1/28/2003
1/2/2003
1/4/2003
1/8/2003
1/10/2003
1/12/2003
1/15/2003
1/17/2003
1/19/2003
1/22/2003
1/24/2003
1/26/2003
• On-duty, not on-train, time was coded as light blue, on-train duty was coded as dark blue
• White is off-duty awake• Black is where the software program has
predicted sleep• Program allows for 90 minutes either side
of work where sleep is not allowed
49
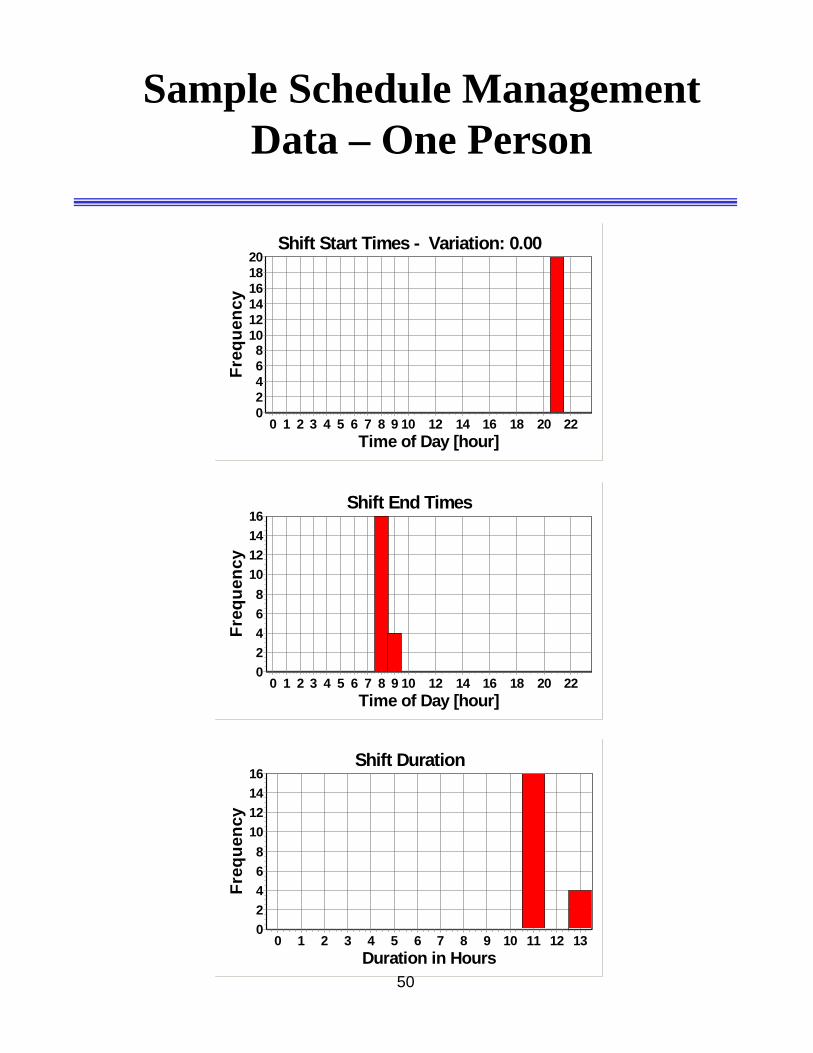
Sample Schedule Management Data – One Person
Shift Start Times - Variation: 0.00
Time of Day [hour]0 1 2 3 4 5 6 7 8 9 10 12 14 16 18 20 22
Freq
uenc
y20181614121086420
Shift End Times
Time of Day [hour]0 1 2 3 4 5 6 7 8 9 10 12 14 16 18 20 22
Freq
uenc
y
1614121086420
Shift Duration
Duration in Hours0 1 2 3 4 5 6 7 8 9 10 11 12 13
Freq
uenc
y
1614121086420
50

Sample Schedule Management Data – One Person
Time Off between Shifts
Time Off in Hours50403020100
Freq
uenc
y
1614121086420
Time between Shift Starts
Time in Hours706050403020100
Freq
uenc
y 12
6
0
51

Sample Schedule Management Data – One Person
Consecutive Days On
# of Days0 1 2 3 4 5
Freq
uenc
y2
1
0
Consecutive Days Off
# of Days0 1 2
Freq
uenc
y
3
2
1
0
Consecutive Nights Off between Shift Blocks
# of Nights0 1 2
Freq
uenc
y
6
5
4
3
2
1
0
52

Alertness Curve and Fatigue Index
• Schedule and sleep pattern combine to produce alertness curve for any given time over month
• Alertness plus other factors combine to produce a fatigue index
• This person has a fatigue index of 81.6 (very high)
53

Methodology –Extra Board Assignments
• To evaluate fatigue levels we used data from Timera system. The information for each person was converted into the on-duty time for the month of November.
• On-duty time was coded dark blue. Information about on-train time was not collected.
• Based on the each assignment, we calculated the average fatigue indices.
• The fatigue indices are plotted as described before
54

Summary of Results Overall
• 290 Conductor Assignments• 260 Engineer Assignments• 112 Extra Board People
55

Regular Assignments
56

Summary of Results Overall –Regular Assignments
• The average fatigue index for conductors was (all terminals) 29.4
• The average fatigue index for engineers was (all terminals) 29.5
• The percentage of conductors and engineers with low fatigue indices (30 or lower) was 65.8%
• The percentage of conductors and engineers with high fatigue indices (60 or higher) was 11.1%
57

Summary of Results: Schedule Management Data –
Regular Assignments
• Shift starts: The peak times for shift starts are between 4am and 7am, and 1pm and 5pm.
• Shift Duration: Most shifts last between 9 and 11 hours, with some lasting 13 hours (presumably in utilizing a split shift arrangement - time during split shifts was counted as on-duty for the purposes of the fatigue assessment.
• Scheduled days on/off: All assignments (excluding Z assignments) are a consecutive block of 5 days with 2 off.
• Scheduled Nights off: A night off is defined as a period of time off between 10pm and 8am the next morning. All assignments had at least 2 consecutive nights off.
58

Distribution of Fatigue Indices for All Engineers
Histogram of Fatigue Indexmean: 29.50 std_dev: 20.65 std_err: 1.28
Fatigue Index1009080706050403020100
Freq
uenc
y in
Per
cent
5
4
3
2
1
0
• Combination of all engineer fatigue indices• Low fatigue is less than 30, medium 30 to 60, and
high over 60• Y axis is percent of engineers who have that fatigue
index
59

Schedule Management Data : All Engineers
Shift Start Times
Time of Day [hour]0 1 2 3 4 5 6 7 8 9 10 12 14 16 18 20 22
Freq
uenc
y900800700600500400300200100
0
Shift End Times
Time of Day [hour]0 1 2 3 4 5 6 7 8 9 10 12 14 16 18 20 22
Freq
uenc
y
500
400
300
200
100
0
Shift Duration
Duration in Hours0 1 2 3 4 5 6 7 8 9 10 11 12 13 14
Freq
uenc
y
1,000
800
600
400
200
0
60

Schedule Management Data : All Engineers
Time Off between Shifts
Time Off in Hours6050403020100
Freq
uenc
y
700600500400300200100
0
Time between Shift Starts
Time in Hours706050403020100
Freq
uenc
y
3,5003,0002,5002,0001,5001,000
5000
61
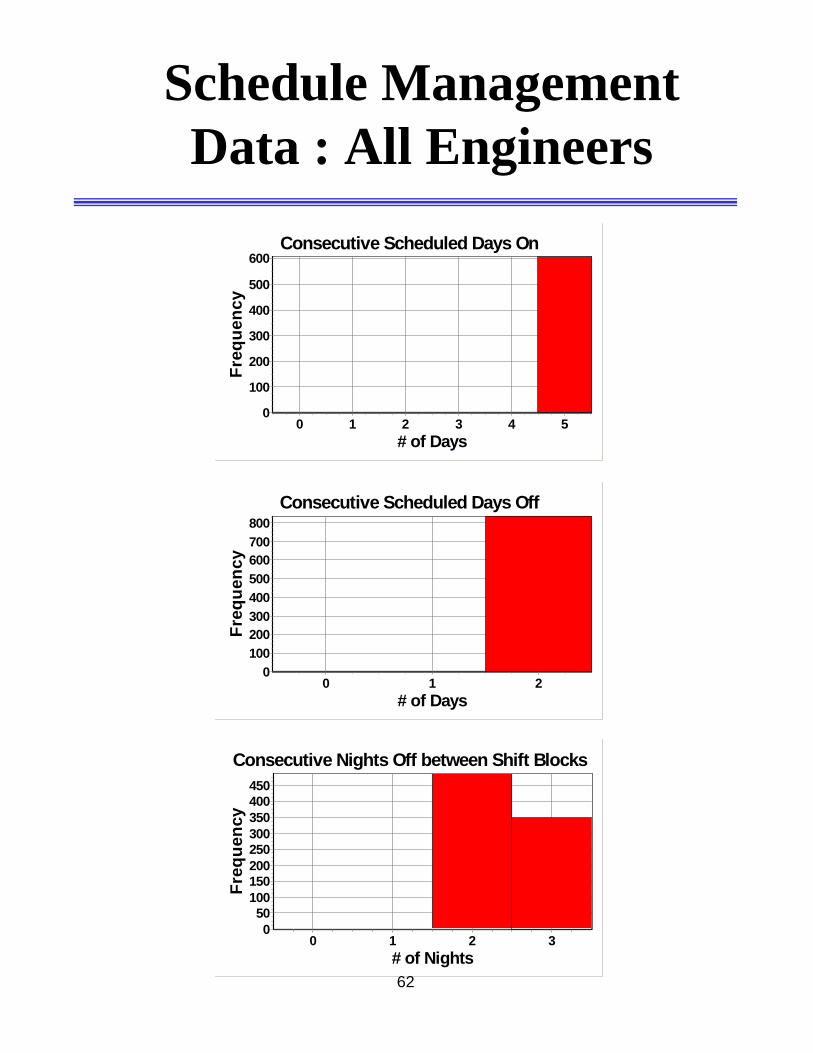
Schedule Management Data : All Engineers
Consecutive Scheduled Days On
# of Days0 1 2 3 4 5
Freq
uenc
y600
500
400
300
200
100
0
Consecutive Scheduled Days Off
# of Days0 1 2
Freq
uenc
y
800700600500400300200100
0
Consecutive Nights Off between Shift Blocks
# of Nights0 1 2 3
Freq
uenc
y
450400350300250200150100500
62
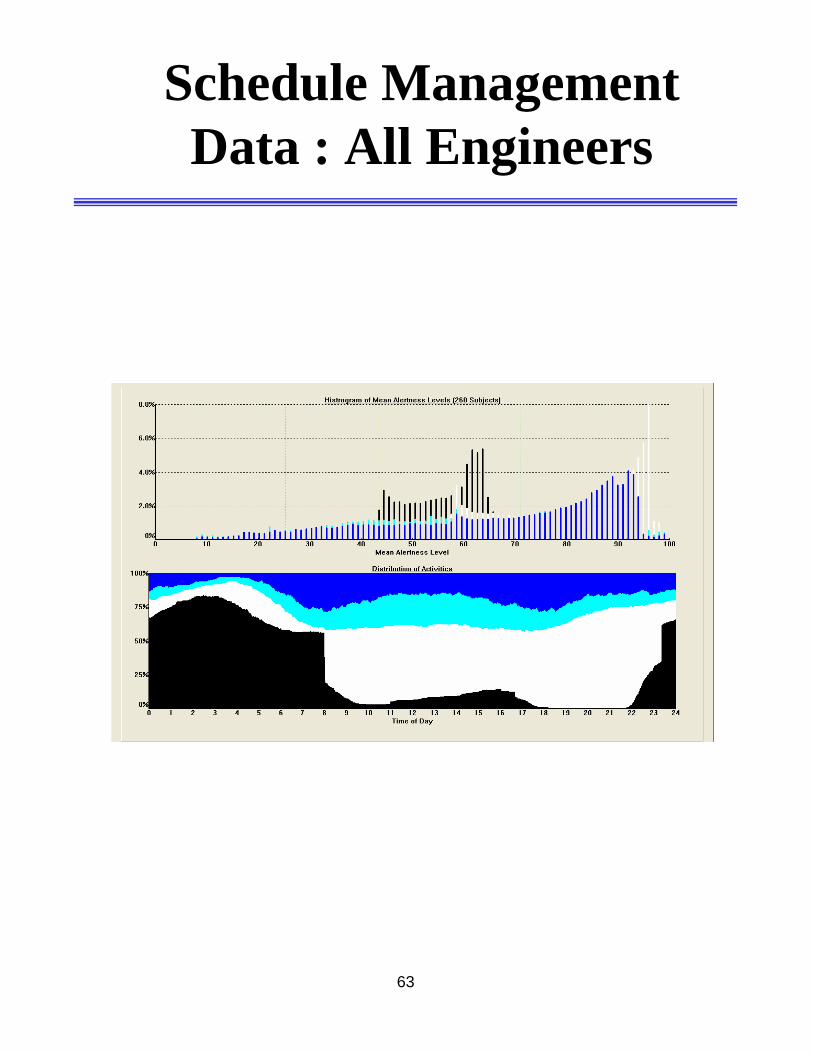
Schedule Management Data : All Engineers
63
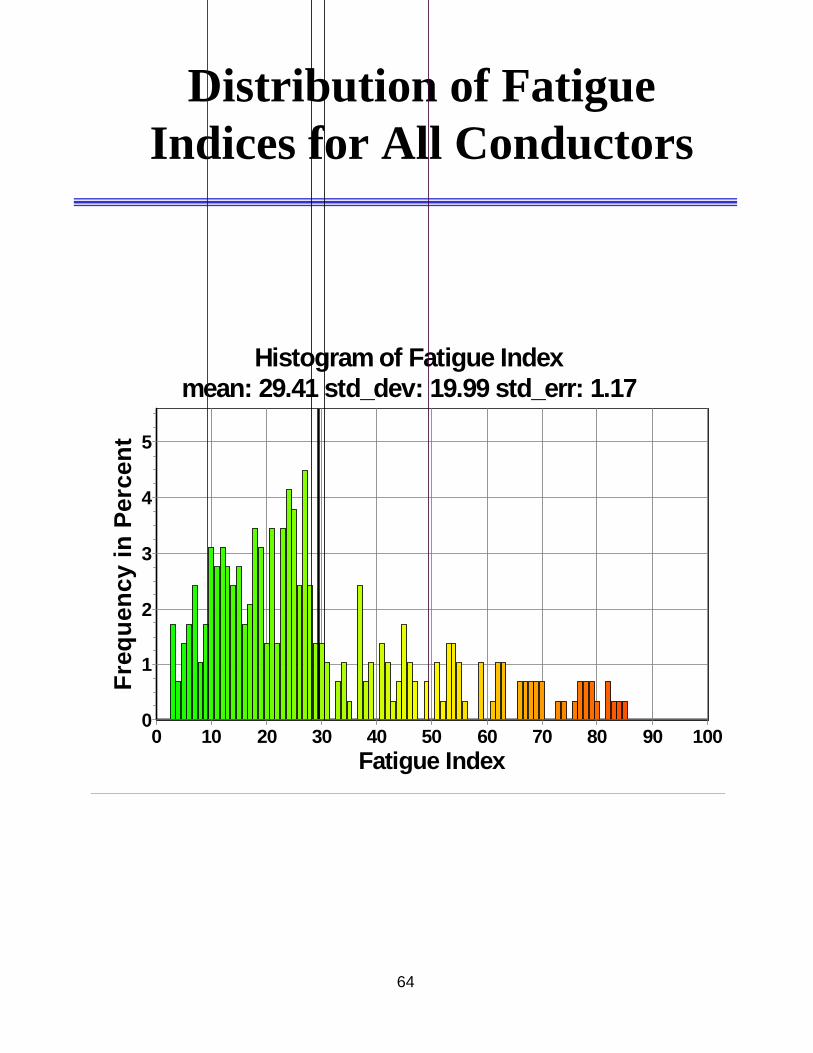
Distribution of Fatigue Indices for All Conductors
Histogram of Fatigue Indexmean: 29.41 std_dev: 19.99 std_err: 1.17
Fatigue Index1009080706050403020100
Freq
uenc
y in
Per
cent 5
4
3
2
1
0
64

Schedule Management Data : All Conductors
Shift Start Times
Time of Day [hour]0 1 2 3 4 5 6 7 8 9 10 12 14 16 18 20 22
Freq
uenc
y
1,000
800
600
400
200
0
Shift End Times
Time of Day [hour]0 1 2 3 4 5 6 7 8 9 10 12 14 16 18 20 22
Freq
uenc
y
600
500
400
300
200
100
0
Shift Duration
Duration in Hours0 1 2 3 4 5 6 7 8 9 10 11 12 13 14
Freq
uenc
y
1,200
1,000
800
600
400
200
0
65

Schedule Management Data : All Conductors
Time Off between Shifts
Time Off in Hours6050403020100
Freq
uenc
y
900800700600500400300200100
0
Time between Shift Starts
Time in Hours706050403020100
Freq
uenc
y
4,0003,5003,0002,5002,0001,5001,000
5000
66

Schedule Management Data : All Conductors
Consecutive Scheduled Days On
# of Days0 1 2 3 4 5
Freq
uenc
y
600
500
400
300
200
100
0
Consecutive Scheduled Days Off
# of Days0 1 2
Freq
uenc
y
900800700600500400300200100
0
Consecutive Nights Off between Shift Blocks
# of Nights0 1 2 3
Freq
uenc
y
500
400
300
200
100
0
67

Schedule Management Data : All Conductors
68

High Fatigue Index: ONYE10EN
Activity Data for: ONYE10EN
Time of Day00:0023:0022:0021:0020:0019:0018:0017:0016:0015:0014:0013:0012:0011:0010:0009:0008:0007:0006:0005:0004:0003:0002:0001:0000:00
Dat
e
1/2/2003
1/4/2003
1/6/2003
1/8/2003
1/10/2003
1/12/2003
1/14/2003
1/16/2003
1/18/2003
1/20/2003
1/22/2003
1/24/2003
1/26/2003
1/28/2003
1/8/2003
1/15/2003
1/22/2003
1/29/2003
1/3/2003
1/5/2003
1/7/2003
1/10/2003
1/12/2003
1/14/2003
1/17/2003
1/19/2003
1/21/2003
1/24/2003
1/26/2003
1/28/2003
1/3/2003
1/5/2003
1/10/2003
1/12/2003
1/17/2003
1/19/2003
1/24/2003
1/26/2003
1/7/2003
1/14/2003
1/21/2003
1/28/2003
1/3/2003
1/5/2003
1/10/2003
1/12/2003
1/17/2003
1/19/2003
1/24/2003
1/26/2003
1/3/2003
1/5/2003
1/10/2003
1/12/2003
1/17/2003
1/19/2003
1/24/2003
1/26/2003
1/7/2003
1/14/2003
1/21/2003
1/28/2003
1/2/2003
1/8/2003
1/15/2003
1/22/2003
1/29/2003
1/7/2003
1/14/2003
1/21/2003
1/28/2003
1/3/2003
1/5/2003
1/10/2003
1/12/2003
1/17/2003
1/19/2003
1/24/2003
1/26/2003
1/3/2003
1/5/2003
1/10/2003
1/12/2003
1/17/2003
1/19/2003
1/24/2003
1/26/2003
1/7/2003
1/14/2003
1/21/2003
1/28/2003
1/7/2003
1/14/2003
1/21/2003
1/28/2003
1/3/2003
1/10/2003
1/17/2003
1/24/2003
1/5/2003
1/12/2003
1/19/2003
1/26/2003
1/6/2003
1/13/2003
1/20/2003
1/27/2003
1/4/2003
1/11/2003
1/18/2003
1/25/2003
1/7/2003
1/14/2003
1/21/2003
1/28/2003
1/3/2003
1/10/2003
1/17/2003
1/24/2003
1/4/2003
1/6/2003
1/11/2003
1/13/2003
1/18/2003
1/20/2003
1/25/2003
1/27/2003
1/7/2003
1/14/2003
1/21/2003
1/28/2003
1/2/2003
1/4/2003
1/6/2003
1/9/2003
1/11/2003
1/13/2003
1/16/2003
1/18/2003
1/20/2003
1/23/2003
1/25/2003
1/27/2003
1/2/2003
1/4/2003
1/6/2003
1/9/2003
1/11/2003
1/13/2003
1/16/2003
1/18/2003
1/20/2003
1/23/2003
1/25/2003
1/27/2003
1/2/2003
1/4/2003
1/6/2003
1/9/2003
1/11/2003
1/13/2003
1/16/2003
1/18/2003
1/20/2003
1/23/2003
1/25/2003
1/27/2003
1/8/2003
1/15/2003
1/22/2003
1/29/2003
1/2/2003
1/4/2003
1/6/2003
1/9/2003
1/11/2003
1/13/2003
1/16/2003
1/18/2003
1/20/2003
1/23/2003
1/25/2003
1/27/2003
1/2/2003
1/4/2003
1/6/2003
1/8/2003
1/10/2003
1/12/2003
1/14/2003
1/16/2003
1/18/2003
1/20/2003
1/22/2003
1/24/2003
1/26/2003
1/28/2003
1/7/2003
1/14/2003
1/21/2003
1/28/2003
1/2/2003
1/4/2003
1/6/2003
1/9/2003
1/11/2003
1/13/2003
1/16/2003
1/18/2003
1/20/2003
1/23/2003
1/25/2003
1/27/2003
1/2/2003
1/4/2003
1/9/2003
1/11/2003
1/16/2003
1/18/2003
1/23/2003
1/25/2003
1/6/2003
1/13/2003
1/20/2003
1/27/2003
1/2/2003
1/4/2003
1/9/2003
1/11/2003
1/16/2003
1/18/2003
1/23/2003
1/25/2003
1/2/2003
1/4/2003
1/9/2003
1/11/2003
1/16/2003
1/18/2003
1/23/2003
1/25/2003
1/6/2003
1/13/2003
1/20/2003
1/27/2003
1/7/2003
1/14/2003
1/21/2003
1/28/2003
1/6/2003
1/13/2003
1/20/2003
1/27/2003
1/2/2003
1/4/2003
1/9/2003
1/11/2003
1/16/2003
1/18/2003
1/23/2003
1/25/2003
1/2/2003
1/4/2003
1/9/2003
1/11/2003
1/16/2003
1/18/2003
1/23/2003
1/25/2003
1/6/2003
1/13/2003
1/20/2003
1/27/2003
1/6/2003
1/13/2003
1/20/2003
1/27/2003
1/2/2003
1/9/2003
1/16/2003
1/23/2003
1/4/2003
1/11/2003
1/18/2003
1/25/2003
1/5/2003
1/12/2003
1/19/2003
1/26/2003
1/3/2003
1/10/2003
1/17/2003
1/24/2003
1/6/2003
1/13/2003
1/20/2003
1/27/2003
1/2/2003
1/9/2003
1/16/2003
1/23/2003
1/3/2003
1/5/2003
1/10/2003
1/12/2003
1/17/2003
1/19/2003
1/24/2003
1/26/2003
1/6/2003
1/13/2003
1/20/2003
1/27/2003
1/2/2003
1/4/2003
1/8/2003
1/10/2003
1/12/2003
1/15/2003
1/17/2003
1/19/2003
1/22/2003
1/24/2003
1/26/2003
1/2/2003
1/4/2003
1/8/2003
1/10/2003
1/12/2003
1/15/2003
1/17/2003
1/19/2003
1/22/2003
1/24/2003
1/26/2003
1/2/2003
1/4/2003
1/8/2003
1/10/2003
1/12/2003
1/15/2003
1/17/2003
1/19/2003
1/22/2003
1/24/2003
1/26/2003
1/7/2003
1/14/2003
1/21/2003
1/28/2003
1/2/2003
1/4/2003
1/8/2003
1/10/2003
1/12/2003
1/15/2003
1/17/2003
1/19/2003
1/22/2003
1/24/2003
1/26/2003
69
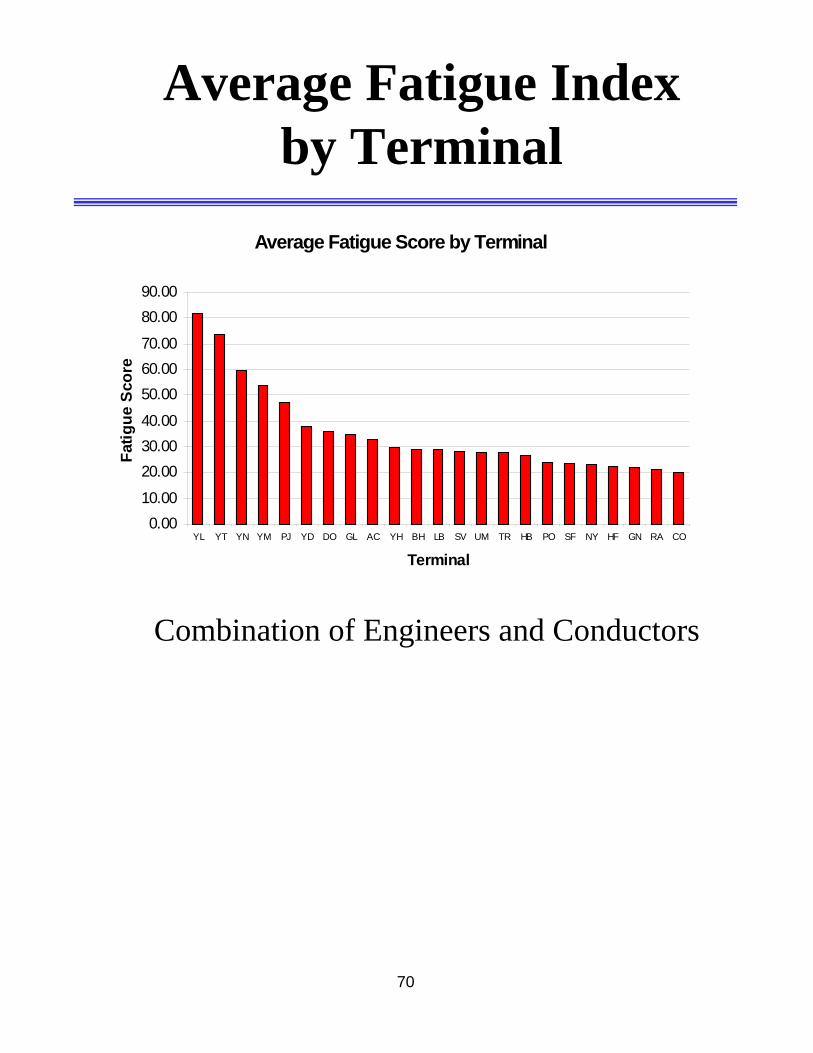
Average Fatigue Index by Terminal
Average Fatigue Score by Terminal
0.0010.00
20.0030.0040.00
50.0060.0070.00
80.0090.00
YL YT YN YM PJ YD DO GL AC YH BH LB SV UM TR HB PO SF NY HF GN RA CO
Terminal
Fatig
ue S
core
Combination of Engineers and Conductors
70

High Fatigue Assignments (>60)
Shift Start Times
Time of Day [hour]0 1 2 3 4 5 6 7 8 9 10 12 14 16 18 20 22
Freq
uenc
y
250
200
150
100
50
0
Histogram of Fatigue Indexmean: 72.45 std_dev: 7.30 std_err: 0.93
Fatigue Index1009080706050403020100
Freq
uenc
y in
Per
cent
109876543210
71

Medium High Fatigue Indices (45-60)
Histogram of Fatigue Indexmean: 52.58 std_dev: 4.12 std_err: 0.57
Fatigue Index1009080706050403020100
Freq
uenc
y in
Per
cent
20181614121086420
Shift Start Times
Time of Day [hour]0 1 2 3 4 5 6 7 8 9 10 12 14 16 18 20 22
Freq
uenc
y
250
200
150
100
50
0
72

Medium Low Fatigue Indices (30-45)
Histogram of Fatigue Indexmean: 37.77 std_dev: 4.31 std_err: 0.50
Fatigue Index1009080706050403020100
Freq
uenc
y in
Per
cent
20181614121086420
Shift Start Times
Time of Day [hour]0 1 2 3 4 5 6 7 8 9 10 12 14 16 18 20 22
Freq
uenc
y
350300250200150100500
73
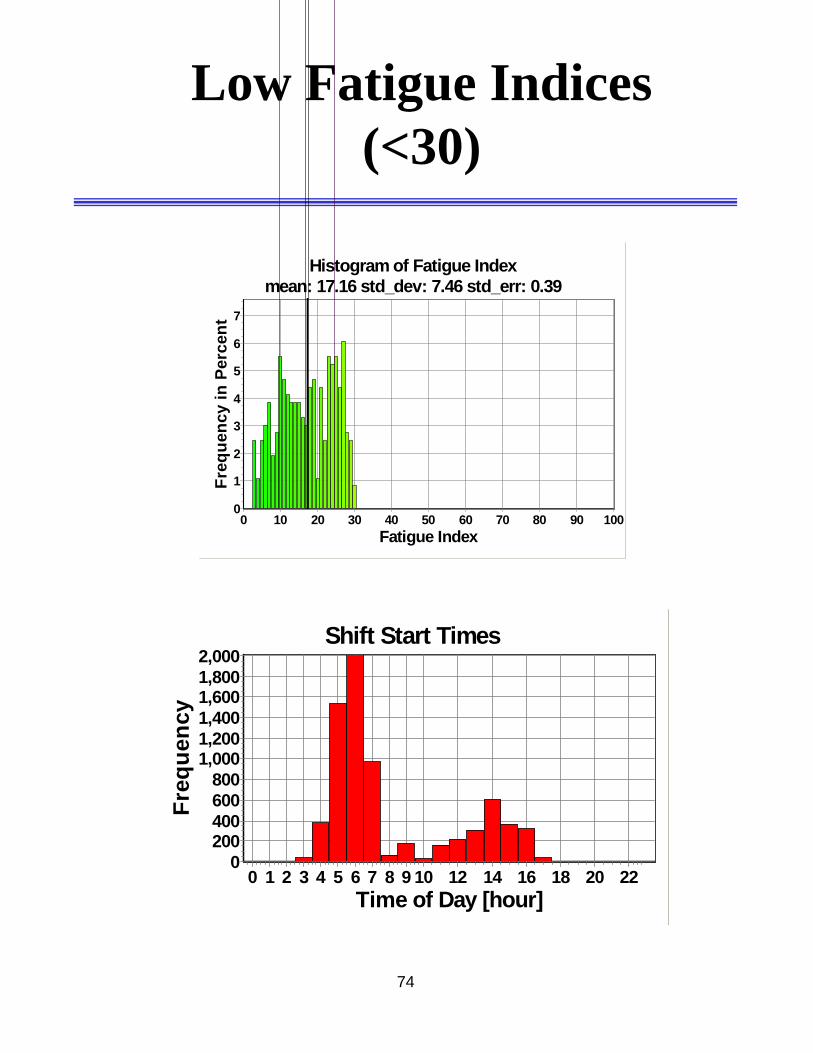
Low Fatigue Indices (<30)
Shift Start Times
Time of Day [hour]0 1 2 3 4 5 6 7 8 9 10 12 14 16 18 20 22
Freq
uenc
y
2,0001,8001,6001,4001,2001,000
800600400200
0
Histogram of Fatigue Indexmean: 17.16 std_dev: 7.46 std_err: 0.39
Fatigue Index1009080706050403020100
Freq
uenc
y in
Per
cent
7
6
5
4
3
2
1
0
74

Extra Board
75

Summary of Results Overall –Extra Board
• The average fatigue index for extra board conductors was (all terminals) was 42.7
• The average fatigue index for extra board engineers was (all terminals) was 39.3
• The percentage of conductors and engineers with low fatigue indices (30 or lower) was 33%
• The percentage of conductors and engineers with high fatigue indices (60 or higher) was 19.6%
76
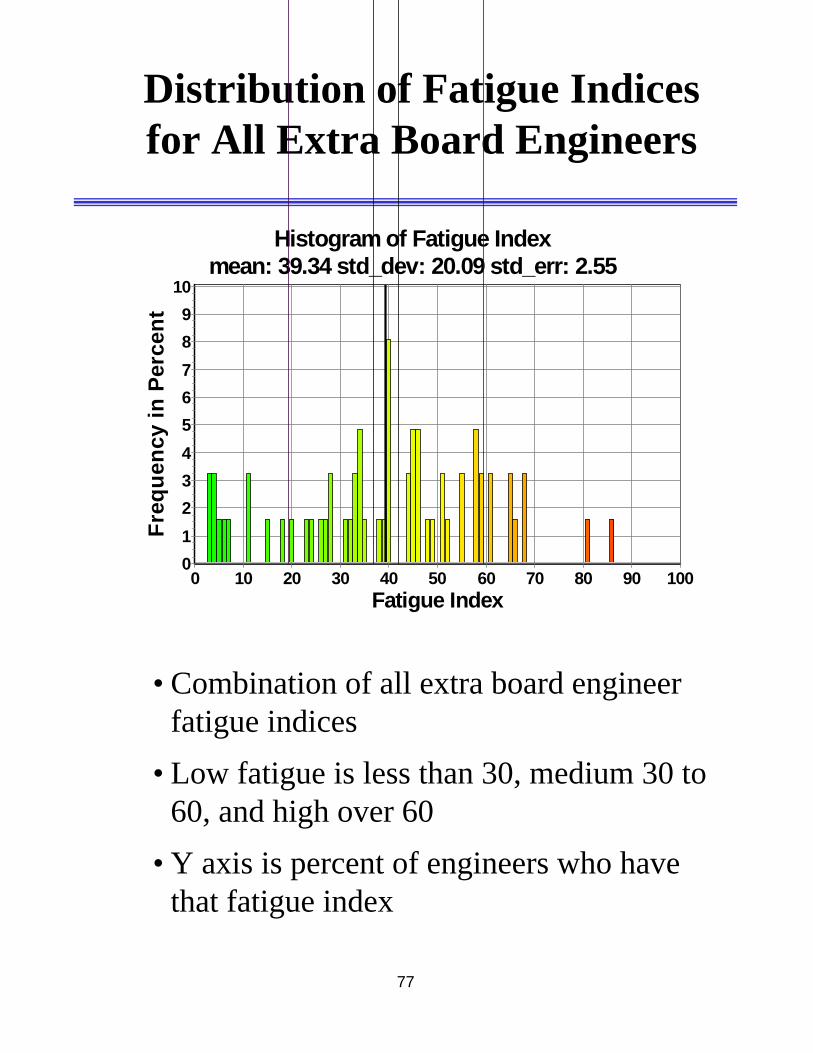
Distribution of Fatigue Indices for All Extra Board Engineers
Histogram of Fatigue Indexmean: 39.34 std_dev: 20.09 std_err: 2.55
Fatigue Index1009080706050403020100
Freq
uenc
y in
Per
cent
109876543210
• Combination of all extra board engineer fatigue indices
• Low fatigue is less than 30, medium 30 to 60, and high over 60
• Y axis is percent of engineers who have that fatigue index
77
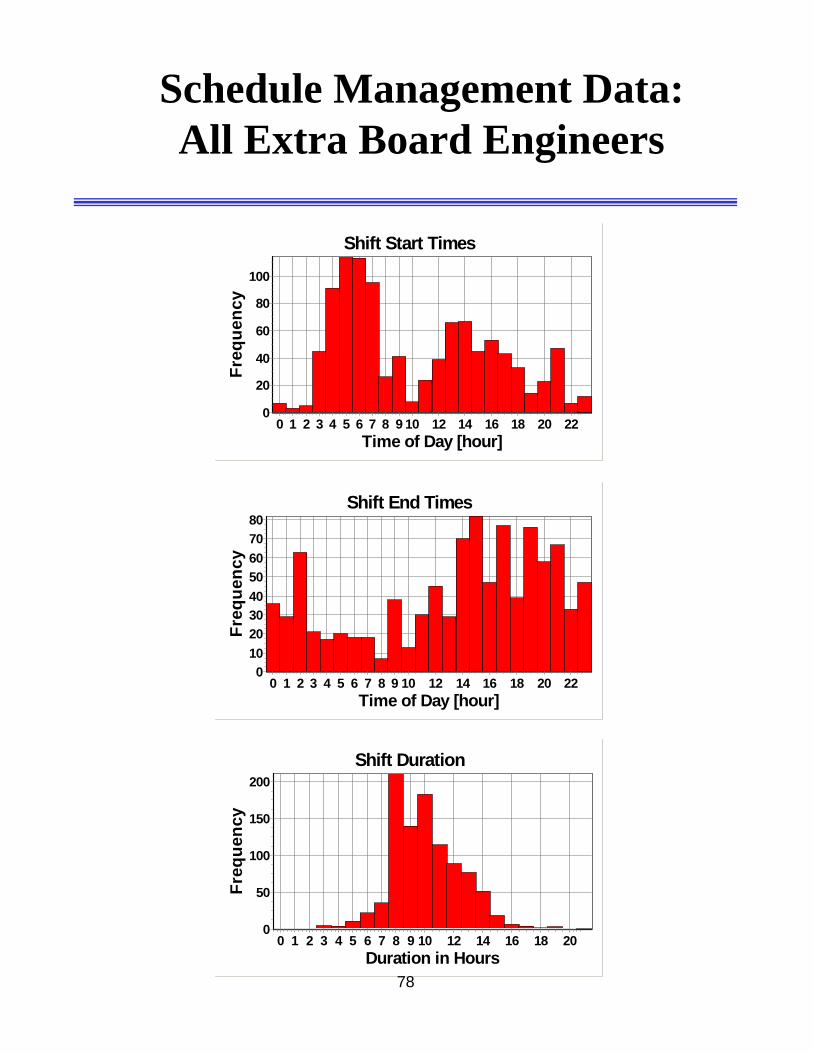
Schedule Management Data: All Extra Board Engineers
Shift Start Times
Time of Day [hour]0 1 2 3 4 5 6 7 8 9 10 12 14 16 18 20 22
Freq
uenc
y
100
80
60
40
20
0
Shift End Times
Time of Day [hour]0 1 2 3 4 5 6 7 8 9 10 12 14 16 18 20 22
Freq
uenc
y
80706050403020100
Shift Duration
Duration in Hours0 1 2 3 4 5 6 7 8 9 10 12 14 16 18 20
Freq
uenc
y
200
150
100
50
0
78

Schedule Management Data: All Extra Board Engineers
Time Off between Shifts
Time Off in Hours1009080706050403020100
Freq
uenc
y
100
80
60
40
20
0
Time between Shift Starts
Time in Hours1009080706050403020100
Freq
uenc
y
250
200
150
100
50
0
79

Schedule Management Data: All Extra Board Engineers
Consecutive Days On
# of Days0 1 2 3 4 5 6 7 8 9 10 11 12 13 14 15
Freq
uenc
y9080706050403020100
Consecutive Days Off
# of Days0 1 2 3 4 5 6 7 8 9
Freq
uenc
y
100
80
60
40
20
0
Consecutive Nights Off between Shift Blocks
# of Nights0 1 2 3 4 5 6 7 8 9 10
Freq
uenc
y
1009080706050403020100
80

Distribution of Fatigue Indices for All Extra Board Conductors
Histogram of Fatigue Indexmean: 42.70 std_dev: 22.39 std_err: 3.17
Fatigue Index1009080706050403020100
Freq
uenc
y in
Per
cent
5
4
3
2
1
0
81

Schedule Management Data: All Extra Board Conductors
Shift Start Times
Time of Day [hour]0 1 2 3 4 5 6 7 8 9 10 12 14 16 18 20 22
Freq
uenc
y
180160140120100806040200
Shift End Times
Time of Day [hour]0 1 2 3 4 5 6 7 8 9 10 12 14 16 18 20 22
Freq
uenc
y
9080706050403020100
Shift Duration
Duration in Hours0 1 2 3 4 5 6 7 8 9 10111213141516171819
Freq
uenc
y
140120100806040200
82

Schedule Management Data: All Extra Board Conductors
Time Off between Shifts
Time Off in Hours1009080706050403020100
Freq
uenc
y
80706050403020100
Time between Shift Starts
Time in Hours1009080706050403020100
Freq
uenc
y 200
150
100
50
0
83

Schedule Management Data: All Extra Board Conductors
Consecutive Days On
# of Days0 1 2 3 4 5 6 7 8 9 10 11 12 13 14 15 16
Freq
uenc
y35302520151050
Consecutive Days Off
# of Days0 1 2 3 4 5 6 7 8 9 10111213141516171819
Freq
uenc
y
100
80
60
40
20
0
Consecutive Nights Off between Shift Blocks
# of Nights0 1 2 3 4 5 6 7 8 9 10 1213 15 1718 20
Freq
uenc
y
80706050403020100
84

High Fatigue Indices (>60) Extra Board
Histogram of Fatigue Indexmean: 71.39 std_dev: 6.32 std_err: 1.45
Fatigue Index1009080706050403020100
Freq
uenc
y in
Per
cent
12
10
8
6
4
2
0
Shift Start Times
Time of Day [hour]0 1 2 3 4 5 6 7 8 9 10 12 14 16 18 20 22
Freq
uenc
y
50
40
30
20
10
0
85

Fatigue Indices vs. Hours Worked
0102030405060708090
0 20 40 60 80 100
Fatigue Score
Ave
rage
Hou
rs P
er W
eek
Consecutive Nights Off between Shift Blocks
# of Nights0 1 2 3 4 5 6 7
Freq
uenc
y
20
15
10
5
0
86
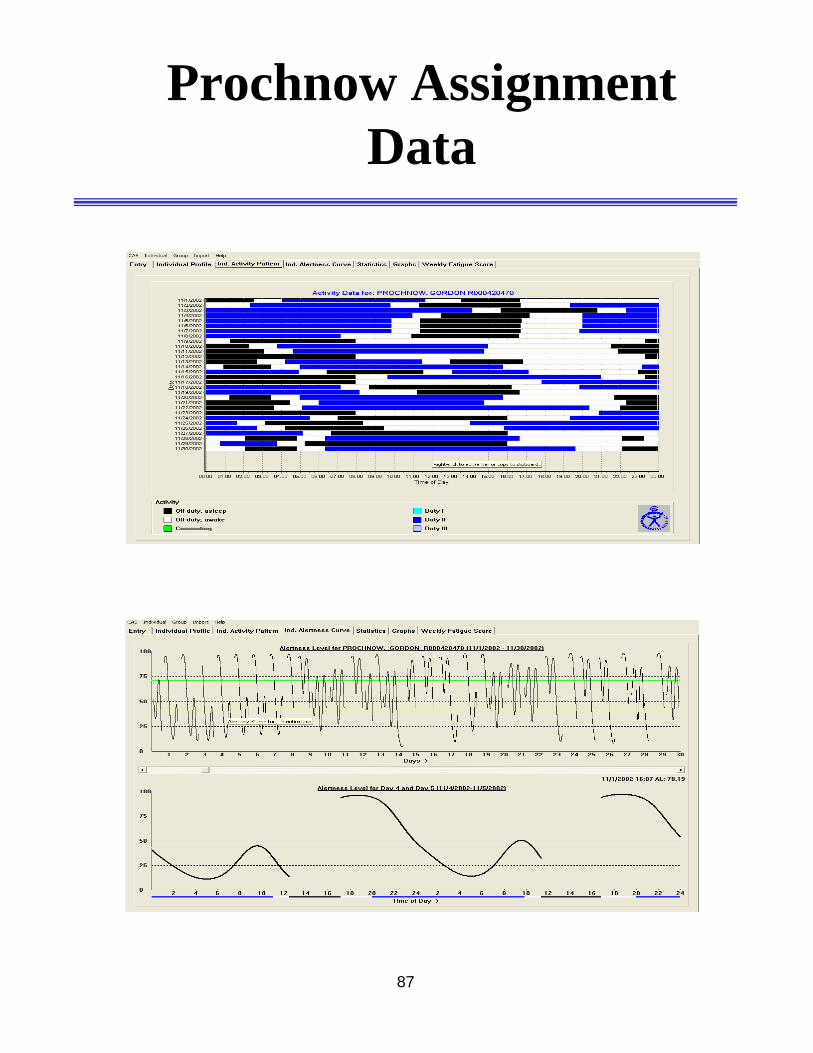
Prochnow Assignment Data
87
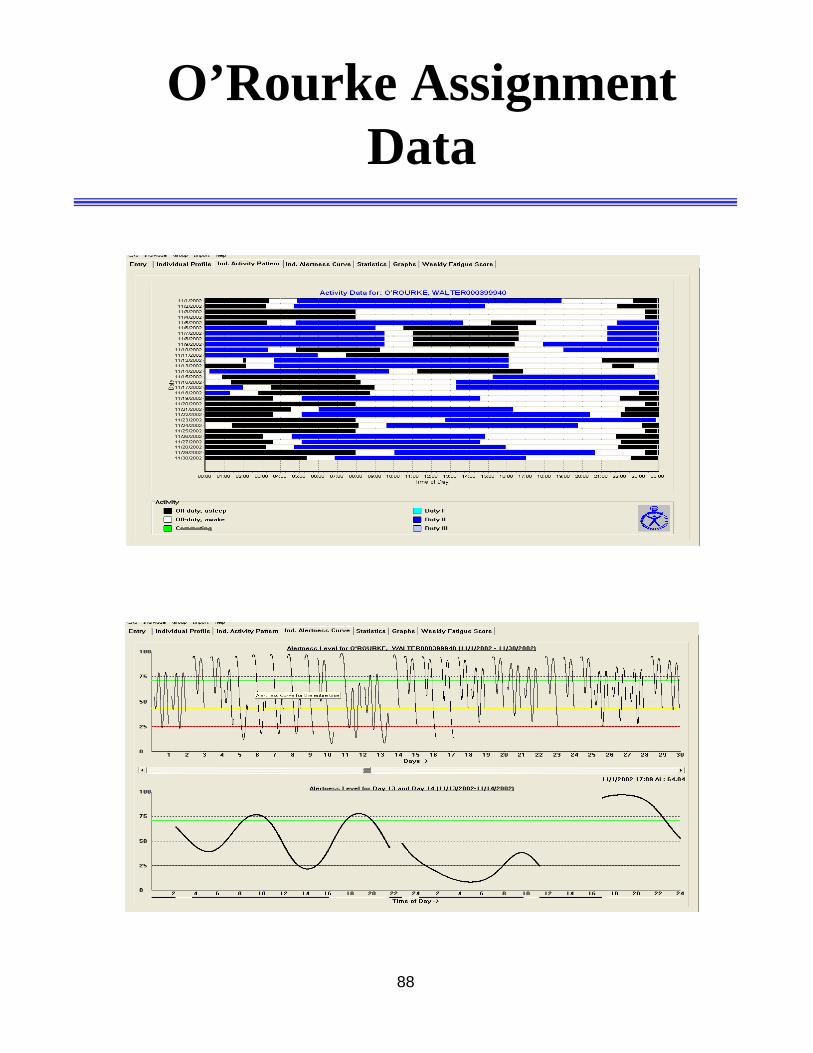
O’Rourke Assignment Data
88

Preliminary Findings
• Fatigue in regular assignment group arises mostly from overnight/early morning schedules.
• Fatigue in extra board likely arises from long work hours, variations in start time, lack of scheduled nights off (sometimes no nights off), and multiple days on.
• More research will determine this
89

Shift Start Time Variation
• Indicates variation of the start times for each shift over the month
• 12 is the worst and represents a constant switching of schedules from night to day, or morning to evening
• 0 is the best – no switching – a constant start time
90

Shift Start Time Variation
Shift Start Variation
Value0 1 2 3 4 5 6 7 8 9 10 11 12
Freq
uenc
y
220210200190
180170160150140
1301201101009080
7060504030
20100
Shift Start Variation
Value0 1 2 3 4 5 6 7 8 9 10 11 12
Freq
uenc
y
14
13
12
11
10
9
8
7
6
5
4
3
2
1
0
Regular Assignment Conductors
Extra Board Conductors
91
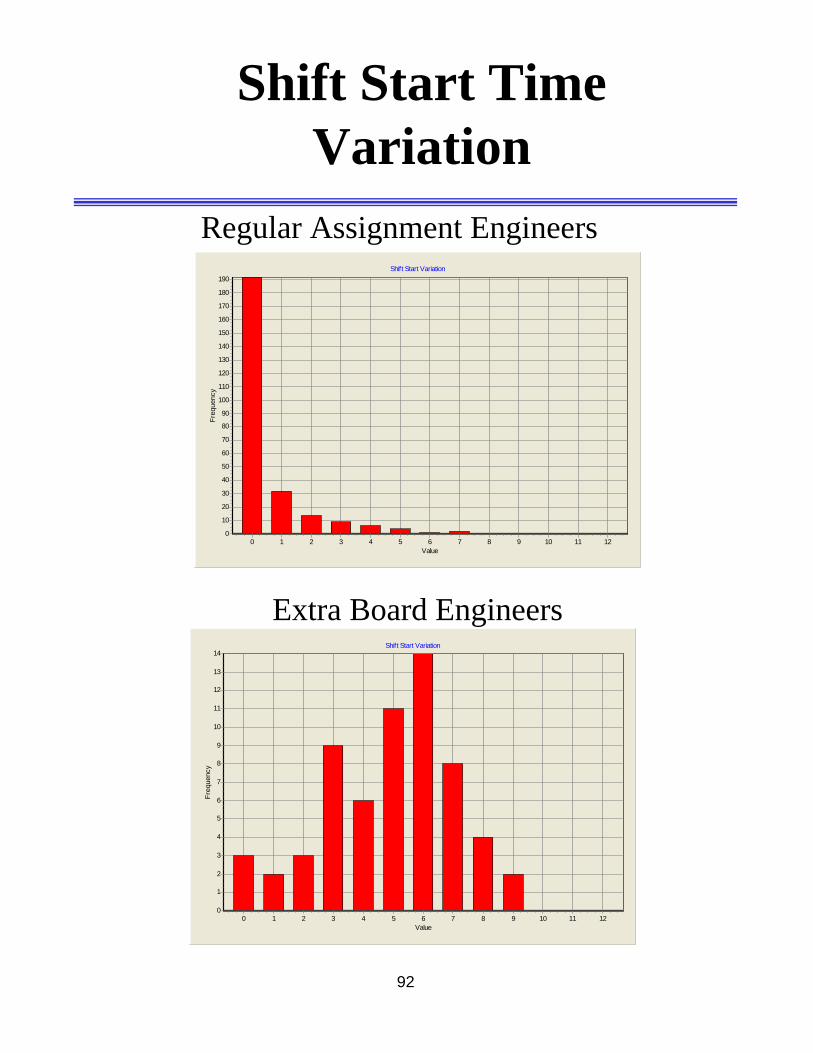
Shift Start Time Variation
Shift Start Variation
Value0 1 2 3 4 5 6 7 8 9 10 11 12
Freq
uenc
y
14
13
12
11
10
9
8
7
6
5
4
3
2
1
0
Shift Start Variation
Value0 1 2 3 4 5 6 7 8 9 10 11 12
Freq
uenc
y
190
180
170
160
150
140
130
120
110
100
90
80
70
60
50
40
30
20
10
0
Regular Assignment Engineers
Extra Board Engineers
92

93
APPENDIX C
Operator Survey and Summary of Results

94
The purpose of this confidential survey questionnaire is to find out how satisfactory the current schedule is to your needs, and what personal preferences you have in schedule features that you feel would be best for you. There are no right or wrong answers, only your personal experience, opinions, and feelings. This is your opportunity for personal input. Please mark your computer answer sheet with a #2 pencil to indicate your best answer for each question. Be sure that the number you answer on the score sheet matches the question number on the survey. There are separate pages for any comments you may wish to make about your schedule preferences and/or shiftwork in general. When finished with the questionnaire, please put your comments sheet (if any) along with your computer answer sheet into the stamp-addressed envelope and mail it back to New Jersey Institute of Technology. All of the data you provide will be held in confidence by New Jersey Institute of Technology. No one at NJTRANSIT will have any access to your individual survey sheets, which will be kept in locked files. This is a condition that the company has agreed to because of the importance of addressing this issue. Only group data will be reported back to you and the company to show the overall response to each question. Copyright Circadian Technologies, Inc., 2002 This confidential questionnaire may no be copied, reproduced in any manner, distributed or used in whole or part without the written permission of Circadian Technologies, Inc.
Circadian Technologies, Inc. 24 Hartwell Ave.
Lexington, MA 02421 USA
781-676-6900
or 800-284-5001 (ph) 781-676-6999 (fax)
95
GENERAL PERSONAL INFORMATION 1. What is your gender?
A. Female B. Male
2. What is your age? (The first row is tens, the second in ones, so if you 35 years old, you would fill in the “3” in the first row and “5” in the second row)
3. What is your height? (The first row is in feet, the second in inches, so if you are
5’-10” you will fill in the “5” in the first row and “10” in the second row) 4. What is your weight? (The first row is hundreds, the second row in tens and the
third row in ones, so if you weight 194 pounds you will fill in the “1” in the first row, “9” in the second row and “4” in the third row)
5. Question 5 intentionally left blank. Please skip. JOB RELATED INFORMATION 6. What is your current job function?
A. Regular local passenger with no split shifts B. Regular local passenger with split shifts C. Regular Yard Service D. Extra-List
7. What is your current job title?
A. Assistant Conductor B. Conductor C. Locomotive Engineer Trainee D. Locomotive Engineer E. Yard Master
8. Are you registered on the supplemental list? A. Yes B. No
9. If you were on the supplemental list, how many times were you called in the last month? (leave blank if you were not on the list)
A. 1 or 2 times B. 3 or 4 times C. 5 or 6 times D. 7 or 8 times E. More than 9 times

96
10. What type of locomotive do you mostly work on? A. Arrows B. Diesel C. Electric D. Cab Cars E. All Different Types
11. How many years have you been working in the transit/railroad industry? A. Less than 1 year B. 1 year or more, but less than 5 years C. 5 years or more, but less than 10 years D. 10 years or more, but less than 15 years E. 15 years or more
12. How many years have you been working shiftwork at NJTRANSIT? A. Less than 1 year B. 1 year or more, but less than 5 years C. 5 years or more, but less than 10 years D. 10 years or more, but less than 15 years E. 15 years or more
13. What time do you usually start work? A. Early Morning (4:01 AM to 7AM) B. Day (7:01AM to 6PM) C. Evening (6:01PM to 11PM) D. Night (11:01PM to 4AM) E. Start time changes frequently
14. How many minutes does it take you to get to work "one way"? A. 1-14 B. 15-29 C. 30-44 D. 45-59 E. 60 or more
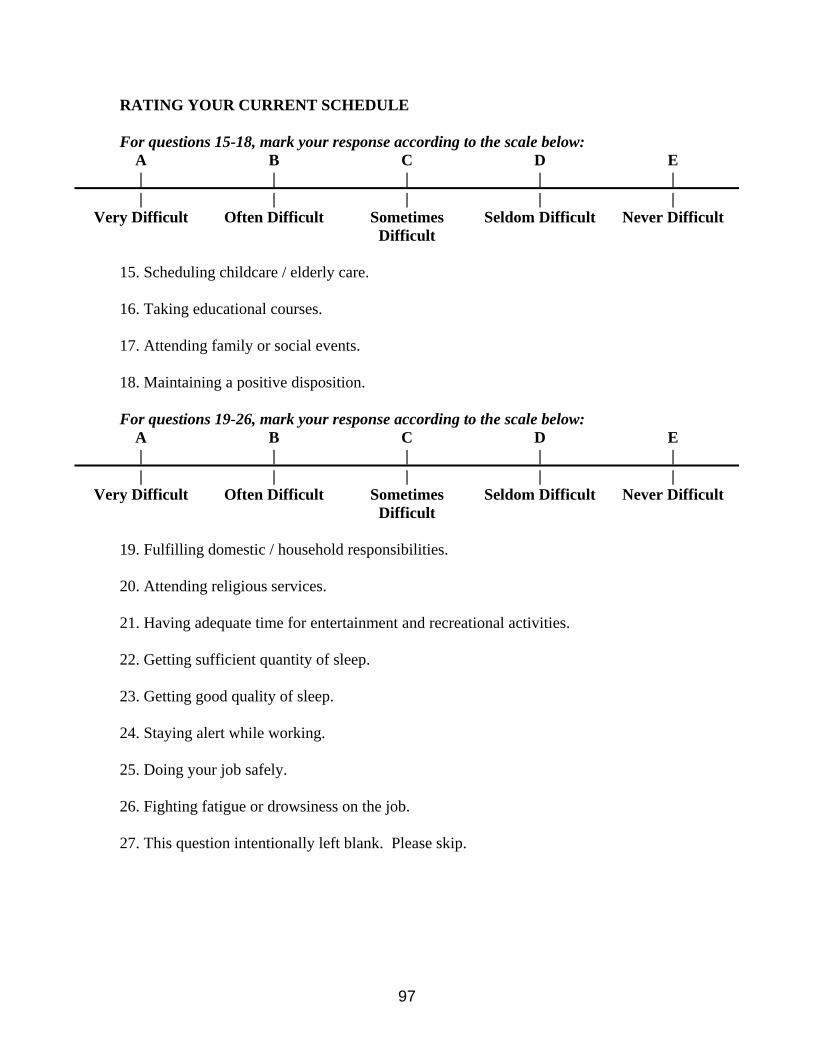
97
RATING YOUR CURRENT SCHEDULE For questions 15-18, mark your response according to the scale below:
A B C D E | | | | | | | | | |
Very Difficult Often Difficult Sometimes Difficult
Seldom Difficult Never Difficult
15. Scheduling childcare / elderly care. 16. Taking educational courses. 17. Attending family or social events. 18. Maintaining a positive disposition. For questions 19-26, mark your response according to the scale below:
A B C D E | | | | | | | | | |
Very Difficult Often Difficult Sometimes Difficult
Seldom Difficult Never Difficult
19. Fulfilling domestic / household responsibilities. 20. Attending religious services. 21. Having adequate time for entertainment and recreational activities. 22. Getting sufficient quantity of sleep. 23. Getting good quality of sleep. 24. Staying alert while working. 25. Doing your job safely. 26. Fighting fatigue or drowsiness on the job. 27. This question intentionally left blank. Please skip.

98
For questions 28-34, mark your response according to the scale below: A B C D E | | | | | | | | | |
Always a problem Often a problem Sometimes a problem
Infrequently a problem
Never a problem
28. Length of your current shifts? 29. Number of workdays in a row? 30. Days on and off pattern of your current schedule? 31. Amount of weekend time off you are currently getting? 32. Number of scheduled days off you are currently getting (excluding overtime)? 33. Length of scheduled breaks (in-between blocks of work days)? 34. Need to come in on a scheduled day off (for training, on-call responsibilities, etc.)? For questions 35-38, mark your response according to the scale below:
A B C D E | | | | | | | | | |
Very High High Moderate A little Not at all 35. How mentally demanding is your job? 36. How physically demanding is your job? 37. How monotonous or boring is your job? 38. How fatiguing is your job? 39. How many days during the past year were you called in to work on your scheduled
days off? A. 0 B. 1-9 C. 10-19 D. 20-29 E. 30 or more

99
40. How well adjusted are you to your current shift schedule?
A. Poorly adjusted (having lots of problems) B. Getting by C. Slightly adjusted D. Well adjusted E. Very well adjusted (having no problems)
SCHEDULE FEATURES These questions will help you to sort out the shift schedule features that are most important to you, and thus provide the criteria for designing new schedule alternatives. For questions 41-44, mark your response according to the scale below:
A B C D E | | | | | | | | | |
Very Important Important Somewhat Important
Not Important Uncertain
41. How important is it for you to have a schedule that gives you the most days off
possible? 42. How important is it for you to minimize the number of consecutive shifts worked?
43. How important is it for you to maximize the total number of full weekends off (i.e.
both Saturday and Sunday) you receive each year?
44. How important is it for you to maintain consistent starting times in a given workweek?
45. Concerning days off, which would you prefer? A. Have each break about the same length B. Have one longer break per cycle
46. I would prefer that all jobs be consecutive hours rather than being split into two blocks:
A. Strongly Agree B. Agree C. No Preference D. Disagree E. Strongly Disagree

100
47. Would you prefer relatively fixed start times or rotating start times? A. Fixed (always work the same schedule) B. Rotating (Schedule change weekly, bi-weekly or monthly) C. No Preference
48. In general, how would you rate the amount of time you spend between split shifts (don't answer if you do not work split shifts)
A. Far too long B. More than enough C. Enough D. Not enough E. Far too little
49. When working a split job, where do you nap between jobs? A. Napping rooms at terminal B. Home C. Don't usually nap D. Other place
50. What is your preferred type of job? A. Days B. Afternoons C. Nights D. Splits
51. I would consider alternative schedules that are physiologically better and allow me to get better sleep.
A. Strongly Agree B. Agree C. No Preference D. Disagree E. Strongly Disagree

101
HEALTH ISSUES This section seeks to identify health issues that may impact fatigue. Please note that the responses are being conveyed directly to the New Jersey Institute of Technology and the information provided to us would be used strictly for research purposes. Please be assured that responses to questions in this or any other section of the survey will be held in the strictest confidence. Information that could link responses to specific individuals would not, under any circumstances, be released to NJ TRANSIT, the New Jersey Department of Transportation or any other outside parties. We ask that you please answer as many questions as you are willing or able. For questions 52-56 below, please use the scale to indicate your typical consumption of each medication.
A B C D E | | | | | | | | | |
Daily Several times/week Once/week Several times/month
Seldom, if ever
52. Antacids or prescribed medication for indigestion, heartburn or ulcers 53. Stimulants (i.e., No-Doz, Vivarin, Amphetamines, etc.) 54. Depressants (i.e., Valium, Melatonin, sleeping pills, etc.) 55. Pain Relievers (i.e., Tylenol, Aspirin, Advil, Motrin, etc.) 56. Cold or Allergy Tablets (i.e., Seldane, Dristan, Histapan, Allerest, etc.) For questions 57-62, mark your response according to the scale below:
A B C D E | | | | | | | | | | 0 1 - 3 4 - 6 7 - 9 10 or more
57. During a typical day shift, how many 12 oz. cups or cans of caffeinated beverages do
you drink on average? (Only answer if you work this shift) 58. During a typical evening shift, how many 12 oz-cups or cans of caffeinated beverages
do you drink on average? (Only answer if you work this shift) 59. During a typical night shift, how many 12 oz. cups or cans of caffeinated beverages
do you drink on average? (Only answer if you work this shift)

102
60. During a typical 24-hour period when you are not working, how many 12 oz. cups or cans of caffeinated beverages (i.e., coffee, tea, soda, etc.) do you drink on average?
61. During a typical 24-hour period when you are not working, how many alcoholic
beverages do you drink on average? 62. During a typical 24-hour period when you are working, how many alcoholic
beverages do you drink on average? For questions 63-70, please use the scale below to indicate if you have experienced any of the following in the past 3 months:
A B C D E | | | | | | | |
Not at all 1-3 times per month
Once a week 2-4 times per week
Every day
63. Disturbed appetite 64. Having to watch what you eat to avoid stomach upsets? 65. Feeling nauseous 66. Heartburn 67. Indigestion 68. Bloated stomach or gas 69. Constipation or diarrhea 70. Abdominal pain 71. Are you currently on any formal weight reduction or medical diet program?
A. Yes B. No
72. Are you aware of how nutrition, diet, and eating practices relate to working shiftwork? A. I am not aware of what proper shiftwork nutrition should be B. I am aware but don’t have good dietary practices for shiftwork C. I am aware and I do have good dietary practices for shiftwork

103
73. How often do you exercise (i.e., cardiovascular activities such as brisk walking, jogging, etc.)?
A. Never B. Once per week C. 2-3 times per week D. Every day
74. How many years have you used tobacco products? A. Never B. 1 C. 2-12 D. 13-25 E. 26 or more
For questions 75-82, please use the scale below to indicate your appropriate response:
A B C D E | | | | | | | | | |
Never Rarely Sometimes Often Always 75. I am told I snore loudly and bother others 76. I am told I stop breathing or hold my breath while asleep 77. I awake suddenly gasping for breath, unable to breathe 78. I sweat a great deal while sleeping 79. I have high blood pressure 80. I have a problem with my nose blocking up when I am trying to sleep 81. My snoring or breathing problem is much worse if I sleep on my back 82. My snoring or breathing problem is much worse if I fall asleep right after drinking
alcohol

104
SLEEP AND FATIGUE ISSUES The following questions will provide information about how your quantity and quality of sleep relate to your current shift schedules. For questions 83 – 87, please use the scale below to indicate your appropriate response.
A B C D E | | | | | | | | | |
Less than 5 hours 5 hours 7 hours 8 hours More than 8 hours 83. How many hours of sleep per 24-hour period (in general) do you feel you need to be
alert and well rested?
84. How many hours of sleep per 24-hour period are you actually getting, on average, when you work the day shift? (Only answer if you work this shift)
85. How many hours of sleep per 24-hour period are you actually getting, on average,
when you work the evening shift? (Only answer if you work this shift)
86. How many hours of sleep per 24-hour period are you actually getting, on average, when you work the night shift? (Only answer if you work this shift)
87. How many hours of sleep per 24-hour period are you actually getting, on average,
during your days off?
For questions 88 - 91, please mark your response according to the scale below: A B C D E | | | | | | | | | |
Excellent Good Average Below Average Poor 88. How would you rate the quality of sleep that you are getting on vacations or days off? 89. How would you rate the quality of nighttime sleep that you are getting when working
the day shift? (Only answer if you work this shift) 90. How would you rate the quality of nighttime sleep that you are getting when working
the evening shift? (Only answer if you work this shift) 91. How would you rate the quality of daytime sleep that you are getting when working
the night shift? (Only answer if you work this shift)
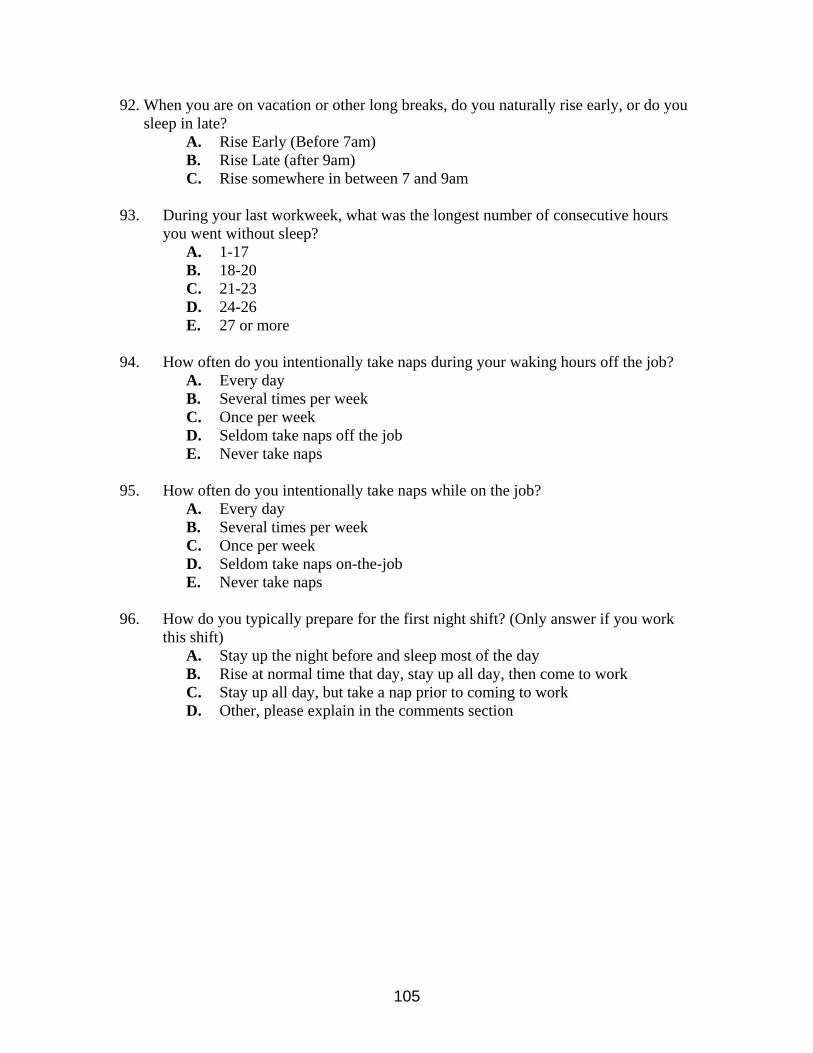
105
92. When you are on vacation or other long breaks, do you naturally rise early, or do you sleep in late?
A. Rise Early (Before 7am) B. Rise Late (after 9am) C. Rise somewhere in between 7 and 9am
93. During your last workweek, what was the longest number of consecutive hours you went without sleep?
A. 1-17 B. 18-20 C. 21-23 D. 24-26 E. 27 or more
94. How often do you intentionally take naps during your waking hours off the job? A. Every day B. Several times per week C. Once per week D. Seldom take naps off the job E. Never take naps
95. How often do you intentionally take naps while on the job? A. Every day B. Several times per week C. Once per week D. Seldom take naps on-the-job E. Never take naps
96. How do you typically prepare for the first night shift? (Only answer if you work this shift)
A. Stay up the night before and sleep most of the day B. Rise at normal time that day, stay up all day, then come to work C. Stay up all day, but take a nap prior to coming to work D. Other, please explain in the comments section

106
For questions 97 –104, please use the scale below to indicate how likely you are to have a hard time keeping your eyes open and keeping from nodding-off to sleep (as opposed to just relaxing or feeling tired). Note: Select only one of the choices below for each situation.
A B C D | | | | | | | |
Would Never Nod-Off
Slight Chance of Nodding-Off
Moderate Chance of Nodding-Off
High Chance of Nodding-Off
97. Sitting and reading 98. Watching TV 99. Sitting, inactive, in a public place (i.e., in a meeting, in a theater or dinner show,
etc.) 100. As a passenger in a car for an hour or more without stopping for a break 101. Lying down to rest in the afternoon when circumstances permit 102. Sitting and talking to someone 103. Sitting quietly after a lunch without alcohol 104. In a car, while stopped for a few minutes in traffic or at a light For questions 105 - 108, please mark your response according to the scale below:
A B C D E | | | | | | | | | |
Several Times per Shift
Several Times per Week
Several Times per Month
Several Times per Year
Seldom, if ever
105. How often do you find yourself fighting sleep or briefly nodding-off while
working? 106. How often do you find yourself fighting sleep or briefly nodding-off while
commuting to and from work? 107. How often do you make mistakes or errors of inattention while working on your
current schedule? 108. How often do you feel fatigued, drowsy or sluggish while working on your current
schedule?

107
109. How many automobile accidents have you had commuting to or from work in the past 12 months?
A. 0 B. 1-2 C. 3-4 D. 5-6 E. Over 7
110. How many near automobile accidents have you had commuting to or from work in the past 12 months?
A. 0 B. 1-2 C. 3-4 D. 5-6 E. Over 7
111. Were any of these accidents or near misses due to fatigue or lack of alertness? A. Yes B. No C. Uncertain
112. What do you feel is the most fatiguing type of job? A. Days B. Afternoons C. Nights D. Splits
113. Where does your longest period of restful sleep take place during a typical workweek?
A. At home B. Away from home C. At work D. Other
114. If you awake during sleep before you are completely rested, the reason is usually: A. The alarm B. Uncomfortable (temperature, toilet needs, thirsty, etc.) C. Noise D. Physical Soreness E. Other

108
115. At home, if you awake before being completely rested, what do you usually do in order to get back to sleep?
A. Read B. Watch TV C. Drink an alcoholic beverage D. Drink a non-alcoholic beverage E. Other
116. If you wake before being completely rested, how do you usually get back to sleep? A. Easily B. With some difficultly C. Usually cannot return to sleep D. It depends on the time of day
117. On the occasions that you did not sleep well or had inadequate rest, what best describes the effect on your personality?
A. No real or pronounced effect B. Dopey, sluggish, or dreamy C. Distracted, starring, or hypnotic D. Grouchy, irritable, or uncooperative E. Other
118. Before going to bed at home during the workweek, do you usually take something to help you sleep?
A. Prescription medication B. Nonprescription medication C. Alcoholic beverage D. Home remedy E. Other
119. How often do you take dietary supplements? A. Daily B. Several times a week C. Several times a month D. Rarely E. Never
ERGONOMIC ISSUES 120. How often do you use the napping/resting rooms?
A. Don't use B. Once a week C. Twice a week D. Three times a week E. Four or more times a week

109
121. How would you rate the quality of the resting rooms A. Excellent B. Good C. Fair D. Poor E. Don't use the rooms
122. At what time of day do you have the most trouble sleeping? A. Day B. Evening C. Nighttime D. Can sleep anytime E. Have trouble sleeping anytime
123. On your current job, how much earlier than normal do you have to get up in order to be at work on time?
A. Don't have to get up earlier B. 1 hour C. 2 hours D. 3 hours E. 4 or more hours
124. On what day of consecutive work do you feel the most fatigued? A. 1st day of work B. 2nd day of work C. 3rd day of work D. 4th day of work E. 5th or later day of work
For questions 125 - 129, please mark your response according to the scale below: A B C D E | | | | | | | | | |
Excellent Good Fair Poor Very Poor When working in the locomotive cab, how is the: 125. Ability to control heating or cooling to personal comfort level. 126. Cab seating in providing comfort and support throughout the work period. 127. Level of cab noise. 128. Vibration level. 129. The effect on the cab environment on your alertness.

110
OTHER PERSONAL INFORMATION The following section would help us to determine company demographics as well as activities outside the workplace that may impact fatigue. Again, we will not use this information to identify any individuals. Please answer as many questions as you are willing or able. 130. What is your race?*
A. White B. Black, African Amer., or Negro C. American Indian or Alaska Native D. Asian/Chinese E. Other or more than one race
131. Are Spanish/Hispanic/Latino?*
A. No, not Spanish/Hispanic/Latino B. Yes, Mexican, Mexican Amer., Chicano C. Yes, Puerto Rican C. Yes, Cuban D. Yes, other Spanish/Hispanic/Latino group
132. What is your current marital status? A. Single B. Married C. Separated D. Divorced E. Other
133. How many children under 18 do you have at home? A. None B. One C. Two D. Three or more
134. What primary childcare arrangements do you currently have? A. Child care provider B. Relatives C. Spouse or partner D. Other E. Does not apply (no children at home)
*These questions are optional.
111
135. If you do any additional work (including a farm or other home business) other than your current job at [company], please indicate the approximate average number of hours per week that you work on your second job.
A. 1-10 B. 11-20 C. 21-30 D. 31 or more E. Does not apply
136. Does your spouse or partner work full time? A. Yes, straight day work B. Yes, straight evening or night work C. Yes, rotating shifts D. No, does not work outside the home E. Does not apply

112
EMPLOYEE COMMENTS If you wish to provide any written comments, please return the employee comments section along with your completed survey sheet (detach from rest of survey) 1. What do you find is the most fatiguing aspect of your job and what jobs do you
find the most difficult? ________________________________________________________________________ ________________________________________________________________________ ________________________________________________________________________ ________________________________________________________________________ ________________________________________________________________________ ________________________________________________________________________ ________________________________________________________________________ ________________________________________________________________________ ________________________________________________________________________ ________________________________________________________________________ ________________________________________________________________________ ________________________________________________________________________ ________________________________________________________________________ ________________________________________________________________________ ________________________________________________________________________ ________________________________________________________________________ ________________________________________________________________________ ________________________________________________________________________ ________________________________________________________________________
113
2. What measures do you think would be most likely to improve the overall alertness of the train crews?
________________________________________________________________________ ________________________________________________________________________ ________________________________________________________________________ ________________________________________________________________________ ________________________________________________________________________ ________________________________________________________________________ ________________________________________________________________________ ________________________________________________________________________ ________________________________________________________________________ ________________________________________________________________________ ________________________________________________________________________ ________________________________________________________________________ ________________________________________________________________________ ________________________________________________________________________ ________________________________________________________________________ ________________________________________________________________________ ________________________________________________________________________ ________________________________________________________________________ ________________________________________________________________________ ________________________________________________________________________ ________________________________________________________________________

114
3. What methods do you currently use to help you reduce your fatigue and increase
alertness? ________________________________________________________________________ ________________________________________________________________________ ________________________________________________________________________ ________________________________________________________________________ ________________________________________________________________________ ________________________________________________________________________ ________________________________________________________________________ ________________________________________________________________________ ________________________________________________________________________ ________________________________________________________________________ ________________________________________________________________________ ________________________________________________________________________ ________________________________________________________________________ ________________________________________________________________________ ________________________________________________________________________ ________________________________________________________________________ ________________________________________________________________________ ________________________________________________________________________ ________________________________________________________________________ ________________________________________________________________________ ________________________________________________________________________

115
4. Is there any other important information that you wish to share with us relative to
your personal preferences, problems, or recommendations regarding working on the trains?
________________________________________________________________________ ________________________________________________________________________ ________________________________________________________________________ ________________________________________________________________________ ________________________________________________________________________ ________________________________________________________________________ ________________________________________________________________________ ________________________________________________________________________ ________________________________________________________________________ ________________________________________________________________________ ________________________________________________________________________ ________________________________________________________________________ ________________________________________________________________________ ________________________________________________________________________ ________________________________________________________________________ ________________________________________________________________________ ________________________________________________________________________ ________________________________________________________________________ THANK YOU FOR YOUR TIME IN FILLING OUT THIS SURVEY! YOUR RESPONSES ARE VERY IMPORTANT TOWARD DETERMINING NEW AND BETTER WAYS TO IMPROVE ALERTNESS AND REDUCE FATIGUE.

116
Survey Results Talley
1. What is your gender?
Total Female 5 Male 26 Sum 31
Relative by Column:
Total Female 16.13% Male 83.87% Sum 100%
2. What is your age?
Average 41.8
3. What is your height?
Average 70.5
4. What is your weight?
Average 194.5
5. At NJT, what is your current job?
Total Regular local passenger with no split shifts 18 Regular local passenger with split shifts 6 Regular Yard Service 1 Extra-list 4 Sum 29
Relative by Column:
Total Regular local passenger with no split shifts 62.07% Regular local passenger with split shifts 20.69% Regular Yard Service 3.45% Extra-list 13.79% Sum 100%
6. At NJT, what is your current title?
Total Assistant Conductor 6 Conductor 7 Locomotive Engineer Trainee 2 Locomotive Engineer 16 Yard Master 0 Sum 31
Relative by Column:
Total Assistant Conductor 19.35% Conductor 22.58%

117
Locomotive Engineer Trainee 6.45% Locomotive Engineer 51.61% Yard Master 0.00% Sum 100%
7. Are you registered on the supplemental list?
Total Yes 12 No 19 Sum 31
Relative by Column:
Total Yes 38.71% No 61.29% Sum 100%
8. If you were on the supplemental list, how many times were you called
in the last month? (leave blank if you were not on the list) Total 1 or 2 times 6 3 or 4 times 2 5 or 6 times 0 7 or 8 times 1 More than 9 times 0 Sum 9
Relative by Column:
Total 1 or 2 times 66.67% 3 or 4 times 22.22% 5 or 6 times 0.00% 7 or 8 times 11.11% More than 9 times 0.00% Sum 100%
9. What type of locomotive do you mostly work on?
Total Arrows 4 Diesel 4 Electric 1 Cab Cars 1 All Different Types 20 Sum 30
Relative by Column:
Total Arrows 13.33% Diesel 13.33% Electric 3.33% Cab Cars 3.33% All Different Types 66.67% Sum 100%
10. How many years have you been working shiftwork?
Total Less than 1 year 2
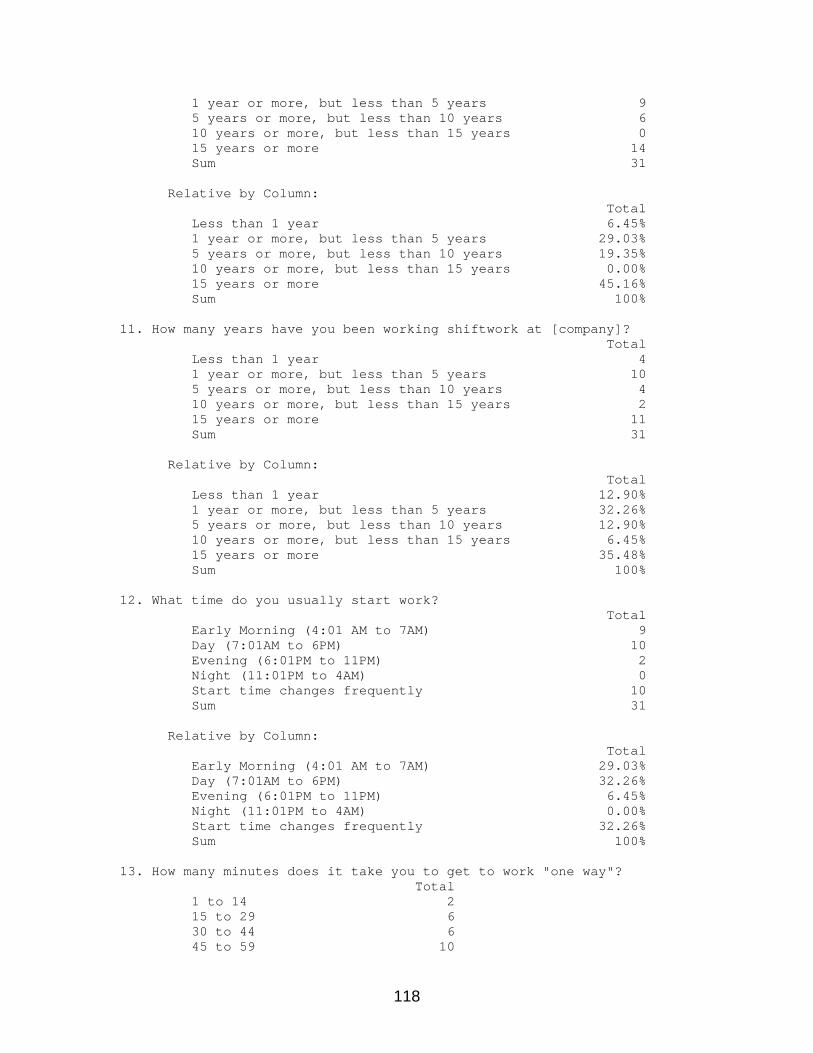
118
1 year or more, but less than 5 years 9 5 years or more, but less than 10 years 6 10 years or more, but less than 15 years 0 15 years or more 14 Sum 31
Relative by Column: Total Less than 1 year 6.45% 1 year or more, but less than 5 years 29.03% 5 years or more, but less than 10 years 19.35% 10 years or more, but less than 15 years 0.00% 15 years or more 45.16% Sum 100%
11. How many years have you been working shiftwork at [company]?
Total Less than 1 year 4 1 year or more, but less than 5 years 10 5 years or more, but less than 10 years 4 10 years or more, but less than 15 years 2 15 years or more 11 Sum 31
Relative by Column: Total Less than 1 year 12.90% 1 year or more, but less than 5 years 32.26% 5 years or more, but less than 10 years 12.90% 10 years or more, but less than 15 years 6.45% 15 years or more 35.48% Sum 100%
12. What time do you usually start work?
Total Early Morning (4:01 AM to 7AM) 9 Day (7:01AM to 6PM) 10 Evening (6:01PM to 11PM) 2 Night (11:01PM to 4AM) 0 Start time changes frequently 10 Sum 31
Relative by Column: Total Early Morning (4:01 AM to 7AM) 29.03% Day (7:01AM to 6PM) 32.26% Evening (6:01PM to 11PM) 6.45% Night (11:01PM to 4AM) 0.00% Start time changes frequently 32.26% Sum 100%
13. How many minutes does it take you to get to work "one way"?
Total 1 to 14 2 15 to 29 6 30 to 44 6 45 to 59 10

119
60 or more 8 Sum 32
Relative by Column: Total 1 to 14 6.25% 15 to 29 18.75% 30 to 44 18.75% 45 to 59 31.25% 60 or more 25.00% Sum 100%
14. Scheduling childcare / elderly care.
Total Very Difficult 4 Often Difficult 5 Sometimes Difficult 6 Seldom Difficult 1 Never Difficult 14 Sum 30
Relative by Column: Total Very Difficult 13.33% Often Difficult 16.67% Sometimes Difficult 20.00% Seldom Difficult 3.33% Never Difficult 46.67% Sum 100%
15. Taking educational courses.
Total Very Difficult 15 Often Difficult 5 Sometimes Difficult 0 Seldom Difficult 2 Never Difficult 7 Sum 29
Relative by Column: Total Very Difficult 51.72% Often Difficult 17.24% Sometimes Difficult 0.00% Seldom Difficult 6.90% Never Difficult 24.14% Sum 100%
16. Attending family or social events.
Total Very Difficult 12 Often Difficult 9 Sometimes Difficult 3 Seldom Difficult 2 Never Difficult 3 Sum 29

120
Relative by Column: Total Very Difficult 41.38% Often Difficult 31.03% Sometimes Difficult 10.34% Seldom Difficult 6.90% Never Difficult 10.34% Sum 100%
17. Maintaining a positive disposition.
Total Very Difficult 4 Often Difficult 7 Sometimes Difficult 8 Seldom Difficult 5 Never Difficult 7 Sum 31
Relative by Column: Total Very Difficult 12.90% Often Difficult 22.58% Sometimes Difficult 25.81% Seldom Difficult 16.13% Never Difficult 22.58% Sum 100%
18. Fulfilling domestic / household responsibilities.
Total Very Difficult 4 Often Difficult 11 Sometimes Difficult 10 Seldom Difficult 3 Never Difficult 3 Sum 31
Relative by Column: Total Very Difficult 12.90% Often Difficult 35.48% Sometimes Difficult 32.26% Seldom Difficult 9.68% Never Difficult 9.68% Sum 100%
19. Attending religious services.
Total Very Difficult 6 Often Difficult 6 Sometimes Difficult 8 Seldom Difficult 4 Never Difficult 7 Sum 31
Relative by Column: Total Very Difficult 19.35%

121
Often Difficult 19.35% Sometimes Difficult 25.81% Seldom Difficult 12.90% Never Difficult 22.58% Sum 100%
20. Having adequate time for entertainment and recreational activities.
Total Very Difficult 11 Often Difficult 10 Sometimes Difficult 5 Seldom Difficult 0 Never Difficult 5 Sum 31
Relative by Column: Total Very Difficult 35.48% Often Difficult 32.26% Sometimes Difficult 16.13% Seldom Difficult 0.00% Never Difficult 16.13% Sum 100%
21. Getting sufficient quantity of sleep.
Total Very Difficult 8 Often Difficult 9 Sometimes Difficult 7 Seldom Difficult 2 Never Difficult 3 Sum 29
Relative by Column: Total Very Difficult 27.59% Often Difficult 31.03% Sometimes Difficult 24.14% Seldom Difficult 6.90% Never Difficult 10.34% Sum 100%
22. Getting good quality of sleep.
Total Very Difficult 9 Often Difficult 7 Sometimes Difficult 8 Seldom Difficult 3 Never Difficult 3 Sum 30
Relative by Column: Total Very Difficult 30.00% Often Difficult 23.33% Sometimes Difficult 26.67% Seldom Difficult 10.00%
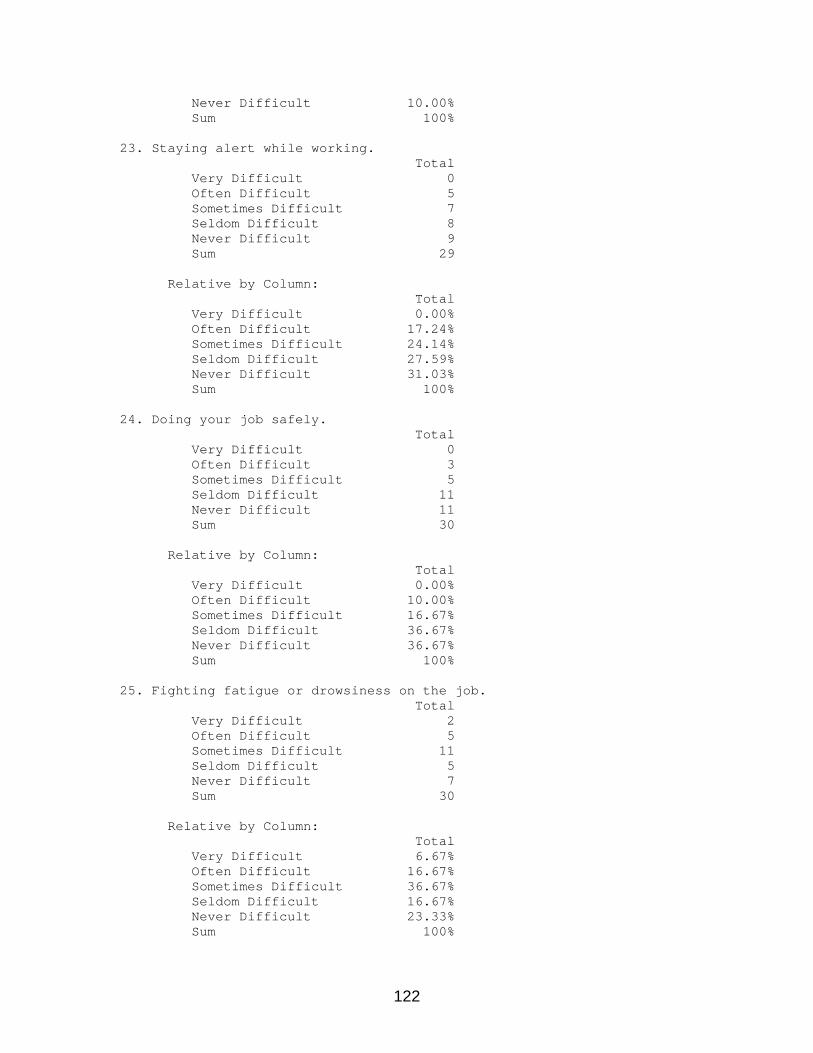
122
Never Difficult 10.00% Sum 100%
23. Staying alert while working.
Total Very Difficult 0 Often Difficult 5 Sometimes Difficult 7 Seldom Difficult 8 Never Difficult 9 Sum 29
Relative by Column: Total Very Difficult 0.00% Often Difficult 17.24% Sometimes Difficult 24.14% Seldom Difficult 27.59% Never Difficult 31.03% Sum 100%
24. Doing your job safely.
Total Very Difficult 0 Often Difficult 3 Sometimes Difficult 5 Seldom Difficult 11 Never Difficult 11 Sum 30
Relative by Column: Total Very Difficult 0.00% Often Difficult 10.00% Sometimes Difficult 16.67% Seldom Difficult 36.67% Never Difficult 36.67% Sum 100%
25. Fighting fatigue or drowsiness on the job.
Total Very Difficult 2 Often Difficult 5 Sometimes Difficult 11 Seldom Difficult 5 Never Difficult 7 Sum 30
Relative by Column: Total Very Difficult 6.67% Often Difficult 16.67% Sometimes Difficult 36.67% Seldom Difficult 16.67% Never Difficult 23.33% Sum 100%

123
26. Length of your current shifts? Total Always a problem 3 Often a problem 2 Sometimes a problem 13 Infrequently a problem 4 Never a problem 9 Sum 31
Relative by Column:
Total Always a problem 9.68% Often a problem 6.45% Sometimes a problem 41.94% Infrequently a problem 12.90% Never a problem 29.03% Sum 100%
27. Number of work days in a row?
Total Always a problem 2 Often a problem 2 Sometimes a problem 6 Infrequently a problem 11 Never a problem 8 Sum 29
Relative by Column: Total Always a problem 6.90% Often a problem 6.90% Sometimes a problem 20.69% Infrequently a problem 37.93% Never a problem 27.59% Sum 100%
28. Days on and off pattern of your current schedule?
Total Always a problem 4 Often a problem 4 Sometimes a problem 4 Infrequently a problem 8 Never a problem 9 Sum 29
Relative by Column:
Total Always a problem 13.79% Often a problem 13.79% Sometimes a problem 13.79% Infrequently a problem 27.59% Never a problem 31.03% Sum 100%
29. Amount of weekend time off you are currently getting?
Total Always a problem 6

124
Often a problem 8 Sometimes a problem 2 Infrequently a problem 6 Never a problem 9 Sum 31
Relative by Column:
Total Always a problem 19.35% Often a problem 25.81% Sometimes a problem 6.45% Infrequently a problem 19.35% Never a problem 29.03% Sum 100%
30. Number of scheduled days off you are currently getting (excluding
overtime)? Total Always a problem 4 Often a problem 3 Sometimes a problem 7 Infrequently a problem 8 Never a problem 9 Sum 31
Relative by Column:
Total Always a problem 12.90% Often a problem 9.68% Sometimes a problem 22.58% Infrequently a problem 25.81% Never a problem 29.03% Sum 100%
31. Length of scheduled breaks (in-between blocks of work days)?
Total Always a problem 6 Often a problem 2 Sometimes a problem 8 Infrequently a problem 8 Never a problem 7 Sum 31
Relative by Column:
Total Always a problem 19.35% Often a problem 6.45% Sometimes a problem 25.81% Infrequently a problem 25.81% Never a problem 22.58% Sum 100%
32. Need to come in on a scheduled day off (for training, on-call
responsibilities, etc.)? Total Always a problem 1 Often a problem 2

125
Sometimes a problem 5 Infrequently a problem 6 Never a problem 16 Sum 30
Relative by Column:
Total Always a problem 3.33% Often a problem 6.67% Sometimes a problem 16.67% Infrequently a problem 20.00% Never a problem 53.33% Sum 100%
33. How mentally demanding is your job?
Total Very High 12 Highly 10 Moderately 6 A little 1 Not at all 2 Sum 31
Relative by Column:
Total Very High 38.71% Highly 32.26% Moderately 19.35% A little 3.23% Not at all 6.45% Sum 100%
34. How physically demanding is your job?
Total Very High 5 Highly 5 Moderately 10 A little 8 Not at all 4 Sum 32
Relative by Column:
Total Very High 15.63% Highly 15.63% Moderately 31.25% A little 25.00% Not at all 12.50% Sum 100%
35. How monotonous or boring is your job?
Total Very High 5 Highly 3 Moderately 7 A little 11 Not at all 6

126
Sum 32 Relative by Column:
Total Very High 15.63% Highly 9.38% Moderately 21.88% A little 34.38% Not at all 18.75% Sum 100%
36. How fatiguing is your job?
Total Very High 4 Highly 6 Moderately 15 A little 3 Not at all 4 Sum 32
Relative by Column:
Total Very High 12.50% Highly 18.75% Moderately 46.88% A little 9.38% Not at all 12.50% Sum 100%
37. How many days during the past year were you called in to work on
your scheduled days off? Total 0 14 1 to 9 12 10 to 19 3 20 to 29 2 30 or more 1 Sum 32
Relative by Column:
Total 0 43.75% 1 to 9 37.50% 10 to 19 9.38% 20 to 29 6.25% 30 or more 3.13% Sum 100%
38. How well adjusted are you to your current shift schedule?
Total Poorly adjusted (having lots of problems) 4 Getting by 10 Slightly adjusted 4 Well adjusted 8 Very well adjusted (having no problems) 5 Sum 31

127
Relative by Column: Total Poorly adjusted (having lots of problems) 12.90% Getting by 32.26% Slightly adjusted 12.90% Well adjusted 25.81% Very well adjusted (having no problems) 16.13% Sum 100%
39. How important is it for you to have a schedule that gives you the most days off possible?
Total Very important 13 Important 6 Uncertain 8 Unimportant 5 Very unimportant 0 Sum 32
Relative by Column:
Total Very important 40.63% Important 18.75% Uncertain 25.00% Unimportant 15.63% Very unimportant 0.00% Sum 100%
40. How important is it for you to minimize the number of consecutive
shifts worked? Total
Very important 9 Important 8 Uncertain 8 Unimportant 7 Very unimportant 0 Sum 32
Relative by Column:
Total Very important 28.13% Important 25.00% Uncertain 25.00% Unimportant 21.88% Very unimportant 0.00% Sum 100%
41. How important is it for you to maximize the total number of full
weekends off (i.e. both Saturday and Sunday off together) that you receive each year?
Total Very important 15 Important 7 Uncertain 5 Unimportant 4 Very unimportant 1 Sum 32

128
Relative by Column:
Total Very important 46.88% Important 21.88% Uncertain 15.63% Unimportant 12.50% Very unimportant 3.13% Sum 100%
42. How important is it for you to maintain consistent starting times
in a given work week? Total Very Important 14 Important 12 No Preference 5 Unimportant 1 Very Unimportant 0 Sum 32
Relative by Column:
Total Very Important 43.75% Important 37.50% No Preference 15.63% Unimportant 3.13% Very Unimportant 0.00% Sum 100%
43. Concerning days off, which would you prefer?
Total Have each break about the same length 15 Have one longer break per cycle 15 Sum 30
Relative by Column: Total Have each break about the same length 50.00% Have one longer break per cycle 50.00% Sum 100%
44. I would prefer that all jobs be consecutive hours rather than being
split into two blocks: Total Strongly Agree 13 Agree 6 No Preference 5 Disagree 2 Strongly Disagree 5 Sum 31
Relative by Column:
Total Strongly Agree 41.94% Agree 19.35% No Preference 16.13% Disagree 6.45%

129
Strongly Disagree 16.13% Sum 100%
45. Would you prefer reletively fixed start times or rotating start
times? Total
Fixed (always work the same schedule) 23 Rotating (Schedule change weekly, bi-weekly or monthly) 1 No Preference 7 Sum 31
Relative by Column: Total Fixed (always work the same schedule) 74.19% Rotating (Schedule change weekly, bi-weekly or monthly) 3.23% No Preference 22.58% Sum 100%
46. In general, how would you rate the amount of time you spend between split shifts (don't answer if you do not work split shifts)?
Total Far too Long 0 More than Enough 1 Enough 11 Not Enough 4 Far too Little 0 Sum 16
Relative by Column: Total Far too Long 0.00% More than Enough 6.25% Enough 68.75% Not Enough 25.00% Far too Little 0.00% Sum 100%
47. When working a split job, where do you nap between jobs?
Total Napping rooms at terminal 14 Home 2 Don't usually nap 6 Other place 3 Sum 25
Relative by Column:
Total Napping rooms at terminal 56.00% Home 8.00% Don't usually nap 24.00% Other place 12.00% Sum 100%
48. What is your preferred type of job?
Total Days 11 Afternoons 13
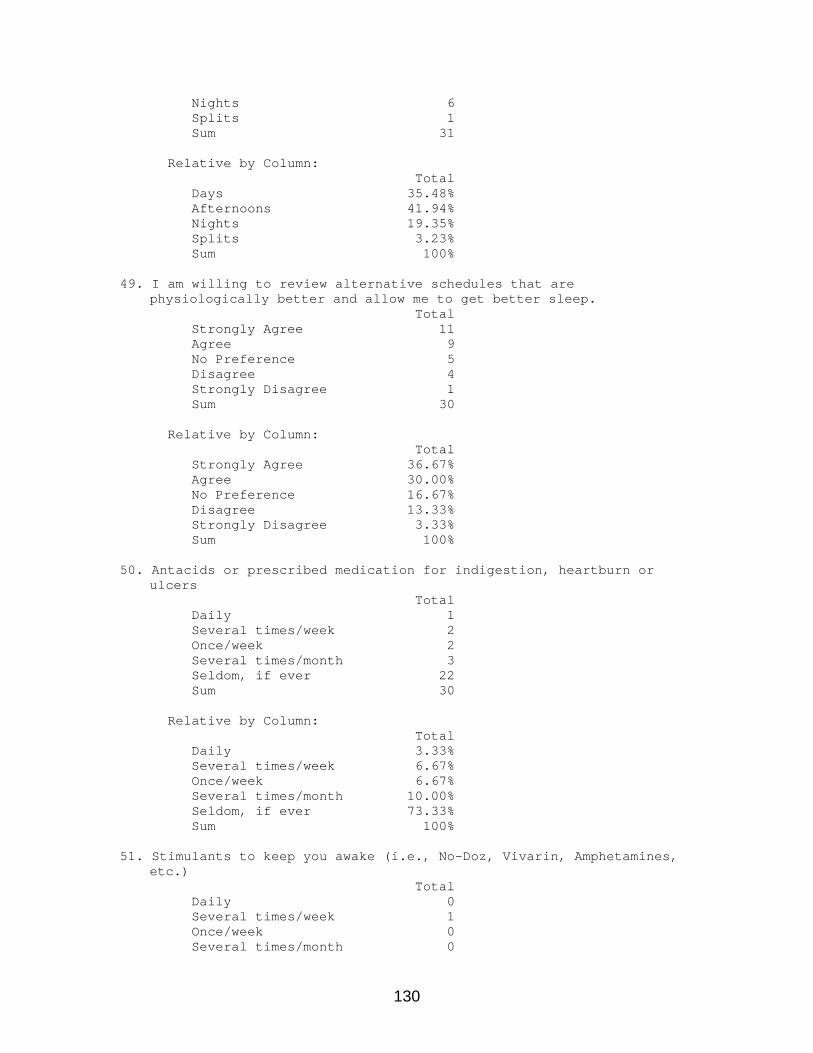
130
Nights 6 Splits 1 Sum 31
Relative by Column:
Total Days 35.48% Afternoons 41.94% Nights 19.35% Splits 3.23% Sum 100%
49. I am willing to review alternative schedules that are
physiologically better and allow me to get better sleep. Total Strongly Agree 11 Agree 9 No Preference 5 Disagree 4 Strongly Disagree 1 Sum 30
Relative by Column:
Total Strongly Agree 36.67% Agree 30.00% No Preference 16.67% Disagree 13.33% Strongly Disagree 3.33% Sum 100%
50. Antacids or prescribed medication for indigestion, heartburn or
ulcers Total Daily 1 Several times/week 2 Once/week 2 Several times/month 3 Seldom, if ever 22 Sum 30
Relative by Column:
Total Daily 3.33% Several times/week 6.67% Once/week 6.67% Several times/month 10.00% Seldom, if ever 73.33% Sum 100%
51. Stimulants to keep you awake (i.e., No-Doz, Vivarin, Amphetamines,
etc.) Total Daily 0 Several times/week 1 Once/week 0 Several times/month 0

131
Seldom, if ever 30 Sum 31
Relative by Column:
Total Daily 0.00% Several times/week 3.23% Once/week 0.00% Several times/month 0.00% Seldom, if ever 96.77% Sum 100%
52. Depressants to help you sleep (i.e., Valium, etc.)
Total Daily 0 Several times/week 1 Once/week 0 Several times/month 0 Seldom, if ever 30 Sum 31
Relative by Column: Total Daily 0.00% Several times/week 3.23% Once/week 0.00% Several times/month 0.00% Seldom, if ever 96.77% Sum 100%
53. Pain Relievers (i.e., Tylenol, Aspirin, Advil, Motrin, etc.)
Total Daily 3 Several times/week 4 Once/week 4 Several times/month 8 Seldom, if ever 12 Sum 31
Relative by Column: Total Daily 9.68% Several times/week 12.90% Once/week 12.90% Several times/month 25.81% Seldom, if ever 38.71% Sum 100%
54. Cold or Allergy Tablets (i.e., Seldane, Dristan, Histapan, Allerest,
etc.) Total Daily 3 Several times/week 3 Once/week 2 Several times/month 3 Seldom, if ever 20 Sum 31
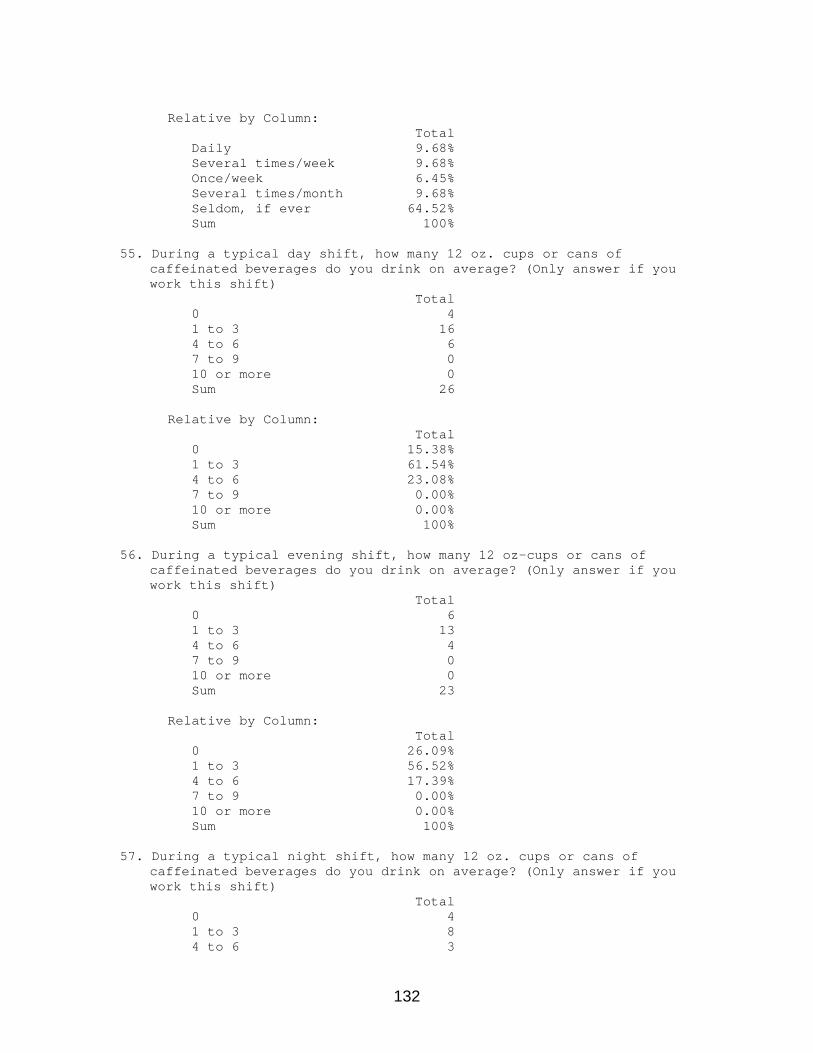
132
Relative by Column:
Total Daily 9.68% Several times/week 9.68% Once/week 6.45% Several times/month 9.68% Seldom, if ever 64.52% Sum 100%
55. During a typical day shift, how many 12 oz. cups or cans of
caffeinated beverages do you drink on average? (Only answer if you work this shift)
Total 0 4 1 to 3 16 4 to 6 6 7 to 9 0 10 or more 0 Sum 26
Relative by Column: Total 0 15.38% 1 to 3 61.54% 4 to 6 23.08% 7 to 9 0.00% 10 or more 0.00% Sum 100%
56. During a typical evening shift, how many 12 oz-cups or cans of
caffeinated beverages do you drink on average? (Only answer if you work this shift)
Total 0 6 1 to 3 13 4 to 6 4 7 to 9 0 10 or more 0 Sum 23
Relative by Column: Total 0 26.09% 1 to 3 56.52% 4 to 6 17.39% 7 to 9 0.00% 10 or more 0.00% Sum 100%
57. During a typical night shift, how many 12 oz. cups or cans of
caffeinated beverages do you drink on average? (Only answer if you work this shift)
Total 0 4 1 to 3 8 4 to 6 3

133
7 to 9 1 10 or more 0 Sum 16
Relative by Column: Total 0 25.00% 1 to 3 50.00% 4 to 6 18.75% 7 to 9 6.25% 10 or more 0.00% Sum 100%
58. During a typical 24-hour period when you are not working, how many
12 oz. cups or cans of caffeinated beverages (i.e., coffee, tea, soda, etc.) do you drink on average?
Total 0 6 1 to 3 22 4 to 6 3 7 to 9 0 10 or more 0 Sum 31
Relative by Column: Total 0 19.35% 1 to 3 70.97% 4 to 6 9.68% 7 to 9 0.00% 10 or more 0.00% Sum 100%
59. During a typical 24-hour period when you are not working, how many
alcoholic beverages do you drink on average? Total 0 19 1 to 3 7 4 to 6 4 7 to 9 0 10 or more 1 Sum 31
Relative by Column: Total 0 61.29% 1 to 3 22.58% 4 to 6 12.90% 7 to 9 0.00% 10 or more 3.23% Sum 100%
60. During a typical 24-hour period when you are working, how many
alcoholic beverages do you drink on average? Total 0 26 1 to 3 2

134
4 to 6 2 7 to 9 1 10 or more 1 Sum 32
Relative by Column: Total 0 81.25% 1 to 3 6.25% 4 to 6 6.25% 7 to 9 3.13% 10 or more 3.13% Sum 100%
61. Disturbed appetite
Total Almost Never 16 Seldom 7 Often 2 Almost Always 5 Sum 30
Relative by Column: Total Almost Never 53.33% Seldom 23.33% Often 6.67% Almost Always 16.67% Sum 100%
62. Having to watch what you eat to avoid stomach upsets? Total Almost Never 21 Seldom 2 Often 1 Almost Always 2 Sum 26
Relative by Column: Total Almost Never 80.77% Seldom 7.69% Often 3.85% Almost Always 7.69% Sum 100%
63. Feeling nauseous
Total Almost Never 22 Seldom 4 Often 2 Almost Always 2 Sum 30
Relative by Column: Total Almost Never 73.33%

135
Seldom 13.33% Often 6.67% Almost Always 6.67% Sum 100%
64. Heartburn
Total Almost Never 16 Seldom 10 Often 1 Almost Always 2 Sum 29
Relative by Column: Total Almost Never 55.17% Seldom 34.48% Often 3.45% Almost Always 6.90% Sum 100%
65. Indigestion
Total Almost Never 15 Seldom 8 Often 3 Almost Always 2 Sum 28
Relative by Column: Total Almost Never 53.57% Seldom 28.57% Often 10.71% Almost Always 7.14% Sum 100%
66. Bloated stomach or gas
Total Almost Never 9 Seldom 11 Often 1 Almost Always 6 Sum 27
Relative by Column: Total Almost Never 33.33% Seldom 40.74% Often 3.70% Almost Always 22.22% Sum 100%
67. Constipation or diarrhea
Total Almost Never 14 Seldom 7

136
Often 5 Almost Always 4 Sum 30
Relative by Column: Total Almost Never 46.67% Seldom 23.33% Often 16.67% Almost Always 13.33% Sum 100%
68. Abdominal pain Total Almost Never 19 Seldom 6 Often 4 Almost Always 0 Sum 29
Relative by Column: Total Almost Never 65.52% Seldom 20.69% Often 13.79% Almost Always 0.00% Sum 100%
69. Are you currently on any formal weight reduction or medical diet
program? Total Yes 2 No 30 Sum 32
Relative by Column: Total Yes 6.25% No 93.75% Sum 100%
70. Are you aware of how nutrition, diet, and eating practices relate
to working shiftwork? Total I am not aware of what proper shiftwork nutrition should be 13 I am aware but don’t have good dietary practices for shiftwork 9 I am aware and I do have good dietary practices for shiftwork 10 Sum 32
Relative by Column: Total I am not aware of what proper shiftwork nutrition should be 40.63% I am aware but don’t have good dietary practices for shiftwork 28.13% I am aware and I do have good dietary practices for shiftwork 31.25% Sum 100%

137
71. How often do you exercise (i.e., cardiovascular activities such as brisk walking, jogging, etc. ) (NJT only)
Total Never 11 Once per week 8 2-3 times per week 9 Every day 4 Sum 32
Relative by Column: Total Never 34.38% Once per week 25.00% 2-3 times per week 28.13% Every day 12.50% Sum 100%
72. How many years have you smoked tobacco?
Total Never 17 1 2 2 to 12 7 13 to 25 3 26 or more 3 Sum 32
Relative by Column: Total Never 53.13% 1 6.25% 2 to 12 21.88% 13 to 25 9.38% 26 or more 9.38% Sum 100%
73. I am told I snore loudly and bother others
Total Never 8 Rarely 6 Sometimes 9 Usually 5 Always 4 Sum 32
Relative by Column: Total Never 25.00% Rarely 18.75% Sometimes 28.13% Usually 15.63% Always 12.50% Sum 100%
74. I am told I stop breathing or hold my breath while asleep
Total Never 25 Rarely 3

138
Sometimes 1 Usually 1 Always 2 Sum 32
Relative by Column: Total Never 78.13% Rarely 9.38% Sometimes 3.13% Usually 3.13% Always 6.25% Sum 100%
75. I awake suddenly gasping for breath, unable to breathe
Total Never 24 Rarely 4 Sometimes 1 Usually 1 Always 1 Sum 31
Relative by Column: Total Never 77.42% Rarely 12.90% Sometimes 3.23% Usually 3.23% Always 3.23% Sum 100%
76. I sweat a great deal while sleeping
Total Never 16 Rarely 6 Sometimes 7 Usually 2 Always 1 Sum 32
Relative by Column: Total Never 50.00% Rarely 18.75% Sometimes 21.88% Usually 6.25% Always 3.13% Sum 100%
77. I have high blood pressure
Total Never 19 Rarely 2 Sometimes 5 Usually 3 Always 3
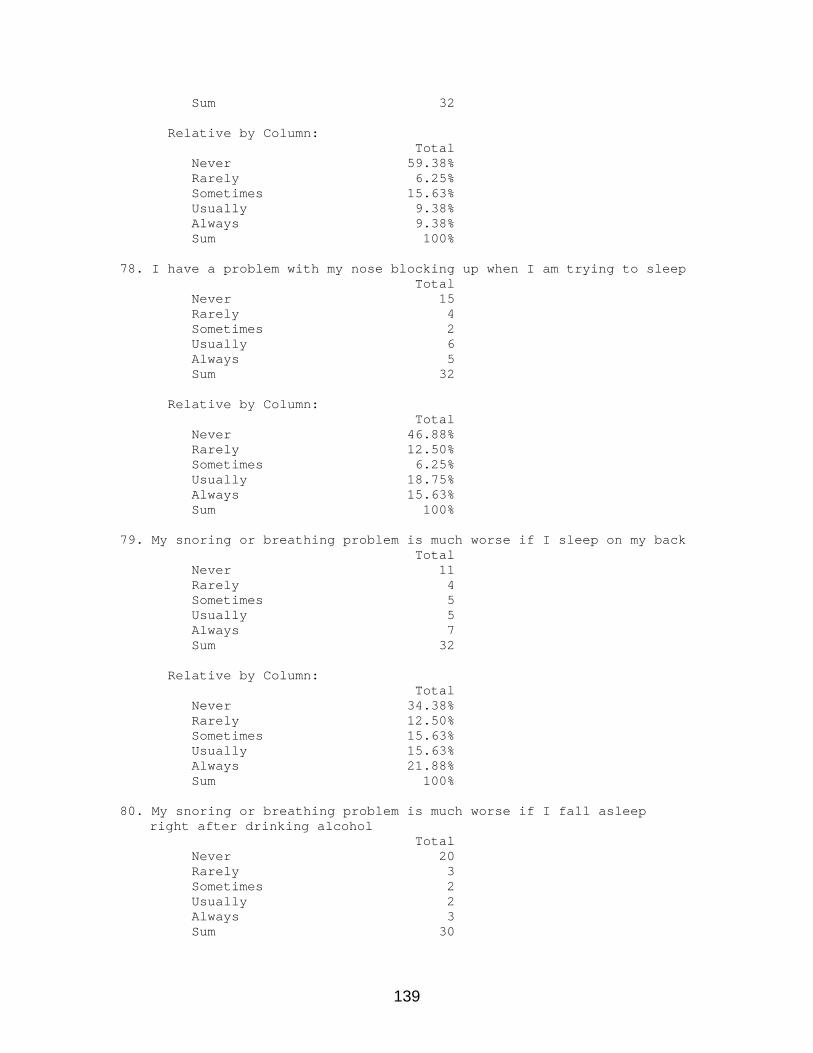
139
Sum 32
Relative by Column: Total Never 59.38% Rarely 6.25% Sometimes 15.63% Usually 9.38% Always 9.38% Sum 100%
78. I have a problem with my nose blocking up when I am trying to sleep
Total Never 15 Rarely 4 Sometimes 2 Usually 6 Always 5 Sum 32
Relative by Column: Total Never 46.88% Rarely 12.50% Sometimes 6.25% Usually 18.75% Always 15.63% Sum 100%
79. My snoring or breathing problem is much worse if I sleep on my back
Total Never 11 Rarely 4 Sometimes 5 Usually 5 Always 7 Sum 32
Relative by Column: Total Never 34.38% Rarely 12.50% Sometimes 15.63% Usually 15.63% Always 21.88% Sum 100%
80. My snoring or breathing problem is much worse if I fall asleep
right after drinking alcohol Total Never 20 Rarely 3 Sometimes 2 Usually 2 Always 3 Sum 30

140
Relative by Column: Total Never 66.67% Rarely 10.00% Sometimes 6.67% Usually 6.67% Always 10.00% Sum 100%
81. How many hours of sleep per 24-hour period (in general) do you feel
you need to be alert and well rested? Total Less than 5 Hours 0 5 - 6 Hours 3 7 Hours 15 8 Hours 11 More than 8 Hours 3 Sum 32
Relative by Column: Total Less than 5 Hours 0.00% 5 - 6 Hours 9.38% 7 Hours 46.88% 8 Hours 34.38% More than 8 Hours 9.38% Sum 100%
82. How many hours of sleep per 24-hour period are you actually getting,
on average, when you work the day shift? (Only answer if you work this shift)
Total Less than 5 Hours 5 5 - 6 Hours 12 7 Hours 7 8 Hours 2 More than 8 Hours 1 Sum 27
Relative by Column: Total Less than 5 Hours 18.52% 5 - 6 Hours 44.44% 7 Hours 25.93% 8 Hours 7.41% More than 8 Hours 3.70% Sum 100%
83. How many hours of sleep per 24-hour period are you actually getting,
on average, when you work the evening shift? (Only answer if you work this shift)
Total Less than 5 Hours 5 5 - 6 Hours 7 7 Hours 4 8 Hours 1 More than 8 Hours 2

141
Sum 19
Relative by Column: Total Less than 5 Hours 26.32% 5 - 6 Hours 36.84% 7 Hours 21.05% 8 Hours 5.26% More than 8 Hours 10.53% Sum 100%
84. How many hours of sleep per 24-hour period are you actually getting,
on average, when you work the night shift? (Only answer if you work this shift)
Total Less than 5 Hours 5 5 - 6 Hours 4 7 Hours 1 8 Hours 1 More than 8 Hours 1 Sum 12
Relative by Column: Total Less than 5 Hours 41.67% 5 - 6 Hours 33.33% 7 Hours 8.33% 8 Hours 8.33% More than 8 Hours 8.33% Sum 100%
85. How many hours of sleep per 24-hour period are you actually getting,
on average, during your days off? Total Less than 5 Hours 0 5 - 6 Hours 2 7 Hours 8 8 Hours 13 More than 8 Hours 9 Sum 32
Relative by Column: Total Less than 5 Hours 0.00% 5 - 6 Hours 6.25% 7 Hours 25.00% 8 Hours 40.63% More than 8 Hours 28.13% Sum 100%
86. How would you rate the quality of sleep that you are getting on
vacations or days off? Total Excellent 12 Good 9 Average 8 Below Average 1

142
Poor 2 Sum 32
Relative by Column: Total Excellent 37.50% Good 28.13% Average 25.00% Below Average 3.13% Poor 6.25% Sum 100%
87. How would you rate the quality of nighttime sleep that you are
getting when working the day shift? (Only answer if you work this shift)
Total Excellent 2 Good 4 Average 9 Below Average 7 Poor 3 Sum 25
Relative by Column: Total Excellent 8.00% Good 16.00% Average 36.00% Below Average 28.00% Poor 12.00% Sum 100%
88. How would you rate the quality of nighttime sleep that you are
getting when working the evening shift? (Only answer if you work this shift)
Total Excellent 3 Good 2 Average 5 Below Average 6 Poor 2 Sum 18
Relative by Column: Total Excellent 16.67% Good 11.11% Average 27.78% Below Average 33.33% Poor 11.11% Sum 100%
89. How would you rate the quality of daytime sleep that you are
getting when working the night shift? (Only answer if you work this shift)
Total Excellent 1

143
Good 1 Average 3 Below Average 3 Poor 4 Sum 12
Relative by Column: Total Excellent 8.33% Good 8.33% Average 25.00% Below Average 25.00% Poor 33.33% Sum 100%
90. When you are on vacation or other long breaks, do you
naturally rise early, or do you sleep in late? Total Rise Early (Before 7am) 16 Rise Late (after 9am) 8 Rise somewhere in between 7 and 9am 8 Sum 32
Relative by Column: Total Rise Early (Before 7am) 50.00% Rise Late (after 9am) 25.00% Rise somewhere in between 7 and 9am 25.00% Sum 100%
91. During your last work week, what was the longest number of
consecutive hours you went without sleep? Total 1 to 17 11 18 to 20 14 21 to 23 2 24 to 26 1 27 or more 1 Sum 29
Relative by Column: Total 1 to 17 37.93% 18 to 20 48.28% 21 to 23 6.90% 24 to 26 3.45% 27 or more 3.45% Sum 100%
92. How often do you intentionally take naps during your waking hours
off-the-job? Total Every day 5 Several times per week 13 Once per week 1 Seldom take naps off-the-job 7 Never take naps 5
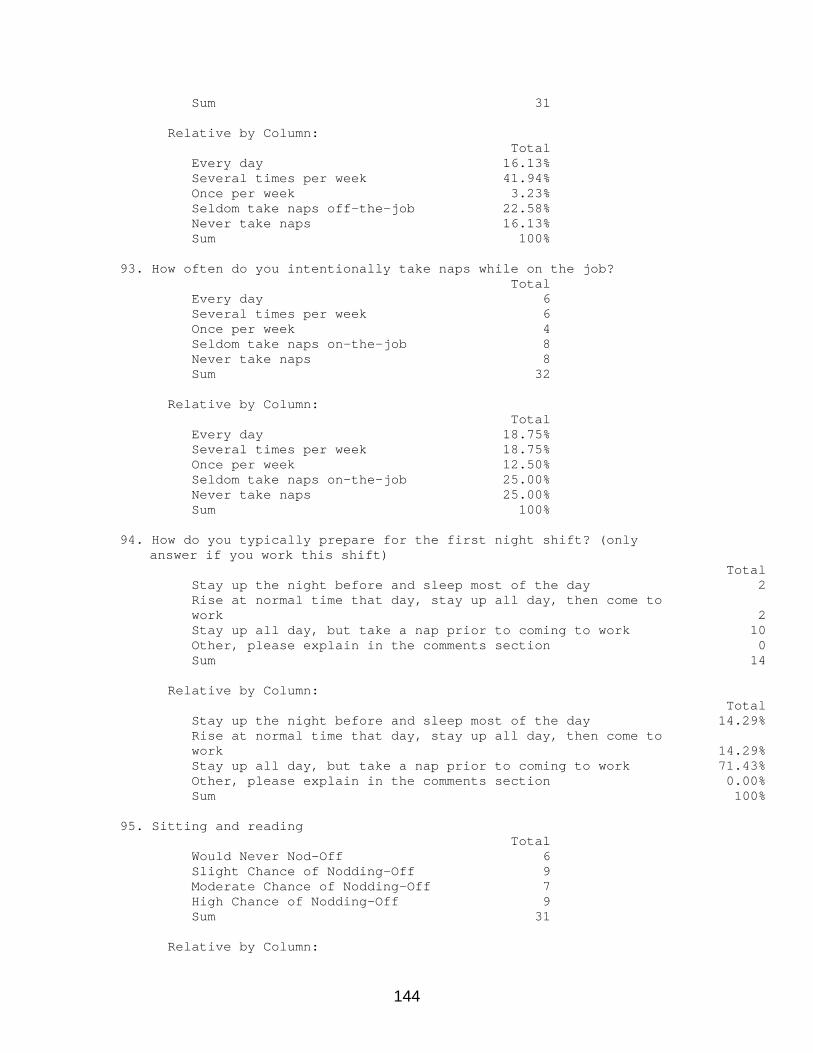
144
Sum 31
Relative by Column: Total Every day 16.13% Several times per week 41.94% Once per week 3.23% Seldom take naps off-the-job 22.58% Never take naps 16.13% Sum 100%
93. How often do you intentionally take naps while on the job?
Total Every day 6 Several times per week 6 Once per week 4 Seldom take naps on-the-job 8 Never take naps 8 Sum 32
Relative by Column: Total Every day 18.75% Several times per week 18.75% Once per week 12.50% Seldom take naps on-the-job 25.00% Never take naps 25.00% Sum 100%
94. How do you typically prepare for the first night shift? (only
answer if you work this shift) Total Stay up the night before and sleep most of the day 2 Rise at normal time that day, stay up all day, then come to work 2 Stay up all day, but take a nap prior to coming to work 10 Other, please explain in the comments section 0 Sum 14
Relative by Column: Total Stay up the night before and sleep most of the day 14.29% Rise at normal time that day, stay up all day, then come to work 14.29% Stay up all day, but take a nap prior to coming to work 71.43% Other, please explain in the comments section 0.00% Sum 100%
95. Sitting and reading
Total Would Never Nod-Off 6 Slight Chance of Nodding-Off 9 Moderate Chance of Nodding-Off 7 High Chance of Nodding-Off 9 Sum 31
Relative by Column:

145
Total Would Never Nod-Off 19.35% Slight Chance of Nodding-Off 29.03% Moderate Chance of Nodding-Off 22.58% High Chance of Nodding-Off 29.03% Sum 100%
96. Watching TV
Total Would Never Nod-Off 3 Slight Chance of Nodding-Off 11 Moderate Chance of Nodding-Off 10 High Chance of Nodding-Off 6 Sum 30
Relative by Column: Total Would Never Nod-Off 10.00% Slight Chance of Nodding-Off 36.67% Moderate Chance of Nodding-Off 33.33% High Chance of Nodding-Off 20.00% Sum 100%
97. Sitting, inactive, in a public place (i.e., in a meeting, in a
theater or dinner show, etc.) Total Would Never Nod-Off 14 Slight Chance of Nodding-Off 7 Moderate Chance of Nodding-Off 8 High Chance of Nodding-Off 2 Sum 31
Relative by Column: Total Would Never Nod-Off 45.16% Slight Chance of Nodding-Off 22.58% Moderate Chance of Nodding-Off 25.81% High Chance of Nodding-Off 6.45% Sum 100%
98. As a passenger in a car for an hour or more without stopping for a
break Total Would Never Nod-Off 6 Slight Chance of Nodding-Off 14 Moderate Chance of Nodding-Off 6 High Chance of Nodding-Off 5 Sum 31
Relative by Column: Total Would Never Nod-Off 19.35% Slight Chance of Nodding-Off 45.16% Moderate Chance of Nodding-Off 19.35% High Chance of Nodding-Off 16.13% Sum 100%

146
99. Lying down to rest in the afternoon when circumstances permit Total Would Never Nod-Off 2 Slight Chance of Nodding-Off 5 Moderate Chance of Nodding-Off 5 High Chance of Nodding-Off 18 Sum 30
Relative by Column: Total Would Never Nod-Off 6.67% Slight Chance of Nodding-Off 16.67% Moderate Chance of Nodding-Off 16.67% High Chance of Nodding-Off 60.00% Sum 100%
100. Sitting and talking to someone
Total Would Never Nod-Off 25 Slight Chance of Nodding-Off 6 Moderate Chance of Nodding-Off 0 High Chance of Nodding-Off 0 Sum 31
Relative by Column: Total Would Never Nod-Off 80.65% Slight Chance of Nodding-Off 19.35% Moderate Chance of Nodding-Off 0.00% High Chance of Nodding-Off 0.00% Sum 100%
101. Sitting quietly after a lunch without alcohol
Total Would Never Nod-Off 11 Slight Chance of Nodding-Off 10 Moderate Chance of Nodding-Off 9 High Chance of Nodding-Off 1 Sum 31
Relative by Column: Total Would Never Nod-Off 35.48% Slight Chance of Nodding-Off 32.26% Moderate Chance of Nodding-Off 29.03% High Chance of Nodding-Off 3.23% Sum 100%
102. In a car, while stopped for a few minutes in traffic or at a light
Total Would Never Nod-Off 23 Slight Chance of Nodding-Off 7 Moderate Chance of Nodding-Off 1 High Chance of Nodding-Off 1 Sum 32
Relative by Column:

147
Total Would Never Nod-Off 71.88% Slight Chance of Nodding-Off 21.88% Moderate Chance of Nodding-Off 3.13% High Chance of Nodding-Off 3.13% Sum 100%
103. How often do you find yourself fighting sleep or briefly nodding-
off while working? Total Several Times per Shift 1 Several Times per Week 8 Several Times per Month 6 Several Times per Year 7 Seldom, if ever 10 Sum 32
Relative by Column: Total Several Times per Shift 3.13% Several Times per Week 25.00% Several Times per Month 18.75% Several Times per Year 21.88% Seldom, if ever 31.25% Sum 100%
104. How often do you find yourself fighting sleep or briefly nodding-
off while commuting to and from work? Total Several Times per Shift 3 Several Times per Week 2 Several Times per Month 8 Several Times per Year 6 Seldom, if ever 13 Sum 32
Relative by Column: Total Several Times per Shift 9.38% Several Times per Week 6.25% Several Times per Month 25.00% Several Times per Year 18.75% Seldom, if ever 40.63% Sum 100%
105. How often do you make mistakes or errors of inattention while
working on your current schedule? Total Several Times per Shift 0 Several Times per Week 2 Several Times per Month 4 Several Times per Year 10 Seldom, if ever 16 Sum 32
Relative by Column: Total

148
Several Times per Shift 0.00% Several Times per Week 6.25% Several Times per Month 12.50% Several Times per Year 31.25% Seldom, if ever 50.00% Sum 100%
106. How often do you feel fatigued, drowsy or sluggish while working
on your current schedule? Total Several Times per Shift 3 Several Times per Week 12 Several Times per Month 10 Several Times per Year 1 Seldom, if ever 6 Sum 32
Relative by Column: Total Several Times per Shift 9.38% Several Times per Week 37.50% Several Times per Month 31.25% Several Times per Year 3.13% Seldom, if ever 18.75% Sum 100%
107. How many automobile accidents have you had commuting to work in
the past 12 months? Total 0 28 1 to 2 3 3 to 4 0 5 to 6 0 Over 7 0 Sum 31
Relative by Column: Total 0 90.32% 1 to 2 9.68% 3 to 4 0.00% 5 to 6 0.00% Over 7 0.00% Sum 100%
108. How many near accidents have you had commuting to work in the past
12 months? Total 0 12 1 to 2 15 3 to 4 4 5 to 6 1 Over 7 0 Sum 32
Relative by Column: Total

149
0 37.50% 1 to 2 46.88% 3 to 4 12.50% 5 to 6 3.13% Over 7 0.00% Sum 100%
109. Were any of these commuting accidents or near misses due to
fatigue or lack of alertness? Total Yes 8 No 17 Uncertain 2 Sum 27
Relative by Column: Total Yes 29.63% No 62.96% Uncertain 7.41% Sum 100%
110. What do you feel is the most fatiguing type of job?
Total Days 4 Afternoons 4 Nights 14 Splits 9 Sum 31
Relative by Column: Total Days 12.90% Afternoons 12.90% Nights 45.16% Splits 29.03% Sum 100%
111. Where does your longest period of restful sleep take place during
a typical workweek? Total At home 29 Away from home 1 At work 1 Other 1 Sum 32
Relative by Column: Total At home 90.63% Away from home 3.13% At work 3.13% Other 3.13% Sum 100%
112. If you awake during sleep before you are comletely rested, the
reason is usually:

150
Total The alarm 5 Uncomfortable (temperature, toilet needs, thirsty, etc.) 14 Noise 5 Physical Soreness 0 Other 8 Sum 32
Relative by Column: Total The alarm 15.63% Uncomfortable (temperature, toilet needs, thirsty, etc.) 43.75% Noise 15.63% Physical Soreness 0.00% Other 25.00% Sum 100%
113. At home, if you awake before being completely rested, what do you
usually do in order to get back to sleep? Total Read 1 Watch TV 9 Drink an alcoholic beverage 0 Drink a non alcoholic beverage 1 Other 21 Sum 32
Relative by Column: Total Read 3.13% Watch TV 28.13% Drink an alcoholic beverage 0.00% Drink a non alcoholic beverage 3.13% Other 65.63% Sum 100%
114. If you wake before being completely rested, how do you usually get
back to sleep? Total Easily 7 With some difficultly 11 Usually cannot return to sleep 5 It depends on the time of day 9 Sum 32
Relative by Column: Total Easily 21.88% With some difficultly 34.38% Usually cannot return to sleep 15.63% It depends on the time of day 28.13% Sum 100%
115. On the occasions that you did not sleep well or had inadequate
rest, what best describes the effect on your personality? Total No real or pronounced effect 8

151
Dopey, sluggish, or dreamy 5 Distracted, starring, or hypnotic 3 Grouchy, irritable, or uncooperative 13 Other 3 Sum 32
Relative by Column: Total No real or pronounced effect 25.00% Dopey, sluggish, or dreamy 15.63% Distracted, starring, or hypnotic 9.38% Grouchy, irritable, or uncooperative 40.63% Other 9.38% Sum 100%
116. Before going to bed at home during the workweek, do you usually
take something to help you sleep? Total Prescription medication 1 Nonprescription medication 2 Alcoholic beverage 1 Home remedy 2 Other 18 Sum 24
Relative by Column: Total Prescription medication 4.17% Nonprescription medication 8.33% Alcoholic beverage 4.17% Home remedy 8.33% Other 75.00% Sum 100%
117. How often do you take dietary supplements?
Total Daily 8 Several times a week 1 Several times a month 2 Rarely 6 Never 15 Sum 32
Relative by Column: Total Daily 25.00% Several times a week 3.13% Several times a month 6.25% Rarely 18.75% Never 46.88% Sum 100%
118. How often do you use the napping/resting rooms?
Total Don't use 17 Once a week 7 Twice a week 0

152
Three times a week 2 Four or more times a week 6 Sum 32
Relative by Column: Total Don't use 53.13% Once a week 21.88% Twice a week 0.00% Three times a week 6.25% Four or more times a week 18.75% Sum 100%
119. How would you rate the quality of the resting rooms
Total Excellent 0 Good 2 Fair 4 Poor 22 Don't use the rooms 4 Sum 32
Relative by Column: Total Excellent 0.00% Good 6.25% Fair 12.50% Poor 68.75% Don't use the rooms 12.50% Sum 100%
120. At what time of day do you have the most trouble sleeping?
Total Day 15 Evening 1 Nighttime 2 Can sleep anytime 8 Have trouble sleeping anytime 6 Sum 32
Relative by Column: Total Day 46.88% Evening 3.13% Nighttime 6.25% Can sleep anytime 25.00% Have trouble sleeping anytime 18.75% Sum 100%
121. On your current job, how much earlier than normal do you have to
get up in order to be at work on time? Total Don't have to get up earlier 11 1 hour 6 2 hours 5 3 hours 6 4 or more hours 4

153
Sum 32
Relative by Column: Total Don't have to get up earlier 34.38% 1 hour 18.75% 2 hours 15.63% 3 hours 18.75% 4 or more hours 12.50% Sum 100%
122. On what day of consecutive work do you feel the most fatigued?
Total 1st day of work 4 2nd day of work 3 3rd day of work 3 4th day of work 6 5th or later day of work 15 Sum 31
Relative by Column: Total 1st day of work 12.90% 2nd day of work 9.68% 3rd day of work 9.68% 4th day of work 19.35% 5th or later day of work 48.39% Sum 100%
123. Ability to control heating or cooling to personal comfort level. Total Excellent 1 Good 6 Fair 9 Poor 9 Very Poor 6 Sum 31
Relative by Column: Total Excellent 3.23% Good 19.35% Fair 29.03% Poor 29.03% Very Poor 19.35% Sum 100%
124. Cab seating in providing comfort and support throughout the work
period. Total Excellent 0 Good 6 Fair 6 Poor 9 Very Poor 10 Sum 31

154
Relative by Column: Total Excellent 0.00% Good 19.35% Fair 19.35% Poor 29.03% Very Poor 32.26% Sum 100%
125. Level of cab noise.
Total Excellent 0 Good 3 Fair 8 Poor 9 Very Poor 12 Sum 32
Relative by Column:
Total Excellent 0.00% Good 9.38% Fair 25.00% Poor 28.13% Very Poor 37.50% Sum 100%
126. Vibration level.
Total Excellent 1 Good 4 Fair 11 Poor 10 Very Poor 6 Sum 32
Relative by Column: Total Excellent 3.13% Good 12.50% Fair 34.38% Poor 31.25% Very Poor 18.75% Sum 100%
127. The effect on the cab environment on your alertness is ....
Total Excellent 1 Good 11 Fair 10 Poor 6 Very Poor 3 Sum 31
Relative by Column: Total Excellent 3.23%
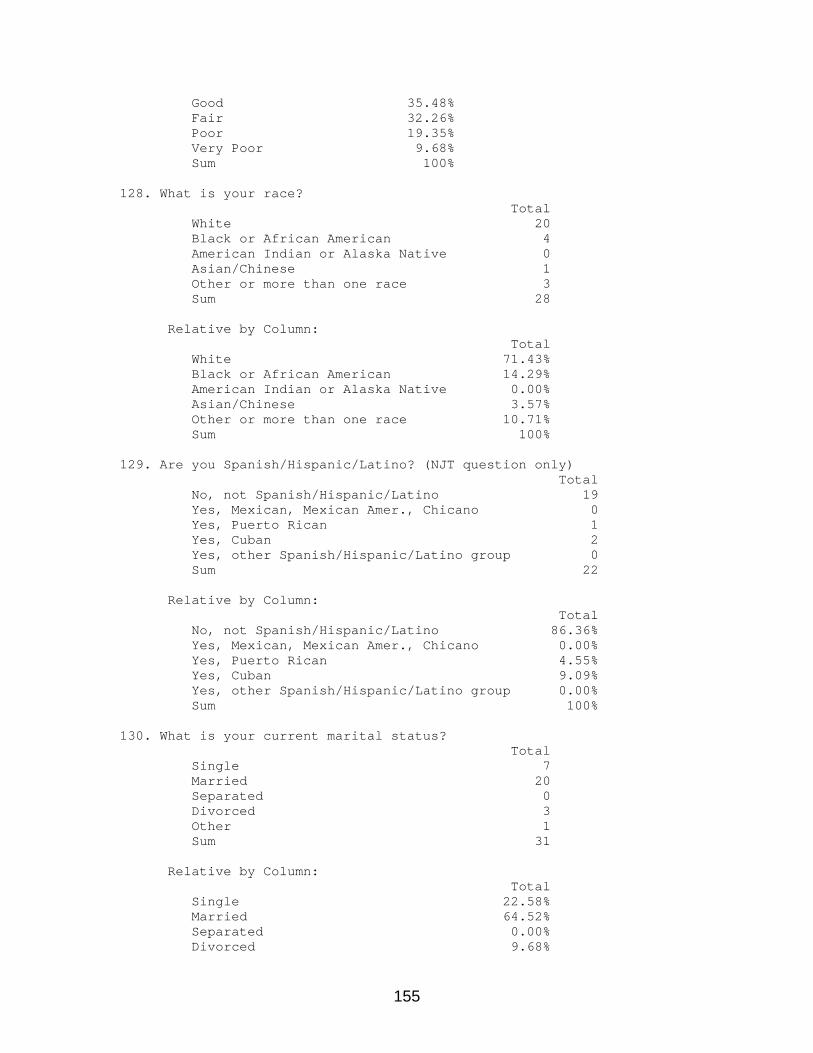
155
Good 35.48% Fair 32.26% Poor 19.35% Very Poor 9.68% Sum 100%
128. What is your race?
Total White 20 Black or African American 4 American Indian or Alaska Native 0 Asian/Chinese 1 Other or more than one race 3 Sum 28
Relative by Column: Total White 71.43% Black or African American 14.29% American Indian or Alaska Native 0.00% Asian/Chinese 3.57% Other or more than one race 10.71% Sum 100%
129. Are you Spanish/Hispanic/Latino? (NJT question only)
Total No, not Spanish/Hispanic/Latino 19 Yes, Mexican, Mexican Amer., Chicano 0 Yes, Puerto Rican 1 Yes, Cuban 2 Yes, other Spanish/Hispanic/Latino group 0 Sum 22
Relative by Column: Total No, not Spanish/Hispanic/Latino 86.36% Yes, Mexican, Mexican Amer., Chicano 0.00% Yes, Puerto Rican 4.55% Yes, Cuban 9.09% Yes, other Spanish/Hispanic/Latino group 0.00% Sum 100%
130. What is your current marital status?
Total Single 7 Married 20 Separated 0 Divorced 3 Other 1 Sum 31
Relative by Column: Total Single 22.58% Married 64.52% Separated 0.00% Divorced 9.68%

156
Other 3.23% Sum 100%
131. How many children under 18 do you have at home?
Total None 17 One 8 Two 5 Three or more 1 Sum 31
Relative by Column: Total None 54.84% One 25.81% Two 16.13% Three or more 3.23% Sum 100%
132. What primary childcare arrangements do you currently have?
Total Child care provider 2 Relatives 4 Spouse or partner 6 Other 3 Does not apply (no children at home) 17 Sum 32
Relative by Column: Total Child care provider 6.25% Relatives 12.50% Spouse or partner 18.75% Other 9.38% Does not apply (no children at home) 53.13% Sum 100%
133. If you do any additional work (including a farm or other home business) other than your current job at [company], please indicate the approximate average number of hours per week that you work on your second job.
Total 1 to 10 2 11 to 20 2 21 to 30 1 31 or more 0 Does not apply 26 Sum 31
Relative by Column: Total 1 to 10 6.45% 11 to 20 6.45% 21 to 30 3.23% 31 or more 0.00% Does not apply 83.87% Sum 100%

157
134. Does your spouse or partner work full time?
Total Yes, straight day work 14 Yes, straight evening or night work 0 Yes, rotating shifts 1 No, does not work outside the home 2 Does not apply 15 Sum 32
Relative by Column: Total Yes, straight day work 43.75% Yes, straight evening or night work 0.00% Yes, rotating shifts 3.13% No, does not work outside the home 6.25% Does not apply 46.88% Sum 100%
135. What do you find is the most fatiguing aspect of your job and what
jobs do you find the most difficult? No crosstab results available
136. What measures do you think would be most likely to improve the overall alertness of the train crews? No crosstab results available
137. What methods do you currently use to help you reduce your fatigue and increase alertness? No crosstab results available
138. Is there any other important information that you wish to share with us relative to your personal preferences, problems, or recommendations regarding working on the trains? No crosstab results available

158
GLOSSARY
circadian rhythm extra board fatigue index fatigue management rail operations
159
REFERENCES
1. http://www.njtransit.com/nn_fyi_record.shtml. 2. Smiley. A. 1998, Fatigue management: Lessons from research, in L Hartley
(ed), Managing Fatigue in Transportation, Oxford: Elsevier Science Ltd (Pergamon).
3. Arnold, P., Hartley, L. 1998. Its not just hours of work; ask the drivers. In Hartley L.R. (Ed). Managing fatigue in transportation. Oxford: Pergamon.
4. Desmond, P. 1998. Driver Fatigue: Performance and State Changes, In Hartley, L., ed. Managing Fatigue in Transportation : Proceedings of the 3rd Fatigue in Transportation Conference Fremantle, Western Australia, 1998, Pergamon Pr.
5. Carskadon, M., Dement, W. 1981. Cumulative effects of sleep restriction on daytime sleepiness. Psychophysiology, 18, 107–113.
6. Wylie, C. D., J. C. Shultz, M. M. Miller, and R. R. Mackie. 1996. Commercial Motor Vehicle Driver Fatigue and Alertness Study Project Report. Goleta, CA: Essex Corporation, Federal Highway Administration (US Department of Transportation), Trucking Research Institute (American Trucking Associations) and Transportation Development Centre, Safety, and Security (Transport Canada).
7. McDonald, N. 1984. Fatigue, Safety and the Truck Driver. London and Philadelphia: Taylor & Francis. pp. 104-115.
8. Kryger, M., Roth, T., Dement, W., eds. 1994. Principles and Practice of Sleep Medicine. 2nd edition. Philadelphia: W.B. Saunders Company.
9. Johnson, L., Naitoh, P. 1974. The Operational Consequences of Sleep Deprivation and Sleep Deficit. AGARD-AG-193, NATO. London: Technical Editing and Reproduction.
10. Rosekind, M., Gander, P., Connel, L.J., Co, E. 1994. Crew Factors in Flight Operations. X: Alertness Management in Flight Operations. NASA/FAA Technical Memorandum DOT/FAA/RD-93/18. Washington, DC: National Aeronautics and Space Administration.
11. National Transportation Safety Board. 1995. Factors That Affect Fatigue in Heavy Truck Accidents. Safety Study NTSB/SS-95/01 and NTSB/SS-95/02. Washington, DC.
12. Folkard, S., Monk, T.H., Lobban, M.C. 1979. Towards a Predictive Test of Adjustment to Shiftwork. Ergonomics 21: 785-799.
13. Thomas, G.R., Raslear, T.G., Kuehn, G.I. 1997. The Effects of Work Schedules on Train Handling Performance and Sleep of Locomotive Engineers: A Simulator Study. DOT/FRA/ORD-97-09. Washington, DC: Federal Railroad Administration.
160
14. Kryger, M.H., Roth, T., Carskadon, M. 1994. Circadian Rhythms in Humans: An Overview. In: Kryger, M.H., Roth, T., Dement, W.C., eds. Principles and Practice of Sleep Medicine. 2nd edition. Philadelphia: W.B. Saunders Company. pp. 301-308.
15. Wylie, C.D., Shultz, T., Miller, J.C., and others. 1996. Commercial Motor Vehicle Driver Fatigue and Alertness Study: Project Report. FHWA-MC-97-002. Washington, DC: Federal Highway Administration.
16. Roehrs, T., Beare, D., Zorick, F., Roth, T. 1994. Sleepiness and Ethanol Effects on Simulated Driving. Alcoholism: Clinical and Experimental Research 18(1): 154-158.
17. Dawson, D., Reid, K. [In preparation]. Equating the Performance Impairment Associated With Sustained Wakefulness and Alcohol Intoxication. Woodville, South Australia: Centre for Sleep Research.
18. Aldrich, M.S. 1994. Cardinal Manifestations of Sleep Disorders. In: Kryger, M.H., Roth, T., Dement, W.C., eds. Principles and Practice of Sleep Medicine. 2nd edition. Philadelphia: W.B. Saunders Company. pp. 413-425.
19. Bliwise, D.L. 1994. Normal Aging. In: Kryger, M.H., Roth, T., Dement, W.C., eds. Principles and Practice of Sleep Medicine. 2nd edition. Philadelphia: W.B. Saunders Company. pp. 26-39.
20. Rosekind, M.R., Graeber, R.C., Dinges D.F., and others. 1993. Crew Factors in Flight Operations. IX: Effects of Planned Cockpit Rest on Crew Performance and Alertness in Long-Haul Operations. NASA Technical Memorandum 108839, DOT/FAA/92/94. Washington, DC: National Aeronautics and Space Administration.
21. Dinges, D.F. 1989. The Nature of Sleepiness: Causes, Context, and Consequences. In: Stunkard, A., Baum, A., eds. Perspectives in Behavioral Medicine: Eating, Sleeping, and Sex. Hillsdale, NJ: Lawrence Erlbaum. pp. 147-179. Chapter 9.
22. Dinges, D.F. 1992. Probing the Limits of Functional Capability: The Effects of Sleep Loss on Short-Duration Tasks. In: Broughton, R.J., Oglivie, R., eds. Sleep, Arousal, and Performance. Boston: Birkhauser-Boston. pp. 176-188. Chapter 12.
23. Pollard, J. K. 1991. Issues in Locomotive Crew Management and Scheduling. USDOT Report # DOT/FRA/RRP-91-06.
24. NTSB. 1999. Evaluation of U.S. department of transportation efforts in the 1990s to address operator fatigue. NTSB/SR-99/01, 1-104. National Transportation Safety Board, Washington, D.C., U.S.A.
25. Rosekind, M.R. 1995. Physiological considerations of fatigue. In Proceedings of the Fatigue Symposium. National Transportation Safety board/NASA Ames Research Center, November 1-2.
161
26. Rosekind, M. R., Gander, P. H.: Gregory, K. B., Smith, R. M., Miller, D.L., Oyung, R., Webbon, L. L., Johnson, J. M. 1996. Managing Fatigue in Operational Settings 1: Physiological Considerations and Countermeasures. Behavioral Medicine, 21 (winter), 157-170.
27. Dinges, D. F., & Kribbs, N. B. 1991. Performing while sleepy: Effects of experimentally induced sleepiness. In T. H. Monk (Ed.) Sleep, Sleepiness, and Performance. New York: Wiley.
28. Dinges, D. F. 1995. The performance effects of fatigue. In Proceedings of the Fatigue Symposium. National Transportation Safety board/NASA Ames Research Center, November 1-2.
29. Coplen, M., Sussman, D. 2000. Fatigue and alertness in the United States railroad industry part 1: the nature of the problem, Transportation Research Part F 3 (2000) 211-228.
30. Grandjean, E. 1988. Fitting the task to the man: a textbook of occupational ergonomics. London: Taylor and Francis.
31. Kogi, K. 1985. Introduction to the problems of shiftwork. In S. Folkard & T.H.Monk (Eds.) Hours of work: temporal factors in work scheduling, pp. 165-184. Chinchester: John Wiley & Sons Ltd.


