Fatigue Determines Endurance Performance: The Training ...
38
Fatigue Determines Endurance Performance: The Training Application USTFCCCA Endurance Symposium 2015
Transcript of Fatigue Determines Endurance Performance: The Training ...

Fatigue Determines Endurance Performance: The Training Application
USTFCCCA Endurance Symposium 2015

“Don’t let fatigue make a coward out of you.”
Steve Prefontaine Runner
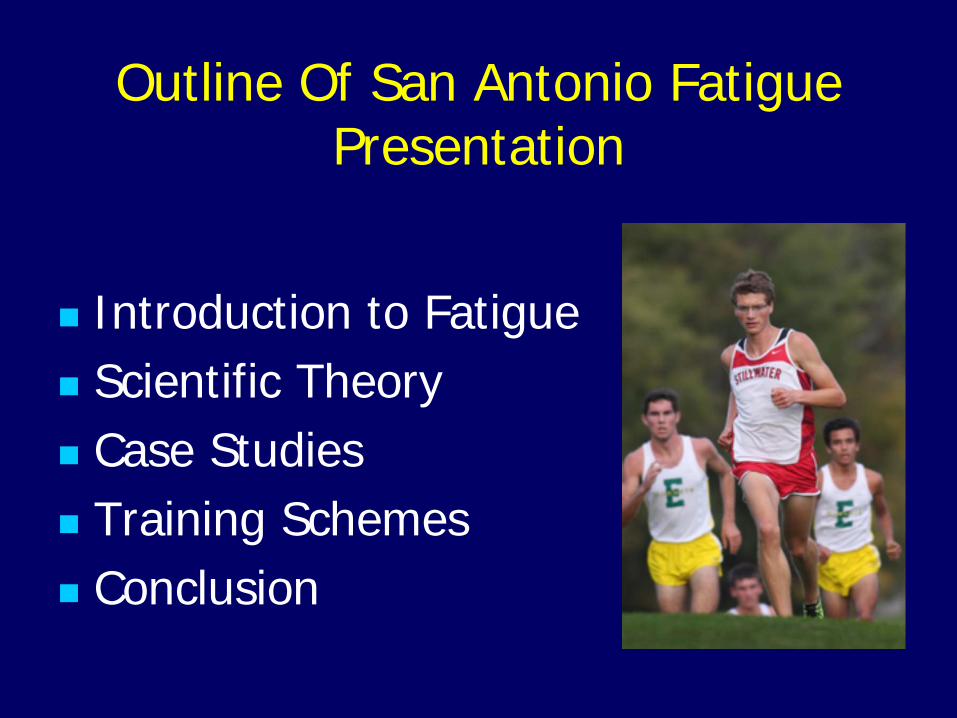
Outline Of San Antonio Fatigue Presentation
Introduction to Fatigue Scientific Theory Case Studies Training Schemes Conclusion

Handling Fatigue is “Training” and Eventually Constitutes “Fitness”
As fatigue is progressively delayed in a distance runner, performance improves.
All other factors being somewhat equal, fatigue determines winners and losers.
The native and trained ability to manage fatigue defines elite.
The athlete with the greatest ability to manage fatigue in distance races “sets the records” at all levels.

Fitness Definition American College of Sports Medicine (2015): Fitness is the biological capacity to carry
out the demands of any activity without undue fatigue.

The Fitness Theory
The Fitness Theory states that if an
external stimulus is applied to a biological system, there will be an orderly tissue adaptation that results. The stimuli must be of an appropriate gradient and directed to specific tissue. Fitness improves as fatigue is delayed.

Fatigue Defined
Fatigue is defined as the inability to maintain a given or expected power or work output.
Fatigue is the lead-up to exhaustion
which is the inability to continue a given or expected power or work output.

Fatigue in Distance Runners
Is it mainly aerobic? i.e. oxygen, glycogen depletion or Is it mainly anaerobic? i.e. lactate, hydrogen ions or Is it mainly muscular? i.e. loss of force production

Fatigue Manifestations
1. A depletion of ingredients needed for respiration (CrP, carbohydrates, fats, oxygen, enzymes).
2. An accumulation of negative byproducts from respiration (hydrogen ions, phosphate ions, carbon dioxide).
3. A limitation at the multi-system interface. (loss of postural strength, heat issues, cold issues, dehydration)

1. Carbohydrate Depletion? Body stores about 490 g of
carbohydrate. Total carbohydrate requirement to
exhaustion: Anaerobic Aerobic
5000 meters
8 g 93 g
10,000 meters
8 g 176 g

Energy Sources in Working Muscles (% Contribution at .70 vVO2 max)
Running Time (min)
Blood Glucose
Fatty Acids Muscle Glycogen
40 37 27 36
90 41 63 22
120 40 58 18
180 38 52 14

Muscle Glycogen Depletion
Muscle Glycogen Depletion at 80% vVO2 max
0
20
40
60
80
100
0 10 20 30 40 50 60 70 80
Time (min)
Mus
cle
Gly
coge
n P
rese
nt
(mm
ol/k
g)
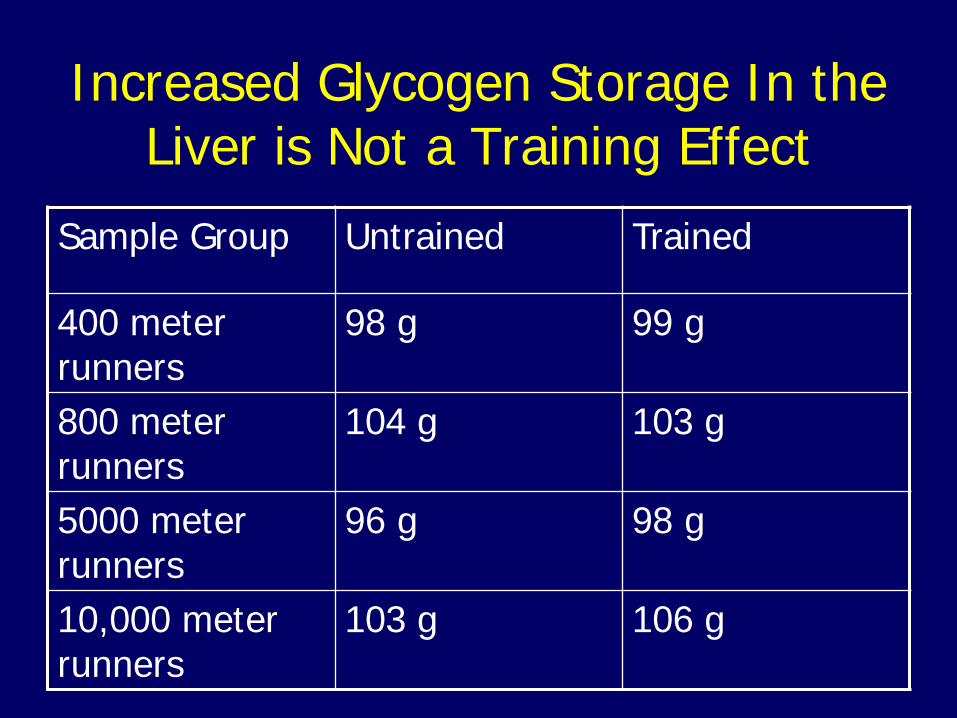
Increased Glycogen Storage In the Liver is Not a Training Effect
Sample Group Untrained Trained
400 meter runners
98 g 99 g
800 meter runners
104 g 103 g
5000 meter runners
96 g 98 g
10,000 meter runners
103 g 106 g

Increased Muscle Glycogen Storage is a Training Effect
Untrained samples tested Muscle glycogen stores of 66.3 mmoL/kg of wet muscle weight
800 meter runners tested
Muscle glycogen stores of 86.3 mmoL/kg of wet muscle weight
10000 meter runners tested Muscle glycogen stores of 133.5 mmoL/kg of wet
muscle weight

Ingestion Case Study Example Subjects: 10 elite Kenyan (Kalenjin sub-
tribe) runners housed at GSC Training Camp. 30 days prior to IAAF World XC.
7 Day Study: Meals at 8, 10, 13, 16, and 19 hundred hours.
Mean Energy Intake: 2987 KCAL/day. Mean Energy Expenditure: 3605 KCAL/day. Carbo: 76.4% (10.4 g/kg BM), Fat: 13.4%
(1.8 g/kg BM), protein: 10.1% 1.3 g/kg BM)

Carbohydrate depletion is not a major factor of fatigue for track distance and cross country runners.
But, oxygen depletion is.

2. Metabolite Accumulation in Distance Runner Fatigue?
Improvement in performance is gained through the following:
Faster removal of lactate/hydrogen Higher tolerance of lactate/hydrogen

Why Worry About Anaerobic Fatigue in Cross Country?
Anaerobic Contribution in Segments of a 6k
<--Start
Finish
020406080
100
0 800 1600 2400 3200 4000 4800 5600
400 Meter Segments
% A
naero
bic

Produced Blood Lactate Levels are Race Specific
Distance % Lactate Anaerobic
mmol/L Lactate
800 meters 44% 21 mmol/L 1600 meters 19% 15 mmol/L 3200 meters 13% 12 mmol/L 5000 meters 8% 9 mmol/kg 8000 meters 7% 6 mmol/kg 10,000 meters 5% 4 mmol/L 12,000 meters 4% 3 mmol/kg

Lactate Training Dilemma Single training session
mitochondrial damage from lactate
Yes, successful
endurance racing requires a Mid Lactate Response (HLR)
But, successful distance racing mainly requires a well developed aerobic energy system.
Lactate present mmol/L
% damage of mitochondrial numbers
7 mmol/L 3% 8-15 mmol/L 5% 16-25 mmol/L 8%

Translation to Broad Lactate Training Parameters
Training Zone A: 3.0 mmol/L to 12.0 mmol/L, 12 k pace to 3 k pace. A Shifting of the lactate threshold occurs. Faster removal of lactate is main adaptation.
Training Zone B: 12.0 mmol/L to 23 mmol/L.
3 k pace to 400 meter pace. Tolerance of higher lactate (H+) is main adaptation.

Shifting the Lactate Threshold
High Lactate Response Curve
02468
101214
4 6 8 10 12 14Speed (mph)
Blo
od
Lact
ate
(m
mol
/L)
Trained Untrained


Stillwater Fatigue Study Part 1
12000 meter timed run Eli Krahn vLT HR
(bpm) Lactate (mmol/L)
Velocity (m/s)
2013 169 3.15 4.88
2014 171 3.54 5.13
2015 171 3.32 5.27

Stillwater Fatigue Study Part 2 Tested Lactate Values
3579
1113151719
0 2 4 6 8 1012141618202224262830Time (minutes)
Lact
ate
(mm
ol/L
)

Metabolite accumulation is a major cause of fatigue in track distance and cross country runners.

3. Multi-System Limitations
Lessening of postural strength Landing platform fluctuates Stride length is compromised
Lessening of leg strength Movement vectors become skewed
horizontally Stride rate is compromised
Extended ground contact time

Multi-system limitation fatigue is a contributing factor to performance deterioration in some track distance and cross country runners.

Workout Application

Relating Lactate Runs to vVO2 max
Training Term: % vVO2 max Lactate mmol/L
Also Called:
Lactate Run 3 84-89% 2.8-6.0 Mean = 4.0
Threshold/ critical pace
Lactate Run 2 79-83% 3.5 mmol/L
Tempo runs
Lactate Run 1 70-78% 3.0 mmol/L
General strength runs

Lactate Threshold 3 Run This is a very long tempo run, or more accurately termed a
lactate threshold type 3 run by the IAAF. This run is to determine aerobic capacity or what we also call running economy. Once you get the accurate 7 mile time, calculate the per mile pace. Is it about 85% of vVO2 max pace as it should be?
2 mile active warm-up. Four or five 60 meter strides just after active
warm-up. Extent of run is a replicable course of 7-8 miles. Intensity is all out and ultimately linked to a %
of date vVO2 max pace as it relates to individual LT pace. Lactate higher in experienced runners.

Lactate Threshold 3 Done as Intervals 7 x 500. 45 sec recovery. Lactate in
mmol/L
Pre-Lactate Post-Lactate Time 500 #1 3.4 4.8 96.0 500 #2 3.7 4.7 95.9 500 #3 3.7 4.8 94.3 500 #4 3.6 4.8 96.6 500 #5 3.7 4.7 95.9 500 #6 3.7 4.8 97.2 500 #7 3.7 4.8 96.2 500 #8 4.3 15.9 98.1

Tempo Run Lactate Threshold 2 Run
Light stretch before run. 2 mile active warm-up similar to race day. Intensity is near date pace lactate
threshold (LT). 80-84% of 3200 test. Extent of run is 4-5 miles accurately
timed. NOT A 5 MILE RACE.

Lactate Threshold 1 Run
60 - 90 minutes of continuous running at 3.0 mmol/L or just over the lactate threshold. Pace is about 75% of vVO2 max pace
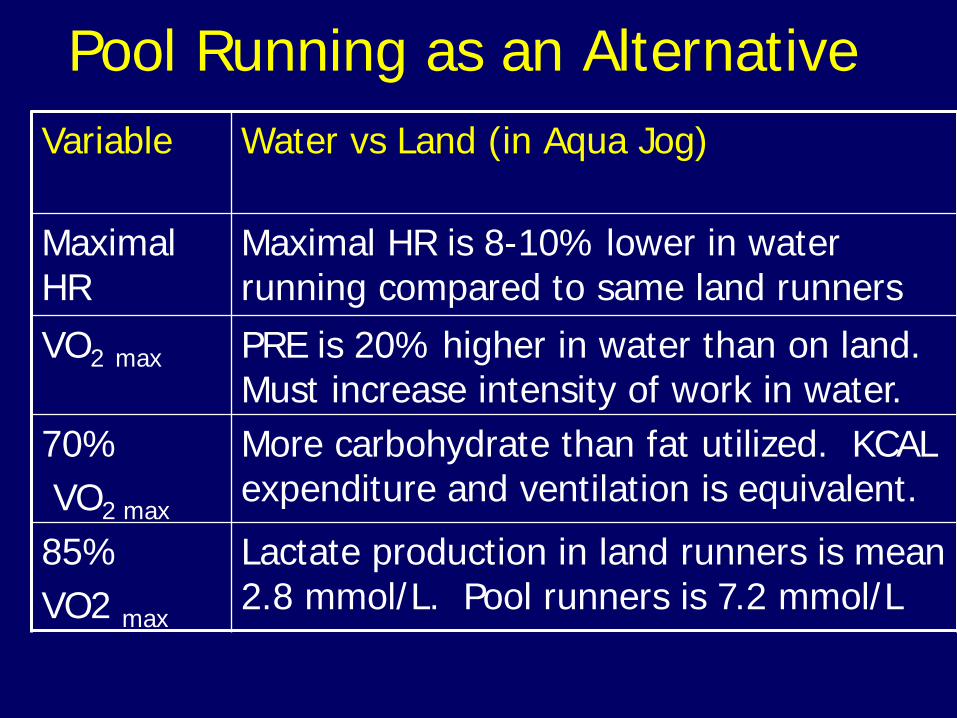
Pool Running as an Alternative Variable Water vs Land (in Aqua Jog)
Maximal HR
Maximal HR is 8-10% lower in water running compared to same land runners
VO2 max PRE is 20% higher in water than on land. Must increase intensity of work in water.
70% VO2 max
More carbohydrate than fat utilized. KCAL expenditure and ventilation is equivalent.
85% VO2 max
Lactate production in land runners is mean 2.8 mmol/L. Pool runners is 7.2 mmol/L

Strength Workout– Long Hills
2 mile warm-up. Jog first mile. Last mile incorporate skipping, bounding, etc. Last 200 meters at a very fast pace.
3 x 4 minute hill, 2-3% grade, jog return.
2 mile cool down @AT pace

Lactate Analysis at vVO2 max 5 x 1600 at 4:30, 4:30 rest (8:58 DP) Pre-
Lactate (mmol/L)
Post-Lactate (mmol/L)
Velocity (m/s)
1600 #1 3.3 8.2 5.92 1600 #2 3.6 8.8 6.03 1600 #3 3.7 9.4 6.01 1600 #4 4.2 9.8 5.86 1600 #5 4.9 9.8 5.94

Conclusion Fatigue is the inability to maintain a high
level of work. Distance races are at a sub-maximal work
rate. Fatigue in distance runners is directly linked
to aerobic, anaerobic, and muscular limitations.
Prescribe training sessions that stimulate all three areas of fatigue.
Recovery principles are crucial in understanding fatigue.