Fatigue assessment of tubular structures
11
CALCULATIONS Magazine of Civil Engineering, №1, 2013 Петинов С.В., Гучинский Р.В. О расчетах долговечности трубчатых конструкций Fatigue assessment of tubular structures Post-graduate student R.V. Guchinsky; D.Sc., professor S.V. Petinov*, Saint-Petersburg State Polytechnical University Key words: Fatigue damage accumulation; «Strain-Life» approach; S-N criteria; Fatigue of tubular structures; FEA modeling of tubular and pipeline structures General An essential component of current rules for fatigue design of steel structures, e.g., [4, 6, 9], etc. is the linear damage summation, Palmgren-Miner, rule. It fits the widely used approaches, when the S-N criteria, or «Strain-Life» criteria for fatigue crack initiation are applied, and also when the residual fatigue life should be assessed in the crack propagation phase. The damage assessment is recommended to carry out in the common form when the S-N criteria for fatigue are applied: 1 / ( ) ( */ ) ( ) m m i i i i i i i i i D n N C n S N C p S , (1) where i is the number of equivalent 1 cyclic stress components in the stress block, i n is the number of equivalent stress cycles in stress block components, * N is the number of stress «cycles» which experiences the structure through the service life, / * i i p n N is the fraction of the stress cycles i n in the life-long loading history, i N is the number of cycles to failure at constant stress range i S , is the «usage factor», total time of exposure to fluctuating loading related to prescribed service life, C and m are parameters of a fatigue failure criterion, e.i.: () / m NS CS . (2) Bolotin [1] considered characterization of the loading history by continuous function of distribution of probabilities and proposed transformation of the damage summation scheme (1) into the integral form by defining the number of stress cycles i n in the step-wise block form as the following: * () i n N p S dS , (3) where * N is the total number of load (stress) fluctuations over the intended service life (or a specified period of time), ( ) pS is the probability of the stress range to occur in a range of dS . Respectively, the sum (1) is expressed as max min / * ( ( )/ ( )) S i i i S D n N N pS NS dS . (4) This relationship can be readily used to estimate the total fatigue damage, which may be accumulated through service life of an industrial or marine structure or, alternatively, the number of stress excursions, * N , over the intended service life, fatigue life, instead of the summation format (1). By this reason development of a controversial procedure, i.e. transforming of the right-hand part of (4) into the common form (1) may seem needless. This may be true, when the S-N criteria are applied for fatigue analysis of structures and loading history is given by the stress probability distribution function. However, the mentioned transforming may be helpful in assessment of residual fatigue life of redundant structures where cracks are allowed within the safe limits, especially when reduction of irregular loading history into equivalent cyclic loading should be done as recommended by present codes [4, 6, 7]. Also, it may be a necessary component of fatigue analysis based on «Strain-Life» approach 1 The term «equivalent» is applied here since the irregular loading is substituted by cyclic loading successions 39
Transcript of Fatigue assessment of tubular structures
CALCULATIONS Magazine of Civil Engineering, №1, 2013
Петинов С.В., Гучинский Р.В. О расчетах долговечности трубчатых конструкций
Fatigue assessment of tubular structures
Post-graduate student R.V. Guchinsky; D.Sc., professor S.V. Petinov*,
Saint-Petersburg State Polytechnical University
Key words: Fatigue damage accumulation; «Strain-Life» approach; S-N criteria; Fatigue of tubular structures; FEA modeling of tubular and pipeline structures
General An essential component of current rules for fatigue design of steel structures, e.g., [4, 6, 9], etc. is
the linear damage summation, Palmgren-Miner, rule. It fits the widely used approaches, when the S-N criteria, or «Strain-Life» criteria for fatigue crack initiation are applied, and also when the residual fatigue life should be assessed in the crack propagation phase.
The damage assessment is recommended to carry out in the common form when the S-N criteria for fatigue are applied:
1/ ( ) ( * / ) ( )m mi i i i i i
i i i
D n N C n S N C p S , (1)
where i is the number of equivalent1 cyclic stress components in the stress block, in is the number of
equivalent stress cycles in stress block components, *N is the number of stress «cycles» which
experiences the structure through the service life, / *i ip n N is the fraction of the stress cycles in in
the life-long loading history, iN is the number of cycles to failure at constant stress range iS , is the
«usage factor», total time of exposure to fluctuating loading related to prescribed service life, C and m are parameters of a fatigue failure criterion, e.i.:
( ) / mN S C S . (2)
Bolotin [1] considered characterization of the loading history by continuous function of distribution of probabilities and proposed transformation of the damage summation scheme (1) into the integral form
by defining the number of stress cycles in in the step-wise block form as the following:
* ( )in N p S dS , (3)
where *N is the total number of load (stress) fluctuations over the intended service life (or a specified
period of time), ( )p S is the probability of the stress range to occur in a range of dS . Respectively, the
sum (1) is expressed as
max
min
/ * ( ( ) / ( ))S
i ii S
D n N N p S N S dS . (4)
This relationship can be readily used to estimate the total fatigue damage, which may be accumulated through service life of an industrial or marine structure or, alternatively, the number of stress excursions, *N , over the intended service life, fatigue life, instead of the summation format (1).
By this reason development of a controversial procedure, i.e. transforming of the right-hand part of (4) into the common form (1) may seem needless. This may be true, when the S-N criteria are applied for fatigue analysis of structures and loading history is given by the stress probability distribution function.
However, the mentioned transforming may be helpful in assessment of residual fatigue life of redundant structures where cracks are allowed within the safe limits, especially when reduction of irregular loading history into equivalent cyclic loading should be done as recommended by present codes [4, 6, 7]. Also, it may be a necessary component of fatigue analysis based on «Strain-Life» approach
1 The term «equivalent» is applied here since the irregular loading is substituted by cyclic loading successions
39
Инженерно-строительный журнал, №1, 2013 РАСЧЕТЫ
Петинов С.В., Гучинский Р.В. О расчетах долговечности трубчатых конструкций
which includes an appropriate Strain-Life criterion and the Neuber’s formula-based technique of evaluation the local strain range [17].
The procedure is exemplified in case of application of the «Strain-Life» approach in this paper. Therefore it may be reasonable first to display the technique of reducing the long-term stress distribution into a set of cyclic loading successions (histogram) equivalent by fatigue damaging to the random loading «history» through the service life.
Description of the procedure Application of the damage summation procedure (1) presumes, as said in above, expressing the
long-term stress range probability distribution function in the form of stress histogram, consisting of
blocks of equivalent cyclic loading successions at stress ranges iS with number of stress repetitions in .
It is noted [4] that the number of equivalent stress successions, «steps», should be selected «large enough to ensure reasonable numerical accuracy, and should not be less than 20…». However, the
explicit recommendations on evaluation of representative stress ranges iS and respective number of
stress cycles in in every of the block «steps» are missing.
To solve this problem, a procedure is proposed, as follows. In the context of recommended reducing the long-term distribution to the block-type composition of equivalent cyclic loading successions, first the whole range of service stress in the accepted stress distribution should be subdivided into several sub-ranges, steps, the number of which may be provisional, not necessarily equal 20. Then the partial damage corresponding to every of the i steps in the block-type damage summation (1) should be calculated using the general form (4):
max,
min,
* ( ( ) / ( ))i
i
S
i
S
d N p S N S dS . (5)
in which min, max,,i iS S are the minimum and maximum stress ranges of the « i » step of the block form (1).
Further, the number of equivalent stress cycles in every of the i steps is found as
max,
min,
* ( )i
i
S
i
S
n N p S dS . (6)
Since the partial damage is defined in the linear summation procedure (1) as
( ) ( ) / ( )i i i i id S n S N S , in which iS may be regarded an equivalent cyclic stress range of the « i » step,
this stress range is obtained using the partial damage definition and fatigue criterion (2) as:
1/, ( / ) m
i eq i iS Cd n . (7)
The loads, e.g., on bridge structures are typically classified into permanent loads due to self-weight of structural members, fixed equipment, variable loads caused by traffic, wind, diurnal and season changes of ambient temperature, and accidental loads caused by feasible vehicle impacts. Depending on the technique of recording and representation of service variable loads, the loading history may be given, alternatively, in the form of stress histogram or of stress continuous probability distribution function.
In marine applications, e.g., the wave loads and, respectively, local stress probability distributions are typically approximated in the form of the two-parameter Weibull «law» ([4, 17], etc.):
1 1( ) exp( ( / ) )ksQ S S S a . (8)
which is read as the probability to exceed an arbitrary stress range 1S ; ,sa k are the scale and shape of
the distribution parameters, respectively. The probability density function, ( )p S , of the Weibull
distribution (8) is given by:
1
( ) exp( ( / ) )k
ksk
s
dQ kSp S S a
dS a
. (9)
40
CALCULATIONS Magazine of Civil Engineering, №1, 2013
Петинов С.В., Гучинский Р.В. О расчетах долговечности трубчатых конструкций
Substituting (9) into (6), one finds the number of equivalent stress cycles in every of the i steps:
max,
min,
1*( ( / ) )
i
i
S
k ki sk
s S
kNn S exp S a dS
a . (10)
And respective partial damage values, when the S-N criterion (2) is applied are defined as:
max,
min,
1*( ( / ) )
i
i
S
m k ki sk
s S
kCNd S exp S a dS
a . (11)
Further, the equivalent stress ranges for every of the block scheme steps i in (1) should be found from equation (7). And then the total fatigue damage is calculated substituting (10) and (7) into the sum (1):
,, ,
*1/
mo eqm m
i i i i eq i i eqi i i
N SD n N n S p S
C C , (12)
where , , 0,/m m mi eq i eq eqS S S , in which the reference stress range, 0,eqS , is selected from the set of obtained
values (12), components of the block scheme.
In the following, the above described procedure is implemented in fatigue assessment of brace and chord welded joint detail of the tubular frame bridge structure when the «Strain-Life» approach is applied.
Application to fatigue assessment of a bridge tubular frame welded joint detail
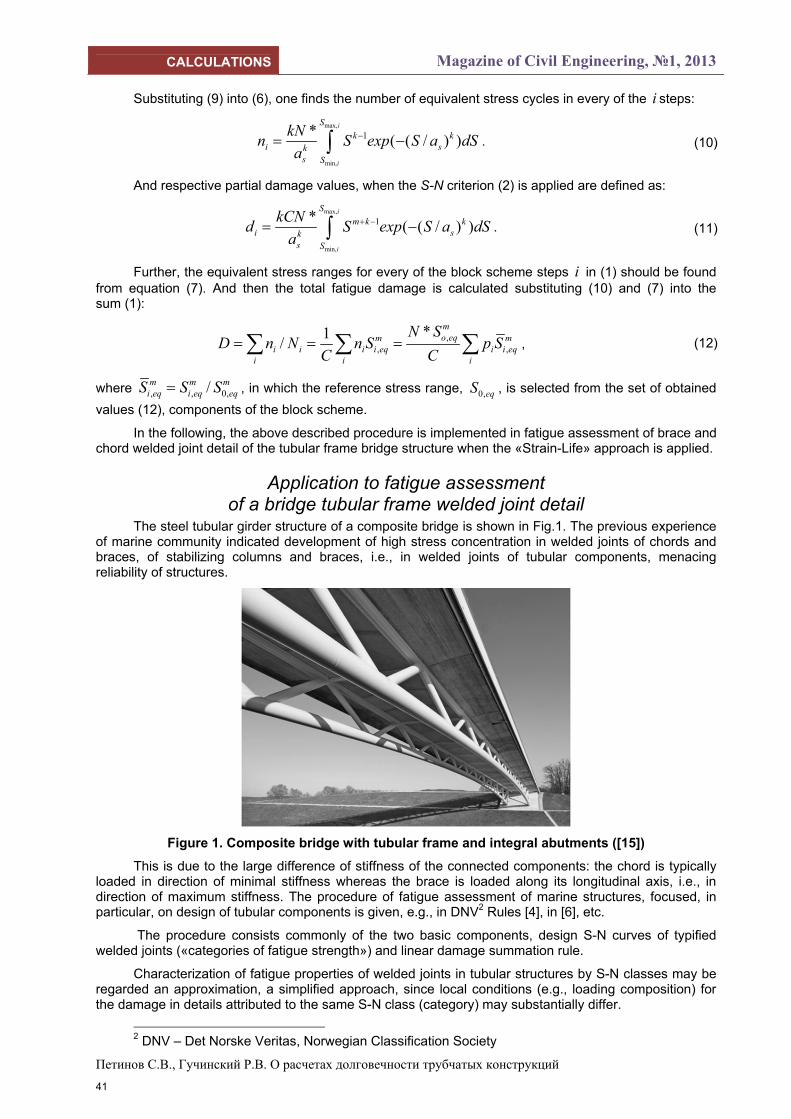
The steel tubular girder structure of a composite bridge is shown in Fig.1. The previous experience of marine community indicated development of high stress concentration in welded joints of chords and braces, of stabilizing columns and braces, i.e., in welded joints of tubular components, menacing reliability of structures.
Figure 1. Composite bridge with tubular frame and integral abutments ([15])
This is due to the large difference of stiffness of the connected components: the chord is typically loaded in direction of minimal stiffness whereas the brace is loaded along its longitudinal axis, i.e., in direction of maximum stiffness. The procedure of fatigue assessment of marine structures, focused, in particular, on design of tubular components is given, e.g., in DNV2 Rules [4], in [6], etc.
The procedure consists commonly of the two basic components, design S-N curves of typified welded joints («categories of fatigue strength») and linear damage summation rule.
Characterization of fatigue properties of welded joints in tubular structures by S-N classes may be regarded an approximation, a simplified approach, since local conditions (e.g., loading composition) for the damage in details attributed to the same S-N class (category) may substantially differ.
2 DNV – Det Norske Veritas, Norwegian Classification Society
41
Инженерно-строительный журнал, №1, 2013 РАСЧЕТЫ
Петинов С.В., Гучинский Р.В. О расчетах долговечности трубчатых конструкций
This difference would result in uncertainty of assessment of bridge structure fatigue life. The rules for fatigue analysis of marine structures [4] employ S-N curves for base and weld materials only (with differentiation by corrosion protection); the shape of details in connection, specifics of the stress flow transfer through the joint is considered by evaluation of the stress concentration factors for the expected critical locations. The approach seems offering reduced range of uncertainties pertaining to the stress analysis of structure, and respectively, a more convincing evaluation of fatigue life.
Meanwhile the S-N criteria-based procedures operate with implication of linear elastic material behavior when stresses at critical locations are evaluated, whether the hot-spot or local stress via the respective stress concentration factors are used [7, 9, 10]. By this the physical nature of fatigue damage process in polycrystalline material structure, which realizes through cyclic microplasticity, is underestimated. This may result in excessive conservatism in estimation of fatigue life, in particular, in the range of the most frequent (moderate) service load excursions.
One more issue should be considered when the S-N criteria are applied: this is uncertainty in definition of the scale of fatigue damage in structure related to exhaustion of fatigue life. The S-N criteria are related almost to separation in two pieces of test specimens; the testing machines are supplied with devices which terminate test when stiffness of specimen would substantially drop down. By this moment fatigue crack may grow over large part of the specimen crossection (which is typically, according to the IIW3 recommendations, 100 by 22 mm). When the S-N criterion is applied to fatigue analysis of welded joints with specific geometry and stress field, the respective crack size occurs uncertain. The rules [2, 4, 9] assume (but did not prove it) that exhaustion of design fatigue life of tubular welded joints may be related to a through-thickness crack. Ever since, this subject was not commented in the design codes.
In the sense of mentioned problems, the «Strain-Life» criteria-based approach may be preferred. It allows considering material cyclic plasticity, the leading mechanism of fatigue damage (although with problems in high-cycle range), and to almost exclude ambiguity of the damage indication: fatigue crack corresponding to properties of criteria is about the stress concentration zone. In welded joints the depth of the zone is around the radius of the weld toe, i.e. about 1 mm.
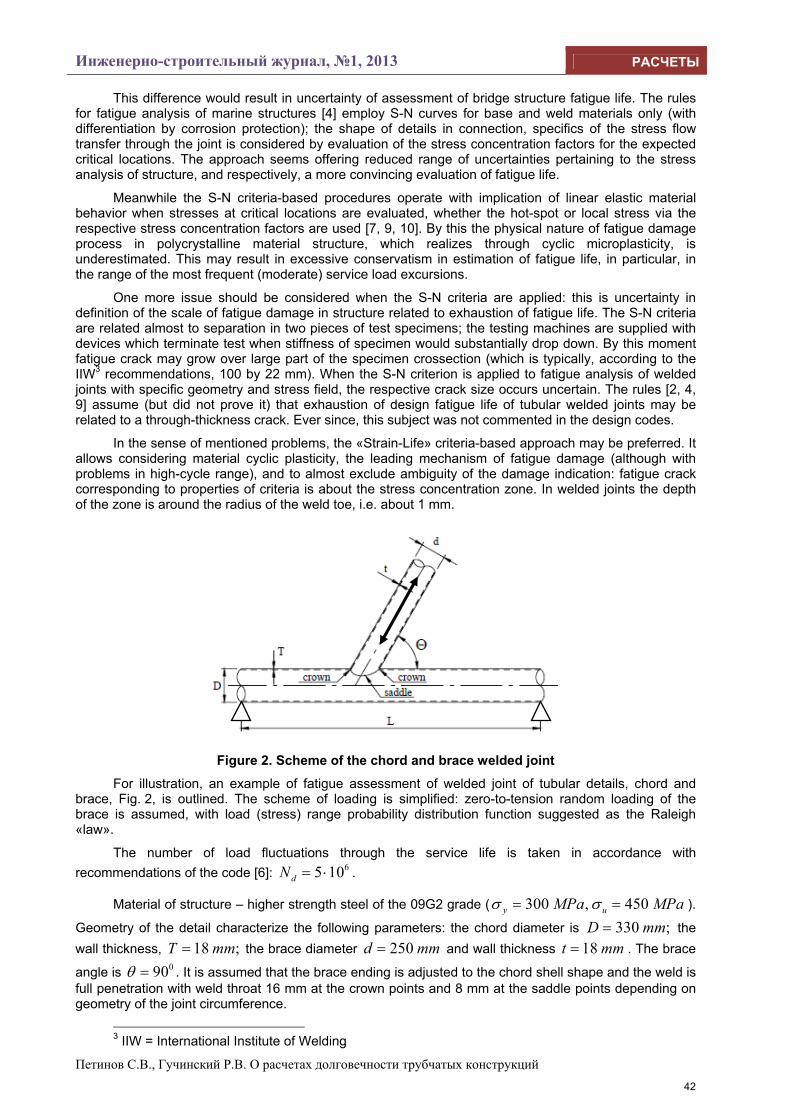
Figure 2. Scheme of the chord and brace welded joint
For illustration, an example of fatigue assessment of welded joint of tubular details, chord and brace, Fig. 2, is outlined. The scheme of loading is simplified: zero-to-tension random loading of the brace is assumed, with load (stress) range probability distribution function suggested as the Raleigh «law».
The number of load fluctuations through the service life is taken in accordance with
recommendations of the code [6]: 65 10dN .
Material of structure – higher strength steel of the 09G2 grade ( 300 , 450y uMPa MPa ).
Geometry of the detail characterize the following parameters: the chord diameter is 330 ;D mm the
wall thickness, 18 ;T mm the brace diameter 250d mm and wall thickness 18t mm . The brace
angle is 090 . It is assumed that the brace ending is adjusted to the chord shell shape and the weld is full penetration with weld throat 16 mm at the crown points and 8 mm at the saddle points depending on geometry of the joint circumference.
3 IIW = International Institute of Welding
42

CALCULATIONS Magazine of Civil Engineering, №1, 2013
Петинов С.В., Гучинский Р.В. О расчетах долговечности трубчатых конструкций
The «Strain-Life» approach in its simplest form consists of the two obtained empirically principal components: the Strain-Life criterion for fatigue of material under the scope of analysis, and generalized cyclic diagram giving the generalized description of elastic-plastic cyclic properties of the same material. Several versions of the criterion are known [3, 5, 11]; in the present analysis a simplified modified form [17] is selected:
12p e t fCN K E K , (13)
where for the steel of the 09G2 grade 10.340, 0.654; 90,C MPa, is the fatigue limit stress
of the heat-affected zone, rolling skin removed [12, 17, 18]; β = 0.55, is the correction for the fatigue
resistance decreasing under irregular loading [6]; tK is the theoretical («elastic») stress concentration
factor (SCF) and fK is the fatigue notch factor.
The rules recommend formulae to calculate (SCF) addressed to the hot-spot stress approach, which is not applicable in the Strain-Life format. Respectively, the stress concentration factor values should be obtained for the critical locations in the joint («crown» and «saddle» points) by the finite element analysis (FEA).
Fatigue notch factor, Kf, may be approximated by Peterson’s formula 1 ( 1) /(1 / )f tK K g r
[16], where r is the notch root (weld toe) radius, assumed here as r = 1 mm, g is the «material structure parameter», a volume at the weld toe which depth approximately corresponds to fatigue crack transition from the shear into the normal opening mode [13]. For structural steels with the yield stress in the range
235 – 390 MPa this parameter may be defined by relationship: 1.160.38(350/ )ug [16, 17], where σu is
the ultimate strength, MPa.
Modified criterion (13) provides somewhat conservative estimations of the damage in the
«transition» number of load cycles, 510N ; however, to partly compensate it, the criterion is completed
with corrections to the «elastic term», e , to account for effects of material microplasticity at the stress
concentration area, ( / )t fK K , and irregular loading, , on the damage accumulation.
The cyclic strains at the weld toe are estimated by applying the Neuber’s formula-based technique [17]. Basically, Neuber’s formula presents heuristic relationship between stress and strain concentration factors when elastic-plastic material behavior is assumed [14]:
2tK K K , or 2( ) /t nK E , (14)
where n is the nominal stress range, and are the stress and strain ranges, respectively; E
is the elasticity modulus.
Applicability of (14) for fatigue analyses was proved since 1960s for stress concentrations with rather unconstrained cyclic plasticity [5, 12, 17], etc. The usefulness of the (14) in engineering procedures is due to necessity of performing only once elastic analysis of a structure (for a given loading mode), in particular, by FEA. Current FEA packages allow cyclic elastic-plastic analysis; however, it has to be carried out many times to cover the whole range of service stresses, which turns a laborious issue.
The stress and strain ranges at a stress concentration in (14) are interrelated by the cyclic stress-strain diagram, which readily allows evaluation of the cyclic strain range at the notch, .
The technique of evaluation stress range differing from typically recommended ([5, 8],
etc.) is illustrated in Fig. 3.
Figure 3. Evaluation of the local strain range by Neuber’s formula and cyclic curve
43
Инженерно-строительный журнал, №1, 2013 РАСЧЕТЫ
Петинов С.В., Гучинский Р.В. О расчетах долговечности трубчатых конструкций
Stress and corresponding strain ranges of the cyclic curve are multiplied and the products are plotted with respect to the strain range axis, as shown in Fig. 3.
As follows from (14), 2( ) /t nK E ; one needs to calculate nominal stress and stress
concentration factor, and the respective strain range can be obtained from the graph.
If nominal stress can not be defined, e.g. when the beam theory is not applicable, the local stress at a critical location calculated on assumption of elastic behavior of material may be used instead of
product t nK in (14).
Stress analysis aimed at evaluation of the stress concentration factors at the mentioned critical locations was carried out using the ANSYS software. The finite-element (FE) model of the detail was designed so that the necessary stress resolution was attained at the weld toes4 of the joint circumference. The minimum finite element size at the assumed rounded weld toe was taken equal 0.2 of the weld toe radius, in coherence with past experience of numerical and experimental studies of stress concentrations [17].
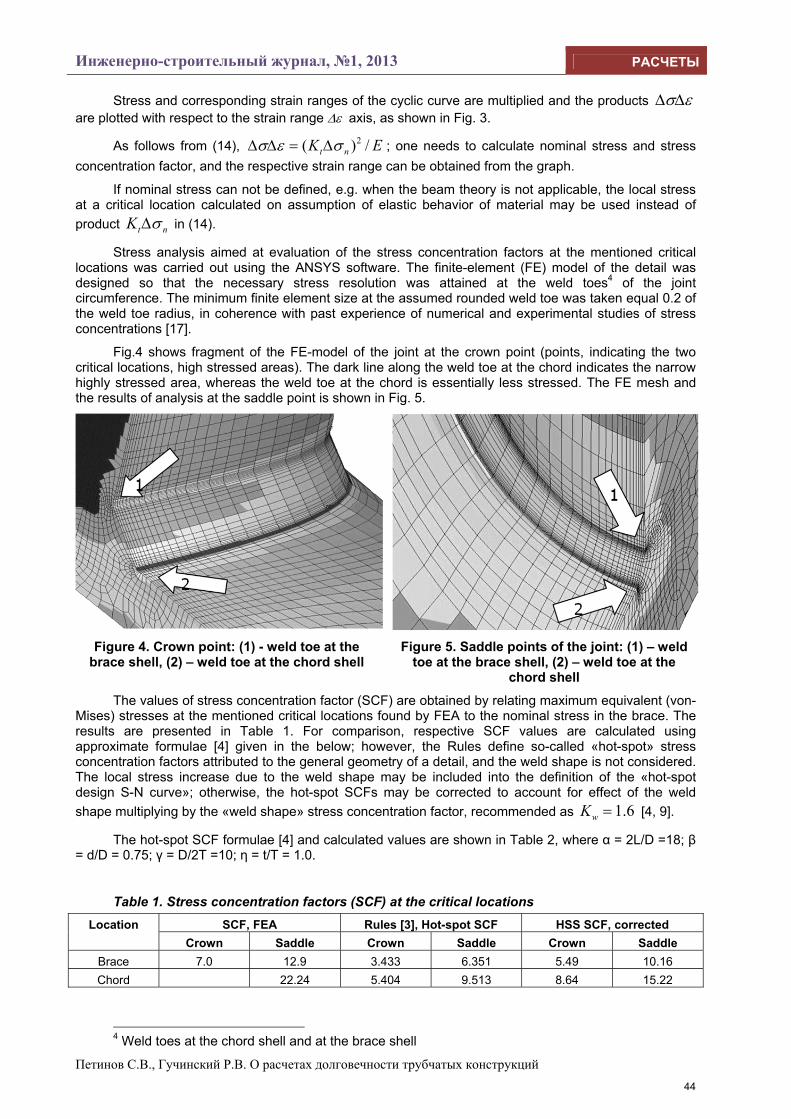
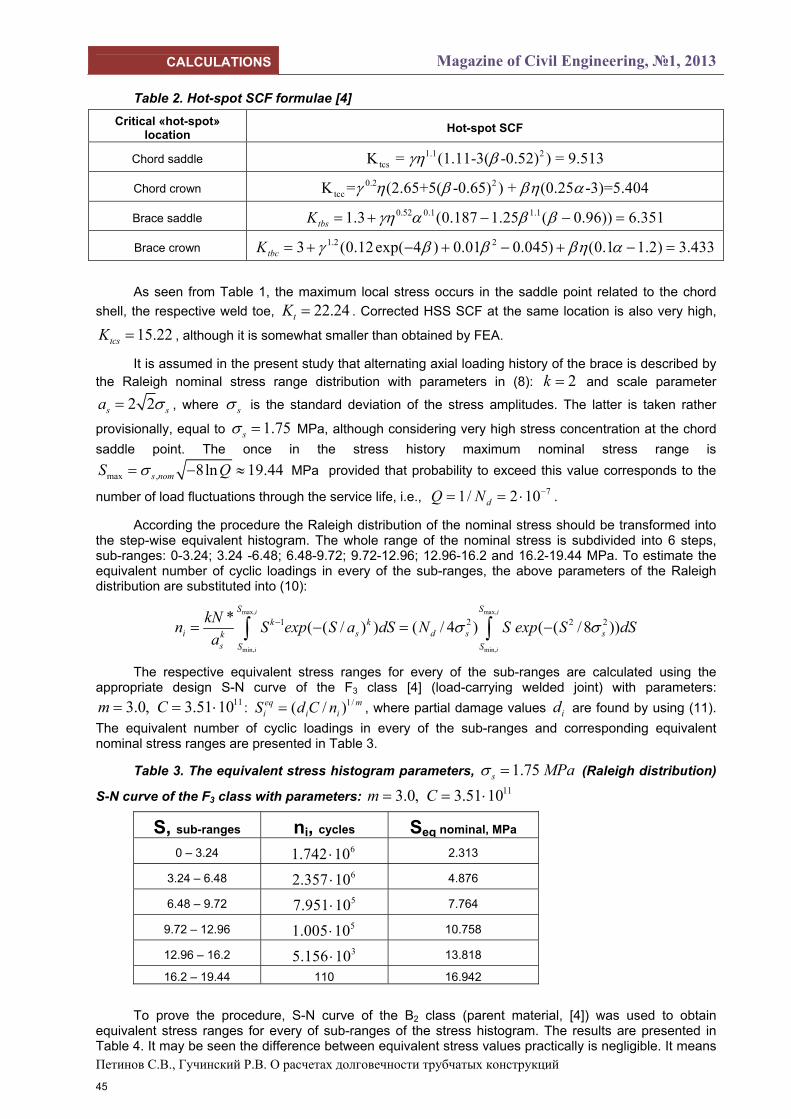
Fig.4 shows fragment of the FE-model of the joint at the crown point (points, indicating the two critical locations, high stressed areas). The dark line along the weld toe at the chord indicates the narrow highly stressed area, whereas the weld toe at the chord is essentially less stressed. The FE mesh and the results of analysis at the saddle point is shown in Fig. 5.
Figure 4. Crown point: (1) - weld toe at the brace shell, (2) – weld toe at the chord shell
Figure 5. Saddle points of the joint: (1) – weld toe at the brace shell, (2) – weld toe at the
chord shell
The values of stress concentration factor (SCF) are obtained by relating maximum equivalent (von-Mises) stresses at the mentioned critical locations found by FEA to the nominal stress in the brace. The results are presented in Table 1. For comparison, respective SCF values are calculated using approximate formulae [4] given in the below; however, the Rules define so-called «hot-spot» stress concentration factors attributed to the general geometry of a detail, and the weld shape is not considered. The local stress increase due to the weld shape may be included into the definition of the «hot-spot design S-N curve»; otherwise, the hot-spot SCFs may be corrected to account for effect of the weld
shape multiplying by the «weld shape» stress concentration factor, recommended as 1.6wK [4, 9].
The hot-spot SCF formulae [4] and calculated values are shown in Table 2, where α = 2L/D =18; β = d/D = 0.75; γ = D/2T =10; η = t/T = 1.0.
Table 1. Stress concentration factors (SCF) at the critical locations
Location SCF, FEA Rules [3], Hot-spot SCF HSS SCF, corrected
Crown Saddle Crown Saddle Crown Saddle
Brace 7.0 12.9 3.433 6.351 5.49 10.16
Chord 22.24 5.404 9.513 8.64 15.22
4 Weld toes at the chord shell and at the brace shell
44
CALCULATIONS Magazine of Civil Engineering, №1, 2013
Петинов С.В., Гучинский Р.В. О расчетах долговечности трубчатых конструкций
Table 2. Hot-spot SCF formulae [4]
Critical «hot-spot» location
Hot-spot SCF
Chord saddle 1.1 2
tcsK = (1.11-3( -0.52) ) = 9.513
Chord crown 0.2 2
tccK = (2.65+5( -0.65) ) + (0.25 -3)=5.404
Brace saddle 0.52 0.1 1.11.3 (0.187 1.25 ( 0.96)) 6.351tbsK
Brace crown 1.2 23 (0.12exp( 4 ) 0.01 0.045) (0.1 1.2) 3.433tbcK
As seen from Table 1, the maximum local stress occurs in the saddle point related to the chord
shell, the respective weld toe, 22.24tK . Corrected HSS SCF at the same location is also very high,
15.22tcsK , although it is somewhat smaller than obtained by FEA.
It is assumed in the present study that alternating axial loading history of the brace is described by the Raleigh nominal stress range distribution with parameters in (8): 2k and scale parameter
2 2s sa , where s is the standard deviation of the stress amplitudes. The latter is taken rather
provisionally, equal to 1.75s MPa, although considering very high stress concentration at the chord
saddle point. The once in the stress history maximum nominal stress range is
max , 8ln 19.44s nomS Q MPa provided that probability to exceed this value corresponds to the
number of load fluctuations through the service life, i.e., 71/ 2 10dQ N .
According the procedure the Raleigh distribution of the nominal stress should be transformed into the step-wise equivalent histogram. The whole range of the nominal stress is subdivided into 6 steps, sub-ranges: 0-3.24; 3.24 -6.48; 6.48-9.72; 9.72-12.96; 12.96-16.2 and 16.2-19.44 MPa. To estimate the equivalent number of cyclic loadings in every of the sub-ranges, the above parameters of the Raleigh distribution are substituted into (10):
max, max,
min, min,
1 2 2 2*( ( / ) ) ( / 4 ) ( ( /8 ))
i i
i i
S S
k ki s d s sk
s S S
kNn S exp S a dS N S exp S dS
a
The respective equivalent stress ranges for every of the sub-ranges are calculated using the appropriate design S-N curve of the F3 class [4] (load-carrying welded joint) with parameters:
113.0, 3.51 10m C : 1/( / )eq mi i iS d C n , where partial damage values id are found by using (11).
The equivalent number of cyclic loadings in every of the sub-ranges and corresponding equivalent nominal stress ranges are presented in Table 3.
Table 3. The equivalent stress histogram parameters, 1.75s MPa (Raleigh distribution)
S-N curve of the F3 class with parameters: 113.0, 3.51 10m C
S, sub-ranges ni, cycles Seq nominal, MPa
0 – 3.24 61.742 10 2.313
3.24 – 6.48 62.357 10 4.876
6.48 – 9.72 57.951 10 7.764
9.72 – 12.96 51.005 10 10.758
12.96 – 16.2 35.156 10 13.818
16.2 – 19.44 110 16.942
To prove the procedure, S-N curve of the B2 class (parent material, [4]) was used to obtain equivalent stress ranges for every of sub-ranges of the stress histogram. The results are presented in Table 4. It may be seen the difference between equivalent stress values practically is negligible. It means
45
Инженерно-строительный журнал, №1, 2013 РАСЧЕТЫ
Петинов С.В., Гучинский Р.В. О расчетах долговечности трубчатых конструкций
that evaluation of the equivalent stress ranges in composing the service stress histogram may be based on selection of any of the design S-N criteria; it should be noted the one-slope approximation is applied.
Table 4. The equivalent stress histogram parameters, 1.75s MPa (Raleigh distribution)
S-N curve of the B2 class with parameters: 144.0, 7.67 10m C .
S, sub-ranges ni, cycles Seq nominal, MPa
0 – 3.24 61.742 10 2.395
3.24 – 6.48 62.357 10 4.956
6.48 – 9.72 57.951 10 7.813
9.72 – 12.96 51.005 10 10.790
12.96 – 16.2 35.156 10 13.838
16.2 – 19.44 110 16.947
Following the procedure, the equivalent nominal stress ranges are multiplied by the maximum
stress concentration factor ( 22.24tK , saddle point, weld toe at the chord) to find the product .
According (14) 2, ,( ) /eq i i t n eqS K S E ; strain ranges in every of the histogram sub-ranges,
i , are estimated from the lumped (generalized) cyclic curve for the steel [17], fragment of which is
given in Table 5.
Table 5. Stabilized lumped cyclic curve of the 09G2 grade steel
∆σ, MPa 105.0 210.0 303.2 363.2 435.0 482.1
∆ε 0.0005 0.0010 0.0015 0.0020 0.0025 0.0030
∆ε ∆σ 0.0525 0.2100 0.4548 0.7264 1.0875 1.4463
The strain range values i are applied to calculate the number of cycles prior to material failure
at every of the stress histogram sub-ranges using the criterion (13) and respective values of partial damage. The results are given in Table 6.
Table 6. Histogram parameters, Neuber’s strain ranges and partial damages
Sn, sub-ranges, MPa Snom.eq, MPa ∆i ni, cycles Ni , cycles di
0 – 3.24 2.313 - 64.617 10 - -
3.24 – 6.48 4.876 - 53.539 10 - -
6.48 – 9.72 7.764 0.0007927 42.713 10 1.188·105 0.2283
9.72 – 12.96 10.758 0.001138 32.079 10 2.109·104 0.0986
12.96 – 16.2 13.818 0.001507 159 9.166·103 0.0173
16.2 – 19.44 16.942 0.001931 12 5.017·103 0.0024
It follows from the results of analysis that the total damage D ≈ 0.347 which means that expected fatigue life of the detail may be almost 3 times longer compared to the designed, certainly, on condition the intensity of traffic loading would remain unchanged through the service life and the structure would be effectively protected from corrosion.
The nominal stress in the brace may seem too small; on condition the fatigue resistance would be expired by the end of designed life of the detail (D = 1) the maximum nominal stress may be increased approximately up to 30 MPa. Still, it remains small depending on the very high stress concentration at the joint. The local stress at the saddle point of the chord may be effectively lowered by increasing stiffness of the chord shell (thickness of the shell) in the joint area.
46
CALCULATIONS Magazine of Civil Engineering, №1, 2013
Петинов С.В., Гучинский Р.В. О расчетах долговечности трубчатых конструкций
Conclusions 1. A procedure of the continuous long-term stress distribution explicit transformation to the step-
vise block-type format is developed. It provides unambiguous technique of composing the histogram of service loading and allows reducing the number of equivalent cyclic stress fragments compared to those required by the rules for fatigue design scheme and provides accuracy of fatigue analysis of welded structures.
2. The procedure may seem unnecessary when the damage index is calculated by using the damage summation in the integral form (4). However, it is necessary when the damage should be analyzed by the means of the «Strain-Life» approach and application of the Neuber’s formula based approach and may be helpful when the crack propagation has to be assessed.
3. Efficiency of the developed approach is illustrated in example of fatigue analysis of a detail of welded tubular structure. The analysis may be used to select sufficiently reliable versions of the detail.
The work was supported by the Russian Grant for Fundamental research 12-08-00943a
References
1. Болотин В.В. Прогнозирование ресурса машин и конструкций. М.: Машиностроение, 1984. 321 с.
2. Conti, F., Verney, L., Bignonnet, A. Fatigue Assessment of Tubular Welded Connections with the Structural Stress Approach // Fatigue Design 2009. Proceedings. 25-26 Nov. 2009. Senlis, France. Pp. 1-8.
3. Coffin, L.F., Tavernelli, J.F. Experimental Support for Generalized Equation Predicting Low-Cycle Fatigue // Trans. ASME. 1962. Ser.D, 4. Pp. 533.
4. Det Norske Veritas. Fatigue Assessment of Offshore Steel Structures. Recommended Practice (RP-C203), Hovik, Norway. 2006.
5. Ellyin F. Fatigue Damage, Crack Growth and Life Prediction. Chapman & Hall, London. 1997. 486 p.
6. Kuhn B., et al. Assessment of Existing Steel Structures: Recommendations for Estimation of Remaining Fatigue Life. JRC – ECCS Joint Report. [Электронный ресурс] EUR 23252 EN – 2008. URL: Eurocodes.jrc.ec.europa.eu/doc/background/EUR23252EN.pdf.
7. Fricke W. Guideline for the Fatigue Assessment by Notch Stress Analysis for Welded Structure / Int. Institute of Welding. Cambridge, Abington, 2008. IIW-Doc. XIII-2240r-08/XV-1289r-08.
8. Glinka G. A Cumulative Model of Fatigue Crack Growth // Int. Journal of Fatigue, April, 1982. Pp. 59-67.
9. Hobbacher A. Recommendations for Fatigue Design of Welded Joints and Components / Int. Institute of Welding. Cambridge, Abington, 2007. IIW Document XIII-2151r1-07 / XV-1254r1-07.
10. Jones J.P., et al. Fighting Fatigue in Steel Bridges // TR News 259, November-December, 2008. Pp. 25-26.
11. Manson S.S. Fatigue: A Complex Subject - Some Simple Approximations // Experimental Mechanics. Vol. 7, №5. 1965. Pp. 193-226.
12. Механика разрушения и прочность материалов: Справ. Пособие в 4 т. / Под общей ред. Панасюка В.В. Киев: Наукова думка, 1988.
13. Miller K.J. Materials Science Perspective of Metal Fatigue Resistance // Materials Science and Technology. 1993. Vol. 9. Pp. 453-462.
14. Neuber H. Theory of Stress Concentration for Shear Strained Prismatic Bodies with Arbitrary Non-Linear Stress-Strain Law // Journal of Applied Mechanics. 1961. Vol. 28. Pp. 544-550.
15. Niederkofler T. Eurocodes. Fatigue, Steel Bridges [Электронный ресурс] // Seminar at the Helsinki University of Technology, 2003. URL: http://www.stalforbund.com/Eurokoder/Fatique_Steel_Bridges.pdf.
16. Петерсон Р. Коэффициенты концентрации напряжений: Пер. с англ. М.: Мир, 1977, 301 с.
17. Petinov, S.V. Fatigue Analysis of Ship Structures. Backbone Publishing Co., Fair Lawn, NJ, USA, 2003, 262 p.
18. Трощенко В.Т., Сосновский Л.А. Сопротивление усталости металлов и сплавов: Справочное пособие в 2 т. Киев: Наукова думка, 1987.
*Сергей Владимирович Петинов, Санкт-Петербург, Россия Тел. раб.: +7 (812) 552-6303; эл. почта: [email protected]
© Петинов С.В., Гучинский Р.В., 2013
47
CALCULATIONS Magazine of Civil Engineering, №1, 2013
Guchinsky R.V., Petinov S.V. Fatigue assessment of tubular structures
doi: 10.5862/MCE.36.5
Fatigue assessment of tubular structures
R.V. Guchinsky; S.V. Petinov,
Saint-Petersburg State Polytechnical University, Saint-Petersburg, Russia +7 (812) 552-6303; e-mail: [email protected]
Key words Fatigue damage accumulation; «Strain-Life» approach; S-N criteria; Fatigue of tubular structures;
FEA modeling of tubular and pipeline structures
Abstract Fatigue assessment of welded joints in tubular structures in industrial applications according to the
current design codes is based on the block-type presentation of the loading histories. An approximate procedure of the long-term stress distribution transformation to the block-type format is devel-oped. It allows reducing the number of equivalent cyclic stress fragments compared to those required by the rules for fatigue design and provides ac-curacy of fatigue analysis of tubular frame structures.
Efficiency of the developed approach is illustrated in example of fatigue assessment of the tubular frame bridge structure. Technique of analysis may be used to choose sufficiently reliable versions of the detail.
References 1. Bolotin V.V. Prognozirovaniye resursa mashin i konstruktsiy [Prediction of machines and structures
resources]. Moscow: Mashinostroyeniye, 1984. 321 p. (rus)
2. Conti F., Verney L., Bignonnet A. Fatigue Assessment of Tubular Welded Connections with the Structural Stress Approach. Proceedings «Fatigue Design 2009». 25-26 November 2009, Senlis, France. Pp.1-8.
3. Coffin L.F., Tavernelli J.F. Experimental Support for Generalized Equation Predicting Low-Cycle Fatigue. Trans. ASME. 1962. No. 4. Ser.D. Pp. 533.
4. Det Norske Veritas. Fatigue Assessment of Offshore Steel Structures. Recommended Practice (RP-C203), Hovik, Norway. 2006.
5. Ellyin F. Fatigue Damage, Crack Growth and Life Prediction. London: Chapman & Hall, 1997.
6. Kuhn B., et al. Assessment of Existing Steel Structures: Recommendations for Estimation of Remaining Fatigue Life. JRC – ECCS Joint Report. EUR 23252 EN – 2008. [Online] URL: Eurocodes.jrc.ec.europa.eu/doc/background/EUR23252EN.pdf
7. Fricke W. Guideline for the Fatigue Assessment by Notch Stress Analysis for Welded Structure. Int. Institute of Welding, IIW-Doc. XIII-2240r-08/XV-1289r-08. Cambridge, Abington, 2008.
8. Glinka G. A Cumulative Model of Fatigue Crack Growth. International Journal of Fatigue. 1982. Vol. 4. No. 2. Pp.59-67.
9. Hobbacher A. Recommendations for Fatigue Design of Welded Joints and Components. Int. Institute of Welding, IIW Document XIII-2151r1-07 / XV-1254r1-07. Cambridge, Abington, 2007.
10. Jones J.P., et al. Fighting Fatigue in Steel Bridges. TR News 259. 2008. November-December. Pp. 25-26.
11. Manson S.S. Fatigue: A Complex Subject - Some Simple Approximations. Experimental Mechanics. 1965. Vol. 7. No. 5. Pp. 193-226.
12. Panasyuk V.V., Andreykiv A.Ye., Parton V.Z. Mekhanika razrusheniya i prochnost materialov: Sprav. Posobiye v 4 t. [Fracture mechanics and strength of materials: Handbook in 4 volumes]. Kiyev: Naukova dumka, 1988. 488 p. (rus)
13. Miller K.J. Materials Science Perspective of Metal Fatigue Resistance. Materials Science and Technology. 1933. Vol. 9. Pp.453-462.
14. Neuber H. Theory of Stress Concentration for Shear Strained Prismatic Bodies with Arbitrary Non-Linear Stress-Strain Law. Trans. ASME. Vol.28, 1961. Pp. 544.
15. Niederkofler T. Eurocodes. Fatigue, Steel Bridges. Seminar at the Helsinki University of Technology, 2003. [Online] URL: http://www.stalforbund.com/Eurokoder/Fatique_Steel_Bridges.pdf.
118
Инженерно-строительный журнал, №1, 2013 РАСЧЕТЫ
Guchinsky R.V., Petinov S.V. Fatigue assessment of tubular structures
16. Peterson R. Koeffitsiyenty kontsentratsii napryazheniy [Stress concentration coefficient]. Moscow: Mir, 1977. 301 p. (rus)
17. Petinov S.V. Fatigue Analysis of Ship Structures. New Jersey: Backbone Publishing Co., Fair Lawn, 2003. 262 p.
18. Troshchenko V.T., Sosnovskiy L.A. Soprotivleniye ustalosti metallov i splavov: Spravochnoye posobiye v 2 t. [Fatigue resistance of metals and alloys: Handbook in 3 volumes]. Kiyev: Naukova dumka, 1987.
Full text of this article in English: pp. 39-47
119