
Fatigue and Fracture Behavior of Airfield Concrete Slabs Prof. S.P. Shah (Northwestern University)...
49
Fatigue and Fracture Behavior of Airfield Concrete Slabs Prof. S.P. Shah (Northwestern University) Prof. J.R. Roesler (UIUC) Dr. Bin Mu David Ey (NWU) Amanda Bordelon (UIUC) FAA Center Annual Review – Champaign, IL, October 7, 2004
Transcript of Fatigue and Fracture Behavior of Airfield Concrete Slabs Prof. S.P. Shah (Northwestern University)...

Fatigue and Fracture Behavior of Airfield
Concrete SlabsProf. S.P. Shah (Northwestern University)Prof. J.R. Roesler (UIUC)Dr. Bin MuDavid Ey (NWU)Amanda Bordelon (UIUC)
FAA Center Annual Review – Champaign, IL, October 7, 2004
Research Work Plan
1. Finite Element Simulation of Cracked Slab
2. Concrete slab compliance
3. Develop preliminary R-curve for concrete slab
4. Small-scale fracture parameters
5. Fatigue crack growth model
6. Model Validation
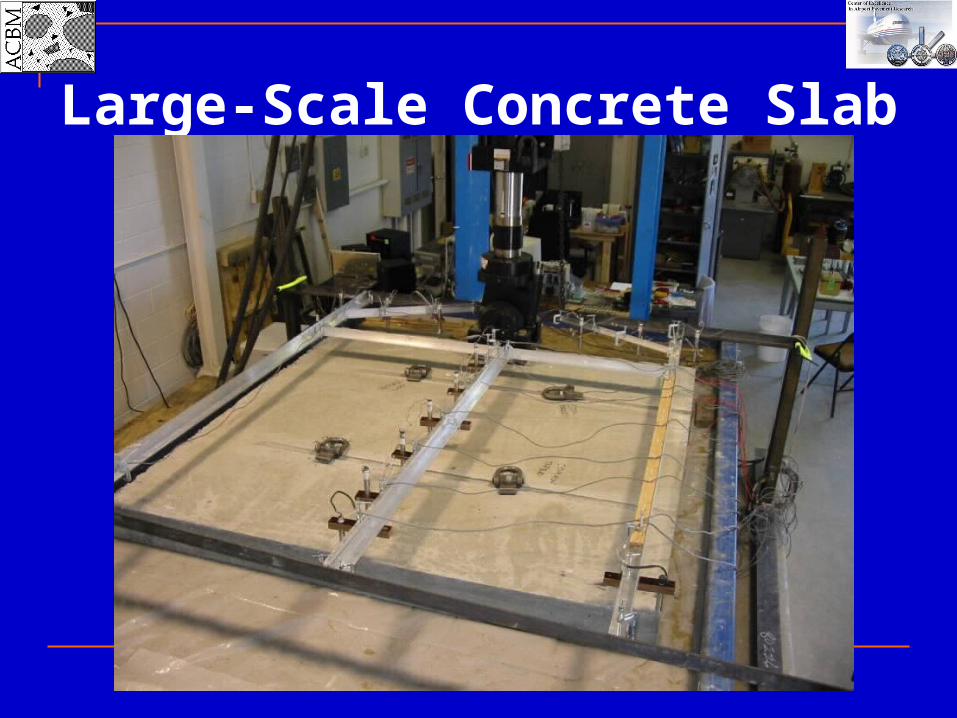
Large-Scale Concrete Slab Tests

Typical S-N Curves for Concrete Fatigue
0
0.25
0.5
0.75
1
1.25
1.5
1.75
2
2.25
2.5
2.75
3
1.0E+00 1.0E+01 1.0E+02 1.0E+03 1.0E+04 1.0E+05 1.0E+06
Repetitions to Failure (N)
Ap
plie
d S
tre
ss
/ F
lex
ura
l Str
en
gth
(S
)
Roesler(1998) Darter(1977)
FAA 150/5320-6D Rollings(1988)
Parker(1979) Foxworthy(1985)
PCA(1985) Darter(1989)
NCHRP 1-26 (1992) LEDFAA
Beam Curves
Slab Curves

The load – crack length (compliance) response obtained from static loading acts as an envelope curve for fatigue loading.
The condition KI = KIC can be used to predict fatigue failure.
Fatigue crack growth rate has two stages: deceleration stage and acceleration stage.
Summary of Approach

Static loading acts as an envelope curve for fatigue loading
(Subramaniam, K. V., Popovics, J.S., & Shah, S. P. (2002), Journal of Engineering Mechanics, ASCE 128(6): 668-676.)
Static Envelope
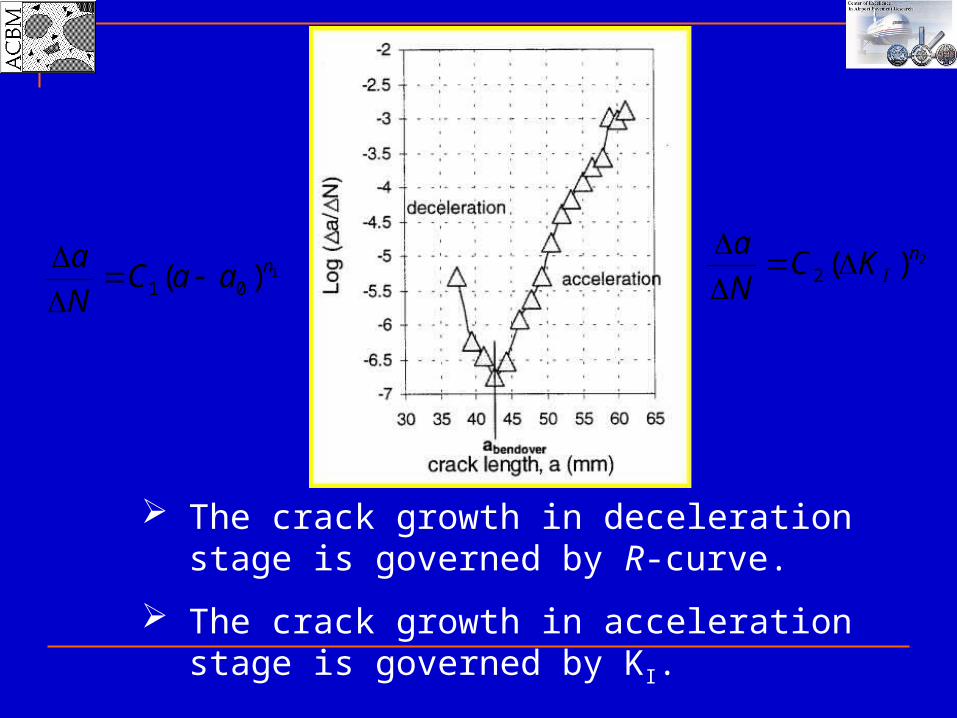
The crack growth in deceleration stage is governed by R-curve.
The crack growth in acceleration stage is governed by KI.
1)( 01naaC
N
a
2)(2
nIKC
N
a

Static and Fatigue Envelope
Fatigue
Static envelope governed by KI=KIC
Crack length
Load
# of cycles
Fatigue crack growth
A
B
C
acritical

0
0.2
0.4
0.6
0.8
1
0 0.3 0.6 0.9 1.2
Normalized cycles, N/Nf
Cra
ck
len
gth
(in
)
90%-5%
Inflection point
Crack growth during fatigue test
(a) crack length vs. cycles (b) rate of crack growth
-4
-3
-2
-1
0.2 0.4 0.6 0.8
Crack length (in)
Lo
g(
a/
N)
90%-5%
deceleration acceleration
a inflection

Step 1
Phase –1: Fatigue test
FEM C=C(a) and KI=KI(a)
FEM Simulation of Cracked Slab
a
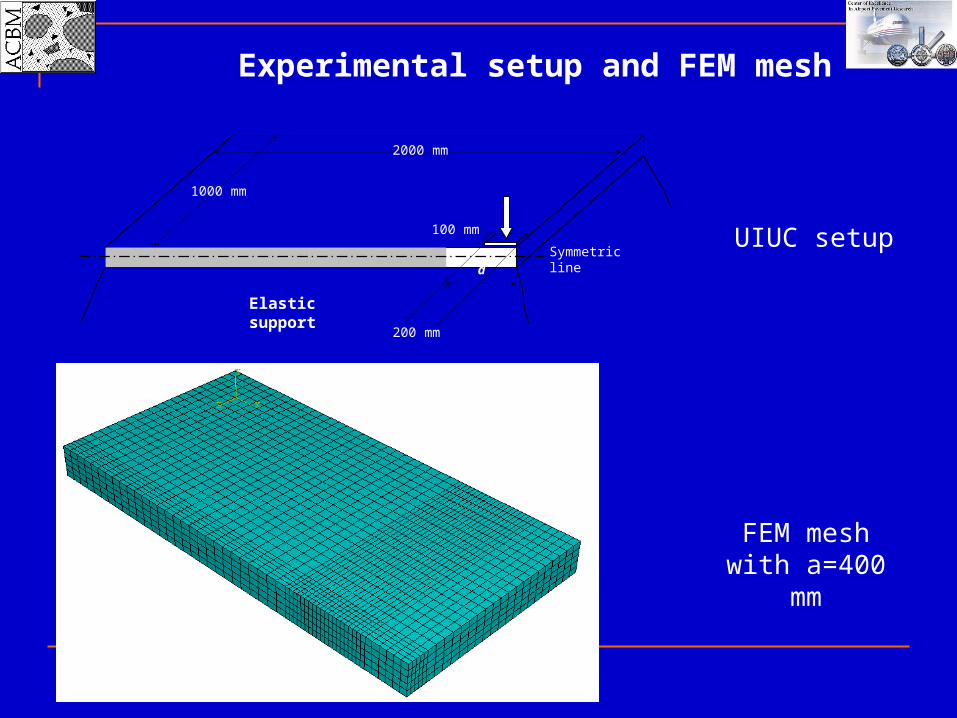
Experimental setup and FEM mesh
Elastic support
2000 mm
1000 mm
aSymmetric line
200 mm
100 mm UIUC setup
FEM mesh with a=400 mm
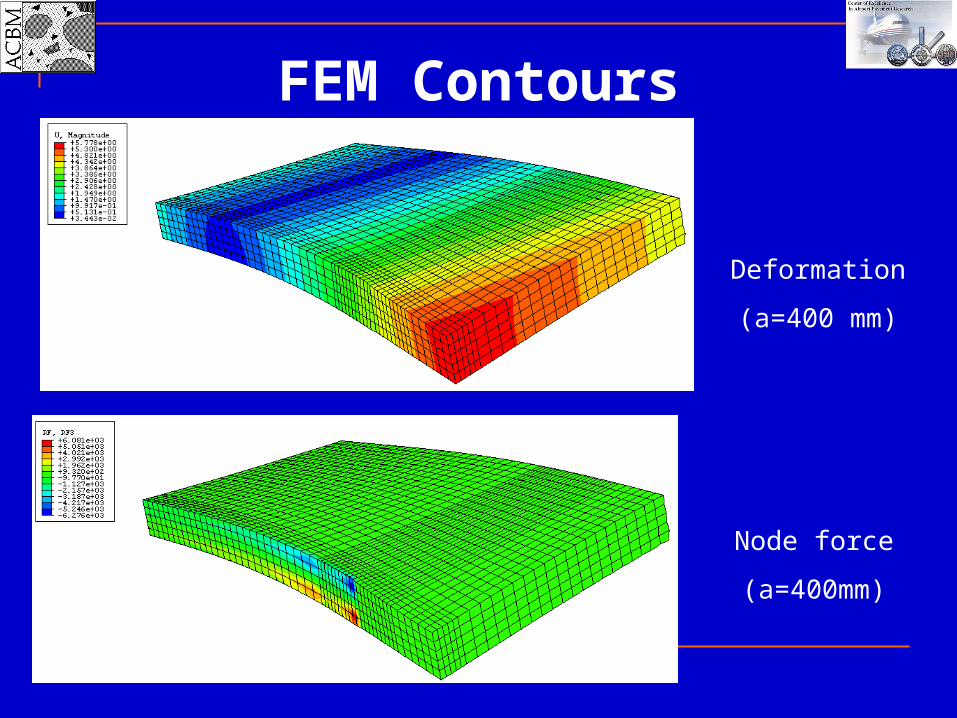
Deformation
(a=400 mm)
Node force
(a=400mm)
FEM Contours
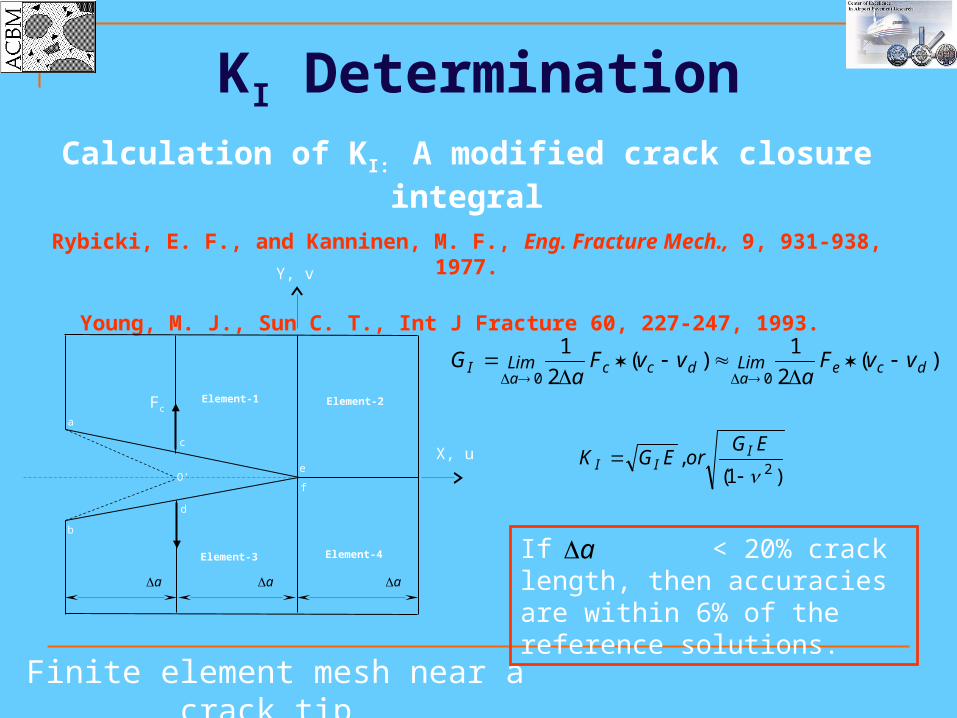
Calculation of KI: A modified crack closure integral
Rybicki, E. F., and Kanninen, M. F., Eng. Fracture Mech., 9, 931-938, 1977.
Young, M. J., Sun C. T., Int J Fracture 60, 227-247, 1993.
a
c
b
d
e
f
Element-1 Element-2
Element-4Element-3
Y, v
X, uO’
Fc
Finite element mesh near a crack tip
a a a
)(2
1)(
2
1
00dce
adcc
aI vvF
avvF
aG LimLim
)1(,
2
EGorEGK I
II
If < 20% crack length, then accuracies are within 6% of the reference solutions.
a
KI Determination
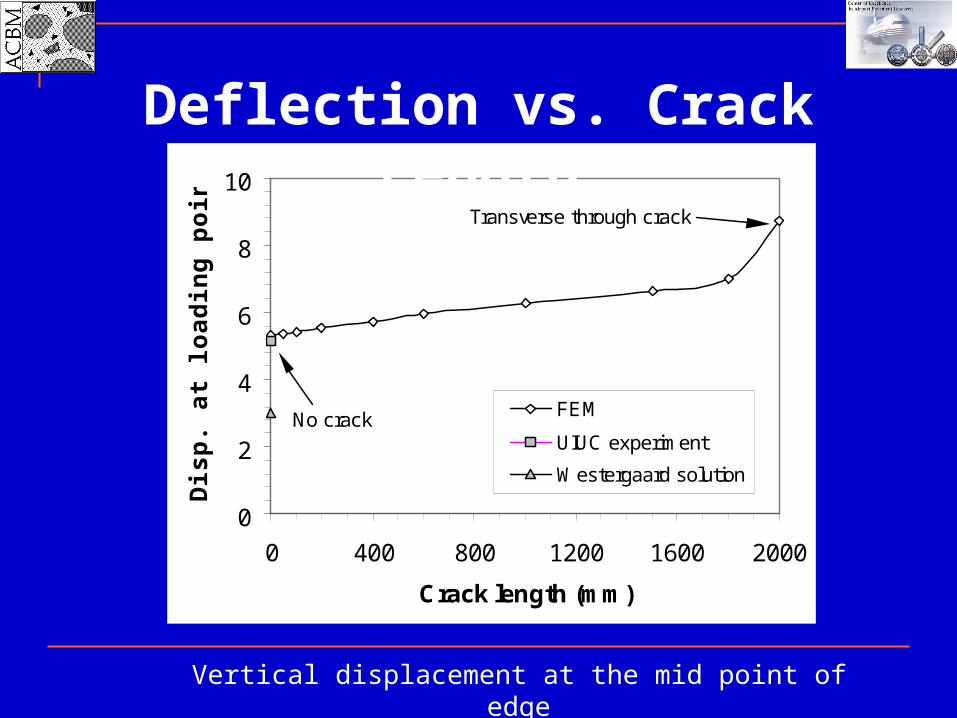
Vertical displacement at the mid point of edge
0
2
4
6
8
10
0 400 800 1200 1600 2000
Crack length (mm)
Dis
p. a
t lo
ad
ing
po
int
(mm
)
FEM
UIUC experiment
Westergaard solution
No crack
Transverse through crack
Deflection vs. Crack Length

y = 1E-07x2 - 1E-06x + 1.0228
0
0.3
0.6
0.9
1.2
1.5
1.8
0 400 800 1200 1600 2000
Crack length (mm)
No
rma
lize
d c
om
plia
nc
e
FEM
Poly. (FEM)
0
500
1000
1500
2000
2500
1 1.2 1.4 1.6 1.8 2
Normalized compliance
Cra
ck
len
gth
(m
m)
FEM
Poly. (FEM)
y=-7176.2*x2+22074.9*x-14898.7
Compliance and crack length
FEM Compliance Results

Stress intensity factor and crack length
y = 2E-06x + 0.0007
y = 5E-10x2 - 9E-07x + 0.0014
0
0.0005
0.001
0.0015
0.002
0 400 800 1200 1600 2000
Crack length (mm)
KI/P
(m
m-3
/2)
FEM-1
FEM-2
Linear (FEM-1)
Poly. (FEM-2)
KI vs Crack Length (a)
0
0.05
0.1
0.15
0.2
0.25
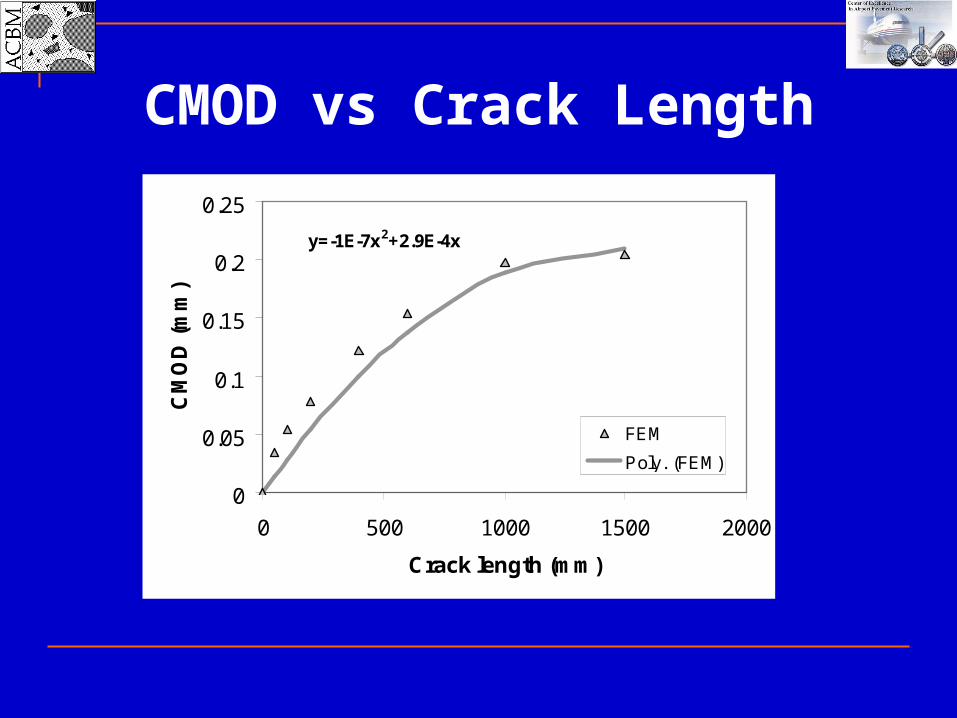
0 500 1000 1500 2000
Crack length (mm)
CM
OD
(m
m)
FEM
Poly. (FEM)
y=-1E-7x2+2.9E-4x
CMOD vs Crack Length

Processing Lab Fatigue Data
Single pulse loading
Tridem pulse loading
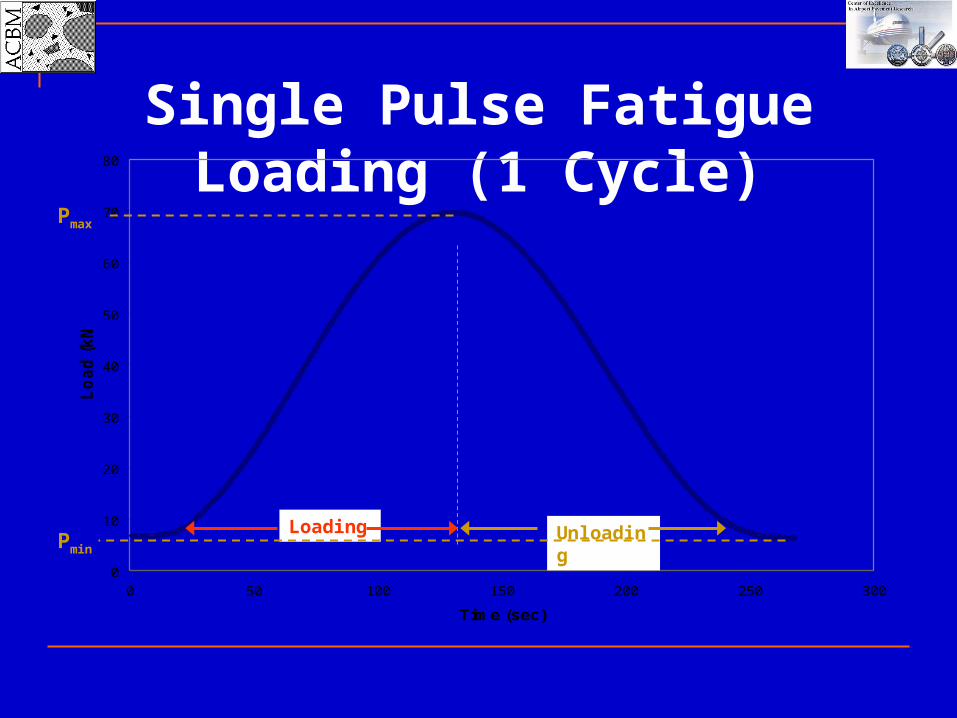
Single Pulse Fatigue Loading (1 Cycle)
0
10
20
30
40
50
60
70
80
0 50 100 150 200 250 300
Time (sec)
Lo
ad
(k
N)
Loading Unloading
Pmax
Pmin
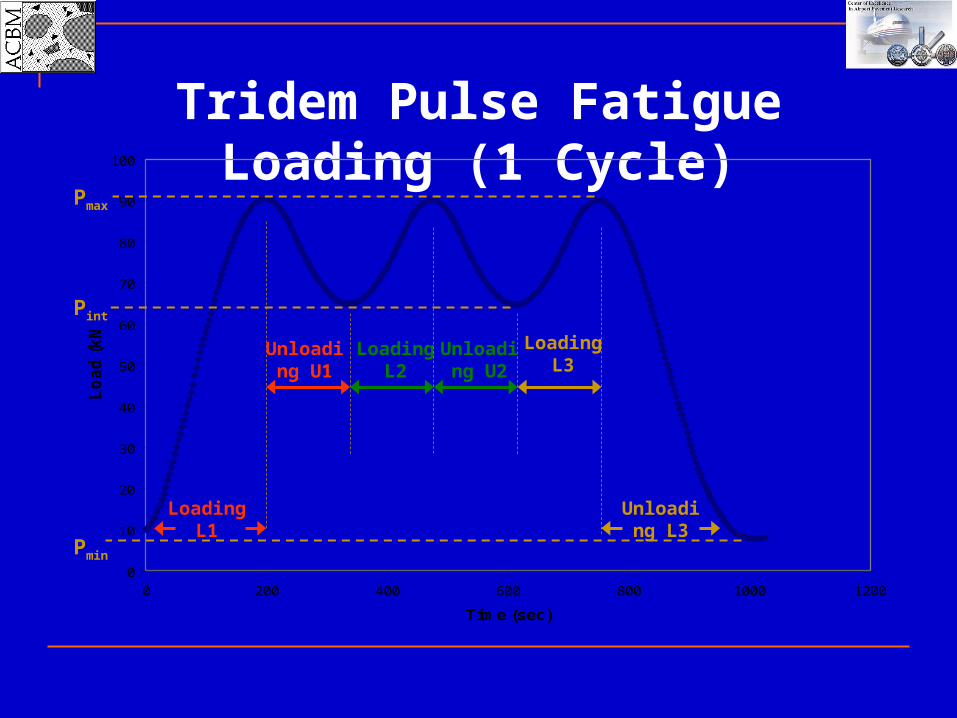
Tridem Pulse Fatigue Loading (1 Cycle)
0
10
20
30
40
50
60
70
80
90
100
0 200 400 600 800 1000 1200
Time (sec)
Lo
ad
(k
N)
Loading L1
Loading L2
Loading L3
Unloading U1
Unloading U2
Unloading L3
Pmax
Pint
Pmin
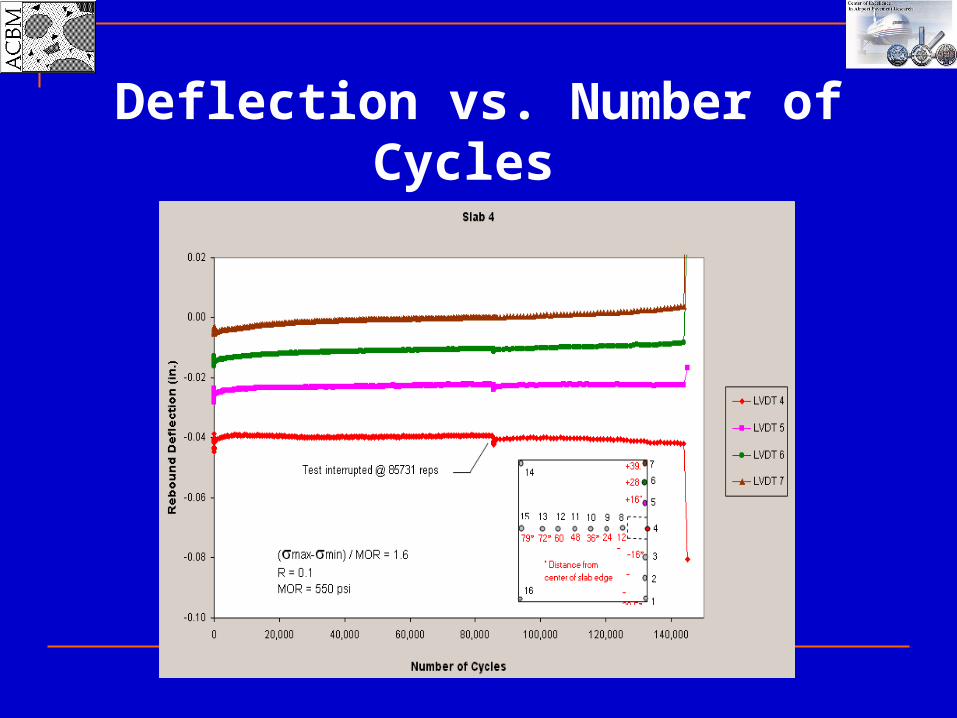
Deflection vs. Number of Cycles
(Single Pulse Slab 4)

Deflection vs. Number of Cycles
(Tridem Pulse Slab 7)
Compliance Plots Loading vs. Unloading Compliance
Single vs. Tridem Pulses Need to measure CMOD in future!!!
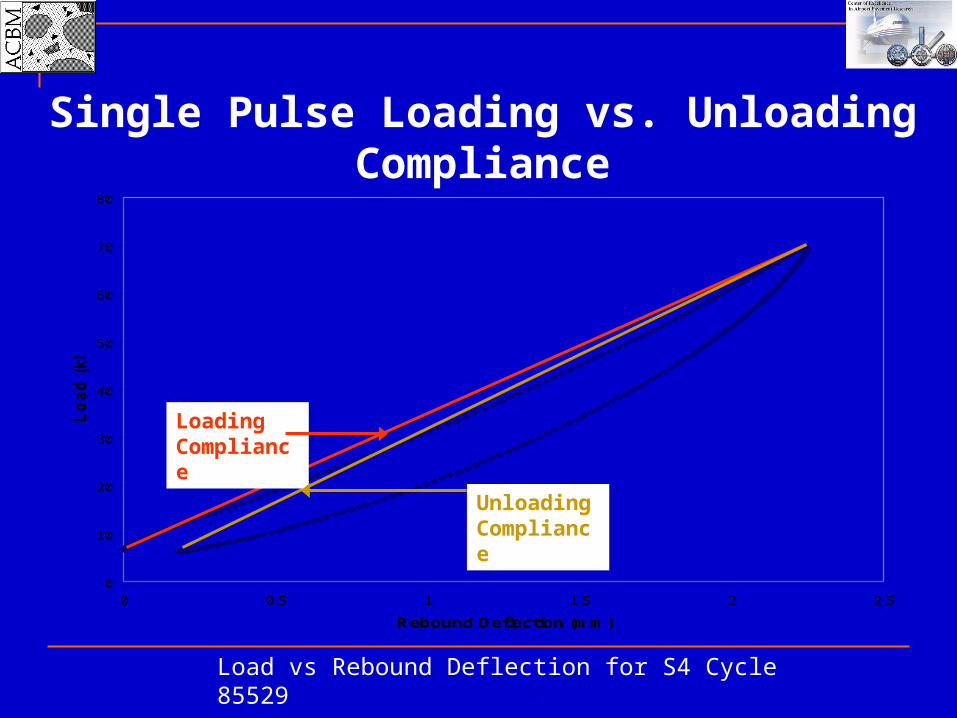
Single Pulse Loading vs. Unloading Compliance
Load vs Rebound Deflection for S4 Cycle 85529
0
10
20
30
40
50
60
70
80
0 0.5 1 1.5 2 2.5
Rebound Deflection (mm)
Lo
ad
(k
N)
Loading Compliance
Unloading Compliance
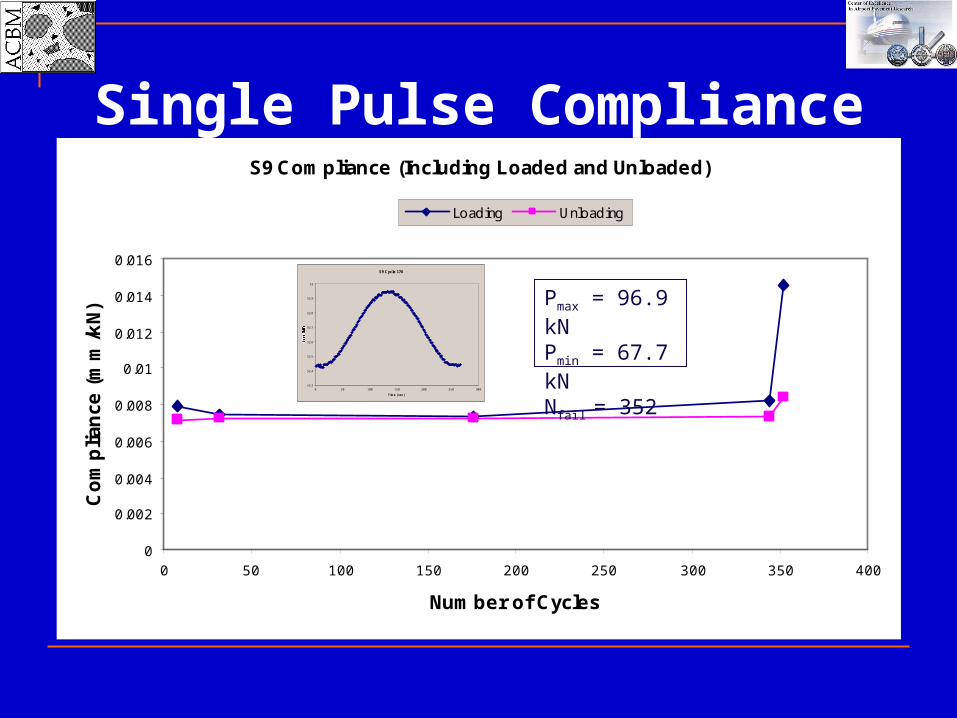
Single Pulse Compliance (Slab 9)S9 Compliance (Including Loaded and Unloaded)
0
0.002
0.004
0.006
0.008
0.01
0.012
0.014
0.016
0 50 100 150 200 250 300 350 400
Number of Cycles
Co
mp
lian
ce (
mm
/kN
)
Loading Unloading
S9 Cycle 176
52.3
52.4
52.5
52.6
52.7
52.8
52.9
53
0 50 100 150 200 250 300
Time (sec)
Pmax = 96.9 kNPmin = 67.7 kNNfail = 352
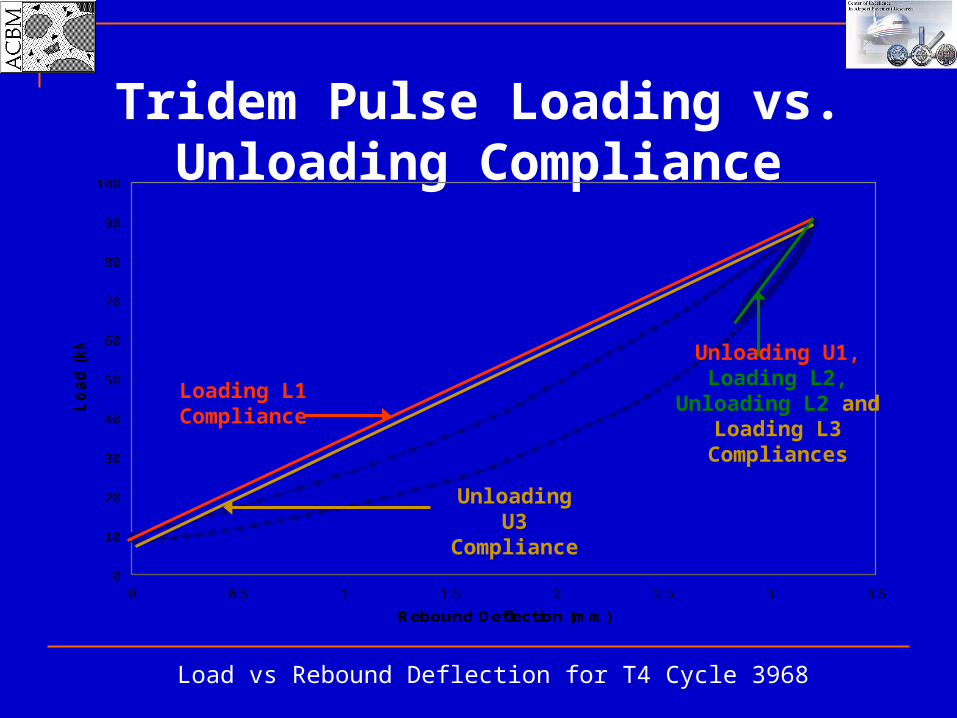
Tridem Pulse Loading vs. Unloading Compliance
Load vs Rebound Deflection for T4 Cycle 3968
0
10
20
30
40
50
60
70
80
90
100
0 0.5 1 1.5 2 2.5 3 3.5
Rebound Deflection (mm)
Lo
ad
(k
N)
Loading L1 Compliance
Unloading U3 Compliance
Unloading U1, Loading L2, Unloading L2 and
Loading L3 Compliances

Tridem Pulse Compliance (Slab 2)T2 Compliance (Including Loaded and Unloaded)
0
0.01
0.02
0.03
0.04
0.05
0.06
0.07
0.08
0.09
0.1
0 10,000 20,000 30,000 40,000 50,000 60,000 70,000
Number of Cycles
Co
mp
lian
ce (
mm
/kN
)
L1 U1 L2 U2 L3 U3
Pmax = 91.5 kNPmin = 7.0 kNNfail = 61,184
T2 Cycle 36000
0
10
20
30
40
50
60
70
80
90
100
0 200 400 600 800 1000 1200
Time (sec)
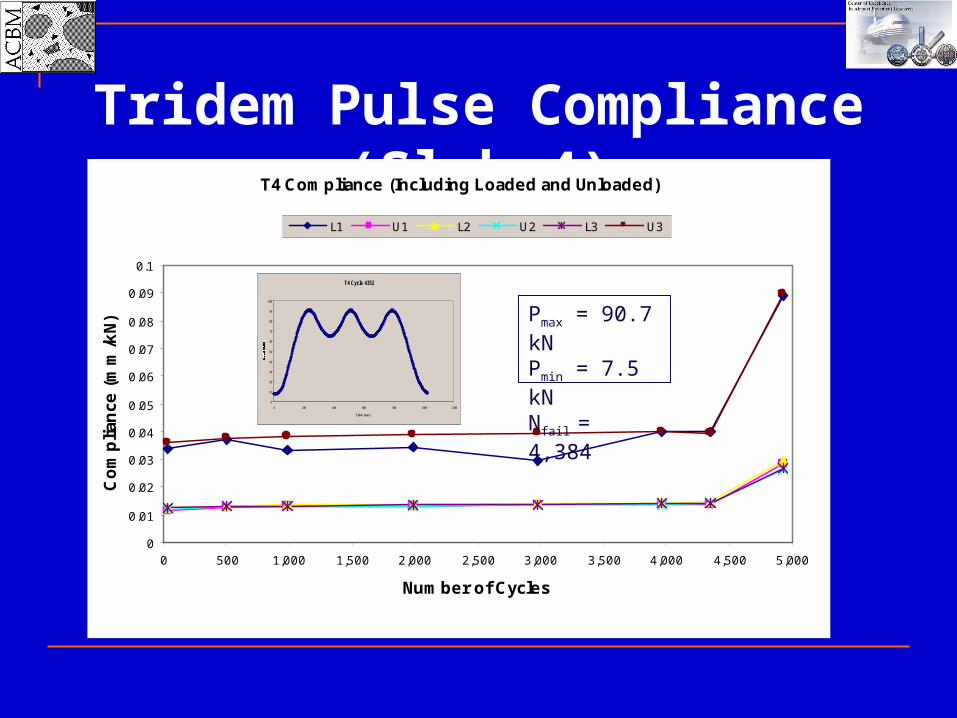
Tridem Pulse Compliance (Slab 4)T4 Compliance (Including Loaded and Unloaded)
0
0.01
0.02
0.03
0.04
0.05
0.06
0.07
0.08
0.09
0.1
0 500 1,000 1,500 2,000 2,500 3,000 3,500 4,000 4,500 5,000
Number of Cycles
Co
mp
lian
ce (
mm
/kN
)
L1 U1 L2 U2 L3 U3
T4 Cycle 4352
0
10
20
30
40
50
60
70
80
90
100
0 200 400 600 800 1000 1200
Time (sec)
Pmax = 90.7 kNPmin = 7.5 kNNfail = 4,384
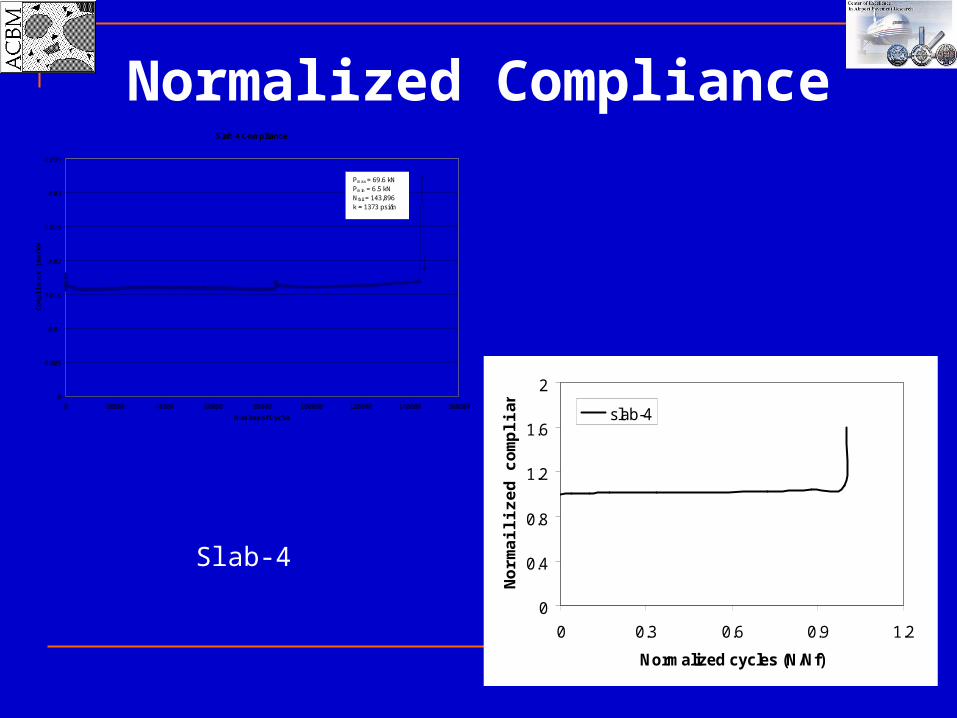
Slab 4 Compliance
0
0.005
0.01
0.015
0.02
0.025
0.03
0.035
0 20000 40000 60000 80000 100000 120000 140000 160000
Number of Cycles
Co
mp
lian
ce (
mm
/kN
)
Pmax = 69.6 kNPmin = 6.5 kNNfail = 143,896k = 1373 psi/in
0
0.4
0.8
1.2
1.6
2
0 0.3 0.6 0.9 1.2
Normalized cycles (N/Nf)
No
rmai
lized
co
mp
lian
ce
slab-4
Slab-4
Normalized Compliance
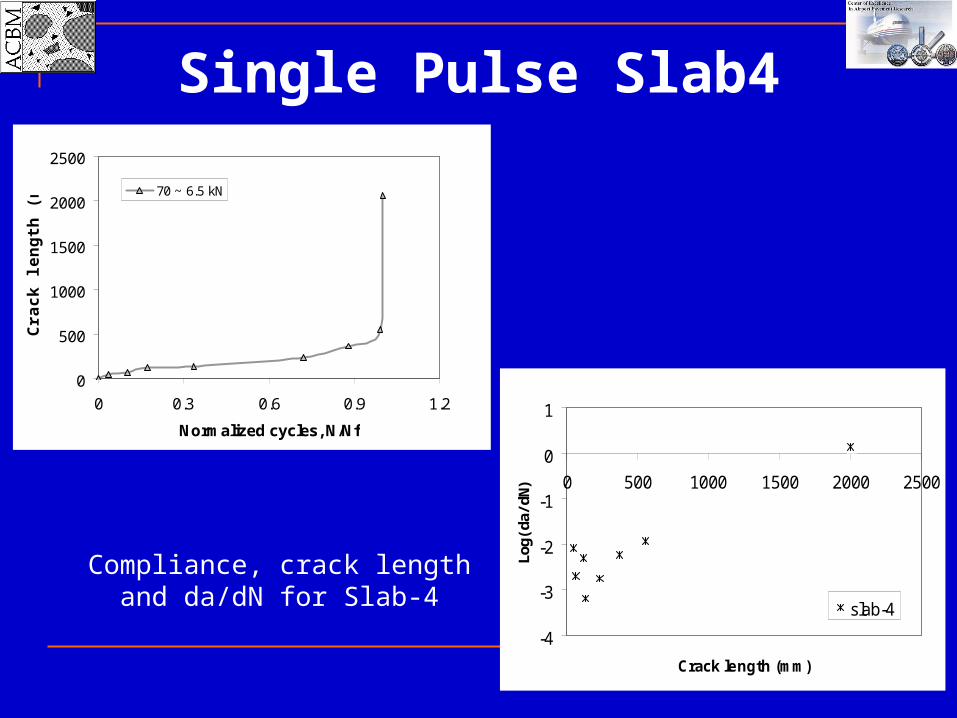
0
500
1000
1500
2000
2500
0 0.3 0.6 0.9 1.2
Normalized cycles, N/Nf
Cra
ck
len
gth
(m
m)
70 ~ 6.5 kN
-4
-3
-2
-1
0
1
0 500 1000 1500 2000 2500
Crack length (mm)
Lo
g(d
a/d
N)
slab-4
Compliance, crack length and da/dN for Slab-4
Single Pulse Slab4

T2 Compliance
-0.01
0
0.01
0.02
0.03
0.04
0.05
0.06
0.07
0.08
0.09
0 10000 20000 30000 40000 50000 60000 70000
Number of Cycles
Co
mp
lian
ce (
mm
/kN
)
Pmax = 91.5 kNPmin = 18.2 kNNfail = 61,184
T-2
0
0.4
0.8
1.2
1.6
2
0 0.3 0.6 0.9 1.2
Normalized cycles, N/Nf
No
rma
lize
d c
om
plia
nc
e T-2
Tridem Slab (T2)
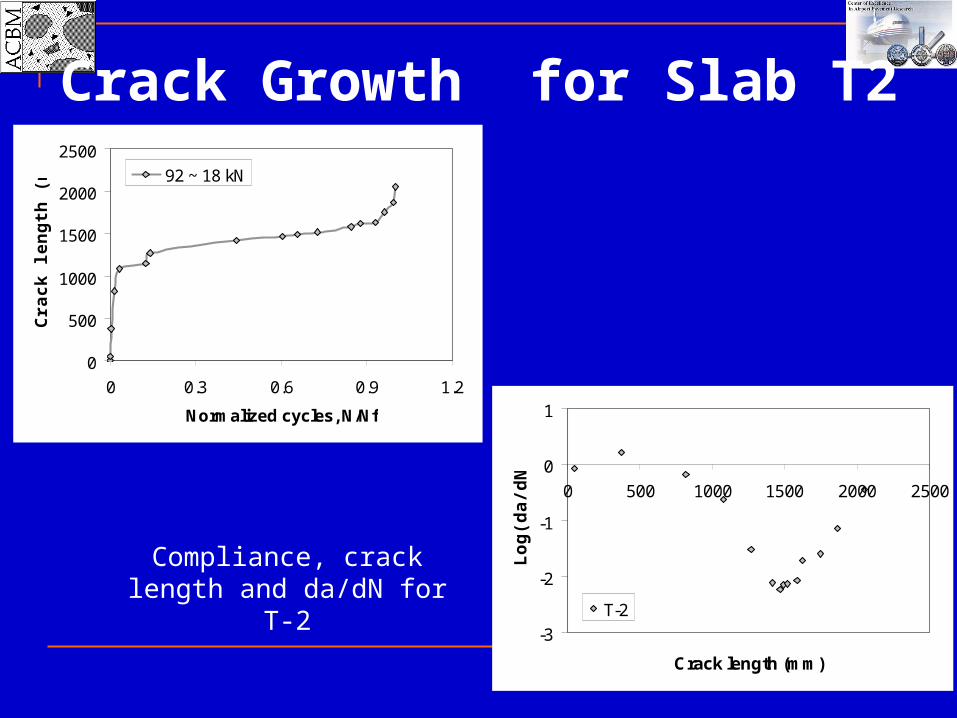
0
500
1000
1500
2000
2500
0 0.3 0.6 0.9 1.2
Normalized cycles, N/Nf
Cra
ck
len
gth
(m
m) 92 ~ 18 kN
Compliance, crack length and da/dN for T-2
-3
-2
-1
0
1
0 500 1000 1500 2000 2500
Crack length (mm)
Lo
g(d
a/d
N)
T-2
Crack Growth for Slab T2

T4 Compliance
0
0.005
0.01
0.015
0.02
0.025
0.03
0.035
0.04
0.045
0.05
0 1000 2000 3000 4000 5000 6000
Number of Cycles
Co
mp
lian
ce (
mm
/kN
)
Pmax = 90.7 kNPmin = 8.6 kNNfail = 4,384
0
0.4
0.8
1.2
1.6
2
0 0.3 0.6 0.9 1.2
Normalized cycles (N/Nf)
No
rma
lize
d c
om
plia
nc
e T-4
T-4
Tridem Slab (T4)
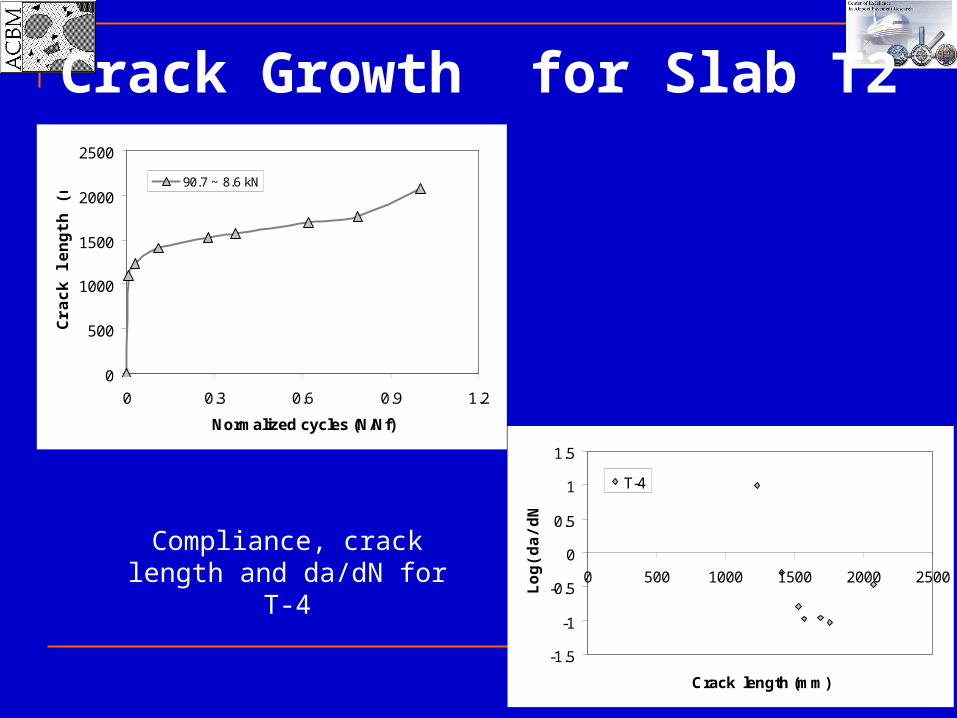
0
500
1000
1500
2000
2500
0 0.3 0.6 0.9 1.2
Normalized cycles (N/Nf)
Cra
ck
len
gth
(m
m)
90.7 ~ 8.6 kN
Compliance, crack length and da/dN for T-4
-1.5
-1
-0.5
0
0.5
1
1.5
0 500 1000 1500 2000 2500
Crack length (mm)
Lo
g(d
a/d
N)
T-4
Crack Growth for Slab T2
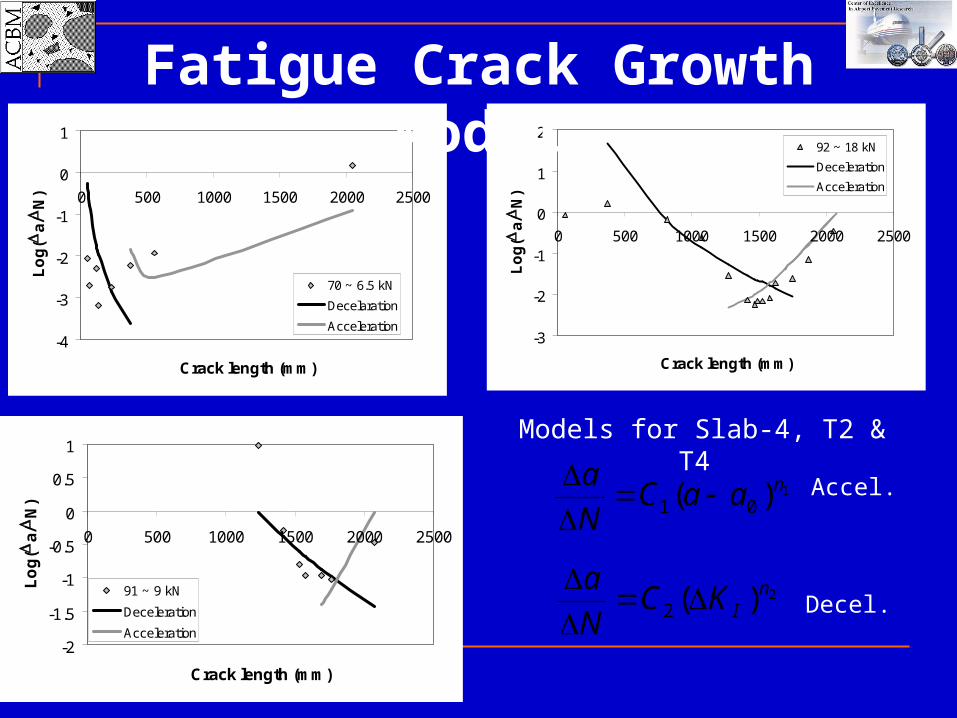
-4
-3
-2
-1
0
1
0 500 1000 1500 2000 2500
Crack length (mm)
Lo
g(
a/
N)
70 ~ 6.5 kN
Decelaration
Acceleration
-2
-1.5
-1
-0.5
0
0.5
1
0 500 1000 1500 2000 2500
Crack length (mm)
Lo
g(
a/
N)
91 ~ 9 kN
Deceleration
Acceleration
-3
-2
-1
0
1
2
0 500 1000 1500 2000 2500
Crack length (mm)
Lo
g(
a/
N)
92 ~ 18 kN
Deceleration
Acceleration
Models for Slab-4, T2 & T4
1)( 01naaC
N
a
2)(2n
IKCN
a
Fatigue Crack Growth Model
Accel.
Decel.

Challenges Need to calibrate material constants C1,n1,
C2, n2 with slab monotonic data and small-scale results
Explore other crack configurations modes (partial depth and quarter-elliptical cracks)
Size Effect….

Concrete Property Testing Test Setup
Two Parameter Fracture Model (KI and CTODc)
Size Effect Law (KIf and cf)

Concrete Material Property Setup Three Beam Sizes
Small Medium Large
Size
Depth Width Length Span Notch Length Notch Width
(mm) (in) (mm) (in) (mm) (in) (mm) (in) (mm) (in) (mm) (in)
1 62.5 2.461 80 3.15 350 13.78 250 9.843 20.8 0.82 3 0.118
2 150 5.906 80 3.15 700 27.56 600 23.62 50 1.969 3 0.118
3 250 9.843 80 3.15 1100 43.31 1000 39.37 83.3 3.281 3 0.118

S = 1 m
D = 250 mm
50 mm
W = 80 mm
Large Beam
Initial crack length
= 83 mm
Clip gauge CMOD
50 mm
notch
LVDT
Top View
LVDT
10 mmCMO
D

Testing Apparatus
Before Loading After Loading
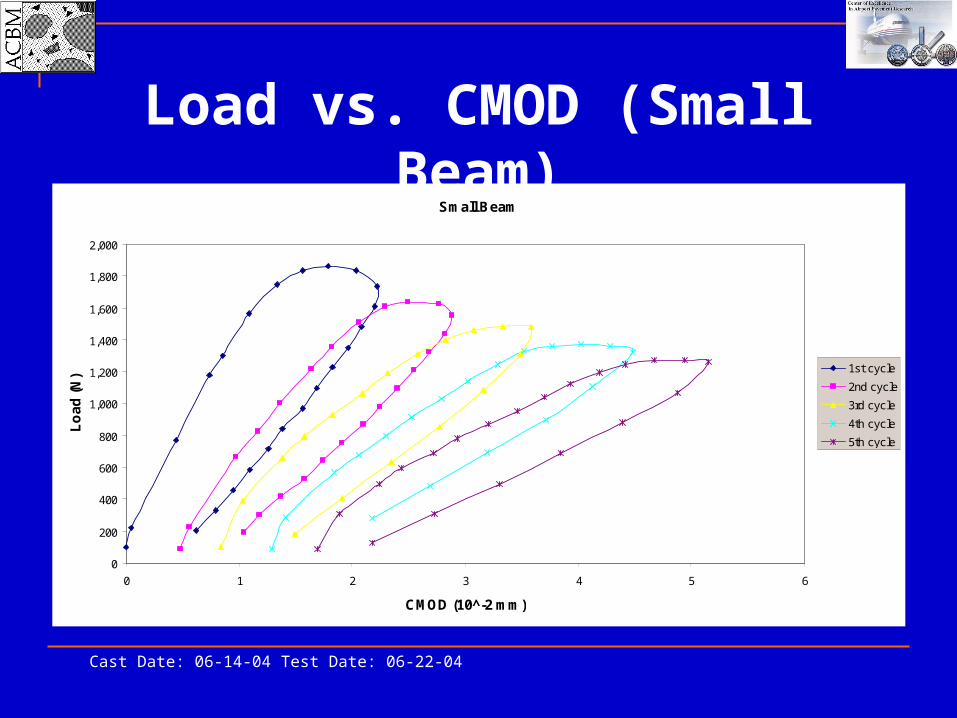
Load vs. CMOD (Small Beam)
Cast Date: 06-14-04 Test Date: 06-22-04
Small Beam
0
200
400
600
800
1,000
1,200
1,400
1,600
1,800
2,000
0 1 2 3 4 5 6
CMOD (10^-2 mm)
Lo
ad
(N
)
1st cycle
2nd cycle
3rd cycle
4th cycle
5th cycle
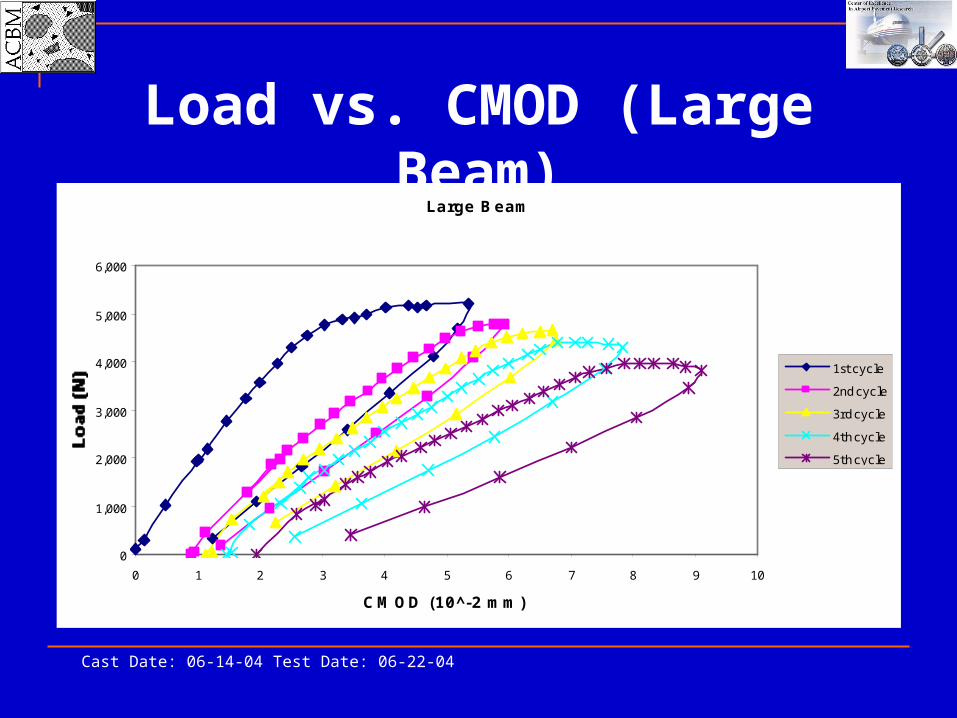
Load vs. CMOD (Large Beam)
Cast Date: 06-14-04 Test Date: 06-22-04
Large Beam
0
1,000
2,000
3,000
4,000
5,000
6,000
0 1 2 3 4 5 6 7 8 9 10
CMOD (10 -̂2 mm)
1st cycle
2nd cycle
3rd cycle
4th cycle
5th cycle

Two Parameter Fracture Model Results
Test #
Dimensions (mm) ft
c
w/c
da
(mm)
E
ao/b ac/b
KsIc
CTODc
(mm)
GsIc
(N/m)bS b t (MPa) (GPa)
(MPa m1/2)
1 250 62.5 80 35.7 0.45 19 27.3 0.333 0.417 1.177 0.0072 50.73
2 600 150 80 35.7 0.45 19 39.6 0.333 0.538 1.735 0.0402 76.08
3 1000 250 80 35.7 0.45 19 39.4 0.333 0.460 1.788 0.0321 81.06
4 250 62.5 80 37.9 0.45 19 28.0 0.333 0.524 1.314 0.0254 61.67
5 600 150 80 37.9 0.45 19 46.1 0.333 0.515 1.699 0.0292 62.63
6 1000 250 80 37.9 0.45 19 34.0 0.333 0.461 1.693 0.0352 84.18
Jenq and Shah

Size Effect Law Results
E
S b t (GPa)1 250 62.5 80 35.7 0.45 19 0.3332 600 150 80 35.7 0.45 19 0.3333 1000 250 80 35.7 0.45 19 0.3334 1367 341.7 80 37.9 0.45 19 0.3335 1742 435.4 80 37.9 0.45 19 0.3336 2117 529.2 80 37.9 0.45 19 0.333
cf
0.095 0.1558
αo
(ao/b)
CB
(MPa-2)
0.04538 4.111
m (<.2)
17.396
17.396
AB (mm-1
MPa-2)Series
Number
Dimensions (mm) f'c (MPa)
da
(mm)w/c
Gf
(N/m)
ωA
(<.1)
0.095 0.1558
35.0 27.68
36.0 26.910.04538 4.111
Bazant et al

Partial Depth Crack
Edge Notch Crack
Quarter-Elliptical Crack
a
b
cd
Slab Tests
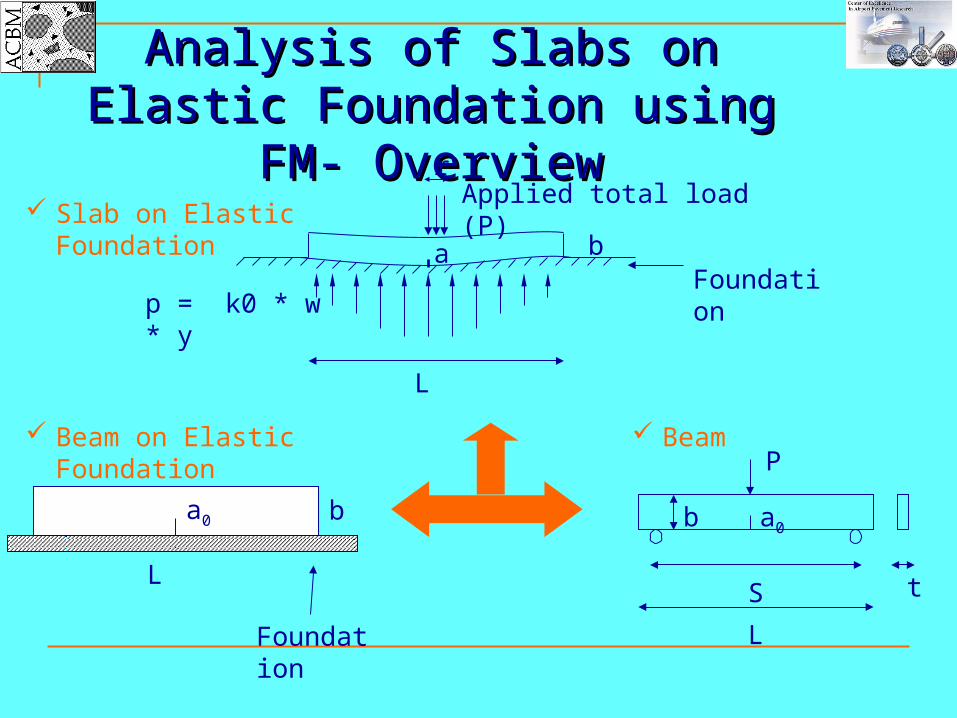
Analysis of Slabs on Elastic Analysis of Slabs on Elastic
Foundation using FM- OverviewFoundation using FM- Overview
ba
L
Foundationp = k0 * w * y
Applied total load (P)r
ba0
L
Foundation
a0b
P
S t
L
Slab on Elastic Foundation
Beam on Elastic Foundation Beam
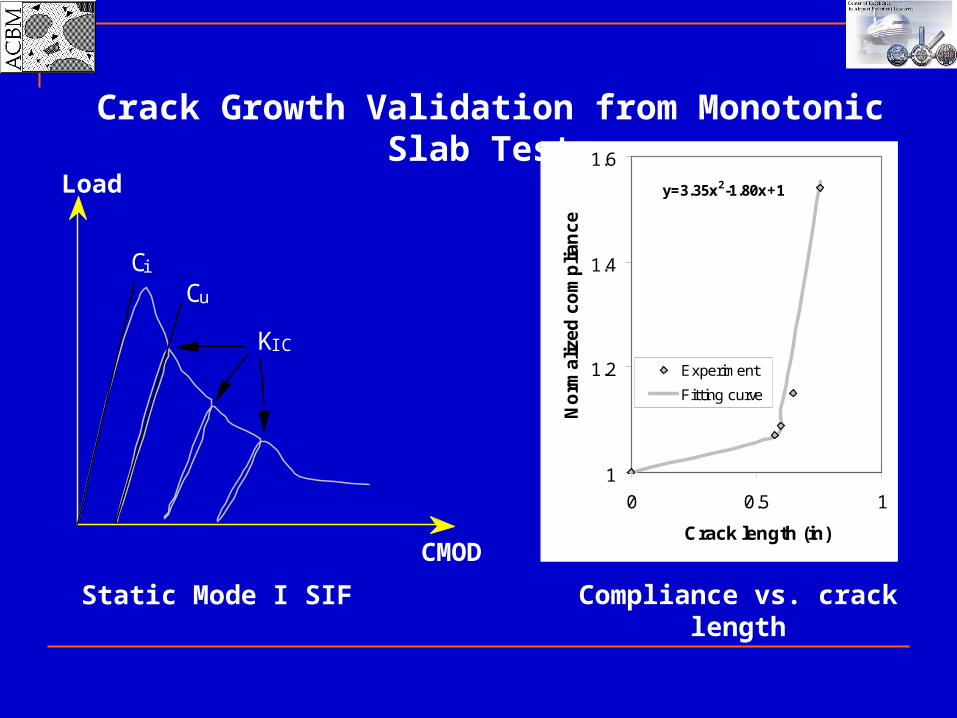
CMOD
Load
KIC
Ci Cu
Static Mode I SIF
1
1.2
1.4
1.6
0 0.5 1
Crack length (in)
No
rma
lize
d c
om
plia
nc
e
Experiment
Fitting curve
y=3.35x2-1.80x+1
Compliance vs. crack length
Crack Growth Validation from Monotonic Slab Tests
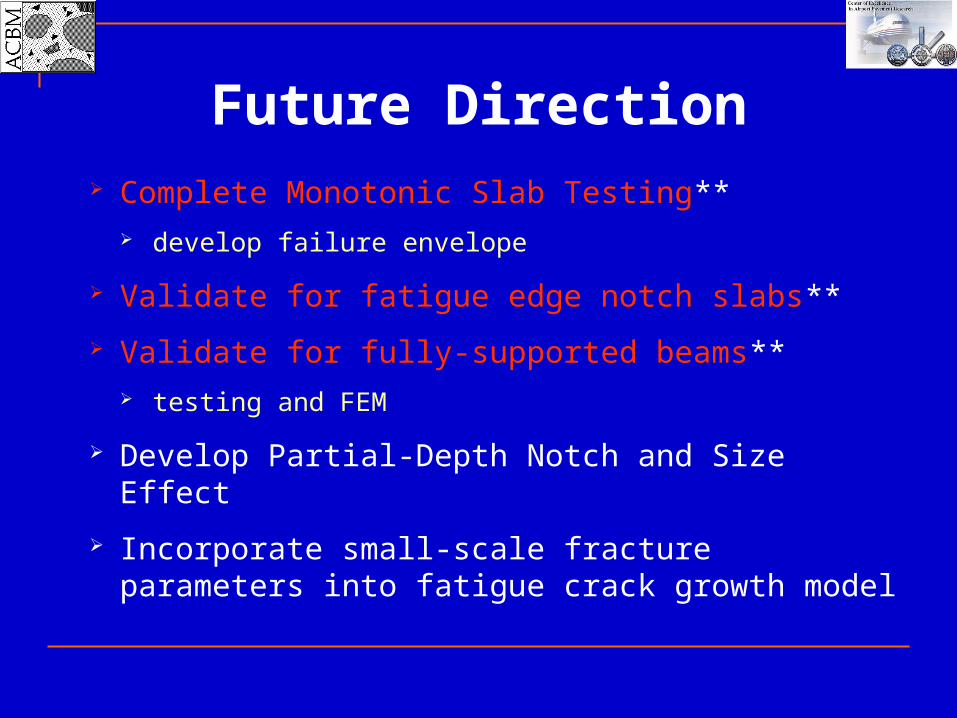
Future Direction Complete Monotonic Slab Testing**
develop failure envelope
Validate for fatigue edge notch slabs**
Validate for fully-supported beams** testing and FEM
Develop Partial-Depth Notch and Size Effect
Incorporate small-scale fracture parameters into fatigue crack growth model

Compliance vs. Crack Length for
Fully Supported Beam λ4 (1 - e-λw cos (λ w)) = 3(k2 b w C) / (d2 q) λ2 / (e-λw sin (λ w)) = 3(q √(π a0) F(α0)) / (KIC b d2)
λ = characteristic (dimension is length-1) w = ½ the length of load distribution k = modulus of subgrade reaction b = width of the beam C = Compliance d = depth of the beam q = distributed load a0 = crack length F(α0) = -3.035α0
4 + 2.540α03 + 1.137α0
2 – 0.690α0 + 1.334 α0 = a0 / b KIC = Critical Stress Intensity Factor for Mode I
q
w
a0


![Construction of Concrete Pavements (Jeff Roesler)[1]](https://static.fdocuments.us/doc/165x107/577d29701a28ab4e1ea6cb41/construction-of-concrete-pavements-jeff-roesler1.jpg)


