Fast resonant target vibrating wire scanner for...
9
Fast resonant target vibrating wire scanner for photon beam S. G. Arutunian, M. Chung, G. S. Harutyunyan, A. V. Margaryan, E. G. Lazareva, L. M. Lazarev, and L. A. Shahinyan Citation: Review of Scientific Instruments 87, 023108 (2016); doi: 10.1063/1.4941837 View online: http://dx.doi.org/10.1063/1.4941837 View Table of Contents: http://scitation.aip.org/content/aip/journal/rsi/87/2?ver=pdfcov Published by the AIP Publishing Articles you may be interested in Beam Tail Measurements using Wire Scanners at DESY AIP Conf. Proc. 693, 129 (2003); 10.1063/1.1638338 Biasing Wire Scanners and Halo Scrapers for Measuring 6.7‐MeV Proton‐Beam Halo AIP Conf. Proc. 648, 297 (2002); 10.1063/1.1524413 Experiments with polarized photon beam at GRAAL AIP Conf. Proc. 570, 198 (2001); 10.1063/1.1384065 Slow wire scanner beam profile measurement for LEDA AIP Conf. Proc. 546, 510 (2000); 10.1063/1.1342624 APL Photonics Reuse of AIP Publishing content is subject to the terms at: https://publishing.aip.org/authors/rights-and-permissions. IP: 37.252.93.206 On: Mon, 22 Feb 2016 14:54:08
-
Upload
truongnguyet -
Category
Documents
-
view
221 -
download
0
Transcript of Fast resonant target vibrating wire scanner for...

Fast resonant target vibrating wire scanner for photon beamS. G. Arutunian, M. Chung, G. S. Harutyunyan, A. V. Margaryan, E. G. Lazareva, L. M. Lazarev, and L. A.Shahinyan Citation: Review of Scientific Instruments 87, 023108 (2016); doi: 10.1063/1.4941837 View online: http://dx.doi.org/10.1063/1.4941837 View Table of Contents: http://scitation.aip.org/content/aip/journal/rsi/87/2?ver=pdfcov Published by the AIP Publishing Articles you may be interested in Beam Tail Measurements using Wire Scanners at DESY AIP Conf. Proc. 693, 129 (2003); 10.1063/1.1638338 Biasing Wire Scanners and Halo Scrapers for Measuring 6.7‐MeV Proton‐Beam Halo AIP Conf. Proc. 648, 297 (2002); 10.1063/1.1524413 Experiments with polarized photon beam at GRAAL AIP Conf. Proc. 570, 198 (2001); 10.1063/1.1384065 Slow wire scanner beam profile measurement for LEDA AIP Conf. Proc. 546, 510 (2000); 10.1063/1.1342624 APL Photonics
Reuse of AIP Publishing content is subject to the terms at: https://publishing.aip.org/authors/rights-and-permissions. IP: 37.252.93.206 On: Mon, 22 Feb 2016
14:54:08
REVIEW OF SCIENTIFIC INSTRUMENTS 87, 023108 (2016)
Fast resonant target vibrating wire scanner for photon beamS. G. Arutunian,1,a) M. Chung,2,a) G. S. Harutyunyan,1 A. V. Margaryan,1 E. G. Lazareva,1L. M. Lazarev,1 and L. A. Shahinyan11Yerevan Physics Institute, Alikhanian Br. St. 2, Yerevan 0036, Armenia2Ulsan National Institute of Science and Technology, Ulsan 689-798, South Korea
(Received 22 September 2015; accepted 31 January 2016; published online 22 February 2016)
We propose a new type of wire scanner for beam profile measurements, based on the use of a vibratingwire as a scattering target. Synchronous measurements with the wire oscillation allow to detect onlythe signal coming from the scattering of the beam on the wire. This resonant method enables fastbeam profiling in the presence of a high level of background. The developed wire scanner, calledresonant target vibrating wire scanner, is applied to photon beam profiling, in which the photonsreflected on the wire are measured by a fast photodiode. In addition, the proposed measurementprinciple is expected to monitor other types of beams as well, such as neutrons, protons, electrons,and ions. C 2016 AIP Publishing LLC. [http://dx.doi.org/10.1063/1.4941837]
I. INTRODUCTION
The operation principle of wire scanners, which arewidely used for profile measurements of various typesof beams, is based on the detection of secondary parti-cles/radiation generated when the beam particles penetratethe wire. To pick out the beam signal from the high levelof background, we consider using vibrating wire as a targetwhose oscillation frequency serves as a reference to separatenoise and signal in the actual measurements. This idea wasproposed in Refs. 1 and 2. In this paper, we realized thisconcept and developed a fast Resonant Target Vibrating WireScanner (RT-VWS) for photon beam profile measurements.The main idea of the method is to measure reflected signalcoming from the scattering of the photon beam on the vibratingwire, synchronously with measuring the wire’s oscillationfrequency. Due to the high frequency of the wire oscillations(few kHz), it needs less than 1 ms of the measurement timeat each scan position, which results in only tens of ms oftotal scan time. The differential signal is produced throughtwo serial measurements of the photons reflected from theopposite positions of the vibrating wire oscillations. Thisprocedure eliminates a high level of background noise fallingon the photodiode during the photon measurements and alsominimizes the noise in the measurement circuits. The proposedmethod is also applicable to scan beams of other types, e.g.,neutrons (see Ref. 2), protons, electrons, and ions.
To apply the resonant target concept, we modified thevibrating wire monitors (VWMs) developed for low-fluxbeam profile measurements.3,4 These monitors are speciallydesigned for beam halo measurements. Their operating prin-ciple is based on the precise detection of wire’s temperatureoverheating. This overheating is caused by scattering of beamparticles on the wire, so the measurement speed is necessarilyslow to get a thermal balance during the position scan.
a)Authors to whom correspondence should be addressed. Electronic ad-dresses: [email protected] and [email protected].
The oscillations of the wire are generated by theinteraction of an AC drive current through the wire with apermanent magnetic field.5 A special feedback circuit selectsthe resonant frequency at which the AC current frequencyis equal to the wire’s natural frequency. The stabilization ofmechanical oscillation process is provided by precise controlof this current. Usually the peak-to-peak amplitude of thewire oscillation is a few times the wire diameter. It means thatduring the oscillation, the wire sweeps finite area in space andcan be effectively treated as a moving target.
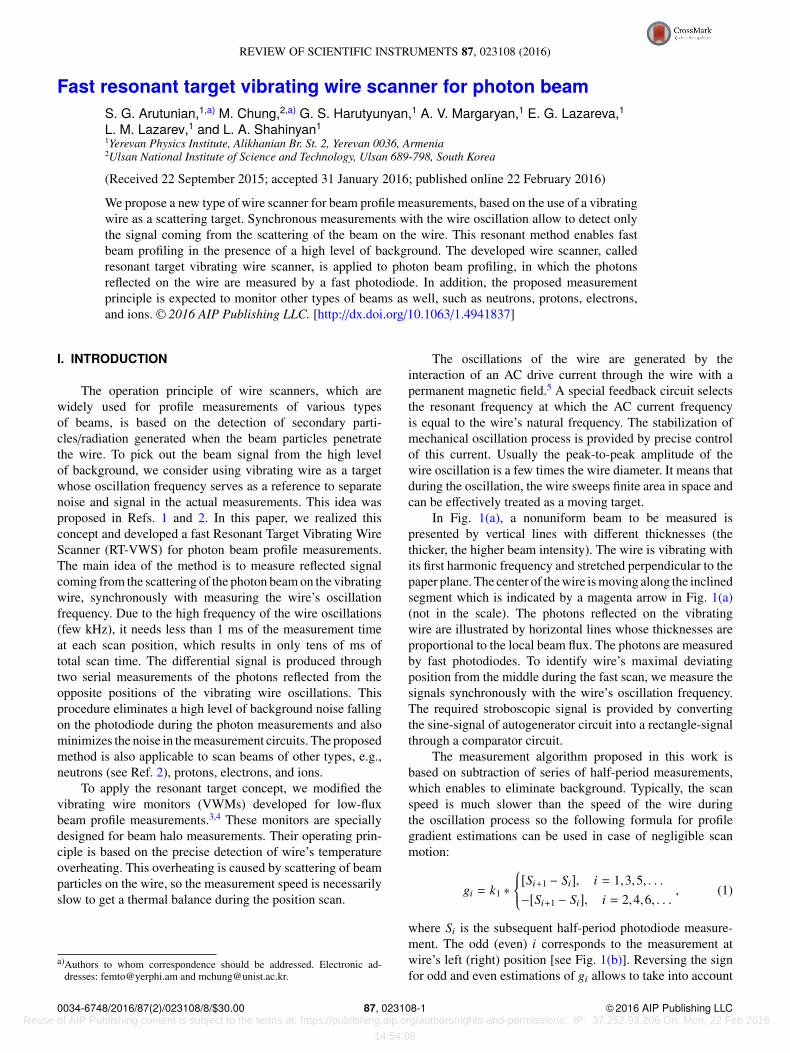
In Fig. 1(a), a nonuniform beam to be measured ispresented by vertical lines with different thicknesses (thethicker, the higher beam intensity). The wire is vibrating withits first harmonic frequency and stretched perpendicular to thepaper plane. The center of the wire is moving along the inclinedsegment which is indicated by a magenta arrow in Fig. 1(a)(not in the scale). The photons reflected on the vibratingwire are illustrated by horizontal lines whose thicknesses areproportional to the local beam flux. The photons are measuredby fast photodiodes. To identify wire’s maximal deviatingposition from the middle during the fast scan, we measure thesignals synchronously with the wire’s oscillation frequency.The required stroboscopic signal is provided by convertingthe sine-signal of autogenerator circuit into a rectangle-signalthrough a comparator circuit.
The measurement algorithm proposed in this work isbased on subtraction of series of half-period measurements,which enables to eliminate background. Typically, the scanspeed is much slower than the speed of the wire duringthe oscillation process so the following formula for profilegradient estimations can be used in case of negligible scanmotion:
gi = k1 ∗
[Si+1 − Si], i = 1,3,5, . . .−[Si+1 − Si], i = 2,4,6, . . .
, (1)
where Si is the subsequent half-period photodiode measure-ment. The odd (even) i corresponds to the measurement atwire’s left (right) position [see Fig. 1(b)]. Reversing the signfor odd and even estimations of gi allows to take into account
0034-6748/2016/87(2)/023108/8/$30.00 87, 023108-1 © 2016 AIP Publishing LLC Reuse of AIP Publishing content is subject to the terms at: https://publishing.aip.org/authors/rights-and-permissions. IP: 37.252.93.206 On: Mon, 22 Feb 2016
14:54:08
023108-2 Arutunian et al. Rev. Sci. Instrum. 87, 023108 (2016)
FIG. 1. Schematic view (a) of the measured beam with nonuniform profile. The nonuniform beam flux is represented by vertical lines with different thicknesses.The thicker lines correspond to the larger values of beam intensity. The direction of wire oscillation is perpendicular to the drawing plane, and the inclinedsegment (magenta line) indicates the movement of the vibrating wire center. The different fluxes of reflected photons at these positions, which are illustrated byhorizontal arrows with different thicknesses, are measured by the fast photodiode. Schematic view (b) of the vibrating wire in the maximal deviating positionsfrom the fixed stable position (black line): 1, 3—“left” measurements, 2—“right” measurements. Schematic view (c) of the vibrating wire moving to the right:during one period of the wire oscillation, the “left” measurements 1 and 3 shift proportional to scan speed. All schematics are not to scale.
only the spatial gradients and completely excludes the high-gradient temporal variations of the background. Formula (1)can be modified when the monitor is moving as a whole witha small scan speed [see Fig. 1(c)],
gi = k2 ∗
[Si+1 − Si]/[a + Vτ/2], i = 1,3,5, . . .−[Si+1 − Si]/[a − Vτ/2], i = 2,4,6, . . .
, (2)
where a is the wire oscillation amplitude, V is the scan speed,and τ is the wire oscillation period (assumed that a/τ ≥ V ).Coefficients k1 and k2 connect the photodiode measurementsto the absolute photon fluxes.
The total number of measurements during the scan ofbeam with size A will be
N = 2F A/V, (3)
where F = 1/τ is the wire oscillation frequency.To estimate the maximal scan speed, we imagine that at
minimum 100 measurements should be made. In this case, wefind
VMAX = F A/50 (4)
and minimal time of scan
tS = 50/F (5)
does not depend on the beam size.In Table I, typical values for the parameters defined above
are presented for two versions of the vibrating wire monitor.
TABLE I. Typical values for two different designs of the RT-VWS. Here,L—is the wire length, 2a/F—wire oscillation mean speed. The wire diam-eter in both cases is 0.1 mm.
L
(mm)F
(Hz)a
(mm)2a/F(mm/s)
A
(mm)VMAX
(mm/s)tS
(ms) N
40 2500 0.15 750 3 150 20 10080 1250 0.30 750 3 75 40 100
We note that the scan speed of the shorter wire can be increasedtwice. The scan speed is doubled with the shorter wire becausethe natural oscillation frequency of the shorter wire is doubled(with the assumption that the mechanical amplitudes of theoscillations remain approximately the same).
II. VWM
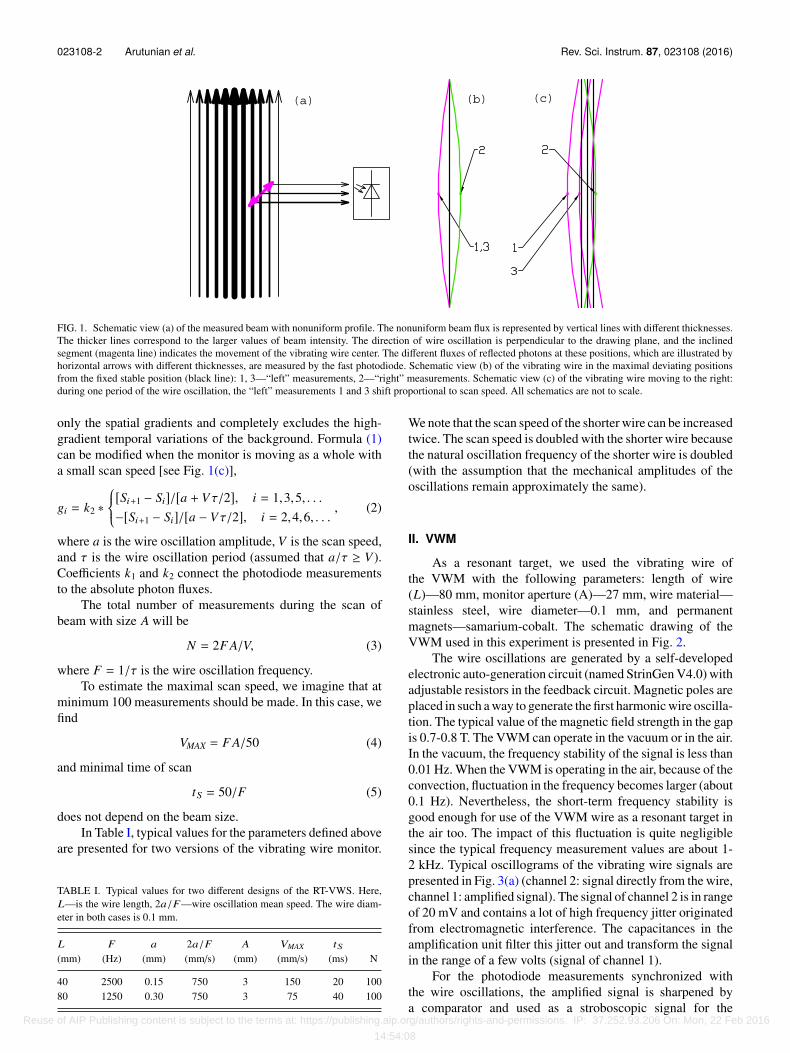
As a resonant target, we used the vibrating wire ofthe VWM with the following parameters: length of wire(L)—80 mm, monitor aperture (A)—27 mm, wire material—stainless steel, wire diameter—0.1 mm, and permanentmagnets—samarium-cobalt. The schematic drawing of theVWM used in this experiment is presented in Fig. 2.
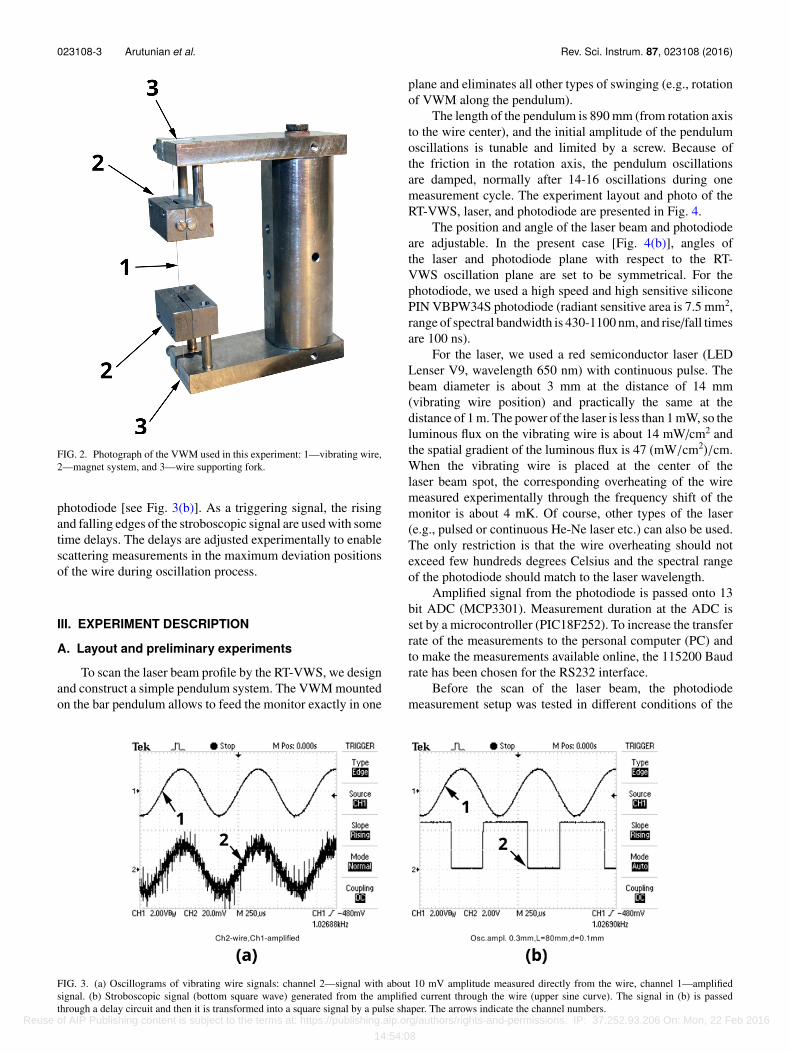
The wire oscillations are generated by a self-developedelectronic auto-generation circuit (named StrinGen V4.0) withadjustable resistors in the feedback circuit. Magnetic poles areplaced in such a way to generate the first harmonic wire oscilla-tion. The typical value of the magnetic field strength in the gapis 0.7-0.8 T. The VWM can operate in the vacuum or in the air.In the vacuum, the frequency stability of the signal is less than0.01 Hz. When the VWM is operating in the air, because of theconvection, fluctuation in the frequency becomes larger (about0.1 Hz). Nevertheless, the short-term frequency stability isgood enough for use of the VWM wire as a resonant target inthe air too. The impact of this fluctuation is quite negligiblesince the typical frequency measurement values are about 1-2 kHz. Typical oscillograms of the vibrating wire signals arepresented in Fig. 3(a) (channel 2: signal directly from the wire,channel 1: amplified signal). The signal of channel 2 is in rangeof 20 mV and contains a lot of high frequency jitter originatedfrom electromagnetic interference. The capacitances in theamplification unit filter this jitter out and transform the signalin the range of a few volts (signal of channel 1).
For the photodiode measurements synchronized withthe wire oscillations, the amplified signal is sharpened bya comparator and used as a stroboscopic signal for the
Reuse of AIP Publishing content is subject to the terms at: https://publishing.aip.org/authors/rights-and-permissions. IP: 37.252.93.206 On: Mon, 22 Feb 2016
14:54:08
023108-3 Arutunian et al. Rev. Sci. Instrum. 87, 023108 (2016)
FIG. 2. Photograph of the VWM used in this experiment: 1—vibrating wire,2—magnet system, and 3—wire supporting fork.
photodiode [see Fig. 3(b)]. As a triggering signal, the risingand falling edges of the stroboscopic signal are used with sometime delays. The delays are adjusted experimentally to enablescattering measurements in the maximum deviation positionsof the wire during oscillation process.
III. EXPERIMENT DESCRIPTION
A. Layout and preliminary experiments
To scan the laser beam profile by the RT-VWS, we designand construct a simple pendulum system. The VWM mountedon the bar pendulum allows to feed the monitor exactly in one
plane and eliminates all other types of swinging (e.g., rotationof VWM along the pendulum).
The length of the pendulum is 890 mm (from rotation axisto the wire center), and the initial amplitude of the pendulumoscillations is tunable and limited by a screw. Because ofthe friction in the rotation axis, the pendulum oscillationsare damped, normally after 14-16 oscillations during onemeasurement cycle. The experiment layout and photo of theRT-VWS, laser, and photodiode are presented in Fig. 4.
The position and angle of the laser beam and photodiodeare adjustable. In the present case [Fig. 4(b)], angles ofthe laser and photodiode plane with respect to the RT-VWS oscillation plane are set to be symmetrical. For thephotodiode, we used a high speed and high sensitive siliconePIN VBPW34S photodiode (radiant sensitive area is 7.5 mm2,range of spectral bandwidth is 430-1100 nm, and rise/fall timesare 100 ns).
For the laser, we used a red semiconductor laser (LEDLenser V9, wavelength 650 nm) with continuous pulse. Thebeam diameter is about 3 mm at the distance of 14 mm(vibrating wire position) and practically the same at thedistance of 1 m. The power of the laser is less than 1 mW, so theluminous flux on the vibrating wire is about 14 mW/cm2 andthe spatial gradient of the luminous flux is 47 (mW/cm2)/cm.When the vibrating wire is placed at the center of thelaser beam spot, the corresponding overheating of the wiremeasured experimentally through the frequency shift of themonitor is about 4 mK. Of course, other types of the laser(e.g., pulsed or continuous He-Ne laser etc.) can also be used.The only restriction is that the wire overheating should notexceed few hundreds degrees Celsius and the spectral rangeof the photodiode should match to the laser wavelength.
Amplified signal from the photodiode is passed onto 13bit ADC (MCP3301). Measurement duration at the ADC isset by a microcontroller (PIC18F252). To increase the transferrate of the measurements to the personal computer (PC) andto make the measurements available online, the 115200 Baudrate has been chosen for the RS232 interface.
Before the scan of the laser beam, the photodiodemeasurement setup was tested in different conditions of the
FIG. 3. (a) Oscillograms of vibrating wire signals: channel 2—signal with about 10 mV amplitude measured directly from the wire, channel 1—amplifiedsignal. (b) Stroboscopic signal (bottom square wave) generated from the amplified current through the wire (upper sine curve). The signal in (b) is passedthrough a delay circuit and then it is transformed into a square signal by a pulse shaper. The arrows indicate the channel numbers.
Reuse of AIP Publishing content is subject to the terms at: https://publishing.aip.org/authors/rights-and-permissions. IP: 37.252.93.206 On: Mon, 22 Feb 2016
14:54:08

023108-4 Arutunian et al. Rev. Sci. Instrum. 87, 023108 (2016)
FIG. 4. Schematic block diagram (a) and photograph of experimental setup (b) 1—laser, 2—vibrating wire, 3—monitor, 4—photodiode, 5—photodiodefront-end circuit, 6—photodiode measurement circuit, 7—wire oscillation autogenerator circuit, 8—stroboscopic input on the photodiode measurement circuit,9—pendulum on which the monitor is mounted, 10—the axis of pendulum, 11—RS232 interface, and 12—PC.
ambient lightening. The main conclusion of these measure-ments was that the background of the laser beam measure-ments contains 50 Hz component mainly due to the ambientelectric light. However, the 50 Hz component in the signalpersists even without any electric light. We suspect that it iscaused by electrical disturbances in the measurement circuit[see inset in Fig. 6(a)].
In order to find the phases of the maximal deviations of thewire from the stable position during the oscillation, the sweepof the photodiode signal was performed by changing the timedelay from the rising/falling edges of the stroboscopic signal.In these measurements, the vibrating wire was located on thelaser beam spot where the gradient of the laser beam profileis high enough. The photodiode signal over the oscillationsperiod (about 1000 µs) is plotted in Fig. 5 as a function ofthe time delay from the rising edge. By analyzing this figure,one can see that the maximum signal, which corresponds tothe signal from the leftmost position of the wire [positions1 and 3 in Fig. 1(b)], is obtained at delay1 = 170 µs. The
FIG. 5. Scan of the photodiode signals according to the time delay from therising edge of stroboscopic signal. The vibrating wire is placed in a fixedposition of the laser beam spot with a finite intensity gradient.
rightmost position of the wire corresponds to the time delayof 740 µs. Considering the pulse width in the stroboscopicsignal [see Fig. 3(b)] was 580 µs, this time delay correspondsto delay2 = 160 µs from the falling edge. This signal sweepindeed defines the profile of the beam in a fixed position of thevibrating wire. So such measurements can provide informationon the profiles of the ultrathin beams (when the beam sizes areabout the amplitudes of the vibrating wire oscillations). Moredetails on this subject will be discussed in the Conclusion.
To compare the measurements using the stroboscopicsignal generated from the vibrating wire with those usingan external signal generator, the following experiments wereperformed. The wire was placed under the laser beam in a fixedposition with a finite flux gradient. The natural frequency ofthe vibrating wire was 1047.6 Hz.
In Fig. 6(a), photodiode measurements were initiated bythe external generator with frequency approximately equalto the vibrating wire frequency (the frequency difference isless than 0.2 Hz). In this case, the serial measurements bythe photodiode are separated by time interval approximatelyequal to the half-period of the vibrating wire oscillations. Thistime interval, however, does not exactly match to the maximaldeviating position of the wire from the central position duringthe mechanical oscillation. As a result, we observed typicalbeating patterns, where the differential signal (the differencebetween two main signals) changes its sign with the periodicityof about few seconds [bottom magenta line in Fig. 6(a)]. Thestructure of the main signal from the photodiode containshigh levels of 50 Hz components. However, such a structureis eliminated in the differential signal [see inset in Fig. 6(a)].In case of measurements synchronized by the vibrating wireitself, both the main measurement and differential signalsremain stable [see Fig. 6(b)]. By comparing Figs. 6(a) and6(b), one can note that the local patterns (i.e., high levels
Reuse of AIP Publishing content is subject to the terms at: https://publishing.aip.org/authors/rights-and-permissions. IP: 37.252.93.206 On: Mon, 22 Feb 2016
14:54:08
023108-5 Arutunian et al. Rev. Sci. Instrum. 87, 023108 (2016)
FIG. 6. Main (1, blue curves) and differential (2, magenta curves) signals of the laser beam reflections on the vibrating wire in cases when the measurementswere synchronized by external generator (a) and by the vibrating wire itself (b).
of 50 Hz components) formed in the main signals are quitesimilar for both the measurements synchronized by externalgenerator and by the vibrating wire itself.
B. Typical scan of laser beam profile
The scan of the laser beam profile was performed byswinging pendulum (see Fig. 7).
In the final damped position of the pendulum, the wireis parked away from the laser beam. For one pendulumoscillation period, two scans of the laser beam were madeby the vibrating wire (the first scan from left to right, and thesecond from right to left).
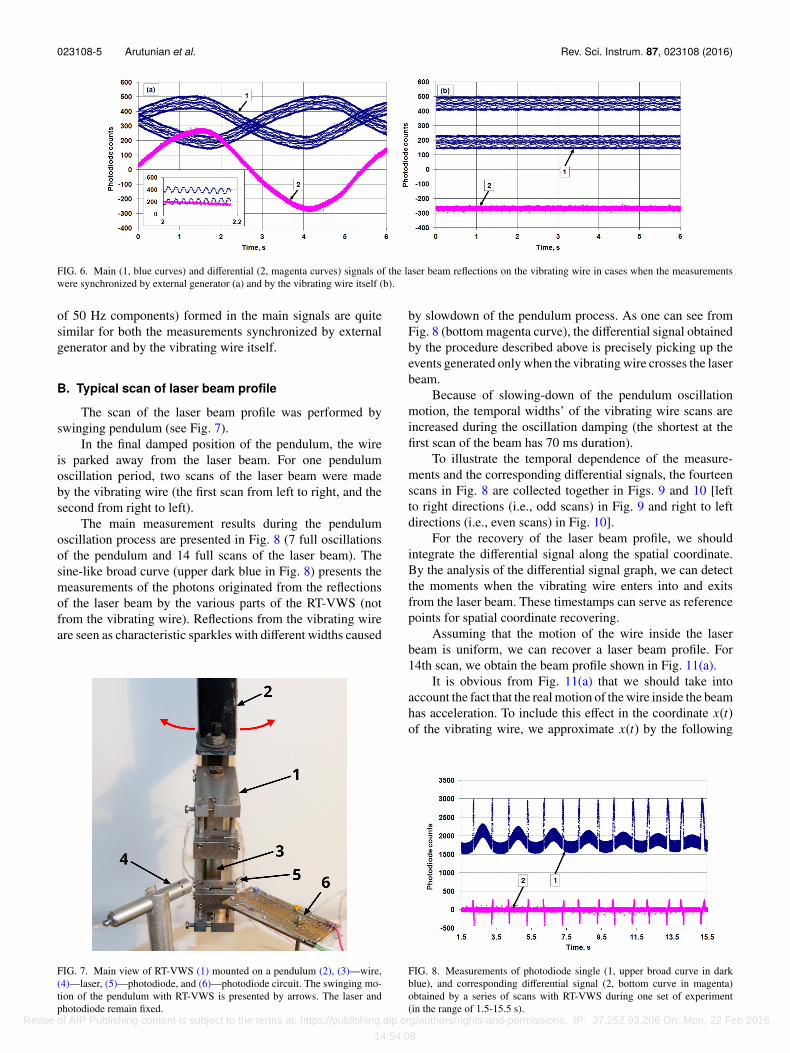
The main measurement results during the pendulumoscillation process are presented in Fig. 8 (7 full oscillationsof the pendulum and 14 full scans of the laser beam). Thesine-like broad curve (upper dark blue in Fig. 8) presents themeasurements of the photons originated from the reflectionsof the laser beam by the various parts of the RT-VWS (notfrom the vibrating wire). Reflections from the vibrating wireare seen as characteristic sparkles with different widths caused
FIG. 7. Main view of RT-VWS (1) mounted on a pendulum (2), (3)—wire,(4)—laser, (5)—photodiode, and (6)—photodiode circuit. The swinging mo-tion of the pendulum with RT-VWS is presented by arrows. The laser andphotodiode remain fixed.
by slowdown of the pendulum process. As one can see fromFig. 8 (bottom magenta curve), the differential signal obtainedby the procedure described above is precisely picking up theevents generated only when the vibrating wire crosses the laserbeam.
Because of slowing-down of the pendulum oscillationmotion, the temporal widths’ of the vibrating wire scans areincreased during the oscillation damping (the shortest at thefirst scan of the beam has 70 ms duration).
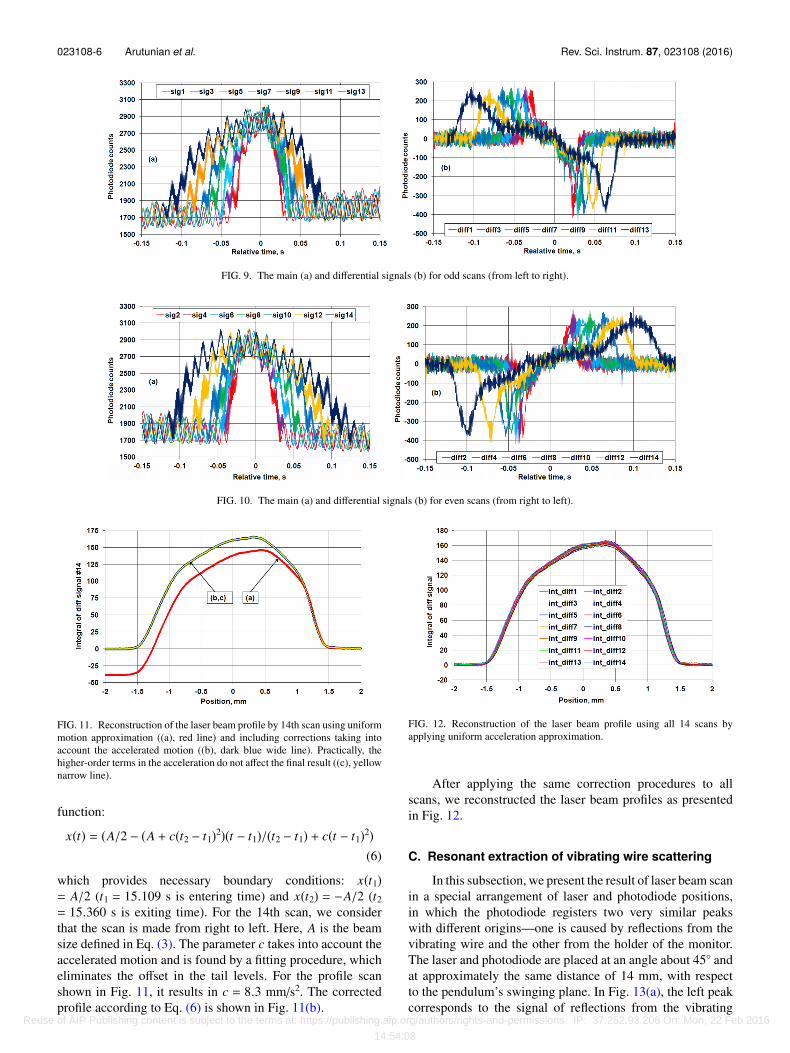
To illustrate the temporal dependence of the measure-ments and the corresponding differential signals, the fourteenscans in Fig. 8 are collected together in Figs. 9 and 10 [leftto right directions (i.e., odd scans) in Fig. 9 and right to leftdirections (i.e., even scans) in Fig. 10].
For the recovery of the laser beam profile, we shouldintegrate the differential signal along the spatial coordinate.By the analysis of the differential signal graph, we can detectthe moments when the vibrating wire enters into and exitsfrom the laser beam. These timestamps can serve as referencepoints for spatial coordinate recovering.
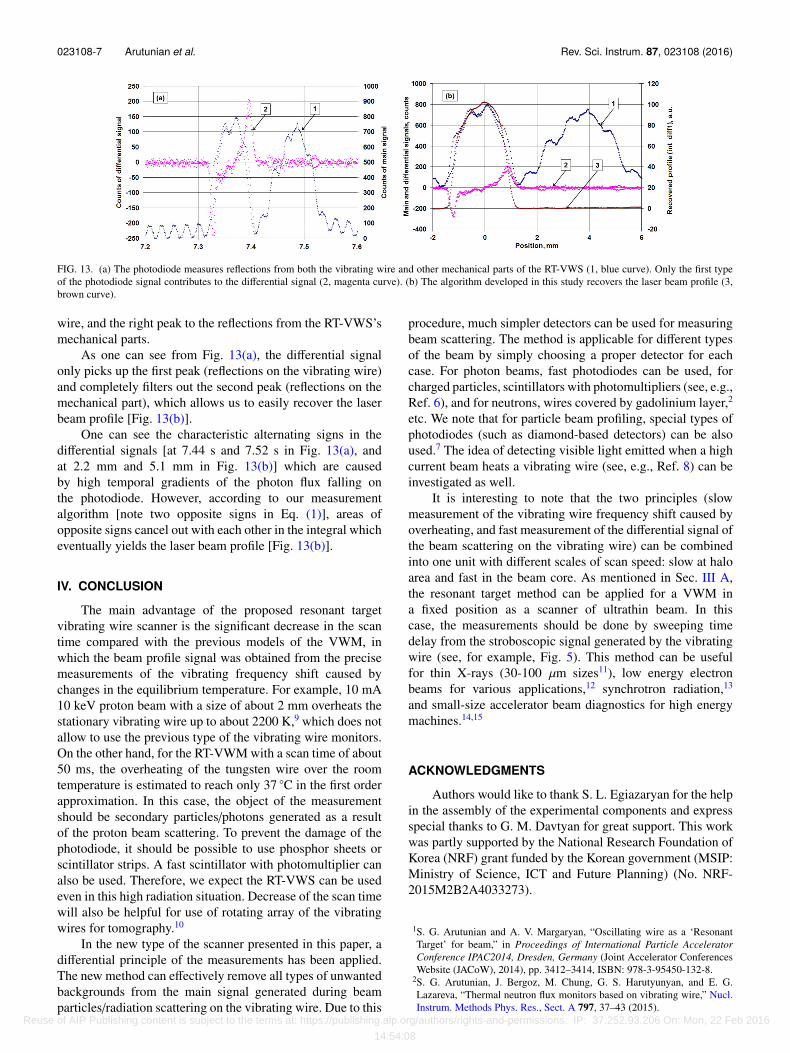
Assuming that the motion of the wire inside the laserbeam is uniform, we can recover a laser beam profile. For14th scan, we obtain the beam profile shown in Fig. 11(a).
It is obvious from Fig. 11(a) that we should take intoaccount the fact that the real motion of the wire inside the beamhas acceleration. To include this effect in the coordinate x(t)of the vibrating wire, we approximate x(t) by the following
FIG. 8. Measurements of photodiode single (1, upper broad curve in darkblue), and corresponding differential signal (2, bottom curve in magenta)obtained by a series of scans with RT-VWS during one set of experiment(in the range of 1.5-15.5 s).
Reuse of AIP Publishing content is subject to the terms at: https://publishing.aip.org/authors/rights-and-permissions. IP: 37.252.93.206 On: Mon, 22 Feb 2016
14:54:08
023108-6 Arutunian et al. Rev. Sci. Instrum. 87, 023108 (2016)
FIG. 9. The main (a) and differential signals (b) for odd scans (from left to right).
FIG. 10. The main (a) and differential signals (b) for even scans (from right to left).
FIG. 11. Reconstruction of the laser beam profile by 14th scan using uniformmotion approximation ((a), red line) and including corrections taking intoaccount the accelerated motion ((b), dark blue wide line). Practically, thehigher-order terms in the acceleration do not affect the final result ((c), yellownarrow line).
function:
x(t) = (A/2 − (A + c(t2 − t1)2)(t − t1)/(t2 − t1) + c(t − t1)2)(6)
which provides necessary boundary conditions: x(t1)= A/2 (t1 = 15.109 s is entering time) and x(t2) = −A/2 (t2= 15.360 s is exiting time). For the 14th scan, we considerthat the scan is made from right to left. Here, A is the beamsize defined in Eq. (3). The parameter c takes into account theaccelerated motion and is found by a fitting procedure, whicheliminates the offset in the tail levels. For the profile scanshown in Fig. 11, it results in c = 8.3 mm/s2. The correctedprofile according to Eq. (6) is shown in Fig. 11(b).
FIG. 12. Reconstruction of the laser beam profile using all 14 scans byapplying uniform acceleration approximation.
After applying the same correction procedures to allscans, we reconstructed the laser beam profiles as presentedin Fig. 12.
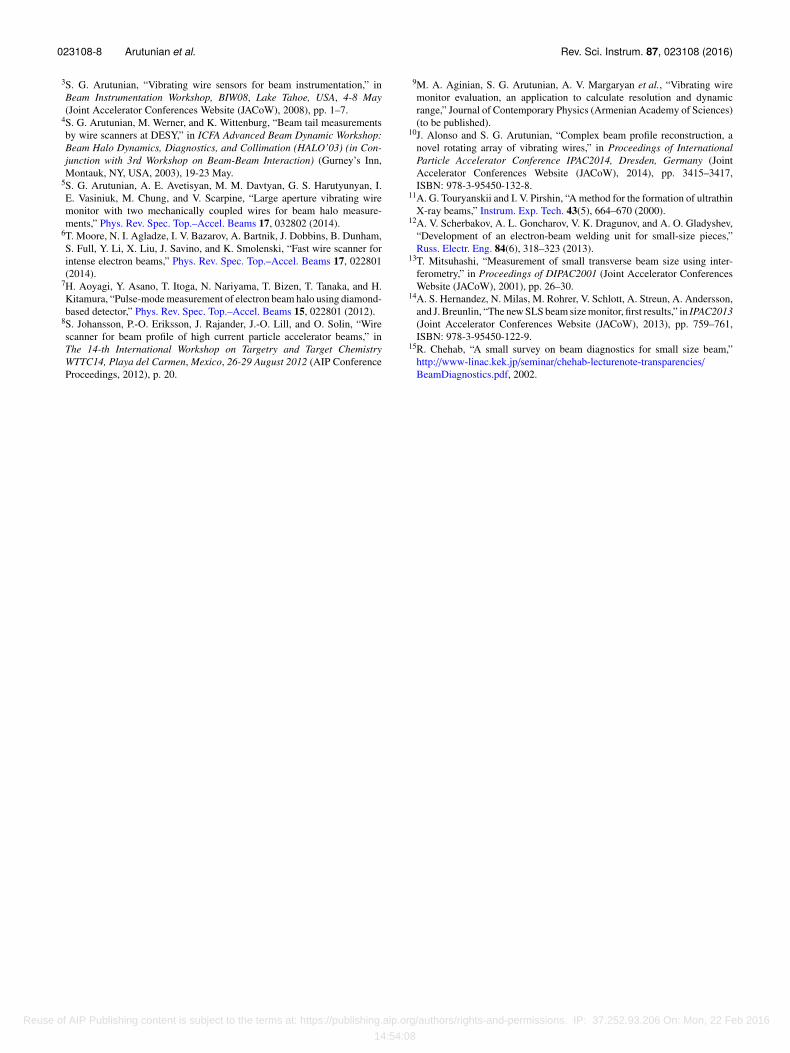
C. Resonant extraction of vibrating wire scattering
In this subsection, we present the result of laser beam scanin a special arrangement of laser and photodiode positions,in which the photodiode registers two very similar peakswith different origins—one is caused by reflections from thevibrating wire and the other from the holder of the monitor.The laser and photodiode are placed at an angle about 45◦ andat approximately the same distance of 14 mm, with respectto the pendulum’s swinging plane. In Fig. 13(a), the left peakcorresponds to the signal of reflections from the vibrating
Reuse of AIP Publishing content is subject to the terms at: https://publishing.aip.org/authors/rights-and-permissions. IP: 37.252.93.206 On: Mon, 22 Feb 2016
14:54:08
023108-7 Arutunian et al. Rev. Sci. Instrum. 87, 023108 (2016)
FIG. 13. (a) The photodiode measures reflections from both the vibrating wire and other mechanical parts of the RT-VWS (1, blue curve). Only the first typeof the photodiode signal contributes to the differential signal (2, magenta curve). (b) The algorithm developed in this study recovers the laser beam profile (3,brown curve).
wire, and the right peak to the reflections from the RT-VWS’smechanical parts.
As one can see from Fig. 13(a), the differential signalonly picks up the first peak (reflections on the vibrating wire)and completely filters out the second peak (reflections on themechanical part), which allows us to easily recover the laserbeam profile [Fig. 13(b)].
One can see the characteristic alternating signs in thedifferential signals [at 7.44 s and 7.52 s in Fig. 13(a), andat 2.2 mm and 5.1 mm in Fig. 13(b)] which are causedby high temporal gradients of the photon flux falling onthe photodiode. However, according to our measurementalgorithm [note two opposite signs in Eq. (1)], areas ofopposite signs cancel out with each other in the integral whicheventually yields the laser beam profile [Fig. 13(b)].
IV. CONCLUSION
The main advantage of the proposed resonant targetvibrating wire scanner is the significant decrease in the scantime compared with the previous models of the VWM, inwhich the beam profile signal was obtained from the precisemeasurements of the vibrating frequency shift caused bychanges in the equilibrium temperature. For example, 10 mA10 keV proton beam with a size of about 2 mm overheats thestationary vibrating wire up to about 2200 K,9 which does notallow to use the previous type of the vibrating wire monitors.On the other hand, for the RT-VWM with a scan time of about50 ms, the overheating of the tungsten wire over the roomtemperature is estimated to reach only 37 ◦C in the first orderapproximation. In this case, the object of the measurementshould be secondary particles/photons generated as a resultof the proton beam scattering. To prevent the damage of thephotodiode, it should be possible to use phosphor sheets orscintillator strips. A fast scintillator with photomultiplier canalso be used. Therefore, we expect the RT-VWS can be usedeven in this high radiation situation. Decrease of the scan timewill also be helpful for use of rotating array of the vibratingwires for tomography.10
In the new type of the scanner presented in this paper, adifferential principle of the measurements has been applied.The new method can effectively remove all types of unwantedbackgrounds from the main signal generated during beamparticles/radiation scattering on the vibrating wire. Due to this
procedure, much simpler detectors can be used for measuringbeam scattering. The method is applicable for different typesof the beam by simply choosing a proper detector for eachcase. For photon beams, fast photodiodes can be used, forcharged particles, scintillators with photomultipliers (see, e.g.,Ref. 6), and for neutrons, wires covered by gadolinium layer,2
etc. We note that for particle beam profiling, special types ofphotodiodes (such as diamond-based detectors) can be alsoused.7 The idea of detecting visible light emitted when a highcurrent beam heats a vibrating wire (see, e.g., Ref. 8) can beinvestigated as well.
It is interesting to note that the two principles (slowmeasurement of the vibrating wire frequency shift caused byoverheating, and fast measurement of the differential signal ofthe beam scattering on the vibrating wire) can be combinedinto one unit with different scales of scan speed: slow at haloarea and fast in the beam core. As mentioned in Sec. III A,the resonant target method can be applied for a VWM ina fixed position as a scanner of ultrathin beam. In thiscase, the measurements should be done by sweeping timedelay from the stroboscopic signal generated by the vibratingwire (see, for example, Fig. 5). This method can be usefulfor thin X-rays (30-100 µm sizes11), low energy electronbeams for various applications,12 synchrotron radiation,13
and small-size accelerator beam diagnostics for high energymachines.14,15
ACKNOWLEDGMENTS
Authors would like to thank S. L. Egiazaryan for the helpin the assembly of the experimental components and expressspecial thanks to G. M. Davtyan for great support. This workwas partly supported by the National Research Foundation ofKorea (NRF) grant funded by the Korean government (MSIP:Ministry of Science, ICT and Future Planning) (No. NRF-2015M2B2A4033273).
1S. G. Arutunian and A. V. Margaryan, “Oscillating wire as a ‘ResonantTarget’ for beam,” in Proceedings of International Particle AcceleratorConference IPAC2014, Dresden, Germany (Joint Accelerator ConferencesWebsite (JACoW), 2014), pp. 3412–3414, ISBN: 978-3-95450-132-8.
2S. G. Arutunian, J. Bergoz, M. Chung, G. S. Harutyunyan, and E. G.Lazareva, “Thermal neutron flux monitors based on vibrating wire,” Nucl.Instrum. Methods Phys. Res., Sect. A 797, 37–43 (2015).
Reuse of AIP Publishing content is subject to the terms at: https://publishing.aip.org/authors/rights-and-permissions. IP: 37.252.93.206 On: Mon, 22 Feb 2016
14:54:08
023108-8 Arutunian et al. Rev. Sci. Instrum. 87, 023108 (2016)
3S. G. Arutunian, “Vibrating wire sensors for beam instrumentation,” inBeam Instrumentation Workshop, BIW08, Lake Tahoe, USA, 4-8 May(Joint Accelerator Conferences Website (JACoW), 2008), pp. 1–7.
4S. G. Arutunian, M. Werner, and K. Wittenburg, “Beam tail measurementsby wire scanners at DESY,” in ICFA Advanced Beam Dynamic Workshop:Beam Halo Dynamics, Diagnostics, and Collimation (HALO’03) (in Con-junction with 3rd Workshop on Beam-Beam Interaction) (Gurney’s Inn,Montauk, NY, USA, 2003), 19-23 May.
5S. G. Arutunian, A. E. Avetisyan, M. M. Davtyan, G. S. Harutyunyan, I.E. Vasiniuk, M. Chung, and V. Scarpine, “Large aperture vibrating wiremonitor with two mechanically coupled wires for beam halo measure-ments,” Phys. Rev. Spec. Top.–Accel. Beams 17, 032802 (2014).
6T. Moore, N. I. Agladze, I. V. Bazarov, A. Bartnik, J. Dobbins, B. Dunham,S. Full, Y. Li, X. Liu, J. Savino, and K. Smolenski, “Fast wire scanner forintense electron beams,” Phys. Rev. Spec. Top.–Accel. Beams 17, 022801(2014).
7H. Aoyagi, Y. Asano, T. Itoga, N. Nariyama, T. Bizen, T. Tanaka, and H.Kitamura, “Pulse-mode measurement of electron beam halo using diamond-based detector,” Phys. Rev. Spec. Top.–Accel. Beams 15, 022801 (2012).
8S. Johansson, P.-O. Eriksson, J. Rajander, J.-O. Lill, and O. Solin, “Wirescanner for beam profile of high current particle accelerator beams,” inThe 14-th International Workshop on Targetry and Target ChemistryWTTC14, Playa del Carmen, Mexico, 26-29 August 2012 (AIP ConferenceProceedings, 2012), p. 20.
9M. A. Aginian, S. G. Arutunian, A. V. Margaryan et al., “Vibrating wiremonitor evaluation, an application to calculate resolution and dynamicrange,” Journal of Contemporary Physics (Armenian Academy of Sciences)(to be published).
10J. Alonso and S. G. Arutunian, “Complex beam profile reconstruction, anovel rotating array of vibrating wires,” in Proceedings of InternationalParticle Accelerator Conference IPAC2014, Dresden, Germany (JointAccelerator Conferences Website (JACoW), 2014), pp. 3415–3417,ISBN: 978-3-95450-132-8.
11A. G. Touryanskii and I. V. Pirshin, “A method for the formation of ultrathinX-ray beams,” Instrum. Exp. Tech. 43(5), 664–670 (2000).
12A. V. Scherbakov, A. L. Goncharov, V. K. Dragunov, and A. O. Gladyshev,“Development of an electron-beam welding unit for small-size pieces,”Russ. Electr. Eng. 84(6), 318–323 (2013).
13T. Mitsuhashi, “Measurement of small transverse beam size using inter-ferometry,” in Proceedings of DIPAC2001 (Joint Accelerator ConferencesWebsite (JACoW), 2001), pp. 26–30.
14A. S. Hernandez, N. Milas, M. Rohrer, V. Schlott, A. Streun, A. Andersson,and J. Breunlin, “The new SLS beam size monitor, first results,” in IPAC2013(Joint Accelerator Conferences Website (JACoW), 2013), pp. 759–761,ISBN: 978-3-95450-122-9.
15R. Chehab, “A small survey on beam diagnostics for small size beam,”http://www-linac.kek.jp/seminar/chehab-lecturenote-transparencies/BeamDiagnostics.pdf, 2002.
Reuse of AIP Publishing content is subject to the terms at: https://publishing.aip.org/authors/rights-and-permissions. IP: 37.252.93.206 On: Mon, 22 Feb 2016
14:54:08
![Design of a mechanical resonant station to free jammed ... · Resonance is a phenomenon [3] in which a vibrating ... simple pendulum). However, there are some losses from cycle to](https://static.fdocuments.us/doc/165x107/5e8951a6890afc414073eb53/design-of-a-mechanical-resonant-station-to-free-jammed-resonance-is-a-phenomenon.jpg)